Abstract
Studies comparing and benchmarking cities on transport and planning have been undertaken for decades. The unique methodology in this paper is explained and then applied to the Greater Manchester (GM) and Leicester (LM) metropolitan areas in the UK. The data cover land use, wealth, transport infrastructure, mobility patterns, energy use and selected externalities. The paper asks: How do the Greater Manchester and Leicester Metropolitan Areas compare with each other and to a sample of global cities in the sustainability of their urban passenger transport systems, what are the key factors that underpin their automobile dependence and what might be done to improve the prospects for public transport, walking and cycling? The answer is presented as standardised indicators comparing GM and LM to metropolitan areas in the USA, Canada, Australia, Europe and Asia (averages), as well as ten Swedish cities plus Freiburg-im-Breisgau, Germany. Both UK metropolitan areas rank poorly on most transport factors, especially public transport and cycling rates. They have uncharacteristically high car use and energy use compared to peer cities, especially since they have supportive urban densities and other factors that can underpin much less automobile dependence. Fundamental issues are raised about GM and LM and how to improve their transport sustainability. Policy implications with eleven recommendations are provided.
1. Introduction
Cities everywhere are striving to develop more sustainable mobility patterns. These efforts date back to the 1960s and 1970s [1,2,3], and are directed primarily at improving the quality of life in cities through reductions in car dependence, but also at meeting international obligations to mitigate climate change. The benefits of these endeavours are multi-faceted and are experienced on a local, regional and global level, the latter most obviously being helping to reduce CO2 output from the transport sector [4,5,6]. The United Nations explicitly recognises this in their Sustainable Developments Goals and targets [7].
But, of most concern to cities themselves, reducing car dependence can have many positive impacts. These include reducing the need for major new road capacity or even removing road capacity by lane reduction and, more radically, demolishing whole sections of motorway, as has happened in numerous cities worldwide [8,9]. Other potential benefits include making more funds available for public transport, walking and cycling, creating traffic calming projects, reducing local air pollution, mitigating noise, neighbourhood severance and visual intrusion, cutting transport-related deaths and enabling less dependence on costly liquid fossil fuels and the Middle Eastern regions that supply them [10,11].
Importantly, reducing automobile dependence also promotes the development of a much higher quality, greener public realm, with much more space for people to walk and cycle and particularly to interact in streets. Streets are the major public domain or “commons” in all cities and towns, accounting for up to 30% or even more of urban land, but most of this is now occupied by cars. Reducing car dependence thus helps to promote a journey from “passage to place” in cities by creating more social space in cities [12].
It is easy to garner widely divergent opinions about the merits of transport options and mobility patterns in cities. Often one hears sweeping statements about the quality and extent of different modes in any city (ask any taxi or Uber driver), many of which can be proven utterly wrong with good data. A key part of the endeavour to get well-targeted and justified action on transport in cities is therefore to have good data describing the current state of mobility and related transport factors in each city. Being able to then compare cities to each other, both within the same country and internationally, is an important part of highlighting the strengths and weaknesses in passenger transport in each city. It can give a critical perspective on how good or bad is a situation, an indication of the needed priorities for improvement and therefore where money might be most productively spent.
More generally, international comparisons can inspire reasons for hope that cities have all kinds of possibilities that they thought they may not have. When such fundamental published research is coupled with communicating and popularising the results in local media and other means, a new impetus for change can be forged. Civil society groups particularly can be given strong support for their ideas through hard data [9].
This approach has a 45-year history of success documented in the works of the author, Peter Newman, and others [5,6,13,14,15], and more recently in Kenworthy [16,17] and Kenworthy and Svensson [18] in comparing ten Swedish cities in a global sample. However, such systematic and reliable data using well-established, consistent and tested definitions are very hard and time consuming to collect and validate, thus requiring a concerted research focus.
In previous works, Newman and Kenworthy [13] and Kenworthy and Laube [14,15] have assembled data on London, Greater Manchester, the Tyne-and-Wear region (Newcastle) and Glasgow in the UK (all metropolitan areas, not just the core cities). These data are now out of date, but they do lend themselves to seeing some trends. This research has collected data again on Manchester (Greater Manchester or GM) and a new inclusion, the Leicester metropolitan area (LM). The words “city” or “cities” are often used here for brevity.
This paper presents the findings of this work, which has collected a comprehensive set of data on the passenger transport systems of these two UK metropolitan areas. It provides the data and discusses the results, comparing the two cities to each other and to a large set of other international cities, especially those in Sweden and Freiburg-im-Breisgau in Germany, which have data for similar years. It therefore provides a perspective on the relative strengths and weaknesses of both cities, helping to draw policy conclusions and make recommendations about where priority action could be taken.
The key research question to be answered in the paper is:
How do the Greater Manchester and Leicester Metropolitan Areas compare to each other and to a sample of global cities in the sustainability of their passenger transport systems, what are the key factors that underpin their automobile dependence and what might be done to improve the prospects for public transport, walking and cycling?
This paper first provides a brief literature review of the background and history of this and other urban comparative approaches for gaining insights into how cities function in urban transport and related land use factors, why the observed patterns of mobility exist and what the approach offers in better urban planning and transport decision-making. It then provides a summarised overview of the methodology of the research, followed by a very detailed accounting of all the results from the two UK metropolitan areas and how these can be interpreted. This is followed by a discussion of the results and their policy implications, including focussed recommendations. A summary answer to the research question is given in the conclusions.
Figure 1 provides more details on the above descriptions by providing a schematic flow chart of the sequential steps in the research process.
2. Literature Review of the Background and Utility of Comparative Cities Research on Automobile Dependence
2.1. General Background
The problem of the automobile in cities dates back many decades. In the 1950s and 1960s, cities in the USA motorised apace with the building of the Interstate Highway System, which sent multi-lane freeways barrelling through the hearts of nearly all US cities. The dramatic effect on the urban fabric of catering for the automobile became very apparent [19]. Large scale protest movements erupted across the country as hundreds of thousands of homes were demolished to make way for freeways, public transport systems spiralled into decline and the ability or desire to walk or ride a bike plummeted [20]. Recently, Newman et al. [21] have documented the very different urban qualities and needs of cities, as they evolved under the dominant transport modes of the time (Walking Cities, Transit Cities and Automobile Cities).
Globally, cities present a very diverse range of characteristics and levels of automobile dependence, and most cities today are combinations of the three city types mentioned above. Some in the USA and Australia, and to a lesser degree in Canada (e.g., Montreal), are dominated by urban fabrics developed in the age of the automobile (essentially post-World War II areas), or the earlier fabrics have been demolished or transformed by large roads and parking facilities. Others, especially in Europe and in many parts of Asia, have much higher proportions of their existing fabrics that were created during the Walking City era (essentially all pre-1850 urban fabric) and/or Transit City fabric, which was created rapidly over 100 years after 1850 in the then industrialising world [5,21].
How then do we compare and measure the extent of these differences in cities regarding automobile dependence and what can be done to reduce it? How much car use occurs in different cities and how much energy use results from that and why? How does the density of cities, a key determinant of transport patterns, vary worldwide? How well are public transport systems used and what is their physical extent and levels of service? Do all cities provide similar levels of parking and freeway networks? How much are walking and cycling used? What are some of the economic implications of such patterns? What policy solutions are most important to individual cities to reduce automobile dependence?
Such questions are often answered anecdotally but the answers are often quite wrong. The only reliable way to answer such questions and compare cities is to collect actual data and to do so using definitions and methods that are as near as humanly possible globally similar. This enables benchmarking, a term that is found mostly in the business world for comparing companies against other companies. Teplanova [22] (p. 5), in a Swedish study, states:
“In general, benchmarking is considered as a systematic tool that allows an organization to determine whether its performance of organizational processes and activities represents its best practices…The benchmarking should answer:—What are benchmark’s partners doing that you are not doing? What can you do to achieve similar and still better results? Realization of benchmarking is a very complex process that includes understanding of one’s own organization and performance, and identifying and learning from best practices of other organizations…”
In the context of this sustainable mobility research on cities, the “organization” becomes the city, the issues or data being benchmarked are the many diverse factors that describe and characterize the land use and transport system and its outcomes, as well as how these compare to other cities. The results, similar to trying to improve a company, are the insights into where the target city or cities perform well and where it/they might be improved based on the performance of other cities. Benchmarking here highlights strengths and weaknesses in a city’s land use and transport system, especially its level of automobile dependence.
Answering the questions posed above using the methodology in this paper commenced in the late 1970s, and by 2025 had accumulated an internationally recognized set of over 200 publications containing its results and policy implications [5,6,13,14,15,23,24].
Specifically, this method was used to analyse the differences in car dependence in Australian cities [25,26] and in 1991 was used to create a vision for a more sustainable Canberra [27]. The same method was used to suggest solutions for Bangkok’s highly problematic transport system [28], to develop land use and transport policies for south-east and east Asian cities [29] and to optimise urban passenger transport through a least-cost model [30]. More broadly, it has been used, for example, to show that increasing automobile dependence is by no means inevitable in rapidly industrialising cities worldwide [31]. And most recently it has been deployed for an in-depth understanding of land use and mobility in Swedish cities, with a special emphasis on energy use [16,17,18].
Globally, comparative approaches on cities in relation to urban transport and related factors can be found in innumerable publications. For example, Gudmundsson et al. benchmarked sustainable transport policy in the then so-called BEST network of cities [32]. de Freitas Miranda and da Silva benchmarked the sustainability of transport in Curitiba, Brazil [33]. Additionally, Rodrigues da Silva et al. provided a comparative evaluation of mobility conditions in cities of five Brazilian regions [34]. Matsunaka et al. compared cities in Japan, France and Germany for the relationship between urban structure and public transport service levels [35]. De Gruyter et al. reviewed sustainability measures of public transport in global cities focussed on Asia and the Middle East [36]. Hadjuk analysed urban transport in a selection of global cities attempting to develop clusters and analyse some trends in those clusters [37]. In New Zealand, Stone et al. undertook a benchmarking exercise to determine the efficiency and effectiveness of public transport in Auckland, Wellington and Christchurch, the three most populous urban regions [38]. Zito and Salvo conducted research designed to establish an urban transport sustainability index for European cities [39], while Alonso, Monzón and Cascajo have provided a comparative analysis of passenger transport sustainability in European cities using a benchmarking approach based on a series of indicators [40]. Continuing this European theme, Bratzel compared sustainable urban transport policies in European cities, namely Zürich and Basel in Switzerland, Amsterdam and Groningen in the Netherlands and Freiburg-im-Breisgau in Germany, examining relatively successful policy change towards sustainability [41].
Benchmarking and comparative analyses have also been applied to health and environmental concerns. For example, Lowe et al. examined 25 international cities for their city planning policies to support health and sustainability using a host of very diverse quantifiable policy indicators [42], while Li et al. undertook a global assessment of 180 cities for their transition to low carbon urban transport [43]. Finally, Tamaki et al. calculated the efficiency and emissions from urban public transport systems in world cities based on the environmental load from CO2 emissions using an economics perspective [44].
Benchmarking and comparisons of cities on various urban transport-related factors is an established, though quite varied methodology, depending on the topics and objectives under investigation. This paper further adds to this body of knowledge by describing an in-depth study of Greater Manchester and the Leicester Metropolitan Area, offering reasons for the observed mobility patterns and some policy implications and recommendations emerging from it. It uses and describes the unique global cities comparative research and benchmarking studies conducted by the author and his colleagues and published for 45 years since 1980. This method and its comprehensiveness have not been replicated by any other researchers.
2.2. Selected Previous Findings on Key Comparative Indicators Central to This Study
This section highlights some key findings from the literature on comparative indicators presented and analysed in the results section of the paper for GM and LM.
Urban density: Urban density (population divided by urbanised land area) is critical in understanding the urban transport characteristics in any city. Low densities are associated with automobile dependence, and higher densities are associated with less automobile dependence and a greater role for public transport, walking and cycling [5,13]. Although such claims are disputed [45,46], evidence continues to emerge of density’s fundamental importance in promoting less car use [47,48].
The importance of density is also seen in supporting higher public transport use, especially in densities around rail stations (transit-oriented development or TOD). Cervero has shown that a key additional way to increase public transport usage is to have more high-density, mixed land use surrounding all stations, evidenced especially in Stockholm [4,49]. Canadian cities such as Toronto, Vancouver and Montreal also demonstrate the value of TOD well, with strong integration of land use, especially around their rail systems, but also generally higher urban densities everywhere such that they have healthy overall public transport use, including well-utilised bus services [9,50,51]. Even though Canadian cities’ public transport service provision is not high, the services are intensely utilised, with seat occupancy reaching as high as 44%, much higher than typical automobile cities [14,15].
Proportion of jobs in the CBD: Thomson identified how important the centralisation of work can be in shaping urban transport, especially jobs located in the central business districts (CBDs) of cities, which particularly favour public transport, where a good radial rail system exists [52]. If the central area is also a neighbourhood, then people can also walk and cycle to work. Of course, the same applies to strong sub-centres in cities and polycentric cities can also enjoy less car-orientation because sustainable modes are favoured for travel into such centres. Where jobs and other urban services are spread out like “salt and pepper” across cities, only cars can access them conveniently [53].
Metropolitan gross domestic product (GDP) per capita: Wealth is considered by many to be a driver of car dependence so that as cities get wealthier cars are naturally favoured. However, in global studies comparing whole metro regions, wealth is not found to be a significant factor in car dependence [5,9,13,46].
Freeway length per capita: Freeways (or motorways in the UK) are the premium road infrastructure for private transport. They are renowned as contributing factors to urban automobile dependence [54]. Freeway provision can be measured by the centre-line length of freeway per person or per urban hectare. Lane length is a better measure, but this is surprisingly difficult to collect across global cities.
Observations of cities globally show that freeway provision arises from conscious policy decisions, not necessities [55]. For example, the City of Vancouver, regularly voted as one of the most liveable cities in the world, scrapped its freeway system in the 1970s and never built any (the greater region built some). Adelaide, Australia, a typical automobile city in every other way, does not have a freeway system. On the other hand, American and other Australian cities built large networks of freeways to support an automobile culture. In the USA there are now extensive efforts to remove freeways [8].
Parking spaces per 1000 CBD jobs: Parking availability and, to a lesser extent, cost are key determinants in how likely people are to use cars [56,57]. Thomson also highlighted parking availability as an important factor in determining modal split for trips to urban centres, especially the central city [52].
Average speed of different modes: One traditional traffic engineering measure of the effectiveness of any urban road system is its level of service, a key factor being average speed. However, a more important factor for reduced automobile dependence is the relative speed between public and private transport, because speed-competitiveness in public transport is an important factor in encouraging usage and reducing automobile dependence [58].
Public transport orientation—rail- or bus-focussed: Globally, much research has shown that the more bus-oriented a city is in public transport, the lower the total usage of the system. Conversely, the more rail-oriented the system, the higher the use. This is also shown in higher vehicle and seat occupancy in rail modes compared to buses, so that given a unit of service supplied, rail has much better attractivity for people than buses [59,60].
Global cities data show that rail modes typically have longer travel distances and are favoured for their speed advantages over buses [15,16,17,18]. However, where rail systems are not strongly developed in cities, both boardings and passenger kilometres travelled (PKT) suffer [59,60].
Overall, any form of rail transport is generally favoured by users [59,61,62,63]. This also assists buses. The per capita use of buses in more rail-oriented cities is higher than in bus-only cities or those with negligible rail [59,60]. The importance of this bus versus rail comparison is reflected in all public transport infrastructure, service and use indicators in the results of the present study.
3. Methodology
3.1. A Brief History of This Paper’s Global Cities Comparative Research
This section provides the key milestones in this global cities comparative research, summarized from Kenworthy [64].
- Stage I: 1978 to 1981
In 1978 the question was asked: How different are Australian cities in their level of car dependence and what are some of the underlying factors in this regard? The data collected related to urban density, car use, energy use, public transport service and use, road network length, parking in the CBD of each city and more. The results were published in Newman and Kenworthy [25,26].
- Stage II: 1982 to 1984
The success of this venture led to a more ambitious question: Is it possible to extend this work internationally by comparing cities in many different countries with diverse physical arrangements, socio-economic, cultural and governance situations? This led to a study of thirty-two global cities in Europe, the USA, Canada and Asia, published in the book Cities and Automobile Dependence: An International Sourcebook [13] and a globally controversial paper which challenged automobile dependence and urban sprawl in US cities [23] and drew a passionate, but inappropriately worded response [45].
- Stage III: 1985 to 1991
The Australian National Energy Research Development and Demonstration Council (NERDDC) recognised the great value of the data that was collected above and provided funding to assist in completing and analysing the massive database that was developed.
- Stage IV: 1992 to 1997
The next major stage of the work was some global recognition of the research through a grant from the World Bank to update and extend the research to a set of thirty-seven global cities, including some initial ventures into cities in less-developed countries at the time (e.g., Malaysia and Indonesia). Results were published in a formal report to the World Bank [24].
- Stage V: 1998 to 2002
The largest of the global cities research projects commenced in 1998 when the International Union (Association) of Public Transport (UITP) in Brussels commissioned the Institute for Sustainability and Technology Policy (ISTP) at Murdoch University in Perth, and in the first instance SYSTRA, a consulting firm in Paris linked to the Régie Autonome des Transports Parisiens (RATP), to undertake an ambitious 3.5-year project to characterise the transport patterns in 100 cities from eleven regions worldwide. The study was called the Millennium Cities Database for Sustainable Transport (MCD) and was published by the UITP as a CD-ROM [15].
- Stage VI: 2003 to 2015
This period saw an update of 1995/6 data contained in the MCD conducted by myself and my research assistant, Monika Brunetti. The results of this work have so far been published in part, focussed on a core set of the original 69 variables, e.g., [6,9,65].
- Stage VI: 2016 to present
The latest stage of this work consists of data collection using 2015 data on the ten largest Swedish metropolitan areas plus Freiburg-im-Breisgau, Germany and Lima, Peru [16,17,18,66].
In summary, the approach and usefulness of the research in this paper has proven itself for over 45 years in its impact on urban and transport planning thinking and policy regarding reducing automobile dependence.
3.2. Background of the Paper’s Global Cities Data Collection
The research here follows the methodology of the international comparative data described above and referred to for short as the “global cities database”. All the global cities have a baseline set of 1995/6 data [15] and a partly published updated set of data for at least 2005/6, while ten Swedish cities and Freiburg-im-Breisgau in Germany have a set of 2015 data. GM and LM data collection for this paper, which commenced in 2022, is for 2016 for two reasons. Firstly, many agencies publish data years after the year of the data represented. Secondly, data for post-2020 is majorly distorted by the COVID-19 pandemic, which decimated public transport use in cities and in many cases, dramatically boosted cycling use, such that comparisons become severely distorted [67]. Since a comprehensive set of data existed for 2015 for ten Swedish regions and Freiburg- im-Breisgau, it was decided to take 2016 data for comparison.
Collection of these data often takes many years due to its problematic nature, the need to identify sources and verify them, sometimes seeking permissions, and the fact that often such data are, in any case, only available at irregular intervals or with large gaps. Thus, there is frequently at least a 7- to 8-year time lag in what can be reported on a city at any time. This global cities research and history are described in detail in Kenworthy [64]. The following summarises the approach.
Each metropolitan area is first defined as corresponding to, or as close as possible to, the functional urban region or commuter belt. The central business district (CBD) of each city is defined in consultation with relevant authorities in each city to ensure that relevant data can be assembled. Data are then initially sought through comprehensive internet searches. The required data on population, jobs, land use, metropolitan GDP, private and public transport infrastructure and mobility patterns, economic data on transport systems, transport emissions, transport fatalities and private and public passenger transport energy consumption data are spread across the online presence of innumerable government institutions and sometimes other websites.
When these sources are exhausted, as they generally are quite quickly, then the very much more time-consuming work begins of trying to locate possible sources of outstanding data. A significant amount of the required data are not normally published items. For example, annual vehicle kilometres and passenger kilometres of travel (VKT and PKT) for passenger cars and motorcycles are often found through the output of computerised traffic models or other sources such as surveys (e.g., the Australian Bureau of Statistics’ (ABS) regular Survey of Motor Vehicle Use, though even here, they do not publish data on cities and must be paid to extract these data for Australian metropolitan regions [68]). Likewise, items such as the consumption of energy in private passenger transport often take a long time to finalise before the best data for an urban region can be established.
The data collection work in this research is highly detailed. For example, data for all items on public transport systems (e.g., vehicle and seat kilometres of service, boardings, passenger kilometres, line lengths, length of reserved public transport route, vehicle fleets and so on) are collected for all modes and every operator, no matter how small. The Tokyo Metropolitan Area (TMA) in Kenworthy and Laube (35 million people) [15], demanded that each public transport item be collected 49 times before finalising any of its public transport indicators (8 public rail operators, 21 private rail operators, 3 public bus operators and 17 private bus operators). This alone took over 3 years to achieve, and thus became the only truly comprehensive and meaningful representation of the public transport system in the TMA.
Once all primary data are collected, then standardized comparable data are calculated. Here it is very important that, for example, the numerator and denominator match both the same physical area and the same year. Since this data collection has spanned over four decades, all data are also subject to detailed reality testing of the resulting standardised items to ensure bogus data have not been supplied. Further contact with those who supplied data may be necessary at this stage.
3.3. The Current Study
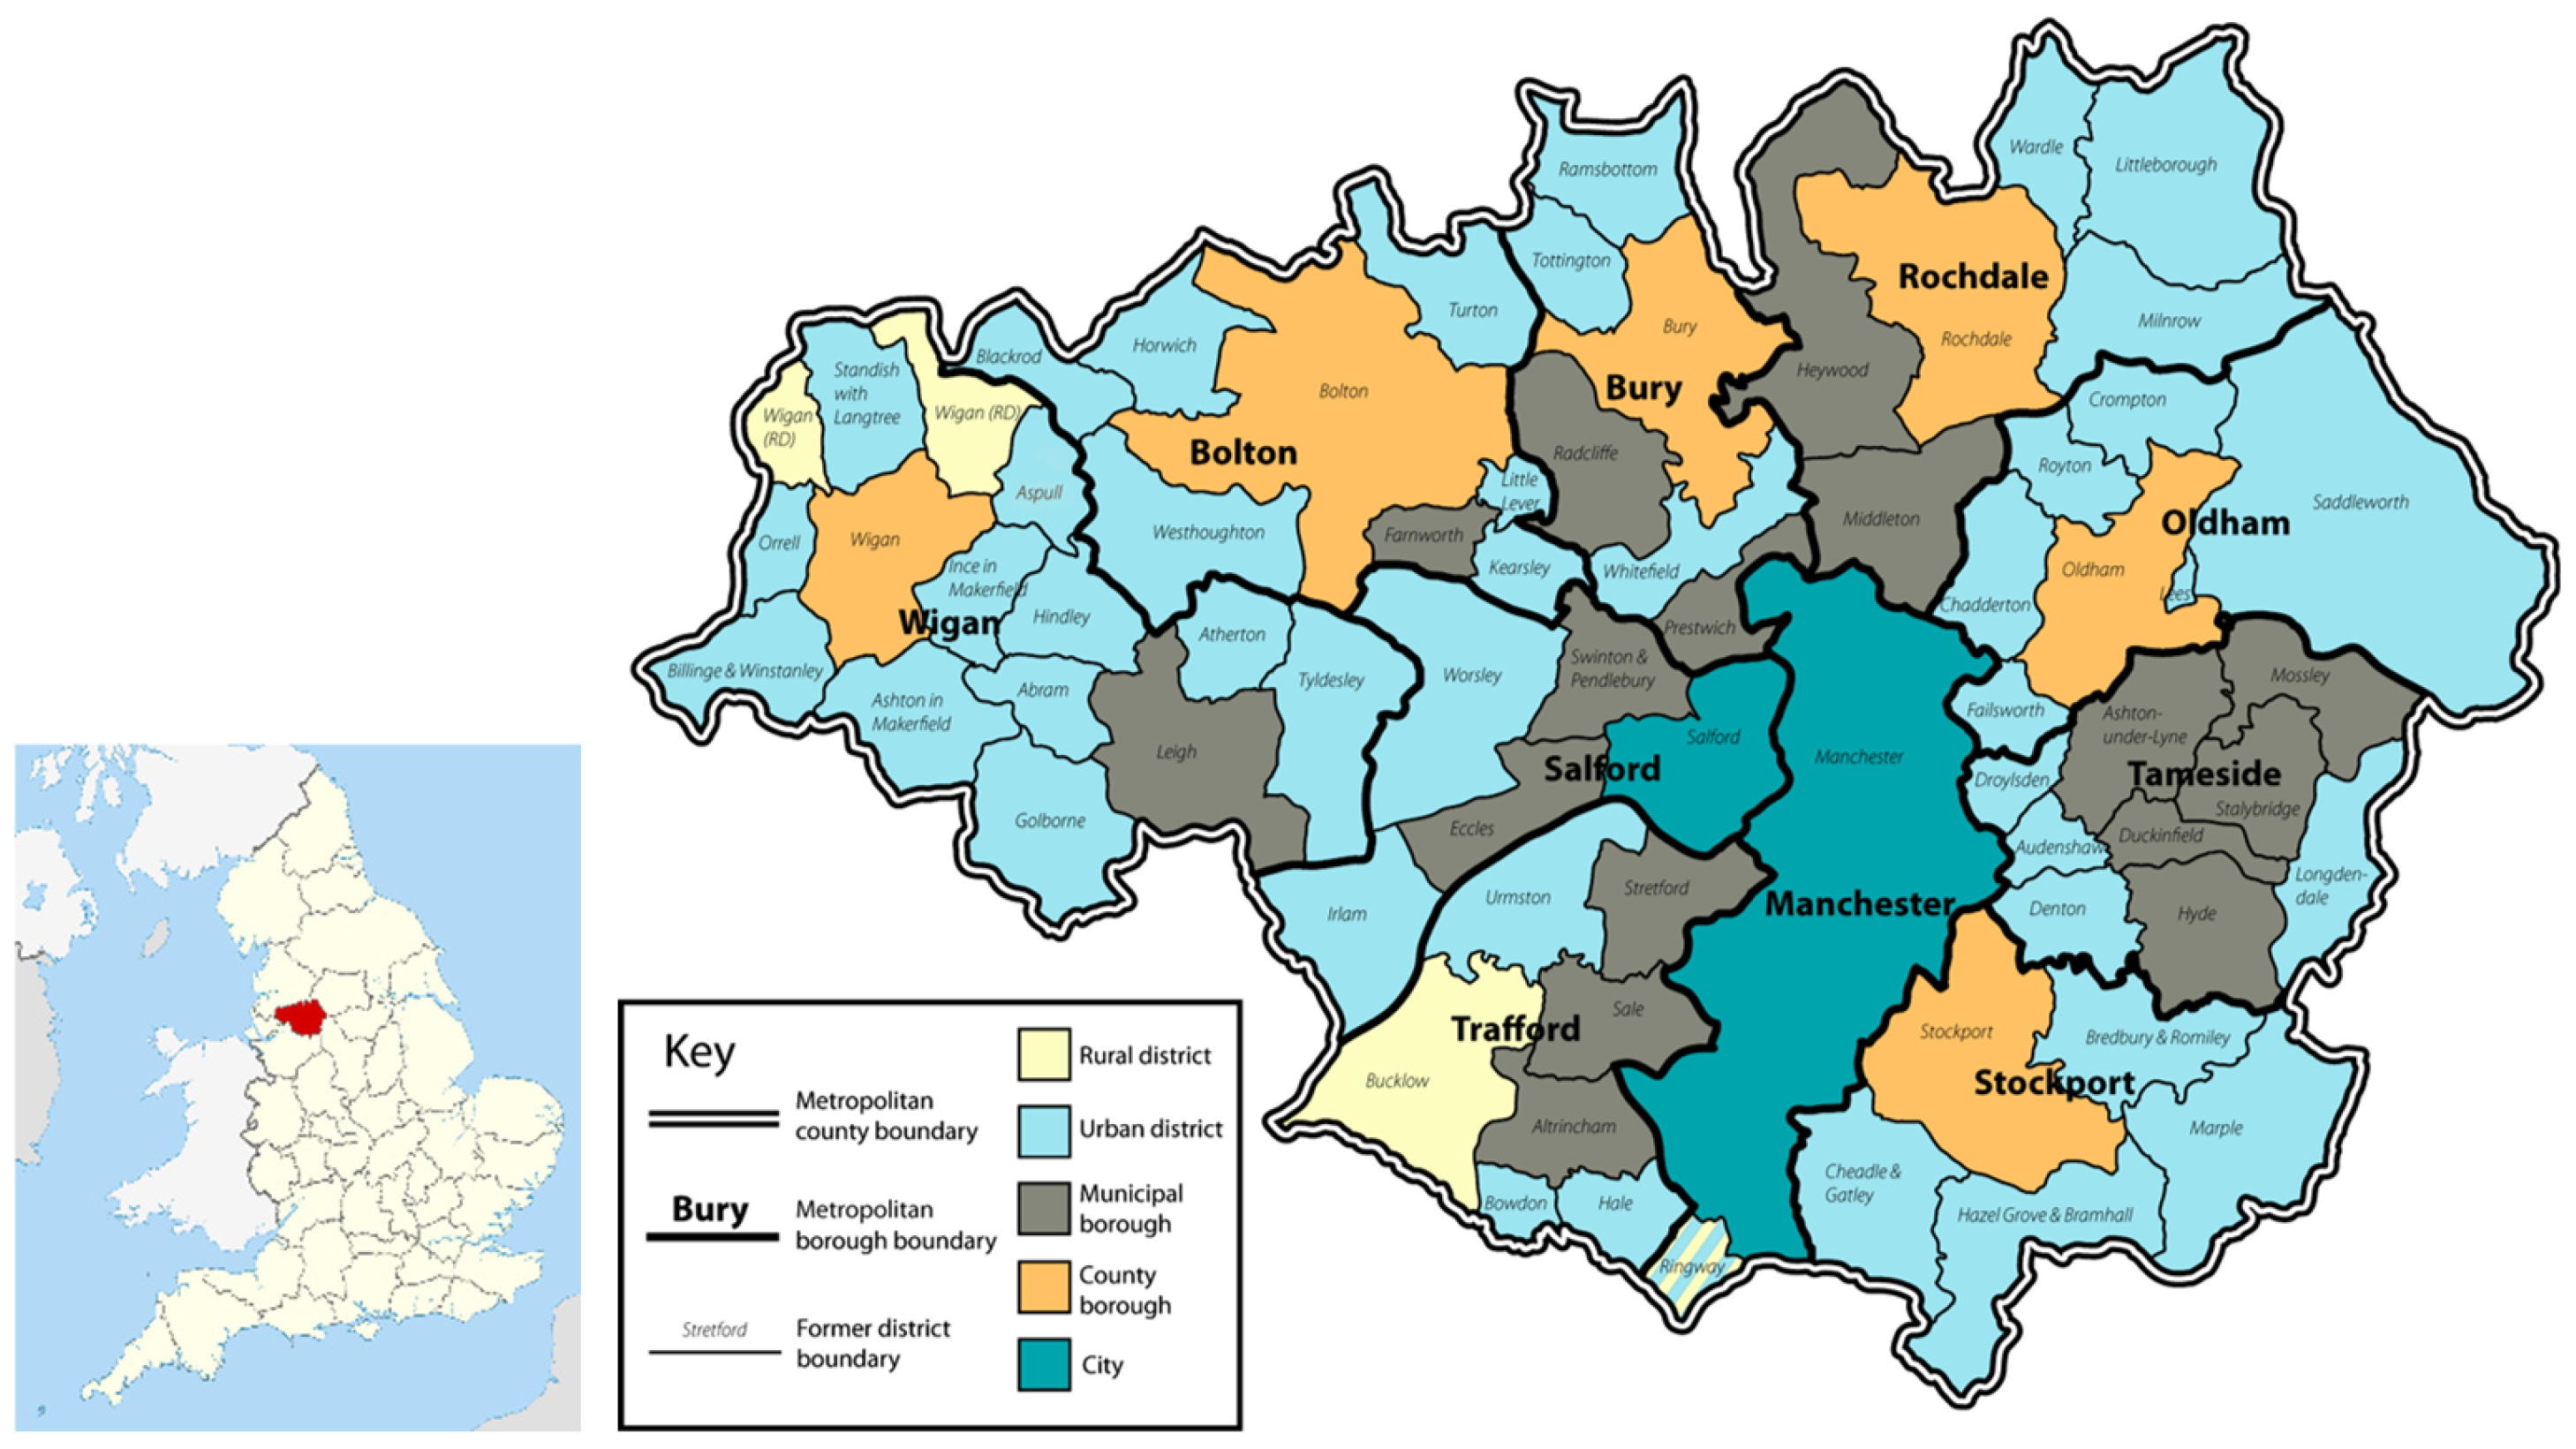
This study collected data on two UK metropolitan areas. GM consists of the Boroughs of Bolton, Bury, Oldham, Rochdale, Stockport, Tameside, Trafford and Wigan, as well as the two cities Manchester and Salford, while LM comprises the City of Leicester plus Leicestershire (Local Government Districts of Blaby, Charnwood, Harborough, Hinckley and Bosworth, Melton, North-West Leicestershire plus Oadby and Wigston). Figure 2 and Figure 3 depict GM and LM and their location in the UK. In 2016, the population of GM was 2,780,800 (currently 2,833,000 million [69]) and LM was 1,030,000 (currently 1,329,062 [70,71]). The primary data collected for these cities are outlined in Table 1.
Figure 2.
Maps of Greater Manchester (main map) and its location in the UK (locator map). Source: Main map [72]; Locator map [73].
Figure 3.
Map of Leicester Metropolitan Area and its location in the UK (the large City of Leicester is situated in the middle). Source: [74].
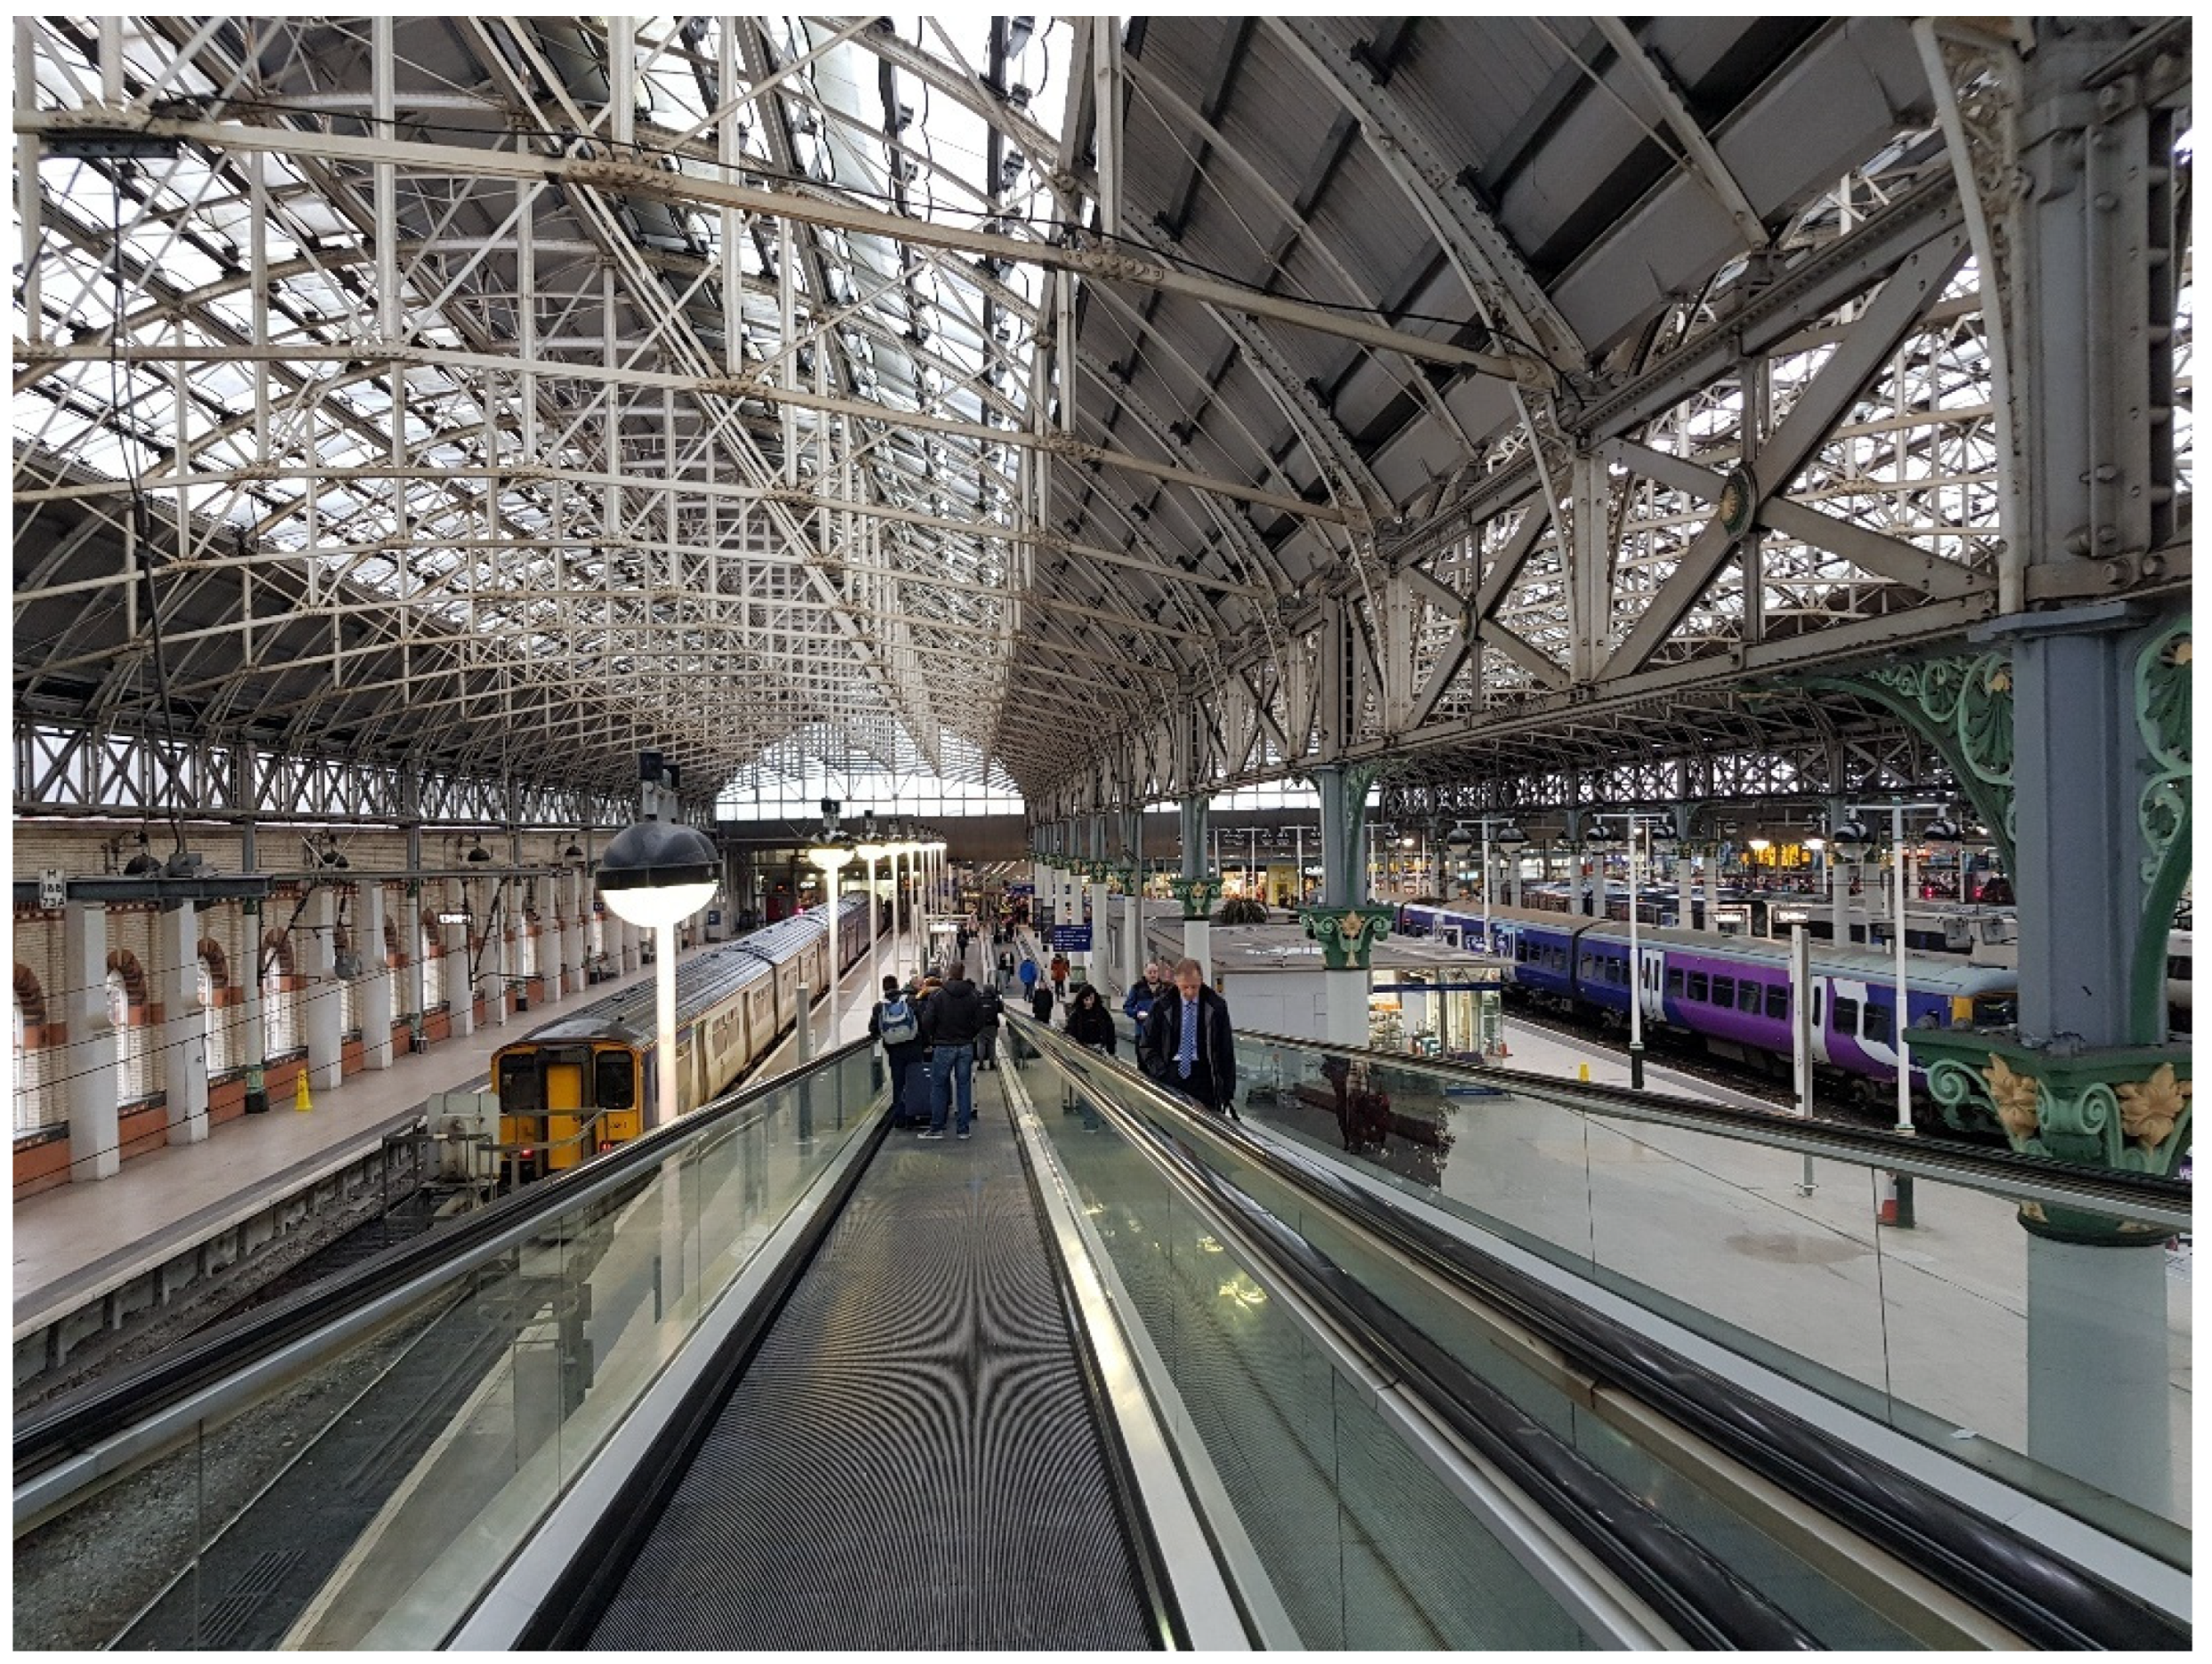
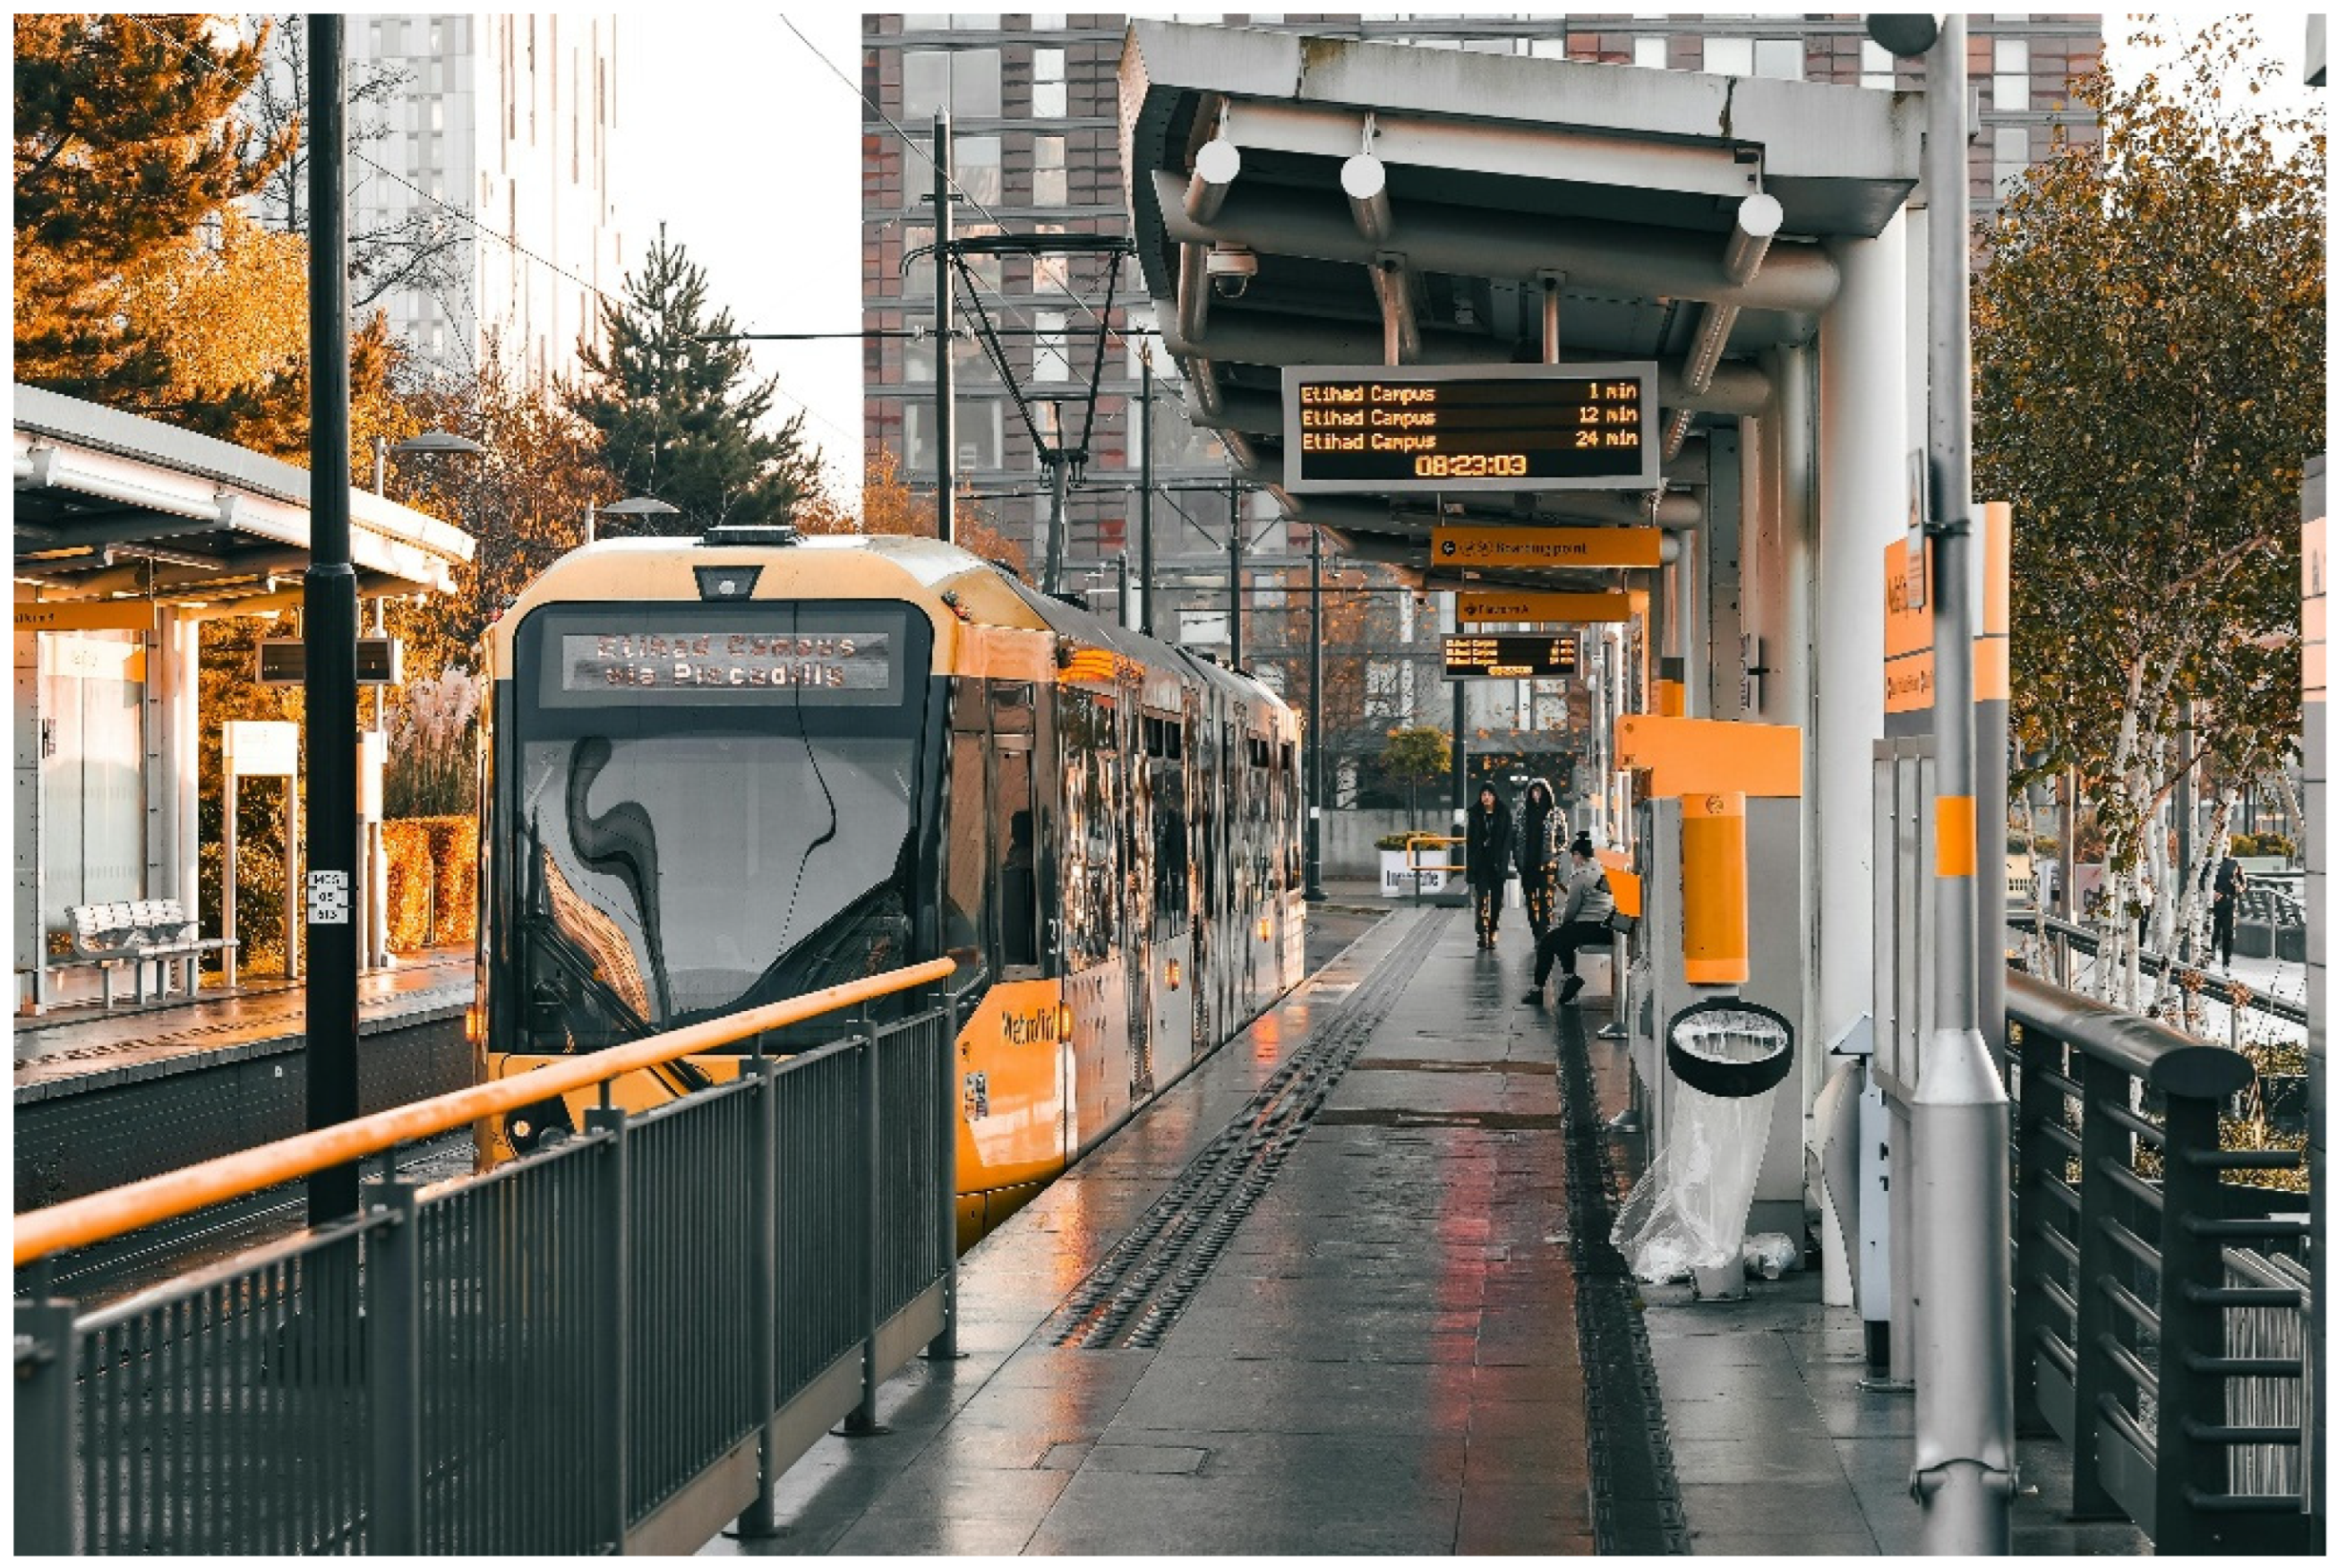
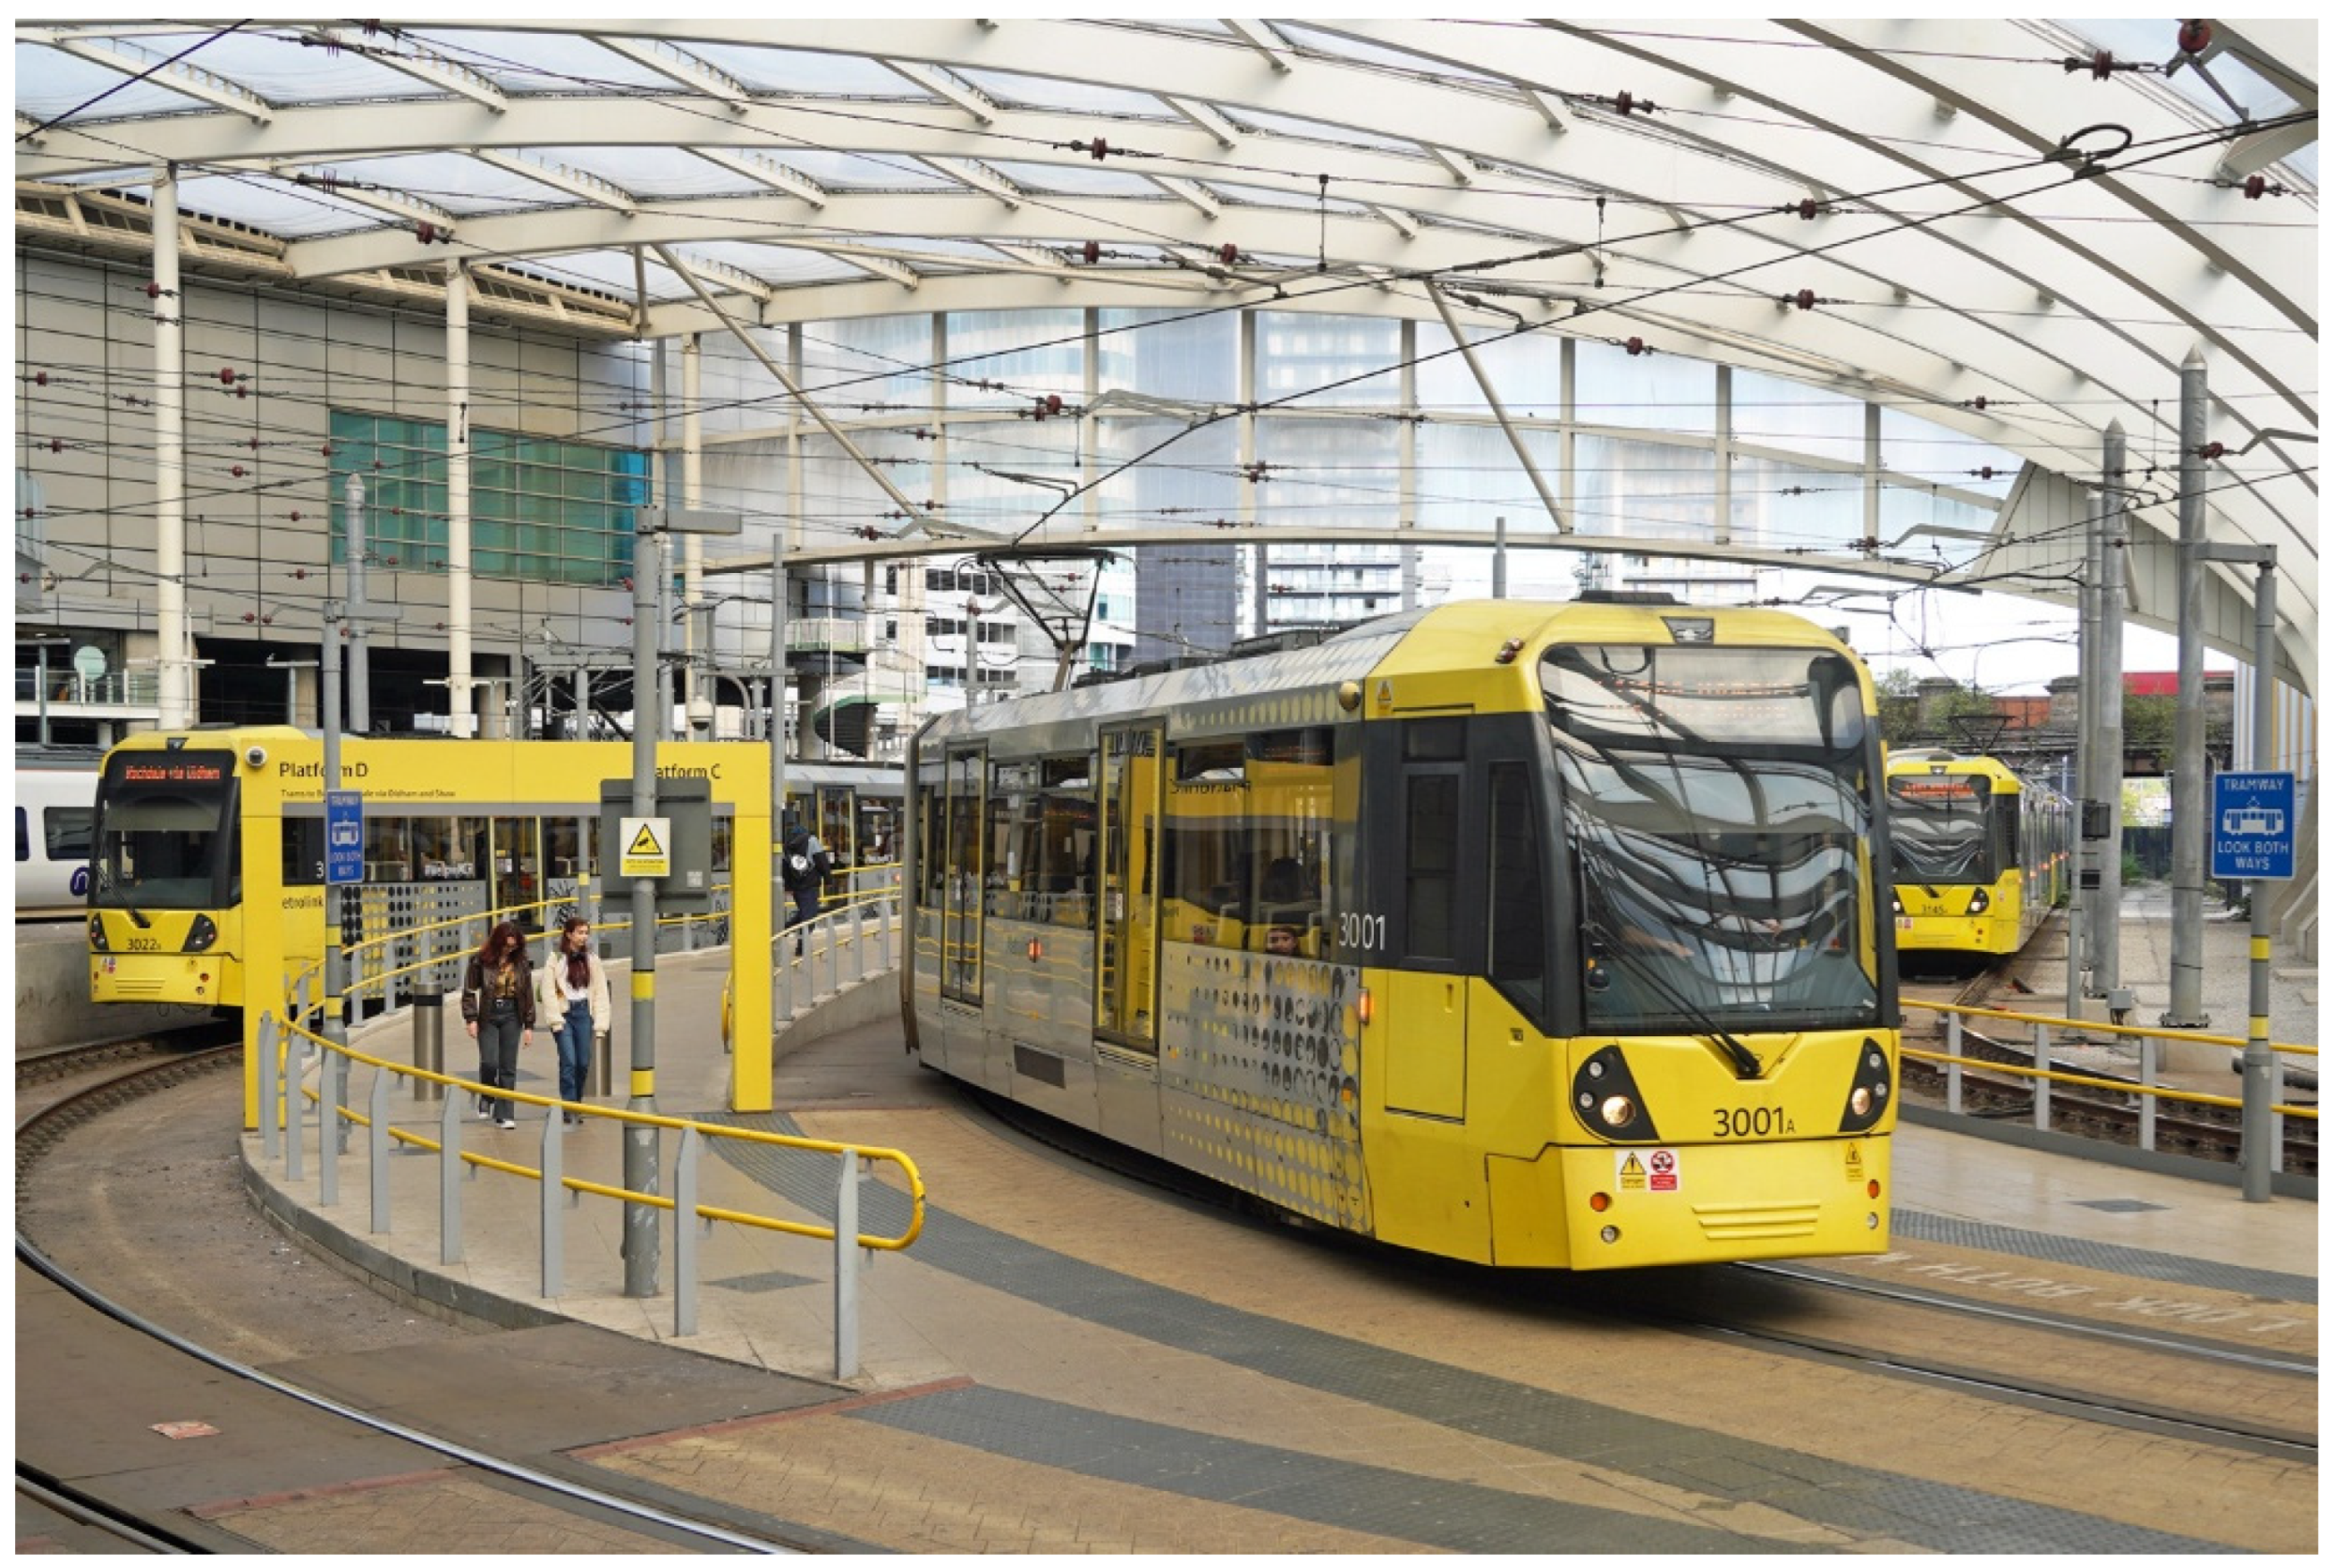
GM was chosen because it is one of the largest metropolitan areas in the UK and has a three decadal set of data (1996, 2006 and now 2016), which provides an interesting perspective on its sustainable transport development. It is also a main hub for intercity rail travel with Piccadilly Station also catering for some suburban rail. Manchester also has a light rail (tram) service (Figure 4 and Figure 5).
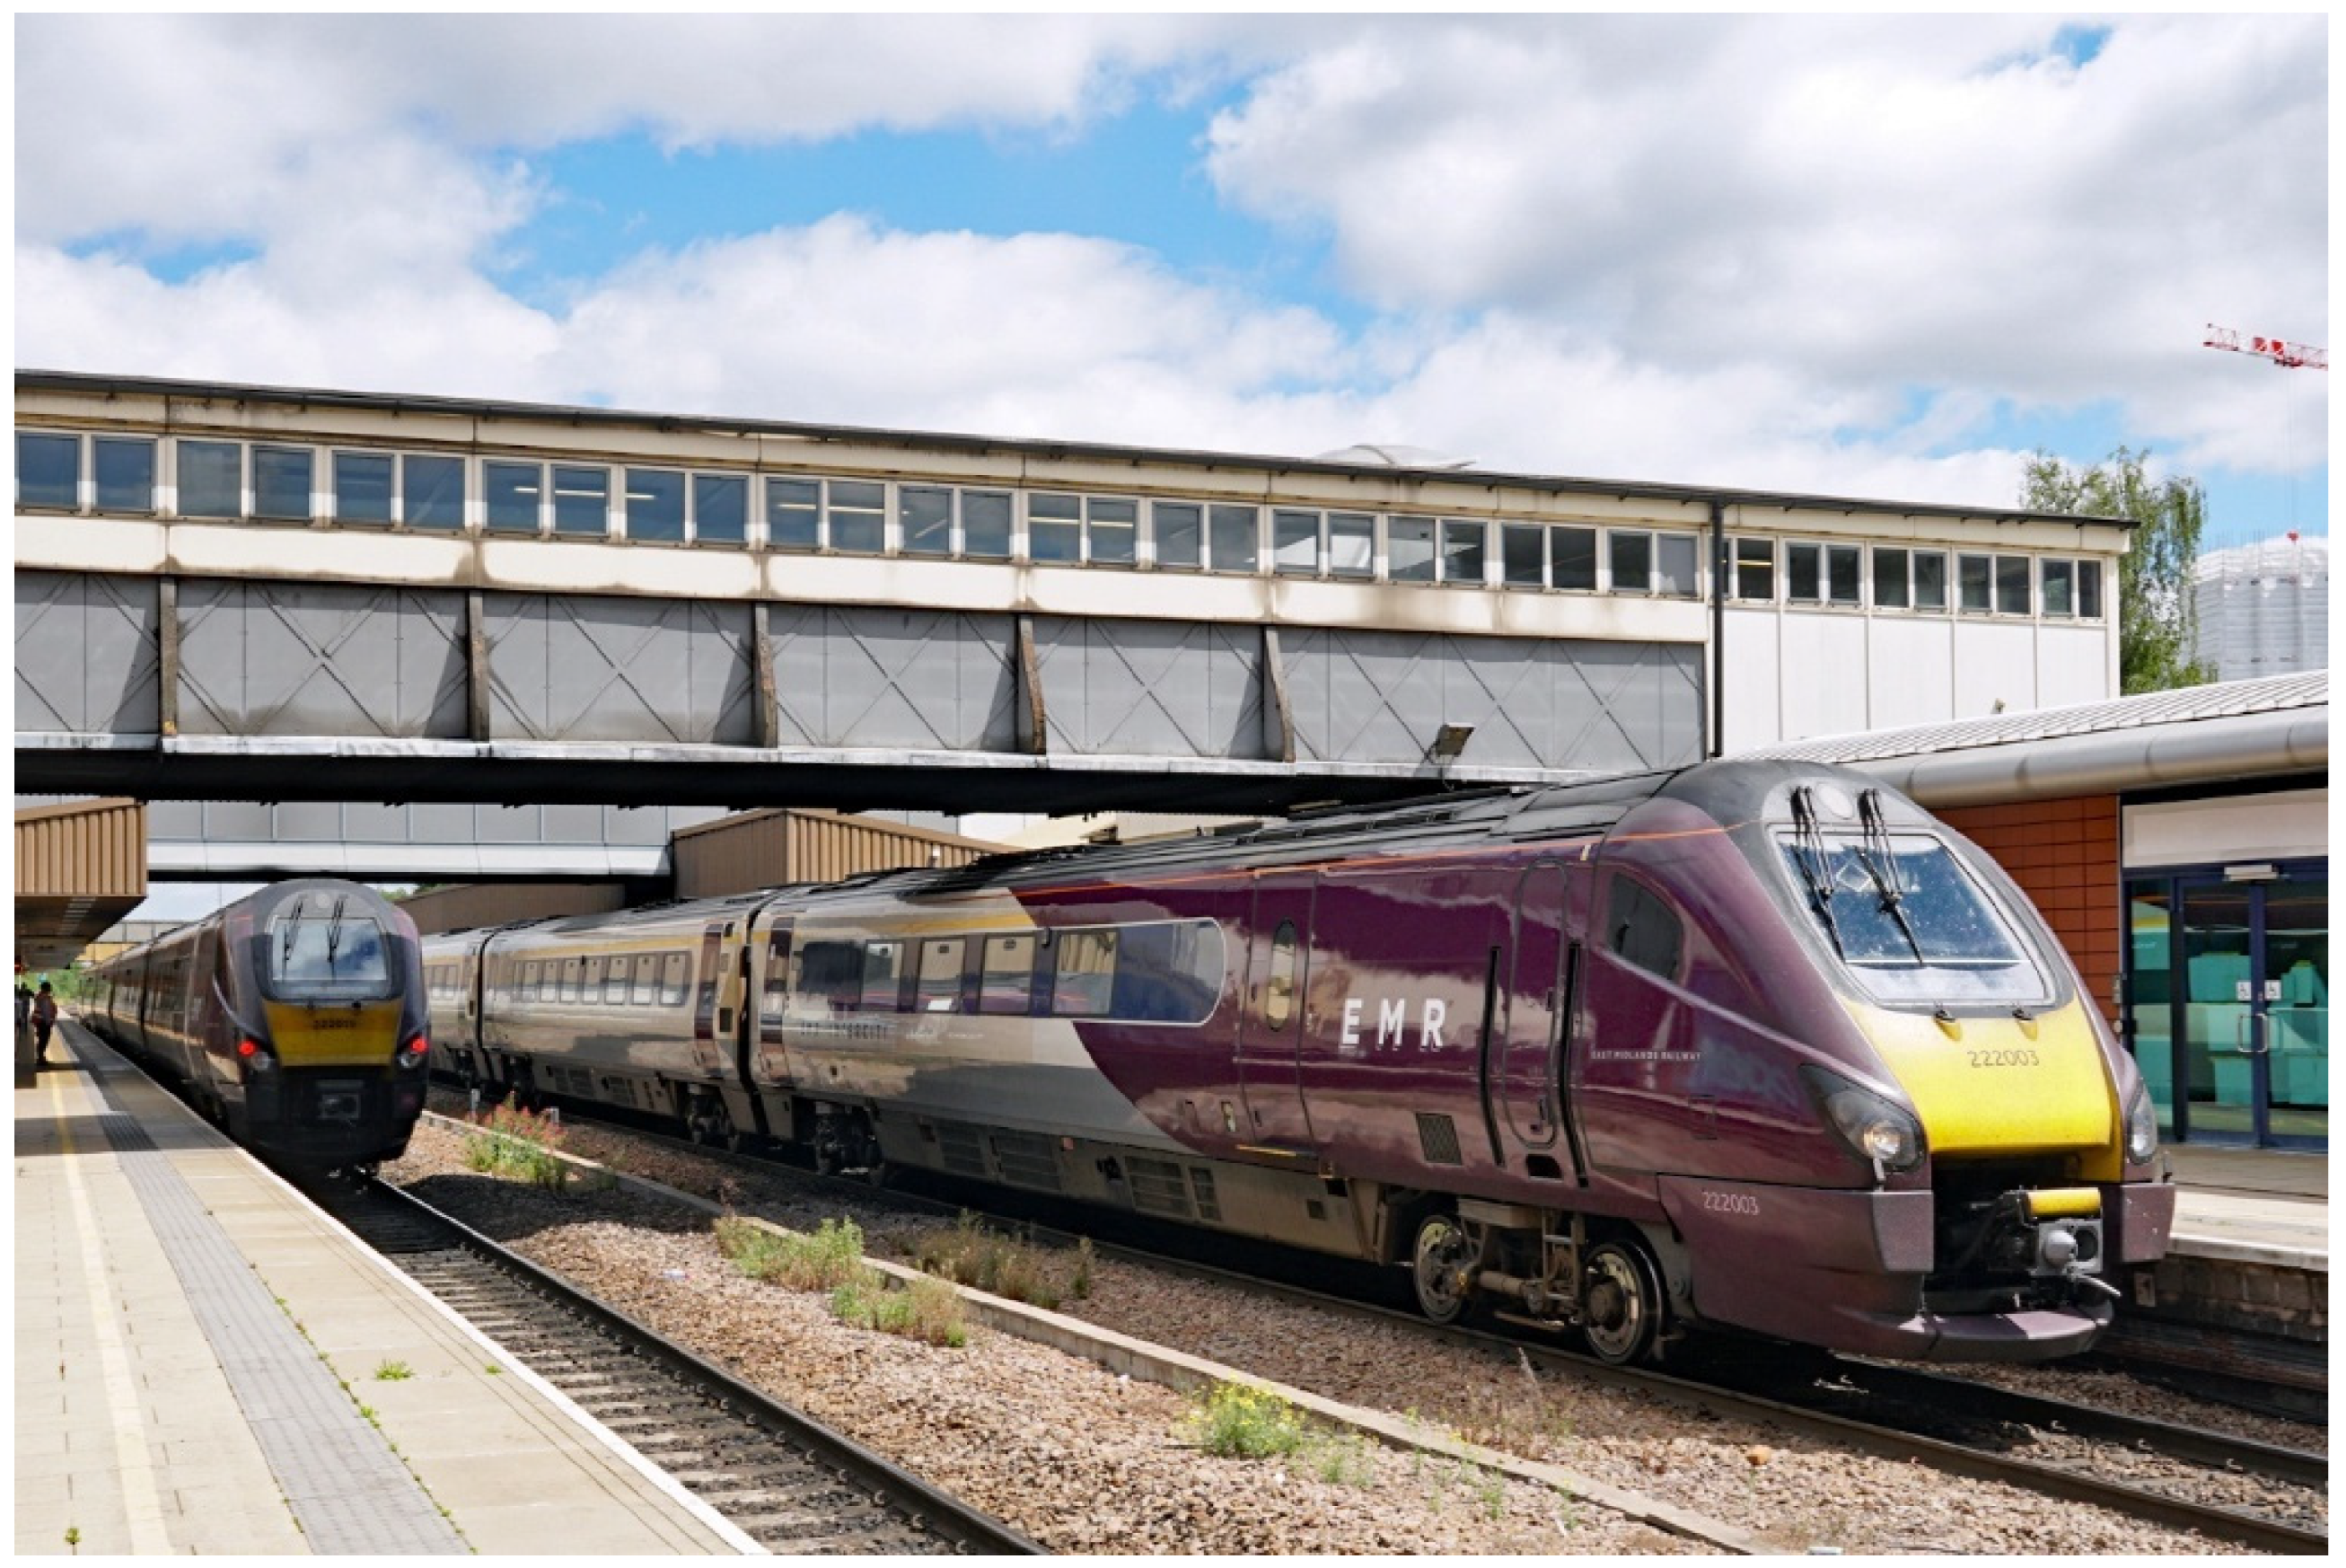
LM was chosen because it has never been studied before as part of the global cities research and because unlike numerous other medium to large UK metropolitan areas, it is contained within one county. This reduces the complexity of trying to compile metropolitan level data across multiple county jurisdictions. LM has a rudimentary suburban rail system (Figure 6).
Figure 6.
Train at Leicester station on 7 July, 2022 showing an unattractive, diesel-based service and the uninviting, rundown station. Source: Neil Pulling: copyright permission granted 5 June, 2025.
London was not chosen because it is the premier and largest UK metropolis, and in many ways is not representative of more typical transport and mobility characteristics in other UK metropolitan areas, due at least in part to its massive underground and wider, formerly referred to Network South-East suburban rail network. Most other UK cities are rather more dependent on bus services [15].
As explained above, data in Table 1 were collected initially from on-line statistical resources available through national statistical sources such as the UK Census, Department for Transport and many other national sources of data that are available through gov.uk. (i.e., only those sources that provide data broken down to the required urban geographies). Additionally, regional transport agencies such as Transport for Greater Manchester, online data from relevant city authorities and even rail enthusiast groups were consulted for sources of data. Overall, the national sources provided the bulk of the data that were available online. But there were very many data items or parts of data items that required a lot more investigation. Even the national sources of data sometimes required emails to ensure that the data meant what they appeared to mean, or requests had to be made to see if data could be provided precisely for the two defined metro areas where these were available on the webpages.
Collecting the primary data in Table 1 required countless emails and some phone calls to many people spread across a multitude of mostly government or quasi-government agencies in the UK and occasionally the private sector or transport interest groups. The table provides a summary description of each primary variable and some general guidelines about how it is collected. The standardised comparative indicators calculated from these in the detailed data in the Appendix A are for the most part simple arithmetic division calculations between two variables to normalise the data so comparisons can be made between cities. The main denominators are population (per capita variables), urbanised and total land area (spatially related variables) and metropolitan GDP (normalisation of a variety of variables to account for different levels of wealth). There are also some other variables that use unique denominators such as the number of parking spaces per 1000 CBD jobs (number of jobs in the CBD) and a variety of public transport indicators such as farebox revenue and operating costs that are normalised by using public transport vehicle kilometres and seat kilometres to compare metropolitan regions.
Table 1.
Detailed description of primary data collected for GM and LM and a short explanation of the importance of each.
Table 1.
Detailed description of primary data collected for GM and LM and a short explanation of the importance of each.
|
|
|
|
|
|
|
|
|
|
|
|
|
|
|
|
|
|
|
|
|
|
|
|
|
|
|
|
|
|
|
Items 32 to 35 are essential in depicting the overall modal split of daily trips in cities, especially since they add the only data on walking and cycling trips in this study. With extra work, the average walking and cycling trip distances can be collected to calculate passenger kilometres, which can then be combined with cars, motorcycles and public transport passenger kilometres to produce an alternative modal split picture for all cities based on what percentage each mode contributes to total passenger movement. |
Table 2.
Urban land definition (Item 2, Table 1).
Table 2.
Urban land definition (Item 2, Table 1).
Land Use Category | Type | Comment |
---|---|---|
Agricultural | n/u | |
Meadows, pastures | n/u | |
Gardens, local parks | u | These areas are not generally built up, but in their size, they are too small and in their human recreational uses, they are too intense to qualify as genuine non-urban land. |
Regional scale parks | n/u | These are large, contiguous areas set aside within metropolitan areas for non-intensive or restricted recreational uses, water catchment functions, green belts, etc. |
Forest, urban forest | n/u | Urban forests are larger than parks and are often significant wildlife and forestry areas. |
Wasteland (natural) | n/u | This includes flood plains, rocky areas, and the like. |
Wasteland (urban) | u | This includes derelict land, culverts, etc. |
Transportation | u | Road area, railway land, airports, etc. |
Recreational | u, n/u | Depending on the intensity of use, this group can belong partly in either category. Golf courses are urban, as their use is intense. Mostly, recreational land is considered urban. |
Residential, industrial, offices, commercial, public utilities, hospitals, schools, cultural uses, sports grounds | u | |
Water surfaces | n/u |
4. Results and Analysis: An International Comparison of Greater Manchester and the Leicester Metropolitan Area with a Global Sample of Cities
These results compare GM and LM with each other and with a sample of international cites, namely ten Swedish cities with data from 2015 and the averages for a set of American, Australian, Canadian, European, and wealthy Asian cities in 2005–2006. Freiburg-im-Breisgau, Germany is also included in all the data because of its international reputation as one of the most sustainable and green cities in the world (2015 data). Although it is smaller than the UK cities, the standardised data are still relevant for showing how far away or close the UK cities are to this global leader. From these comparisons, policy relevant findings and recommendations can be made about GM and LM.
It should be noted that the 2005/6 data, although pre-dating the GM and LM data by 10 years, is still indicative and worthwhile for two reasons: (1) the scale and comprehensiveness of the data being compared is unique and (2) many of the standardised variables tend not to change dramatically over a decade, especially when comparing averages for groups of cities.
4.1. Land Use, GDP and Private Transport Infrastructure Characteristics
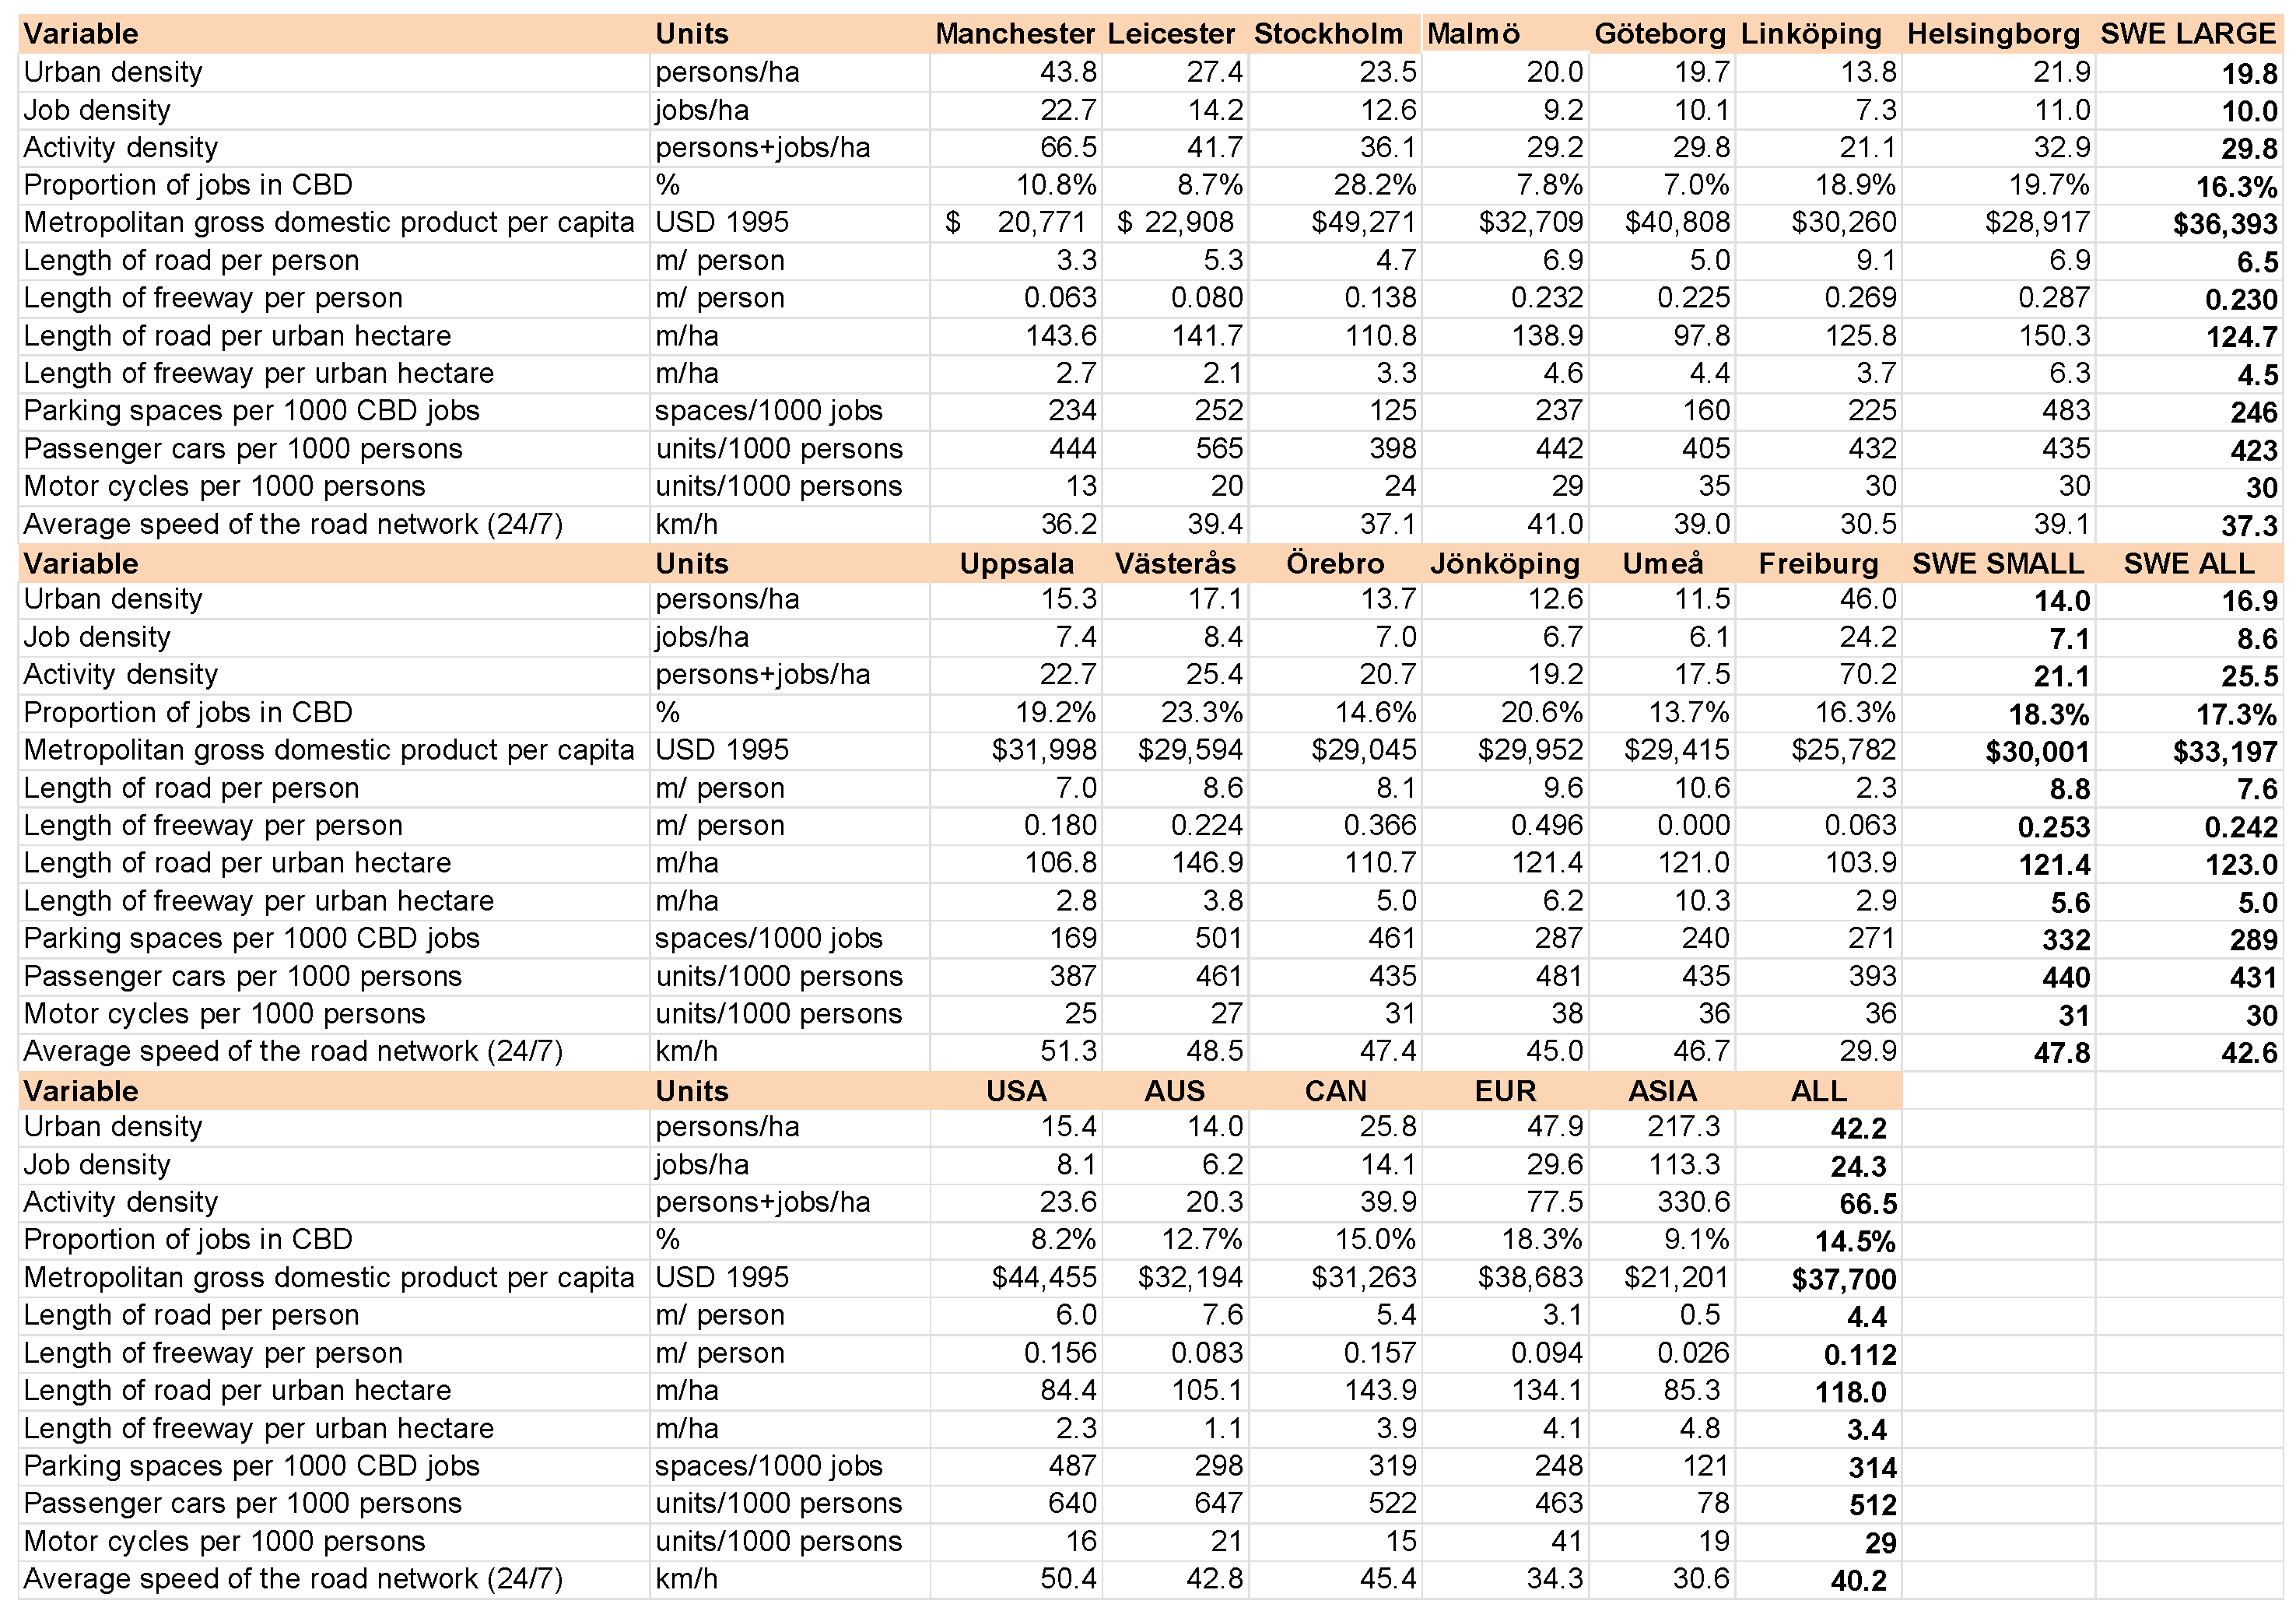
Figure A1 provides key variables on the above three topics. It is formatted so that it is not broken into less readable parts and the comparisons thus lost. The first block has the variables for the two UK cities and the larger Swedish cities. The second block shows the smaller Swedish cities and an overall average for all ten Swedish cities, while the final block represents averages for each variable for a large sample of major American, Australian, Canadian, European and Asian cities, with a global average across the whole sample. The same pattern is followed in all other appendix figures. No attempt to compare the two large Asian cities to the UK cities is provided in the text, since their land use and transport systems are vastly different to all other cities in the paper. However, the data are provided in the appendix and can be explored if needed.
4.1.1. Urban Density
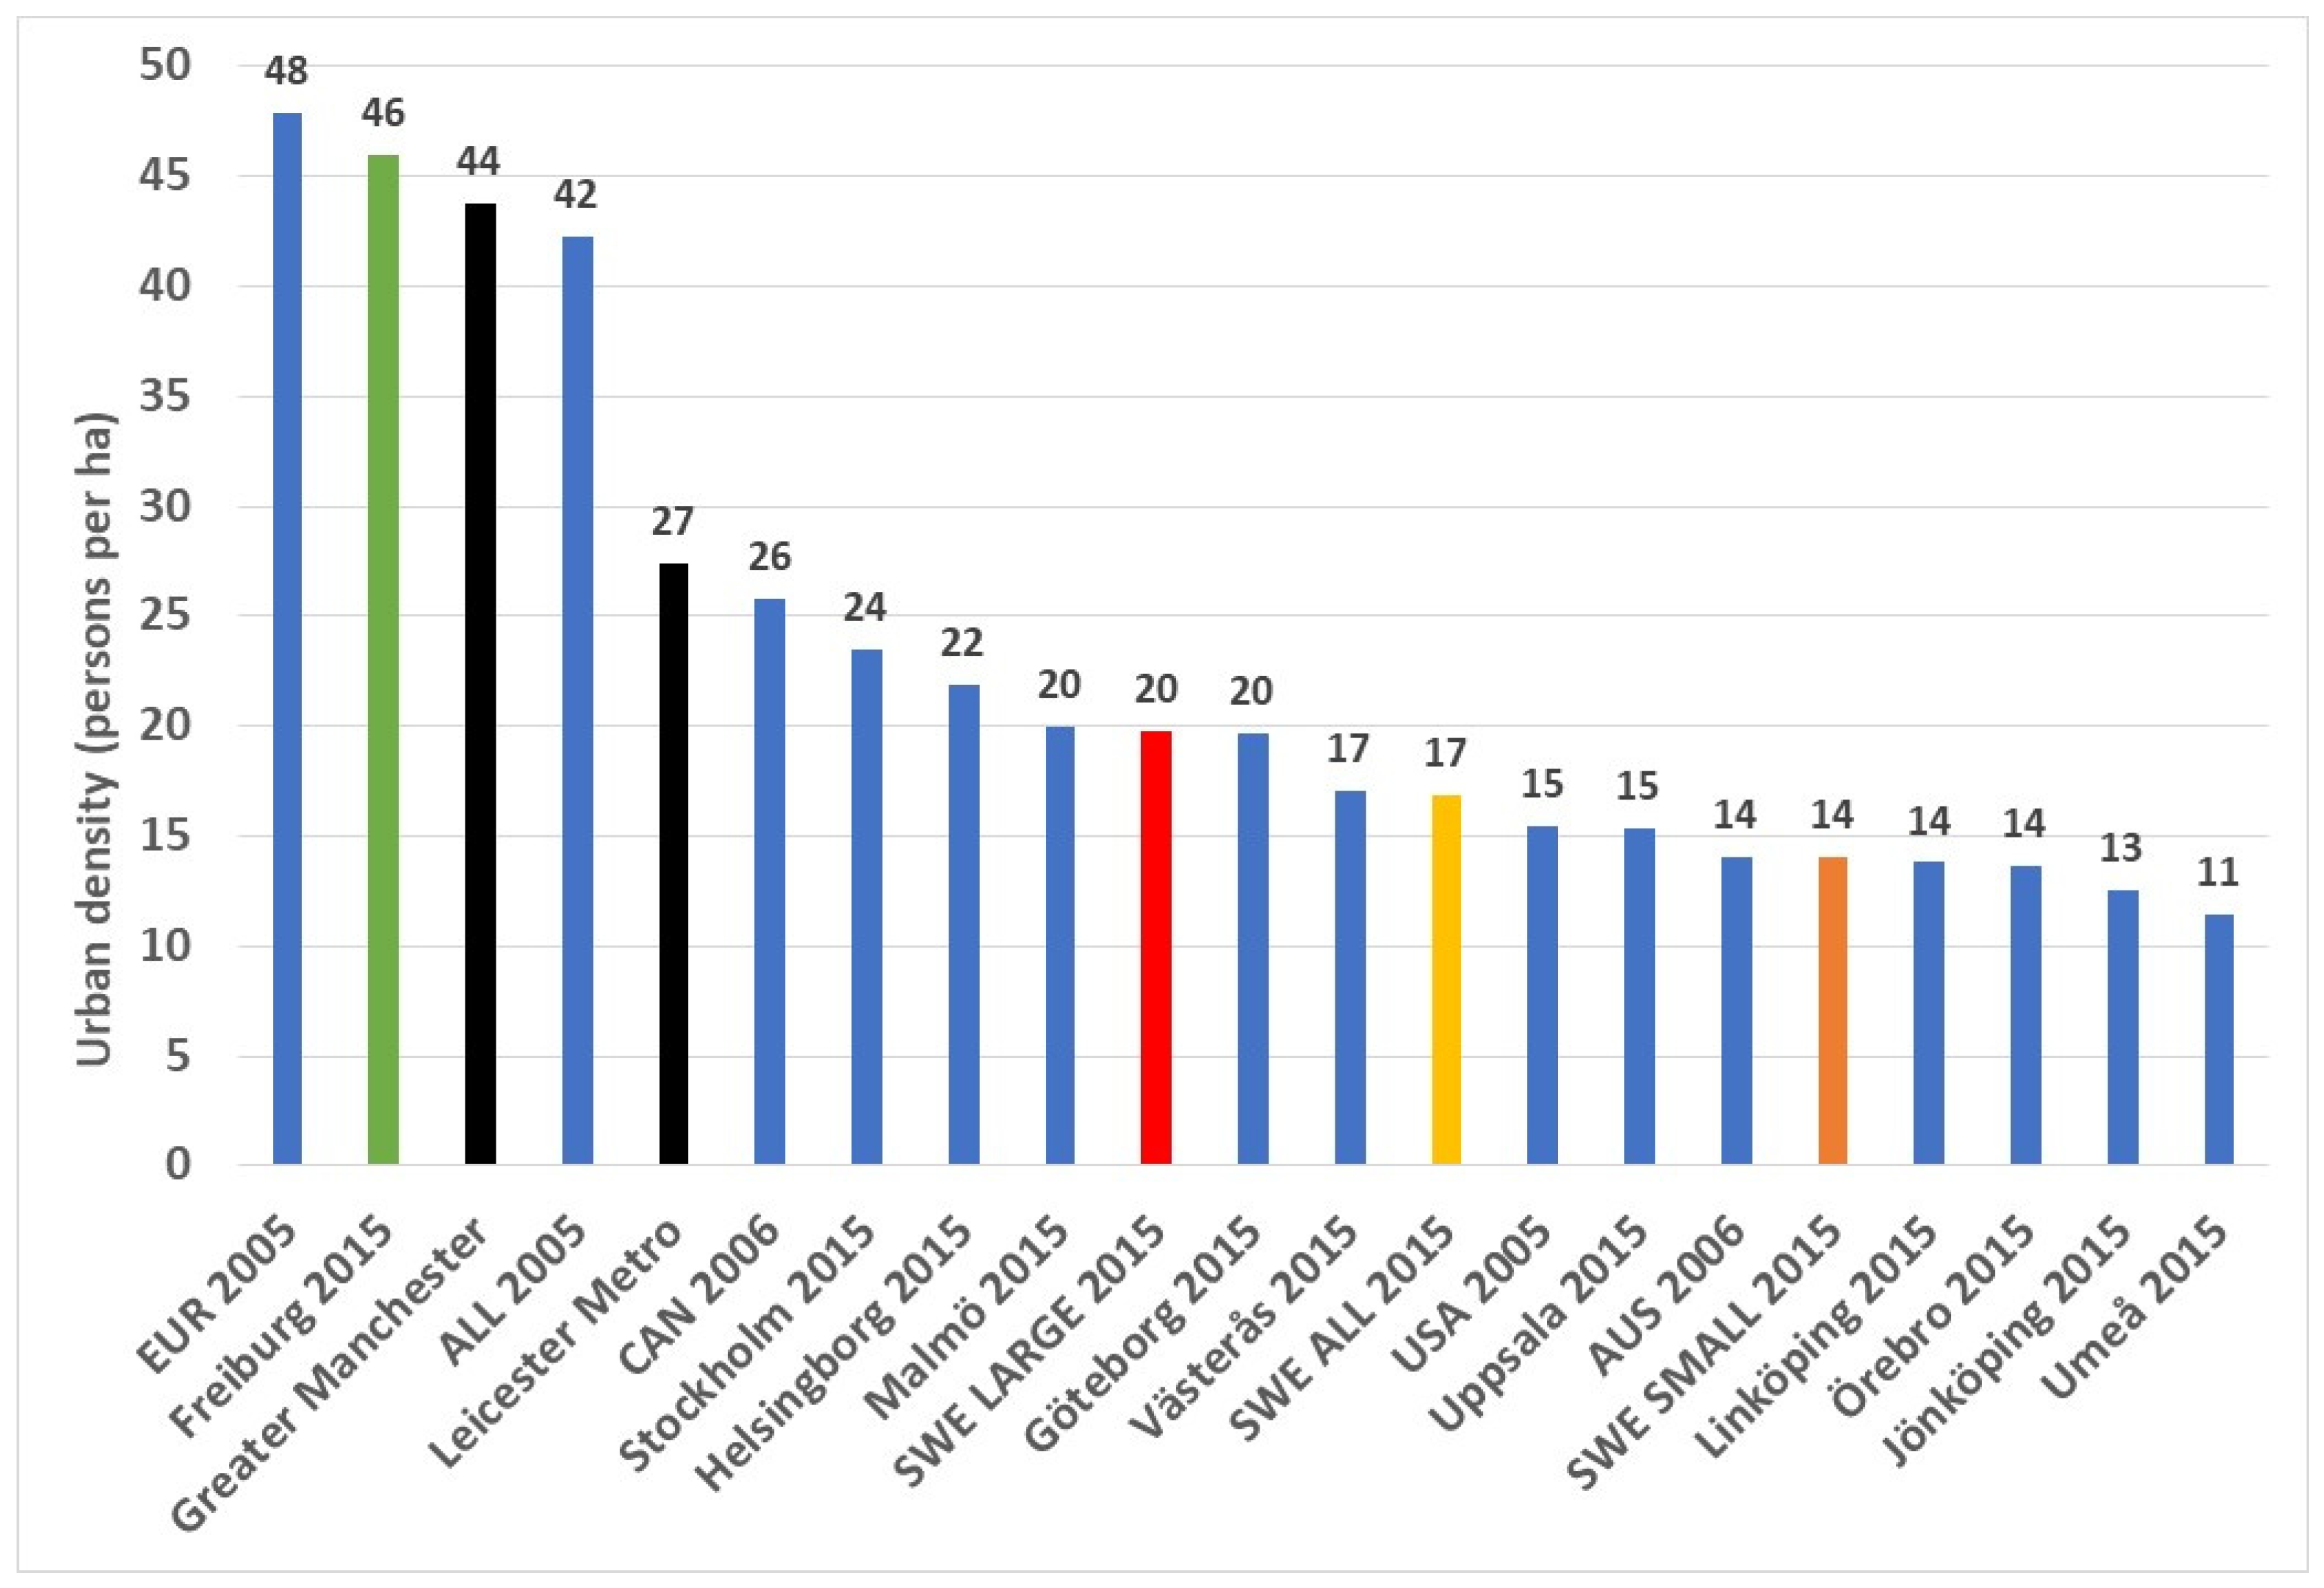
Figure A1 shows that GM (43.8 persons/ha) has a similar density to the European cities in 2005 (47.9 persons/ha), which would have declined over the 11 years to 2016 to be roughly similar to GM. It is also like Freiburg in 2015 with 46 persons/ha. From this, it can be concluded that GM has a density that is more than sufficient to achieve relatively low levels of automobile dependence, as evident in continental Europe [14,15]. That is, overall, it cannot be said that GM is handicapped with insufficient concentration of population for people to use public transport, walking and cycling for many of their daily needs.
For LM, the situation is a little different with an overall urban density of 27.4 persons/ha, with the City of Leicester having a significantly higher density but containing only a bit over a one-third of the metropolitan population. It is important to point out that LM’s density is not affected by the large areas of rural or forested land within its border, as only urbanised land is included.
Although LM’s density is lower than most continental cities, it is significantly higher than the average Swedish city of only 16.9 persons/ha. Even the Stockholm region has a density of only 23.5 persons/ha, which is the highest in Sweden. So again, LM can be viewed as having sufficient urban density, especially in the core of the region, to support lower car dependence than is found in the American (15.4/ha) and Australian cities (14.8/ha), and to a lesser extent the Canadian cities (25.8/ha). To what extent both these cities exploit this density is discussed later. Figure 7 shows urban density compared to all the other cities.
Figure 7.
Urban density in GM and LM compared to other international cities (Asian cities 217 persons per ha excluded due to scale issues).
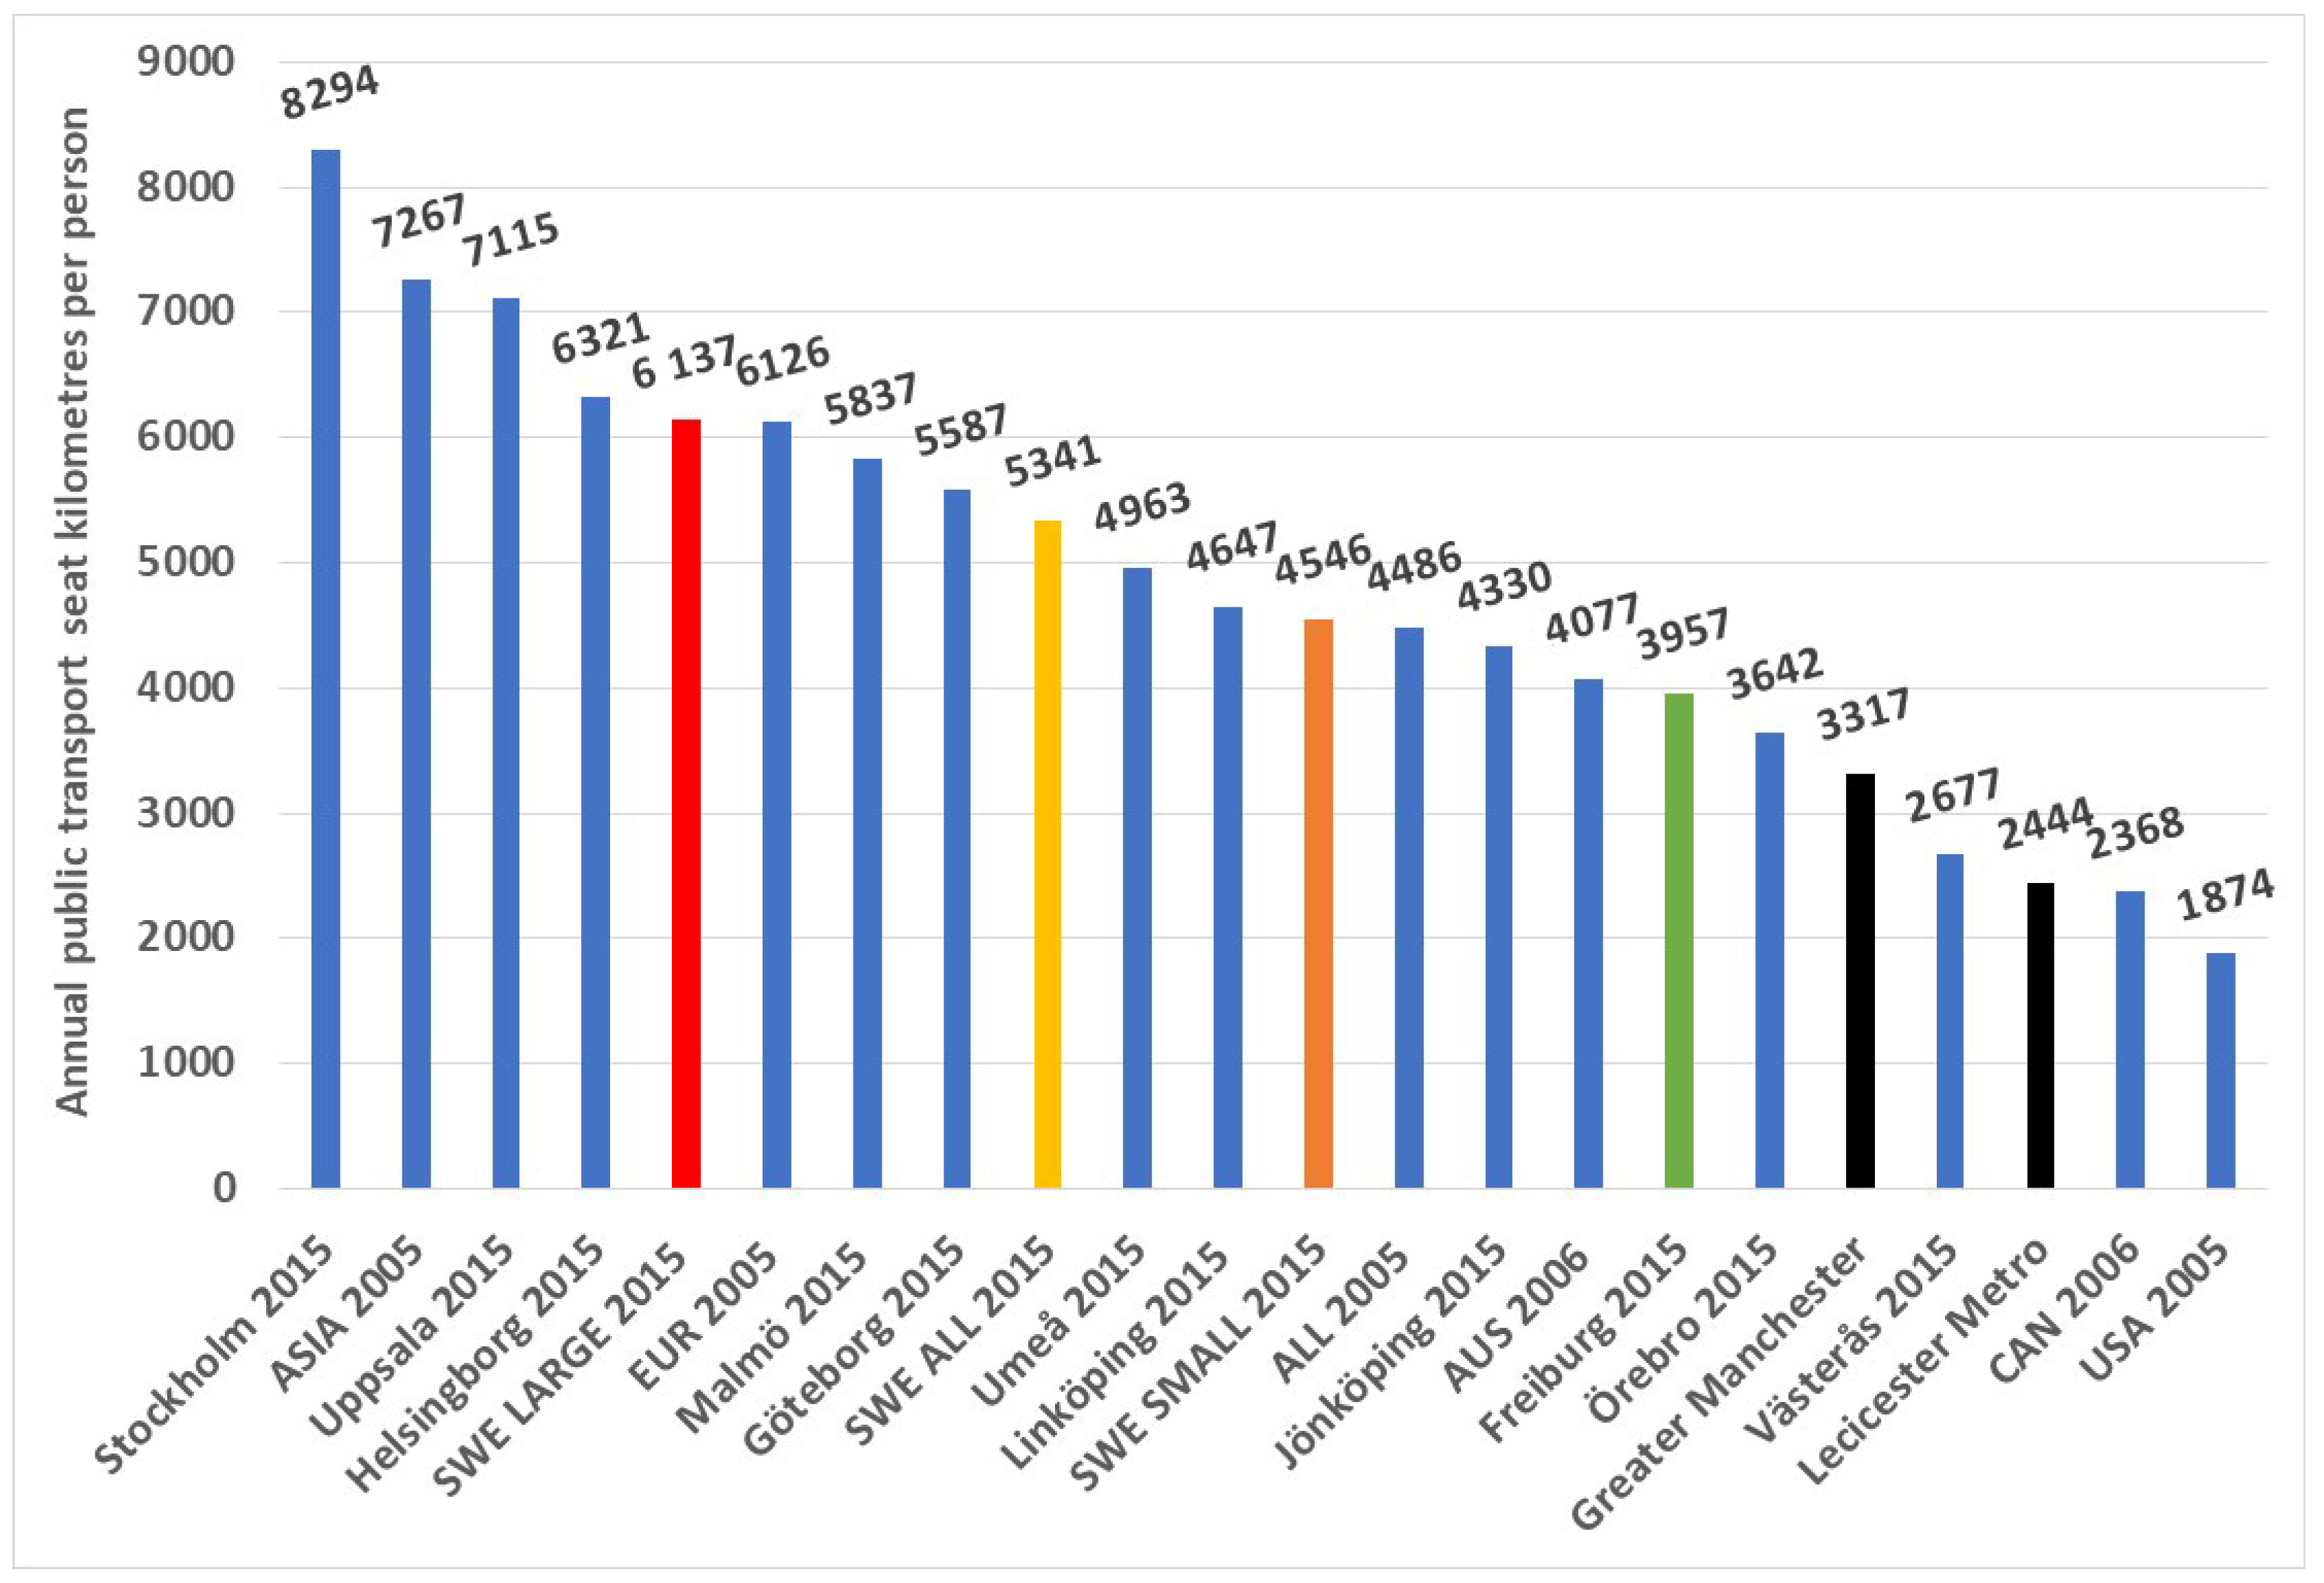
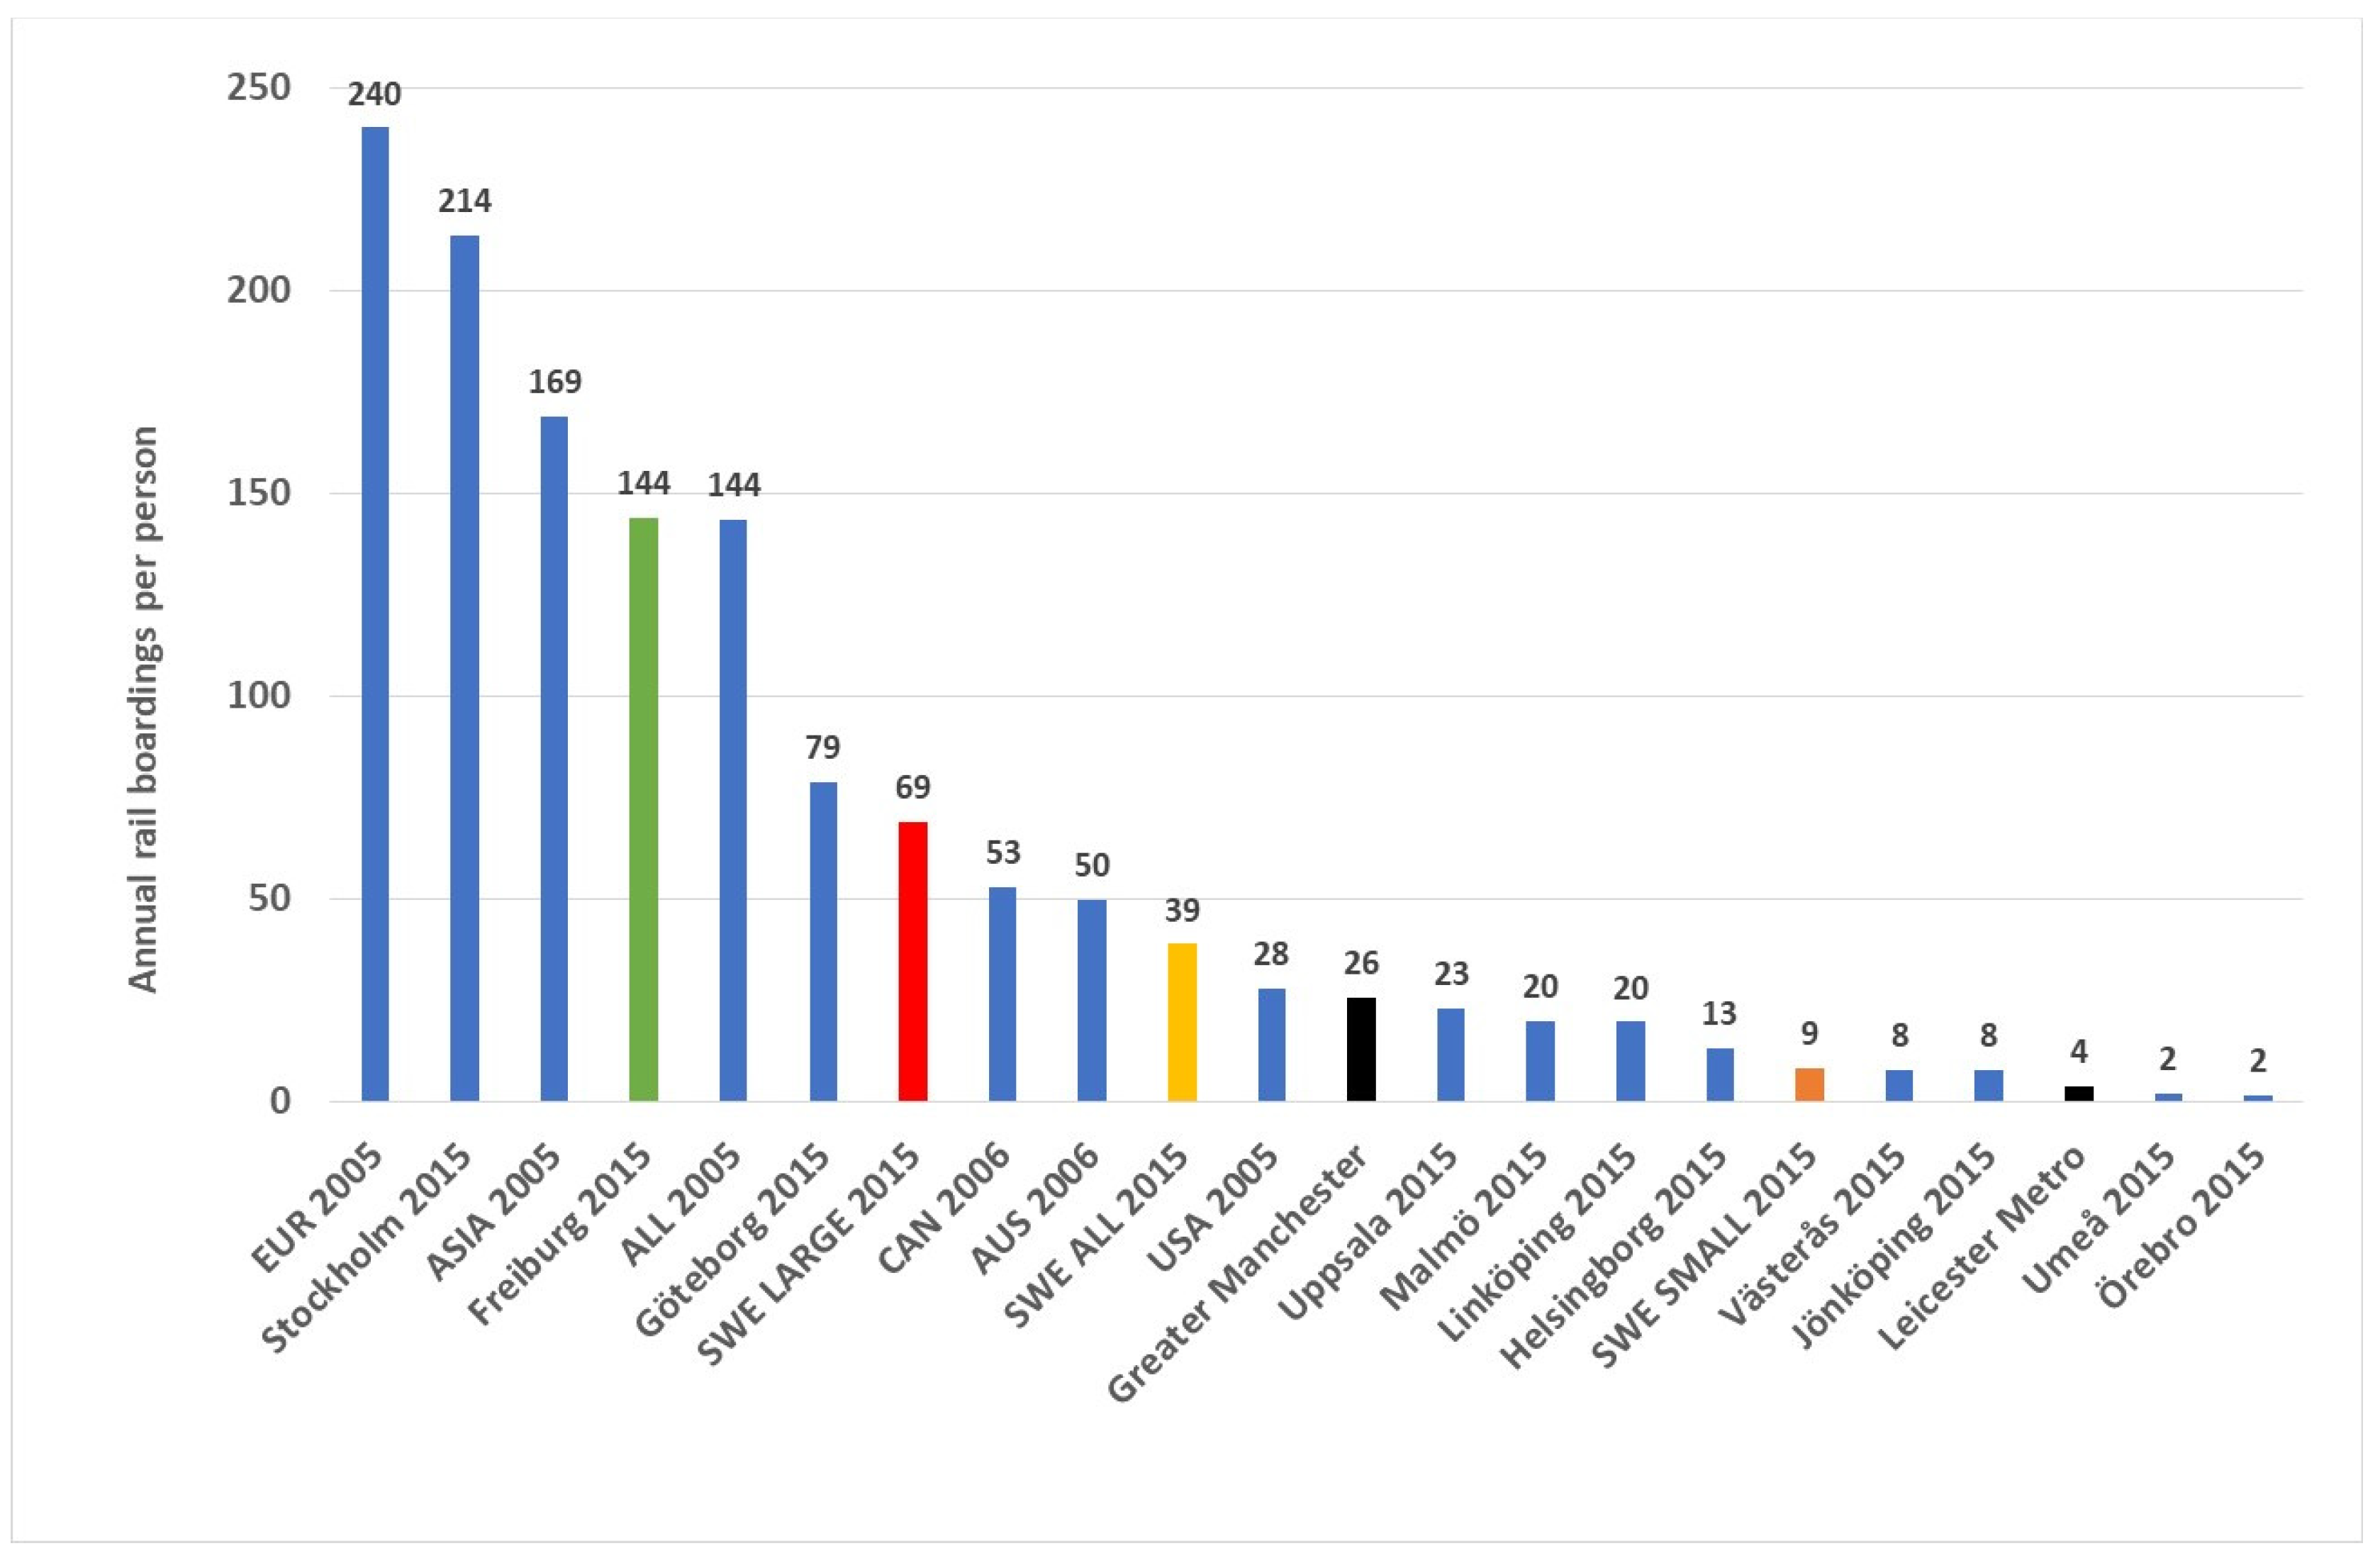
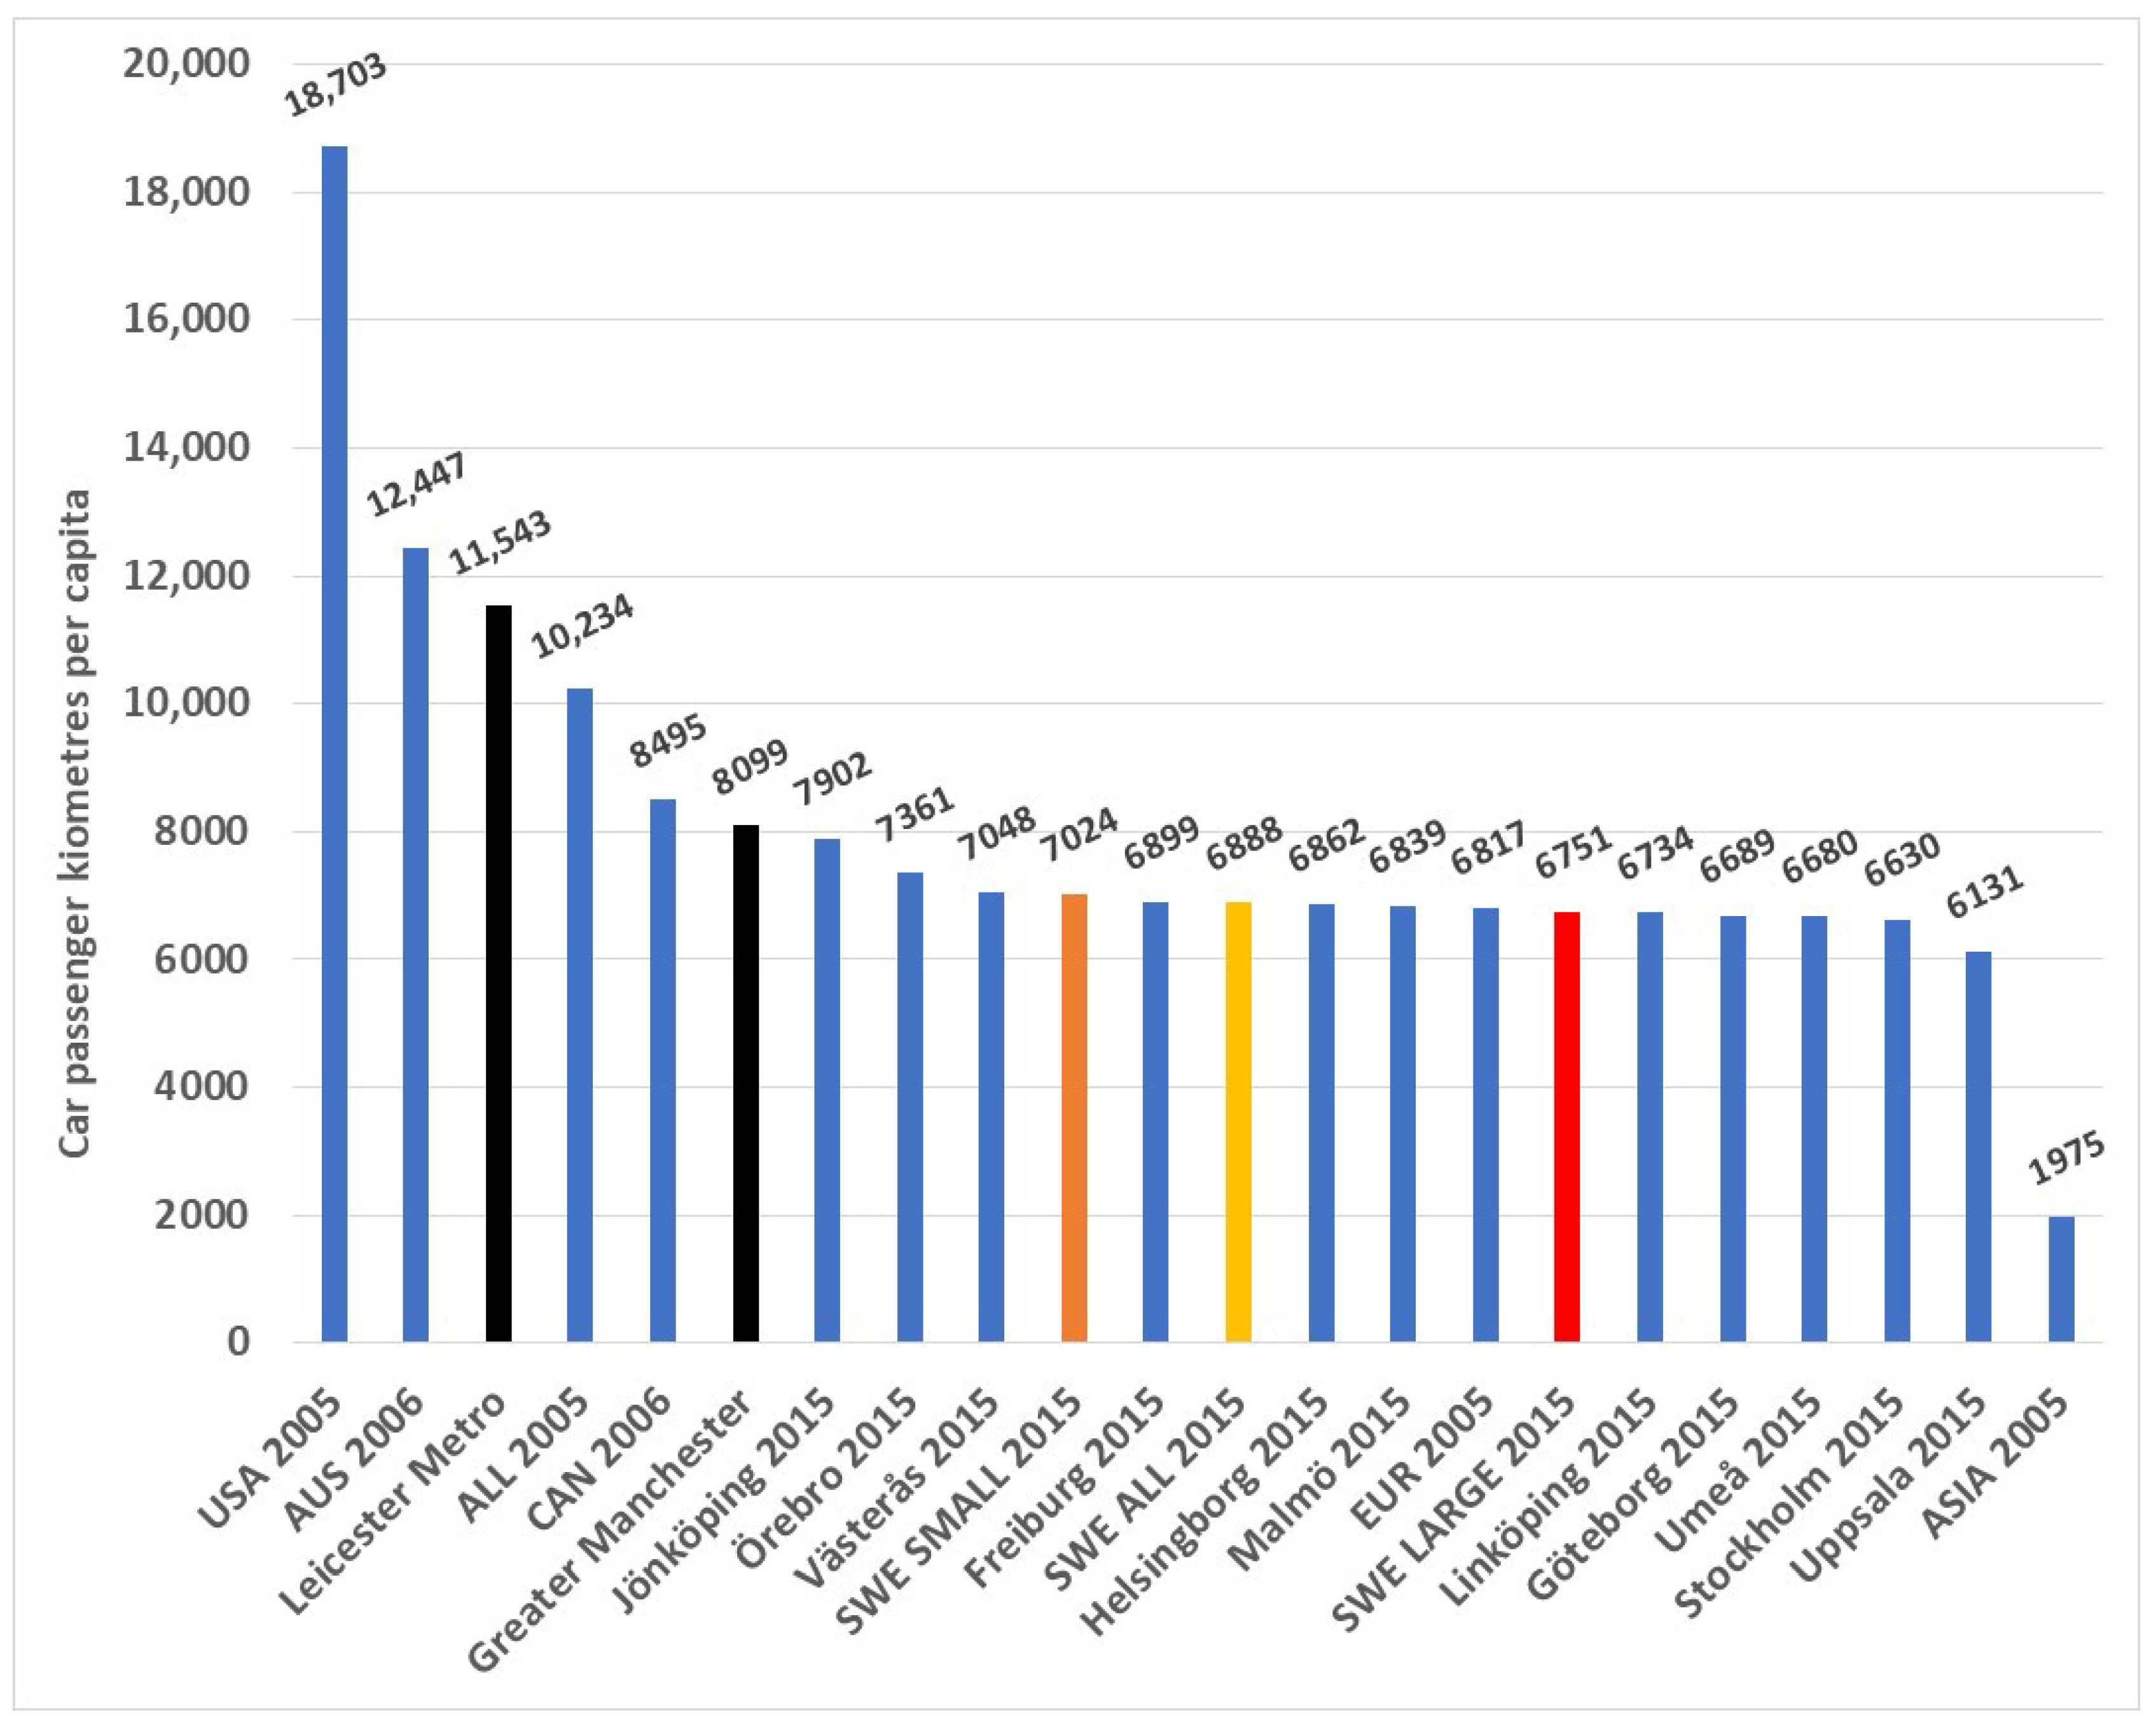
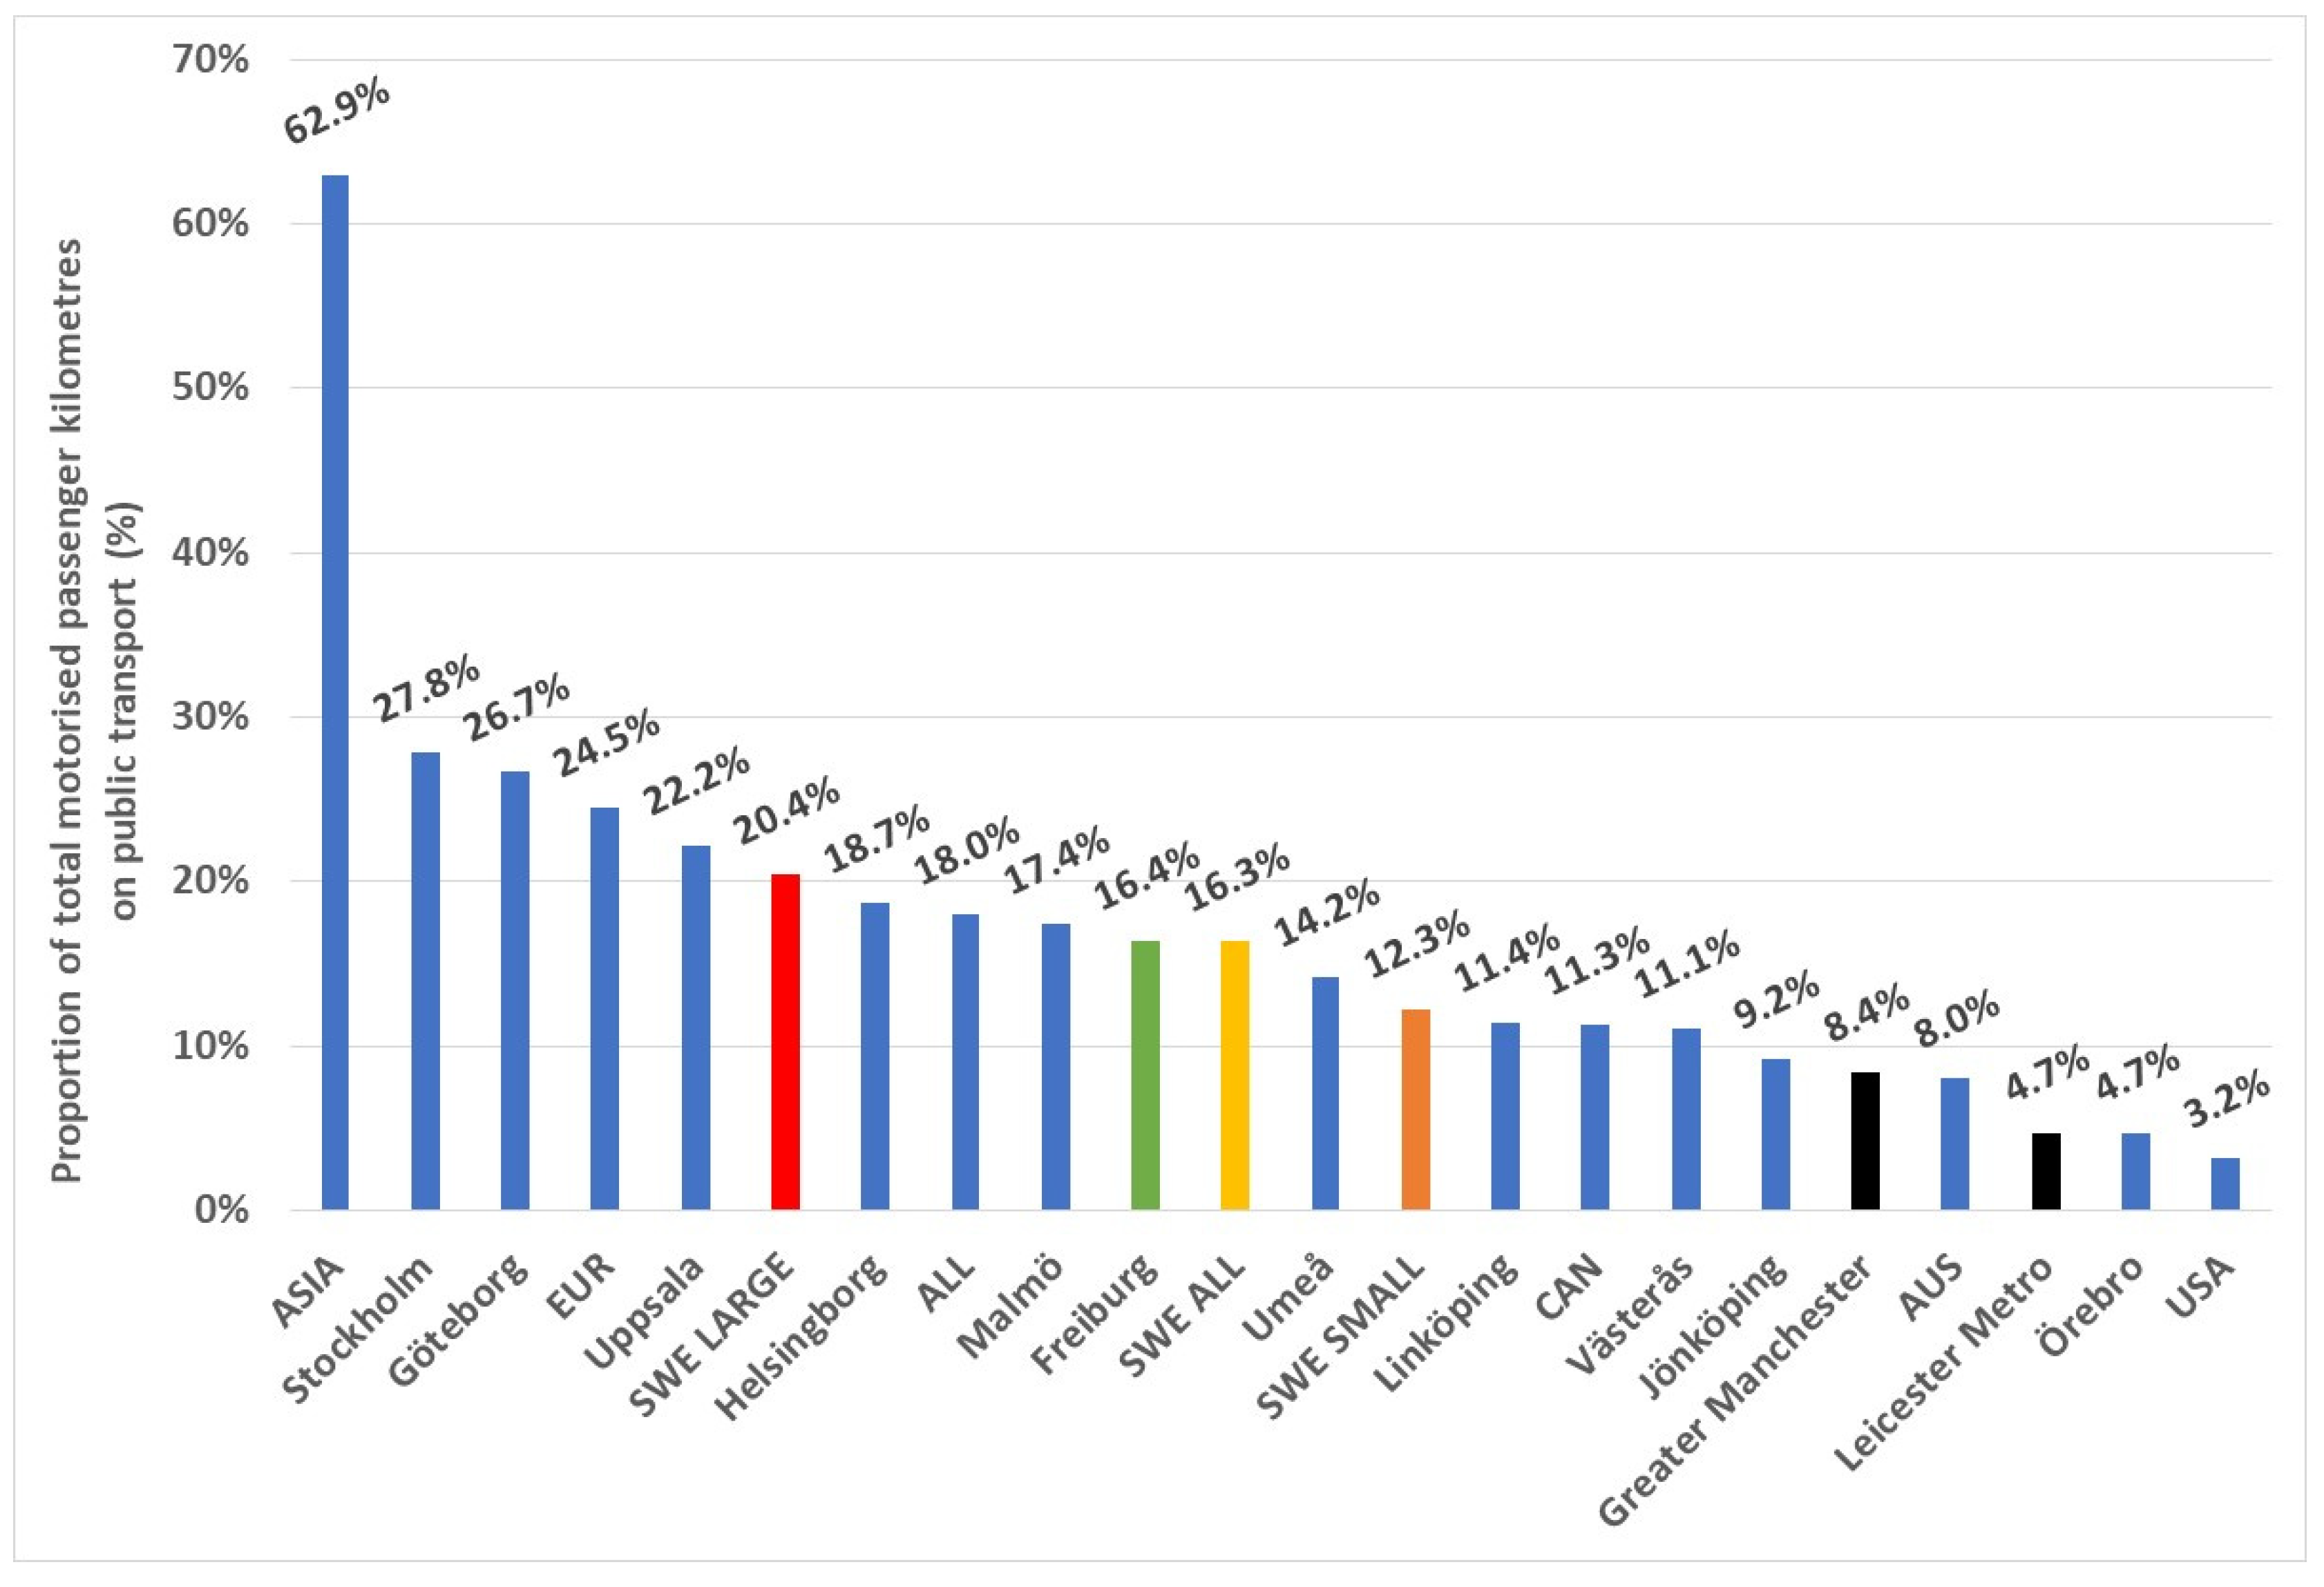
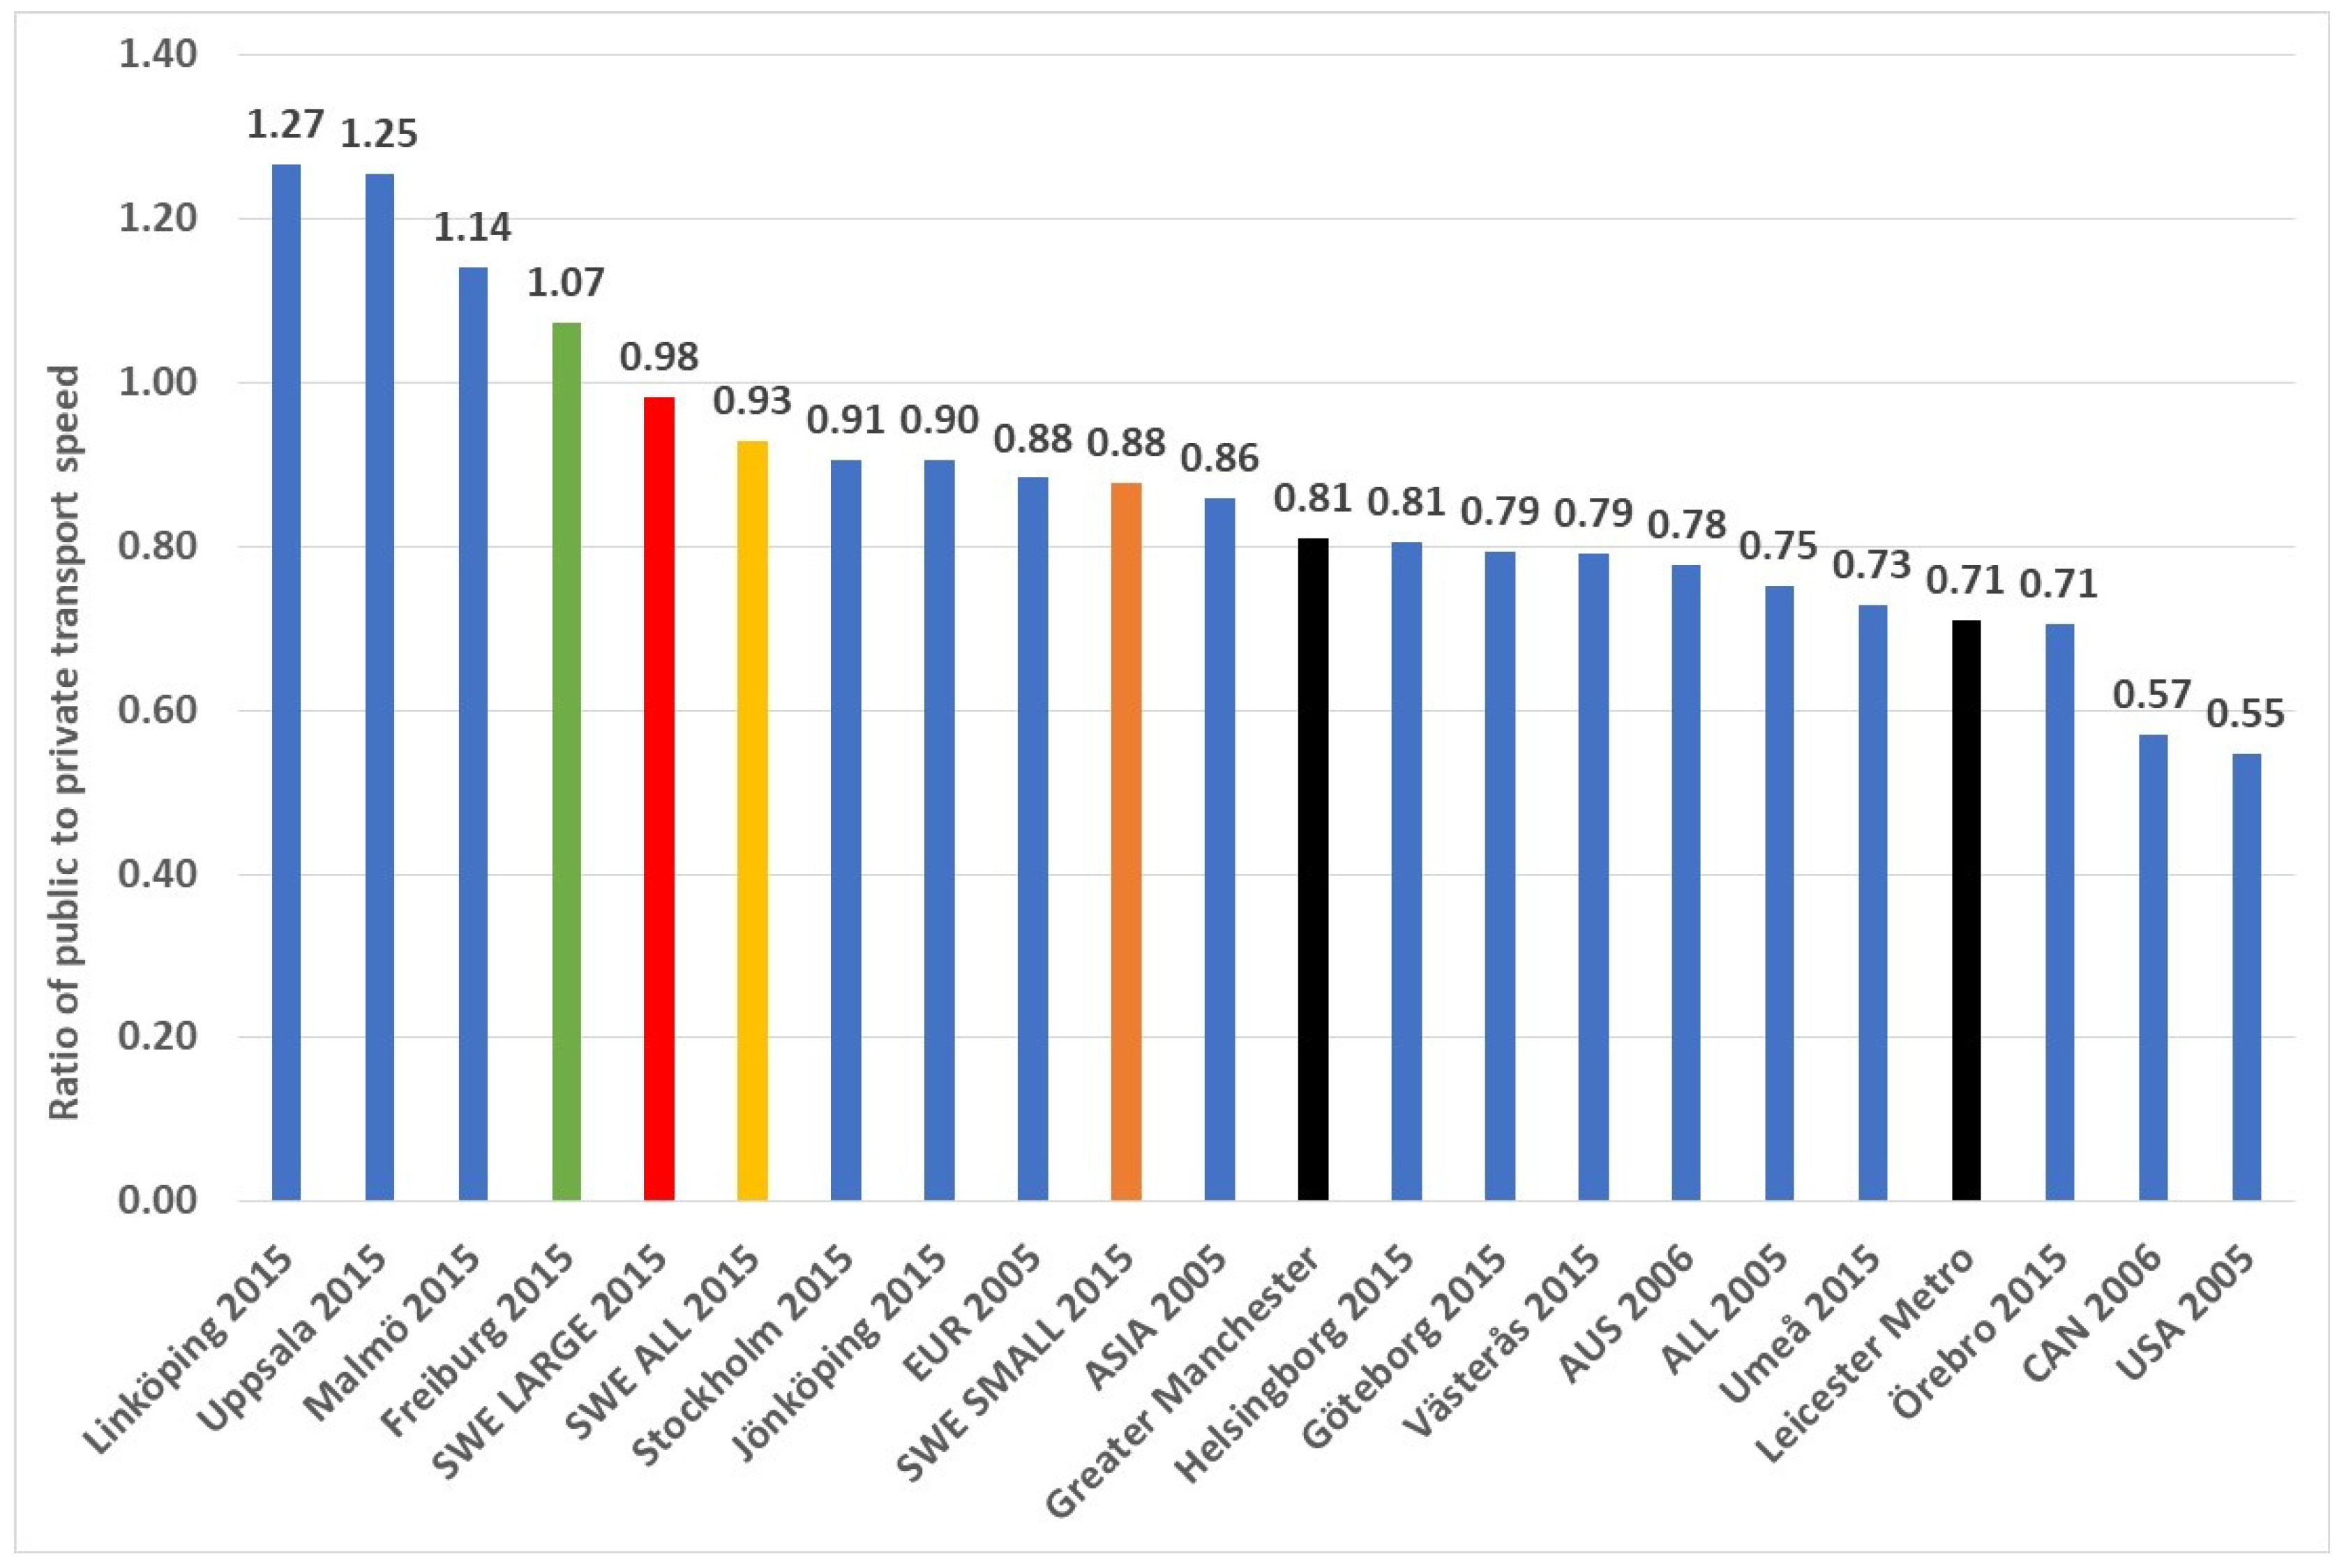
It should be noted that for clarity, the two UK cities in Figure 7, and in all similar column graphs in this paper (Figures 8–12, 14, 17–21 and 24–35) are shown in black. Likewise, Freiburg is always shown in green. The average for the five large Swedish cities in 2015 is always shown in red and for the smaller five Swedish cities, the average is shown in orange. The average for all Swedish cities combined in 2015 is always shown in gold. The blue columns simply represent all the remaining regional averages from 2005 or 2006 and the values for individual Swedish cities.
Figure A1 also provides data on metropolitan job density as well as an activity density for each city which is a sum of the population and job densities. The same patterns are found as for urban density and do not need to be discussed here.
4.1.2. Proportion of Jobs in the CBD
The proportion of metropolitan jobs located in the CBDs of the two UK cities indicates poor centralisation (GM 10.8% of metropolitan jobs and LM only 8.7%, which are close to US levels of job decentralisation in 2005—only 8.2% of jobs in their CBDs). This is compared to 18.3% in European cities in 2005 and 17.3% on average in the Swedish cities in 2015. The larger Swedish cities are slightly less centralised than the smaller (16.3% cf. 18.3%), perhaps because as cities grow larger, they begin to develop significant sub-centres beyond the CBD (polycentrism), which certainly occurs in Stockholm. The larger Swedish cities are identical to Freiburg, with 16.3% of jobs in the CBD. A higher percentage of jobs in the CBD generally works in favour of public transport, at least for work-related travel and likely also better access to work and other services by non-motorised modes. Figure 8 shows the percentage of jobs in the CBD in GM and LM and the international cities in the study.
4.1.3. Metropolitan Gross Domestic Product (GDP) per Capita
Wealth was measured here as metropolitan GDP per capita. The data in Figure A1 were calculated for the labour market region of each city (see Table 1, Item 6). Note that for the purposes of the international comparisons published over decades using this urban comparative data [5,13,15], all financial data were converted to constant 1995 US dollars so that continuity in comparisons could be maintained (see notes to Figure A1).
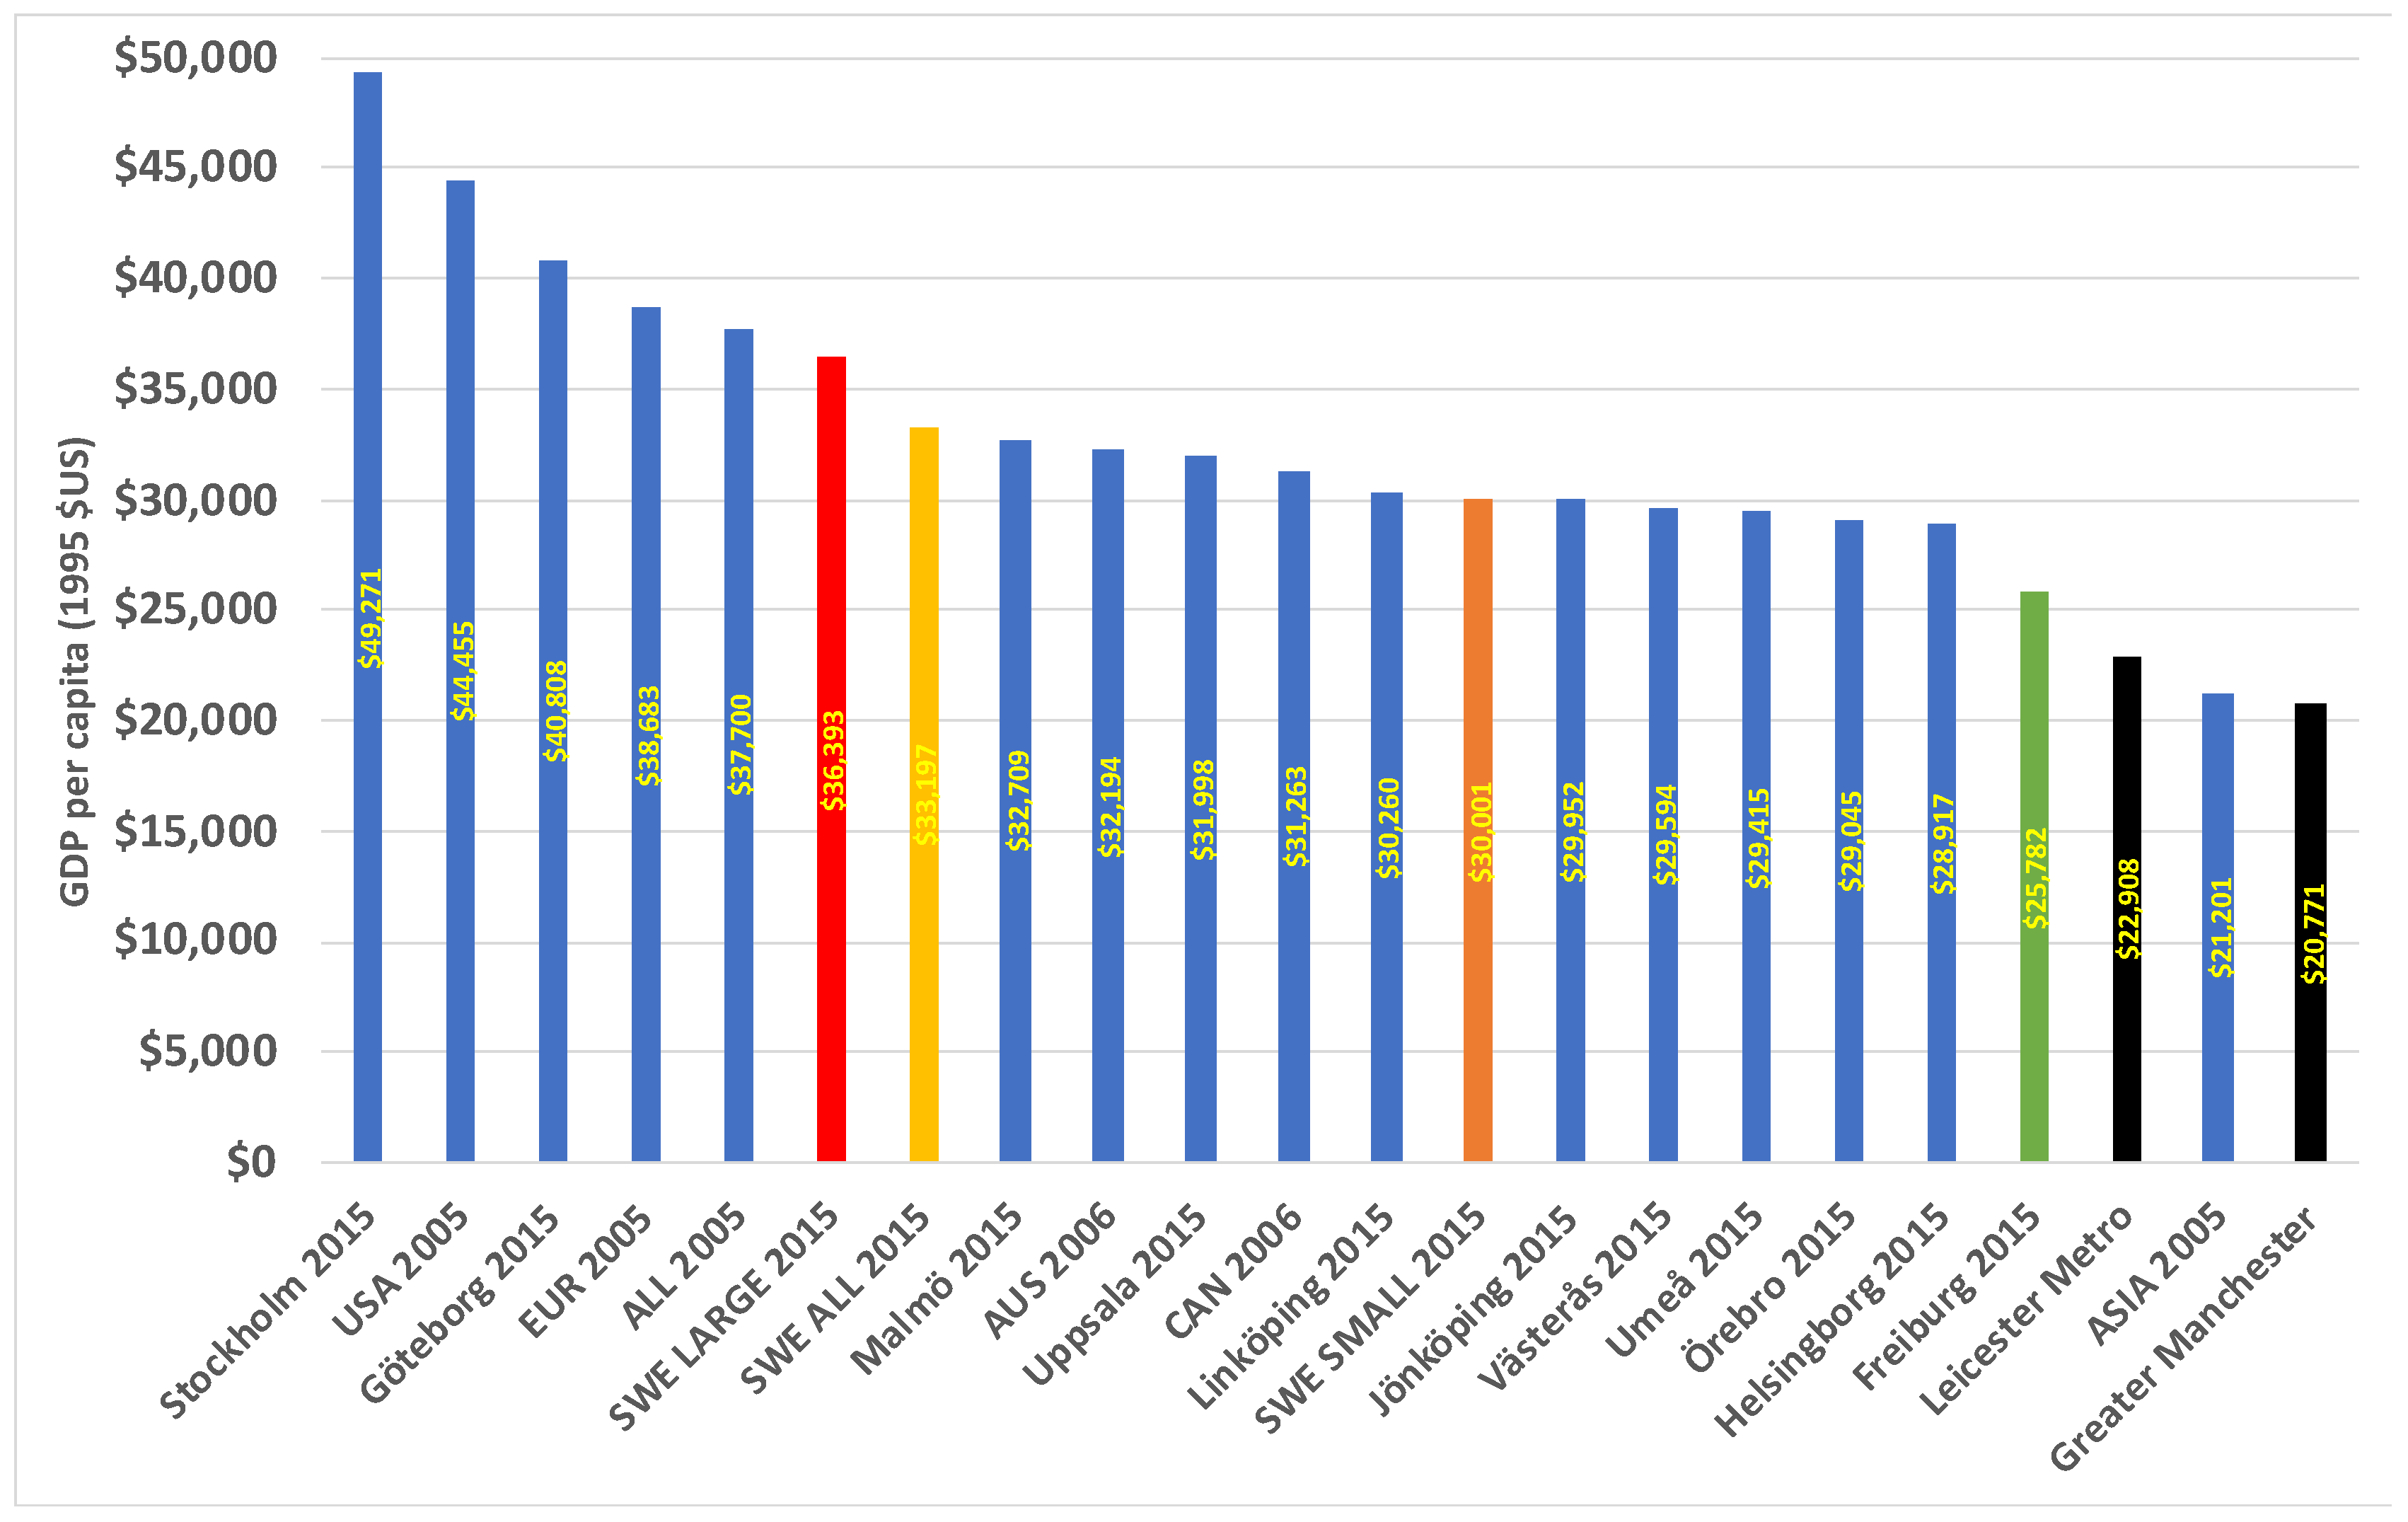
In 2016, both GM and LM had low levels of urban wealth for cities in the developed world (USD 20,771 and USD 22,908/person respectively). Figure 9 shows this clearly. In 2015, Swedish cities were moderately wealthy, averaging USD 33,197/person, which was more than both the Australian (USD 32,194) and Canadian cities (USD 31,263) were in 2006, though these cities now likely have higher GDP per capita. GM and LM are languishing in wealth as measured by local GDP compared to peer cities, both in Europe and globally.
The other European cities in 2005 were higher in wealth (USD 38,683). The global sample in 2005 averaged USD 37,700. Stockholm, the largest and most important Swedish city, clearly stands out in wealth (USD 49,271) and in 2015 was higher than the US cities were in 2005, the wealthiest group in the global sample (USD 44,455). The smaller Swedish cities have clearly lower GDP per capita than the larger Swedish cities (USD 30,001 cf. USD 36,393). An important point to note is that Freiburg has significantly lower GDP per capita (USD 25,782) than all the Swedish cities and compared to other cities is in the vicinity of the GDP per capita of GM and LM, though still higher. The impact or otherwise of urban wealth will be returned to later in the discussion of the private, public and non-motorised transport patterns.
4.1.4. Road Length per Capita and per Hectare
The length of road per capita and per hectare includes all roads in the metropolitan area from motorways to small residential streets. Urban density is strongly related to road length, which logically decreases as density increases because it requires less road length to service a compactly distributed population than it does a sprawling population. GM, with its near typical European density, has a road length of 3.3 m/person (metres per person), while LM with its significantly lower density, has 5.3 m/person. The larger Swedish cities, with even lower density (19.8 persons/ha) than these UK cities, average 6.5 m/person. In 2005 the European cities, which had an average density of 47.9 persons/ha, had only 3.1 m/person average road length provision—in all, a close relationship to density. In summary, the road length per person in the two UK cities conforms well to the overall pattern found globally.
Spatially, the two UK cities are higher in total road length per hectare than the Swedish cities because the roads are superimposed on a more compact urban landscape. It could be imputed from this that roads in GM and LM possibly have more negative impacts on liveability than those in Swedish cities, simply because their spatial presence is stronger. The fact that road density is also higher in the UK cities than in America, Australia or continental Europe, further strengthens this claim.
4.1.5. Freeway Length per Capita and per Hectare
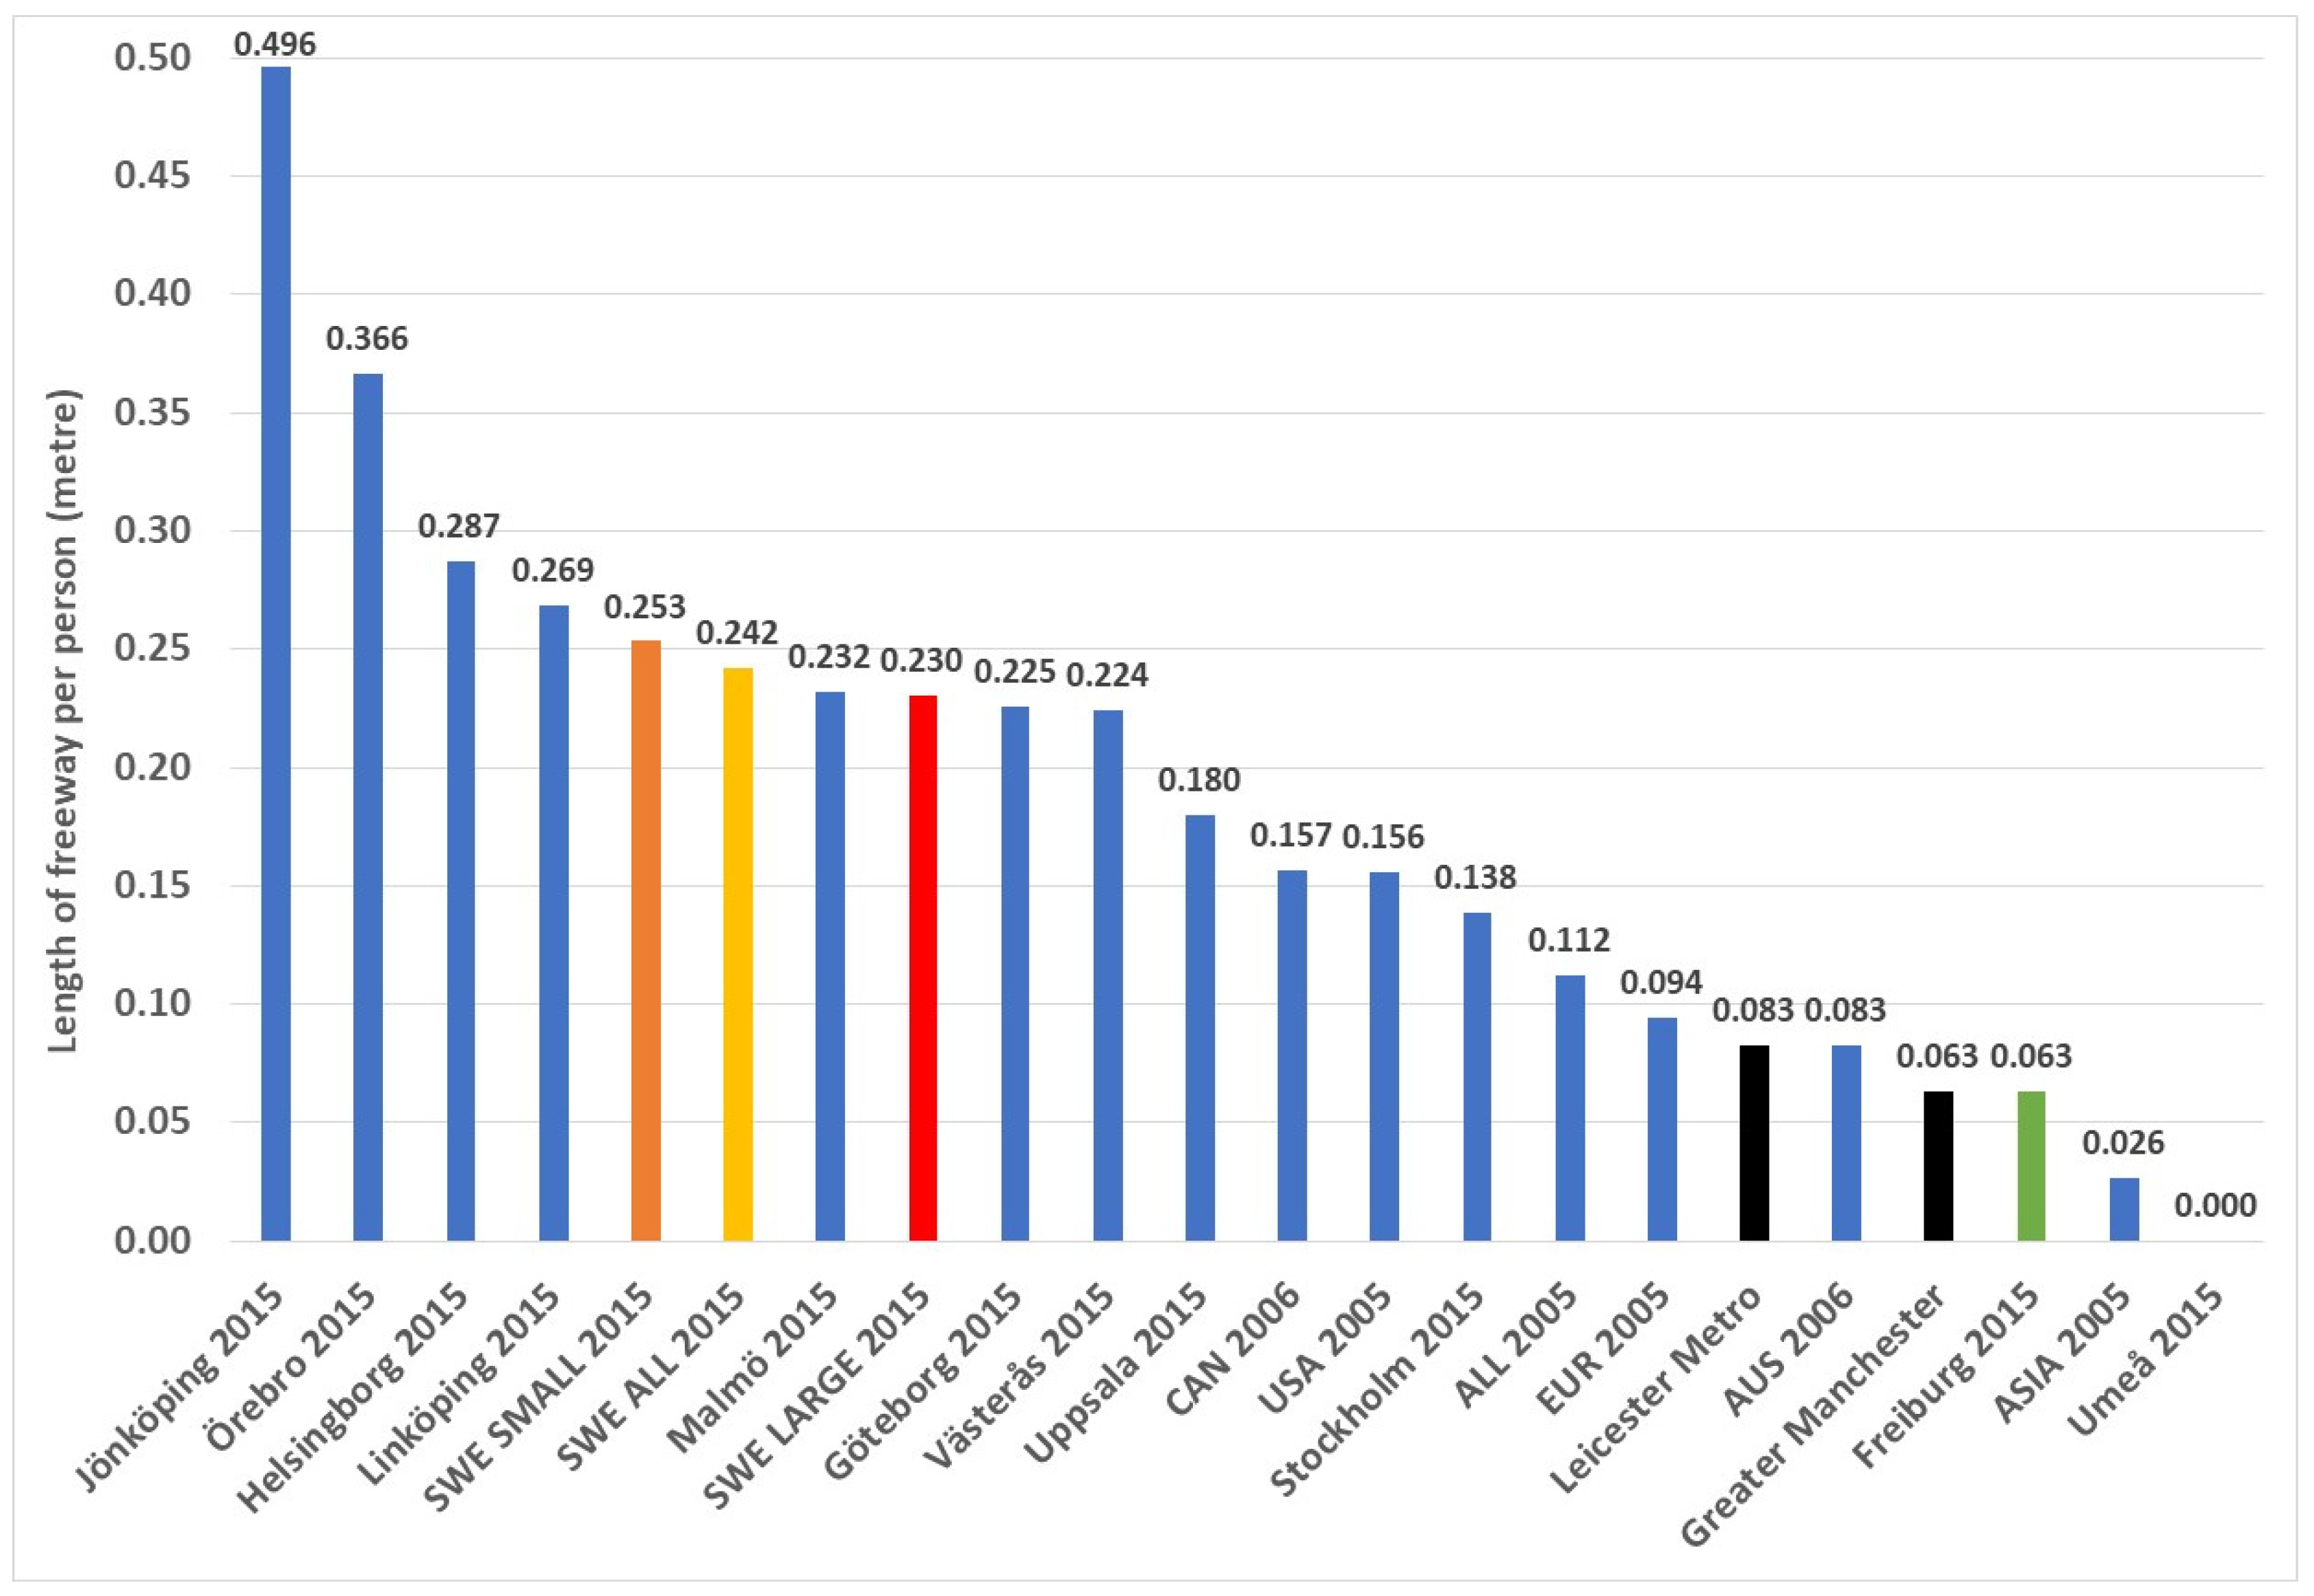
Based on the data in Figure A1 and Figure 10, it is seen that GM and LM are only moderate in their freeway provision when measured by freeway length per person (0.063 and 0.080 m/person respectively). The much lower density and generally smaller Swedish cities have in contrast built considerable freeways and because of low populations, the per capita provision is high. The larger Swedish cities averaged 0.230 m/person in 2015 or some 3.6 times more than GM and 2.9 times more than LM. The continental European cities had 0.094 m/person, which was closer to the two UK cities but still more. The American and Canadian cities in 2005 were also higher than the UK cities in 2016, though quite similar to the Australian cities.
Figure 10.
Length of freeway (motorway) per person in GM and LM compared to other international cities.
When considering the length of freeway per urban hectare, GM and LM are again relatively modest compared to many other cities. For example, the Swedish sample averaged 5.0 m/ha in 2015, and the continental European cities averaged 4.1 m/ha, while GM had 2.7 m/ha and LM had 2.1 m/ha. The global sample in 2005 averaged 3.4 m/ha. This cannot and should not be used as an argument for more motorway construction in GM or LM. Rather, in a policy sense, it must be viewed as an advantage over other cities and as even a call to reduce it further, which will become clearer later in the paper.
4.1.6. Parking Spaces per 1000 CBD Jobs
For trips to the CBD, parking is comparatively limited in the two UK cities, with GM having 234 and LM having 252 spaces per 1000 CBD jobs, or about one parking space available for every four jobs. In other words, setting aside time differences when people work in the CBD and part-time jobs, so that there is the possibility that some spaces might be used by multiple employees, typically only about 25% of the people who might want to find a parking space for work in the CBD, can do so. This is a relatively moderate parking supply compared to many other cities and, all other things being equal, can help leverage the use of walking, cycling and public transport to access CBD jobs.
The ten Swedish cities have a little higher parking supply in their CBDs with an average of 289 spaces per 1000 jobs (Figure 11). The other European CBDs (average of 248 spaces per 1000 jobs) sit between the two UK cities. Freiburg in 2015 had 271 parking spaces per 1000 CBD jobs. The larger Swedish cities perform fractionally better than Europe generally (246/1000 jobs), while the smaller, more car-oriented Swedish cities have 332 spaces per 1000 jobs. Overall, one can say that GM and LM are typical of the European situation on this factor.
It is possible to achieve much lower parking in CBDs, especially in those cities that have a very high CBD job density, such as major global cities like Paris, London, New York and Tokyo. Such cities have exceptional rail-based public transport feeding into their CBDs, which provides the dominant capacity for commuting trips into the area.
While GM and LM are not in this class, there is, in principle, nothing to stop them moving more in this direction. This can be achieved, for example, by building out parking lots and structures with residential development, adding more job opportunities in the CBD with limited or no new parking, greatly improving and expanding the rail and bus services into the centre and making inbound commuting by bike a safe and viable option.
4.1.7. Passenger Cars and Motorcycles per 1000 Persons
Car ownership—So far, GM and LM display factors that can help minimise automobile dependence (moderate densities, typical average road supply, moderate freeway provision, modest CBD parking). Car ownership is another critical factor in a city’s orientation around the car and GM’s and LM’s comparatively low wealth should also generally discourage purchase and use cars. On the other hand, jobs in GM and LM are relatively decentralised, demanding higher car use for accessing work in scattered locations.
There is, however, some divergence here, with GM having comparatively moderate car ownership of 444 cars/1000 persons, while LM has 565 cars/1000 persons, which is globally high (see Figure 12).
Swedish cities in 2015 averaged 431 cars/1000 persons, with the larger cities at 423 and the smaller having 440. Whilst GM is relatively close to Swedish urban car ownership (despite it having lower GDP per capita—Section 4.1.3), LM is very much higher and even less wealthy. As should be expected, GM and LM are both below the averages for the very auto-dependent Australian and American cities in 2005 (647 and 640 cars/1000 persons, respectively). The European cities had 463 cars/1000 persons in 2005, and the global sample overall was 512 cars/1000, though all of these would have increased by 2016. Freiburg, on the other hand, had only 393 cars/1000 persons in 2015, a stark difference to both GM and LM.
Both GM and LM, but especially the latter, demand much higher car ownership than might be expected for cities of such low comparative real wealth, especially given the other moderating factors described above. This is explored later.
Motorcycle ownership—In GM and LM, like many cities with similar characteristics, motorcycles play a relatively small role in mobility. Motorcycles per 1000 persons amounted to only 13 and 20 in 2016 in GM and LM respectively. The Swedish cities in 2015 averaged 30, while Freiburg in 2015 was even higher at 36 per 1000 persons. The European cities in 2005 had 41 motorcycles/1000 persons. Figure A1 shows that GM and LM in 2016 had motorcycle ownership very close to US levels in 2005 (16), Australian cities (21) and Canadian cities (15).
Overall, motorcycles appear to be not as popular in the UK as they are in continental Europe. The reason for this is unclear. Bad weather is unlikely a factor, since throughout Europe the winter is comparable and Sweden may be even less inviting for motorcycle use than in the UK, yet motorcycle ownership is over twice as high as the average for the two UK cities. Motorcycle usage is discussed later.
4.1.8. Average Road System Speed
The 24 h/7 day average speed for the road systems in GM and LM was 36.2 km/h and 39.4 km/h respectively. This is lower than in the Swedish cities in 2015, which had an average speed of 42.6 km/h. With greater freeway supply, this speed is higher than in other European cities in 2005 (34.3 km/h). There is, however, a notable difference between the larger Swedish cities (37.3 km/h) and the smaller cities with presumably significantly less congestion (47.8 km/h). Road traffic in GM and LM is, as could be expected, also slower than in North American and Australian cities, which collectively average 46.2 km/h. On the other hand, Freiburg’s average road traffic speed is only 29.9 km/h, which is commensurate with a city that is much more amenable to public transport, walking and cycling than in GM and LM. This also becomes clearer later in the paper.
4.2. Public Transport Infrastructure and Service
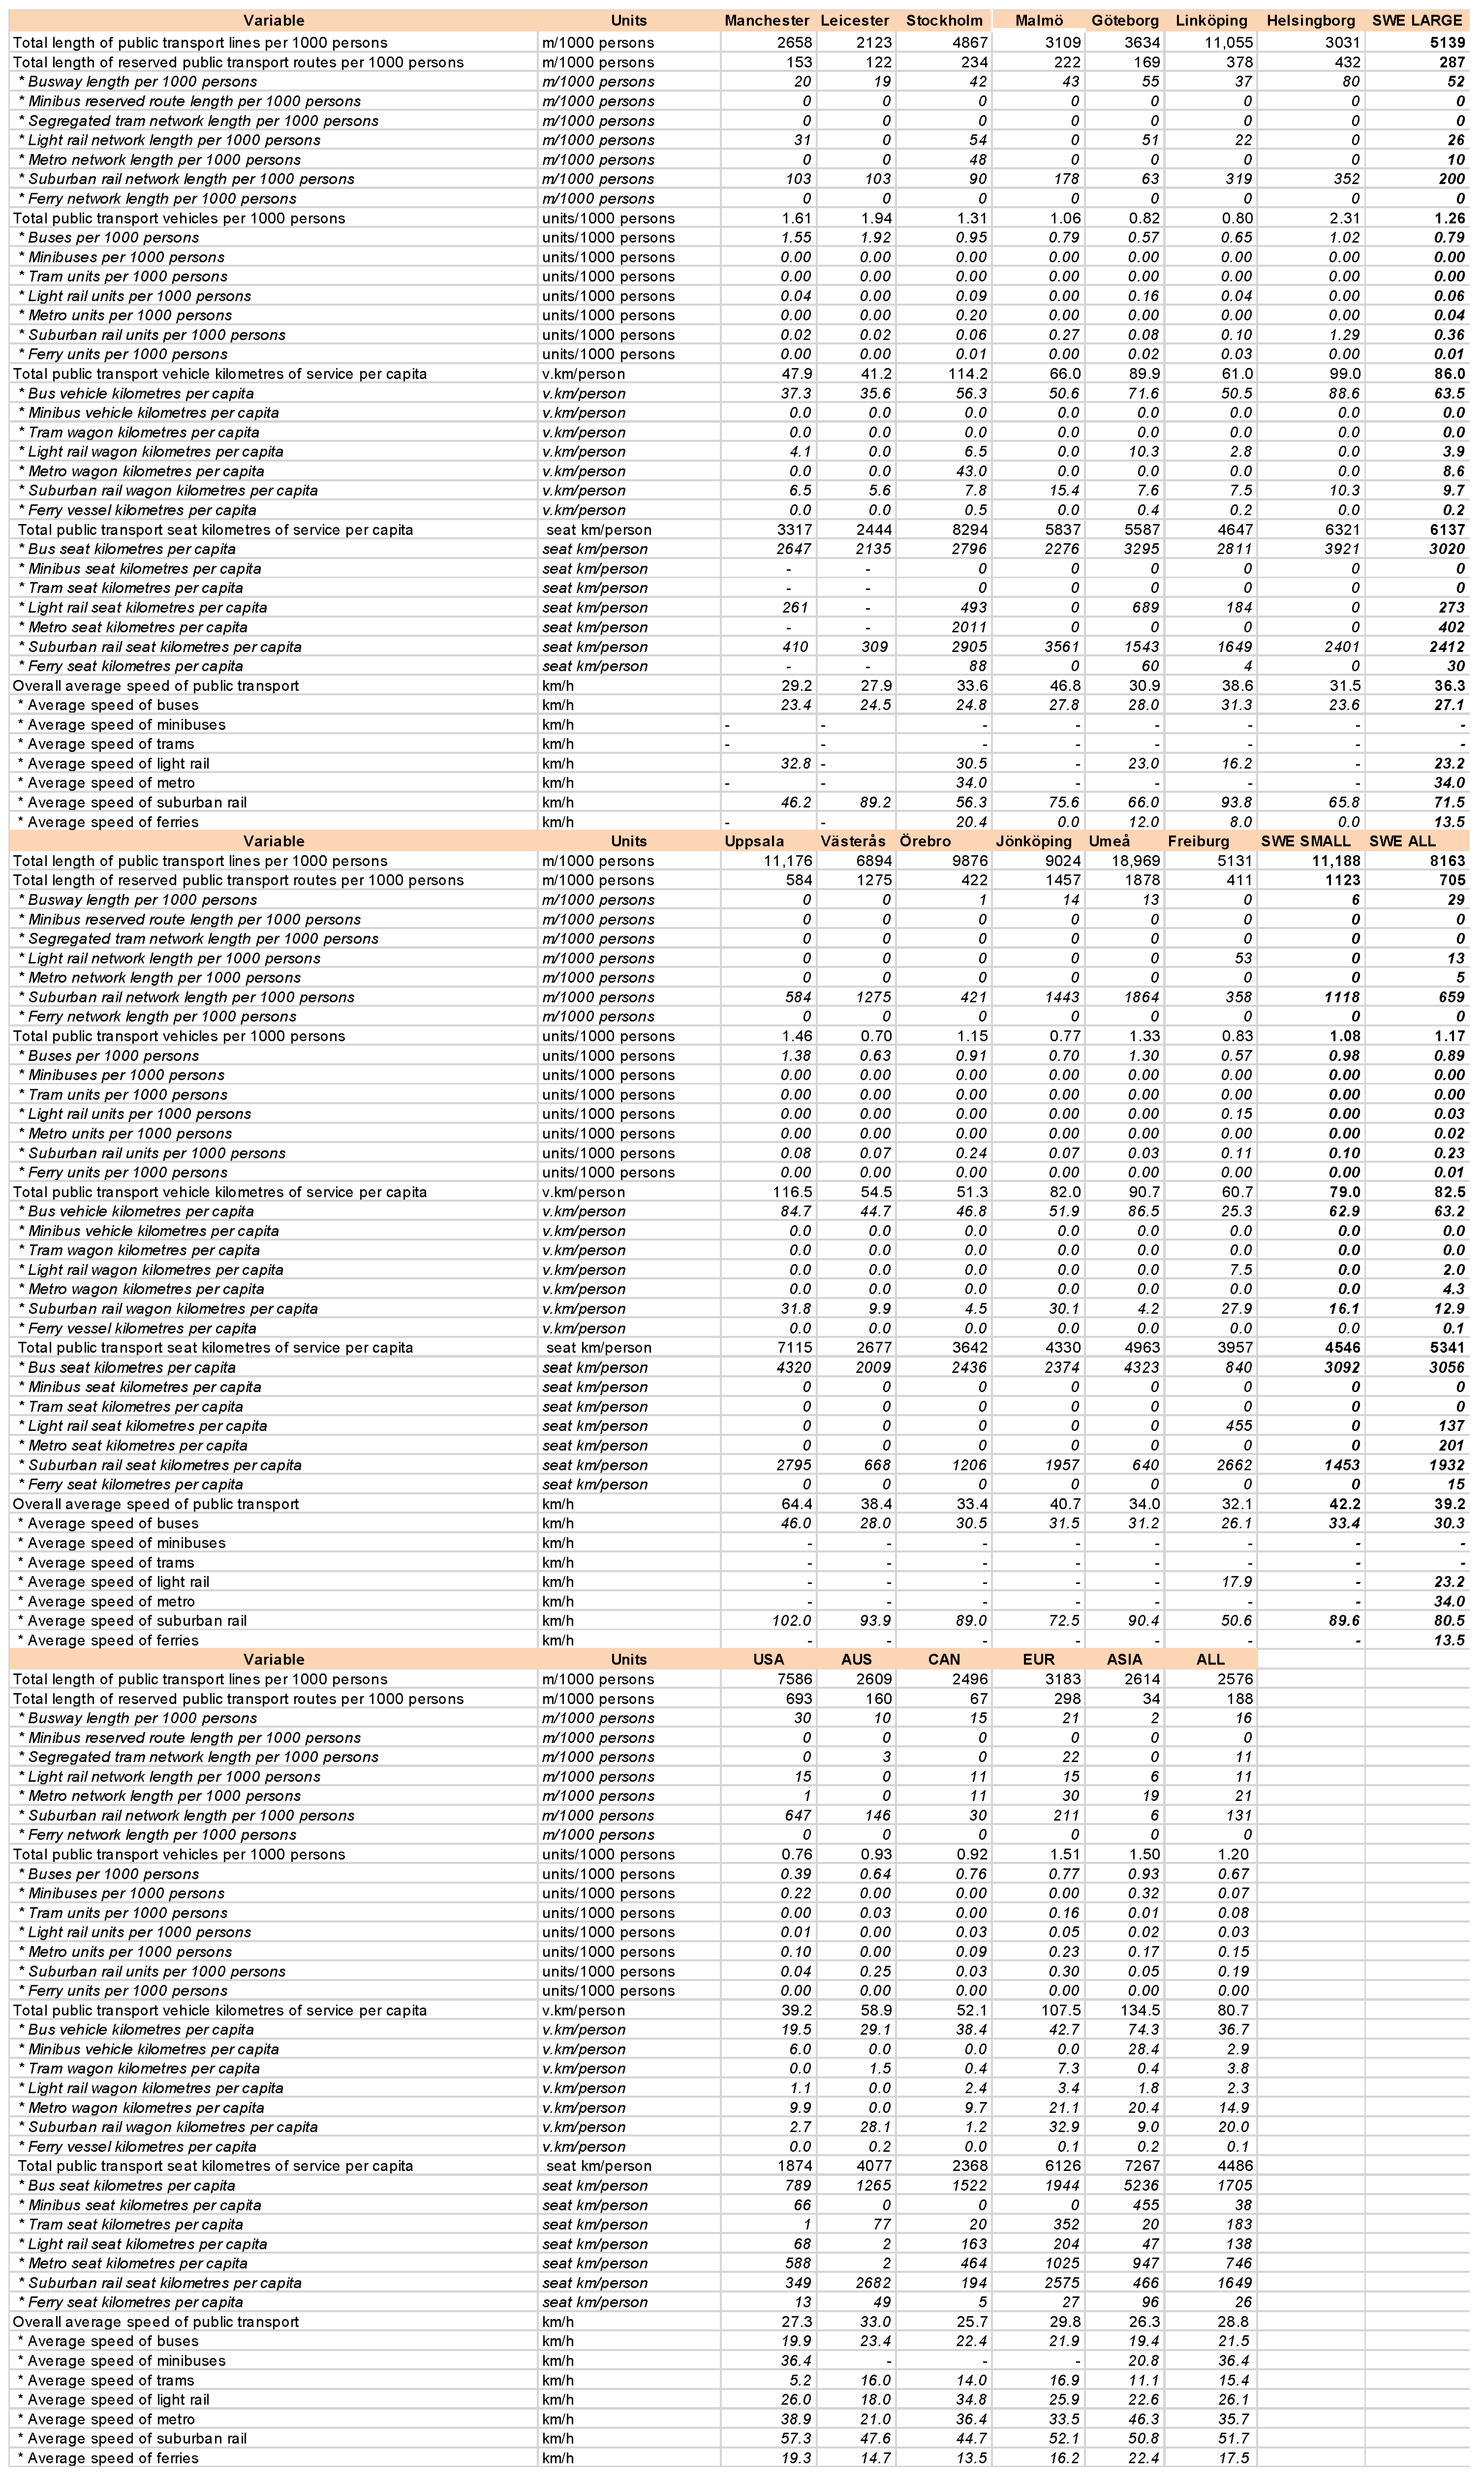
This section presents critical information about the amount of public transport infrastructure and the level of public transport service provided in GM and LM. Figure A2 contains the results.
4.2.1. Public Transport Line Length per Person
Public transport line length per person is a measure of the extent of the public transport system. It is imperfect because it gives no idea how well serviced these lines are. For example, there is a big difference between a bus line that operates 7 days per week on a 10 min headway, compared to one that operates only on weekdays every hour.
Nevertheless, it is worthwhile comparing this factor as it does give some broad overview of how extensive the public transport system is. GM and LM have 2658 and 2123 metres of public transport line for every 1000 persons respectively (i.e., about 2.7 km and 2.1 km for every 1000 persons). By contrast, the larger Swedish cities have 5139 metres and the smaller ones, 11,188 metres, averaging 8163 metres overall, which is 3.4 times higher than the UK cities.
Likewise, Freiburg in Germany has a lot more line length (5131 m/1000 persons), while in 2005 the European cities averaged 3183 m/1000 persons, which was still significantly more than GM and LM. Even the American cities in 2005 averaged some 7586 metres, though this is not necessarily an indication of service quality. The only cities where one could say the public transport line length per capita in GM and LM were similar were the Australian and Canadian cities in 2005 (2609 and 2496 m/1000 persons respectively). In summary, GM and LM are somewhat parsimoniously served by public transport.
4.2.2. Reserved Public Transport Route Length per 1000 Persons
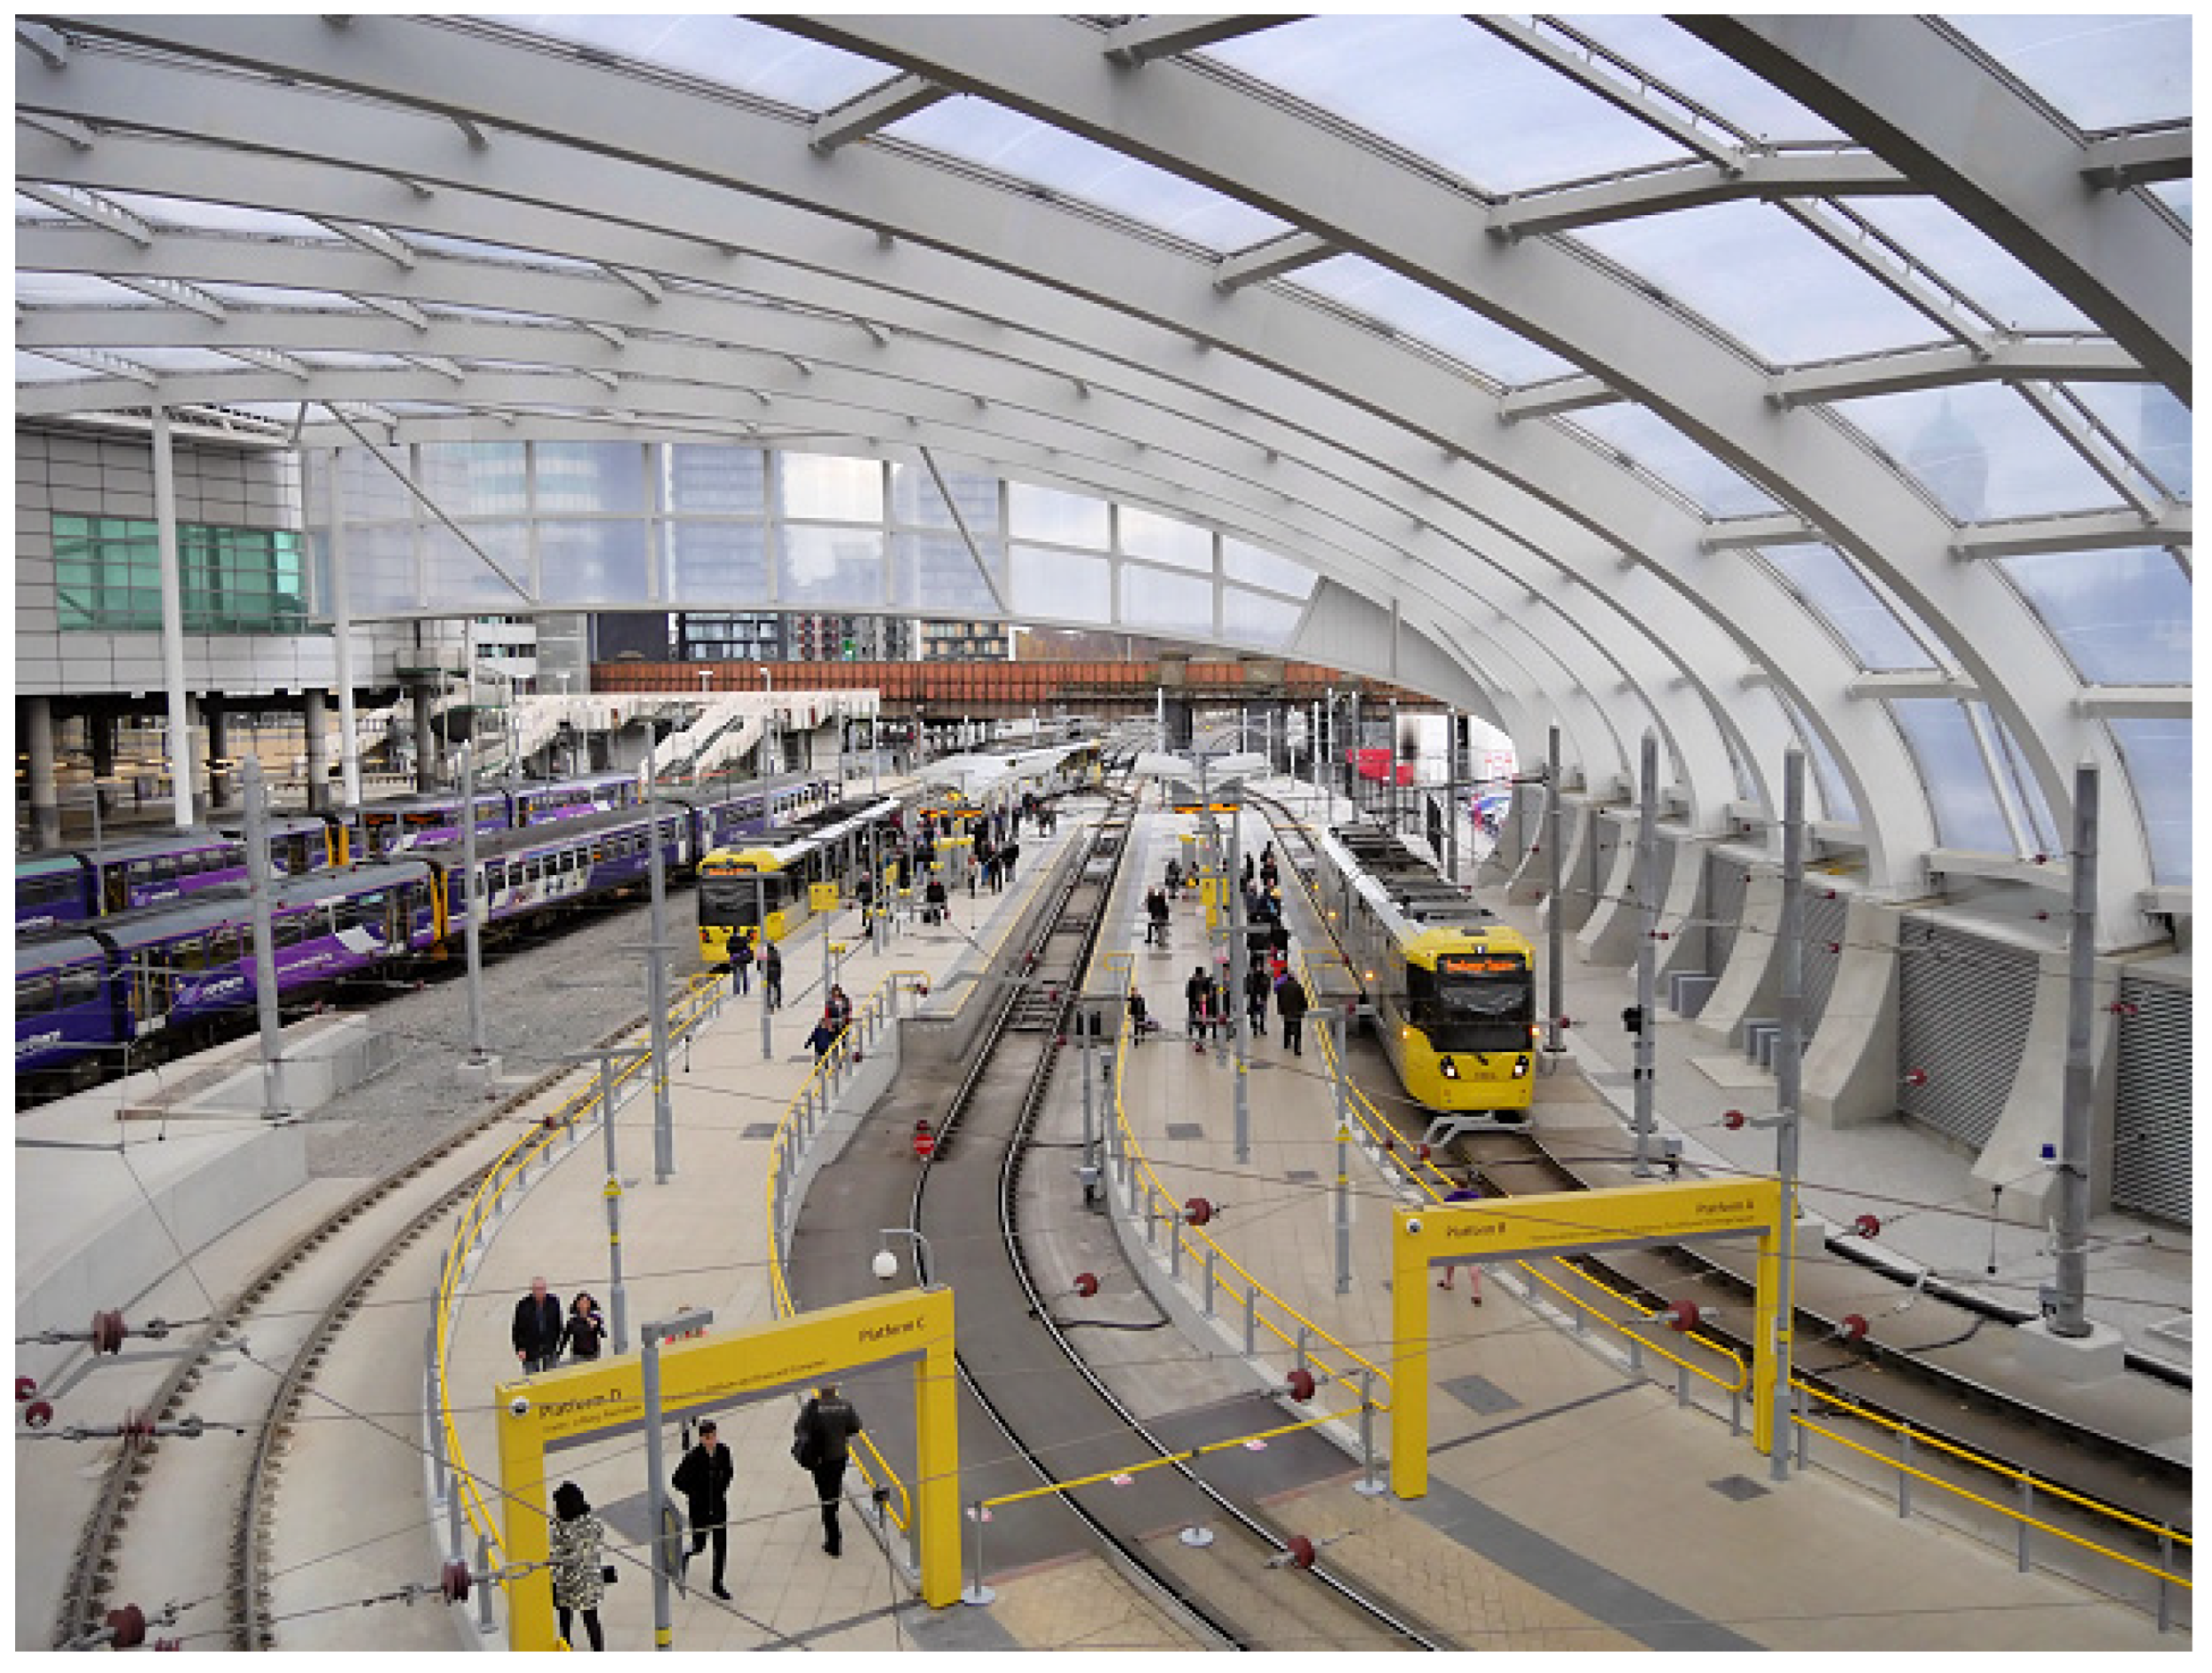
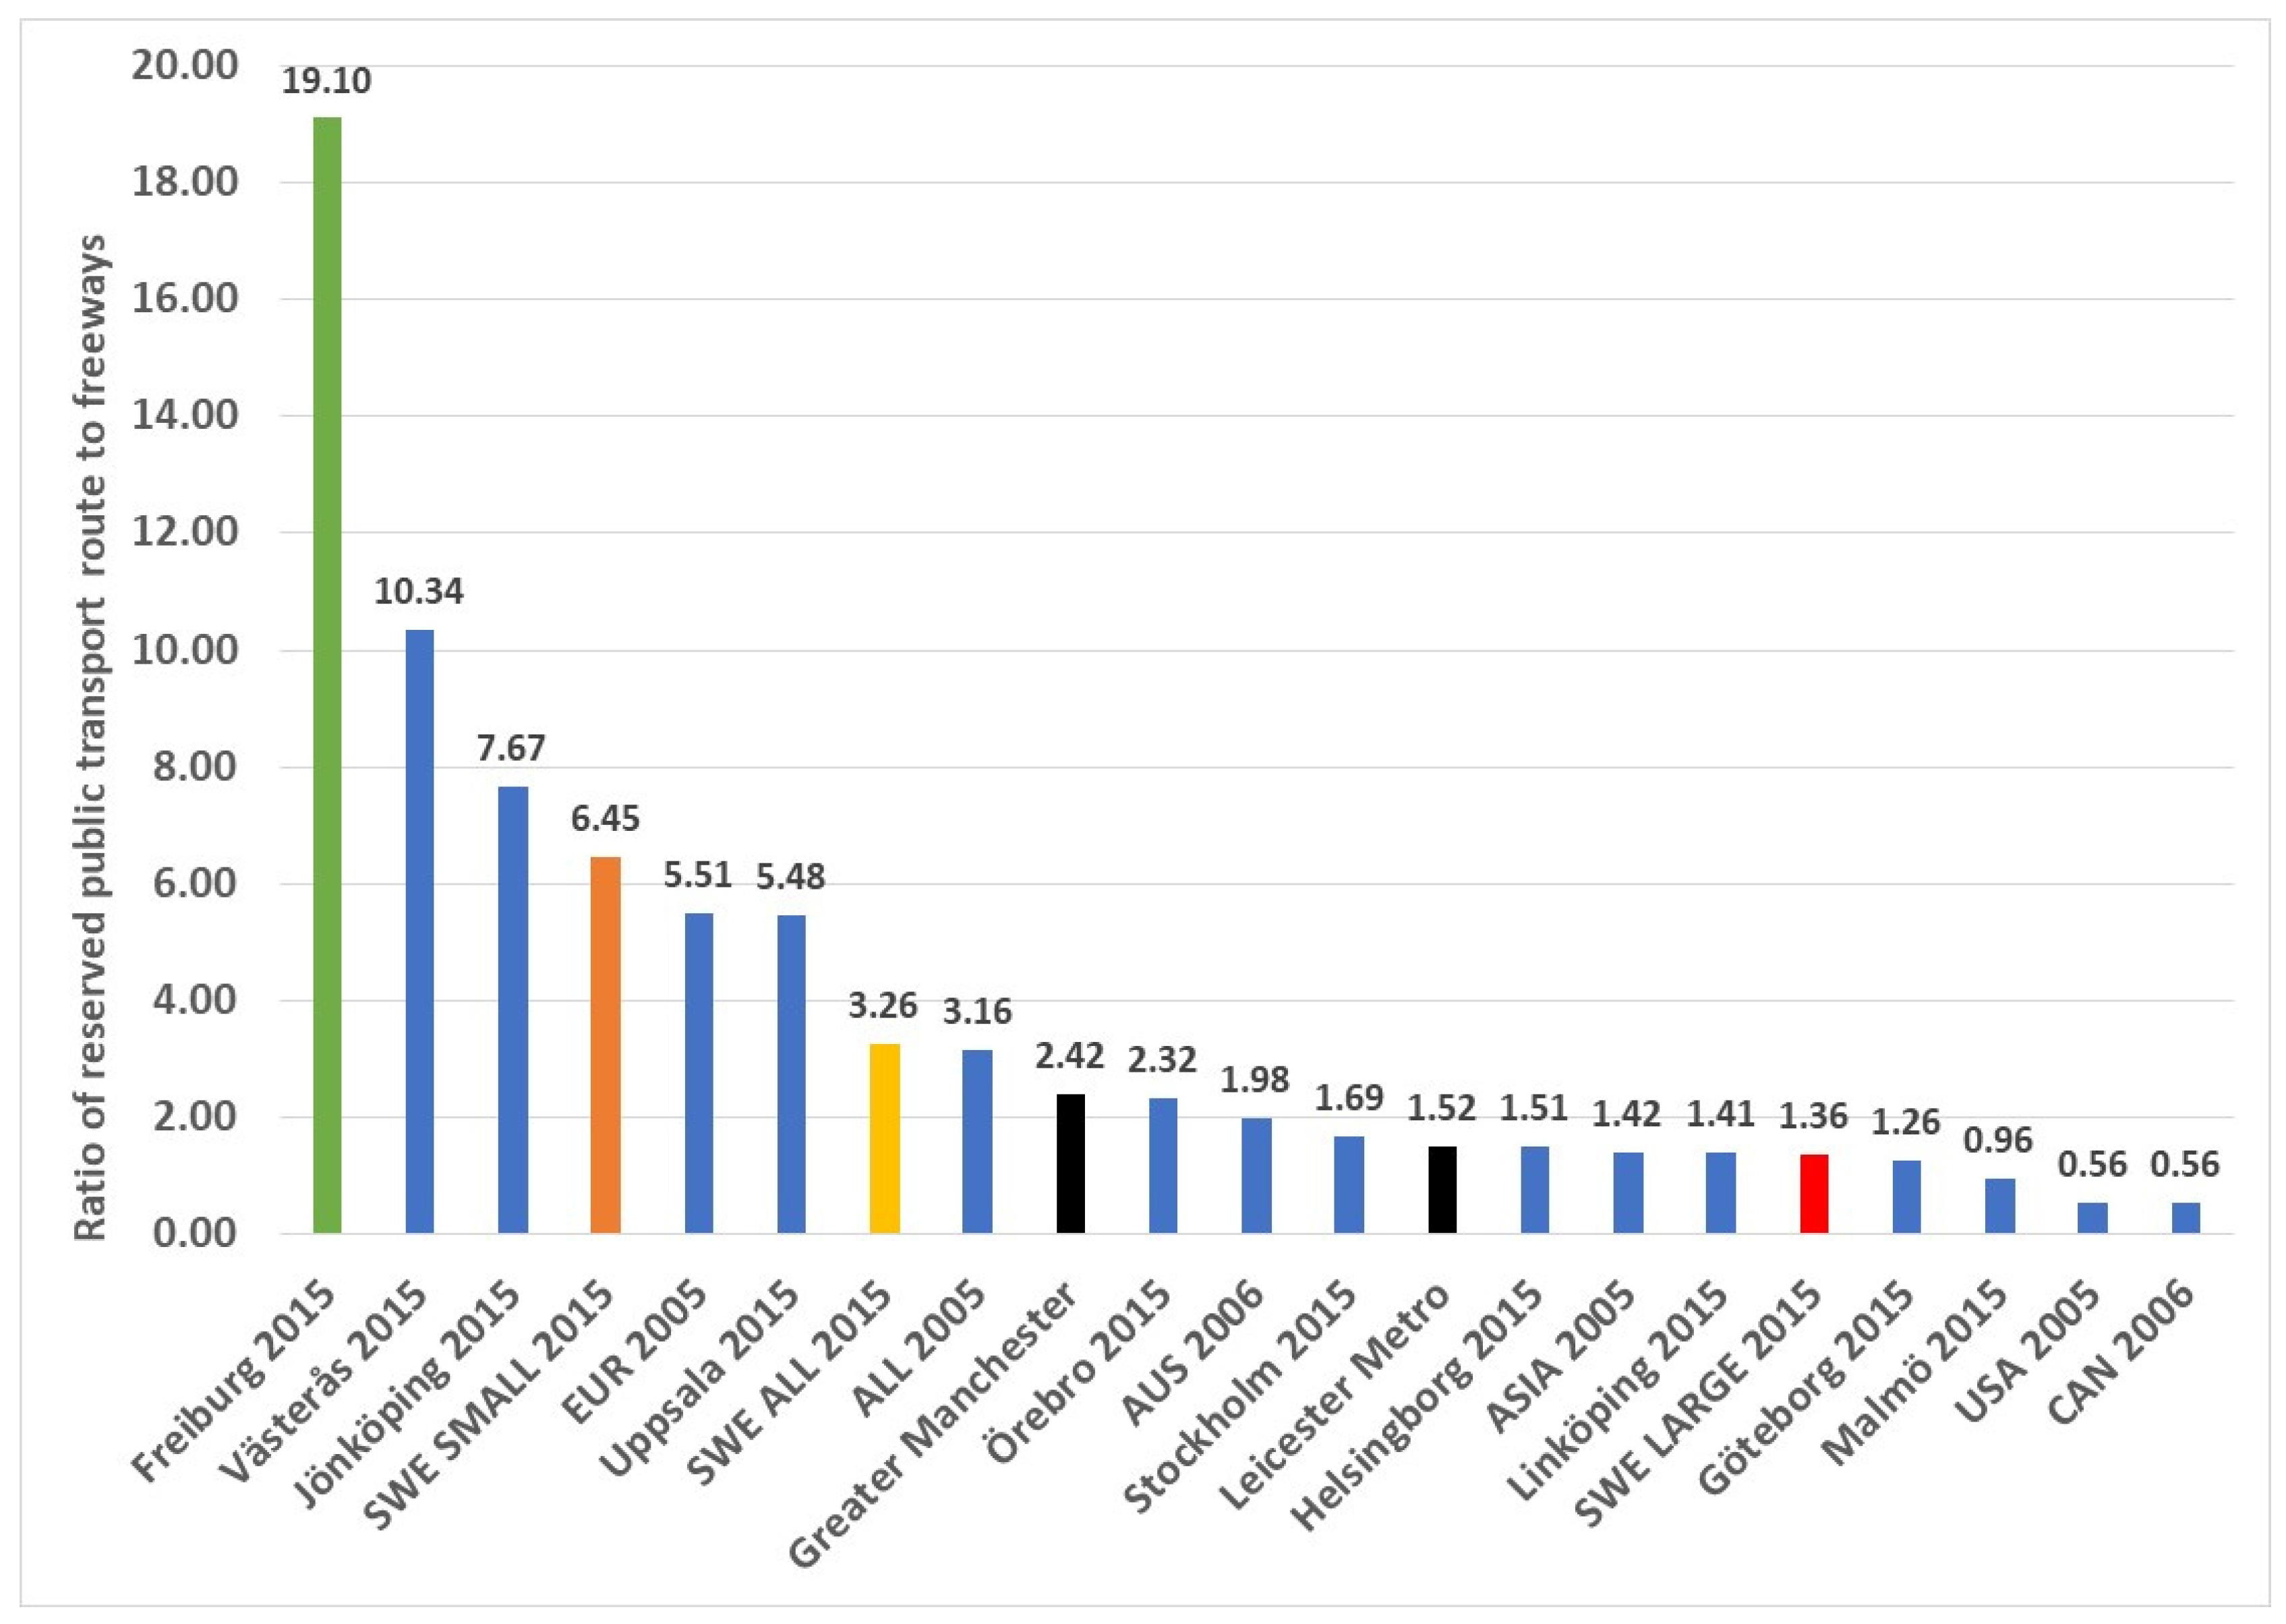
A more revealing item than public transport line length is the extent of reserved public transport routes (Figure A2). This is a public transport route that is fully protected from general traffic and therefore not subject to hold-ups due to congestion. It consists mainly of rail lines, some parts of tram/light rail transit (LRT) systems, where they have dedicated protected sections on roads (usually with barriers or kerbs of some kind) or are elevated, and of course busways painted on roads or physically segregated so general traffic cannot use them (except perhaps for taxis and emergency vehicles). The magnitude of this variable is one measure of the likely quality of public transport services because such routes offer speedier travel and more reliable timetables, and their services often can compete with the speed of cars, which are frequently stuck in parallel traffic jams or hampered by intersections. Figure 13 shows the integration of suburban and light rail in Manchester.
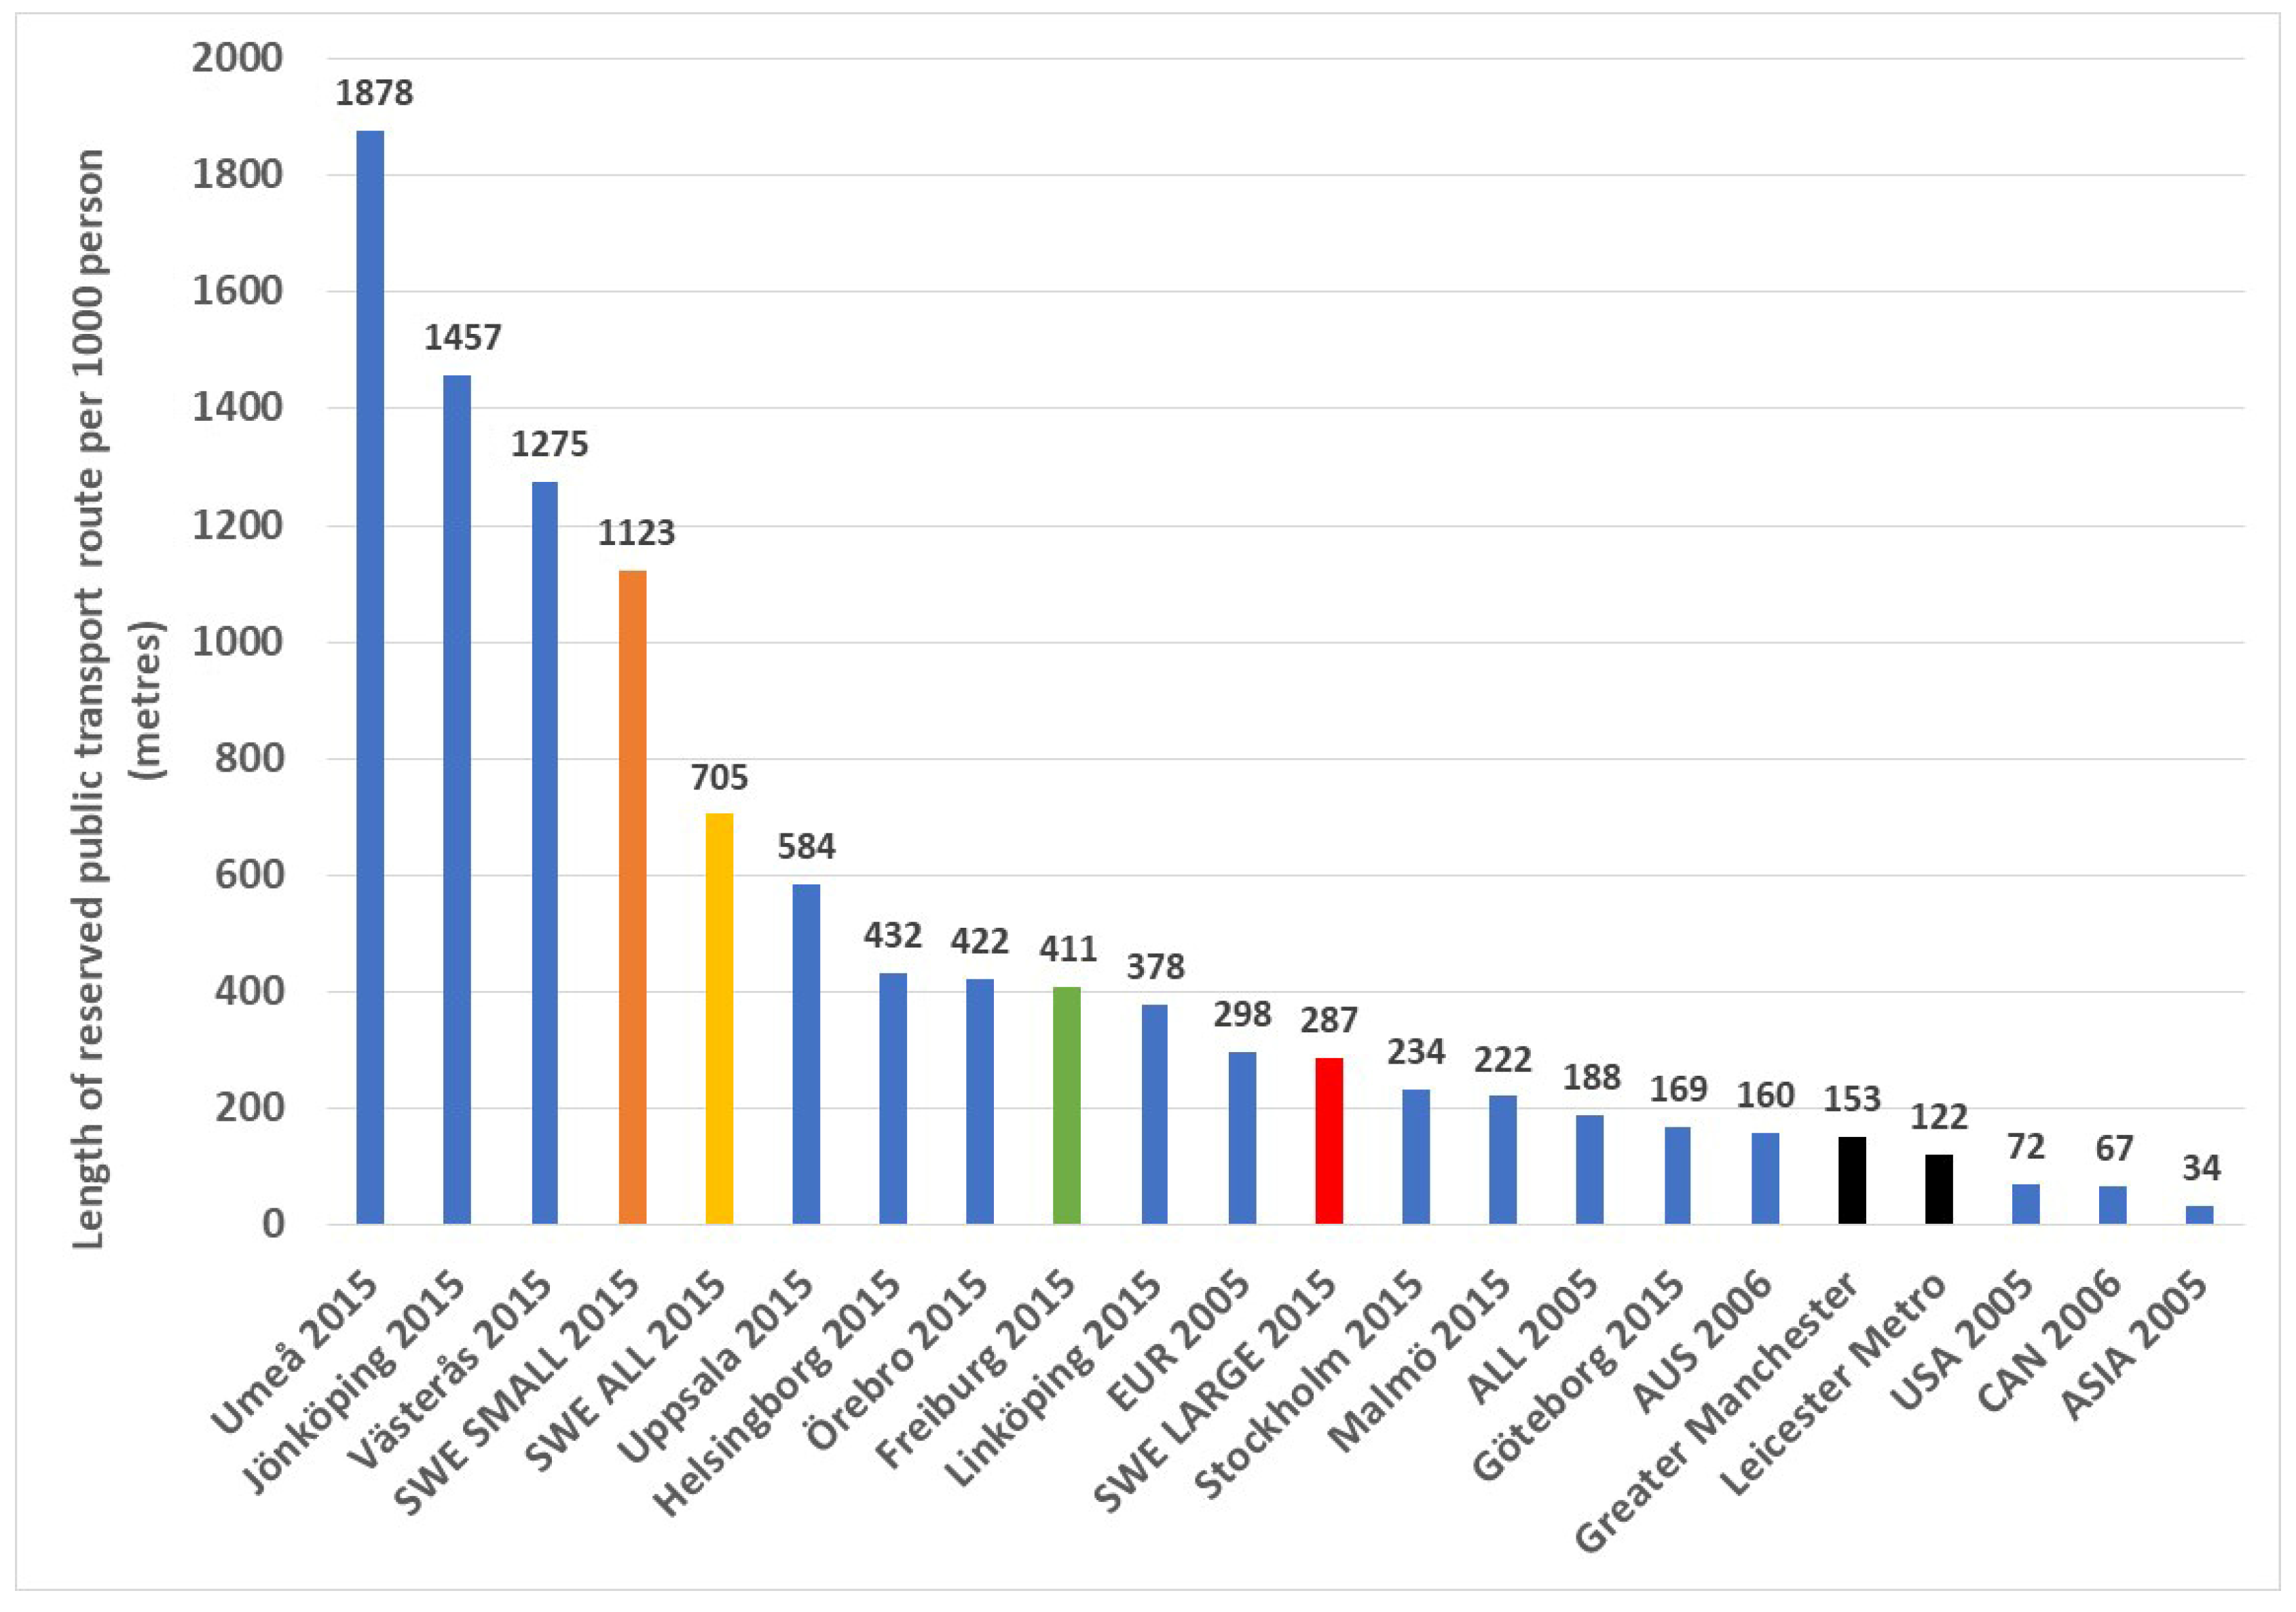
Figure A2 and Figure 14 show that GM and LM have only 153 and 122 metres of reserved route/1000 persons, which is the lowest of all, except for the Canadian and Asian cities. The former had in 2005 only 67 (this number will have increased because, for example, Vancouver has added a lot of new rail line since then). The Asian cities have also added rail lines since 2005. Even the American cities in 2005 had 693 m/1000 persons, five times more than GM and LM.
In particular, the data suggest that Swedish cities are very well-endowed with reserved public transport routes. The average for the ten Swedish cities of 705 m/1000 persons exceeded by a significant margin even that of other European cities (298 m/1000 persons in 2005), including Freiburg (411 m/1000 persons in 2015). The larger Swedish cities are more in line with Europe on this item, but the smaller cities are significantly higher. This is mainly achieved by extensive suburban rail systems that are needed to cover low density areas, and much less so by bus lanes. The exception is Göteborg, where bus lanes are more common and represent a higher proportion of the reserved routes than in the other Swedish cities, especially in the smaller less congested Swedish cities where bus lanes are rare.
The Swedish cities have comparatively low urban densities, but they are still extremely well endowed with rail systems that provide superior, speedy services for many trips and the vast bulk of reserved public transport routes in their cities. By contrast, GM and LM reveal an extreme paucity of reserved public transport routes.
A common factor across all the cities is the dominant role of suburban rail systems in providing protected rights-of-way for public transport and a scarcity of bus lanes in virtually every city in the survey. This suggests the political difficulty of removing road space for cars in favour of public transport on urban roadway systems. The argument often goes that removing lanes for buses reduces capacity and that any bus lane must be replaced by road widening. However, bus lanes increase the people-moving capacity of a road because of their much greater capacity to carry people, compared to the very common situation of single-occupancy cars in congested peak periods.
4.2.3. Public Transport Vehicle Fleet per Person
This variable represents the number of public transport vehicles that are available for service per 1000 persons in cities. A bus is counted as one vehicle, whereas rail wagons or carriages, rather than train sets, are used for rail modes. GM and LM have a comparatively high number of public transport vehicles available for use in their metro areas (1.61 and 1.94 vehicles/1000 persons respectively). By comparison, the Swedish cities in 2015 had 1.17/1000, which was also lower than the average in European cities in 2005 of 1.51 vehicles/1000 persons (close to the GM figure in 2016). Freiburg also had comparatively fewer public transport vehicles in 2015 with 0.83/1000, which may relate to the strong popularity of non-motorised modes.
Whilst the high number of public transport vehicles in GM and LM may appear to be positive, it also reveals an underlying problem. Figure A2 shows that 96% of the fleet is buses in GM, and in LM it is 99%, which is an extraordinarily high dominance of buses. In the Swedish cities, 76% of the total fleet were buses, and in the larger Swedish cities with more rail, only 63% of the fleet were buses. In the large European sample in 2005, only 51% of all public transport vehicles were buses.
Overall, the UK cities are disadvantaged in public transport by being extremely bus-based and lacking a sufficient rail-based structure to anchor public transport services and land uses.
4.2.4. Public Transport Vehicle Kilometres (VKT) of Service per Person
One measure of public transport service is the vehicle kilometres per person operated by each mode, where the rail measure is wagon kilometres, not train kilometres. The two UK cities are very weak in this factor (GM 47.9 km/person and LM 41.2 km/person). Only the US cities provided less (in 2005 only 39.2 km/person) and they are renowned for their poor public transport, but this was only 5% lower than in LM and 18% less than GM, a poor advertisement for both cities.
Conversely, Swedish cities (88.6 km/person) were significantly higher than GM and LM, while the European cities in 2005 provided 107.5 km/person, and even Freiburg in 2015, which is very non-motorised mode oriented, had 60.7 km/person in 2015. The American, Australian and Canadian cities averaged 50.0 km/person in 2005, which was still more than both GM and LM.
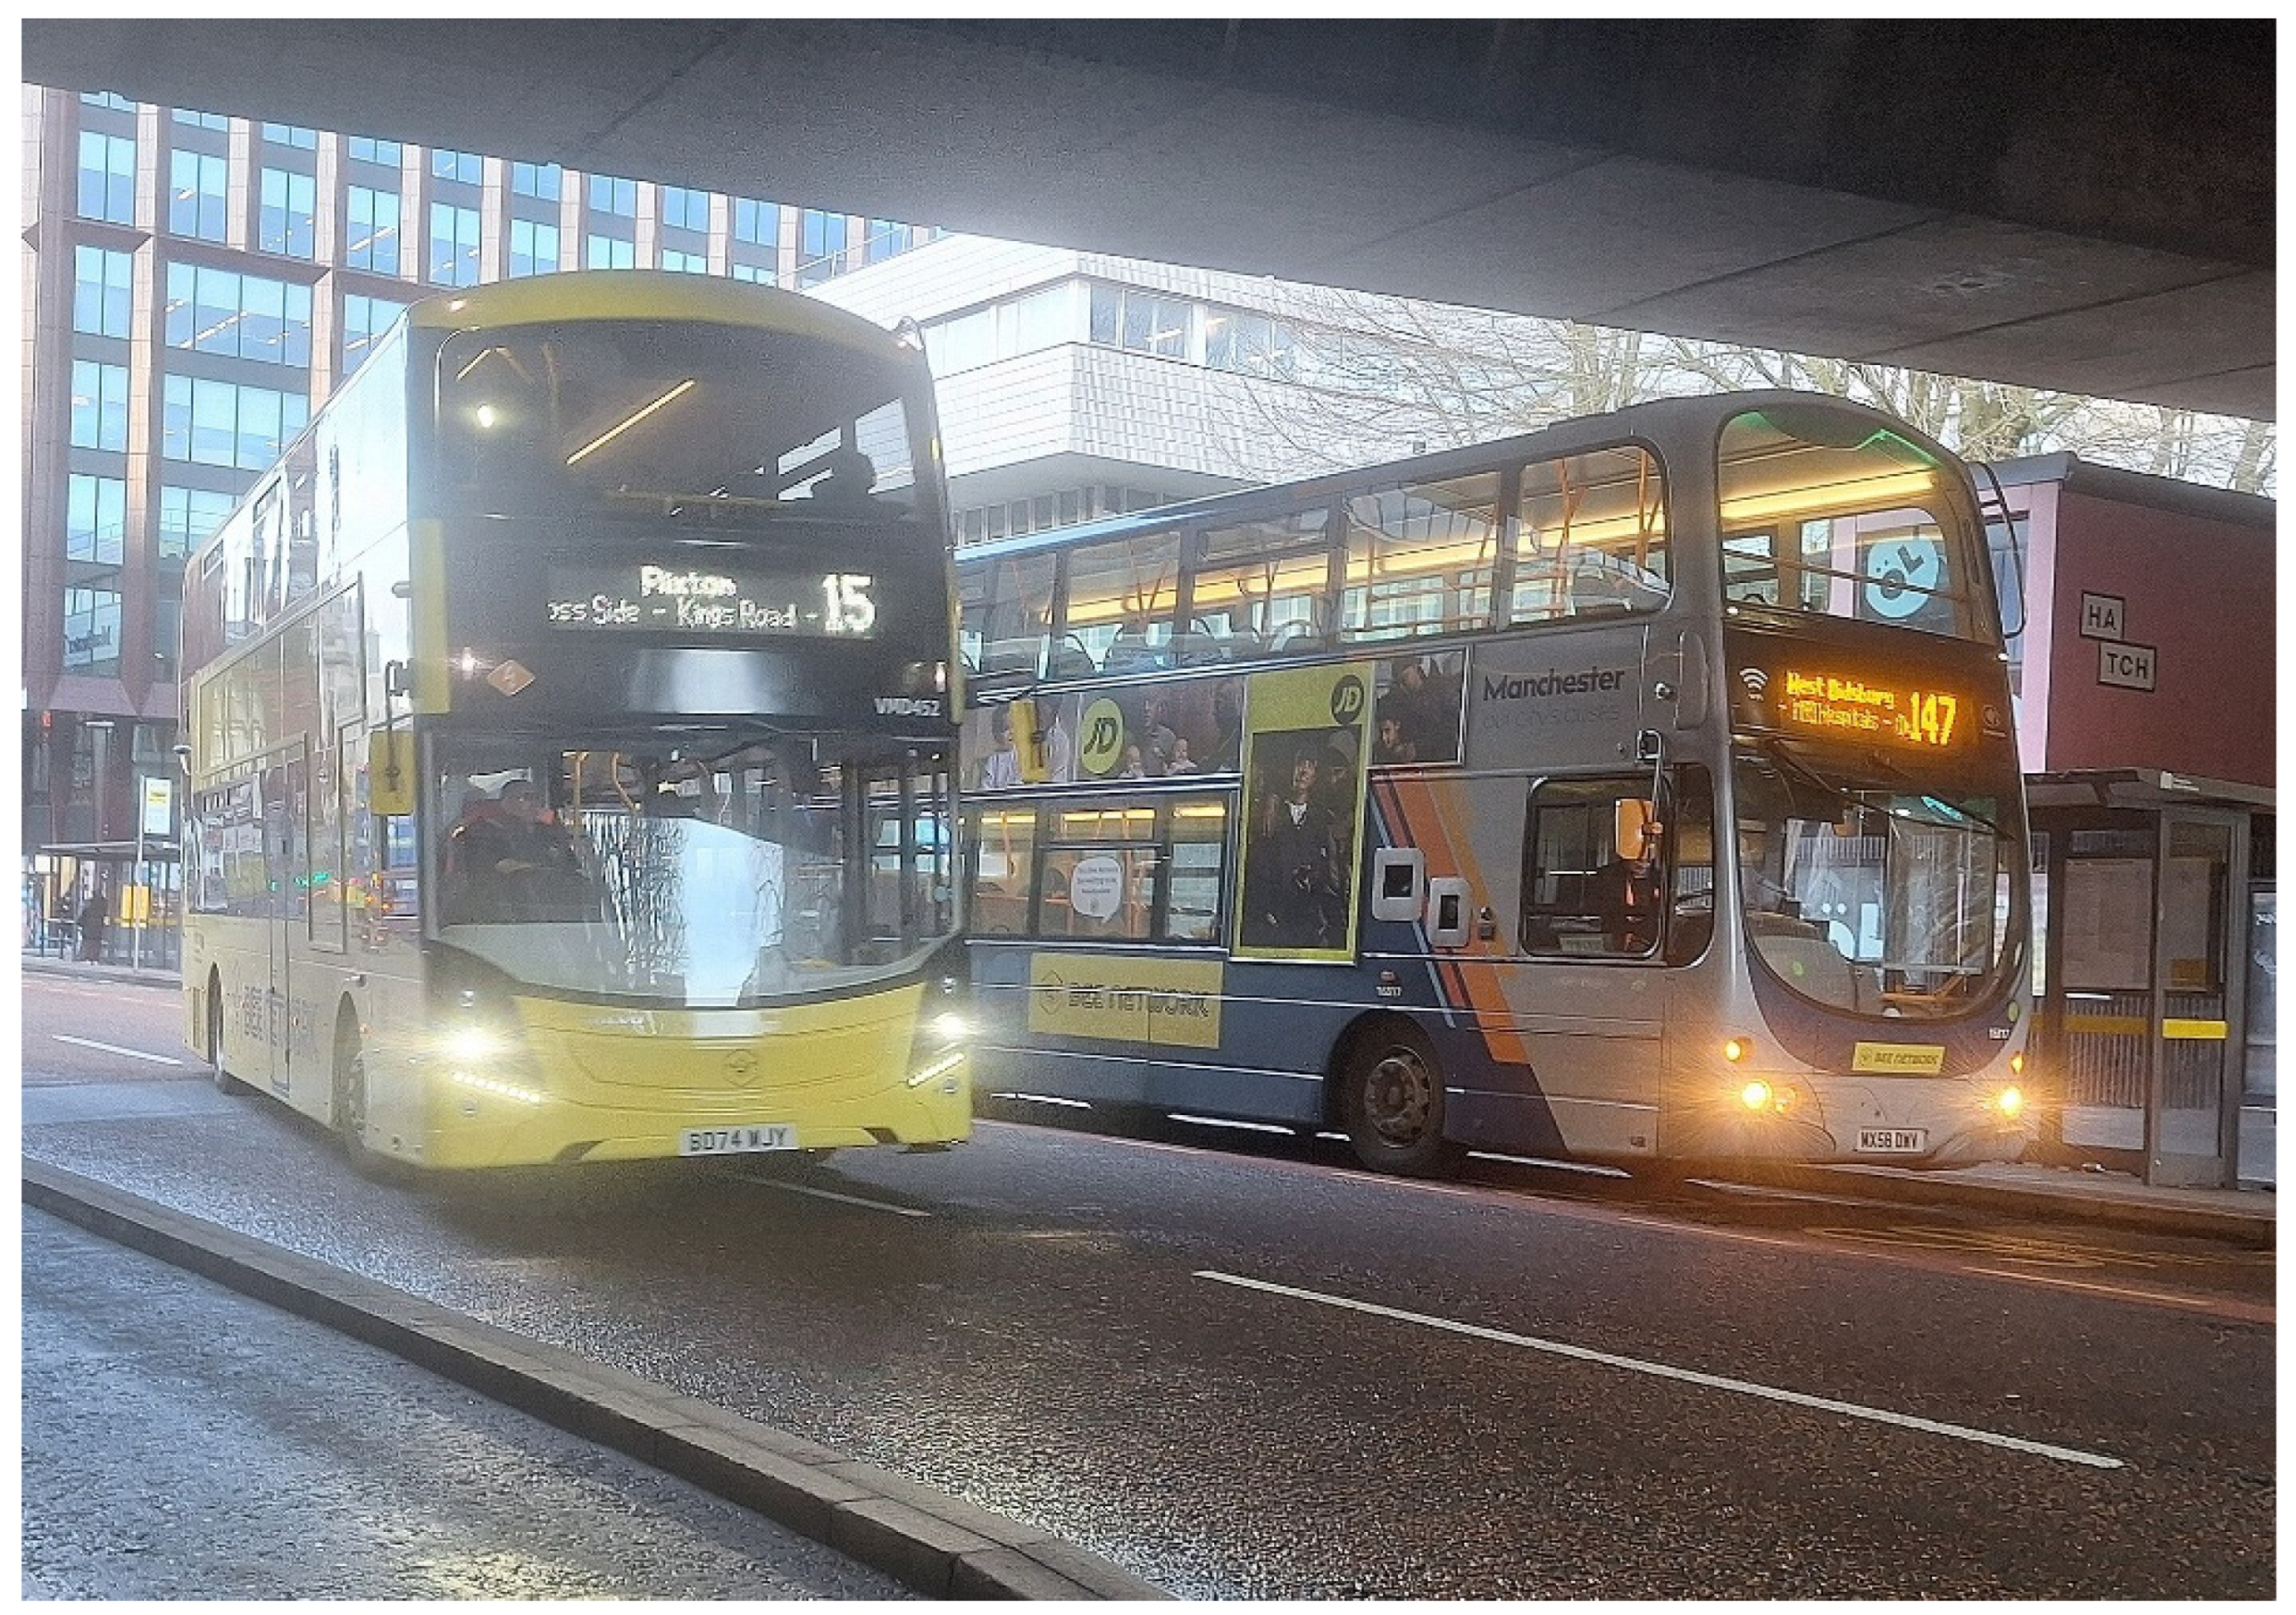
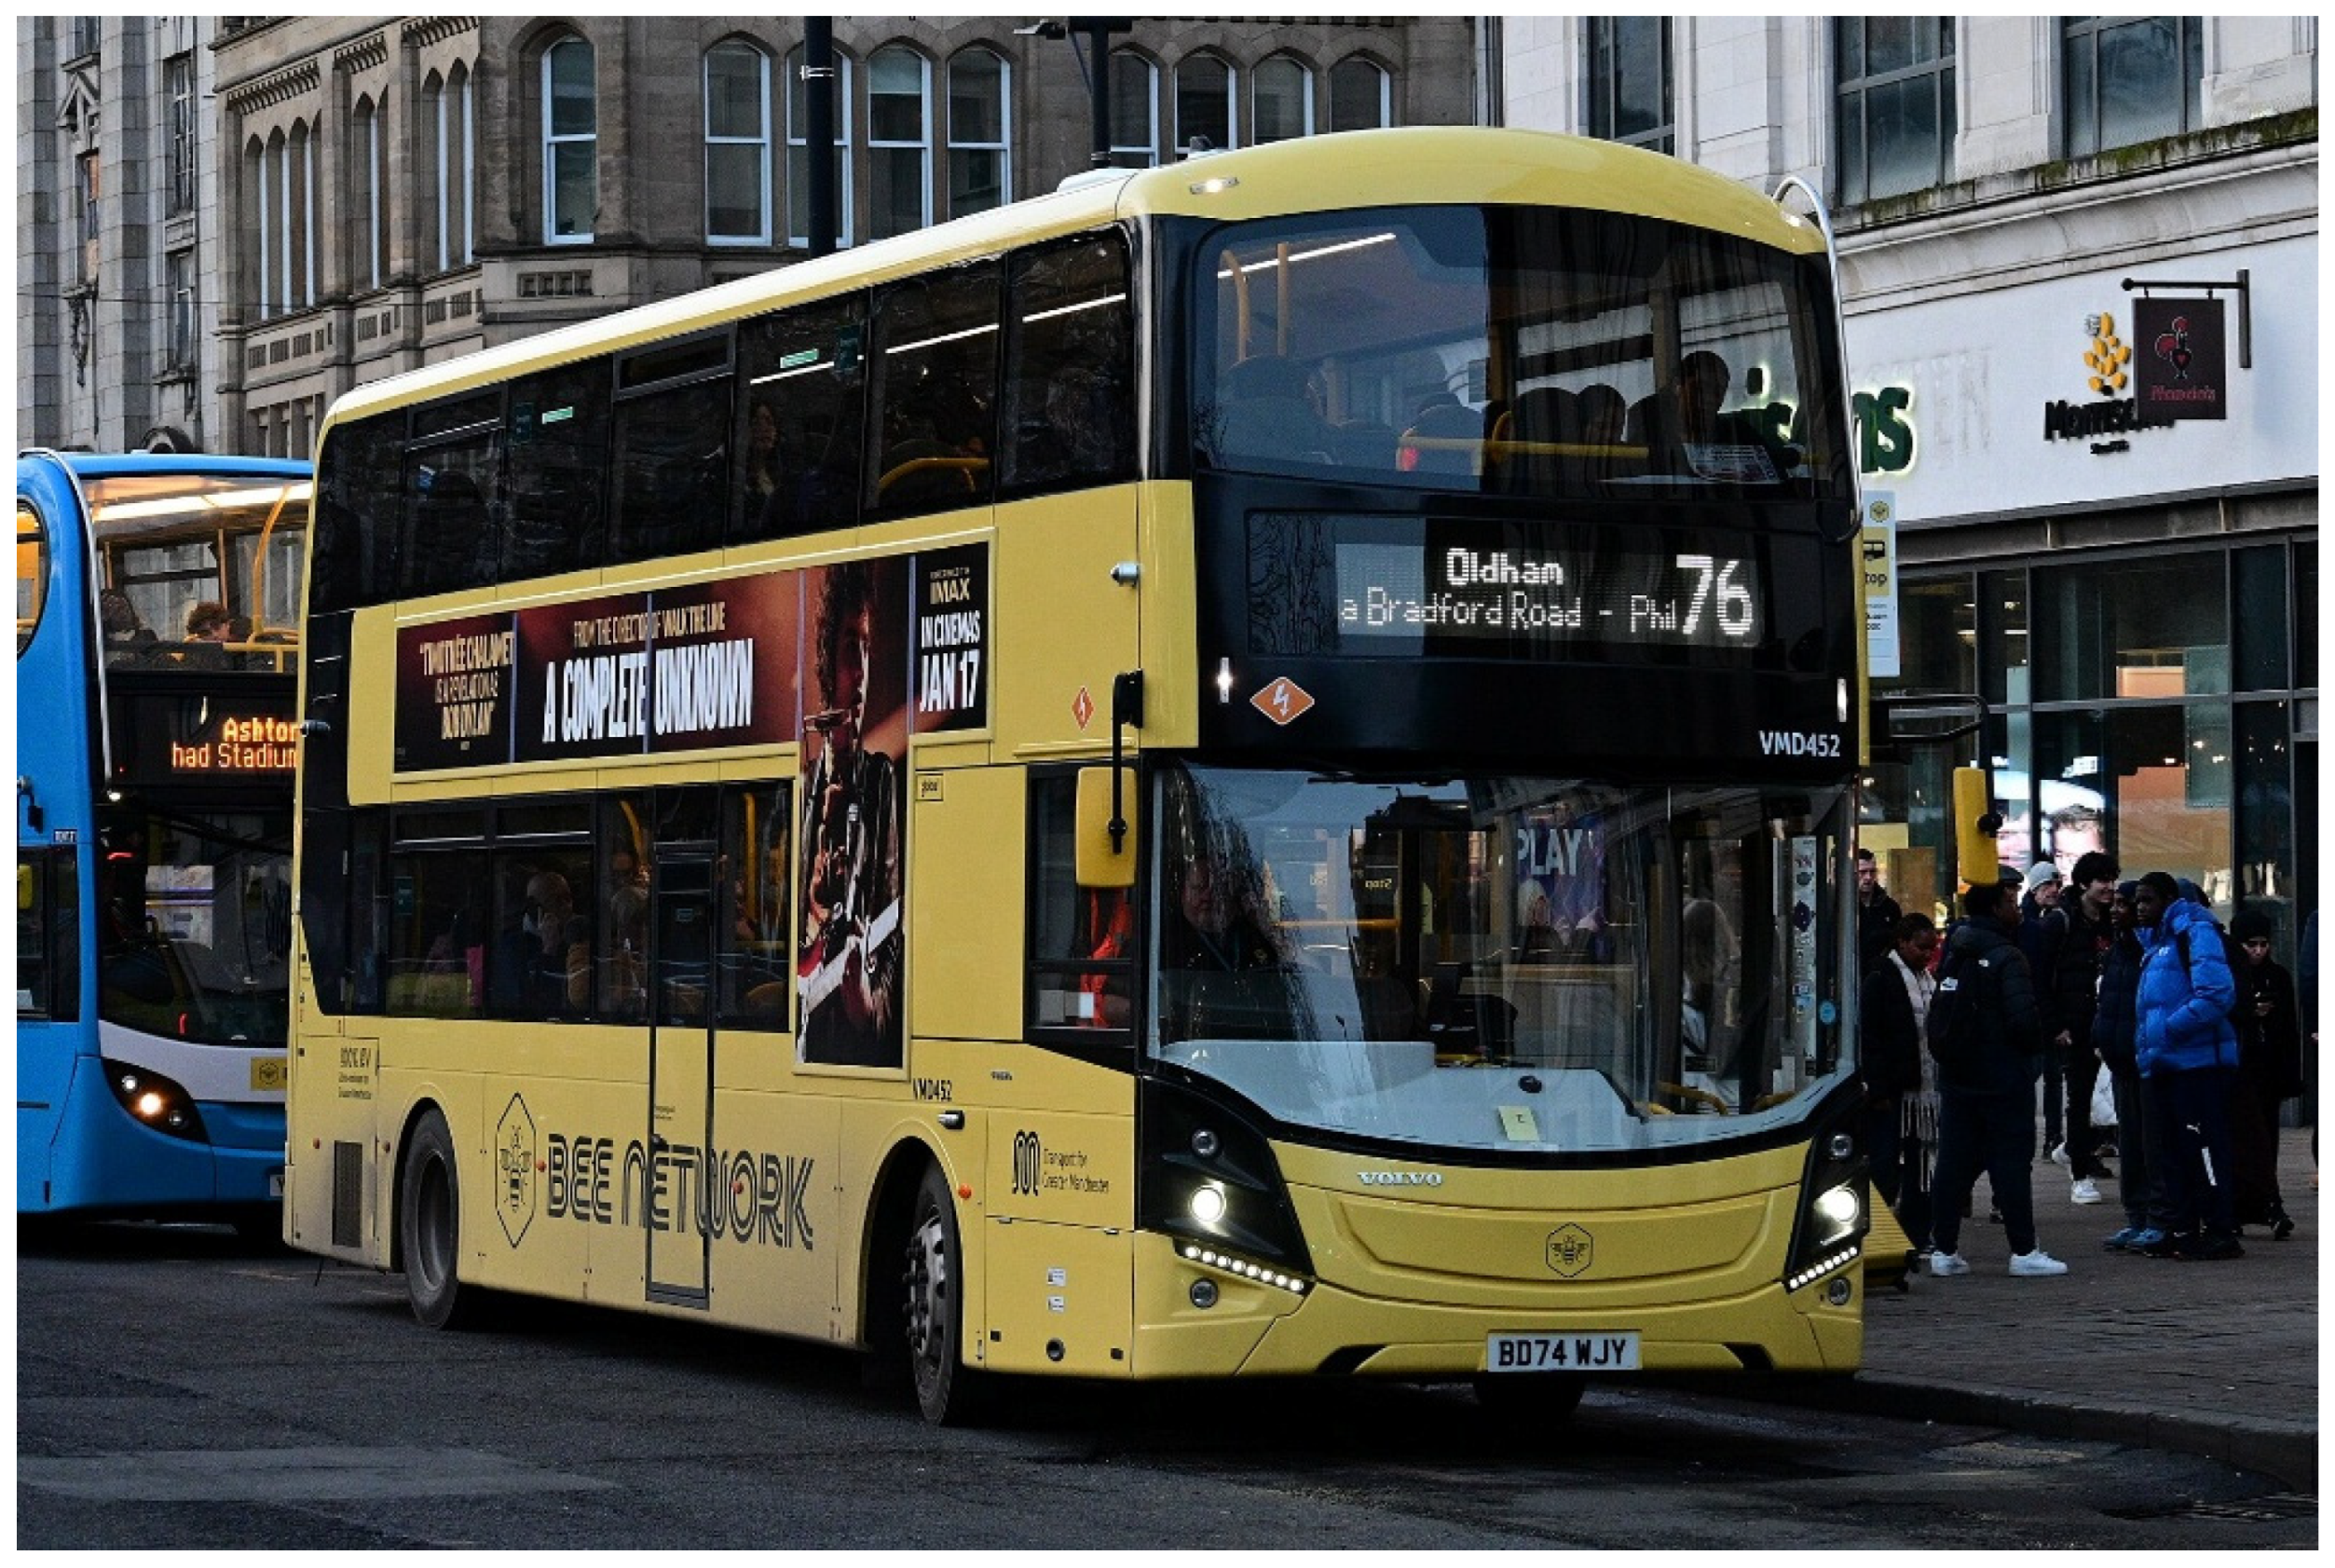
By developed world standards, GM and LM are poorly serviced with public transport. This is especially concerning given that they have urban densities that could certainly support a higher level of service with higher usage. Public transport service in both GM (Figure 15) and LM (Figure 16) is too dominated by buses, although many are double-deck and higher capacity.
Figure 15.
Most public transport service and use in GM is by bus, especially double-deck buses. Source: [77].
4.2.5. Public Transport Seat Kilometres (SKT) of Service per Person
Seat kilometres represent a better measure of the capacity of public transport services by incorporating the size of each vehicle as specified by seating capacity. GM and LM perform a little better on this factor because of the prevalence of larger double-deck buses with more seats than standard buses. GM had a total of 3317 SKT/person while LM has 2444 in 2016 (Figure A2 and Figure 17). In this case, both the US and the Canadian cities averages are inferior (1874 and 2368 SKT/person), but LM is very close to the Canadian average in 2005.
However, Swedish cities again distinguish themselves well. Their average level of 5720 SKT/person is much larger than in the UK cities and even the smaller Swedish cities averaged 4546 SKT/person in 2015. Freiburg in 2015 (3957 SKT/person) and European cities in 2005 (6126 SKT/person) are also very much higher in seat kilometres than either GM or LM. By this measure, the two UK cities again reflect a low level of public transport service.
4.2.6. Average Public Transport System Speed
Figure A2 reveals that the two UK cities have public transport system average speeds that are mixed in their performance compared to other cities (GM 29.2 km/h and LM 27.9 km/h). For example, Freiburg’s public transport system averaged 32.1 km/h in 2015. In particular, the ten Swedish cities have very healthy average public transport speeds (the overall speed of the entire public transport system is weighted by the passenger hours for each mode). At 39.2 km/h, the Swedish cities have the highest public transport speeds of all cities, ahead of the next highest, the Australian cities, which averaged 33.0 km/h. The global average was only 25.1 km/h in 2005 and the European cities were slightly better at 29.8 km/h, or only a little better than GM. In the smaller Swedish cities, the overall average speed was even higher (42.2 km/h), while the larger Swedish cities had 36.3 km/h.
The Swedish cities achieve these high average speeds predominantly because of the high average speed of the suburban/regional rail trains (80.5 km/h). These operate over long distances, with significantly higher speeds than the suburban rail systems in other cities (51.7 km/h globally), which mostly operate over smaller distances. LM, which averaged 89.2 km/h, is close to the Swedish cities.
Swedish urban bus systems also have the highest speed in the global sample, averaging 30.3 km/h, which is very competitive when compared to all other groups of cities. The global average for urban buses was only 21.5 km/h, and the European cities only 21.9 km/h. With GM at 23.4 km/h and LM at 24.5 km/h, their urban bus speeds are neither the worst, but also far from the best. Freiburg, for example, had an average bus speed of 26.1 km/h.
4.3. Public Transport Use
This section examines public transport usage factors expressed as annual per capita boardings and passenger kilometres (PKT) of travel. The first variable considers only how many “unlinked trips” are made (i.e., every time a passenger enters a public transport vehicle) and the second variable considers how far passengers travel, which can then be compared to car travel (see later). From these data, one can also calculate the average occupancy of public transport vehicles (number of passengers per vehicle) and the seat occupancy, which measures the annual average percentage of the seats that are occupied compared to what are offered. Figure A3 contains these data.
4.3.1. Annual Public Transport Boardings per Person
GM is unremarkable in its public transport use with a meagre 100 annual boardings/person, while LM has a very poor usage of 45 boardings/person. The latter is significantly below the highly automobile dependent American cities in 2005 (67 boardings/person), which places LM in the highly automobile-dependent category on this factor. GM avoids that label by being significantly better than US cities and a fraction better than Australian cities (both in 2005). However, this is where positive interpretations end. Even the Canadian cities registered 151 boardings/person in 2005, with the European cities showing 386 boardings/person, and cities averaged 254 boardings/person globally.
The parlous state of public transport in these UK cities is highlighted by data from 2015 in the Swedish cities, which average 117 boardings/person. The larger cities reach significantly higher levels of use (average 172 boardings/person), with Stockholm being a major contributor, but the smaller cities average only 61 boardings/person, or less than the average for the two UK cities (72 boardings/person). Freiburg, which is highly oriented to walking and cycling, had 192 boardings/person in 2015, again eclipsing the UK cities.
The data in Figure A3 also highlight how bus-oriented the UK cities are with 74% of boardings in GM being by bus and 89% in LM. On the contrary, European cities in 2005 had only 38% of boardings by bus, and even Freiburg in 2015 had only 25% of its boardings by bus and the rest by rail. Figure 18 shows the total rail boardings per person in all the cities, highlighting the very poor situation of GM and LM. The Swedish cities were more bus-oriented than other European cities with 66% of boardings by bus, but still significantly below that of the UK cities. The UK cities’ low rail use puts them at a significant disadvantage compared to cities with stronger rail systems and a greater proportion of the overall public transport task on rail [59,60].
Stockholm, for example, has developed at significantly higher densities with mixed land uses around many rail stations on the “tunnelbana” (metro) network throughout the region, thus supporting the use of rail [4,49]. Stockholm’s expanding tram/light rail lines are also in areas of high density. Thus, even though the Stockholm region has a lower density than LM, it has significant areas of high-density transit-oriented development (TOD).
4.3.2. Public Transport Passenger Kilometres per Person
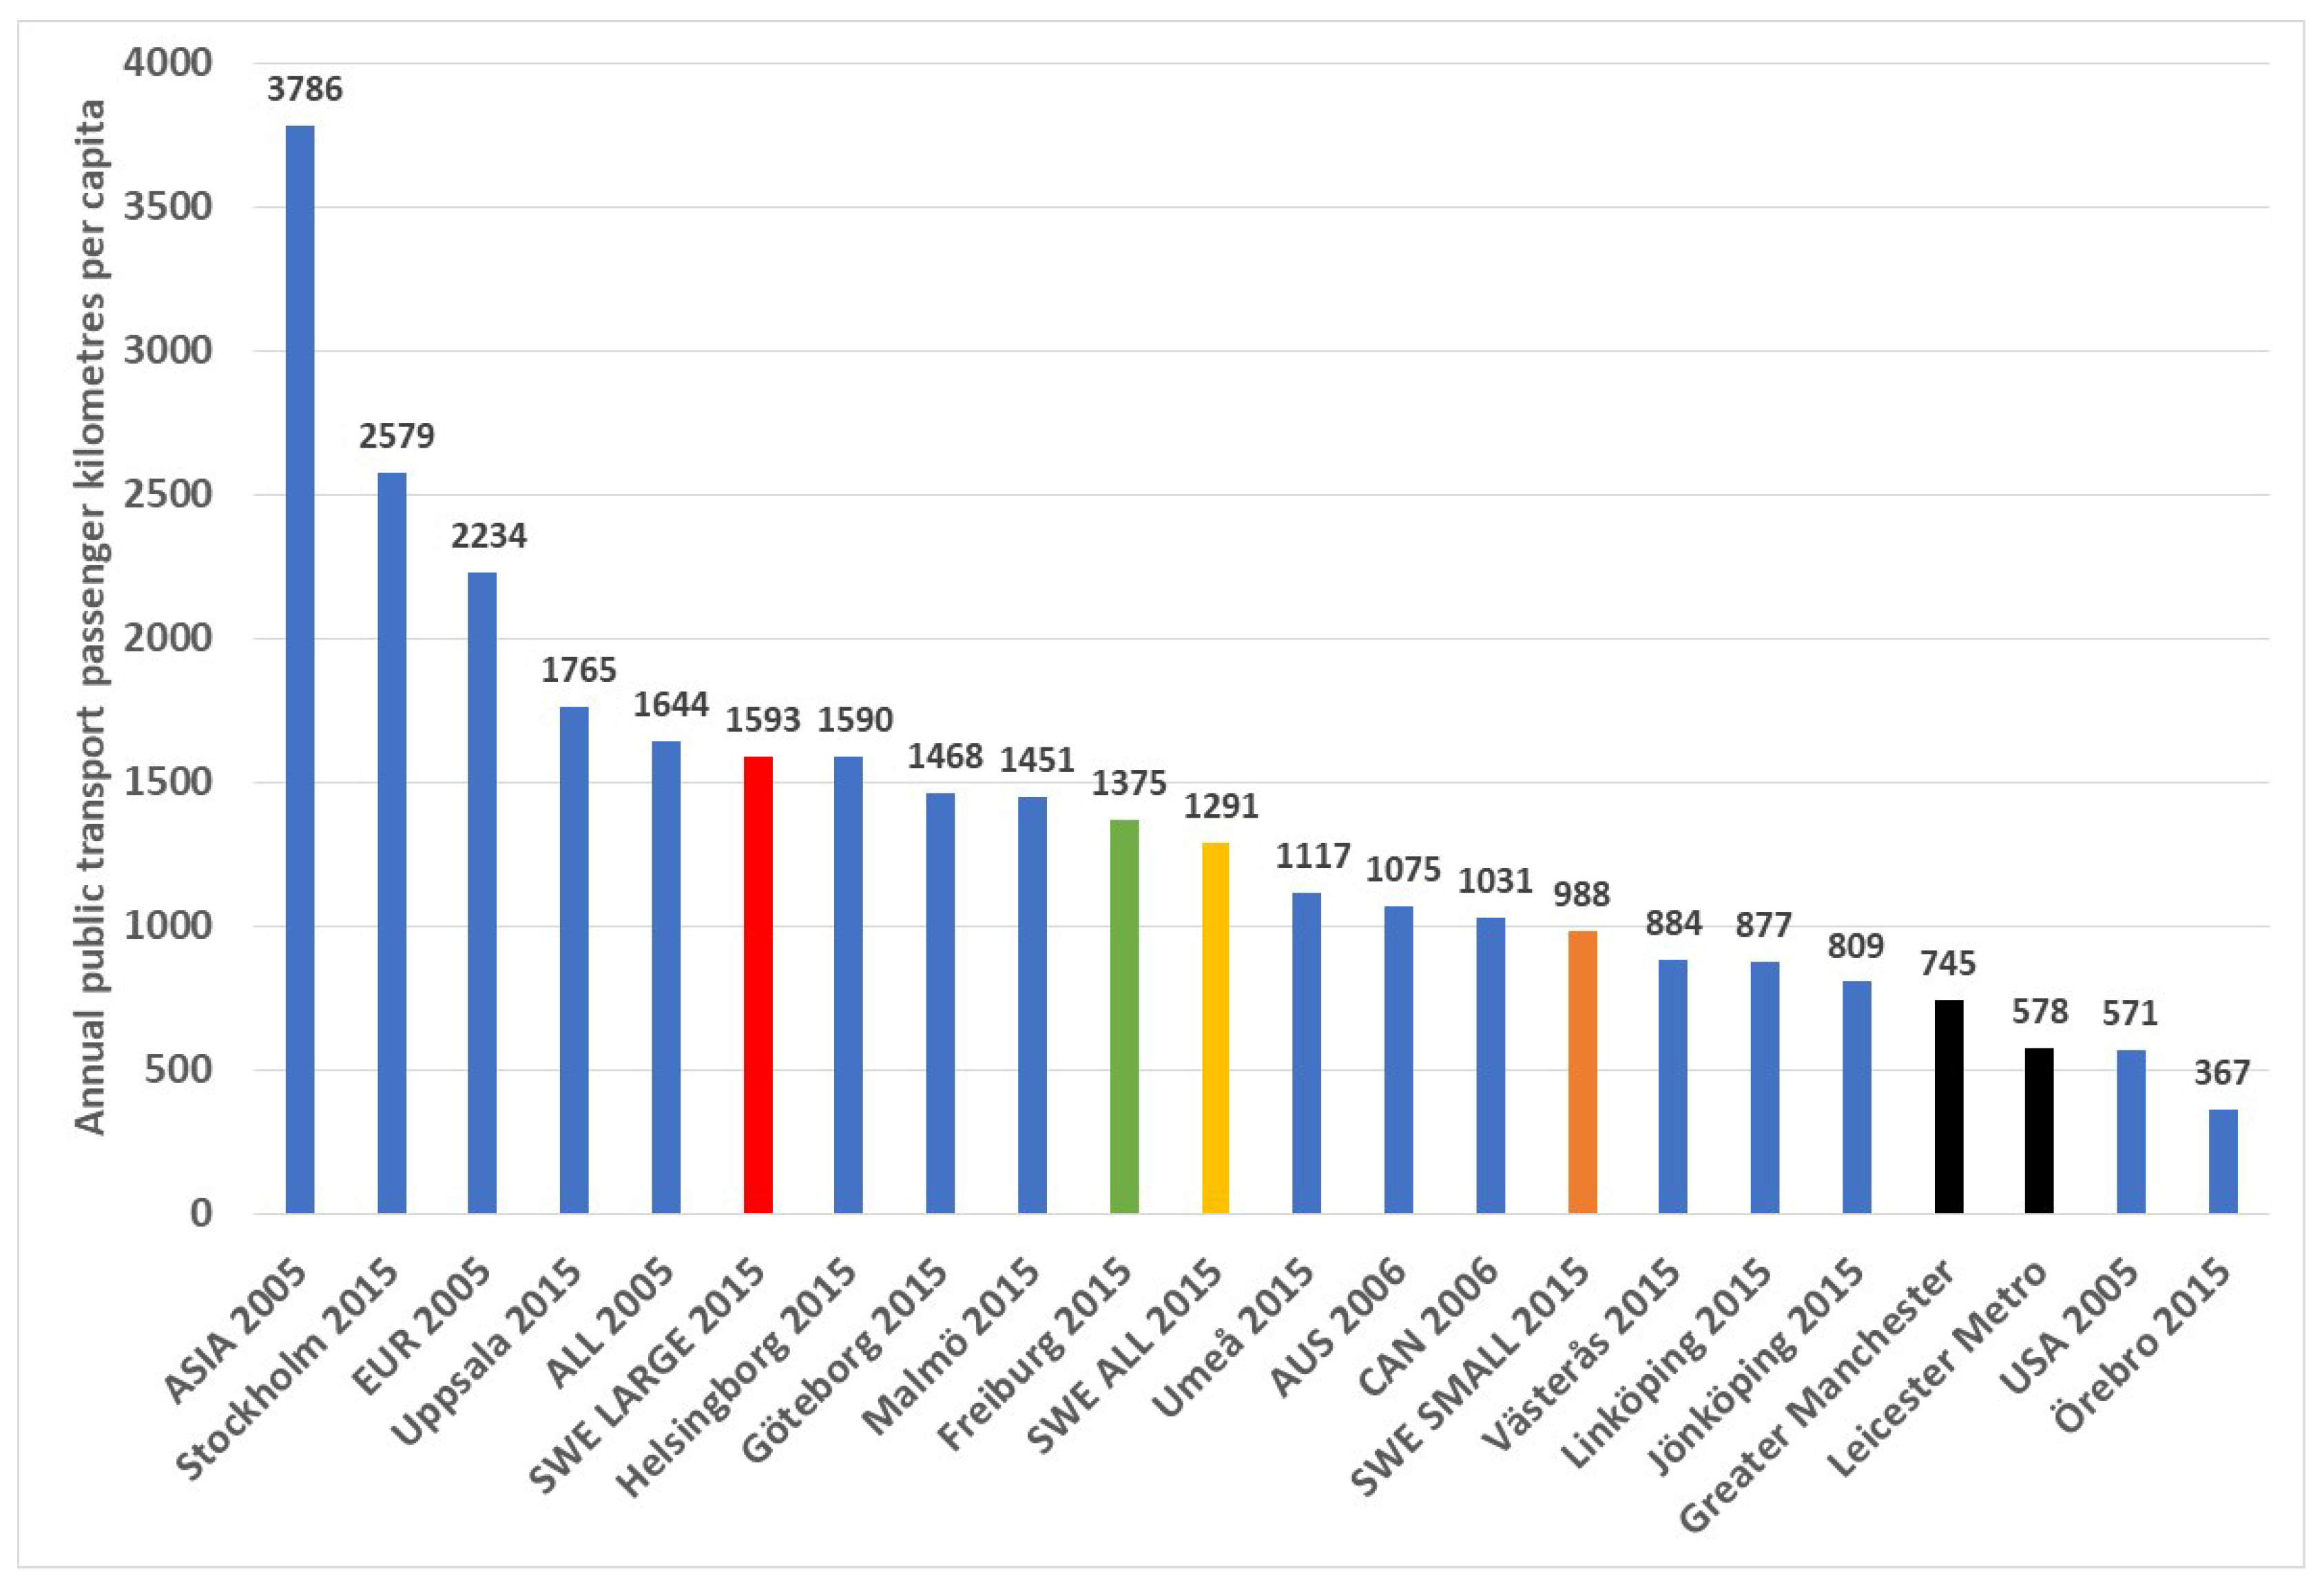
The poor state of public transport use in the two UK cities is further accentuated by the low PKT/person with GM totalling a meagre 745/person and LM even lower at 578/person, with an average of 661/person. Nowhere in the global cities data is this worse except in the American cities, which in 2005 averaged only 571 passenger km/person, and Örebro in Sweden (Figure A3 and Figure 19).
By contrast, the Swedish cities in 2015 averaged 1291 and the European cities in 2005 averaged 2234 public transport PKT/person. Even the Australian and Canadian cities in 2005 were very much higher than the two UK cities on this factor (1075 and 1031 PKT/person respectively). Even Freiburg, with its non-motorised mode orientation, had 1375 public transport PKT/person in 2015, double that of the two UK cities.
An important contributing factor to this is not just the poor number of boardings, but the dominance again of buses in these UK cities, because buses always have a significantly lower average distance travelled per boarding. This is the case in LM, and a little less so in GM where the city at least has a light rail system to supplement its suburban rail offer. Poor public transport use, especially rail in both GM and LM, is a major problem for both metropolitan areas and one that requires urgent policy attention.
4.3.3. Public Transport Vehicle Occupancy
It is important to understand the intensity of public transport usage in relation to the service provided. One way of doing this is to examine the average vehicle occupancy. Figure A3 shows that vehicle occupancy has mixed results in the two UK cities. GM has an overall annual average of 15.5 people/vehicle, while LM is a little less at 14.0 (average of 14.7 people/vehicle). Both UK cities are higher than the small Swedish cities in 2015 (12.1 people/vehicle) as well as the US cities in 2005 (13.1 people/vehicle). On average the two UK cities are also only 3% less in average vehicle occupancy than the ten Swedish cities in 2015. The UK cities are therefore within a range that is experienced in other cities around the world. It is important to remember, however, that part of the reason why the Swedish cities have relatively low vehicle occupancy is explained by the very high levels of service they provide, while the US cities’ result is caused by both poor levels of service and poor usage.
Looking more widely at the UK cities, we see that they are eclipsed in all other comparisons. Freiburg in 2015 achieved 22.6 people/vehicle, while the European cities in 2005 had 21.0 people/vehicle. The global samples as a whole in 2005 was 19.0 people/vehicle and even the Australian and Canadian cities achieved better in 2005 (18.1 and 19.8 people/vehicle).
When considering the modal results, we also can see that in both GM and LM, the rail modes achieve much better vehicle occupancy. GM’s light rail system had 31.3 people/vehicle and the suburban rail had 34.4 people/vehicle. This is in contrast to the 10.5 people/vehicle in buses. In LM, buses had 13.5 people/vehicle while the suburban rail had 17.3 people/vehicle.
This suggests some important policy implications which are pursued further later. Firstly, the bus services provided in GM and LM need to be made more attractive. This could be achieved through generic means, such as having more reserved route (bus lanes) to make buses faster and more reliable, as well as giving buses full green-light priority at intersections. Of course, other factors could also be addressed across the board such as more attractive, integrated fare systems, better waiting environments at bus stops with more facilities and especially reliable real-time passenger information services. Vehicle fleets could be more modern, better maintained and cleaner.
For rail, with its already superior occupancy, both UK metro areas should develop more rail-based public transport to structure and anchor the system. This would help to ensure more usage, not only in the peak direction, but also the off-peak due to back-loading of passengers wanting to gain access to amenities in sub-centres on the rail lines.
4.3.4. Public Transport Seat Occupancy
Seat occupancy, provides another insight into the intensity of public transport use. The results are similar to vehicle occupancy with GM and LM having on average 22% and 24% of seats occupied on an annual basis. In this case, LM is a little better than GM. This result is very similar to the Swedish cities, with the larger cities having 25%, the smaller cities 22% and an overall average of 24%.
Again, this is where favourable comparisons end, with Freiburg, for example, having 35% seat occupancy, the European cities in 2005 achieving 39%, Canadian cities 44% and even the US and Australian cities having 29% and 27%, respectively in 2005, while the global average in 2005 was 37%, much higher than either GM or LM.
In policy terms, public transport services in GM and LM, need to be more extensive, more attractive and much better integrated with higher-density, mixed-land uses to ensure higher usage.
4.4. Car and Motorcycle Use and Modal Split
This section examines the modal share between private, public and non-motorised modes based on all the daily trips made by people in each of the cities. It also presents car and motorcycle use in each city through annual VKT and PKT per person by these two modes. The first measures the per capita distance that the vehicles themselves travel and the latter measures how far the occupants of the vehicles travel each year. PKT is more useful because it can be compared with public transport PKT. Figure A4 contains the results.
4.4.1. Non-Motorised Modes Modal Share
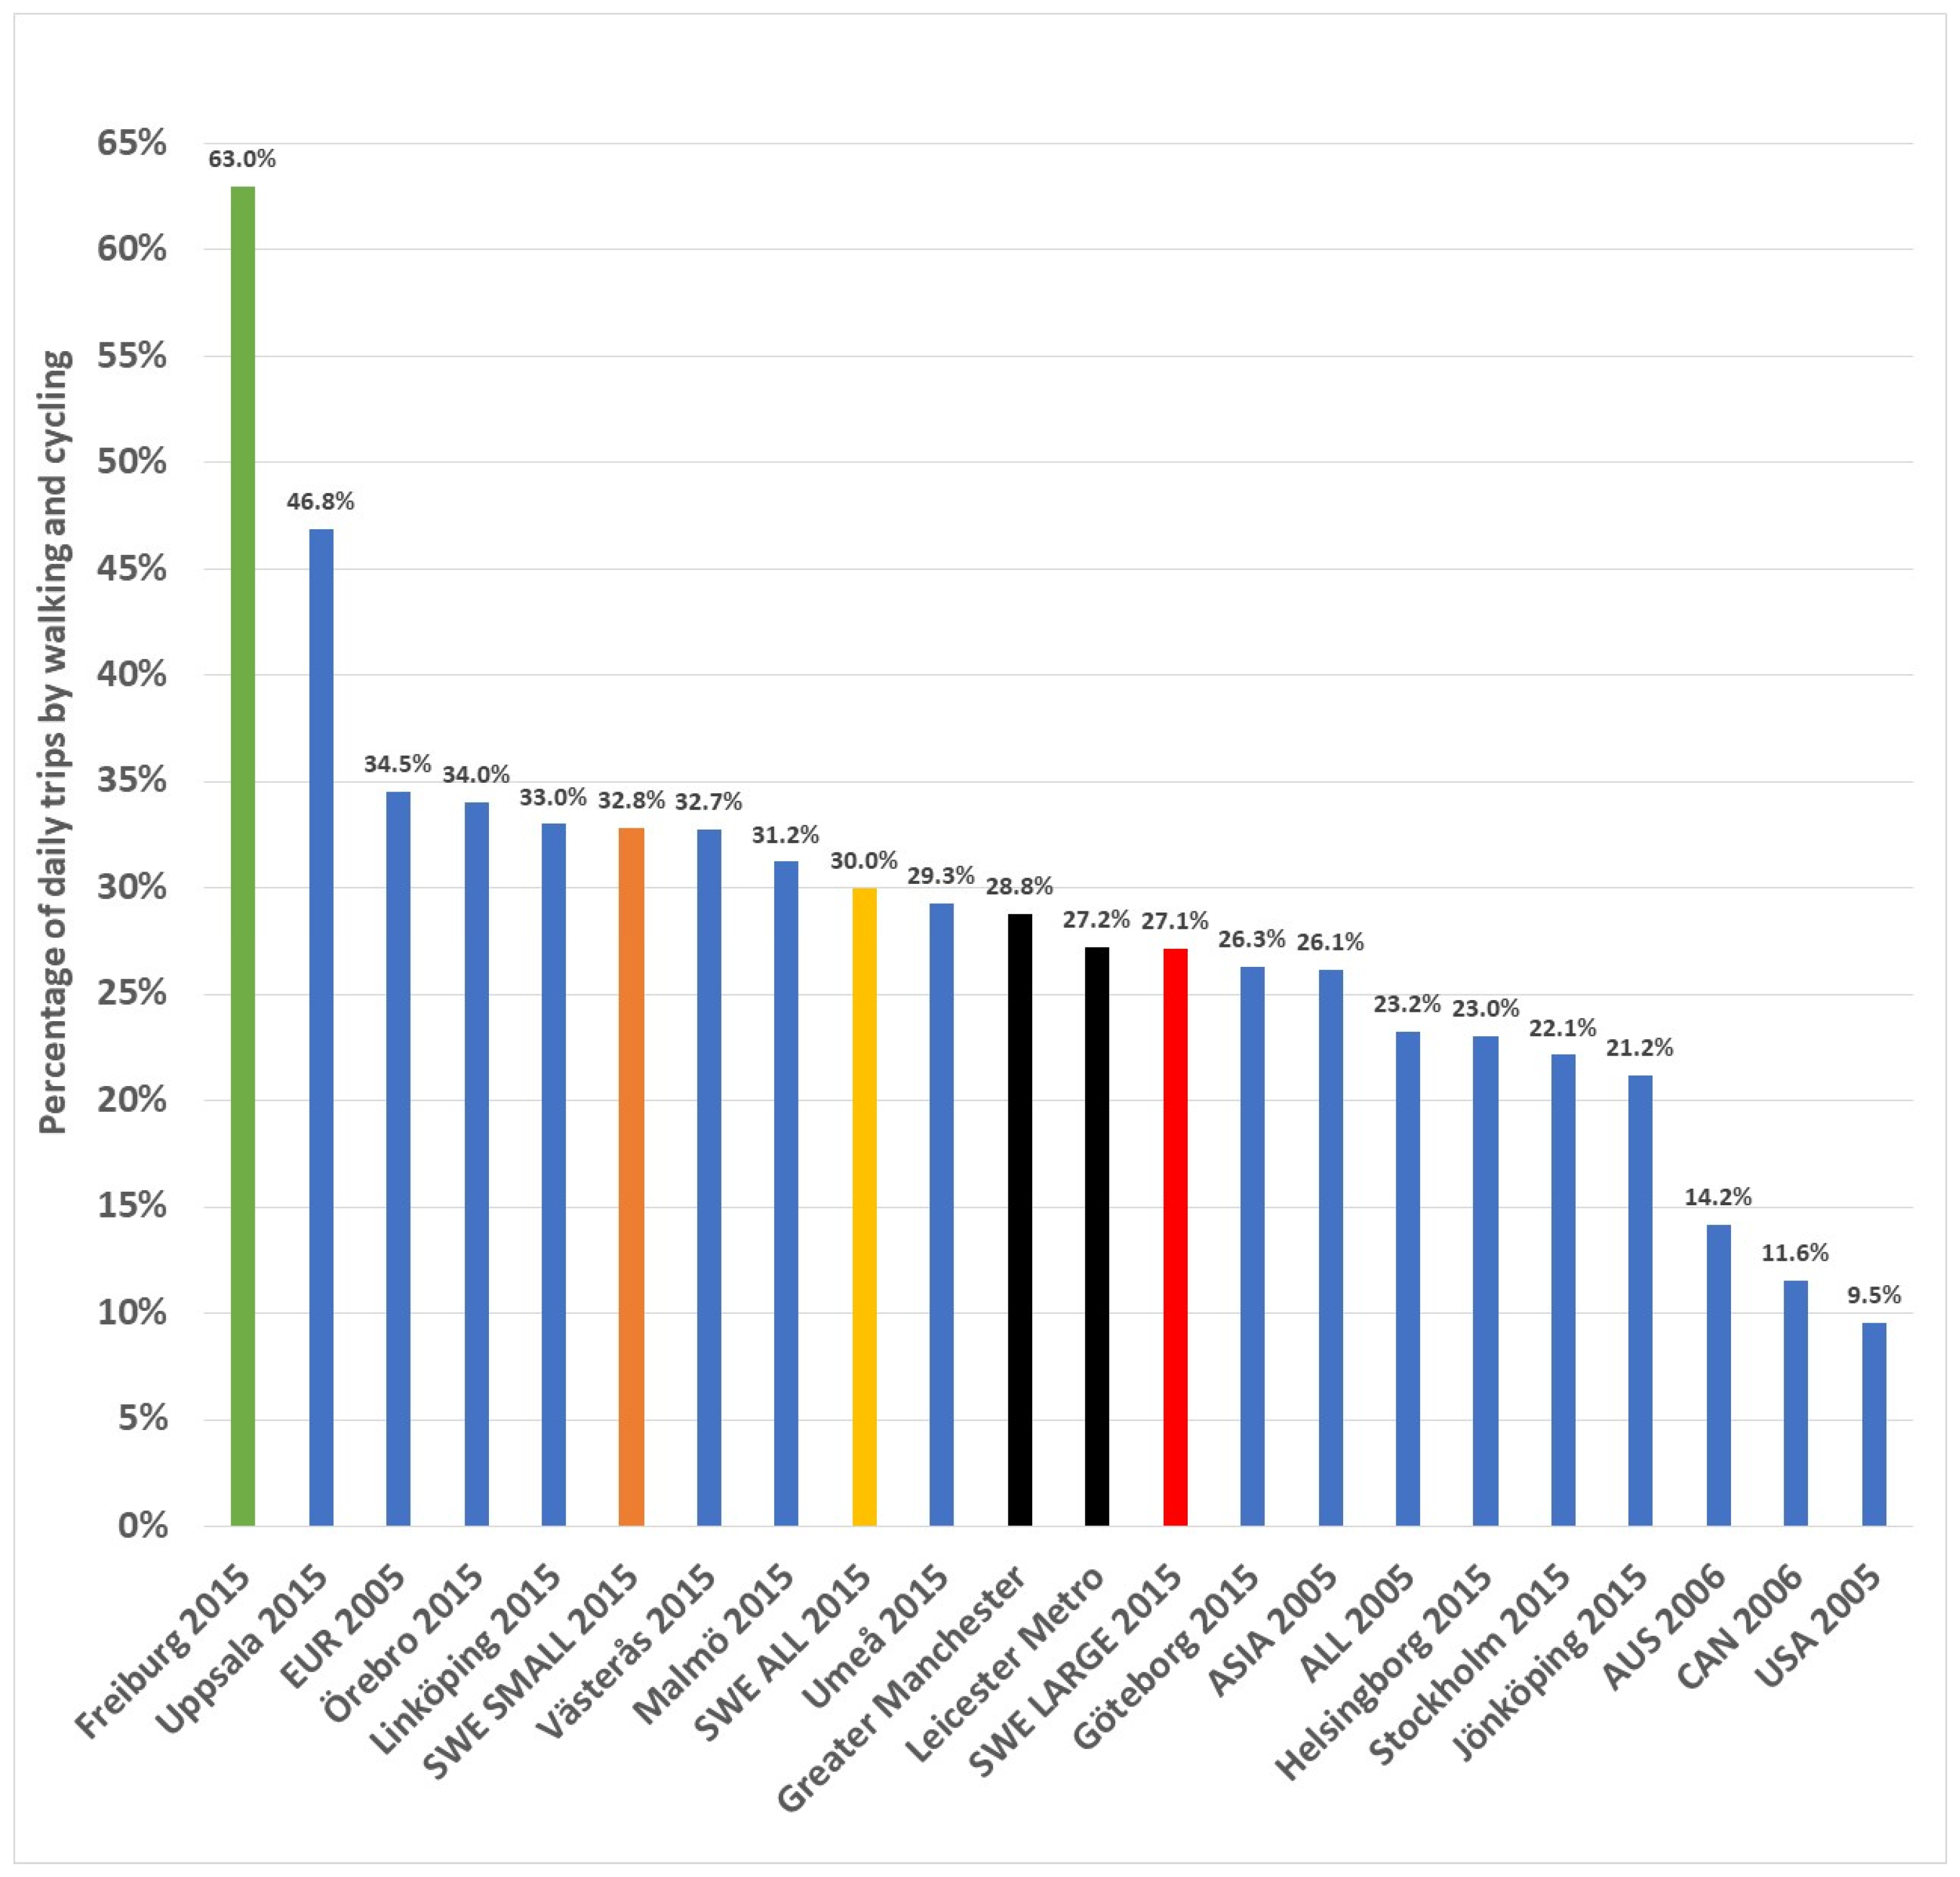
Figure A4 and Figure 20 show that GM and LM have reasonably healthy levels of non-motorised trip-making with 28.8% and 27.2%, respectively. However, in GM, only 1.0% of the 28.8% are by bicycle and in LM only 1.2%. The majority of non-motorised travel in these cities comprises inevitably short walking trips, compared to having a significant contribution of longer cycling trips, which can compete with short cars trips of perhaps 5 km to 10 km, especially with e-bikes.
Although these overall percentages compare well against many cities (e.g., US, Australian and Canadian cities only had 9.5%, 14.2% and 11.6% of their daily trips in 2005 by walking and cycling, respectively), the European cities in 2005 had 34.5%, while Freiburg had a massive 63%. The Swedish cities, which climatically could hardly be considered ideal for walking and cycling, especially in the long, dark winters, had 30.0% by non-motorised modes, with the smaller cities having 32.8%. The larger Swedish cities, with generally more diverse and attractive public transport, were about the same as the UK cities, with 27.1% in 2015.
4.4.2. Public Transport Modal Share
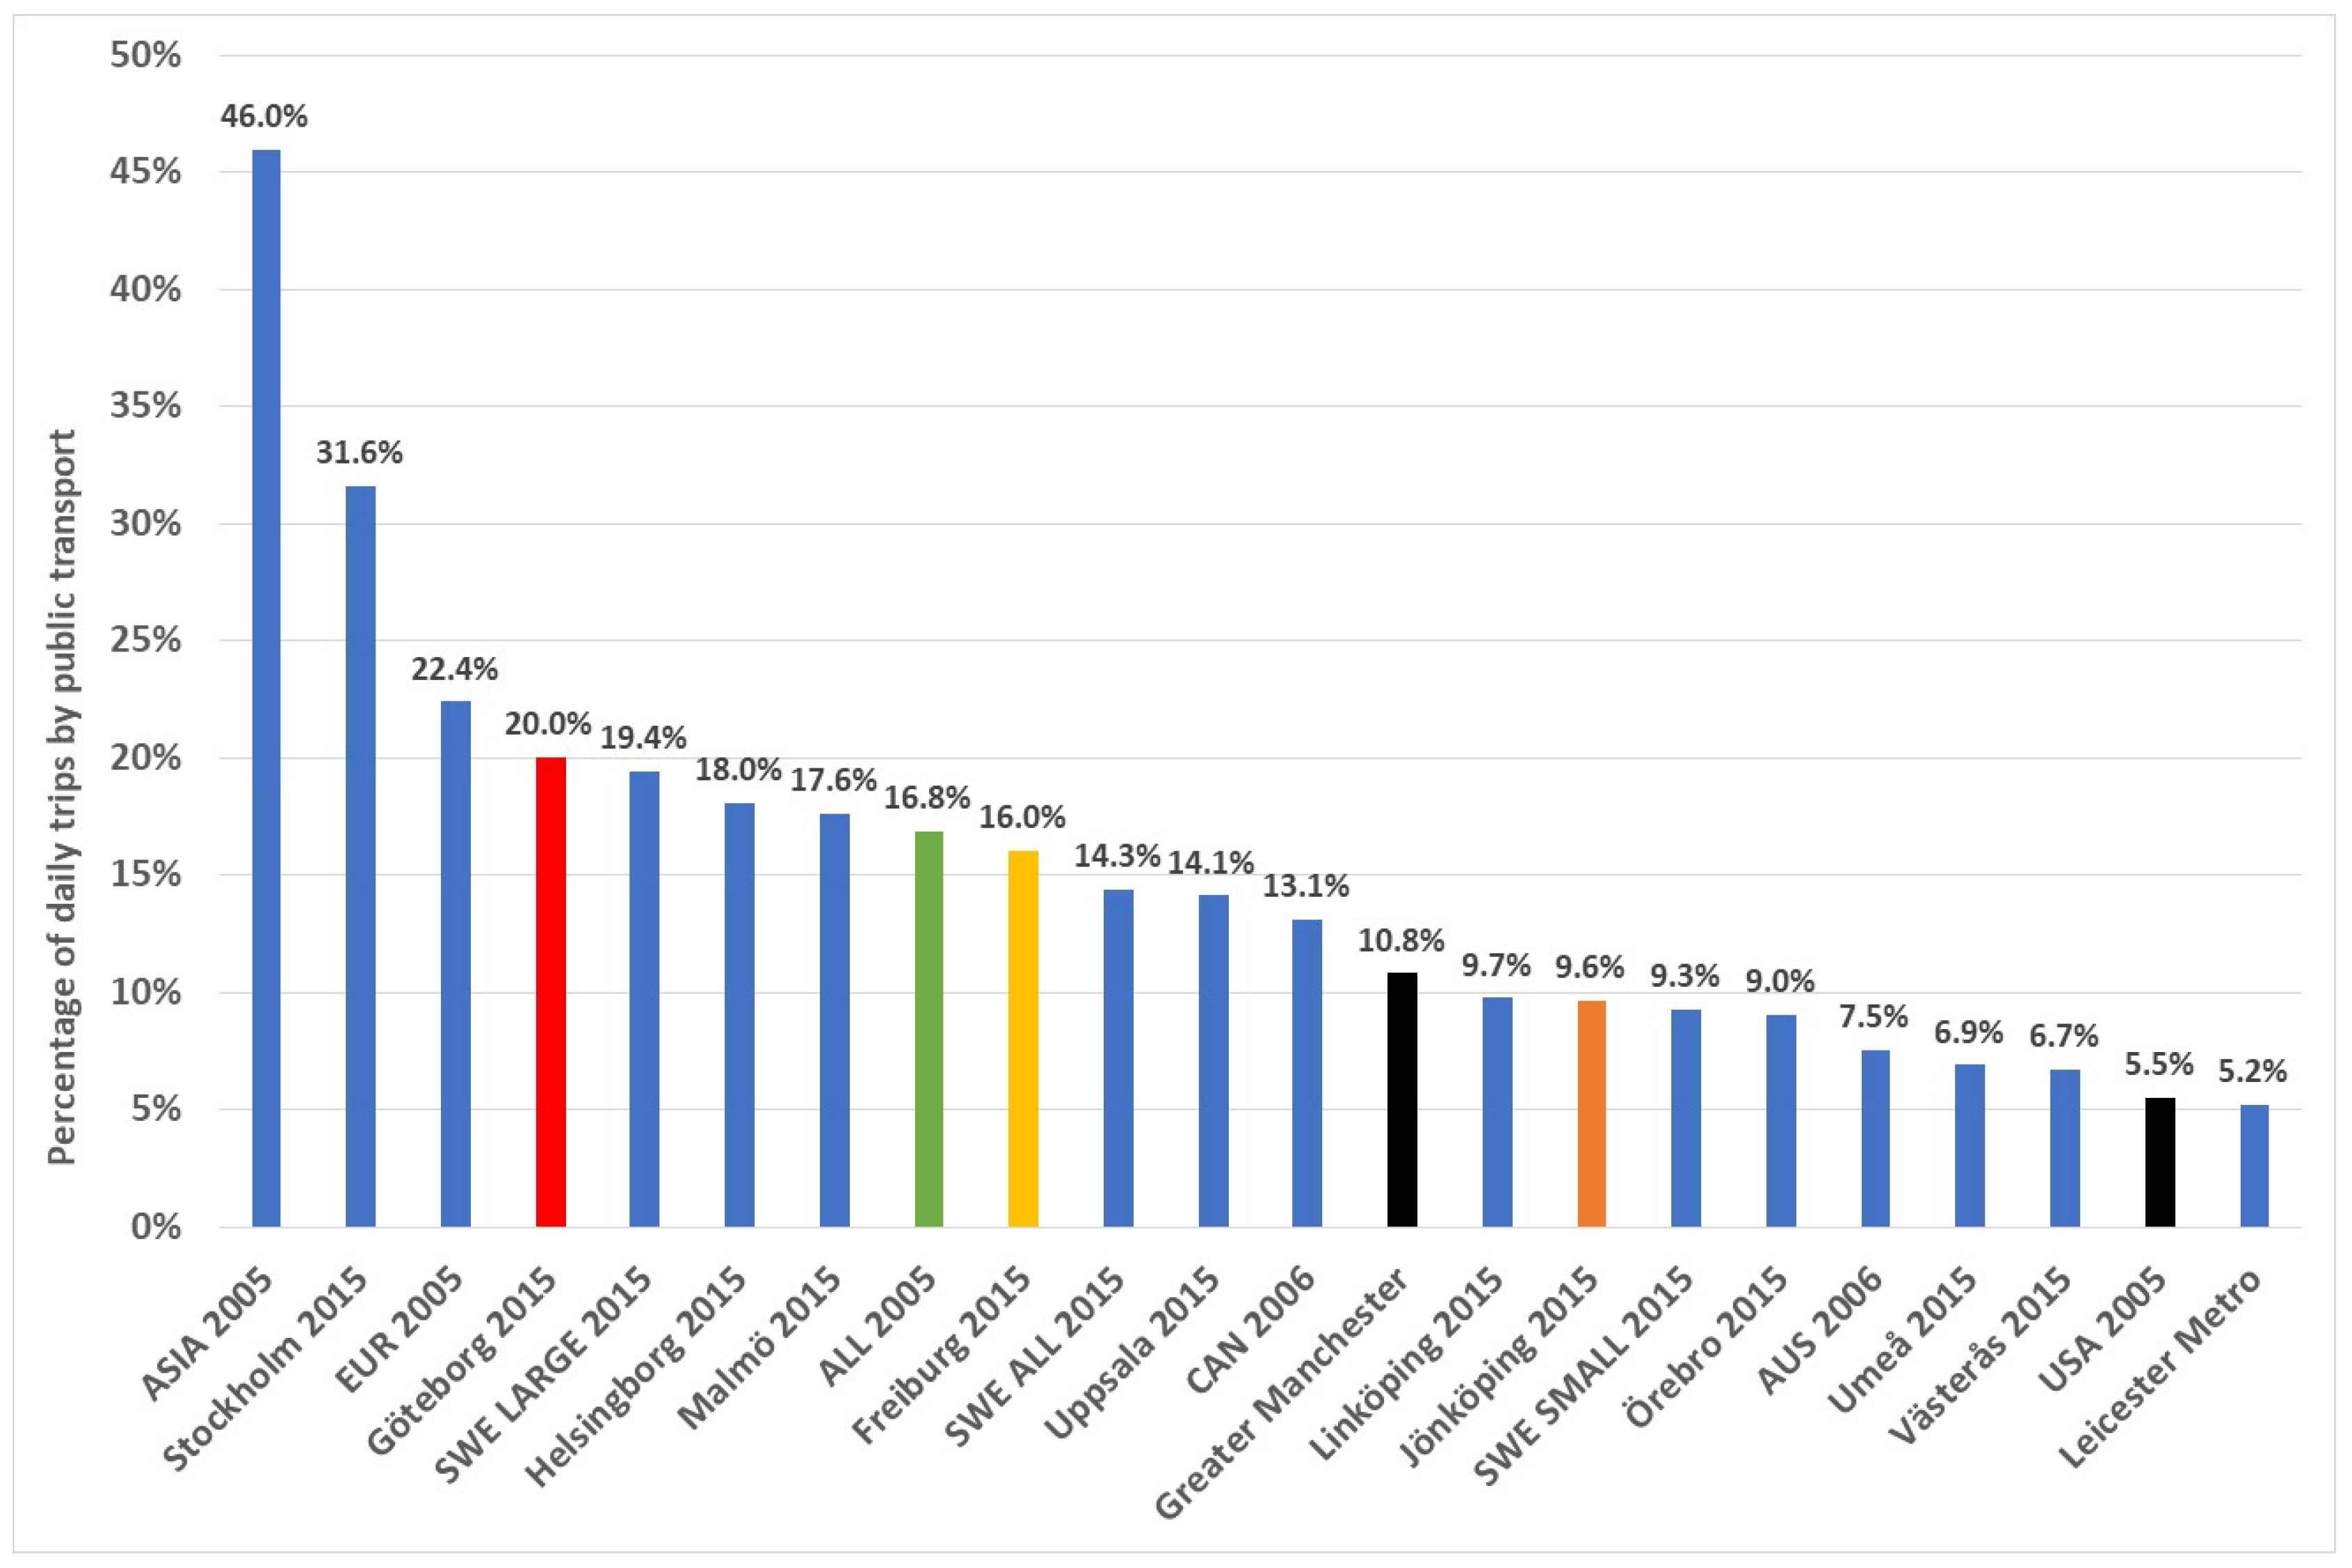
The problem with GM and LM, as with previous public transport variables, is the very low modal share of public transport (GM 10.8% and LM a tiny 5.2% of all daily trips). Such low modal shares for public transport are highly problematic, especially considering that in 2005 Australian cities had 7.5% and Canadian cities 13.1% by public transport, and these cities are considered automobile cities. Only the US cities had comparably poor public transport modal split (5.5%), but still a fraction higher than LM (Figure 21).
By contrast, European cities in 2005 averaged 22.4% of daily trips by public transport, with Freiburg in 2015 having 16%, on top of their 63% by walking and cycling. The Swedish cities in 2015, with their inferior urban densities to the two UK cities, but superior public transport systems, had 14.3% of daily trips by public transport, with the larger Swedish cities having 19.4%. Even the smaller Swedish cities had 9.3% of daily trips by public transport, which was very similar to GM and nearly double that of LM.
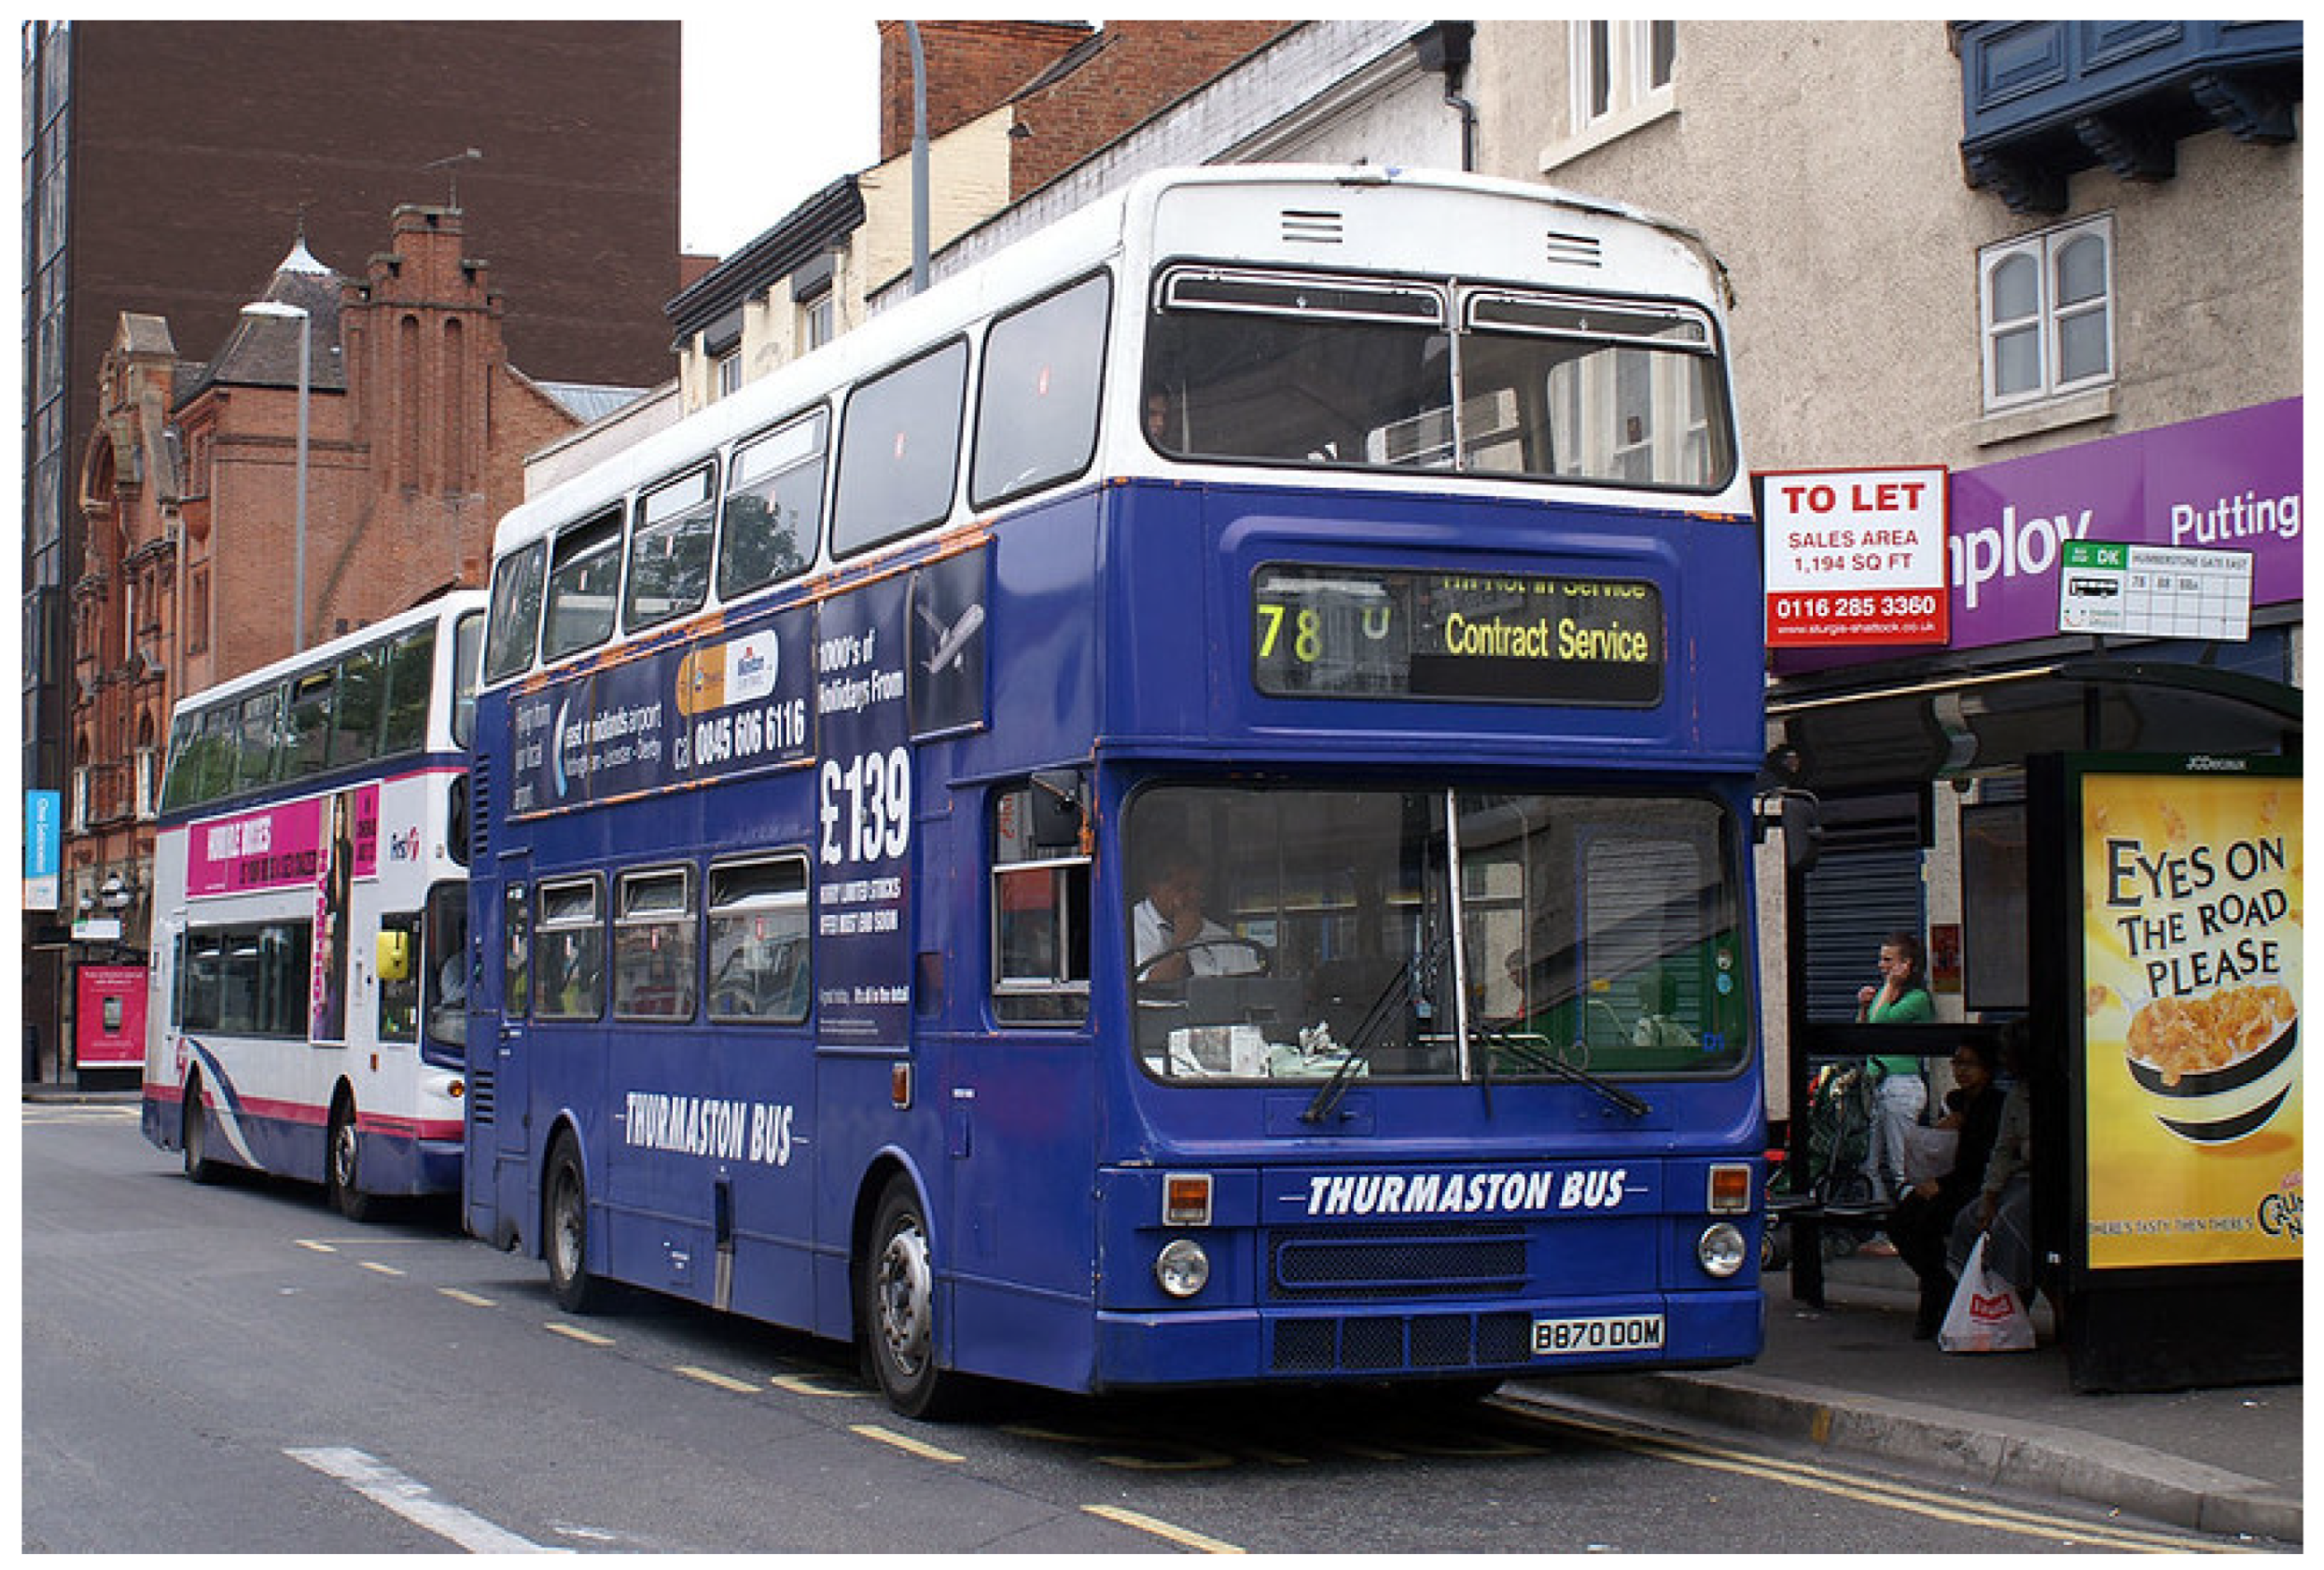
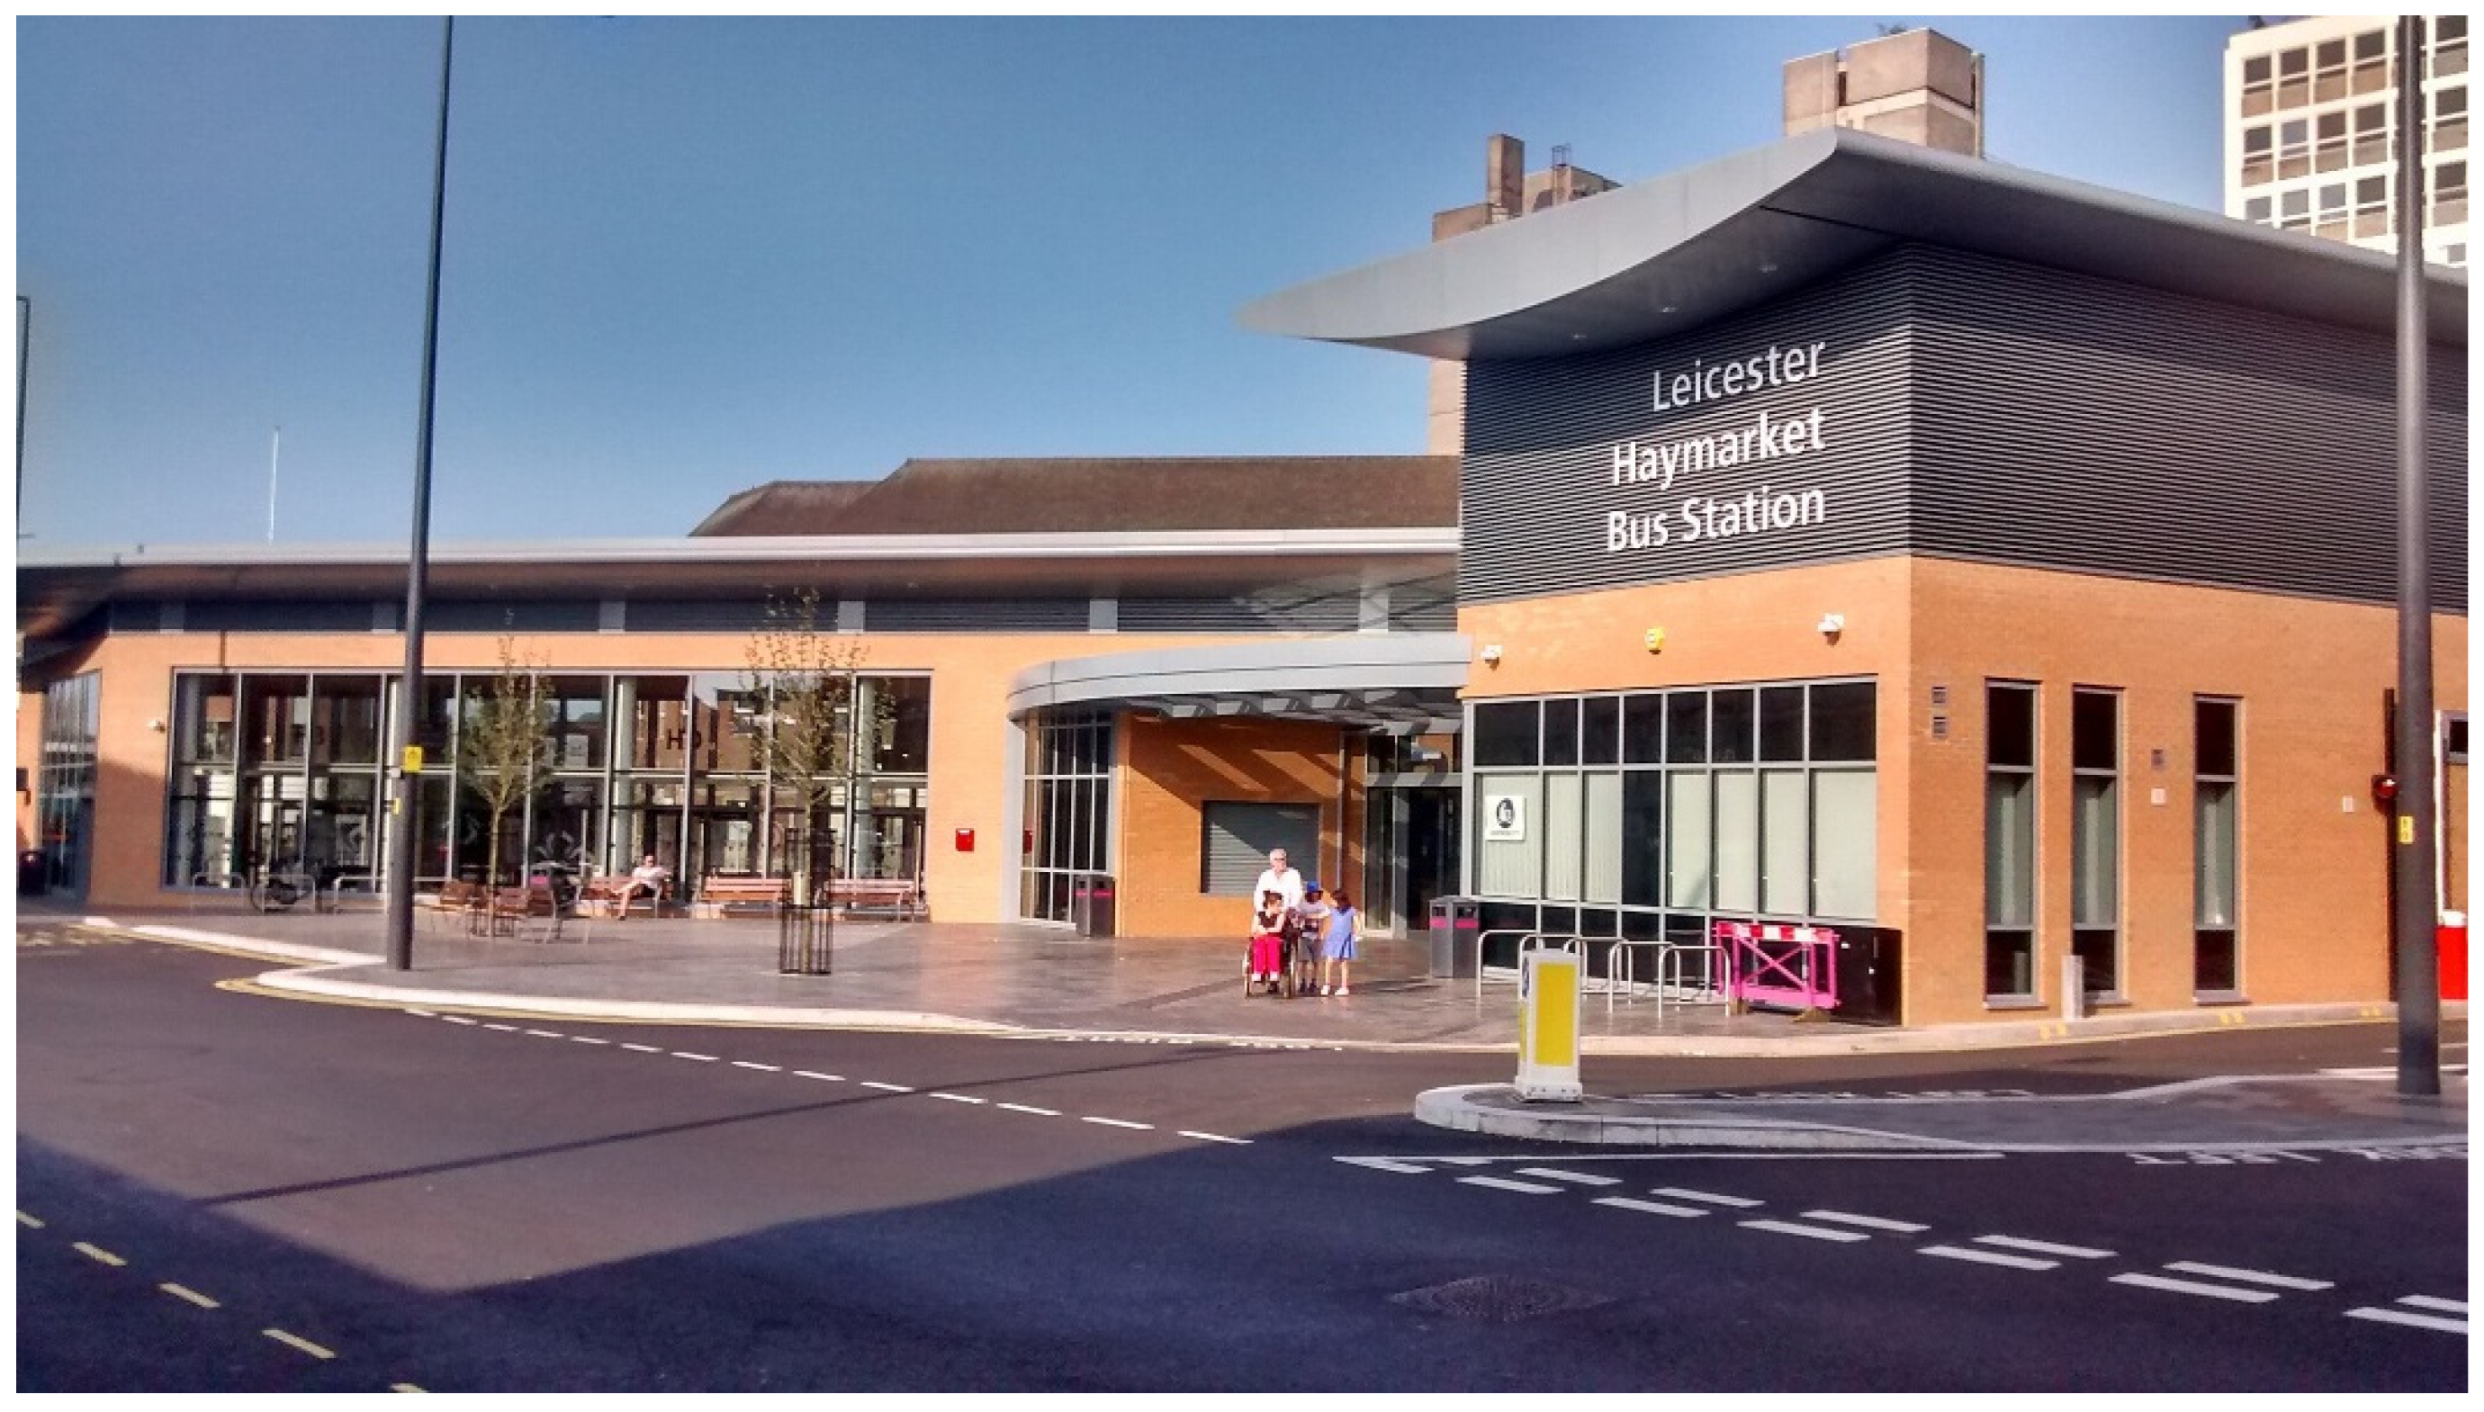
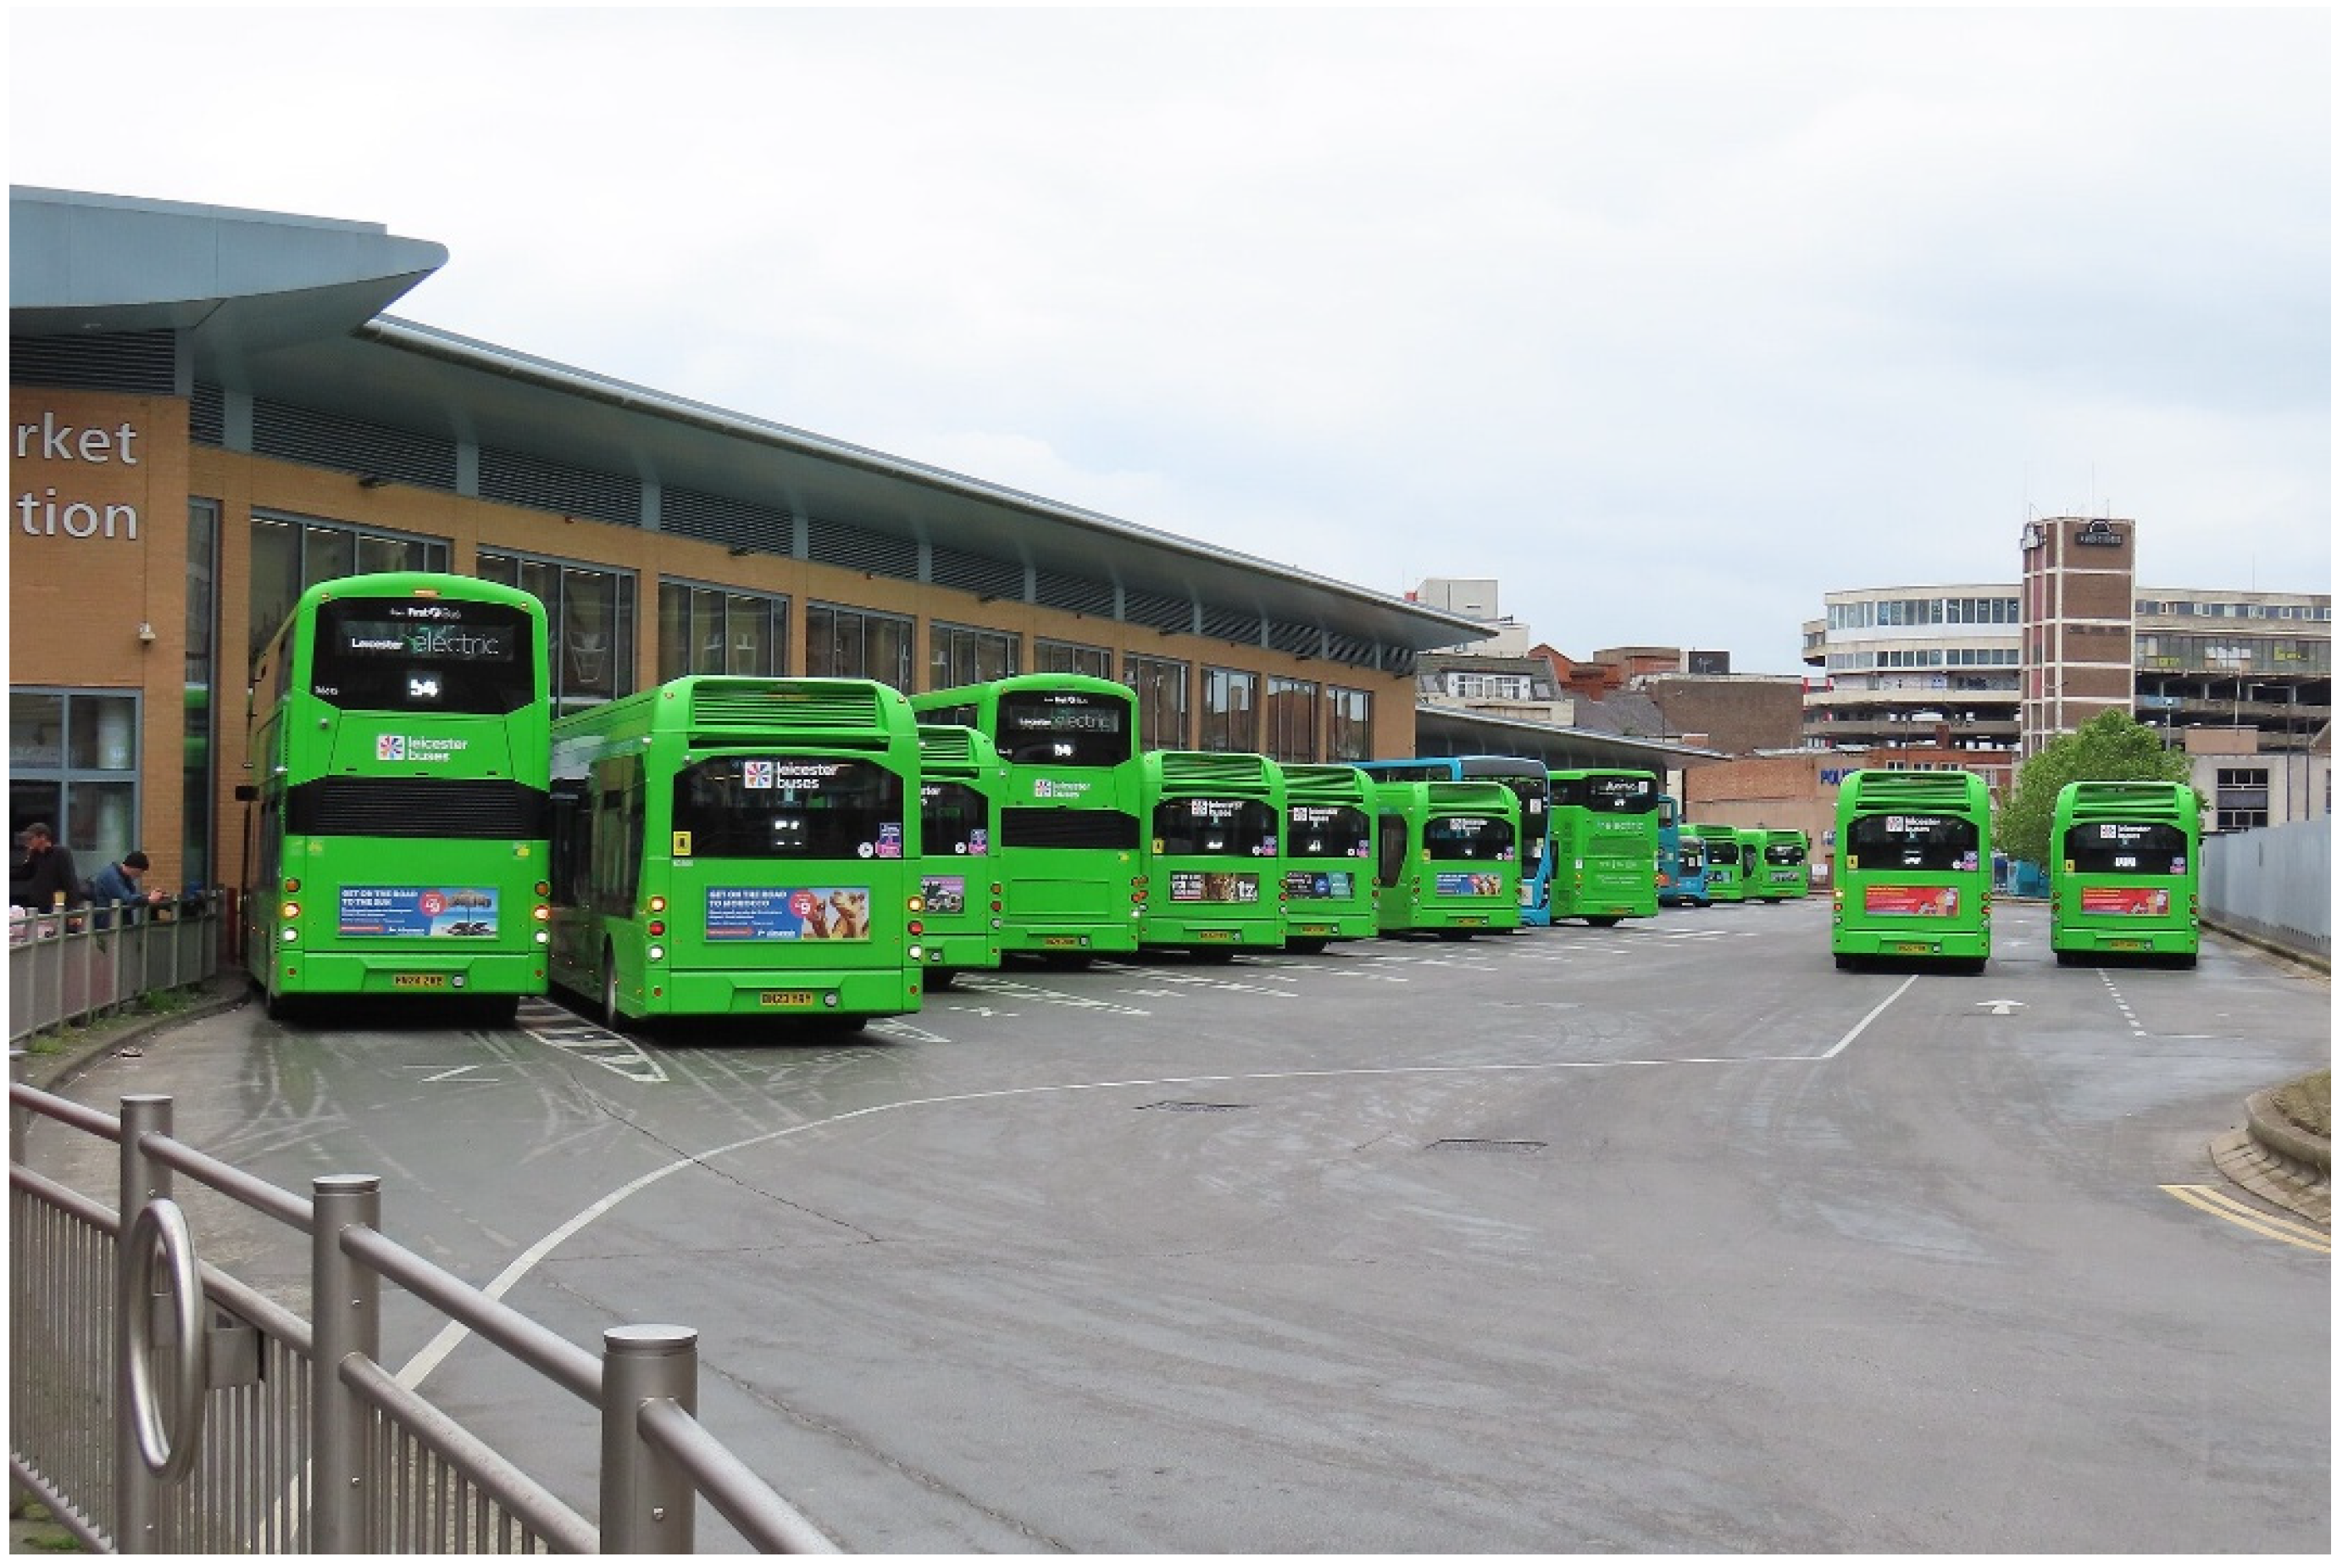
The poor public transport systems of GM and LM with their low usage, are reflected in the modal split figures and constitute perhaps the biggest challenge for sustainable transport in GM and LM, along with the miniscule use of bikes. It is also very telling that both GM and LM, especially GM, have urban densities that could support very healthy public transport use, but this does not happen. Figure 22 and Figure 23 show the Haymarket bus station in Leicester, with buses providing the main form of public transport and partly a reason for the low modal share.
4.4.3. Modal Share by Private Transport Modes
The modal share of daily trips by private motorised modes is the corollary of the above two variables with GM and LM having 60.4% and 67.6%, respectively, of all daily trips by these modes. This is not the worst result on a global basis; US, Australian and Canadian cities had in 2005 85.0%, 78.3% and 75.4%, respectively. However, it does not compare well in the European context where in 2005 the private mode share was 43.1%, the Swedish cities in 2015 had 55.7% and Freiburg a tiny 21.0%. The two UK cities, when compared to their peers, are much more automobile-oriented than they should be.
4.4.4. Car Use per Person
Car use is measured by two variables: VKT/person and PKT/person. VKT/person in Figure A4 shows that GM and LM have comparatively high car use of 6089 and 8487 car VKT/person respectively (average 7288). This is highlighted in comparing the ten Swedish cities which average 5245 VKT/person with little variation between larger and smaller cities (5194 and 5295 respectively). Freiburg in 2015 had 5267 car VKT/person and was virtually identical to the Swedish cities, while the European cities overall in 2005 were a fraction less (4937). It is noteworthy that GM’s and LM’s combined average of 7288 car VKT/person exceeds the average in the Canadian cities in 2005 (6519), although GM is less at 6089.
This is also evident with car PKT/person, with GM and LM having 8099 and 11,543 car PKT/person, respectively (a relatively high average of 9821 PKT/person). The Swedish cities, by contrast, had only 6888, meaning that GM and LM were on average 43% higher than the Swedish cities in car PKT/person. European cities in 2005 were 6817 and virtually identical to car use in Freiburg in 2015 (6899 car PKT/person), with both being very much less than the UK cities. Car PKT/person in the two UK cities was on average 16% more than even the Canadian cities in 2005 (Figure 24).
It can be concluded that all the previous data, which cast the UK cities in a less than favourable light, are culminating in car use per capita that is significantly higher than any of the car use found in continental European cities. Furthermore, their car use is crossing a line into the levels of automobile dependence found in North America. This is especially worrying given that their urban density, the key determinant of per capita car use, is higher than typical North American densities, but they are gaining little advantage from it.
4.4.5. Motorcycle Use per Person
Motorcycle use is a very minor mobility option in most cities, especially cities with relatively high GDP per capita. It is only in some rapidly industrializing countries and cities that motorcycles feature very importantly (e.g., Ho Chi Minh City or Taipei). GM and LM are mostly even lower than the other cities in motorcycle use (37 and 56 PKT/person respectively). By contrast, the Swedish cities had 65 and Freiburg 98 motorcycle PKT/person in 2015.
The policy implications of motorcycle use are therefore relatively minor, except to say that they are probably the most dangerous mode and they have been increasing in use in the last decades in a great many cities due to their cost-effectiveness (especially in fuel terms and purchase cost) and because they enable avoidance of road congestion.
4.5. Private–Public Transport Balance Indicators
Figure A5 shows three indicators that give an insight into the priority or lack of it provided by public transport in cities.
4.5.1. Proportion of Total Motorised PKT on Public Transport
This indicator represents public transport’s proportion of total car, motorcycle and public transport PKT. Figure A5 and Figure 25 show that GM and LM have a very low contribution by public transport to the overall mobility needs of their populations (8.4% and 4.7%, respectively, with a meagre average of 6.5%).
Figure 25.
Percentage of total motorised passenger kilometres by public transport in GM and LM compared to international cities.
These are amongst the worst results in this study. Swedish cities averaged 15.5% of total motorised mobility by public transport, compared to 24.5% in other European cities in 2005, but were similar to Freiburg’s 16.4%. The only cities where GM and LM are larger in this factor are the American cities in 2005 (3.2%), while even the Australian cities averaged 8.0% and Canada 11.3%. There is nothing positive here, with GM and LM amongst the most automobile dependent cities worldwide.
4.5.2. Public Versus Private Transport Average Speed
This measures the relative speed between private and public motorised transport. The more competitive public transport is compared to that of general traffic which cars experience, theoretically the more public transport should be preferred. GM’s public transport has an overall speed that is only 0.81 as fast as private transport and LM is worse at 0.71 (average 0.76). The larger five Swedish cities have a ratio of 0.98, meaning that public and private transport are almost equal, while the smaller Swedish cities have a ratio 0.88 (as did the European cities in 2005), which is still better than GM and LM. Freiburg’s public transport achieves a ratio of 1.07 or on average, 7% faster than travelling by car. Compared to the other global cities, the two UK cities are approximately the same as the Australian cities were in 2005 when their ratio was 0.78. But there are only two groups of cities where GM and LM perform better, not surprisingly, the US and Canadian cities, which had in 2005 ratios of 0.55 and 0.57 respectively (Figure 26).
Figure 26.
Ratio of public transport system speed to private transport speed in GM and LM compared to international cities.
In conclusion, GM and LM are not the worst in the speed competitiveness of their public transport system, but they are far from being the best. The only ways that this factor can be improved are to speed up the system, which generally means more rail service and more bus lanes, and/or to slow down the traffic, letting it congest without adding road capacity to relieve it.
4.5.3. Reserved Public Transport Route Versus Freeways
The final factor here is the ratio of reserved public transport route per person to freeway provision. Both variables represent premium infrastructure for public transport and private transport and the higher the ratio, the more priority there is to public transport on this factor.
Both GM and LM have more reserved public transport route than freeways with ratios of 2.42 and 1.52 respectively (average of 1.97 or almost twice as much reserved public transport route compared to freeways). The Swedish cities had an average of 3.21 times more reserved public transport route, while Freiburg had a massive 19.10 times more. The European cities in 2005 had 5.51 times more (Figure 27). GM and LM only have a better ratio than American, Canadian and Australian cities in 2005. The only way to rectify this is to stop building freeways or even tear some down or convert them to boulevards, and/or to provide more rail lines and dedicated bus lanes.
4.6. Some Transport Outcomes
This section examines some outcomes of urban transport systems such as energy use, transport-related air emissions from all modes of transport and transport fatalities covering all modes (Figure A6).
4.6.1. Private Passenger Transport Energy Use per Capita
Energy use, with its attendant costs as well as local and global environmental impacts (e.g., global warming), is an important characteristic of urban transport systems. Energy use for each fuel type has been converted to megajoules (MJ) using standard conversion factors. Figure A6 and Figure 28 show that GM had an annual use of energy per person in private motorised passenger transport of 18,102 MJ, while LM had some 19% more at 21,587 MJ/person. This is significantly more than in the Swedish cities, which in 2015 averaged 15,601 MJ/person. Likewise, Freiburg in 2015 had 16,488 MJ/person, while the large sample of European cities in 2005 were almost the same as the Swedish cities in 2015 with 15,795 MJ/person.
Figure 28.
Private transport energy use per person in passenger transport in GM and LM compared to international cities.
When compared to European cities, GM and LM use significantly more energy for private mobility, which is a reflection of their higher car use, significantly poorer public transport systems and negligible use of bikes.
Favourable comparisons nevertheless can be made with the American (53,441 MJ/person), Australian (35,972 MJ/person) and Canadian cities (30,804 MJ/person) in 2005. Part of the difference here will be accounted for by cars having higher fuel consumption per kilometre in 2005 compared to 11 years later.
UK cities have the potential to reduce their private transport energy use, especially due to their supportive urban densities, but it will require a transformation in their public transport systems and other supportive transport and land use policies favouring sustainable mobility.
4.6.2. Public Transport Energy Use per Capita
GM and LM have comparatively low use of energy in public transport (900 and 744 MJ/person respectively, averaging 822 MJ/person). In limited terms, this is good, but it is unfortunately a reflection of poor public transport supply, which negatively affects the usage of this energy-efficient mode. The Swedish cities consumed some 1426 MJ/person in their public transport systems in 2015 which was 73% more than in the two UK cities. Freiburg, on the other hand, consumed 1081 MJ/person, which was much closer to the two UK cities, but this is for two reasons—Freiburg relies very heavily on non-motorised mobility and is dominated by rail modes running on electricity which are very much more energy-efficient than buses which dominate in the UK cities. In 2016, both GM and LM consumed less energy per capita in public transport than the US cities in 2005 (963 MJ/person), which is further indication of low service (Figure 29).
Figure 29.
Public transport energy use per person in passenger transport in GM and LM compared to international cities.
Both GM and LM have plenty of spare capacity for increased use of the public transport services they provide, but making use of that capacity would require a large elevation in the attractiveness of their public transport systems. Such increased use would not involve any increase in energy use—rather, it would further increase the energy-efficiency of public transport travel compared to private transport by improving their poor vehicle and seat occupancies.
4.6.3. Transport Emissions per Capita and per Hectare
Air pollution derived from transport systems is a very important source of emissions in urban areas. This research collected the annual emissions of four air pollutants, CO (carbon monoxide), NOx (nitrogen oxides), SO2 (sulphur dioxide), and VHC or VOC (volatile hydrocarbons or volatile organics), and normalised them on both a per capita and spatial basis (kg of combined emissions per person, per total ha and per urban ha of land).
The data in Figure A6 and Figure 30 indicate that the two UK cities are low in transport emissions with total per capita emissions of the four pollutants amounting to 11 and 15 kg/person annually (or 13 kg/person on average). This compares favourably with the Swedish cities, which average 17 kg/person. Freiburg in the same year had 24 kg/person. Comparisons with the global cities on this factor are strongly impacted by the passage of time because emissions from transport are mostly on a significant downwards trajectory due to tighter regulations and automotive technological advances, so it is likely that by 2015/16, the other cities would have reduced their emissions significantly. The global sample averaged 98 kg in 2005, and the European average was 35 kg/person, so almost three times more than in the two UK cities. Of course, the North American and Australian cities were vastly more in 2005 than GM and LM.
Figure 30.
Transport emissions per person in passenger transport in GM and LM compared to international cities.
While per capita transport emissions present a comparatively good picture in the UK cities, when these emissions are expressed on a per hectare of urban land basis (where most of the emissions occur), the picture is a little different. Here we see that GM and LM had 463 and 391 kg emitted/urban ha (average 427 kg), while the Swedish cities experienced 288 kg/urban ha. On the other hand, Freiburg, which has a denser urban form, the transport emissions/urban ha were 1117 kg.
These figures relate to exposure to air pollutants with lower density cities having more widely distributed air pollutants than denser cities. This is not a reason to spread cities out because this increases car use which simply adds more pollutants to the air.
The emissions per total area of land depend on how much non-urbanised land is included within the boundaries of the defined metropolitan areas. The more forests, agricultural land and undeveloped land there is, the lower will be the total emissions/ha.
GM and LM had 233 and 70 kg/ha, respectively, with an average of 151 kg/ha. The Swedish cities average only 32 kg/ha, reflecting the much lower density of these cities. Freiburg, on the other hand, has 353 kg/ha, again reflecting a much more compact and more fully urbanised territory compared to the UK cities. All the other cities in 2005 had much higher emissions per ha than the UK cities, but as already explained, because transport emissions in cities have been falling significantly, these comparisons are more time sensitive than for other variables.
4.6.4. Transport Fatalities per 100,000 Persons
A major cost and source of human pain and suffering in cities is the loss of life in urban transport systems. This factor measures the transport deaths in cities using the World Health Organisation’s (WHO) International Classification of Diseases codes (ICD10, codes V01-V99), which are more reliable than police records, since they record the cause of death in hospitals up to 30 days after transport accidents as attributable to transport reasons. Police records typically only record deaths at the scene of an accident.
The two UK cities show a divergence on this factor with GM having 1.9 deaths/100,000 people, while LM had 4.1 (average 3.0). These numbers are relatively low, though not as low as the Swedish cities which recorded a low 2.4 deaths/100,000 compared to 5.5 globally in 2005, 3.4 in the European cities, and an average of 7.3 in the American, Australian and Canadian cities where exposure to automobiles, through sheer usage levels, is the highest (Figure 31). Freiburg is almost double the Swedish figure at 4.5 per 100,000 and a little higher than the Leicester Metro area.
Figure 31.
Transport deaths per 100,000 persons in passenger transport in GM and LM compared to international cities.
Transport deaths in cities have also been on a downward trajectory over the last decades, so one would expect the 2016 figures for the global cities to be significantly lower than in 2005, and therefore closer to the UK cities in 2016. Some factors behind this trend might be the increased safety features of new automobiles, a stronger focus against drink-driving or perhaps even slower speeds due to congestion. In GM and LM, where cycling trips are very low, there could also be some avoidance factor involved, which while it may be contributing to lower transport fatalities, is not a good way of minimising this negative outcome of transport. In this respect, the Swedish cities appear even better because they have much higher levels of cycling than GM and LM, but still manage lower transport fatalities, most likely because cyclists are better provided for with safer, dedicated cycling facilities and Sweden’s Vision Zero programme [81].
4.7. Some Economics of Public Transport
It is important to understand the comparative economics of urban public transport and this research has tried to capture this partially through the collection of annual farebox revenues (with and without government reimbursements for concession fares for seniors and students etc) and the annual operating costs (with and without finance and depreciation). From this a range of standardised indicators are possible (Figure A7), one of which is the operating cost recovery. The method used here is the common norm of using farebox revenues including government reimbursements and operating costs minus finance and depreciation charges (i.e., the best-case scenario). Public transport farebox recovery is often a point of policy or political discussion with most systems unable to recover their operating costs from their farebox revenues. This is often viewed negatively, forgetting that the financial benefits of public transport extend beyond fares. Significant benefits accrue to car drivers by helping to minimise congestion, reducing costly air pollution and through needing less space for roads and parking. However, these benefits are rarely quantified and never feature in public transport accounting systems.
Before this variable is presented, however, some other variables are discussed. These are the public transport farebox revenue collected per PKT travelled (including reimbursements) and the corresponding operating cost per PKT (including finance and depreciation). Finally, the annual operating costs of public transport are expressed as a percentage of the per capita GDP of each city to gain a comparative idea of how much of a city’s wealth is spent on operating public transport. Many factors feature in operating costs including wages, fuel costs etc (see Table 1).
4.7.1. Public Transport Farebox Revenue per PKT
This factor measures how much fare revenue is collected by the public transport system for every one passenger kilometre of service that is catered for (i.e., one passenger travelling one kilometre). All data are in US 1995 dollars for reasons already explained. Figure A7 and Figure 32 show that in GM in 2016, USD 0.17 was raised while in LM USD 0.14 was collected (average USD 0.15). By contrast in Sweden USD 0.09 was collected, suggesting that public transport is more expensive in the UK cities than in Sweden. This is especially so since the Swedish cities in 2015 were considerably wealthier than the two cities in the UK (USD 33,197/capita GDP vs. USD 21,839). It means that residents of the two UK cities not only have higher public transport fares but are also less able to afford them.
Figure 32.
Public transport farebox revenue per passenger kilometre in GM and LM compared to international cities.
Likewise, Freiburg only raised USD 0.08 per PKT, though the other European cities in 2005 had USD 0.13/PKT, which was a lot closer to the UK figure in 2016, although here again, those European cities at the time were much wealthier (USD 38,683 GDP/person) and more able to afford those fares. Overall, there were no groups of cities that charged more for public transport than GM and LM. It is possible that high fares are a contributing factor to the low use of public transport, while also being inequitable.
4.7.2. Public Transport Operating Cost per PKT and per VKT
The flipside of farebox revenue is what operators must pay to run their systems. Here Figure A7 and Figure 33 show that per PKT, GM and LM paid USD 0.14 and USD 0.12 respectively to run their systems, or on average USD 0.13. This is noteworthy because GM and LM paid amongst the lowest of any city in this large sample to run their public transport. Swedish cities were paying on average USD 0.24/PKT or close to double, although Freiburg was paying only USD 0.10 and the Asian cities in 2005 were also more economical at USD 0.06/PKT. On a per VKT basis, the data reveal that GM and LM also pay less for each VKT offered (GM USD 2.18 and LM USD 1.72—average USD 1.95).
Figure 33.
Public transport operating costs per passenger kilometre in GM and LM compared to international cities.
There are different ways to interpret these results. One could say that the UK cities are much more efficient and cost-effective in running their public transport. Or it could also be posited that they are just parsimonious and since wages for drivers and others are a major part of operating costs, it could mean that employees are not paid as well as they are in other cities. Freiburg in 2015 paid USD 2.32 for every VKT of service, versus the average of USD 1.95 in the UK cities. In the European cities in 2005, the cost of running their systems was USD 5.05/VKT and globally in that year it was USD 4.44/VKT.
When one combines the farebox revenue with the operating costs it could be concluded that in GM and LM not only are high fares charged relative to the wealth of the cities, but they also strongly minimise their operating costs relative to other cities, which may be reflected negatively in the quality of the services delivered.
4.7.3. Cost Recovery of Public Transport
Combining the data in the previous sections yields a high operating cost recovery for GM and LM (in 2016 it was 120% and 116%, respectively—Figure 34). This is quite unusual for public transport systems, although not unheard of. For example, the Asian cities in the global sample in 2005 had a cost recovery of 121% or around the same level as the UK cities. On the other hand, the Swedish cities in 2015 only recovered 43% of their costs, while Freiburg recovered a relatively high 84% of its costs from fares. However, as explained in the introduction to this section, this does not mean that public transport was “subsidised” in such cities, or any other city where fare revenue does not cover costs, if a full account is taken of public transport’s broader benefits to society.
4.7.4. Percentage of Metropolitan GDP Spent on Operating Public Transport
The last item measures how much of the city’s wealth is committed to the operational costs of public transport. The greater the percentage, the more likely it is that there is a significant and well-funded public transport system. GM and LM spend only 0.50% and 0.31%, respectively, and unsurprisingly this is very low (average 0.40%), as shown in Figure 35. The Swedish cities spent 1.05% of their cities’ GDP on operating their public transport systems and Freiburg 0.50%, while in 2005 the European cities spent 1.50% of their GDP on this factor. Even the US cities in 2005 spent 0.44% of their wealth on operating public transport, which was just a little more than the two UK cities in 2016. Again, this points to public transport being a low priority in GM and LM, but one for which the population pays high prices to use, resulting in an operating profit (an unusual situation outside the Asian region). This neglect is reflected in these economic factors and in the wider infrastructure, operational and usage factors explained in previous sections.
5. Discussion and Policy Implications
5.1. Discussion
This research has collected a large sample of data to characterise critical factors describing land use, economic and passenger transport conditions in GM and LM, comparing them to many other cities around the world. Perhaps most importantly, as a litmus test of overall automobile dependence, car use per person in both GM and LM in 2016 was much higher than in a sample of Swedish cities in 2015, as well as much higher than a large sample of other European cities in 2005, and indeed in the case of LM, car use was very close to Australian cities in 2005. GM was also only a little less than car use per person in Canadian cities in 2005, while LM greatly exceeded it, meaning that in car dependence and transport sustainability, both UK cities are poor.
These results are of concern for several reasons. Firstly, based on 45 years of experience collecting and comparing car use in cities around the world against their urban density (the strongest statistical determinant of car use/person—[47]), both the UK cities had urban densities that should have resulted in less car use/person than was observed. This is especially true of GM, while LM, although significantly lower than GM in density, still had a density that was 38% higher than the five larger Swedish cities and 62% more than the average for the ten Swedish cities. Additionally, given that GDP/person in both cities was extremely low compared to all the other cities, which should mitigate against car use, the level of car use is especially atypical. There are also some other factors, which when compared to other cities, would normally tend to reduce car use, although with some caveats:
- The length of freeway per person in both cities was only moderate.
- The parking supply in both cities’ CBDs was moderate and quite like other European cities. However, the percentage of metropolitan jobs located in the CBDs was very low compared to other European cities, suggesting much more job decentralisation which encourages car use.
- The percentage of daily trips by walking and cycling in both UK cities is similar and healthy, though it is below both the Swedish and other European cities. Of concern though is the fact that cycling represents only a very tiny fraction of non-motorised mobility in both UK cities, so that there is little substitution of car travel by bikes.
Thus, what are some of the defining problems in GM and LM which work against reduced automobile dependence? This study has assembled a large range of factors that describe the public transport systems in both cities and compared these to a large sample of global cities. Unless a city is designed almost singularly around walking, and especially cycling, such as Copenhagen, most Dutch cities and cities such as Münster or Freiburg-im-Breisgau in Germany, then an extensive and effective public transport system with high usage, especially on rail, is the main competitor to car use and most cities’ major bulwark against developing high automobile dependence. When this is combined with excellent conditions for, and use of, non-motorised modes, which is the case in Freiburg, then the city has a recipe for keeping car use restrained (even when car ownership might be high).
Unfortunately, poor public transport is where both GM and LM distinguish themselves.
- Both cities have low public transport system coverage (line length per person) compared to other cities.
- They also have a low length of reserved public transport route per person, meaning that public transport infrastructure is generally not well-protected from traffic congestion because there are insufficient rail systems in both cities and very poor bus lane coverage.
- The per capita public transport service provision, both in vehicle kilometres and seat kilometres is very low, especially compared to their European neighbours, and this is particularly so considering their healthy urban densities are a sound pre-condition for offering greater service and in turn, higher use. In particular, there is a paucity of rail service.
- The relative speed of their public transport systems, speed competitiveness with the car being a major attraction of public transport where it exists [58], is below that of the Swedish cities and the European cities generally. This is especially so in LM. This inferior speed performance is despite their being more reserved public transport than freeways in both cities, but unfortunately, not enough in total.
- Especially problematic in GM and LM is that, despite these insufficiencies in the public transport system, the cost of public transport for the user was very high. Per boarding and per passenger kilometre, GM and LM had the most expensive public transport in the global sample.
- Both GM and LM raised the highest amount of farebox revenue per VKT of service offered compared to other cities. This is not because there is a high amount of usage per se, but rather because the level of service was low and the fares were high. From a societal perspective, a high amount of farebox revenue per VKT could only be considered a positive occurrence where the situation was the reverse—that is where service provision is high, and fares are low and the amount raised per VKT of service is high because the service attracts high use.
- Contrary to farebox revenue, the public transport operating costs per VKT provided and per PKT of usage were the lowest in all the groups of cities in the study. Low operating costs per vehicle km of service or passenger kilometre of use is not intrinsically a negative factor, but where it is low because employees are not fairly paid, or cost savings are being made to the detriment of service quality, then it is a negative result because it undermines usage and the perception of public transport in the community. This study has not been able to determine if either of these situations are prevalent in GM and LM, but further investigations are worthwhile.
- Linked to low operating costs, GM and LM have by far the lowest expenditure per capita on operating costs for public transport in the global sample, which appears to be because they do not have very high levels of service. Likewise, they spend the smallest percentage of their metropolitan GDP on providing public transport services, which appears more than anything else to be a lack of priority, rather than greater “efficiency”.
- High farebox revenue and low operating costs also reveal how GM and LM made public transport operating profits in 2016. None of the other city groups, apart from those in Asia, come close to such a result. But unlike in Asia, where operating profits reflect huge levels of usage in very dense environments, the profit in GM and LM is in the context of very low public transport use and what appears to be inferior public transport infrastructure and service, the latter reflected in low operating costs.
- Finally, the low amount of annual public transport energy use per person in GM and LM, the lowest in the global sample, continues to show a general paucity of public transport service in both cities and therefore not a positive. Consumption of energy in public transport can yield very high energy efficiency because of the high load factors that are possible per vehicle (cars have an annual average of about 1.3 to 1.5 persons per vehicle). Thus, in virtually every case, high per capita energy consumption in public transport is reflective of very high public transport service and use, which reduces car use and leads to a more sustainable city overall.
The remaining items in this study concern energy use in private passenger transport, transport-related emissions, and transport deaths. In private transport energy use, GM and LM both exceeded the Swedish cities and typical European levels. This was inextricably linked to their higher dependence on cars. But compared to US, Australian and Canadian cities in 2005, they were significantly less.
In transport emissions per person, GM and LM in 2016, were the lowest in the study. This appears to be consistent with a very steady decline worldwide in transport emissions, at least in developed cities (for example, the Swedish cities and Freiburg in 2015 were not much higher than GM and LM). Since transport emissions here are for the whole transport sector, it is possible that low figures might partly reflect lower economic activity in commercial and freight transport. For GM and LM with their low GDP per capita, this may be the case. Overall, this is a promising result, but every city must ensure improvements in emissions in individual vehicles is not eclipsed by increased usage in the private passenger and freight/commercial transport sectors [82].
Transport-related deaths show a similar positive result in GM and LM. They were comparatively low compared to cities in 2005, although significantly higher than in the Swedish cities in 2015. This may be partly an exposure factor because LM has significantly higher car use than GM and very significantly more than the Swedish cities. Again, fatalities in urban transport in more developed cities have been on a downward trajectory for many years, and the results here for GM and LM bear evidence of this. A challenge for both cities is to safely increase their cycling use without increasing transport deaths.
5.2. Policy Implications
The foregoing results suggest the need for a wide range of urban planning and transport policies. The following summarises what appears to be needed in these two UK cities based on this study. Each issue is discussed in general, followed by a succinct recommendation, which is then explained.
Urban density: Both metropolitan areas need a focus on increasing densities as urban density is a fundamental determinant of car use. GM’s density fell from 51.6 persons/ha in 1995 to 45.7 in 2005 and 43.8 in 2016 [6,15]. Meanwhile, car use has increased from 5464 PKT/person in 1995 to 6564 in 2005 and 8099 in 2016, a 48% increase in 21 years [6,15]. No density trend data are available for LM, but with an urban density in 2016 of only 27.4 persons/ha, there has likely been a similar trend there, culminating in very high car use of 11,654 PKT/person. This contrasts with stabilising or even slightly increasing urban densities in many cities over a similar period [6,9] due to conscious policies to try to curb urban sprawl and redevelop existing urban land into denser forms.
Recommendation 1: Increase urban densities and mixed land uses. GM and LM need to stop further declines in urban density and to focus urban planning policy on strategically increasing urban densities and mixed land uses especially around public transport, both in a linear form along denser corridors based on light rail and in nodal forms around rail stations. This must be with special attention to quality-of-life issues, especially the public environments, to make sure they encourage greater walking and cycling and have urban design qualities which make the streets beautiful and community oriented and not littered with parking. Improvements in dwelling construction standards to improve energy efficiency and reduce noise are also important.
Job centralisation: Centralisation of work in the CBDs of both metropolitan regions is very low, which is normally associated with less favourable conditions for public transport, walking and cycling.
Recommendation 2: Centralise jobs in the CBD and sub-centres. Both GM and LM should ensure that job growth is focussed in strong mixed-use centres. This means strengthening their CBDs but also creating a strong polycentric urban structure with a majority of workplaces focussed in sub-centres that are situated around high-quality public transport, enabling movement between centres primarily on rail services or rapid bus services [53]. This should include easy orbital movement between sub-centres, not just radial movement. Stockholm, Vancouver and Toronto are models of strong polycentric development which continues to transform these regions into “transit metropolises” [4,49,83]. Within the CBD and sub-centres, the primary concern should be high quality car-free or traffic-calmed streets where most of the movement is on foot and bicycle. This means centres should become magnets to more compact housing and mixed land uses enabling more people to live without a car or with much reduced car use.
Parking: Linked to job centralisation is parking. From an international perspective, GM and LM have only a moderate amount of parking in their CBDs. This means only around 20% to 25% of workers would be able to find a parking space in their CBDs.
Recommendation 3: Further reduce parking in the city centre. Both metropolitan regions should ensure that CBD parking spaces per 1000 CBD jobs should not increase, either through job loss from the areas or through increasing parking as jobs increase or remain stable. This should also apply to sub-centres. Parking can be eliminated by replacing it with residential or other development, as well as attractive public spaces. Increasing the cost of parking can assist in discouraging car use, but it is more critical to restrict supply [56,57].
This policy is both logical and practical because centres would be the main places where car use is not needed because public transport and non-motorised modes would be the most convenient and economical modes of access. This restrictive off-street and on-street parking policy is linked to urban design qualities such as green streetscapes, quality street furniture, attractive paving and creative lighting, fostering a sense of safety, conviviality and overall beauty and liveability of the centres. Without these elements, people are discouraged to live and work there without a car.
Freeways (motorways) and high-capacity roads: Coupled with this need to restrict parking is the need to eliminate construction or widening of new freeways (motorways) and higher capacity roads. Without this, it becomes harder to implement all the other policies aimed at sustainable urban and transport planning because new roads shape the trajectory of nearly everything else in an urban region (e.g., centring land uses becomes more difficult, densities decline, effective public transport is harder to implement and indeed more problematic to fund because of low use).
While GM and LM were relatively moderate in their freeway provision in 2016, the overall policy context in the UK is heavily biased towards large new roads. Currently there is GBP 36 billion earmarked for roads in the UK and efforts by local communities to stop large additions to road capacity have been for the most part unsuccessful [10,84].
Recommendation 4: Stop further freeway (motorway) or other high-capacity road building or widening and consider some selective removal. Within the context of a national policy that is so biased towards cars and road construction, any metropolitan area in the UK should reject arguments concerning favourable benefit–cost ratios based on time-savings and that faster, freer-flowing traffic will save fuel and reduce emissions. The actual effect will be more car driving, more sprawl, more emissions and more energy use [82]. GM and LM already have enough road capacity to function. The challenge is to manage travel demand to match existing road supply, not to constantly increase that supply to meet endless new demand [85]. GM and LM should also consider identifying sections of motorway that might conceivably be torn down as has happened in San Francisco, Montreal, Seoul and other cities to revitalize urban environments [8,86].
Car and motorcycle ownership: GM in 2016 had 444 cars/1000 persons, which was an increase from 372 cars/1000 person in 1995, and LM had a very high 565. Increasing car ownership will lead to more car use if nothing is done to make people less dependent on cars. Increasing car ownership also requires more parking spaces around the metropolitan area. Although motorcycle ownership is currently low in GM and LM, it should also be monitored and not allowed to increase.
Recommendation 5: Limit the growth in car and motorcycle ownership and then reverse it. GM and LM should introduce policies that discourage car ownership firstly by making the need for a car less compelling through the provision of cheaper and much more widespread, better-quality public transport, as well as improved conditions for non-motorised modes, especially bikes (see later). Cities can also reduce the need for car ownership by formal car-sharing as in Bremen, Germany where it has been claimed that for every new car sharing car, ten privately owned cars have been avoided [87] “Car-on-demand” systems such as BMWs Drive Now and Daimler Benz’s Car-2-Go scheme can make the need to buy one’s own car less attractive or cause people to dispose of existing cars. For metropolitan regions that have low GDP per capita, and many people that likely find it hard to own a car, policies to reduce the need for car ownership make good social, equity and economic sense. Similar arguments can apply to reducing the need for motorcycles, which are often symptomatic of an absence or inadequacy of sound alternatives and are the most dangerous form of transport [28,29,31].
Public transport infrastructure: GM and LM have very poor coverage of public transport lines (line length/1000 persons) and more importantly, the reserved public transport route/1000 persons is also very low. This suggests a systematic neglect of the investment needed for more extensive and better-quality public transport.
Again, the context is important. National policy appears to favour investment in roads, and where investments are made in public transport, they can be inappropriate and very expensive. This is the case with the UK’s efforts to build High-Speed Rail (HSR). HS1 linking London with the channel tunnel over a 109.9 km distance, opened in November 2007, cost GBP 5.8 billion to build or GBP 52.8 million/km. HS2 costs are open to debate, especially since the recent cancellation by the UK government of the section north of Birmingham to Manchester, but it appears that the likely cost is of the order of GBP 250 million/km or roughly four times the cost of the original HS1 cost per kilometre. International costs of building HSR average out at around GBP 32 million/km [88].
For the total costs of building HSR in the UK, it would be possible to build hundreds of kilometres of high-quality light rail transit (LRT) or even underground or elevated metro lines in UK cities, and certainly the cost of building bus rapid transit (BRT) lines would be extraordinarily lower.
Recommendation 6: Provide greater public transport coverage and build more reserved public transport route through new rail lines (including light rail transit (LRT) and bus lanes). GM and LM need to offer more extensive public transport systems. Based on comparisons of the extent of urban rail systems in other cities (light rail, metro and suburban rail), this network expansion must include provision of more extensive rail infrastructure, not just more and better serviced bus lines. GM already has a good basis to build upon, as shown in the Victoria light rail stop at the Victoria train station (Figure 36).
Figure 36.
Victoria Metrolink light rail stop, at Victoria rail station in GM, 3 September, 2023. Source: Neil Pulling: copyright permission granted 5 June, 2025.
Cities cannot be expected to fund such investments alone but must rely on national policy to provide a share of the costs. Given the prodigious investment in roads and HSR by the UK government, money per se is not the problem, but rather poorly reasoned public policy that does not recognise the needs of cities or provide the highest overall social benefits from public investment.
Rail systems are not the only way of giving right-of-way priority to public transport. Buses are still the dominant mode in GM and LM, and bus lanes are meagre, so creating effective bus lanes throughout the two regions needs prioritising. This should be achieved by reclaiming road space, not by widening roads to maintain the same capacity for private transport. Unlike rail, this is not a cost issue because bus lanes are cheap to install. It is a political matter involving public policy, and therefore requires a robust and informed political commitment, public education on a significant scale and intelligent public administration. The politics of road space is a minefield of fear-based discontent due most often to unrealistic public expectations of unimpeded private mobility. This has been encouraged by the privileged position of cars in UK cities, essentially during the post-World War II period. Any effort that now challenges this privilege is met with resistance, but must nevertheless be tackled head on if progress is to be made.
Adding reserved public transport alignments to any road corridor and building up a high quality, highly visible and speed-competitive public transport system that transforms streets into dignified urban boulevards is a major step forward in transforming cities. It should give public transport a competitive edge over private transport by enabling people to achieve many of their needs in less time than using a car. Bus lanes or LRT, increase the passenger carrying capacity of any road due to public transport’s ability to move greater numbers of people in much fewer vehicles that require much less road space, produce much less air and noise pollution and have much less negative impact on public spaces in cities.
Public transport service: The level of public transport service provided in GM and LM as measured by vehicle kilometres and seat kilometres of service per person is very low internationally. Furthermore, service provision in GM declined from 1995 to 2016. Since public transport usage and service are correlated, it is important to improve both the VKT provided (which means running more buses and trains) and the capacity offered, which means providing more seat kilometres of service. Trains are best equipped to provide the latter since their vehicles offer much higher seating than buses.
Recommendation 7: Increase the amount of public transport service in GM and LM, especially rail. This means providing more network coverage for buses and rail and increasing frequencies. Both cities especially need to increase their rail offer, since this is particularly poor internationally. A more comprehensive network of rail services is needed, and LRT seems most suited to achieve this, especially in the denser, more built-up parts of their respective regions. High levels of suburban rail service are especially prevalent in Swedish cities, so it seems not unreasonable to provide more in the two UK cities, given that both GM and LM are significantly denser than the Swedish cities.
Public transport use: The very low use of public transport in GM and LM is an outcome of the inadequacies in other critical aspects of their public transport systems. Additionally, in GM, public transport boardings per person declined from 1995 to 2016 from 106 to 100/person [15]. If GM and LM are to develop sustainable transport, radical increases in public transport use are needed.
“Better Buses for Greater Manchester” has noted that since deregulation, fares have doubled in cost in real terms because of a profit driven system (supported by data in this paper), while the bus network has shrunk. At least in GM, there is recognition that something must be done about this. Topham [89,90] reports the recent decision in GM to introduce a “Bee Network” franchise-based bus service which will bring bus services back under public control because the free-market has proven that it cannot deliver the public transport systems cities need (Figure 37). By 2019, London, which was not deregulated, had doubled its bus usage, while Manchester’s had almost been halved [90].
The move to the new system in Manchester was preceded by a GBP 2 capped flat single fare across the region designed to simplify the fare system for users and bus drivers, reduce the cost and increase patronage. The new Bee Network represents a significant departure from the problems of the past which saw buses deregulated across the UK (except London) and in the words of the current Mayor Andy Burnham “deregulation was a disaster for transport in Manchester” [89]. He further stated that: “The deregulated model—it just hands power to the private vested interests. The evidence so far is that franchises per mile are coming out less than tendered services under the old deregulated system. So it’s cheaper.” [89].
Recommendation 8: GM and LM must aim to steadily increase public transport use by reversing public transport deregulation and improving services as detailed above for GM. To achieve this would most likely involve significant across the board investment and change to bring public transport up to continental European standards, perhaps through a “Verkehrsverbund” (transport community) style of organization in both metro areas to control all standards across the systems, as well as providing centralised oversight and control of investment [92]. In parallel with the expected progressive improvement in public transport and steady rise in usage through these “carrot” approaches, some “sticks” should also be carefully introduced to reduce car use through physical means (e.g., more bus lanes and on-street LRT that reduce car lanes, traffic calming schemes etc) and economic restraints (e.g., congestion pricing/charges). Such “sticks” must be introduced judiciously and not designed to punish car users whose dependence on cars has not necessarily been by choice, but rather by poor transport policies and approaches imposed upon them over decades, often nationally inspired. Providing the ability to conveniently and cost-effectively transition from car use to sustainable modes must occur simultaneously.
The costs of public transport: High farebox revenue in the context of comparatively low usage suggests high fares even though the wealth in both metropolitan areas is low and the public transport is poor. GM and LM have the hallmarks of profit-driven rather than user-needs-driven public transport systems. The changes being implemented in GM strongly recognize this problem and are aimed at rectifying it, especially through trying to minimize the cost of fares while creating a much better integrated system that should encourage higher use.
Recommendation 9: The changes being implemented in GM towards a franchised, integrated system of public transport with capped fares and away from the fragmented, deregulated and expensive system of the last decades should be continued and followed by LM and other UK cities. The emphasis on keeping fares as low as possible, improving service and creating an integrated, seamless system which is user-friendly (and better for employees) should increase public transport use and should be encouraged in LM (and other UK cities). Although this will involve costs, it is important to remember that high levels of public transport use provide much greater societal returns than are ever measured in traditional financial accounting (e.g., lower air pollution, less transport-related death and injury, lower health care costs, less noise, more attractive public spaces and indeed a more functional road system due to public transport’s much lower demand for road space).
Non-motorised mode use: The use of walking and cycling in both GM and LM is comparatively healthy compared to auto cities but it is below continental European cities. The bike component is exceptionally low, however (less than 2% of total daily trips), and is a fundamental weakness in the mobility characteristics of both UK cities.
Recommendation 10: Increase the use of non-motorised modes using Freiburg-im-Breisgau as a model of what is possible, where 63% of daily trips are by these modes with a very high contribution from cycling. Achieving this requires a multi-pronged approach involving land use change to increase densities and especially mixed land use and a radical improvement in the public environments to make it much safer and more pleasant for people on foot, but especially by bicycle. The latter requires a comprehensive system of cycleways, bicycle parking, travel behaviour modification methods and other measures to assist people in choosing bikes. E-bikes, which have become extremely popular in continental Europe, can significantly improve the use of bikes for more trips. Overall, the techniques for increasing walking and cycling are well-proven and are not necessary to repeat in detail here [93].
Car use: The overall aim of all the above recommendations is to reduce car use. Both GM and LM have very significantly higher per capita car use than their peer cities in continental Europe, even approximating or exceeding car use in Canadian cities and in the case of LM, close to Australian average car use per person in 2005.
Recommendation 11: GM and LM need to use every available land use planning tool and transport policy change suggested here to create the synergies needed to replace as many car trips as possible with public transport, walking and cycling. Adding one person-kilometre by public transport replaces multiple person-kilometres by car through the transit leverage effect, which is a multiplier effect [5,94]. Public transport users exploit “trip chaining” where during one public transport journey, they often achieve multiple purposes such as shopping, personal business, etc., which is otherwise achieved in multiple car trips.
6. Conclusions
This study has collected a wide-ranging set of data for Greater Manchester (GM) and the Leicester Metropolitan Area (LM) covering land use characteristics, wealth and specific public transport economic factors, private and public transport infrastructure and use, non-motorised transport, energy use, emissions and transport fatalities.
It reveals that GM is the better of the two cities in both its land use and transport characteristics but that both urban regions rate very poorly in an international context. This is especially so when compared to peer cities in continental Europe and in particular the Swedish cities, which, although less dense, have lower overall levels of automobile dependence. Indeed, the two UK cities have high per capita car use, exceeding what would be expected based on their reasonably favourable urban density and some other supportive factors. Consistent with this, they also have comparatively poor public transport service and use and the percentage of daily trips by bike is less than 2%, a particularly troubling result given bikes, and especially e-bikes, have the potential to replace many short automobile trips.
A very detailed description and discussion of all the results on a variable-by-variable basis has been provided, culminating with a set of eleven recommendations, which are fully explained and justified in the last section of the paper. The detailed data-based results in this study provide a mirror to reflect on the poor state of urban mobility in GM and LM compared to other cities and can hopefully contribute to sustainable transport in both regions, and indeed provide some guidance or insights for UK cities in general.
Funding
The research on the ten Swedish cities and Freiburg-im-Breisgau was funded through two small research grants from K2: Sweden’s National Knowledge Centre for Collective Mobility (based in Lund, Sweden-https://www.k2centrum.se/en/, accessed on 25 June 2025) and the research on Greater Manchester and the Leicester Metropolitan Area was funded by the Foundation for Integrated Transport (FIT), a grant-making charity (number 1156363) in the UK through a GBP 8000 Fellowship (https://integratedtransport.org.uk/work-we-fund/fellowships, accessed on 25 June 2025).
Data Availability Statement
All data used in this paper are available directly in the paper in tables and figures. There are no additional data.
Acknowledgments
The author wishes to sincerely thank the Foundation for Integrated Transport in the UK for their generous funding of the research on Greater Manchester and the Leicester Metropolitan Area through their Fellowship programme. I am especially grateful to Madeleine Roberts, the Executive Secretary and Grants Manager, who was always brilliant and clear in her communications and her support in the practical matters concerning the grant. Thanks also must go to the many people in both UK national and local governments who gave generously of their time to provide answers to my many emails requesting assistance with data. I want to also thank some rail enthusiasts in the UK who pointed me in good directions for rail information which I could not find myself, and Neil Pulling for providing two photos for the paper, with permission to use them. Without all this help from many people this research would not have been possible. Finally, thanks also go to K2: Sweden’s National Knowledge Centre for Collective Mobility for funds supporting the research on Swedish cities and Freiburg-im-Breisgau, which forms an integral part of this paper.
Conflicts of Interest
The author declares no conflicts of interest. The funders had no role in the design of the study; in the collection, analyses, or interpretation of data; in the writing of the manuscript; or in the decision to publish the results.
Appendix A
Figures containing all data in the paper.
Figure A1.
Land use, GDP and private transport infrastructure characteristics for UK cities (2016), Swedish cities (2015), Freiburg (2015) and global cities (2005–6).
Notes for Figure A1: 1. In this figure and all subsequent figures, Manchester refers to Greater Manchester and Leicester refers to the Leicester Metropolitan Area, as defined in the methodology above. 2. Note that the GDP refers to the British GVA (Gross Value Added), which for all intents and purposes is almost the same. GM’s GDP is for 2016 and for LM it is for 2015 because of difficulties in compiling it. 3. The currency conversion uses the IMF’s Standard Drawing Right or SDR available at Exchange Rate Archives by Month (imf.org) (accessed on 30 September 2023) for the last financial day of each year (as was used in all currency conversions) and then deflated to 1995 USD using Convert Current to Real US Dollars | Using the GDP Deflator (areppim.com) (accessed on 30 September 2023). 4. The GBP was much stronger in 2015 (SDR conversion to USD was 1.4819 USD per GBP with a deflator of 0.69) than in 2016 when the conversion was 1.2302 and a deflator to 1995 USD of 0.68. In each case, the correct populations were used for per capita calculations (2016 for GM and 2015 for LM).
Figure A2.
Public transport infrastructure and service characteristics for UK cities (2016), Swedish cities (2015), Freiburg (2015) and global cities (2005–6).
Figure A3.
Public transport use characteristics for UK cities (2016), Swedish cities (2015), Freiburg (2015) and global cities (2005–6).
Figure A4.
Car and motorcycle use and daily modal split characteristics for UK cities (2016), Swedish cities (2015), Freiburg (2015) and global cities (2005–6).
Figure A5.
Private–public transport balance characteristics for UK cities (2016), Swedish cities (2015), Freiburg (2015) and global cities (2005–6).
Figure A6.
Transport outcomes in energy, emissions and fatalities for UK cities (2016), Swedish cities (2015), Freiburg (2015) and global cities (2005–6).
References
- Jacobs, J. The Death and Life of Great American Cities; Vintage: New York, NY, USA, 1961. [Google Scholar]
- Mumford, L. The City in History; Penguin Press: London, UK, 1961. [Google Scholar]
- Schneider, K. On the Nature of Cities: Towards Creative and Enduring Human Environments; Jossey-Bass Publishers: San Francisco, CA, USA, 1979. [Google Scholar]
- Cervero, R. The Transit Metropolis: A Global Inquiry; Island Press: Washington, DC, USA, 1998. [Google Scholar]
- Newman, P.W.G.; Kenworthy, J.R. Sustainability and Cities: Overcoming Automobile Dependence; Island Press: Washington, DC, USA, 1999; 442p. [Google Scholar]
- Newman, P.; Kenworthy, J. The End of Automobile Dependence: How Cities are Moving Away from Car-Based Planning; Island Press: Washington, DC, USA, 2015; 273p. [Google Scholar]
- United Nations. United Nations Sustainable Development Goals. Goal 11; United Nations, Department of Economic and Social Affairs: New York, NY, USA, 2024; Available online: https://sdgs.un.org/goals (accessed on 13 October 2024).
- Congress for the New Urbanism. Freeways Without Futures: The Top Highways to Boulevards Campaigns in North America; Congress for the New Urbanism: Washington, DC, USA, 2025; Available online: https://www.cnu.org/sites/default/files/FWF_2025%20FINAL.pdf (accessed on 6 June 2025).
- Schiller, P.L.; Kenworthy, J.R. An Introduction to Sustainable Transportation: Policy, Planning and Implementation; Routledge: New York, NY, USA, 2018. [Google Scholar]
- Whitelegg, J. Mobility: A New Urban Design and Transport Planning Philosophy for a Sustainable Future; Straw Barnes Press: Church Stretton, UK, 2015. [Google Scholar]
- Whitelegg, J.; Haq, G. The Earthscan Reader on World Transport Policy and Practice; Earthscan: Abingdon, UK, 2003. [Google Scholar]
- Wen, L.; Kenworthy, J.; Marinova, D. Higher Density Environments and the Critical Role of City Streets as Public Open Spaces. Sustainability 2020, 12, 8896. [Google Scholar] [CrossRef]
- Newman, P.W.G.; Kenworthy, J.R. Cities and Automobile Dependence: An International Sourcebook; Gower: Aldershot, UK, 1989; 388p. [Google Scholar]
- Kenworthy, J.R.; Laube, F.B. An International Sourcebook of Automobile Dependence in Cities, 1960-1990; University Press of Colorado: Boulder, CO, USA, 1999; 704p. [Google Scholar]
- Kenworthy, J.; Laube, F. The Millennium Cities Database for Sustainable Transport; Institute for Science and Technology Policy, Murdoch University, Perth and The International Association for Public Transport (UITP): Brussels, Belgium, 2001. [Google Scholar]
- Kenworthy, J.R. Urban Transport and Eco-Urbanism: A Global Comparative Study of Cities with a Special Focus on Five Larger Swedish Urban Regions. Urban Sci. 2019, 3, 25. [Google Scholar] [CrossRef]
- Kenworthy, J. Passenger Transport Energy Use in Ten Swedish Cities: Understanding the Differences Through a Comparative Review. Energies 2020, 13, 3719. [Google Scholar] [CrossRef]
- Kenworthy, J.R.; Svensson, H. Exploring the energy saving potential in private, public and non-motorized transport for ten Swedish cities. Sustainability 2022, 14, 954. [Google Scholar] [CrossRef]
- Federal Highway Administration. History of the Interstate Highway System. United States Department of Transportation. 2025. Available online: https://highways.dot.gov/highway-history/interstate-system/50th-anniversary/history-interstate-highway-system (accessed on 11 May 2025).
- Klein, J.; Olson, M. Taken for a Ride, New Day Films. 1996. Available online: https://www.newday.com/films/taken-for-a-ride (accessed on 19 August 2025).
- Newman, P.; Kosonen, L.; Kenworthy, J. Theory of urban fabrics: Planning the walking, transit/public transport and automobile/motor car cities for reduced car dependency. Town Plan. Rev. 2016, 87, 429–458. [Google Scholar]
- Teplanova, K. Benchmarking Methodology. South East Europe Transnational Cooperation Programme. Project Title SEE Science, Project Number SEE/B/0048/1.3/X. 2012. Available online: https://www.cvtisr.sk/buxus/docs/SEE_Science/Benchmarking_methodology.pdf (accessed on 25 May 2025).
- Newman, P.W.G.; Kenworthy, J.R. Gasoline consumption and cities: A comparison of US cities with a global survey and its implications. J. Am. Plan. Assoc. 1989, 55, 24–37. [Google Scholar]
- Kenworthy, J.; Laube, F.B.; Newman, P.W.G.; Barter, P.A. Indicators of Transport Efficiency in 37 Global Cities; A Report for the World Bank, ISTP; Murdoch University: Perth, Australia, 1997. [Google Scholar]
- Newman, P.; Kenworthy, J. Public and private transport in Australian cities: I. An analysis of existing patterns and their energy implications. Transp. Policy Decis. Mak. 1980, 1, 133–148. [Google Scholar]
- Newman, P.; Kenworthy, J. Public and private transport in Australian cities: II. The potential for energy conservation through land use change. Transp. Policy Decis. Mak. 1980, 1, 149–167. [Google Scholar]
- Newman, P.W.G.; Kenworthy, J.R. Towards a More Sustainable Canberra: An Assessment of Canberra’s Transport, Energy and Land Use; Institute for Science and Technology Policy, Murdoch University: Perth, Australia, 1991; 157p. [Google Scholar]
- Poboon, C. Anatomy of a Traffic Disaster: Towards a Sustainable Solution to Bangkok’s Transport Problems. Ph.D. Dissertation, Murdoch University, Perth, Australia, 1998. [Google Scholar]
- Barter, P. An International Comparative Perspective on Urban Transport and Urban Form in Pacific Asia: Responses to The Challenge of Motorisation in Dense Cities. Ph.D. Dissertation, Murdoch University, Perth, Australia, 1999. [Google Scholar]
- Laube, F.B. Optimising Urban Passenger Transport: Developing a Least-Cost Model Based on International Comparisons of Urban Transport Costs, Transport Patterns, Land Use, Infrastructure, Environment and Best Practice in Public Transport. Ph.D. Dissertation, Murdoch University, Perth, Australia, 1998. [Google Scholar]
- Kenworthy, J.R. Is Automobile Dependence in Emerging Cities an Irresistible Force? Perspectives from São Paulo, Taipei, Prague, Mumbai, Shanghai, Beijing and Guangzhou. Sustainability 2017, 9, 1953. [Google Scholar] [CrossRef]
- Gudmundsson, H.; Wyatt, A.; Gordon, L. Benchmarking and Sustainable Transport Policy: Learning from the BEST Network. Transport Reviews. Transp. Energy Use Sustain. 2005, 25, 669–690. [Google Scholar] [CrossRef]
- de Freitas Miranda, H.; da Silva Rodrigues, A.N. Benchmarking sustainable urban mobility: The case of Curitiba, Brazil. Transp. Policy 2012, 21, 141–151. [Google Scholar] [CrossRef]
- da Silva, A.N.R.; de Azevedo Filho, M.A.N.; Macêdo, M.H.; Sorratini, J.A.; da Silva, A.F.; Lima, J.P.; Pinheiro, A.M.G.S. A comparative evaluation of mobility conditions in selected cities of the five Brazilian regions. Transp. Policy 2015, 37, 147–156. [Google Scholar] [CrossRef]
- Matsunaka, R.; Oba, T.; Nakagawa, D.; Nagao, M.; Nawrocki, J. International comparison of the relationship between urban structure and the service level on urban public transportation: A comprehensive analysis of local cities in Japan, France and Germany. Transp. Policy 2013, 30, 26–39. [Google Scholar] [CrossRef]
- De Gruyter, C.; Currie, G.; Rose, G. Sustainability measures of urban public transport in cities: A world review and focus on the Asia/Middle East Region. Sustainability 2017, 9, 43. [Google Scholar] [CrossRef]
- Hajduk, S. Assessment of urban transport: A comparative analysis of selected cities by taxonomic methods. Econ. Manag. 2016, 8, 67–74. [Google Scholar] [CrossRef][Green Version]
- Stone, J.; Mees, P.; Imran, M. Benchmarking the efficiency and effectiveness of public transport in New Zealand cities. Urban Policy Res. 2011, 30, 207–224. [Google Scholar] [CrossRef]
- Zito, P.; Salvo, G. Towards an urban transport sustainability index: An European Comparison. Eur. Transp. Res. Rev. 2011, 3, 179–195. [Google Scholar] [CrossRef]
- Alonso, A.; Monzón, A.; Cascajo, R. Comparative analysis of passenger transport sustainability in European cities. Ecol. Indic. 2015, 48, 578–592. [Google Scholar] [CrossRef]
- Bratzel, S. Conditions of success in sustainable urban transport policy success: Policy change in “relatively successful European cities. Transp. Rev. 1999, 19, 177–190. [Google Scholar] [CrossRef]
- Lowe, M.; Adlakha, D.; Sallis, J.F.; Salvo, D.; Cerin, E.; Moudon, A.V.; Higgs, C.; Hinckson, E.; Arundel, J.; Boeing, G.; et al. City planning policies to support health and sustainability: An international comparison of policy indicators for 25 cities. Lancet Glob. Health 2022, 10, E882–E992. [Google Scholar] [CrossRef]
- Li, W.; Bao, L.; Li, Y.; Si, H.; Li, Y. Assessing the transition to low-carbo urban transport: A global comparison. Resour. Conserv. Recycl. 2022, 180, 106179. [Google Scholar] [CrossRef]
- Tamaki, T.; Nakamura, H.; Fujii, H.; Managi, S. Efficiency and emissions from urban transport: Application to world city-level public transportation. Econ. Anal. Policy 2019, 61, 55–63. [Google Scholar] [CrossRef]
- Gordon, P.; Richardson, H. Gasoline Consumption and Cities: A Reply. J. Am. Plan. Assoc. 1989, 55, 342–346. [Google Scholar] [CrossRef]
- Newman, P.W.G.; Kenworthy, J.R. Is there a role for physical planning? J. Am. Plan. Assoc. 1992, 48, 353–362. [Google Scholar] [CrossRef]
- McIntosh, J.; Trubka, R.; Kenworthy, J.; Newman, P. The role of urban form and transit in city car dependence: Analysis of 26 global cities from 1960–2000. Transp. Res. Part D Transp. Environ. 2014, 33, 95–110. [Google Scholar] [CrossRef]
- Lewis, S.; Grande del Valle, E. San Francisco’s neighborhoods and auto dependency. Cities 2019, 86, 11–24. [Google Scholar] [CrossRef]
- Cervero, R. Sustainable new towns: Stockholm’s rail served satellites. Cities 1995, 12, 41–51. [Google Scholar] [CrossRef]
- Goldberg, M.; Mercer, J. The Myth of the North American City: Continentalism Challenged; UBC Press: Vancouver, BC, Canada, 1986. [Google Scholar]
- Cervero, R. Urban Transit in Canada: Innovation and Integration at its Best. Transp. Q. 1986, 40, 293–316. [Google Scholar]
- Thomson, J.M. Great Cities and Their Traffic; Penguin Books: Middlesex, UK, 1977. [Google Scholar]
- Kenworthy, J. Urban Structure and its Impact on Mobility Patterns: Reducing Automobile Dependence through Polycentrism. In The Palgrave Encyclopedia of Urban and Regional Futures; Brears, R., Ed.; Springer Nature: Cham, Switzerland, 2021. [Google Scholar] [CrossRef]
- Watt, K.E.F.; Ayres, C. Urban land use patterns and transportation energy cost. In Proceedings of the 140th Annual Meeting of the American Association for the Advancement of Science (AAAS), San Francisco, CA, USA, 25 February 1974. [Google Scholar]
- Perl, A.; Hern, M.; Kenworthy, J. Big Moves: Global Agendas, Local Aspirations and Urban Mobility in Canada. Studies in Urban Governance Series; McGill-Queen’s University Press: Montreal, QC, Canada, 2020. [Google Scholar]
- Shoup, D. The High Cost of Free Parking; Routledge: New York, NY, USA, 2011. [Google Scholar]
- Shoup, D. Parking and the City; Routledge: New York, NY, USA, 2018. [Google Scholar]
- Newman, P.; Kenworthy, J. ‘Relative speed’ not ‘time savings’: A new indicator for sustainable transport. In Proceedings of the 23rd Australasian Transport Research Forum, Perth, Australia, 29 September–1 October 1999; pp. 425–440. [Google Scholar]
- Litman, T. Evaluating rail transit benefits: A comment. Transp. Policy 2007, 14, 94–97. [Google Scholar] [CrossRef]
- Kenworthy, J. An international review of the significance of rail in developing more sustainable urban transport systems in higher income cities. World Transp. Policy Pract. 2008, 14, 21–37. [Google Scholar]
- Hass-Klau, C.; Crampton, G. Future of Urban Transport Learning from Success and Weakness: Light Rail; Environmental and Transport Planning: Brighton, UK, 2002. [Google Scholar]
- Hass-Klau, C.; Crampton, G.; Benjari, R. Economic Impact of Light Rail: The Results of 15 Urban Areas in France, Germany, UK and North America; Environmental and Transport Planning: Brighton, UK, 2004. [Google Scholar]
- Hass-Klau, C.; Crampton, G.; Biereth, C.; Deutsch, V. Bus or Light Rail: Making the Right Choice—A Financial, Operational and Demand Comparison of Light Rail, Guided Buses, Busways and Bus Lanes; Environmental and Transport Planning: Brighton, UK, 2003. [Google Scholar]
- Kenworthy, J.R. Chapter 3: The good, the bad and the ugly in urban transport: Comparing global cities for dependence on the automobile. In Methods for Sustainability Research; Hartz-Karp, J., Marinova, D., Eds.; Edward Elgar Publishing: Cheltenham, UK, 2017; pp. 46–62. [Google Scholar]
- Kenworthy, J. Chapter 5: Trends in Transport and Urban Development in Thirty-Three International Cities, 1995-6 to 2005-6: Some Prospects for Lower Carbon Transport. In Low Carbon Cities: Transforming Urban Systems; Lehmann, S., Ed.; Routledge: London, UK, 2014; pp. 113–130. [Google Scholar]
- Jauregui-Fung, F.; Kenworthy, J.; Almaaroufi, S.; Pulido-Castro, N.; Pereira, S.; Golda-Pongratz, K. Anatomy of an Informal Transit City: Mobility Analysis of the Metropolitan Area of Lima. Urban Sci. 2019, 3, 67. [Google Scholar] [CrossRef]
- Linares-Rendon, F.; Garrido-Cumbrera, M. Impact of the COVID-19 Pandemic on Urban Mobility: A Systematic Review of the Existing Literature. J. Transp. Health 2021, 22, 101225. [Google Scholar] [CrossRef]
- Australian Bureau of Statistics. Survey of Motor Vehicle Use, Australia; Australian Bureau of Statistics: Canberra, Australia, 2020. Available online: https://www.abs.gov.au/statistics/industry/tourism-and-transport/survey-motor-vehicle-use-australia/latest-release (accessed on 19 August 2025).
- Macrotrends. 2025. Available online: www.macrotrends.net/global-metrics/cities/22862/manchester/population (accessed on 11 May 2025).
- World Population Review. Leicester Population 2025. Available online: https://worldpopulationreview.com/cities/united-kingdom/leicester (accessed on 5 September 2025).
- Varbes. Population of Leicestershire. 2025. Available online: https://www.varbes.com/population/leicestershire-population (accessed on 19 August 2025).
- JHamez84. Map of Greater Manchester. 2025. Available online: https://commons.wikimedia.org/wiki/File:Greater_Manchester_County.svg (accessed on 5 September 2025).
- Nilfanion. Greater Manchester Locator Map. 2025. Available online: https://commons.wikimedia.org/wiki/File:Greater_Manchester_UK_locator_map_2010.svg (accessed on 5 September 2025).
- Nilfanion. Map of the Leicester Metropolitan Area and its Location in the UK (The Large City of Leicester is Situated in the Middle). Ordnance Survey OpenData. 2025. Available online: https://commons.wikimedia.org/wiki/File:Leicestershire_UK_parish_map_(blank).svg (accessed on 5 September 2025).
- Hilton, N.J. 2025. Available online: https://www.pexels.com/photo/urban-tram-at-salford-quays-station-during-sunset-30675768/ (accessed on 4 June 2025).
- Dixon, D. Integration Between Suburban Rail and Light Rail in Manchester. 2025. Available online: https://commons.wikimedia.org/wiki/File:Manchester_Victoria_Station_Tram_Platforms_(December_2015)_-_geograph.org.uk_-_4763752.jpg (accessed on 5 September 2025).
- Anonymous. Buses in Oxford Road, Manchester (Creative Commons 4.0 International License). 2025. Available online: https://commons.wikimedia.org/wiki/File:Manchester_Oxford_Road_buses_(1).jpg (accessed on 5 September 2025).
- Law, J. Leicester Bus. Leics—Thurmaston Bus b870dom Leicester 26-7-11 JL|Flickr. 2025. Available online: https://www.flickr.com/photos/johnmightycat/5984885004/in/photolist-5F7T4t-5FcjLw-5Fc6RJ-5Fcq8A-5Fc9Rw-acNTaM-a7S6Nu-5F81je-eCNmQ2-wq5t8Y-D8WeXP-8QPipB-npqzEc-acNTfg-7ussou-9K4GXq-ag5v7s-dhUSJE-HXwsLa-95SCoe-aMmq2n-Ky3LjS-aMmpiV-JQVX3w-bAU51c-D1Ek8D-acRGKE-acNSTX-Jt2VAN-95SCri-Jt48Pd-bdgGDR-FB1ZqJ-G7nkYQ-d7TVXA-d7U1ML-K3QuKM-a7VApC-bnZeYL-dDjwbu-JLWcqD-95VEtj-9DDqEP-d7TW69-a7VApJ-D6C2wq-ag2KuR-aMmon2-95SCk2-9K1SrZ (accessed on 5 September 2025).
- Kris1973. Leicester’s Haymarket Bus Station. 2025. Available online: https://commons.wikimedia.org/wiki/File:Dworzec_autobusowy_Haymarket.jpg (accessed on 5 September 2025).
- Joieman. Rear of Haymarket Bus Station, Leicester. 2025. Available online: https://commons.wikimedia.org/wiki/File:Haymarket_Bus_Station,_Leicester.jpg (accessed on 5 September 2025).
- Eveby, S.; Håkansson, M. Vision Zero: Revisiting What Sweden Means By Vision Zero and How Do We Get There? World Transp. Policy Pract. 2024, 29, 13–25. [Google Scholar]
- Newman, P.W.G.; Kenworthy, J.R. The transport energy trade-off: Fuel-efficient traffic versus fuel-efficient cities. Transp. Res. Part A Gen. 1988, 22, 163–174. [Google Scholar] [CrossRef]
- Punter, J. The Vancouver Achievement: Urban Planning and Design; UBC Press: Vancouver, BC, Canada, 2003. [Google Scholar]
- Whitelegg, J. (Emeritus Professor, Lancaster University, Lancaster, Lancashire, UK). Personal communication, 2023.
- Goodwin, P. Solving Congestion (When We Must Not Build Roads, Increase Spending, Lose Votes, Damage the Economy, Harm the Environment and will Never Find Equilibrium): Inaugural Lecture for the Professorship of Transport Policy [Online]. London University College. 1997. Available online: http://discovery.ucl.ac.uk/1244/1/2004_22.pdf (accessed on 22 July 2025).
- Fettig, T. Seoul: The Stream of Consciousness. e2—Series Documentary, Transport, Episode 4; Public Broadcasting Service: Arlington, VA, USA, 2008. [Google Scholar]
- Glotz-Richter, M. (Consultant for Sustainable Mobility, Bremen, Germany). Personal communication, 2012.
- Topham, G. Why has HS2 ended up being so expensive. The Guardian, 25 September 2023. [Google Scholar]
- Topham, G. Greater Manchester jumps onboard the franchise route to better buses. The Guardian, 16 September 2023. [Google Scholar]
- Topham, G. Manchester to launch ‘revolutionary’ Bee Network public bus system. The Guardian, 23 September 2023. [Google Scholar]
- Hullian OneEleven. Bee Network Bus Operating in Manchester Under Public Control. 2025. Available online: https://commons.wikimedia.org/wiki/File:Stagecoach_Manchester_80096_-_SK74_BHU.jpg (accessed on 5 September 2025).
- Buehler, R.; Pucher, J.; Dümmler, O. Verkehrsverbund: The evolution and spread of fully integrated regional public transport in Germany, Austria, and Switzerland. Int. J. Sustain. Transp. 2018, 13, 36–50. [Google Scholar] [CrossRef]
- Buehler, R.; Pucher, J.; Gerikee, R.; Götschi, T. Reducing car dependence in the heart of Europe: Lessons from Germany, Austria, and Switzerland. Transp. Rev. 2016, 37, 4–28. [Google Scholar] [CrossRef]
- Neff, J.W. Substitution rates between transit and car travel. In Proceedings of the Annual Meeting of the Association of American Geographers (AAG), Charlotte, NC, USA, 9–13 April 1996. [Google Scholar]
Disclaimer/Publisher’s Note: The statements, opinions and data contained in all publications are solely those of the individual author(s) and contributor(s) and not of MDPI and/or the editor(s). MDPI and/or the editor(s) disclaim responsibility for any injury to people or property resulting from any ideas, methods, instructions or products referred to in the content. |
© 2025 by the author. Licensee MDPI, Basel, Switzerland. This article is an open access article distributed under the terms and conditions of the Creative Commons Attribution (CC BY) license (https://creativecommons.org/licenses/by/4.0/).