


Abstract
Gut microbiome research turns sequencing reads into taxa and functions by matching them against a reference database of isolate and metagenome-assembled genomes. That database is the measuring instrument, yet its sensitivity is never reported. Reference incompleteness is therefore not a computational nuisance but a measurement bias; because the gaps are geographically structured, it behaves as differential misclassification rather than random error. The magnitudes are substantial. On identical data, the share of reads receiving a taxonomic assignment runs from 44% to 94.5% depending only on whether a standard Kraken2 database, UHGG, or a gut-specific catalog is used; missing genomes are enriched in non-Westernized populations. Formally, expected observed richness is true richness multiplied by population-specific coverage, so comparing two populations estimates the true ratio times the ratio of their coverages, a second term no study reports. In a simulation, a 5-percentage-point coverage gap raises the false-positive rate for a between-population richness comparison to 55%, a proof-of-concept rather than a real-world estimate. Reference bias distorts between-population comparisons in a determinate direction rather than simply blurring them and does so invisibly: batch correction leaves it untouched and quality control never sees it. We distinguish it from sampling bias, batch effects, and non-differential misclassification, and propose Minimum Information for Reference Reporting (MIRR).
1. Introduction
Every quantitative statement about the human gut microbiome rests on an inference step that is rarely examined. Sequencing produces reads; reads become taxa and functions only after comparison against a reference collection of genomes or genes. The reference is therefore not a passive lookup table. It is a measuring instrument, and like any instrument it has a calibration, a sensitivity range, and blind spots. Unlike most instruments in biology, its blind spots are neither characterized nor reported.
This review advances a single claim: reference incompleteness in human gut metagenomics is better understood as a measurement bias than as a computational inconvenience, and that because this incompleteness is geographically structured, we propose it should be treated as differential misclassification rather than as random error. The distinction is not semantic. Random error attenuates estimates and weakens power; it does not manufacture differences between groups. Error correlated with group membership can and does.
The empirical basis for the claim has two parts. First, the reference collections in general use are large but demonstrably incomplete. The Unified Human Gastrointestinal Genome (UHGG) collection assembled 204,938 non-redundant genomes spanning 4644 gut prokaryotic species, yet more than 70% of those species lack a cultured representative and 40% of the associated protein catalog lacks functional annotation [1]. Earlier blueprints assembled from uncultivated genomes had already indicated how much diversity sits outside cultivation [2,3]. Second, the missing fraction is not randomly distributed. A reconstruction of 154,723 genomes from 9428 metagenomes recovered 4930 species-level genome bins (SGBs), of which 77% had no genome in public repositories at the time; those unknown SGBs were enriched in non-Westernized populations [4]. Ultra-deep sequencing of Hadza hunter-gatherers and comparison populations later recovered 91,662 genomes, 44% of them absent from existing unified datasets [5].
Placed together, these observations produce a measurement problem rather than a coverage problem. If a substantial fraction of gut microbial diversity is missing from reference catalogs, and the missing fraction is concentrated in particular human populations, then the sensitivity of microbiome measurement varies systematically with the geographic origin of the sample. If this reasoning holds, comparisons between populations confound biological difference with differential instrument performance and do so in a direction predictable in advance.
The consequence is a self-reinforcing loop. Under-sampled populations contribute few genomes to reference catalogs; catalogs therefore represent those populations poorly; studies of those populations return lower mappability, lower apparent diversity, and weaker functional signal; and the resulting impression that less is to be found there does nothing to redirect sampling effort. Database dependence in metagenomic profiling is itself well-documented. Benchmarking studies have shown repeatedly that classifier and database choice alter both the proportion of reads assigned and the set of taxa recovered [6,7,8,9], the unknown fraction of the microbiome has been characterized at several levels [10], and recent work documents the representational imbalance in the literature together with its computational consequences [11]. What that body of work establishes is that the reference matters. What it does not do is specify the structure of the resulting error. That specification is the contribution here: because catalog incompleteness is correlated with the geographic origin of the sample, the error is not random with respect to the comparison being made. This places it in a different class from the database dependence already described, namely differential rather than non-differential misclassification, and the two classes carry different consequences and require different remedies. What has not previously been articulated is a measurement framework that treats the reference catalog as an instrument with population-dependent sensitivity and derives what follows from that.
Section 3 characterizes what the catalogs contain and, more importantly, what they disclose about their own provenance. Section 4 quantifies the dependence of measurement on reference choice. Section 5, the analytical core, formalizes reference bias in epidemiological terms and distinguishes it from the error structures with which it is routinely conflated. Section 6 traces the resulting cascade from catalog composition through to biological conclusion. Section 7 and Section 8 examine the geographic pattern in practice and propose a reporting standard intended to make the bias visible.
2. Scope and Approach to the Literature
This is a narrative critical review rather than a systematic review, and it does not claim systematic coverage. Studies were identified through keyword searches of PubMed, Google Scholar, and Scopus combining terms for gut metagenomics (“gut microbiome”, “gut metagenome”, “faecal metagenome”) with terms for reference resources (“reference genome”, “reference database”, “metagenome-assembled genome”, “genome catalog”, “mappability”, “classification rate”) and terms for representation (“bias”, “under-represented”, “non-Western”, “population”, “geography”). This was supplemented by backward and forward citation chasing from the principal catalog publications. Searches were run to July 2026 and restricted to English-language publications. Preprints were eligible and are identified as such.
Because the review’s central claims are quantitative, numerical statements are limited to figures reported directly in the cited sources, and we indicate throughout where the underlying data are not publicly broken down in a form that permits comparison. This absence is itself one of the review’s findings.
3. What the Reference Catalogs Contain, and What They Disclose
3.1. Four Routes to a Reference Catalog
Reference resources for the human gut have developed along two converging routes. The first is cultivation. The Culturable Genome Reference presented 1520 non-redundant high-quality draft genomes generated from more than 6000 bacteria cultivated from the feces of healthy humans, of which 264 were absent from existing reference catalogs [12]. A companion culture collection released the same year pursued the same objective by different means [13], following earlier work showing that organisms long described as unculturable could in fact be grown under suitable conditions [14], and that systematic culturomics could materially expand the catalog of isolated human-associated species [15]. Curated isolate libraries paired with longitudinal multi-omic data extend the same logic toward mechanistic experimentation [16]. A later release extended cultivated coverage to 527 species across eight phyla, including 179 not previously identified [17].
The second route is assembly directly from metagenomes. Metagenome-assembled genomes (MAGs) sidestep the cultivation bottleneck and have driven the recent expansion in catalog size. The reconstruction of 154,723 genomes from 9428 metagenomes established 4930 SGBs and demonstrated that unknown SGBs were present in 93% of well-assembled samples [4]. UHGG subsequently unified isolate and MAG-derived genomes into 204,938 non-redundant genomes representing 4644 species, with a protein catalog exceeding 170 million sequences [1]. Comparable catalogs have since been produced for early-life cohorts [17] and specific regional populations [18], and the methodology has been applied to non-human hosts [19,20]. Single-cell approaches recover strain-resolved genomes that assembly alone tends to collapse [21]. Minimum quality standards for reporting such genomes are codified in the MIMAG criteria [22].
A third strategy curates by prevalence rather than accumulation. HumGut screened more than 5700 healthy human gut metagenomes against over 490,000 publicly available prokaryotic genomes, retaining and ranking those actually observed in human gut data, and clustering the survivors into 30,691 representatives [23]. This inverts the usual logic: rather than asking what genomes exist, it asks which genomes the human gut actually contains.
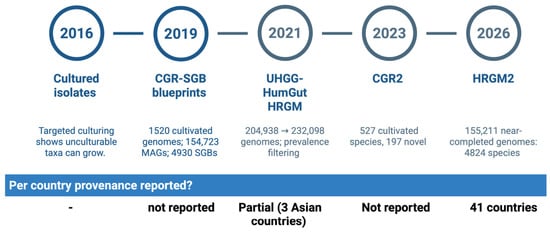
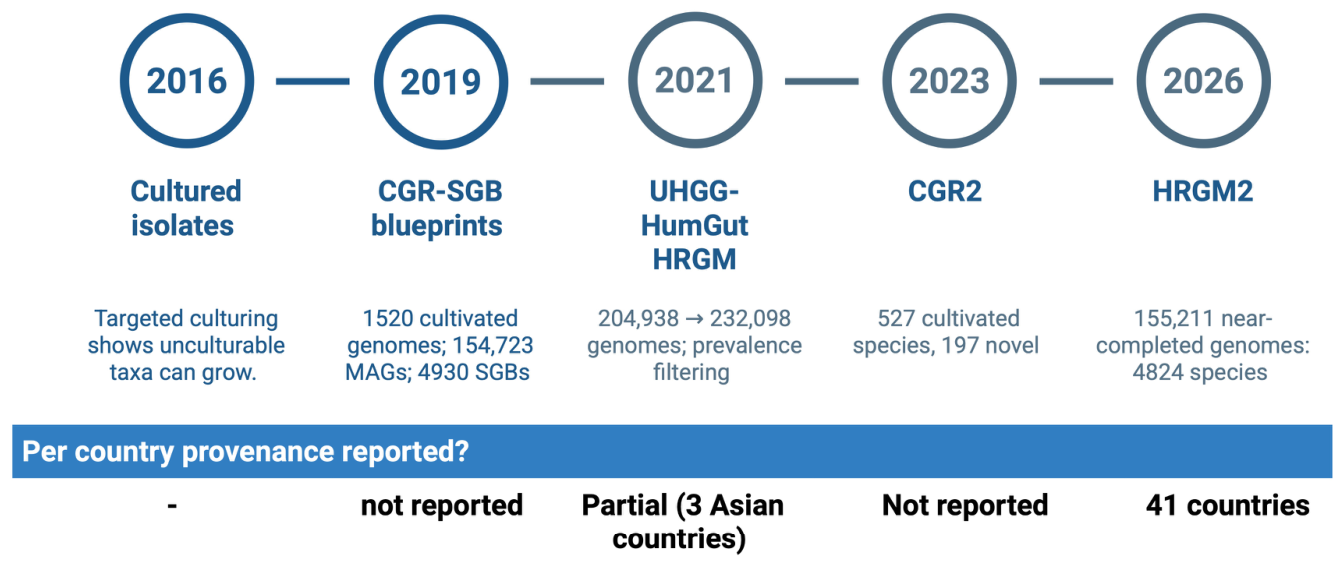
Efforts explicitly framed as corrections to geographic imbalance form a fourth strand. The Human Reference Gut Microbiome (HRGM) assembled 29,082 new genomes from 845 fecal samples collected in Korea, India, and Japan, yielding 232,098 non-redundant genomes representing 5414 species including 780 novel species, an increase in more than 10% over the largest prior database [24]. Its opening premise is worth stating directly: metagenome sampling bias for geographical location and lifestyle is partially responsible for the incomplete catalog of reference genomes [24]. Its successor, HRGM2, extended assembly across 41 countries to yield 155,211 non-redundant near-complete genomes representing 4824 species, reported as a 66% increase in genome count and a 50% increase in species diversity relative to UHGG [25]. Because HRGM2 applies a near-complete quality threshold, its genome count is not directly comparable with catalogs admitting lower-quality assemblies. Long-read sequencing expands recoverable diversity further still [26]. Figure 1 places these developments on a common timeline, together with whether each publication reports the geographic provenance of its genomes.
Figure 1.
A decade of catalog growth without a decade of provenance reporting. Principal human gut reference resources placed on a common timeline, with the scale of each release and, below, whether the publication reports per-country sample or genome contributions in an extractable form. Teal markers denote resources built wholly or partly from metagenome-assembled genomes; amber markers denote cultivation-based resources. Genome counts rose by roughly two orders of magnitude between 2016 and 2026, while machine-readable reporting of contributing countries appeared only at the end of that period. This figure is a schematic summary of published catalog characteristics. The horizontal axis denotes year of release and is not to scale. (Created in BioRender.com).
3.2. The Disclosure Gap
The headline totals conceal two persistent gaps. The first is taxonomic and functional darkness within the catalogs themselves. More than 70% of UHGG species have no cultured representative, and 40% of the UHGP protein catalog carries no functional annotation [1]. Species can therefore be counted without being understood, and a read can be assigned to a genome whose biology is unknown. This is one of several levels at which the unknown operates in microbiome research [10], and it persists even as systematic taxonomic frameworks expand [27].
The second gap is not in the catalogs but in what they disclose. Table 1 summarizes the principal resources. What the table cannot show, because the source publications do not consistently report it in extractable form, is the number of samples contributed by each country to each catalog. This absence is the pivot of the present argument. A catalog that does not publish its own geographic provenance cannot be audited for representativeness by the researchers who depend on it; more consequentially, no individual study can determine whether the instrument it is using is well-calibrated for the populations it is measuring. Reporting standards exist for genome quality [22]; no equivalent convention governs provenance.
Table 1.
Principal human gut reference genome catalogs. Figures are as reported in the cited source publications. “Geographic provenance” indicates whether the publication reports per-country sample or genome contributions in a form permitting direct comparison across catalogs. MAG, metagenome-assembled genome; SGB, species-level genome bin.
4. Reference Choice Determines the Measurement
4.1. Classification Rate Varies by Tens of Percentage Points on Identical Data
The dependence of results on reference choice is not subtle. Using Kraken2 for classification, HumGut assigned on average 94.5% of reads in a metagenome, compared with 86% using UHGG and 44% using the standard Kraken2 database; a coarser HumGut collection dereplicated at 95% sequence identity classified 88.25% [23]. The same reads, the same software, and the same parameters yield a spread of more than fifty percentage points in the fraction of data receiving any taxonomic label, determined solely by the choice of reference.
This is not an isolated observation. A systematic evaluation of parameter and database choice found large discrepancies both in the proportion of reads classified and in the number of species identified when Kraken2 and MetaPhlAn 3 were applied to human-associated and environmental metagenomes [6]. Dedicated benchmarking studies reach the same conclusion across tools, sequencing platforms, and clinical and environmental applications [7,8,9]; continuous benchmarking platforms exist precisely because the ranking of methods depends on what they are compared against [28]. The growth of RefSeq over time alters the accuracy of k-mer-based species identification, producing different results depending on database version [29], and classification software continues to be revised in ways that shift outcomes [30].
The same dependence appears in amplicon-based work. The choice among Greengenes, SILVA, RDP, and NCBI references alters community descriptions across datasets [31], reference database choice influences recovered core-microbiome structure [32], and the training set used for classification has long been recognized as a determinant of the resulting taxonomy [33]. Database choice significantly biases alignment-based classification in ancient metagenomics [34], and the joint selection of software and database changes community characterization and pathogen detection [35]. Evaluations built on simulated data are themselves sensitive to the reference catalog used to generate the simulation [36], and in silico approaches can misrepresent the complexity of real communities [28]. Running several classifiers in parallel and integrating across them has been proposed as partial mitigation [37], and explicit standards for taxonomic annotation have been argued for on the same grounds [38].
Table 2 collects the quantitative comparisons reported in directly comparable form. The magnitude is the point: an instrument whose reading varies by fifty percentage points according to a choice the analyst makes is not a neutral conduit between sample and result.
Table 2.
Reported effects of reference catalog choice and expansion on metagenomic read assignment, grouped by metric. Values within each block share a common measurement but different classifier, dataset, and catalog version, and should be read as indicating the magnitude of reference dependence rather than directly comparable quantities. Read mappability (a) and proportion of reads (b) are distinct operations and are not interchangeable.
4.2. Expansion Raises Mappability but Does Not Equalize It
Each successive catalog has raised the fraction of reads that can be assigned. That is genuine progress and should be acknowledged. It is also insufficient, for a reason the aggregate figures obscure: a mean mappability computed across a sample set that is itself geographically skewed will improve fastest for the populations best represented in that set. Improvement in the average is compatible with a stable or widening gap between populations. Successive expansions, from cultivated collections [12] through uSGB incorporation [4] to multi-country assembly [25], have each been evaluated primarily on global means.
Direct evidence on stratified performance is scarce, which is itself informative. Mappability and classification rates are frequently reported as global means rather than by cohort origin. Where population-level signals do surface they are suggestive: among helminth-infected indigenous Malaysians, individuals from villages with higher infection prevalence showed both more unmapped reads and greater microbial diversity [39]. The co-occurrence is what the differential-bias hypothesis predicts, since communities furthest from the reference sampling frame should show both more unmapped data and, when properly measured, more distinctive composition.
5. Reference Bias as an Epidemiological Bias
5.1. Differential Misclassification, Formalized
The claim of this section is that reference bias belongs to a recognized family of measurement problems, and that assigning it correctly within that family determines how it should be handled.
Epidemiology distinguishes error that is independent of the comparison being made from error that is not. Non-differential misclassification, in which measurement error is unrelated to group membership, generally attenuates associations toward the null: estimates are degraded but comparisons remain interpretable, and the direction of any residual bias is conservative. Differential misclassification, in which measurement error is correlated with group membership, has no such guarantee. It can inflate, deflate, reverse, or create an association, and no general correction exists without external information about the error structure.
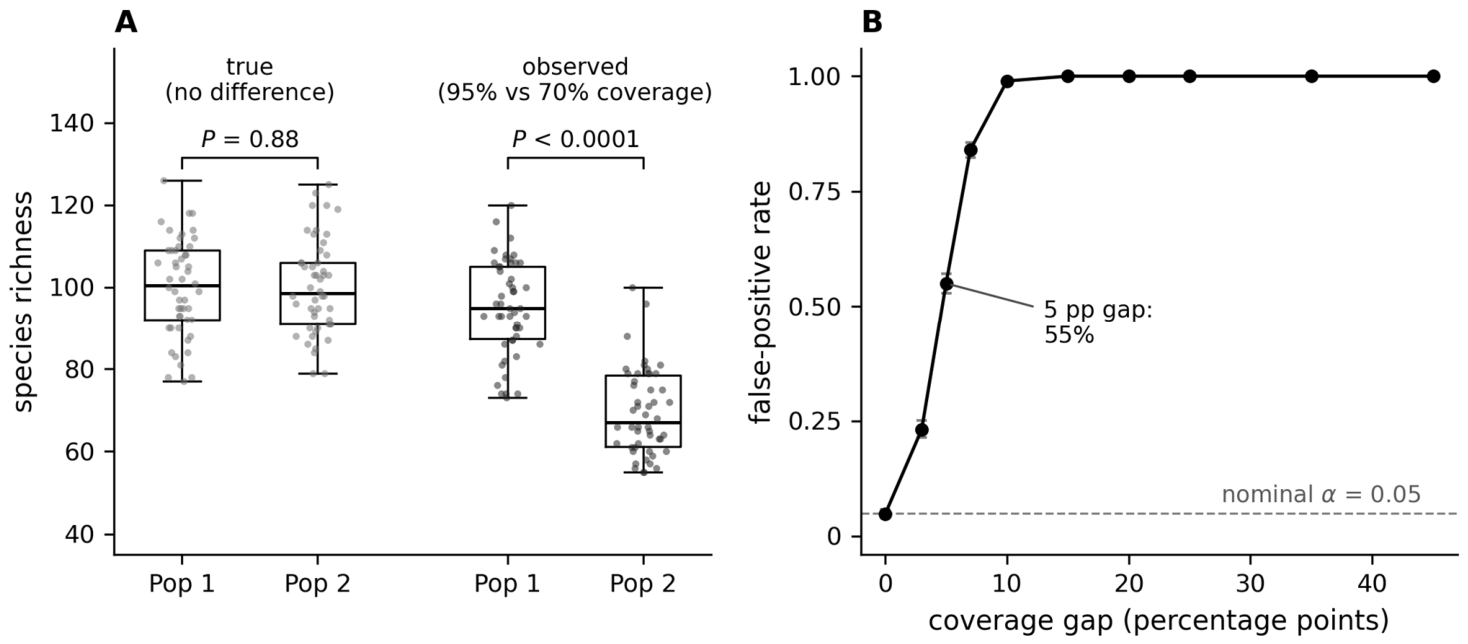
We propose that reference bias in metagenomics has the second structure whenever the populations under comparison differ in how well the reference represents them. The mechanism is direct. Unmapped reads contribute nothing to observed richness; unannotated genes contribute nothing to observed function. If a catalog is assembled predominantly from population 1 and a study compares population 1 with population 2, the loss is larger in population 2 by construction. Figure 2 illustrates the contrast with random error.
Figure 2.
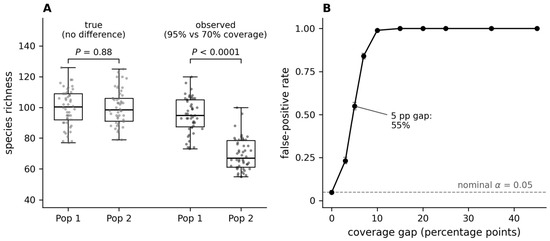
A coverage gap alone can manufacture a significant difference. (A) One representative simulated study, 50 individuals per group. True species richness is drawn from the same normal distribution (mean 100, SD 12) for both populations and does not differ (two-sided Mann–Whitney P = 0.88). Detection is modeled as binomial sampling of each individual’s true taxa at that population’s catalog coverage; after detection at 95% and 70% coverage, observed richness differs strongly (p < 0.0001). Boxes show median and interquartile range, whiskers 1.5 × IQR, points individual samples. (B) False-positive rate across 2000 replicates per coverage setting, with Wilson 95% confidence intervals. The procedure is calibrated at zero gap (4.8% against a nominal 5%); a 5-percentage-point gap raises the false-positive rate to 55%, a 10-point gap to 99%. All values are simulated by the procedure specified in full in Section 5.2; no empirical data are plotted.
Proposition (coverage bias in a between-population ratio). Let Tp denote the true richness of population p, Cp the coverage of that population by the reference catalog expressed as the proportion of its true diversity represented, and Op the observed richness. Assume that (i) a taxon is observed if and only if it is represented in the catalog, so that every taxon carried by the population p is detected independently with the same probability Cp; (ii) Cp is constant across individuals within a population and independent of their true richness; and (iii) richness is the estimand of interest. Then Op ~ Binomial (Tp, Cp), so that E[Op] = Tp × Cp, and for a comparison between two populations E[O1]/E[O2] = (T1/T2) × (C1/C2). The quantity of scientific interest is T1/T2. The ratio of observed richness estimates it without bias only when C1 = C2. Where C1 > C2 the observed ratio overstates the true ratio; where C1 < C2 it understates it. In either case the direction of the error is fixed by the sign of C1 − C2 and is not reduced by the increasing sample size.
Coverage Cp is not a primitive quantity, and it is worth decomposing it conceptually even where it cannot yet be measured. We suggest four contributing components: reference completeness, meaning how much of global gut diversity the catalog contains at all; geographic similarity, meaning how closely the catalog’s contributing populations resemble the population being measured; taxonomic representation, meaning whether the specific lineages carried by that population are present; and functional annotation depth, meaning whether the genes recovered can be assigned a function. The first component is shared across all studies using a given catalog and improves with each release. The remaining three are population-specific, and it is their population specificity that generates the bias term. A catalog can therefore grow substantially, improving completeness, while leaving geographic similarity for a given population unchanged.
Assumptions (i) to (iii) are deliberately strong, and the Proposition should not be mistaken for a model of the measurement process. Coverage is not a single scalar; it varies by taxon and by function, and richness is not the only estimand affected. The purpose of the expression is to locate the bias term and to show that it is separable in principle, not to provide a correction factor.
We therefore propose the following definition (Box 1). Geographically structured reference bias is the condition in which the completeness of a reference resource, and hence the sensitivity of measurements made against it, varies systematically with the geographic, ancestral, or lifestyle origin of the sample. Three criteria identify it. First, the reference is demonstrably incomplete with respect to the sampled populations. Second, that incompleteness is correlated with a variable used for comparison or stratification. Third, the analysis pipeline discards or fails to represent the unmatched fraction rather than propagating it as uncertainty. Where all three hold, our framework predicts that between-population comparisons will be biased in a determinate direction even where within-population comparisons remain valid.
5.2. A Simulation of the Proposed Mechanism
The argument to this point is analytical. To make its consequence concrete, we ran a simple simulation in which the only difference between two populations is how well the reference catalog represents them.
The simulation is specified in full below so that it can be reproduced from this description alone. Two populations of 50 individuals each were assigned true species richness values drawn independently from the same normal distribution, with mean 100 taxa and standard deviation 12, truncated below at 20. Because that distribution is identical for both populations, no biological difference exists by construction. Detection was modeled as binomial sampling: for an individual of true richness T, observed richness was drawn from Binomial (T, c), where c is the coverage of that individual’s population by the reference catalog. Observed richness was then compared between the two populations using a two-sided Mann–Whitney U test at a significance level of 0.05. Each coverage setting was evaluated over 2000 independent replicates. Coverage for population 1 was held at 0.95 throughout, while coverage for population 2 was varied. Computation used NumPy and SciPy with the pseudorandom generator seeded at 20260729. No empirical or previously published data were used at any stage: every value shown in Figure 2 is generated by the procedure just described.
The simulation is calibrated: when both populations are covered at 95%, the false-positive rate is 4.8%, matching the nominal 5% significance level and confirming that the procedure itself introduces no bias. Introducing a coverage gap changes this rapidly. Across the settings examined, the false-positive rate was 4.8% at a gap of 0 percentage points, 23.2% at 3 points, 55.0% at 5 points, 84.0% at 7 points and 99.0% at 10 points, reaching 100% at every gap of 15 points and above. At a 25-point gap, corresponding to catalog coverage of 95% against 70%, every one of the simulated studies reported a statistically significant difference in richness between two populations that were, by construction, identical. Figure 2 indicates a single such study alongside the full relationship. These values are illustrative rather than estimates of real-world magnitude. Because real detection failures are correlated across related taxa rather than independent, and because real cohorts differ in ways this model omits, the figures reported here should be read as a lower bound on the sensitivity of between-population comparison to catalog coverage, with the realistic magnitude presently unknown.
The magnitudes deserve emphasis against the empirical values in Table 2, where reported classification rates on identical data span from 44% to 94.5% depending on catalog choice [23]. We are not claiming that this full spread corresponds to a coverage gap between two populations within a single study; it does not, since those figures compare catalogs rather than cohorts. The relevant observation is more modest and, we think, more troubling: the simulation indicates that a gap far smaller than the documented between-catalog spread, one of five percentage points, would be sufficient to make spurious significance the majority outcome. Whether real between-population coverage gaps reach that magnitude is precisely the question that cannot currently be answered, because catalog provenance is not published in a form that would allow coverage to be estimated per population.
To test whether the result depends on the specific distributional assumption, the simulation was repeated under two relaxations: richness drawn from a log-normal rather than a normal distribution and taxon-specific detection probabilities drawn from a Beta distribution with mean equal to the population coverage, so that detectability varies between taxa rather than being uniform. The false-positive rate at a 5-point gap was 55.1%, 56.4%, and 55.9% under the three models, respectively. The calibration at zero gap was preserved throughout (4.8%, 4.5%, and 5.0%) against our nominal 5% (Table 3). The result is therefore not an artifact of the detection model chosen.
Table 3.
Sensitivity of the simulated false-positive rate to the distributional assumptions of the detection model. The published model draws true richness from a normal distribution and applies a single detection probability per population. Two relaxations were tested: true richness drawn from a log-normal distribution, and taxon-specific detection probabilities drawn from a Beta distribution with mean equal to the population coverage, so that detectability varies between taxa. All values are false-positive rates of a two-sided Mann–Whitney test across 2000 replicates per setting, with the two populations identical by construction. Calibration at a zero-coverage gap is preserved under all three models.
The simulation is not intended to reproduce the statistical properties of real metagenomic communities and should not be evaluated as though it were. It is a proof of mechanism: a demonstration that differential catalog coverage alone is sufficient to generate false-positive between-population differences, holding everything else equal. Three limitations follow from that purpose and bound what it indicates. It models detection as independent binomial sampling, whereas real read assignment failures are structured, correlated across related taxa, and dependent on sequence similarity to whatever reference is present. It treats coverage as a single scalar rather than the four-component quantity described above. And it addresses richness alone, not composition, differential abundance, or functional profiles, each of which would require its own treatment. The simulation therefore implies that the proposed mechanism is sufficient to produce spurious findings under stated assumptions. It does not establish that this mechanism explains any particular published result, and we make no such claim.
Box 1. Geographically structured reference bias: definition and identifying criteria.
- Definition: Geographically structured reference bias
- The condition in which the completeness of a reference resource, and hence the sensitivity of measurements made against it, varies systematically with the geographic, ancestral, or lifestyle origin of the sample.
- Criterion 1. The reference is demonstrably incomplete with respect to the sampled populations.
- Criterion 2. That incompleteness is correlated with a variable used for comparison or stratification.
- Criterion 3. The pipeline discards the unmatched fraction rather than propagating it as uncertainty.
- Consequence. Between-population comparisons are biased in a determinate direction even where within-population comparisons remain valid.
5.3. What Reference Bias Is Not
Reference bias is frequently discussed as though it were interchangeable with several other problems in microbiome measurement. It is not, and the differences carry practical consequences. Table 4 sets out the comparison.
Table 4.
Reference bias distinguished from error structures with which it is commonly conflated. The practical test is whether the standard remedy for each error type would remove reference bias; in every case it would not.
The distinction from sampling bias is the most important and the most often blurred. Sampling bias concerns which individuals enter a study; reference bias concerns how accurately any individual is measured once enrolled. A study can recruit a perfectly representative cohort and still measure it with an instrument calibrated elsewhere. The two are causally linked, since historical sampling bias is what produced the present reference composition, but they are not the same error and they are not remedied by the same action. Recruiting more diverse cohorts does not by itself fix a catalog; depositing genomes does.
The distinction from batch effects is similarly practical. Batch effects arise from technical variation between processing runs and can, in principle, be estimated and adjusted using replicated or shared samples [40,41]. Reference bias is invariant across batches processed against the same catalog: it will not appear as between-batch variance, will not be removed by batch correction, and is invisible to the quality-control procedures designed to detect technical artifacts [42].
An instructive parallel exists in human genomics, where incomplete reference genomes have been shown to generate spurious biological signal rather than merely to lose true signal [43]. The analogy is worth stating plainly. Had the human reference genome been assembled exclusively from European donors, and had that fact gone unreported, decades of comparative human genetics would have measured non-European populations with an instrument calibrated for someone else, and would have interpreted the resulting deficits as biology. The genomics community recognized this and responded with pangenome and graph-based references, in which multiple haplotypes are represented simultaneously so that no single donor’s sequence is privileged. Microbiome science is at present in the position that human genomics occupied before that recognition, with the aggravating feature that the reference is not one genome but a catalog of hundreds of thousands, and that no equivalent convention for reporting provenance exists. Whether the genomics solution transfers is genuinely unclear. Graph and pangenome representations address within-species variation, which is real and substantial in gut commensals [44,45], but the dominant gap here is between-species: organisms with no representative of any kind. A graph built over known species cannot represent an unknown one. Reference-free and assembly-first approaches sidestep the catalog entirely and are attractive for exactly that reason, though they trade interpretability for coverage and cannot assign names to what they recover. Hybrid strategies, in which assembly-derived novel content is folded back into a study-specific reference, may prove the most practical compromise, and long-read methods make such per-study augmentation increasingly feasible [26,46,47,48]. We raise these possibilities without endorsing any of them; evaluating them is beyond this review and would require the very stratified benchmarks the field currently lacks.
6. The Reference Bias Cascade
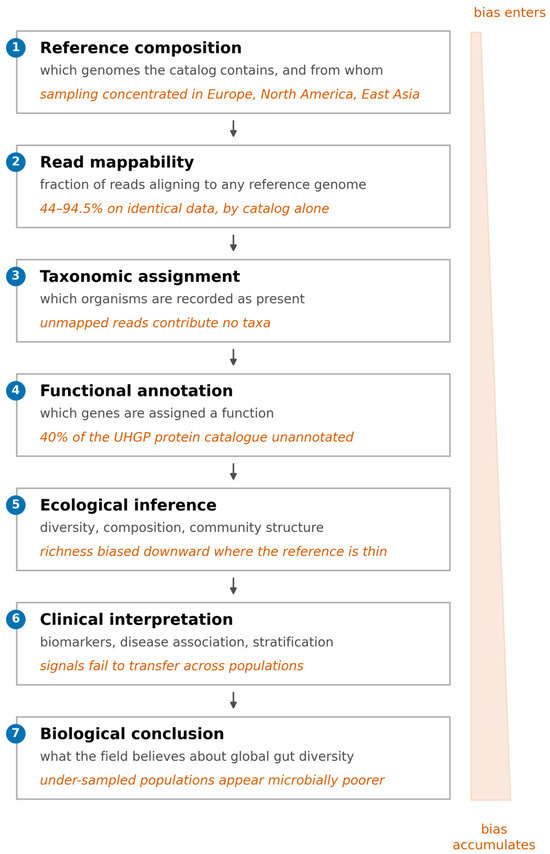
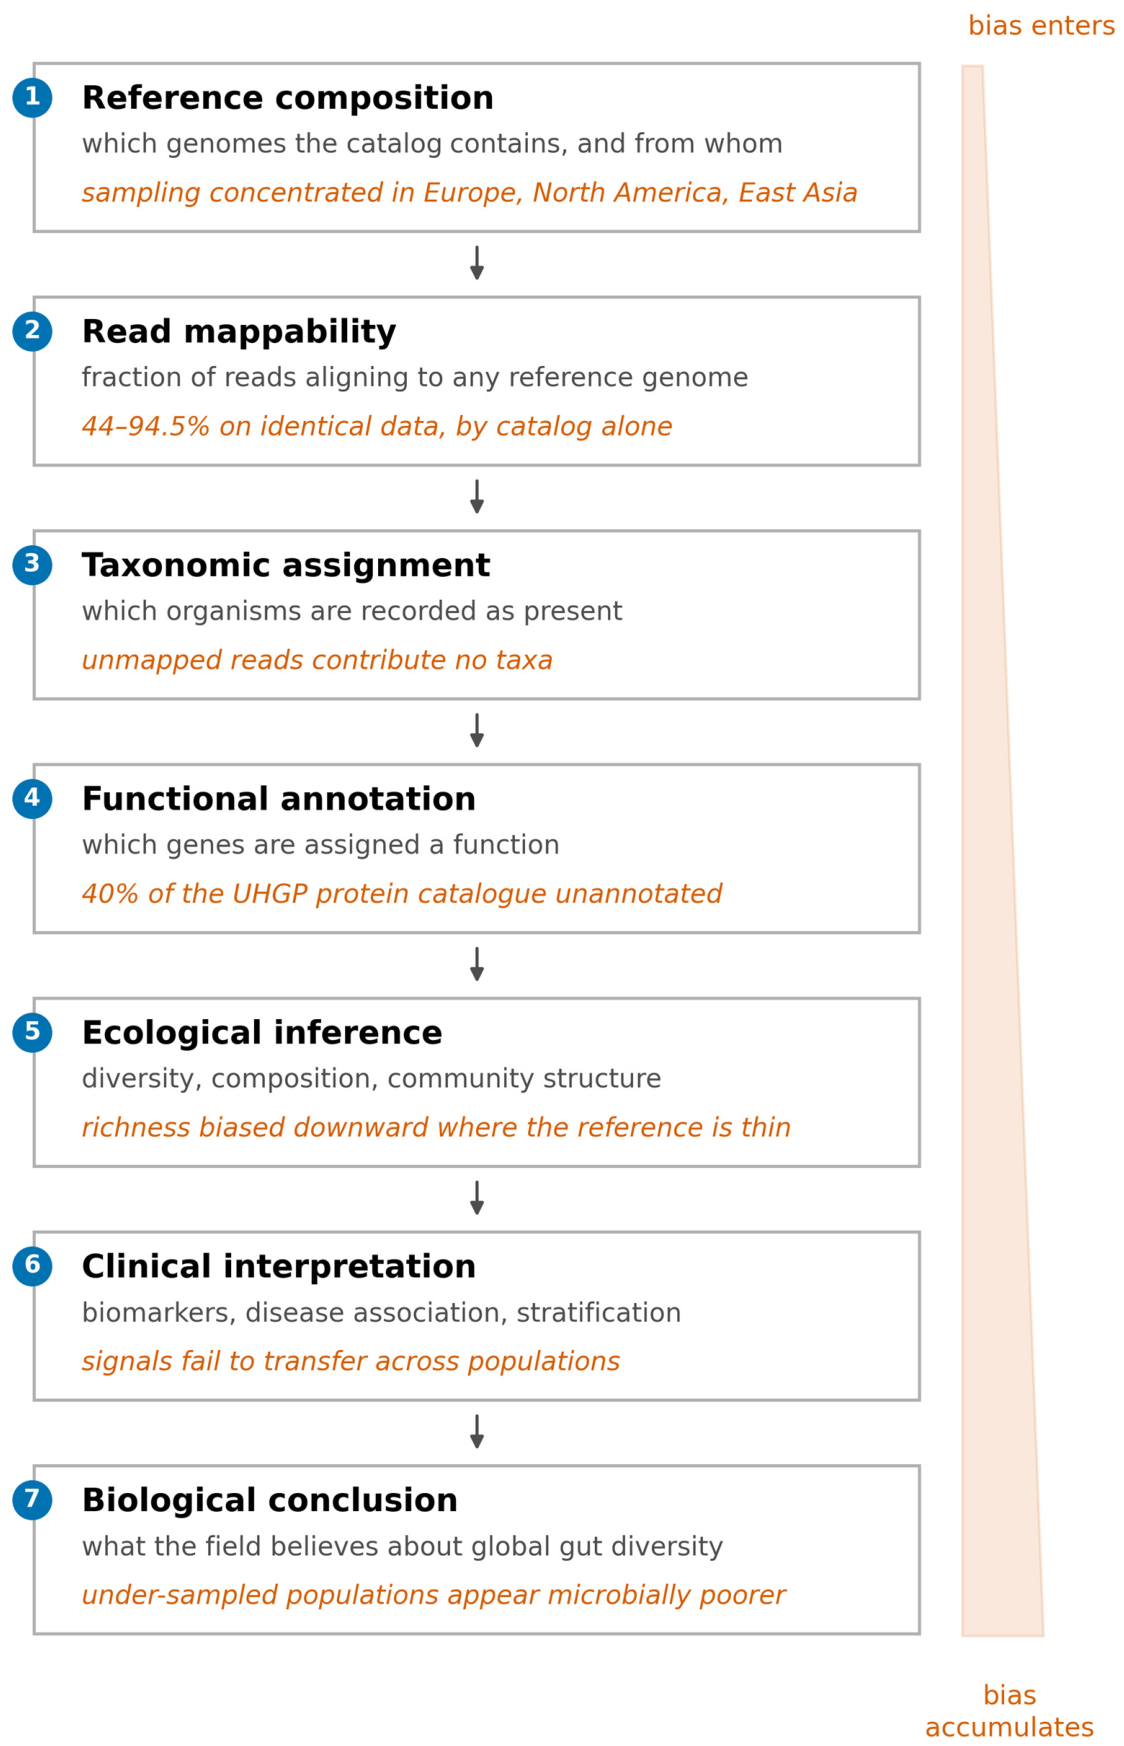
Because measurement sits upstream of every subsequent operation, reference bias does not remain localized. All downstream analyses inherit the assumptions of upstream measurement. Figure 3 traces the propagation of what we term the Reference Bias Cascade. Each stage inherits the incompleteness of the stage above it, and no downstream procedure recovers what was never measured.
Figure 3.
The Reference Bias Cascade. Catalog composition propagates through read mappability, taxonomic assignment, functional annotation, ecological inference and clinical interpretation to the biological conclusion. Gray text gives the quantity determined at each stage; orange text gives the evidence cited in the main text. Because bias enters at the first stage and is not removed downstream it accumulates, and because it is geographically structured it accumulates differentially across the populations being compared. This is a conceptual schematic; no data are plotted. (Created in BioRender.com).
Richness and alpha-diversity estimators operate on the set of taxa detected. Taxa present in a sample but absent from the reference are not detected and are not counted. Since the undetected fraction is larger for samples from under-represented populations [4], richness comparisons across populations are biased downward for exactly those populations. Beta-diversity is affected differently but not less: distances are computed in a feature space defined by the reference, so two samples may appear similar because the features that would distinguish them are jointly invisible. Diversity estimates are in any case sensitive to technical and design factors frequently left unreported, from stool consistency [49] to contamination and study design [50], and geographic differences in measured alpha diversity have been reported in association with social as well as biological variables [10].
Functional inference compounds taxonomic incompleteness with annotation incompleteness. Even for reads that map, 40% of the UHGP protein catalog carries no functional annotation [1]. The functional profile of a sample is therefore a description of its annotatable fraction. Where that fraction differs systematically between populations, pathway-level comparisons inherit the difference. Reported functional distinctiveness in Indian cohorts, including differences in branched-chain amino acid and short-chain fatty acid pathway representation between dietary groups [51], is measurable only to the extent that the underlying genes are represented and annotated in the reference used [10].
At the clinical end of the cascade, microbiome biomarkers frequently fail to replicate across cohorts. Evaluation of replicability found that while most sequencing laboratories can consistently distinguish between samples, with a median correct classification of 87% on genus-level proportion data, these distinctions frequently fail to hold in data from other laboratories, where median correct classification falls to 55% [52]. That analysis concerns laboratory and protocol variation rather than reference choice and should not be read as measuring reference bias; it is cited to establish that cross-study transportability is already poor for documented reasons, and that reference dependence is an additional and largely unquantified contributor. The surrounding evidence is consistent: the Microbiome Quality Control project documented substantial inter-laboratory variation directly [42], batch effects can exceed the biological effect under study [40], and repeatability assessments in population-scale cohorts report similar fragility [41]. Meta-analytic frameworks and machine-learning toolboxes were developed partly in response [53,54], and cross-cohort signatures that do replicate, as in colorectal cancer, are notable precisely because replication is uncommon [55]. Benchmarks for differential abundance testing show that confounder adjustment materially changes which taxa are called [56], and curated disease-association resources inherit whatever biases their constituent studies carry [57].
The practical implication is that a biomarker discovered in one population and validated against a catalog built from that population carries no guarantee of transferring to a population the catalog represents poorly, and that failure to transfer will be difficult to attribute correctly between biology, protocol, and reference. As microbiome data increasingly feed clinical stratification and donor-matching decisions, the cascade acquires consequences for individual patients rather than for population estimates alone.
7. Geographic Skew in Practice: South Asia and Other Under-Sampled Regions
South Asia illustrates the mismatch between population size and reference contribution with unusual clarity. The HRGM effort, undertaken explicitly to address Asian under-representation, assembled genomes from 845 fecal samples drawn from Korea, India, and Japan combined, of which 110 were from India [24]. India alone accounts for approximately one-sixth of the world’s population and spans exceptional heterogeneity in diet, geography, urbanicity, and lifestyle. Independent Indian cohort work has been correspondingly small in scale: a multi-omics characterization of 110 healthy individuals from two locations found compositional divergence between a predominantly plant-based North-Central cohort associated with Prevotella and an omnivorous Southern cohort associated with Bacteroides, Ruminococcus, and Faecalibacterium, with corresponding differences in amino acid and short-chain fatty acid pathways [58]. Further analysis reports features unique to the Indian distal gut microbiota [58], and seasonal dietary practice shapes community stability in rural Indian populations [11]. Comparative work across sub-Saharan African and South Asian women attributes much of the difference between them to dietary intake [59]. The relevant observation is not that these studies are deficient, but that a subcontinent of this scale is represented in global reference resources by cohorts numbering in the low hundreds.
Comparable arguments apply elsewhere. The Hadza analysis, in which 44% of recovered genomes were absent from existing unified datasets [5], indicates that lifestyle-associated diversity is being lost from the living record at the same time as it remains absent from the reference record [60]. Short- and long-read sequencing of urban and rural South African cohorts reveals transitional compositions and undescribed taxa [61,62]; rural and urban African populations differ in microbiome-mediated immune metabolism [63]; helminth exposure and lifestyle jointly structure Cameroonian gut communities [64]; and context dependence of the same kind is documented among indigenous Malaysians [39]. Regional perspectives from Latin America [65], Māori populations [66], and remote Indigenous Australian infants [67] converge on the same conclusion, as do reviews of global microbiome data across low- and middle-income countries [68].
Population structure in gut bacteria is now documented at several resolutions, which strengthens rather than weakens the argument: subspecies structure is patterned by population [44], detailed phylogeographic structure has been demonstrated for individual species such as Eubacterium rectale [45], and population structure differs measurably across rural African cohorts [69], among ethnic groups sharing a single city [70], and in migrants after enforced lifestyle change [71]. Urbanization is associated with loss of novel diversity in China [72] and reorganization of community structure across dietary contexts [73], with comparable signals in non-industrialized urban Amazonia [74] and in comparisons between Han Chinese and other populations [75]. Real biological variation across populations is therefore well-established. The difficulty is that genuine variation and differential measurement error are currently entangled, and no standard practice exists for separating them.
Recent catalog efforts have begun to respond. Extension of MAG assembly across 41 countries [25], regional compendia for previously unrepresented populations [18], expanding taxonomic frameworks [27], and explicit roadmaps for equitable reuse of public microbiome data [68] and equity-oriented data sharing in African health research [76] all represent real movement. The argument here is not that the field has ignored the problem, but that reference provenance is still not reported in a way that allows any individual study to assess how well its own populations are covered.
Several developments already work against the problem described here. Successive catalog releases have materially increased the fraction of reads that can be assigned, and the most recent resource extend assembly across many more countries than their predecessors [1,25]. Long-read sequencing recovers genomes that short-read assemblies collapse or miss. Reference-free and assembly-first workflows avoid catalog entirely for some questions and running more than one classifier and comparing outputs is a practical partial safeguard available to any study today. None of these removes the problem. Catalog growth improves the mean without necessarily equalizing coverage across populations, and reference-free methods trade interpretability for coverage, but the direction of travel is favorable. MIRR is intended to make progress measurable rather than to suggest none is being made.
8. Minimum Information for Reference Reporting (MIRR)
The recommendations below are adoptable without additional data generation. They are grouped as a proposed reporting standard, Minimum Information for Reference Reporting (MIRR), and are stated as checkable items so that journals and reviewers can apply them directly. MIRR is intended to sit within the established family of minimum-information reporting standards developed under the Minimum Information for Biological and Biomedical Investigations (MIBBI) framework, and specifically to complement rather than duplicate MIMAG [22]. MIMAG standardizes the reporting of genome quality, that is, how good an assembled genome is; it is silent on provenance, that is, whose gut it came from. The argument of this review is that provenance is the property on which measurement sensitivity depends, and that it therefore requires an equivalent convention of its own. Table 5 presents them in checklist form.
Table 5.
The Minimum Information for Reference Reporting (MIRR) checklist. Items 1–6 (Core) are addressable by any study without additional data generation. Items 7–8 (Extended) are aspirational for individual studies and are the proper responsibility of catalog builders and journals.
Items 1–3 and 6 apply to any study that profiles metagenomic data against a reference catalog, since they record what instrument was used and how much of the data it assigned. Items 4 and 5 apply specifically to comparative designs, where the risk described in this review arises; in a single-population study there is no between-group comparison for coverage to distort.
The items were derived by working backwards through the Reference Bias Cascade and asking, at each stage, what minimal disclosure would allow a reader to judge whether that stage had been compromised. Items 1 and 2 establish which instrument was used, since results are not interpretable without it. Item 3 reports the instrument’s overall sensitivity. Item 4 is the pivotal item, because it alone reveals whether sensitivity differs across the groups being compared, and it is the item most often omitted. Item 5 asks authors to state the interpretive consequence. Item 6 extends the same logic to functional analysis. Items 1 to 6 require no work beyond reporting quantities that pipelines already produce, and we designate them core. Items 7 and 8 are more demanding: a reference-sensitivity analysis requires rerunning the pipeline, and deposition requires assembly. We designate these extended: aspirational for individual studies but appropriate as expectations for well-resourced consortia.
Two design decisions deserve comment. First, we deliberately do not propose a single composite coverage score. A numerical index combining mapping rate, novel taxa, and provenance would be easy to cite and difficult to defend, since the weighting would be arbitrary and the resulting number would obscure exactly the stratified detail that matters. Second, the burden is deliberately split between two parties: individual studies can report what they already compute, but only catalog builders can publish provenance, and no amount of diligence at the study level substitutes for that.
The diverse nature of current practice is illustrated in Table 1. Provenance ranges from a single named country with a donor count, through continent-level summaries, to a tabulated breakdown across 41 contributing countries. In some cases, the geography of the cohorts used to validate mapping rates is reported while the origin of the contributing genomes is not. Each of these is better than silence, and none is sufficient. What item 8 requires is narrower: a machine-readable file giving the number of samples or genomes contributed by each country. Naming countries in prose tells a reader that a catalog is not universal. Only counts let that reader estimate Cp for their own population, which is the quantity on which the argument of this review turns.
Beyond the study level, we recommend that catalog builders publish a machine-readable supplementary table giving samples and genomes by country of origin, and that journals require items 1 to 4 as a condition of publication. The first of these is the single most correctable gap identified in this review; existing equity roadmaps provide a natural home for such a convention [68,76], and long-read methods make contribution from under-sampled settings increasingly practical [46,47,48,77,78,79]. Deposited genomes should meet established quality standards [22].
9. Open Questions
Six questions follow directly from the framework and are, in our view, the most consequential open problems.
- How large is the bias term? No study has yet quantified, for a single dataset analyzed against catalogs of differing provenance, what fraction of an observed between-population difference is attributable to reference composition. This is the decisive experiment and it requires no new sampling: a single public multi-population cohort, profiled with identical software and parameters against standard Kraken2, UHGG, HumGut, HRGM, and HRGM2 in turn, with alpha diversity, beta diversity, and differential abundance recomputed under each and the between-population effect size tracked across catalogs. If the effect size moves with catalog provenance, the framework proposed here is supported; if it does not, the framework is wrong in a way that matters and should be abandoned.
- What mapping rate is adequate? The field has no accepted threshold below which a taxonomic profile should be considered unreliable, and no convention for how much stratified variation in mapping rate should trigger caution.
- Can graph-based or pangenome references dissolve the problem? Human genomics responded to reference bias with graph representations. Whether an analogous construction is tractable for a catalog of hundreds of thousands of genomes remains open.
- How much diversity remains unsampled, and where? Rarefaction of catalog growth by contributing geography would give an empirical answer, but requires the provenance data that are not currently published.
- Will machine-learning models trained on current catalogs propagate the bias? Predictive models inherit the representational structure of their training data. A classifier trained on features that are systematically better measured in some populations than others may encode that asymmetry, and the resulting performance disparity would be difficult to detect without stratified evaluation.
- Should journals require reference reporting? The checklist proposed here is intended to be adoptable as an editorial requirement. Whether adoption should be voluntary or mandatory is a question for editors rather than authors.
10. Limitations of This Review
Several limitations qualify the arguments above. This is a narrative review and does not claim systematic or exhaustive coverage; relevant work will have been missed, and source selection reflects the author’s search strategy and judgment. The quantitative comparisons in Table 2 are drawn from studies using different metrics, software, and sample sets, and are presented to indicate magnitude rather than to support pooling; no meta-analysis is warranted or attempted.
More importantly, the central claim of directional bias is an argument from mechanism supported by indirect evidence, not a demonstrated effect size. The formalization in Section 5 indicates where the bias term sits; it does not measure it. The simulation in Section 5.2 indicates that the mechanism is sufficient to produce spurious findings under stated assumptions, but it is a proof of mechanism rather than a model of real communities, and it cannot indicate how often the conditions it describes are met in practice. Until the controlled reanalysis described in Section 9 is performed, the magnitude of the problem remains uncertain even though its direction does not. Readers should treat the framework as a hypothesis with a clear empirical test attached rather than as an established quantity.
Two considerations narrow the scope of what is claimed here. The first is functional redundancy. Taxonomic loss does not translate one-to-one into functional loss, and where the missing taxa are redundant with represented ones, pathway-level profile may prove more robust to catalog incompleteness than richness estimates are. This review does not quantify that buffering and cannot say how much of it there is. Assembly-first and reference-free workflows avoid catalog dependency altogether. They are not a general substitute since they cannot assign names to what they recover, but for some questions, they are the right tool, and their existence bounds how much of metagenomics the argument here applies to.
MIRR has a weakness of its own. A checklist can be satisfied without being understood. A study might report a stratified classification rate, observe that it differs between cohorts, and then interpret its findings as though it had not, and nothing in the eight items prevents that. Reporting standards change what is visible. They do not change what is inferred from it. That work stays with authors, reviewers and editors, and no convention will do it for them.
Finally, the geographic provenance data needed to characterize catalog composition are not available in extractable form for most catalogs, as Table 1 records. The account given here is therefore less complete than the topic requires, for precisely the reason that motivated the review.
11. Conclusions
Reference genome catalogs are the instruments through which the human gut microbiome is observed, and their composition determines what can be seen. The evidence assembled here indicates that the fraction of a metagenome receiving any taxonomic assignment varies from below half to above nine-tenths according to reference choice alone [23], and that the diversity missing from reference resources is concentrated in populations outside the high-income regions where sampling has been concentrated [4,5,11]. On our interpretation, reference incompleteness is therefore not a uniform haze over the data but a structured distortion aligned with the very variable that comparative microbiome studies most often wish to estimate.
Treating this as differential misclassification rather than as missing coverage changes what follows. If the framework is correct, the appropriate response is not only to build larger catalogs but to report the sensitivity of the instrument, stratified by the populations being measured, in the same way that any other measurement in quantitative biology is expected to carry an error characterization. It requires no new technology. It requires that catalog builders publish their geographic provenance and that individual studies report and stratify the classification rates they already compute.
We expect the framework is not specific to the gut. Any metagenomic measurement that assigns sequences by comparison to a curated reference inherits the same structure, and the argument extends directly to the oral, skin, and vaginal microbiomes, to soil and marine metagenomics, and with greater force to viromics and fungal metagenomics, where reference incompleteness is more severe still and where the populations and environments sampled are at least as unevenly distributed.
Every microbiome study should therefore report not only what was measured, but what could not have been measured. The greatest unknown in microbiome science may not be the organisms we have not yet discovered, but the conclusions we have already drawn because we were not equipped to see them.
Author Contributions
Conceptualization, S.S.; methodology, S.S.; investigation, S.S.; software and formal analysis, R.H.D.; visualization, S.S.; writing—original draft preparation, R.H.D.; writing—review and editing, S.S. All authors have read and agreed to the published version of the manuscript.
Funding
This research received no external funding.
Institutional Review Board Statement
Not applicable.
Informed Consent Statement
Not applicable.
Data Availability Statement
No new experimental data were created or analyzed in this study. All empirical values discussed are available in the cited publications. The simulation reported in Section 5.2 uses no empirical data of any kind; its model, parameters and random seed are specified in full in that section, and the reported false-positive rates are given there in full.
Conflicts of Interest
The author declares no conflicts of interest.
Abbreviations
The following abbreviations are used in this manuscript:
| CGR | Culturable Genome Reference |
| HRGM | Human Reference Gut Microbiome |
| IQR | Interquartile range |
| MAG | Metagenome-assembled genome |
| MIBBI | Minimum Information for Biological and Biomedical Investigations |
| MIMAG | Minimum Information about a Metagenome-Assembled Genome |
| MIRR | Minimum Information for Reference Reporting |
| SD | Standard deviation |
| SGB | Species-level genome bin |
| uSGB | unknown species-level genome bin |
| UHGG | Unified Human Gastrointestinal Genome |
| UHGP | Unified Human Gastrointestinal Protein |
References
- Almeida, A.; Nayfach, S.; Boland, M.; Strozzi, F.; Beracochea, M.; Shi, Z.J.; Pollard, K.S.; Sakharova, E.; Parks, D.H.; Hugenholtz, P.; et al. A Unified Catalog of 204,938 Reference Genomes from the Human Gut Microbiome. Nat. Biotechnol. 2021, 39, 105–114. [Google Scholar] [CrossRef] [Scilit] [PubMed]
- Almeida, A.; Mitchell, A.L.; Boland, M.; Forster, S.C.; Gloor, G.B.; Tarkowska, A.; Lawley, T.D.; Finn, R.D. A New Genomic Blueprint of the Human Gut Microbiota. Nature 2019, 568, 499–504. [Google Scholar] [CrossRef] [Scilit] [PubMed]
- Nayfach, S.; Shi, Z.J.; Seshadri, R.; Pollard, K.S.; Kyrpides, N.C. New Insights from Uncultivated Genomes of the Global Human Gut Microbiome. Nature 2019, 568, 505–510. [Google Scholar] [CrossRef] [Scilit] [PubMed]
- Pasolli, E.; Asnicar, F.; Manara, S.; Zolfo, M.; Karcher, N.; Armanini, F.; Beghini, F.; Manghi, P.; Tett, A.; Ghensi, P.; et al. Extensive Unexplored Human Microbiome Diversity Revealed by Over 150,000 Genomes from Metagenomes Spanning Age, Geography, and Lifestyle. Cell 2019, 176, 649–662.e20. [Google Scholar] [CrossRef] [Scilit] [PubMed]
- Carter, M.M.; Olm, M.R.; Merrill, B.D.; Dahan, D.; Tripathi, S.; Spencer, S.P.; Yu, F.B.; Jain, S.; Neff, N.; Jha, A.R.; et al. Ultra-Deep Sequencing of Hadza Hunter-Gatherers Recovers Vanishing Gut Microbes. Cell 2023, 186, 3111–3124. [Google Scholar] [CrossRef] [Scilit] [PubMed]
- Wright, R.J.; Comeau, A.M.; Langille, M.G.I. From Defaults to Databases: Parameter and Database Choice Dramatically Impact the Performance of Metagenomic Taxonomic Classification Tools. Microb. Genom. 2023, 9, 000949. [Google Scholar] [CrossRef] [Scilit] [PubMed]
- Ye, S.H.; Siddle, K.J.; Park, D.J.; Sabeti, P.C. Benchmarking Metagenomics Tools for Taxonomic Classification. Cell 2019, 178, 779–794. [Google Scholar] [CrossRef] [Scilit] [PubMed]
- Govender, K.N.; Eyre, D.W. Benchmarking Taxonomic Classifiers with Illumina and Nanopore Sequence Data for Clinical Metagenomic Diagnostic Applications. Microb. Genom. 2022, 8, mgen000886. [Google Scholar] [CrossRef] [Scilit] [PubMed]
- McIntyre, A.B.R.; Ounit, R.; Afshinnekoo, E.; Prill, R.J.; Hénaff, E.; Alexander, N.; Minot, S.S.; Danko, D.; Foox, J.; Ahsanuddin, S.; et al. Comprehensive Benchmarking and Ensemble Approaches for Metagenomic Classifiers. Genome Biol. 2017, 18, 182. [Google Scholar] [CrossRef] [Scilit] [PubMed]
- Thomas, A.M.; Segata, N. Multiple Levels of the Unknown in Microbiome Research. BMC Biol. 2019, 17, 48. [Google Scholar] [CrossRef] [Scilit] [PubMed]
- Arif, S.J.; Graham, S.P.; Abdill, R.J.; Blekhman, R. Analyzing Human Gut Microbiome Data from Global Populations: Challenges and Resources. Trends Microbiol. 2025, 33, 1212–1223. [Google Scholar] [CrossRef] [Scilit] [PubMed]
- Zou, Y.; Xue, W.; Luo, G.; Deng, Z.; Qin, P.; Guo, R.; Sun, H.; Xia, Y.; Liang, S.; Dai, Y.; et al. 1,520 Reference Genomes from Cultivated Human Gut Bacteria Enable Functional Microbiome Analyses. Nat. Biotechnol. 2019, 37, 179–185. [Google Scholar] [CrossRef] [Scilit] [PubMed]
- Forster, S.C.; Kumar, N.; Anonye, B.O.; Almeida, A.; Viciani, E.; Stares, M.D.; Dunn, M.; Mkandawire, T.T.; Zhu, A.; Shao, Y.; et al. A Human Gut Bacterial Genome and Culture Collection for Improved Metagenomic Analyses. Nat. Biotechnol. 2019, 37, 186–192. [Google Scholar] [CrossRef] [Scilit] [PubMed]
- Browne, H.P.; Forster, S.C.; Anonye, B.O.; Kumar, N.; Neville, B.A.; Stares, M.D.; Goulding, D.; Lawley, T.D. Culturing of ‘Unculturable’ Human Microbiota Reveals Novel Taxa and Extensive Sporulation. Nature 2016, 533, 543–546. [Google Scholar] [CrossRef] [Scilit] [PubMed]
- Bilen, M.; Dufour, J.-C.; Lagier, J.-C.; Cadoret, F.; Daoud, Z.; Dubourg, G.; Raoult, D. The Contribution of Culturomics to the Repertoire of Isolated Human Bacterial and Archaeal Species. Microbiome 2018, 6, 94. [Google Scholar] [CrossRef] [Scilit] [PubMed]
- Poyet, M.; Groussin, M.; Gibbons, S.M.; Avila-Pacheco, J.; Jiang, X.; Kearney, S.M.; Perrotta, A.R.; Berdy, B.; Zhao, S.; Lieberman, T.D.; et al. A Library of Human Gut Bacterial Isolates Paired with Longitudinal Multiomics Data Enables Mechanistic Microbiome Research. Nat. Med. 2019, 25, 1442–1452. [Google Scholar] [CrossRef] [Scilit] [PubMed]
- Lin, X.; Hu, T.; Chen, J.; Liang, H.; Zhou, J.; Wu, Z.; Ye, C.; Jin, X.; Xu, X.; Zhang, W.; et al. The Genomic Landscape of Reference Genomes of Cultivated Human Gut Bacteria. Nat. Commun. 2023, 14, 1663. [Google Scholar] [CrossRef] [Scilit] [PubMed]
- Jin, H.; Quan, K.; He, Q.; Kwok, L.-Y.; Ma, T.; Li, Y.; Zhao, F.; You, L.; Zhang, H.; Sun, Z. A High-Quality Genome Compendium of the Human Gut Microbiome of Inner Mongolians. Nat. Microbiol. 2023, 8, 150–161. [Google Scholar] [CrossRef] [Scilit] [PubMed]
- Xie, F.; Jin, W.; Si, H.; Yuan, Y.; Tao, Y.; Liu, J.; Wang, X.; Yang, C.; Li, Q.; Yan, X.; et al. An Integrated Gene Catalog and over 10,000 Metagenome-Assembled Genomes from the Gastrointestinal Microbiome of Ruminants. Microbiome 2021, 9, 137. [Google Scholar] [CrossRef] [Scilit] [PubMed]
- Chen, C.; Zhou, Y.; Fu, H.; Xiong, X.; Fang, S.; Jiang, H.; Wu, J.; Yang, H.; Gao, J.; Huang, L. Expanded Catalog of Microbial Genes and Metagenome-Assembled Genomes from the Pig Gut Microbiome. Nat. Commun. 2021, 12, 1106. [Google Scholar] [CrossRef] [Scilit] [PubMed]
- Arikawa, K.; Ide, K.; Kogawa, M.; Saeki, T.; Yoda, T.; Endoh, T.; Matsuhashi, A.; Takeyama, H.; Hosokawa, M. Recovery of Strain-Resolved Genomes from Human Microbiome through an Integration Framework of Single-Cell Genomics and Metagenomics. Microbiome 2021, 9, 202. [Google Scholar] [CrossRef] [Scilit] [PubMed]
- The Genome Standards Consortium; Bowers, R.M.; Kyrpides, N.C.; Stepanauskas, R.; Harmon-Smith, M.; Doud, D.; Reddy, T.B.K.; Schulz, F.; Jarett, J.; Rivers, A.R.; et al. Minimum Information about a Single Amplified Genome (MISAG) and a Metagenome-Assembled Genome (MIMAG) of Bacteria and Archaea. Nat. Biotechnol. 2017, 35, 725–731. [Google Scholar] [CrossRef] [Scilit] [PubMed]
- Hiseni, P.; Rudi, K.; Wilson, R.C.; Hegge, F.T.; Snipen, L. HumGut: A Comprehensive Human Gut Prokaryotic Genomes Collection Filtered by Metagenome Data. Microbiome 2021, 9, 165. [Google Scholar] [CrossRef] [Scilit] [PubMed]
- Kim, C.Y.; Lee, M.; Yang, S.; Kim, K.; Yong, D.; Kim, H.R.; Lee, I. Human Reference Gut Microbiome Catalog Including Newly Assembled Genomes from Under-Represented Asian Metagenomes. Genome Med. 2021, 13, 134. [Google Scholar] [CrossRef] [Scilit] [PubMed]
- Ma, J.; Kim, N.; Cha, J.H.; Kim, W.; Kim, C.Y.; Lee, Y.; Kim, H.S.; Han, Y.D.; Yong, D.; Han, E.; et al. A Human Gut Metagenome-Assembled Genome Catalogue Spanning 41 Countries Supports Genome-Scale Metabolic Models. Nat. Microbiol. 2025, 11, 317–334. [Google Scholar] [CrossRef] [Scilit] [PubMed]
- Sereika, M.; Mussig, A.J.; Jiang, C.; Knudsen, K.S.; Jensen, T.B.N.; Petriglieri, F.; Yang, Y.; Jørgensen, V.R.; Delogu, F.; Sørensen, E.A.; et al. Genome-Resolved Long-Read Sequencing Expands Known Microbial Diversity across Terrestrial Habitats. Nat. Microbiol. 2025, 10, 2018–2030. [Google Scholar] [CrossRef] [Scilit] [PubMed]
- Parks, D.H.; Chaumeil, P.-A.; Mussig, A.J.; Rinke, C.; Chuvochina, M.; Hugenholtz, P. GTDB Release 10: A Complete and Systematic Taxonomy for 715 230 Bacterial and 17 245 Archaeal Genomes. Nucleic Acids Res. 2026, 54, D743–D754. [Google Scholar] [CrossRef] [Scilit] [PubMed]
- Seppey, M.; Manni, M.; Zdobnov, E.M. LEMMI: A Continuous Benchmarking Platform for Metagenomics Classifiers. Genome Res. 2020, 30, 1208–1216. [Google Scholar] [CrossRef] [Scilit] [PubMed]
- Nasko, D.J.; Koren, S.; Phillippy, A.M.; Treangen, T.J. RefSeq Database Growth Influences the Accuracy of K-Mer-Based Lowest Common Ancestor Species Identification. Genome Biol. 2018, 19, 165. [Google Scholar] [CrossRef] [Scilit] [PubMed]
- Wood, D.E.; Lu, J.; Langmead, B. Improved Metagenomic Analysis with Kraken 2. Genome Biol. 2019, 20, 257. [Google Scholar] [CrossRef] [Scilit] [PubMed]
- Ceccarani, C.; Severgnini, M. A Comparison between Greengenes, SILVA, RDP, and NCBI Reference Databases in Four Published Microbiota Datasets. bioRxiv 2023. [Google Scholar] [CrossRef] [Scilit]
- Ramakodi, M.P. Influence of 16S rRNA Reference Databases in Amplicon-Based Environmental Microbiome Research. Biotechnol. Lett. 2022, 44, 523–533. [Google Scholar] [CrossRef] [Scilit] [PubMed]
- Werner, J.J.; Koren, O.; Hugenholtz, P.; DeSantis, T.Z.; Walters, W.A.; Caporaso, J.G.; Angenent, L.T.; Knight, R.; Ley, R.E. Impact of Training Sets on Classification of High-Throughput Bacterial 16s rRNA Gene Surveys. ISME J. 2012, 6, 94–103. [Google Scholar] [CrossRef] [Scilit] [PubMed]
- Eisenhofer, R.; Weyrich, L.S. Assessing Alignment-Based Taxonomic Classification of Ancient Microbial DNA. PeerJ 2019, 7, e6594. [Google Scholar] [CrossRef] [Scilit] [PubMed]
- Xu, R.; Rajeev, S.; Salvador, L.C.M. The Selection of Software and Database for Metagenomics Sequence Analysis Impacts the Outcome of Microbial Profiling and Pathogen Detection. PLoS ONE 2023, 18, e0284031. [Google Scholar] [CrossRef] [Scilit] [PubMed]
- Puller, V.; Oñate, F.P.; Prifti, E.; De Lahondès, R. Impact of Simulation and Reference Catalogues on the Evaluation of Taxonomic Profiling Pipelines. Microb. Genom. 2023, 11, 001330. [Google Scholar]
- Karagiannis, T.T.; Chen, Y.; Bald, S.; Tai, A.; Reed, E.R.; Milman, S.; Andersen, S.L.; Perls, T.T.; Segrè, D.; Sebastiani, P.; et al. Integrative Analysis across Metagenomic Taxonomic Classifiers: A Case Study of the Gut Microbiome in Aging and Longevity in the Integrative Longevity Omics Study. PLoS Comput. Biol. 2026, 22, e1013883. [Google Scholar] [CrossRef] [Scilit] [PubMed]
- Escobar-Zepeda, A.; Godoy-Lozano, E.E.; Raggi, L.; Segovia, L.; Merino, E.; Gutiérrez-Rios, R.M.; Juarez, K.; Licea-Navarro, A.F.; Pardo-Lopez, L.; Sanchez-Flores, A. Analysis of Sequencing Strategies and Tools for Taxonomic Annotation: Defining Standards for Progressive Metagenomics. Sci. Rep. 2018, 8, 12034. [Google Scholar] [CrossRef] [Scilit] [PubMed]
- Tee, M.Z.; Er, Y.X.; Easton, A.V.; Yap, N.J.; Lee, I.L.; Devlin, J.; Chen, Z.; Ng, K.S.; Subramanian, P.; Angelova, A.; et al. Gut Microbiome of Helminth-Infected Indigenous Malaysians Is Context Dependent. Microbiome 2022, 10, 214. [Google Scholar] [CrossRef] [Scilit] [PubMed]
- Randall, D.W.; Kieswich, J.; Swann, J.; McCafferty, K.; Thiemermann, C.; Curtis, M.; Hoyles, L.; Yaqoob, M.M. Batch Effect Exerts a Bigger Influence on the Rat Urinary Metabolome and Gut Microbiota than Uraemia: A Cautionary Tale. Microbiome 2019, 7, 127. [Google Scholar] [CrossRef] [Scilit] [PubMed]
- Moossavi, S.; Fehr, K.; Khafipour, E.; Azad, M.B. Repeatability and Reproducibility Assessment in a Large-Scale Population-Based Microbiota Study: Case Study on Human Milk Microbiota. Microbiome 2021, 9, 41. [Google Scholar] [CrossRef] [Scilit] [PubMed]
- The Microbiome Quality Control Project Consortium; Sinha, R.; Abu-Ali, G.; Vogtmann, E.; Fodor, A.A.; Ren, B.; Amir, A.; Schwager, E.; Crabtree, J.; Ma, S.; et al. Assessment of Variation in Microbial Community Amplicon Sequencing by the Microbiome Quality Control (MBQC) Project Consortium. Nat. Biotechnol. 2017, 35, 1077–1086. [Google Scholar] [CrossRef] [Scilit] [PubMed]
- Guccione, C.; Patel, L.; Tomofuji, Y.; McDonald, D.; Gonzalez, A.; Sepich-Poore, G.D.; Sonehara, K.; Zakeri, M.; Chen, Y.; Dilmore, A.H.; et al. Incomplete Human Reference Genomes Can Drive False Sex Biases and Expose Patient-Identifying Information in Metagenomic Data. Nat. Commun. 2025, 16, 825. [Google Scholar] [CrossRef] [Scilit] [PubMed]
- Costea, P.I.; Coelho, L.P.; Sunagawa, S.; Munch, R.; Huerta-Cepas, J.; Forslund, K.; Hildebrand, F.; Kushugulova, A.; Zeller, G.; Bork, P. Subspecies in the Global Human Gut Microbiome. Mol. Syst. Biol. 2017, 13, MSB177589. [Google Scholar] [CrossRef] [Scilit] [PubMed]
- Karcher, N.; Pasolli, E.; Asnicar, F.; Huang, K.D.; Tett, A.; Manara, S.; Armanini, F.; Bain, D.; Duncan, S.H.; Louis, P.; et al. Analysis of 1321 Eubacterium Rectale Genomes from Metagenomes Uncovers Complex Phylogeographic Population Structure and Subspecies Functional Adaptations. Genome Biol. 2020, 21, 138. [Google Scholar] [CrossRef] [Scilit] [PubMed]
- Kim, C.Y.; Ma, J.; Lee, I. HiFi Metagenomic Sequencing Enables Assembly of Accurate and Complete Genomes from Human Gut Microbiota. Nat. Commun. 2022, 13, 6367. [Google Scholar] [CrossRef] [Scilit] [PubMed]
- Benoit, G.; James, R.; Raguideau, S.; Alabone, G.; Goodall, T.; Chikhi, R.; Quince, C. High-Quality Metagenome Assembly from Nanopore Reads with nanoMDBG. Nat. Commun. 2026, 17, 3556. [Google Scholar] [CrossRef] [Scilit] [PubMed]
- Portik, D.M.; Feng, X.; Benoit, G.; Nasko, D.J.; Auch, B.; Bryson, S.J.; Cano, R.; Carlin, M.; Damerum, A.; Farthing, B.; et al. Highly Accurate Metagenome-Assembled Genomes from Human Gut Microbiota Using Long-Read Assembly, Binning, and Consolidation Methods. bioRxiv 2024. [Google Scholar] [CrossRef] [Scilit]
- Vandeputte, D.; Falony, G.; Vieira-Silva, S.; Tito, R.Y.; Joossens, M.; Raes, J. Stool Consistency Is Strongly Associated with Gut Microbiota Richness and Composition, Enterotypes and Bacterial Growth Rates. Gut 2016, 65, 57–62. [Google Scholar] [CrossRef] [Scilit] [PubMed]
- Agudelo, J.; Miller, A.W. Impact of Study Design, Contamination, and Data Characteristics on Results and Interpretation of Microbiome Studies. mSystems 2025, 10, e00408–e00425. [Google Scholar] [CrossRef] [Scilit] [PubMed]
- Dhakan, D.B.; Maji, A.; Sharma, A.K.; Saxena, R.; Pulikkan, J.; Grace, T.; Gomez, A.; Scaria, J.; Amato, K.R.; Sharma, V.K. The Unique Composition of Indian Gut Microbiome, Gene Catalogue and Associated Faecal Metabolome Deciphered Using Multi-Omics Approaches. GiaScience 2019, 1, giz004. [Google Scholar]
- Clausen, D.S.; Willis, A.D. Evaluating Replicability in Microbiome Data. Biostatistics 2022, 23, 1099–1114. [Google Scholar] [CrossRef] [Scilit] [PubMed]
- Wirbel, J.; Zych, K.; Essex, M.; Karcher, N.; Kartal, E.; Salazar, G.; Bork, P.; Sunagawa, S.; Zeller, G. Microbiome Meta-Analysis and Cross-Disease Comparison Enabled by the SIAMCAT Machine Learning Toolbox. Genome Biol. 2021, 22, 93. [Google Scholar] [CrossRef] [Scilit] [PubMed]
- Pasolli, E.; Truong, D.T.; Malik, F.; Waldron, L.; Segata, N. Machine Learning Meta-Analysis of Large Metagenomic Datasets: Tools and Biological Insights. PLoS Comput. Biol. 2016, 12, e1004977. [Google Scholar] [CrossRef] [Scilit] [PubMed]
- Thomas, A.M.; Manghi, P.; Asnicar, F.; Pasolli, E.; Armanini, F.; Zolfo, M.; Beghini, F.; Manara, S.; Karcher, N.; Pozzi, C.; et al. Metagenomic Analysis of Colorectal Cancer Datasets Identifies Cross-Cohort Microbial Diagnostic Signatures and a Link with Choline Degradation. Nat. Med. 2019, 25, 667–678. [Google Scholar] [CrossRef] [Scilit] [PubMed]
- Wirbel, J.; Essex, M.; Forslund, S.K.; Zeller, G. A Realistic Benchmark for Differential Abundance Testing and Confounder Adjustment in Human Microbiome Studies. Genome Biol. 2024, 25, 247. [Google Scholar] [CrossRef] [Scilit] [PubMed]
- Liu, C.; Wang, X.; Zhang, Z.; Wang, W.; Wang, T.; Zhao, Y.; Wang, M.; Chen, W.-H. GMrepo v3: A Curated Human Gut Microbiome Database with Expanded Disease Coverage and Enhanced Cross-Dataset Biomarker Analysis. Nucleic Acids Res. 2026, 54, D734–D742. [Google Scholar] [CrossRef] [Scilit] [PubMed]
- Kaur, K.; Khatri, I.; Akhtar, A.; Subramanian, S.; Ramya, T.N.C. Metagenomics Analysis Reveals Features Unique to Indian Distal Gut Microbiota. PLoS ONE 2020, 15, e0231197. [Google Scholar] [CrossRef] [Scilit] [PubMed]
- Tang, M.; Frank, D.N.; Tshefu, A.; Lokangaka, A.; Goudar, S.S.; Dhaded, S.M.; Somannavar, M.S.; Hendricks, A.E.; Ir, D.; Robertson, C.E.; et al. Different Gut Microbial Profiles in Sub-Saharan African and South Asian Women of Childbearing Age Are Primarily Associated with Dietary Intakes. Front. Microbiol. 2019, 10, 1848. [Google Scholar] [CrossRef] [Scilit] [PubMed]
- Smits, S.A.; Leach, J.; Sonnenburg, E.D.; Gonzalez, C.G.; Lichtman, J.S.; Reid, G.; Knight, R.; Manjurano, A.; Changalucha, J.; Elias, J.E.; et al. Seasonal Cycling in the Gut Microbiome of the Hadza Hunter-Gatherers of Tanzania. Science 2017, 357, 802–806. [Google Scholar] [CrossRef] [Scilit] [PubMed]
- Tamburini, F.B.; Maghini, D.; Oduaran, O.H.; Brewster, R.; Hulley, M.R.; Sahibdeen, V.; Norris, S.A.; Tollman, S.; Kahn, K.; Wagner, R.G.; et al. Short- and Long-Read Metagenomics of Urban and Rural South African Gut Microbiomes Reveal a Transitional Composition and Undescribed Taxa. Nat. Commun. 2022, 13, 926. [Google Scholar] [CrossRef] [Scilit] [PubMed]
- Oduaran, O.H.; Tamburini, F.B.; Sahibdeen, V.; Brewster, R.; Gómez-Olivé, F.X.; Kahn, K.; Norris, S.A.; Tollman, S.M.; Twine, R.; Wade, A.N.; et al. Gut Microbiome Profiling of a Rural and Urban South African Cohort Reveals Biomarkers of a Population in Lifestyle Transition. BMC Microbiol. 2020, 20, 330. [Google Scholar] [CrossRef] [Scilit] [PubMed]
- Stražar, M.; Temba, G.S.; Vlamakis, H.; Kullaya, V.I.; Lyamuya, F.; Mmbaga, B.T.; Joosten, L.A.B.; Van Der Ven, A.J.A.M.; Netea, M.G.; De Mast, Q.; et al. Gut Microbiome-Mediated Metabolism Effects on Immunity in Rural and Urban African Populations. Nat. Commun. 2021, 12, 4845. [Google Scholar] [CrossRef] [Scilit] [PubMed]
- Rubel, M.A.; Abbas, A.; Taylor, L.J.; Connell, A.; Tanes, C.; Bittinger, K.; Ndze, V.N.; Fonsah, J.Y.; Ngwang, E.; Essiane, A.; et al. Lifestyle and the Presence of Helminths Is Associated with Gut Microbiome Composition in Cameroonians. Genome Biol. 2020, 21, 122. [Google Scholar] [CrossRef] [Scilit] [PubMed]
- Reyes, A.; Durán, C.; Rodríguez-Otálora, S.; Delgado Pugley, D.; Iraola, G.; Domínguez-Bello, M.G.; Lawley, T.D.; Tsukayama, P. A Latin American Perspective on Microbiome Research. Nat. Commun. 2025, 16, 10691. [Google Scholar] [CrossRef] [Scilit] [PubMed]
- Silk, E.T.; Bayer, S.B.; Foster, M.; Roy, N.C.; Taylor, M.W.; Vatanen, T.; Gearry, R.B. Advancing Microbiome Research in Māori Populations: Insights from Recent Literature Exploring the Gut Microbiomes of Underrepresented and Indigenous Peoples. mSystems 2024, 9, e00909–e00924. [Google Scholar] [CrossRef] [Scilit] [PubMed]
- Harrison, L.; Allnutt, T.; Hanieh, S.; Roth-Schulze, A.; Gurruwiwi, G.; Gondarra, V.; Couper, J.; Craig, M.; Davis, E.; Huynh, T.; et al. Indigenous Infants in Remote Australia Retain an Ancestral Gut Microbiome despite Encroaching Westernization. Nat. Comun. 2025, 3, 9904. [Google Scholar] [CrossRef] [Scilit] [PubMed]
- Hug, L.A.; Hatzenpichler, R.; Moraru, C.; Soares, A.R.; Meyer, F.; Heyder, A.; Data Reuse Consortium; Abdallah, R.Z.; Abdalrahem, A.; Abdulkadir, N.; et al. A Roadmap for Equitable Reuse of Public Microbiome Data. Nat. Microbiol. 2025, 10, 2384–2395. [Google Scholar] [CrossRef] [Scilit] [PubMed]
- Hansen, M.E.B.; Rubel, M.A.; Bailey, A.G.; Ranciaro, A.; Thompson, S.R.; Campbell, M.C.; Beggs, W.; Dave, J.R.; Mokone, G.G.; Mpoloka, S.W.; et al. Population Structure of Human Gut Bacteria in a Diverse Cohort from Rural Tanzania and Botswana. Genome Biol. 2019, 20, 16. [Google Scholar] [CrossRef] [Scilit] [PubMed]
- Deschasaux, M.; Bouter, K.E.; Prodan, A.; Levin, E.; Groen, A.K.; Herrema, H.; Tremaroli, V.; Bakker, G.J.; Attaye, I.; Pinto-Sietsma, S.-J.; et al. Depicting the Composition of Gut Microbiota in a Population with Varied Ethnic Origins but Shared Geography. Nat. Med. 2018, 24, 1526–1531. [Google Scholar] [CrossRef] [Scilit] [PubMed]
- Keohane, D.M.; Ghosh, T.S.; Jeffery, I.B.; Molloy, M.G.; O’Toole, P.W.; Shanahan, F. Microbiome and Health Implications for Ethnic Minorities after Enforced Lifestyle Changes. Nat. Med. 2020, 26, 1089–1095. [Google Scholar] [CrossRef] [Scilit] [PubMed]
- Sun, S.; Wang, H.; Howard, A.G.; Zhang, J.; Su, C.; Wang, Z.; Du, S.; Fodor, A.A.; Gordon-Larsen, P.; Zhang, B. Loss of Novel Diversity in Human Gut Microbiota Associated with Ongoing Urbanization in China. mSystems 2022, 7, e00200–e00222. [Google Scholar] [CrossRef] [Scilit] [PubMed]
- Vinogradova, E.; Mukhanbetzhanov, N.; Nurgaziyev, M.; Jarmukhanov, Z.; Aipova, R.; Sailybayeva, A.; Bekbossynova, M.; Kozhakhmetov, S.; Kushugulova, A. Impact of Urbanization on Gut Microbiome Mosaics across Geographic and Dietary Contexts. mSystems 2024, 9, e00585-24. [Google Scholar] [CrossRef] [Scilit] [PubMed]
- Schaan, A.P.; Vidal, A.; Zhang, A.-N.; Poyet, M.; Alm, E.J.; Groussin, M.; Ribeiro-dos-Santos, Â. Temporal Dynamics of Gut Microbiomes in Non-Industrialized Urban Amazonia. mSystems 2024, 9, e00707-23. [Google Scholar] [CrossRef] [Scilit] [PubMed]
- Wang, J.; Zhang, Z.; Chen, Y.; Zhou, X.; Xiang, J.; Yang, C.; Rodionov, D.A.; Osterman, A.L.; Qiu, Q.; Deng, Y.; et al. Exploring Differences in the Human Gut Microbiome between Han Chinese and Non-Chinese Populations. Genome Biol. 2026, 27, 34. [Google Scholar] [CrossRef] [Scilit] [PubMed]
- Munung, N.S.; Ewuoso, C.; Chimusa, E.R.; Ogundiran, T. Cultivating an Equity-Oriented Data Sharing Culture for African Health Research Initiatives. Nat. Commun. 2025, 16, 8122. [Google Scholar] [CrossRef] [Scilit] [PubMed]
- Feng, X.; Li, H. Evaluating and Improving the Representation of Bacterial Contents in Long-Read Metagenome Assemblies. Genome Biol. 2024, 25, 92. [Google Scholar] [CrossRef] [Scilit] [PubMed]
- Sanderson, N.D.; Hopkins, K.M.V.; Colpus, M.; Parker, M.; Lipworth, S.; Crook, D.; Stoesser, N. Evaluation of the Accuracy of Bacterial Genome Reconstruction with Oxford Nanopore R10.4.1 Long-Read-Only Sequencing. Microb. Genom. 2024, 10, 001246. [Google Scholar] [CrossRef] [Scilit] [PubMed]
- Wick, R.R.; Judd, L.M.; Holt, K.E. Assembling the Perfect Bacterial Genome Using Oxford Nanopore and Illumina Sequencing. PLoS Comput. Biol. 2023, 19, e1010905. [Google Scholar] [CrossRef] [Scilit] [PubMed]

Disclaimer/Publisher’s Note: The statements, opinions and data contained in all publications are solely those of the individual author(s) and contributor(s) and not of MDPI and/or the editor(s). MDPI and/or the editor(s) disclaim responsibility for any injury to people or property resulting from any ideas, methods, instructions or products referred to in the content. |
© 2026 by the authors. Licensee MDPI, Basel, Switzerland. This article is an open access article distributed under the terms and conditions of the Creative Commons Attribution (CC BY) license.