Article

Computational Design and Structure-Guided Optimization of Anti-Osteopontin Monoclonal Antibodies at the Intersection of Obesity, Type 2 Diabetes, and Hepatocellular Carcinoma


1
Department of Regenerative Medicine, Cell Science Research Center, Royan Institute for Stem Cell Biology and Technology, ACECR, Tehran 16635-148, Iran
2
Molecular Medicine Department, Biotechnology Research Center (BRC), Pasteur Institute of Iran, Tehran 1316943551, Iran
3
Liver Transplantation Research Center, Tehran University of Medical Sciences, Tehran 1416634793, Iran
4
Digestive Disease Research Institute, Tehran University of Medical Sciences, Tehran 1416634793, Iran
5
Experimental Cancer Medicine, Institution for Laboratory Medicine, Karolinska University Hospital, Karolinska Institute, 141 52 Stockholm, Sweden
6
Department of Cellular and Molecular Biology, Faculty of Sciences and Advanced Technologies in Biology, University of Science and Culture, Tehran 1461968151, Iran
*
Author to whom correspondence should be addressed.
†
These authors contributed equally to this work.
J. Genome Biotechnol. Genet. 2026, 1(3), 19; https://doi.org/10.3390/jgbg1030019
Submission received: 22 July 2026 / Revised: 17 September 2026 / Accepted: 24 September 2026 / Published: 6 October 2026

Abstract

Hepatocellular carcinoma (HCC) remains a leading cause of cancer-related mortality, and obesity and type 2 diabetes (T2D) are recognized metabolic risk factors for its development. In this study, disease-associated gene lists for T2D and obesity were integrated with differentially expressed genes from the Cancer Genome Atlas Liver Hepatocellular Carcinoma cohort (TCGA-LIHC). Analysis of 371 primary HCC and 50 solid-tissue normal samples identified 2123 differentially expressed genes, including 715 upregulated and 1408 downregulated genes. The intersection of the 715 upregulated genes with 2055 T2D-associated and 1944 obesity-associated protein-coding genes identified 29 common candidates. Functional annotation identified 14 extracellular-region genes, which were evaluated using protein–protein interaction analysis and ranked using the maximal clique centrality algorithm. SPP1, encoding Osteopontin (OPN), was the highest-ranked candidate. SPP1 expression distinguished HCC from non-tumor tissues with an area under the receiver operating characteristic curve of 0.714 (95% confidence interval: 0.666–0.760). High SPP1 expression was associated with poorer overall survival, and continuous log2-transformed SPP1 expression remained independently associated with survival after adjustment for age, sex, and pathological stage. OPN was subsequently subjected to structural modeling, molecular dynamics simulation, B-cell epitope prediction, and the structure-guided optimization of anti-OPN monoclonal antibodies. Molecular docking and binding affinity analyses revealed that optimized mAbs exhibited predicted Kd values corresponding to approximately 10- to 650-fold stronger binding affinity and increased predicted hydrogen bonding at the interface. These findings support SPP1 as a promising immunotherapeutic target in metabolically driven HCC, warranting further experimental validation.

1. Introduction

A sedentary lifestyle and a Western diet are key factors contributing to the rising incidence and prevalence of liver complications, including cirrhosis and cancer [1]. Primary liver cancer, which ranks sixth globally in incidence, is the third leading cause of cancer-related deaths due to its aggressive nature and poor prognosis. Hepatocellular carcinoma (HCC) accounts for approximately 75% of all liver cancers, while cholangiocarcinoma is less common [2]. Major risk factors for HCC include viral infections, chronic alcohol consumption, gender, ethnicity, and liver-affecting conditions such as obesity and type 2 diabetes [3].
Obesity is generally a preventable cause of disease and a significant public health concern. Apart from its metabolic consequences, it has also been identified as an established risk factor in cancers, particularly in HCC. Abdominal (visceral) fat, as measured by waist circumference, is a risk factor. Whereas obesity is associated with HCC through many mechanisms, the exact route through which fatty liver progresses to inflammation and then to cancer is not fully known. [4]. Non-alcoholic fatty liver disease encompasses a heterogeneous spectrum from simple steatosis to non-alcoholic steatohepatitis, progressive fibrosis, and cirrhosis, with a minority of patients developing HCC, sometimes even in the absence of cirrhosis; insulin resistance, lipotoxicity-related oxidative stress, and chronic inflammation contribute to disease progression and hepatocarcinogenesis [5,6]. Diabetes independently increases the risk of liver cancer by two- to three-fold, probably because insulin resistance increases oxidative stress in the liver, promoting inflammation leading to cancer. [7,8,9]. Many studies showed that, in diabetic and cirrhotic patients, the risk of liver cancer is high [7,10,11,12]. However, there are still controversial discussions regarding the different effects of diabetes on the risk of liver cancer based on the etiology of cirrhosis [7,9].
While considerable progress has been made in surgical and locoregional therapies worldwide [13], eventually, 50–60% of all patients with liver cancer require systemic medications [14,15]. More than a decade has passed since targeted drugs became prominent in the management of advanced liver cancer. These generally extend overall survival (OS) by about 11–14 months for first-line drugs like sorafenib and lenvatinib and donafenib in China [16], while the second-line drugs include regorafenib, cabozantinib, and ramucirumab, increasing OS by 8–11 months [13,15]. Sorafenib, a multi-kinase inhibitor of RAF kinases, VEGFRs, and PDGFRs, and lenvatinib, which primarily targets VEGFR1-3, FGFR1-4, PDGFRα, RET, and KIT, are commonly used first-line targeted agents. Donafenib, a structural derivative of sorafenib, also inhibits RAF- and receptor tyrosine kinase–dependent angiogenic signaling. Second-line options include regorafenib, which targets VEGFR1-3, TIE2, PDGFR, FGFR, KIT, RET, RAF, and CSF1R; cabozantinib, which inhibits MET, VEGFR2, AXL, and additional kinases; and ramucirumab, an anti-VEGFR2 monoclonal antibody [17,18]. More recently, immunotherapies have altered the management of HCC treatment; these include cytokines [19,20,21], monoclonal antibodies [22], vaccines [23,24,25], adoptive immune cell transfers (T [26,27], DC therapy [28,29], NK and NK-T cell therapies [30,31,32,33]), and finally, the application of toll-like receptor agonists [34,35,36], which have transformed HCC management.
Monoclonal antibodies represent prototypes of targeted therapies developed through recombinant technology and have greatly improved cancer research and clinical oncology. Their targeted approach is based on specificity for binding to distinct regions on target antigens, a concept developed about 30 years ago, enhancing their therapeutic efficacy [37]. Osteopontin (OPN), encoded by SPP1, is a multifunctional secreted phosphoglycoprotein that interacts with integrins and CD44 to regulate cell adhesion, migration, and immune responses [38,39]. OPN has been implicated in cancer growth and metastasis [40]. In HCC, SPP1 overexpression has been associated with increased tumor-cell growth, vascular invasion, macrophage infiltration, and poorer survival [41,42]. Anti-OPN antibodies could potentially function as both direct anti-tumor agents (by blocking OPN-integrin interactions that promote proliferation, migration, and angiogenesis) and as immunomodulatory agents (by reversing OPN-mediated immunosuppression in the tumor microenvironment). Anti-OPN antibodies might be most effective as adjuvant therapy in combination with existing treatments such as tyrosine kinase inhibitors (sorafenib, lenvatinib) or immune checkpoint inhibitors, although this hypothesis requires preclinical testing. However, these mechanisms strongly require experimental validation.
In this study, we have performed a comprehensive bioinformatic analysis of integrated obesity- and T2D-associated protein-coding gene lists retrieved from NCBI Gene with genes upregulated in the Cancer Genome Atlas Liver Hepatocellular Carcinoma (TCGA-LIHC) cohort. The common candidates were evaluated through functional annotation and protein–protein interaction network analysis to prioritize extracellular proteins that may connect metabolic disease-associated molecular processes with HCC. The diagnostic and prognostic relevance of the highest-ranked candidate was subsequently examined using TCGA-LIHC expression and clinical data. Finally, a structure-guided computational strategy was applied to design and optimize monoclonal antibodies against the selected protein. The present bioinformatics pipeline links with the identified gene and shows that it is specifically dysregulated in HCC patients with clinically documented obesity or T2D. However, this gene-set integration represents a hypothesis-generating approach and needs further in vitro and in vivo validation of targeted mAbs for eventual translation into therapy in these patients.

2. Results

2.1. Identification of Differentially Expressed Genes in TCGA-LIHC

The TCGA-LIHC mRNA dataset included 421 samples after sample filtering and the removal of duplicate specimens, comprising 371 primary HCC samples and 50 solid-tissue normal samples. Differential-expression analysis identified 2123 genes using the predefined thresholds of |log2 fold change| > 1 and Benjamini–Hochberg false-discovery rate < 0.05. Of these genes, 715 were upregulated, and 1408 were downregulated in primary HCC samples relative to solid-tissue normal samples. Because the downstream objective was to prioritize overexpressed extracellular candidates for antibody-based targeting, only the 715 upregulated genes were retained for subsequent gene-set intersection and target-prioritization analyses. The complete differential-expression results, including gene symbol, log2 fold change, average expression, test statistic, raw p-value, and false-discovery rate (FDR), are provided in Supplementary Table S1.

2.2. Intersection of HCC, Obesity, and Type 2 Diabetes Gene Sets

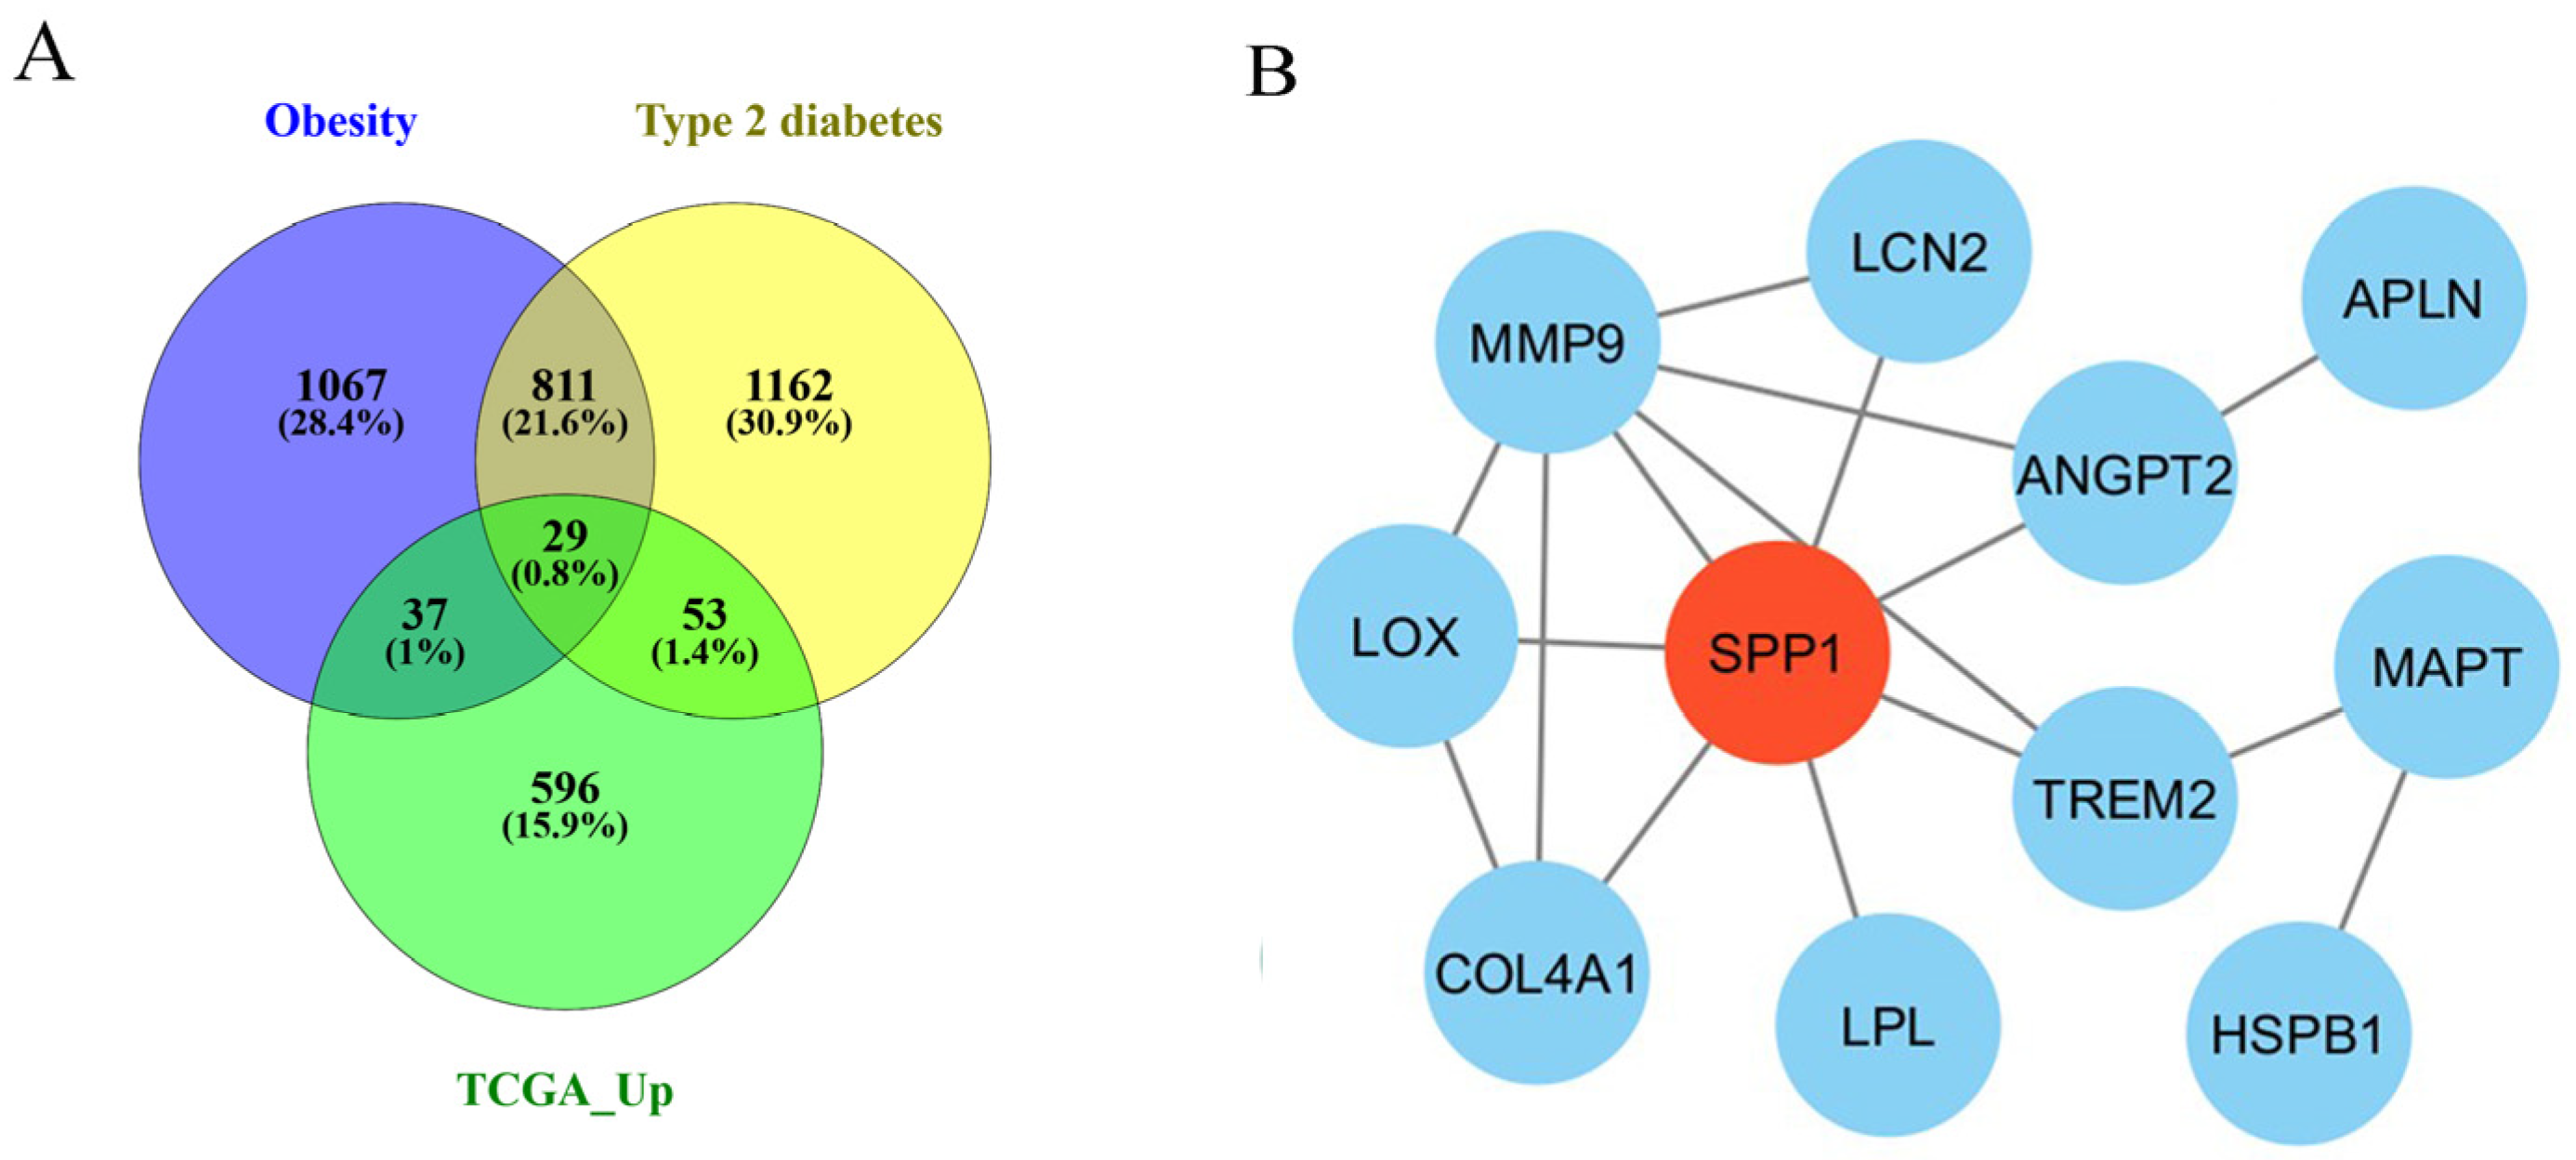
NCBI Gene searches identified 2055 protein-coding genes associated with T2D and 1944 protein-coding genes associated with obesity after restricting the searches to Homo sapiens. The T2D- and obesity-associated gene lists were intersected with the 715 genes upregulated in TCGA-LIHC. This three-way comparison identified 29 common genes (Figure 1A). These genes represent candidates associated with both metabolic disease terms and increased expression in HCC; however, the intersection does not demonstrate HCC-specific expression changes in individual patients with obesity or T2D.

2.3. Functional Annotation and Hub-Gene Prioritization

The 29 genes identified in the three-way intersection of TCGA-LIHC upregulated genes, obesity-associated genes, and T2D-associated genes are shown in Figure 1A. These shared candidates were submitted to DAVID for Gene Ontology cellular-component analysis. Fourteen genes annotated to the extracellular region were retained for further evaluation because extracellular proteins may be more accessible to antibody-based targeting. Protein–protein interactions among these 14 candidates were then analyzed using STRING, and the resulting interaction network is shown in Figure 1B. Genes without interactions at the selected STRING confidence threshold were not displayed. The network was imported into Cytoscape, where hub-gene ranking was performed using the maximal clique centrality algorithm implemented in the CytoHubba plugin. SPP1 received the highest ranking and was therefore selected for subsequent diagnostic, prognostic, and structural analyses. Figure 1. The integration of HCC, obesity, and type 2 diabetes gene sets and prioritization of extracellular candidates. A. Three-way overlap between genes upregulated in TCGA-LIHC, obesity-associated protein-coding genes, and type 2 diabetes-associated protein-coding genes. Twenty-nine genes were shared among the three lists. B. STRING protein–protein interaction network of the 14 common genes annotated to the extracellular region. CytoHubba analysis using the maximal clique centrality algorithm ranked SPP1 as the highest-scoring candidate.

2.4. Diagnostic and Prognostic Evaluation of SPP1

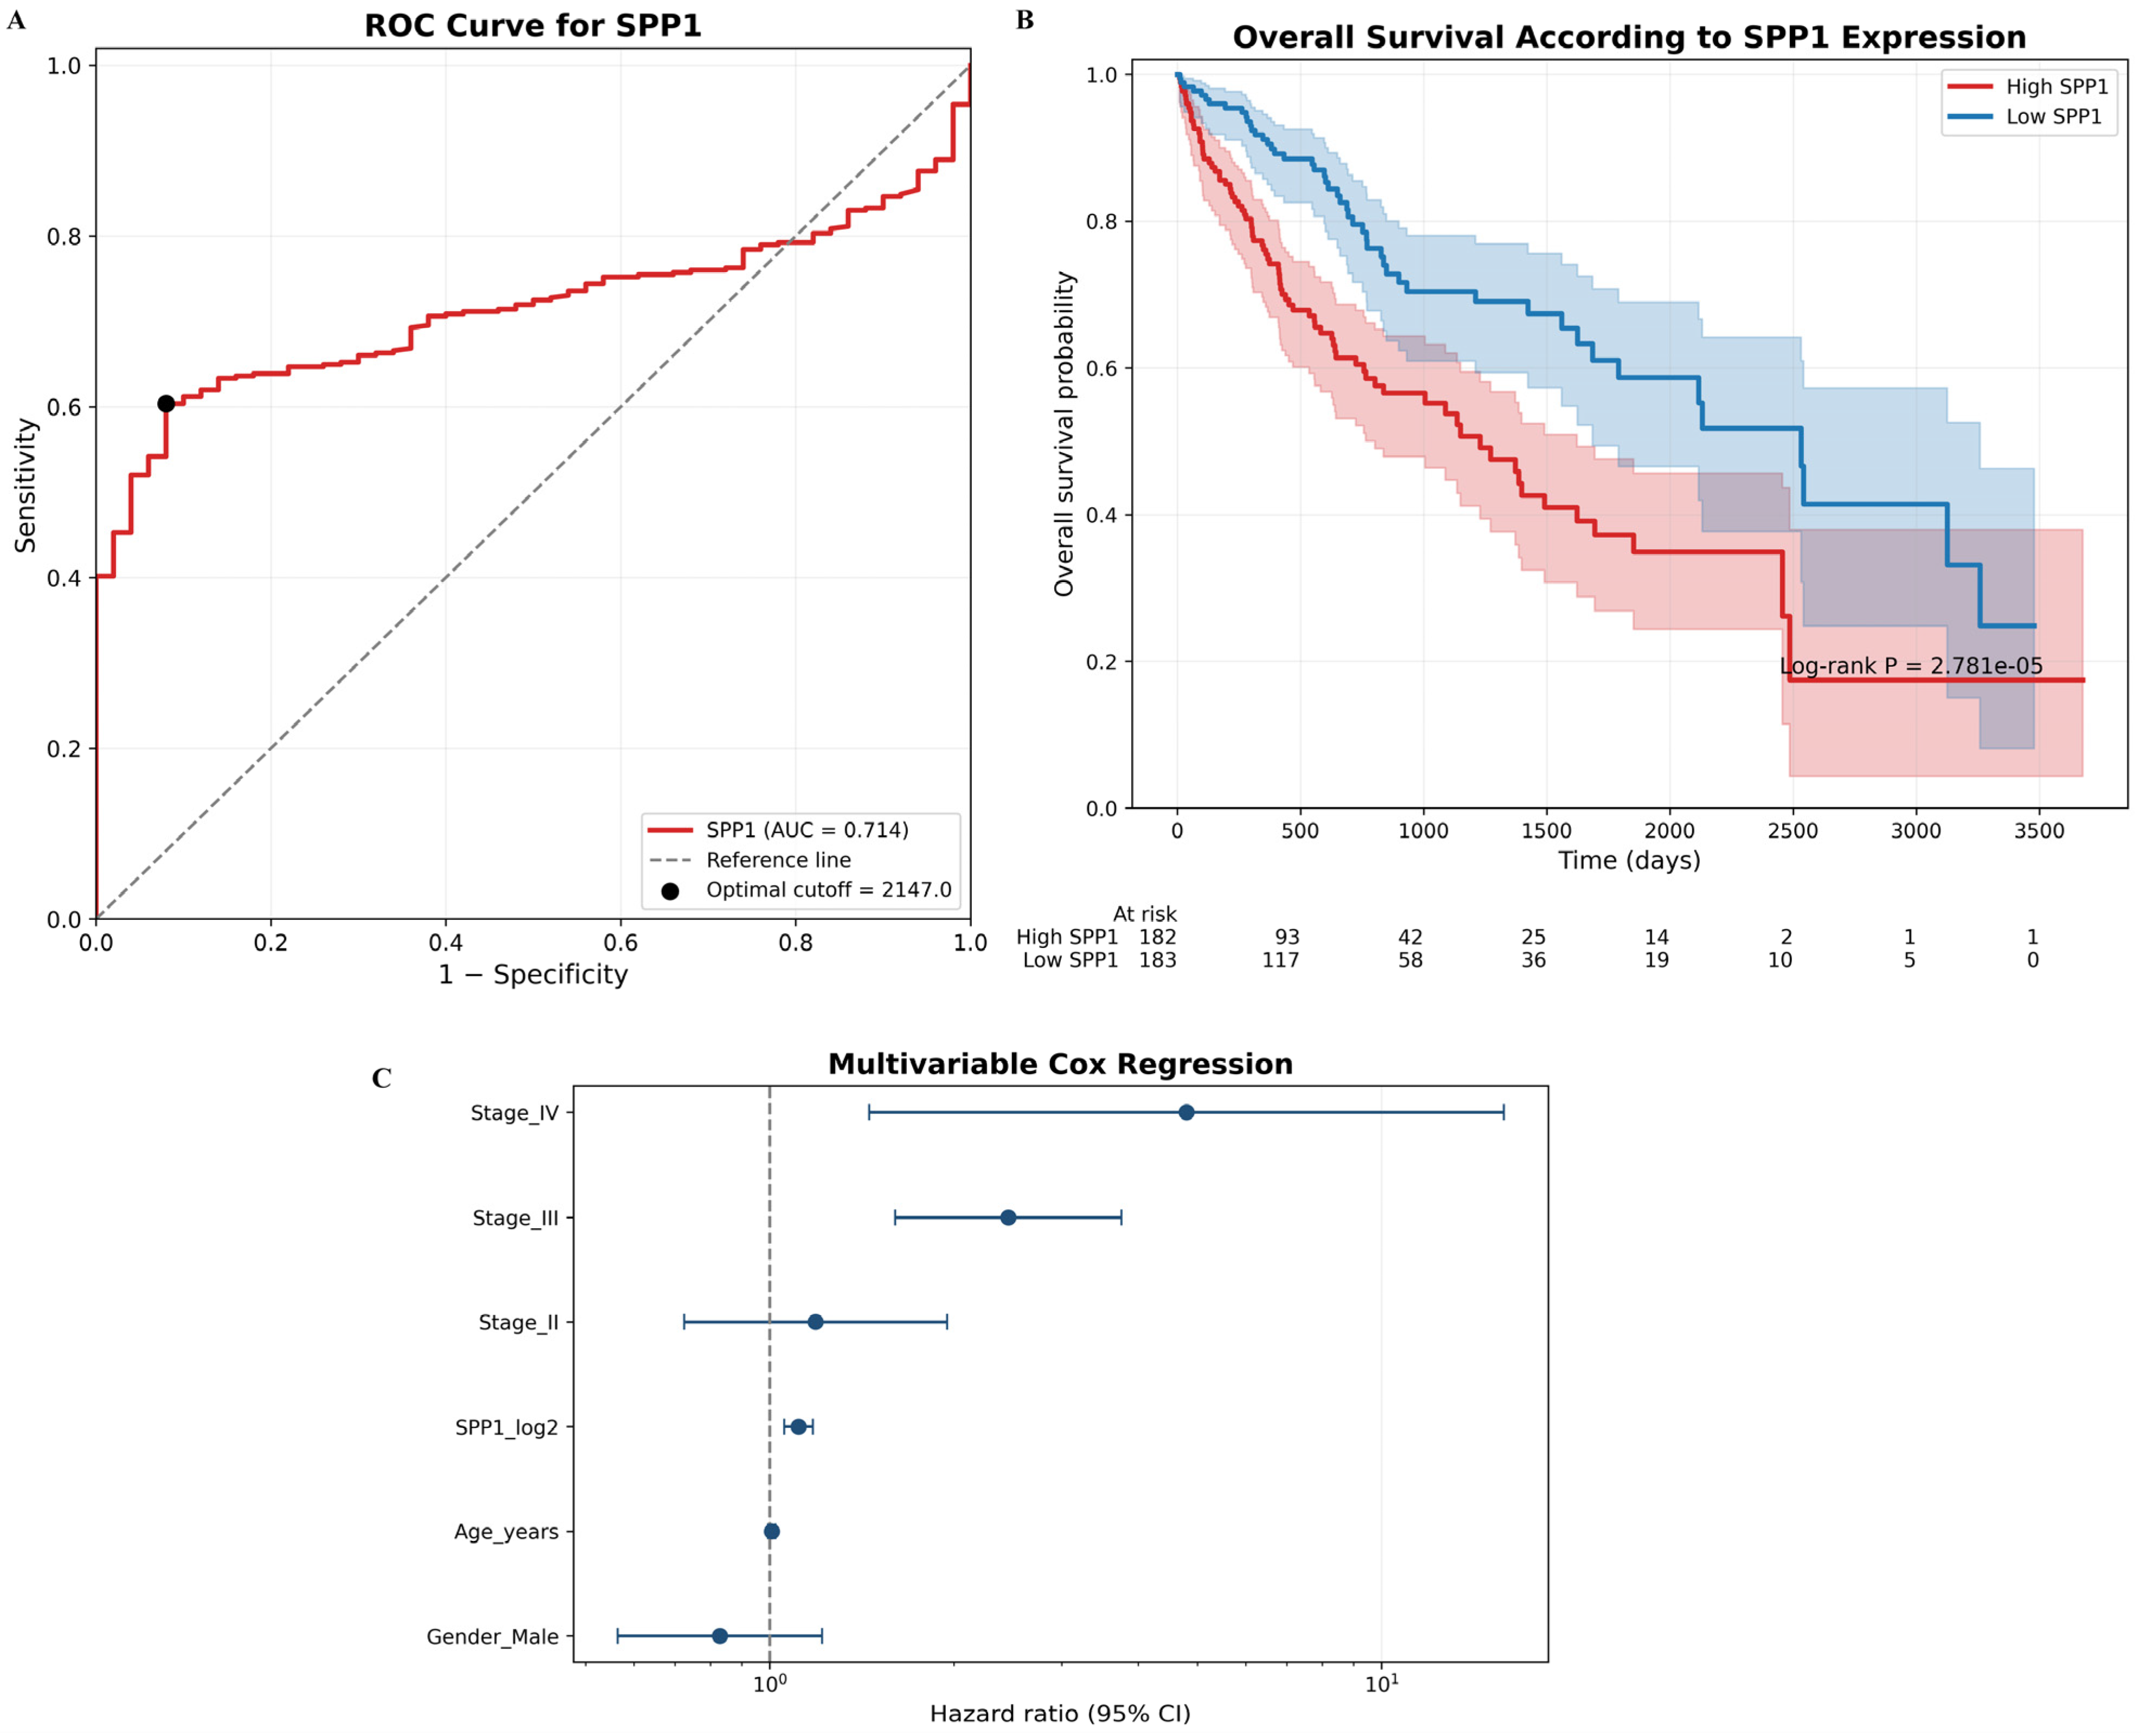
A receiver operating characteristic analysis was performed using SPP1 expression in 371 primary HCC and 50 solid-tissue normal samples. SPP1 distinguished the two sample groups with an area under the curve of 0.714 (95% CI: 0.666–0.760; Figure 2A). The Youden index identified an expression cutoff of 2147, corresponding to a sensitivity of 60.4% and a specificity of 92.0%.
Expression and clinical records were matched using the first 12 characters of the TCGA patient barcode. Overall-survival information was available for 365 patients, including 130 deaths. Patients were divided using the median untransformed SPP1 expression value of 4159, resulting in 182 patients in the high-expression group and 183 in the low-expression group. Kaplan–Meier analysis demonstrated significantly poorer overall survival in the high-SPP1 group than in the low-SPP1 group (log-rank p < 0.001; Figure 2B). In univariable Cox analysis, high SPP1 expression was associated with a greater risk of death than low expression (HR = 2.12, 95% CI: 1.48–3.04; p < 0.001). In a multivariable Cox regression model including 341 patients with complete covariate data, continuous log2(SPP1 + 1) expression remained independently associated with poorer overall survival after adjustment for age, sex, and pathological stage (adjusted HR = 1.11, 95% CI: 1.06–1.18; p < 0.001; Figure 2C). Pathological stages III and IV were also independently associated with poorer overall survival compared with stage I, whereas age, sex, and stage II were not statistically significant. An evaluation of Schoenfeld residuals revealed no evidence of violation of the proportional-hazards assumption (Table 1).

2.5. Model Validation

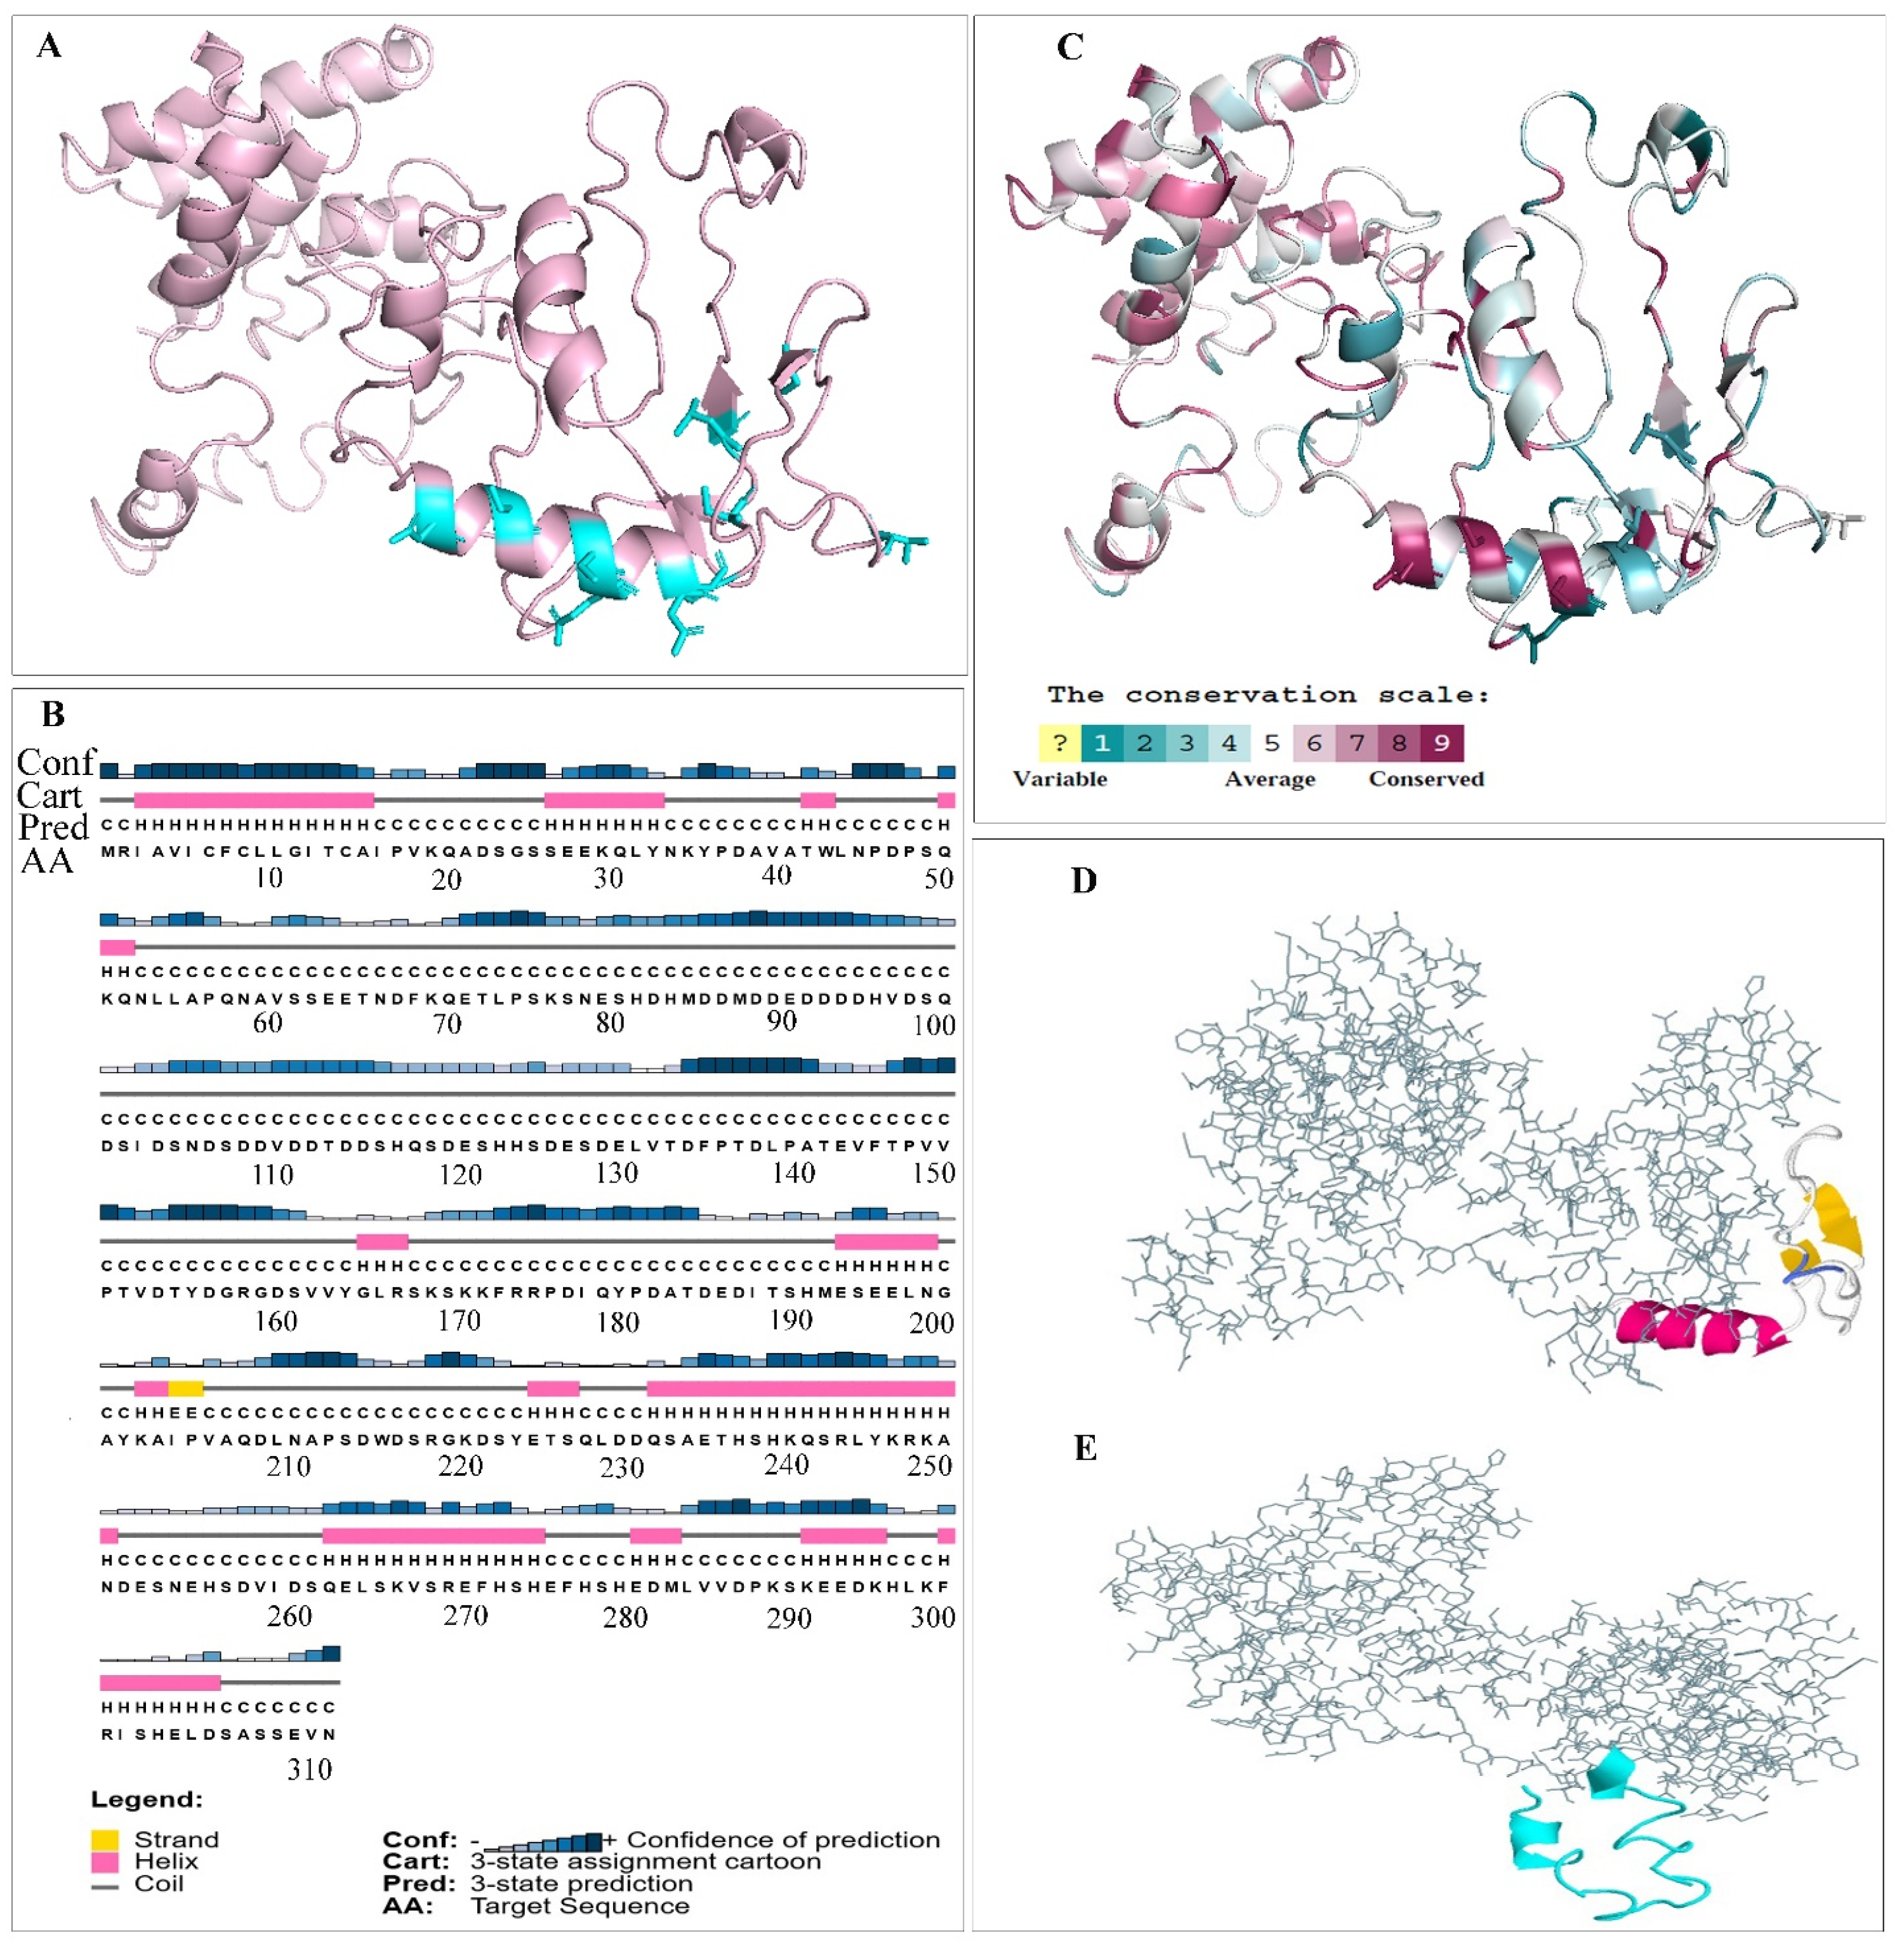
Osteopontin consists of 314 amino acids with several extracellular conserved motifs [38,39]. The cartoon view of the predicted model is depicted in Figure 3A. The secondary structure of the protein showed regions characterized by disorder, helix, and strand. The level of predictive confidence is designated from the lowest to the highest (Figure 3B). The evaluation of atomic non-bonded interactions within the predicted structure was determined by ERRAT. The model achieved an ERRAT score of 49.67, which is below the typical threshold for high-resolution experimental structures. Higher scores are indicative of the higher quality of this model. Finally, a Ramachandran analysis performed on the 3D structure via PROCHECK revealed that 92% of residues were detected in the plot’s most favored and allowed regions (Table 2). While 97.8% of residues were outside the disallowed region, the 74.5% occupancy of the most favored region is below that of typical high-quality experimental structures. These validation metrics indicate that the model is suitable for exploratory structural analysis but should not be interpreted as a high-resolution representation of native OPN.

2.6. Structural Stability Analysis

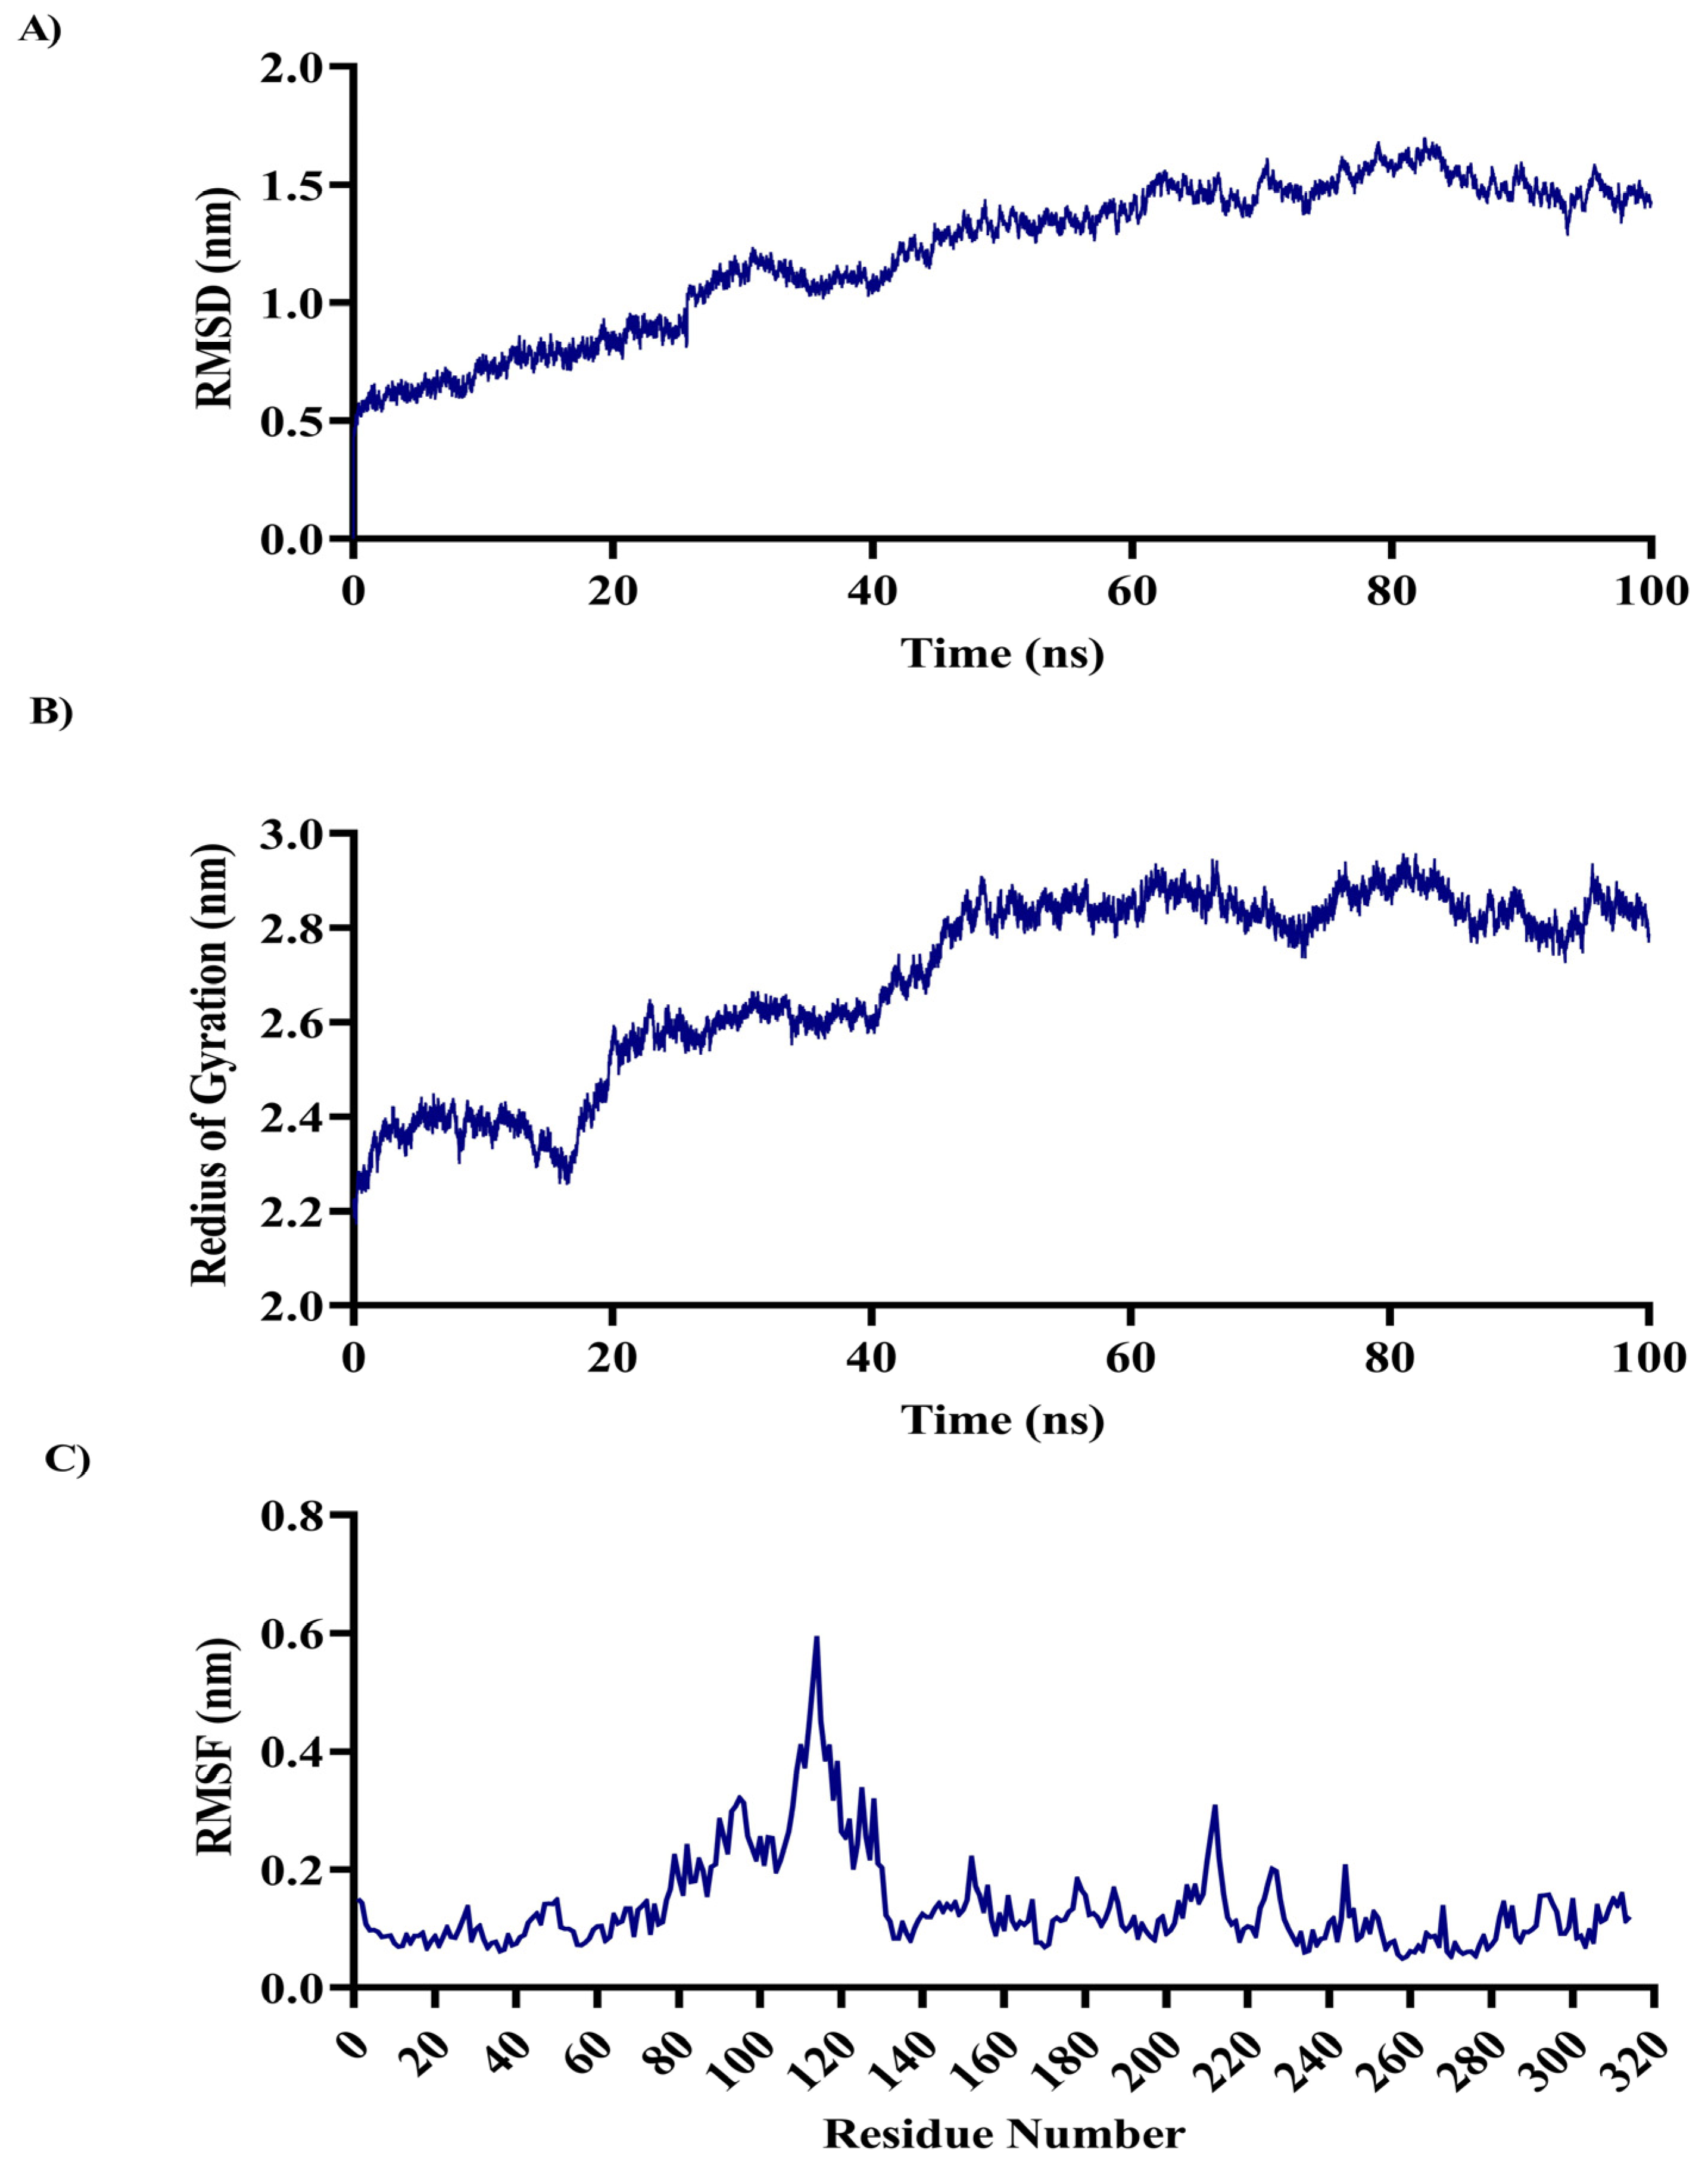
The backbone RMSD of OPN increased progressively during the first ~80 ns and approached a plateau near 1.6 nm toward the end of the 100-ns trajectory, suggesting a gradual approach toward dynamic equilibrium under the simulated conditions (Figure 4A). The radius of gyration remained relatively stable around 2.7 nm, and RMSF analysis identified flexible regions consistent with predicted disorder (Figure 4B,C). Given the moderate RMSD convergence and the absence of replicate simulations, these results should be interpreted as exploratory indicators of conformational behavior rather than definitive evidence of structural stability.

2.7. Binding Pocket Predictions

Osteopontin contains several well-characterized functional motifs that mediate its diverse biological activities, including an RGD motif (residues 159–161), SVVYGLR motif (residues 162–168), calcium-binding domain (residues 216–228), heparin-binding domain, and CD44 receptor-binding domain [38,43]. To define a candidate binding pocket for antibody-docking, residues were prioritized using an integrative computational workflow. First, ConSurf analysis was used to identify functional residues with moderate-to-high evolutionary conservation within the 3D structure. The amino acids are represented in various colors according to their conservation, with a color gradient from cyan to purple signifying a transition from variable to highly conserved residues (Figure 3C). Second, ElliPro and BepiPred predictions were examined to retain residues located within or adjacent to high-propensity conformational B-cell epitopes (residues 185–230 and 235–253). Third, only residues with predicted solvent accessibility consistent with surface exposure were considered. Finally, residues were required to cluster spatially in the 3D model to form a continuous or dis-continuous interface compatible with antibody binding. Based on these criteria, residues 188, 191, 195, 196, 199, 200, 207, 219, 228, and 230 were selected as the candidate binding pocket for molecular docking based on the computational model (Figure 3D,E). These residues represent predicted interaction sites that require experimental validation.

2.8. Computational Antibody Design and Structural Modeling

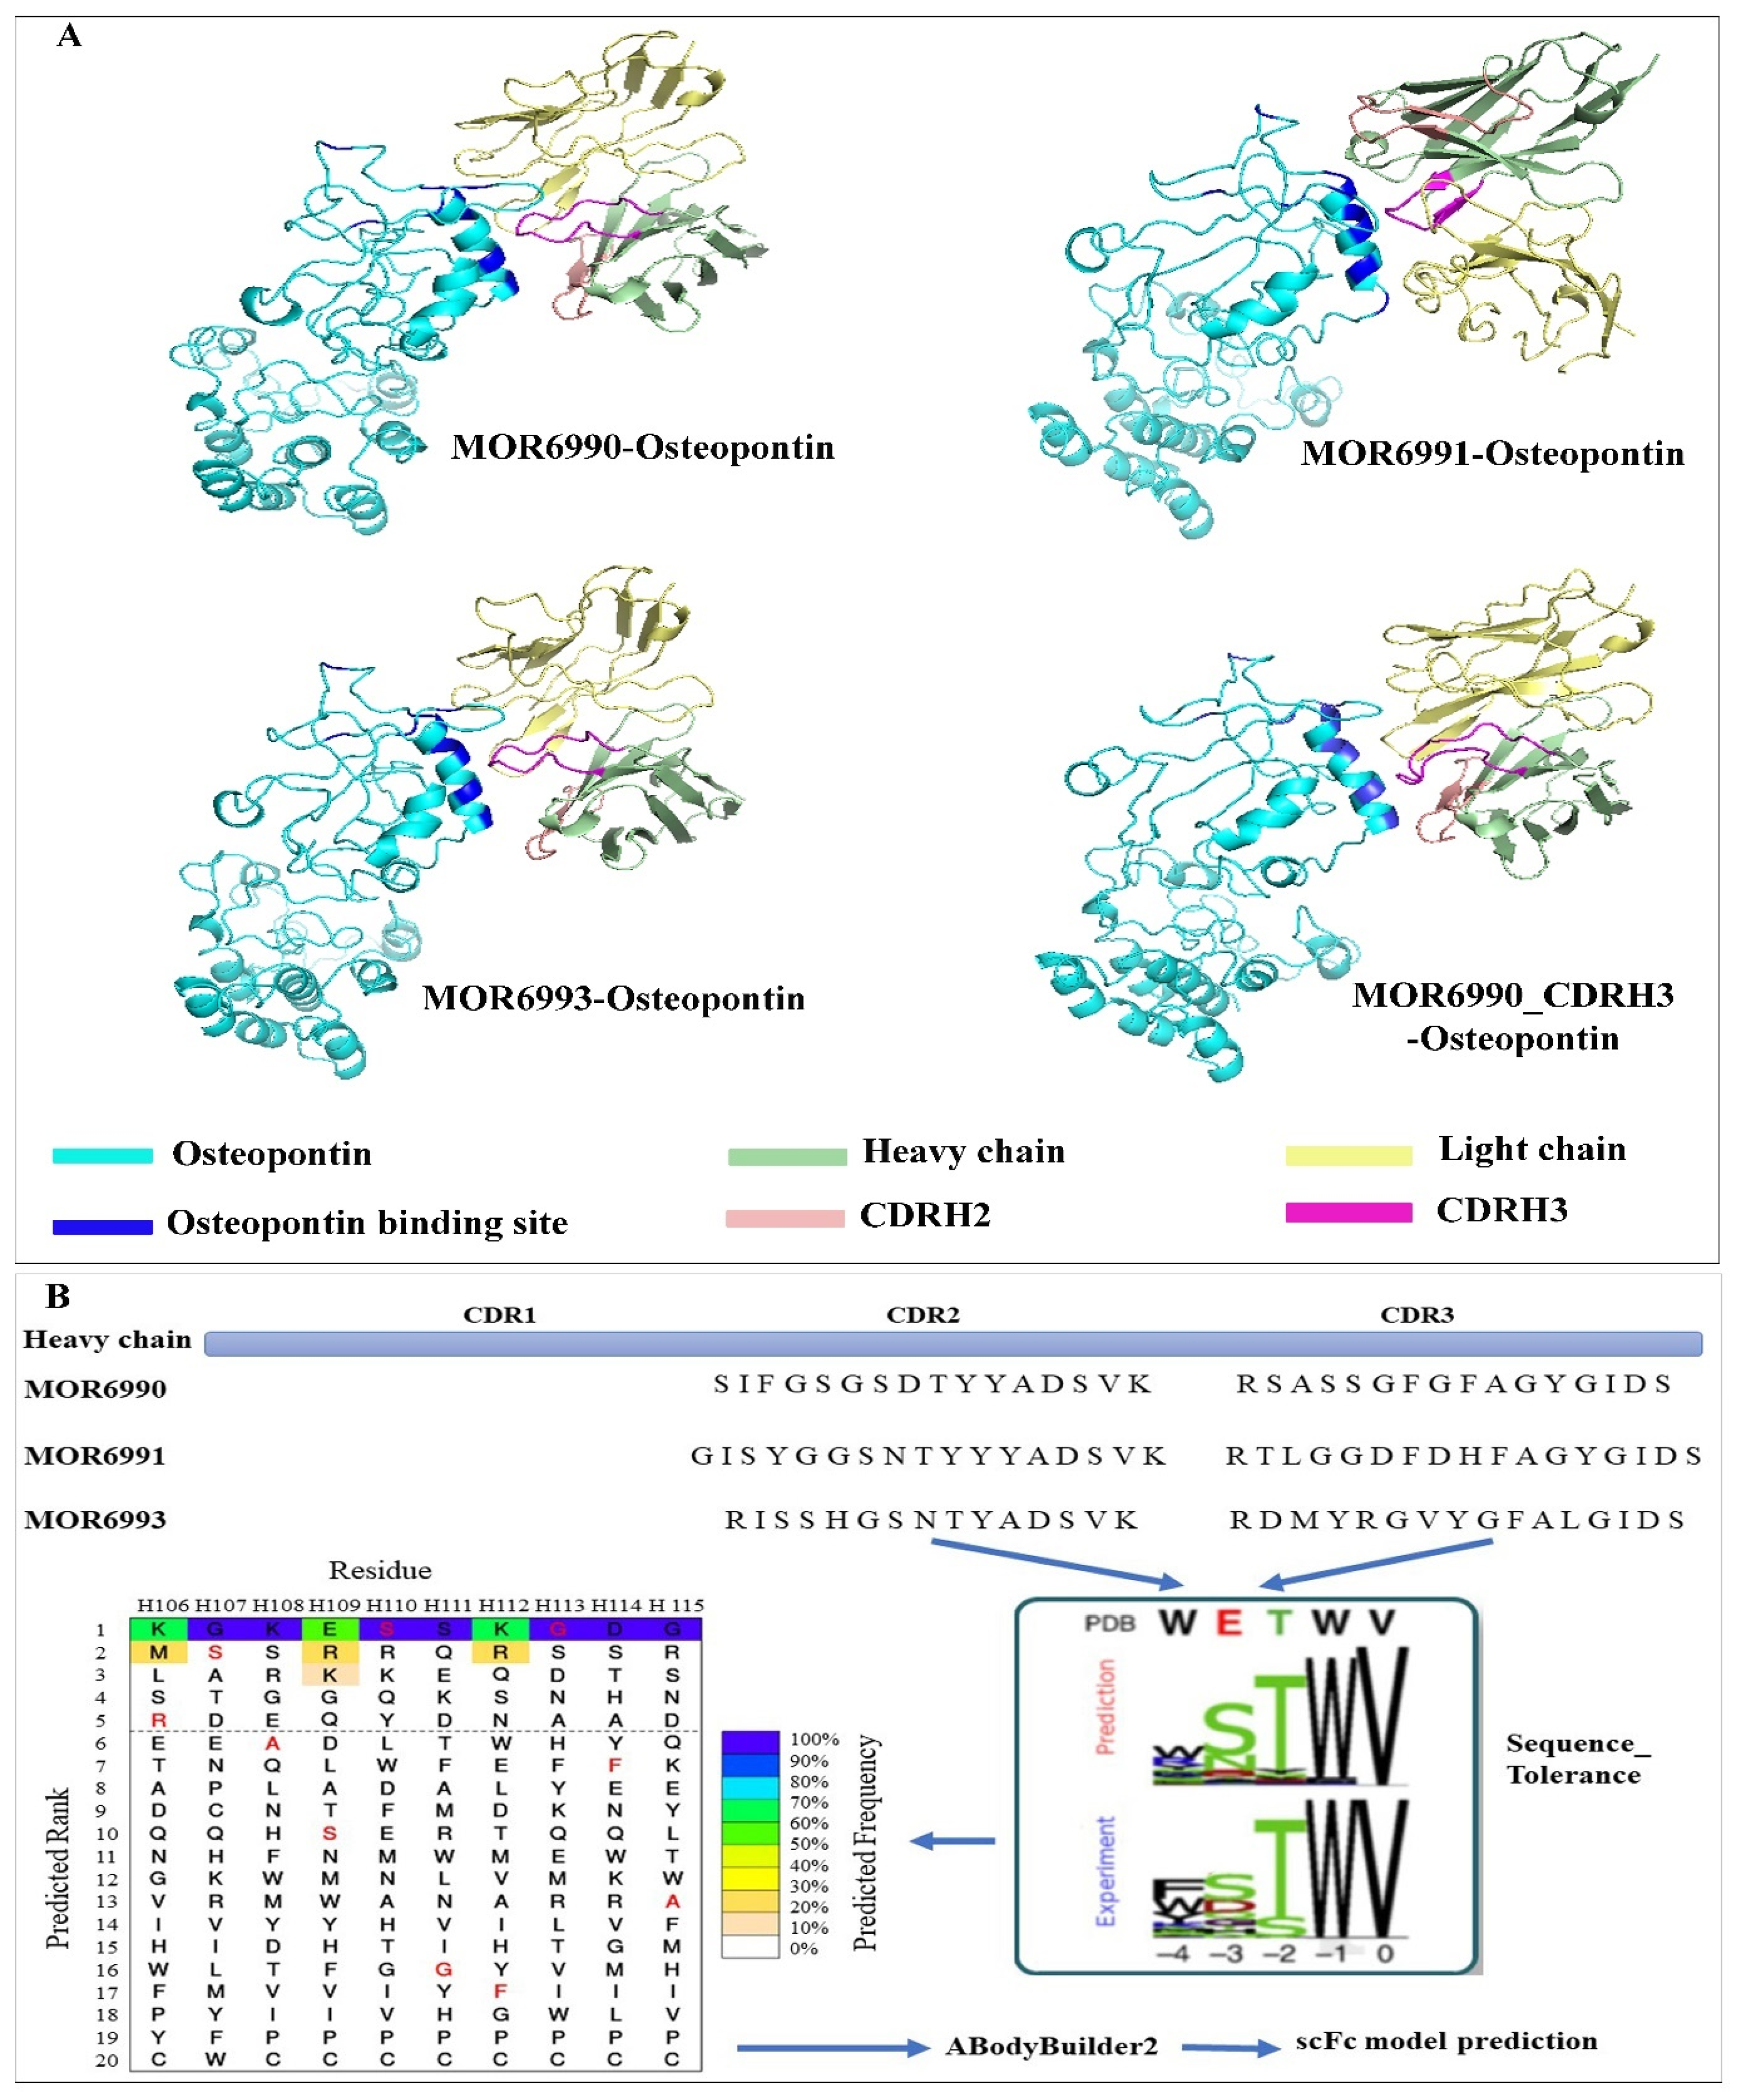
The 3D structure of the scFv region of antibodies was predicted using ABodyBuilder2, where the sequences of heavy and light chains of anti-Osteopontin antibodies were defined as input (Figure 5A). The scFv-Osteopontin complex was applied as the input of the Sequence-tolerance protocol. The output was a series of mutated sequences inserted as CDRH2 or CDRH3 of heavy chains. The new sequences were used as input for ABodyBuilder2 to generate the models with default parameters and IMGT numbering schemes. (Figure 5B).

2.9. Antibody-Osteopontin Interaction and Binding-Affinity Analysis

The interaction between Osteopontin and the antibodies was predicted by the ClusPro server using antibody mode. The output complexes were ranked based on the coefficient weight score calculated according to the energy formula in the Kozakov et al. protocol [44]. The top-ranked complexes were submitted to the PRODIGY web server to calculate binding affinity and Kd. A lower Kd value indicates stronger predicted binding affinity. In our analysis, we evaluated the VH-OPN and VL-OPN interfaces separately for each scFv-OPN complex. Comparing the predicted Kd values of the parent and optimized antibody heavy chains indicated that Kd decreased by 10- to 650-fold (for MOR6990-CDRH3, from 3.8 × 10⁻⁶ M to 5.9 × 10⁻⁹ M) in the optimized models, corresponding to stronger predicted binding affinity. Similarly, the number of hydrogen bonds in the optimized models increased compared to the original model (Table 3).

3. Discussion

In addition to viral hepatitis, metabolic factors, including T2D, obesity, dyslipidemia, and metabolic syndromes, have increasingly been proposed as risk factors for HCC [45,46,47,48]. Also, the more significant impact of metabolic syndromes on HCC has been reported in populations with lower rates of viral hepatitis [49]. However, there has been no statistically significant evidence of the effects of metabolic factors on HCC in patients with chronic liver diseases.
Regrettably, the global prognosis for HCC patients remains poor across all regions [50]. As a heterogeneous tumor characterized by alterations in multiple signaling pathways, HCC presents significant challenges in treatment decision-making due to its complex pathophysiology [51]. Despite remarkable advances in the treatment of HCC over the past decade, patient survival has shown only modest improvement, primarily due to the limited availability of effective therapeutic modalities [52]. Importantly, advancements in understanding the molecular mechanisms underlying HCC have facilitated the development of targeted therapies, including mAbs and immunotherapies [53]. Consequently, these advancements highlight the discovery of novel mAbs and therapeutic targets through molecular profiling techniques.
This investigation employed an integrative computational approach to prioritize molecular candidates shared among HCC, obesity, and T2D. Genes upregulated in TCGA-LIHC were intersected with obesity- and T2D-associated protein-coding gene lists retrieved from NCBI Gene. The common genes were subsequently evaluated through functional annotation and protein–protein interaction network analysis. This approach prioritized SPP1 as the highest-ranked extracellular candidate. Importantly, the obesity and T2D gene lists represent disease-associated database records rather than gene-expression profiles from metabolically characterized HCC patients. Therefore, the results identify SPP1 as a candidate at the molecular intersection of these conditions but do not establish that it is specifically dysregulated in HCC patients with obesity or T2D.
The clinical relevance of SPP1 was further evaluated using TCGA-LIHC expression and survival data. SPP1 expression demonstrated moderate discrimination between HCC and non-tumor tissues, while increased expression was associated with poorer overall survival. This association remained significant after adjustment for age, sex, and pathological stage, supporting the prognostic relevance of SPP1 in HCC. However, direct experimental validation is required to determine whether OPN is a driver of HCC progression or a biomarker associated with aggressive disease. These findings are consistent with previous studies showing that SPP1 is upregulated in HCC and associated with tumor growth and progression. Junqing Wang et al. provided bioinformatics, clinical, and experimental evidence that SPP1 is significantly upregulated in HCC patients and plays a crucial role in tumor growth and progression [42]. Expanding on these findings, Jianping Song et al. reported that SPP1 upregulation in HCC is associated with tumor progression, poor prognosis, and macrophage infiltration. They further identified promoter demethylation as a key mechanism driving SPP1 overexpression, reinforcing its potential as a prognostic biomarker and therapeutic target in HCC [41]. Similarly, Hyoung Doo Shin et al. highlighted a strong correlation between SPP1 expression and earlier HCC occurrence, particularly in chronic hepatitis B patients [54]. Beyond HCC, Wang et al. explored SPP1’s role in NASH, suggesting its role in pathogenesis and its potential as a therapeutic target and biomarker [55].
The development of mAbs against OPN represents a promising avenue for targeted therapy in HCC, particularly in obesity and T2D. While several anti-OPN monoclonal antibodies, including ASK8007, AOM1, and hu1A12, have been developed and evaluated primarily in inflammatory diseases and various cancer models, there remains a significant gap in their evaluation specifically for HCC associated with metabolic risk factors like obesity and T2D. Most of these antibodies are designed to target the SVVYGLR epitope or thrombin-cleaved fragments of OPN, demonstrating promising preclinical efficacy in tumor types other than HCC [40,56]. However, their effects in the context of metabolic syndrome-driven HCC have been underexplored. Our study provides computational evidence to establish SPP1/OPN as a key driver in HCC progression linked to obesity and T2D, with structure-guided optimization of antibodies that demonstrate an approximately 10- to 650-fold stronger binding affinity compared to previously reported antibodies.
The epitope regions identified in this study (residues 185–230 and 235–253) are located C-terminal to the well-characterized RGD and SVVYGLR integrin-binding motifs and may partially overlap with or be proximal to the CD44-binding domain of OPN. Osteopontin interacts with CD44, which is overexpressed in HCC and associated with poor prognosis, metastasis, and therapy resistance [57,58,59]. The OPN-CD44 interaction may promote HCC cell proliferation, migration, and invasion through activation of PI3K/Akt and NF-κB signaling pathways [60,61,62]. Antibodies targeting our predicted epitope regions could potentially interfere with OPN-CD44 binding, although the precise CD44-binding domain in OPN has not been definitively mapped and requires experimental validation. Antibodies targeting these regions may offer advantages over antibodies that block classical integrin binding, as they could modulate OPN function through alternative mechanisms such as preventing interactions with CD44, calcium-dependent binding, or other extracellular matrix components. This computational progression in anti-OPN design emphasizes a clinically relevant subgroup of HCC characterized by metabolic dysregulation, offering a rationale for personalized immunotherapy strategies. However, experimental validation will be required to determine whether antibodies targeting these predicted epitopes actually neutralize OPN function and through what mechanism.
The findings of this study highlight the potential of computationally designed antibody fragment candidates to serve as starting points for future optimization by selectively targeting OPN, the protein encoded by the SPP1 gene. The predicted OPN model was evaluated using complementary stereochemical and structural quality metrics and was subsequently subjected to molecular dynamics simulation to assess its behavior under the selected simulation conditions. Although the model showed dynamic equilibration during the simulation, the relatively modest ERRAT and Ramachandran scores indicate that it should be interpreted as an approximate structural model rather than an experimentally validated structure. Computational refinements were performed to generate candidate designs with more favorable predicted binding properties. However, docking does not demonstrate actual stability, specificity, or functional activity, which require experimental validation.
The process of in silico mAb design involved the structural prediction of Osteopontin using advanced computational techniques, including molecular modeling, MD simulation, and molecular docking. Particularly, localized peaks in RMSF correspond to sequence regions of intrinsic flexibility, which may impact epitope accessibility and antibody binding. The MD results provided a computational basis for exploratory epitope mapping and antibody-docking analyses; however, the resulting epitopes, docking poses, and affinity estimates require experimental validation. The structural quality metrics warrant careful interpretation. These values indicate that the model is suitable for exploratory structural analysis but does not have the quality expected of a high-resolution experimentally determined structure. This limitation is particularly relevant because OPN is a secreted, intrinsically flexible, and partially disordered protein that undergoes extensive post-translational modifications (including glycosylation and phosphorylation) and proteolytic processing by thrombin and other enzymes. A single static conformation therefore may not represent all biologically relevant states or PTM/fragment isoforms present in vivo. However, the model retained sufficient local structural information for a preliminary analysis of solvent-exposed and flexible regions. The selected epitope residues were not inferred solely from the global validation scores; they were identified by integrating structural accessibility and flexibility information from ElliPro and BepiPred, evolutionary conservation from ConSurf, and residue-level dynamics from the MD trajectory. Thus, the model was used to prioritize candidate regions for further investigation. The identification of key functional residues in OPN, particularly those within the predicted binding pockets, was crucial for guiding antibody design [41,42].
Antibody engineering focused on optimizing the CDRs to enhance binding affinity and specificity. A sequence-tolerance analysis allowed for identifying mutations within CDRH2 and CDRH3, which were subsequently incorporated into the antibody design. Optimization was restricted primarily to CDRH2 and CDRH3 because these loops typically contribute most to antigen-binding specificity and affinity. The Rosetta Sequence-Tolerance protocol was used to identify mutations predicted to enhance OPN binding while preserving fold stability; mutations with unfavorable stability scores were excluded. However, the optimized antibodies were evaluated only in silico, and potential effects on aggregation, specificity, or immunogenicity were not assessed. These properties will require experimental characterization in future studies. The resulting antibodies demonstrated a significant improvement in predicted binding affinity, with Kd values decreasing by 10- to 650-fold compared to previously reported antibodies. The most substantial improvements were observed for CDRH3-optimized variants, particularly MOR6990-CDRH3, which exhibited a ~644-fold decrease in predicted Kd. This factor is essential for successful therapeutic intervention. This strategy significantly improved the predicted interaction between Osteopontin and the modified antibodies, as evidenced by the increase in hydrogen bonding and more favorable predicted binding free energy observed in molecular docking analyses. Enhancing binding affinity through structural modifications represents a promising approach for developing targeted therapies against tumors characterized by high SPP1 expression. However, experimental epitope mapping using recombinant or native OPN, together with characterization of its PTM and cleavage status, will be required to confirm whether these regions are accessible and functionally relevant for antibody binding under biologically realistic conditions.
Emerging evidence suggests that OPN functions as an immune checkpoint that suppresses T cell activation through CD44 binding, contributing to resistance to immune checkpoint inhibitor (ICI) therapy [63,64]. Preclinical studies have demonstrated that combining anti-OPN mAbs with anti-PD-1/PD-L1 antibodies enhances antitumor immunity and overcomes ICI resistance in colorectal cancer, breast cancer, and liver cancer models [63,65,66]. The synergistic effect is attributed to complementary mechanisms: anti-OPN mAbs reverse OPN-mediated T cell suppression and M2 macrophage polarization, while anti-PD-1/PD-L1 prevents T cell exhaustion. Therefore, combination therapies incorporating anti-OPN mAbs with existing immunotherapeutic agents, such as immune checkpoint inhibitors, may further enhance treatment efficacy in HCC, although this hypothesis requires experimental validation [64].
SPP1 is significantly upregulated in HCC and has been associated with a poor prognosis, making it an attractive molecular target for immunotherapy. Its role in tumor progression, metastasis, and immune evasion underscores the necessity of precise targeting strategies. By blocking OPN, mAbs can potentially inhibit critical pathways that contribute to tumor aggressiveness [42]. Moreover, SPP1’s involvement in immune modulation presents an additional advantage for mAb-based therapies. As a key player in the tumor microenvironment, OPN interacts with immune cells such as macrophages, facilitating an immunosuppressive milieu that favors tumor growth. Targeting OPN with optimized mAbs could disrupt these interactions, thereby enhancing anti-tumor immune responses and improving patient outcomes [54,55]. The computationally optimized mAbs against OPN suggested promising binding affinity and stability in silico. However, further in vitro and in vivo validation studies must confirm their therapeutic potential. Experimental validation will help assess the functional impact of these antibodies on HCC progression, tumor microenvironment modulation, and immune system activation [50]. Additionally, combination therapies incorporating anti-OPN mAbs with existing immunotherapeutic agents, such as immune checkpoint inhibitors, may further enhance treatment efficacy. Given the heterogeneity of HCC, a multi-targeted approach may be necessary to achieve optimal clinical benefits [42,53].
This study integrated genes upregulated in HCC with obesity- and T2D-associated gene lists and prioritized SPP1/OPN as an extracellular candidate with diagnostic and prognostic relevance in TCGA-LIHC. Structure-guided computational analyses identified anti-OPN antibody variants with potentially improved predicted binding properties. However, these findings are hypothesis-generating and require biochemical, cellular, and in vivo validation. Further analyses using HCC cohorts with individual-level obesity, T2D, and other metabolic information are also needed to determine whether SPP1/OPN has particular relevance to metabolically associated HCC.

4. Materials and Methods

4.1. Data Collection and Preprocessing

Protein-coding genes associated with “type 2 diabetes” and “obesity” were retrieved from the NCBI Gene database (https://www.ncbi.nlm.nih.gov/gene/) on 11 September 2026. Searches were restricted to Homo sapiens and protein-coding genes. After removal of duplicate entries, the final lists contained 2055 T2D-associated genes and 1944 obesity-associated genes.
TCGA-LIHC mRNA expression and clinical data were obtained from the Genomic Data Commons (https://portal.gdc.cancer.gov/) using the GDCRNATools package in R.—(version 4.5.2) Duplicate samples and sample types other than primary tumor and solid-tissue normal were excluded. The final expression dataset contained 421 samples, comprising 371 primary HCC and 50 solid-tissue normal samples. Expression data were processed using gdcVoomNormalization before differential-expression analysis.

4.2. Differential-Expression and Gene-Intersection Analyses

Differential-expression analysis between primary HCC and solid-tissue normal samples was performed using gdcDEAnalysis with the limma method. p-values were corrected for multiple testing using the Benjamini-Hochberg procedure. Genes with an absolute log2 fold change greater than 1 and a false-discovery rate (FDR) below 0.05 were considered differentially expressed. Genes with log2 fold change greater than 1 were classified as upregulated, whereas those with log2 fold change below −1 were classified as downregulated. The upregulated HCC genes were intersected with the NCBI Gene lists for T2D and obesity. Only genes present in all three lists were retained for subsequent analysis.

4.3. Functional Annotation and PPI Network Analysis

The common genes were submitted to DAVID (https://davidbioinformatics.nih.gov/) for Gene Ontology cellular-component annotation [67]. Genes annotated to the extracellular region were retained as potentially accessible candidates for antibody-based targeting. Protein-protein interactions among these genes were obtained using STRING database (https://string-db.org/) (version 12.0, with a medium confidence score of 0.4 and default parameters) and imported into Cytoscape (version 3.10.3) for network visualization. Hub-gene ranking was performed using the maximal clique centrality algorithm implemented in the CytoHubba plugin [68].

4.4. ROC and Survival Analyses

The ability of SPP1 expression to discriminate primary HCC from solid-tissue normal samples was evaluated using receiver operating characteristic analysis. The area under the curve and its 95% confidence interval were calculated, and the optimal expression cutoff was determined using the Youden index. Sensitivity and specificity were calculated at this cutoff.
For survival analysis, TCGA expression and clinical records were matched using the first 12 characters of the patient barcode. Patients with valid overall-survival information were retained. The Kaplan-Meier analysis divided patients into high- and low-expression groups according to the median untransformed SPP1 expression value. Survival differences were evaluated using the log-rank test. SPP1 expression was additionally analyzed as a continuous log2(SPP1 + 1) variable in Cox proportional-hazards regression. The multivariable model was adjusted for age, sex, and pathological stage. The adjusted hazard ratios and their 95% confidence intervals were visualized using a forest plot, with female sex and pathological stage I used as the reference categories. The proportional-hazards assumption was evaluated using Schoenfeld residuals. Two-sided p-values below 0.05 were considered statistically significant.

4.5. Structure Prediction and Validation

The sequence of Osteopontin protein (SPP1 gene) was retrieved from UniProt (ID: P10451). To reduce dependence on a single prediction approach, full-length OPN was independently modeled using the Robetta server with the RoseTTAFold method and AlphaFold3. The resulting models were compared based on per-residue confidence, predicted secondary-structure agreement with PSIPRED, and structural similarity by backbone superposition [69,70]. Since the predicted structures showed disordered and flexible regions, their outputs were applied to MODELLER v9.19 software as a template to generate refined comparative models. A total of 1000 models were generated, ranked according to DOPE score, and the top-ranked candidate was selected for further evaluation [71]. The secondary structure of the protein was predicted by PSIPRED 4.0 [72]. Several evaluation tools, including ERRAT (evaluating atomic non-bonded interaction patterns), validated the reliability of the structural model [73], PROCHECK (Ramachandran plot analysis) [74], and Verify3D (assessing 3D-1D profile compatibility) [75].

4.6. Molecular Dynamics Simulation (MD)

The predicted 3D model of the Osteopontin protein was subjected to a 100 ns all-atom MD simulation by GROMACS 2022.6 using the protocol described in our previous study [76]. The simulation was performed in an explicit solvent environment and periodic boundary conditions with the AMBER99SB-ILDN force field. Post-simulation analyses were performed to assess structural stability and flexibility. Root mean square deviation (RMSD), radius of gyration (Rg), and root mean square fluctuation (RMSF) were calculated on the MD trajectory using standard GROMACS tools. RMSD was used to evaluate overall structural drift and approach toward equilibrium, Rg to assess global compactness, and RMSF to identify flexible regions. We acknowledge that a single 100-ns simulation without replicates provides limited evidence for convergence, and the results should be interpreted as exploratory.

4.7. Binding Pockets Predictions

The functional residues of the Osteopontin protein were predicted through the ConSurf web server, which analyzes the conservation levels of each amino acid across homologous sequences [77]. Additionally, to analyze the binding interactions of Osteopontin with antibodies, the potential linear and conformational B-cell epitopes of Osteopontin were predicted using BepiPred 2.0 and ElliPro from the IEDB server [78,79]. These tools are well established for identifying B-cell epitopes based on the sequence and 3D structure.

4.8. Antibody Optimization

The sequences of heavy and light chains of anti-Osteopontin, including MOR6990, MOR6991, and MOR6993, were extracted from US Patent US20110165170A1, which reports experimental OPN binding for these clones in surface plasmon resonance (SPR) assays with KD values in the nanomolar to sub-nanomolar range. The CDR definitions are provided in Supplementary Table S2. In this study, these sequences were used as computational templates for CDR optimization and docking; their binding characteristics under our experimental conditions have not yet been independently validated [80]. ABodyBuilder2 from SAbPred was used to generate models of the antibody scFv regions. The modeling parameters were set at default with IMGT numbering schemes [81]. The Rosetta Sequence-tolerance protocol, accessed through the Rosetta Online Server that Includes Everyone (ROSIE), was employed to explore the amino acid sequences to be tolerated at specific positions within the interacting partner protein [81,82,83]. This approach is critical for understanding how mutations in antibody regions can impact binding affinity and specificity. Briefly, the residues of CDRH2 or CDRH3 of antibodies were defined to be mutated to all 20 natural amino acids. The protocol calculates an overall interface binding score and a fold stability score for each protein chain in the given protein–protein complex. These scores are applied to identify which mutations maintain or enhance binding capabilities while preserving structural stability. The top 5 tolerated sequences were incorporated into the CDRH2 or CDRH3 regions of antibodies. The updated antibody sequences were subjected to ABodyBuilder2 to generate their 3D models.

4.9. Molecular Docking

The ClusPro server was employed for molecular docking studies to simulate the interaction between Osteopontin and the potential antibodies. This platform is advantageous, as it incorporates an antibody model that automatically masks non-complementarity determining region (CDR) areas, focusing the docking process on relevant binding sites [84]. The antibodies were defined as the receptor and OPN as the ligand. The PRODIGY® web server evaluated the binding affinity of complexes [85].

Supplementary Materials

The following supporting information can be downloaded at: https://www.mdpi.com/article/10.3390/jgbg1030019/s1. Table S1. Differential-expression analysis of TCGA-LIHC identified 2123 DEGs, including 715 upregulated and 1408 downregulated genes in primary HCC using |log2 fold change| > 1 and Benjamini-Hochberg FDR < 0.05. Table S2. CDR definitions of anti-OPN antibodies MOR6990, MOR6991, and MOR6993 (US Patent US20110165170A1).

Author Contributions

E.S.: conceptualization; investigation; visualization; methodology; writing—original draft; E.R.: conceptualization; methodology; software; visualization; validation; writing—original draft; writing—review and editing; P.A.-S.: investigation; methodology; software; validation; revising the original draft; M.H., M.N.-T. and R.M.: writing—review and editing; M.V.: conceptualization; project administration; supervision; writing—review and editing; final approval of the manuscript. All authors have read and agreed to the published version of the manuscript.

Funding

This research received no external funding.

Institutional Review Board Statement

Not applicable.

Informed Consent Statement

Not applicable.

Data Availability Statement

The original contributions presented in this study are included in the article/Supplementary Material. Further inquiries can be directed to the corresponding author.

Acknowledgments

We would like to express our sincere gratitude to fellow colleagues at the Regenerative Medicine department at Royan Institute.

Conflicts of Interest

The authors declare no conflicts of interest.

References

  1. Pan, Y.; Zhang, X. Diet and gut microbiome in fatty liver and its associated liver cancer. J. Gastroenterol. Hepatol. 2021, 37, 14–17. [Google Scholar] [CrossRef] [Scilit]
  2. Sung, H.; Ferlay, J.; Siegel, R.L.; Laversanne, M.; Soerjomataram, I.; Jemal, A.; Bray, F. Global cancer statistics 2020: GLOBOCAN estimates of incidence and mortality worldwide for 36 cancers in 185 countries. CA A Cancer J. Clin. 2021, 71, 209–249. [Google Scholar] [CrossRef] [Scilit]
  3. Villanueva, A.; Newell, P.; Hoshida, Y. Inherited hepatocellular carcinoma. Best Pract. Res. Clin. Gastroenterol. 2010, 24, 725–734. [Google Scholar] [CrossRef] [Scilit]
  4. Gurala, D.; Nishal, R.; Philipose, J. The Weight of Risk: Exploring the Link Between Obesity and Liver Cancer. Med. Res. Arch. 2024, 12, 8. [Google Scholar] [CrossRef] [Scilit]
  5. Anstee, Q.M.; Reeves, H.L.; Kotsiliti, E.; Govaere, O.; Heikenwalder, M. From NASH to HCC: Current concepts and future challenges. Nat. Rev. Gastroenterol. Hepatol. 2019, 16, 411–428. [Google Scholar] [CrossRef] [Scilit]
  6. Powell, E.E.; Wong, V.W.; Rinella, M. Non-alcoholic fatty liver disease. Lancet 2021, 397, 2212–2224. [Google Scholar] [CrossRef] [Scilit]
  7. Yang, J.D.; Mohamed, H.A.; Cvinar, J.L.; Gores, G.J.; Roberts, L.R.; Kim, R.W. Diabetes mellitus heightens the risk of hepatocellular carcinoma except in patients with hepatitis C cirrhosis. Off. J. Am. Coll. Gastroenterol.|ACG 2016, 111, 1573–1580. [Google Scholar] [CrossRef] [Scilit]
  8. El–Serag, H.B.; Hampel, H.; Javadi, F. The association between diabetes and hepatocellular carcinoma: A systematic review of epidemiologic evidence. Clin. Gastroenterol. Hepatol. 2006, 4, 369–380. [Google Scholar] [CrossRef] [Scilit]
  9. Huang, S.F.; Chang, I.C.; Hong, C.C.; Yen, T.C.; Chen, C.L.; Wu, C.C.; Tsai, C.; Ho, M.; Lee, W.; Yu, H.; et al. Metabolic risk factors are associated with non-hepatitis B non-hepatitis C hepatocellular carcinoma in Taiwan, an endemic area of chronic hepatitis B. Hepatol. Commun. 2018, 2, 747–759. [Google Scholar] [CrossRef] [Scilit]
  10. Balkwill, F.; Mantovani, A. Inflammation and cancer: Back to Virchow? Lancet 2001, 357, 539–545. [Google Scholar] [CrossRef] [Scilit]
  11. Hirosumi, J.; Tuncman, G.; Chang, L.; Görgün, C.Z.; Uysal, K.T.; Maeda, K.; Karin, M.; Hotamisligil, G.S. A central role for JNK in obesity and insulin resistance. Nature 2002, 420, 333–336. [Google Scholar] [CrossRef] [Scilit]
  12. Hui, L.; Zatloukal, K.; Scheuch, H.; Stepniak, E.; Wagner, E.F. Proliferation of human HCC cells and chemically induced mouse liver cancers requires JNK1-dependent p21 downregulation. J. Clin. Investig. 2008, 118, 3943–3953. [Google Scholar] [CrossRef] [Scilit]
  13. Llovet, J.M.; De Baere, T.; Kulik, L.; Haber, P.K.; Greten, T.F.; Meyer, T.; Lencioni, R. Locoregional therapies in the era of molecular and immune treatments for hepatocellular carcinoma. Nat. Rev. Gastroenterol. Hepatol. 2021, 18, 293–313. [Google Scholar] [CrossRef] [Scilit]
  14. Llovet, J.; Kelley, R.; Villanueva, A.; Singal, A.; Pikarsky, E.; Roayaie, S.; Lencioni, R.; Koike, K.; Zucman-Rossi, J.; Finn, R. Hepatocellular carcinoma. Nat. Rev. Dis. Primers PubMed Artic. 2021, 7, 7. [Google Scholar]
  15. Llovet, J.M.; Montal, R.; Sia, D.; Finn, R.S. Molecular therapies and precision medicine for hepatocellular carcinoma. Nat. Rev. Clin. Oncol. 2018, 15, 599–616. [Google Scholar] [CrossRef] [Scilit]
  16. Qin, S.; Bi, F.; Gu, S.; Bai, Y.; Chen, Z.; Wang, Z.; Ying, J.; Lu, Y.; Meng, Z.; Pan, H.; et al. Donafenib versus sorafenib in first-line treatment of unresectable or metastatic hepatocellular carcinoma: A randomized, open-label, parallel-controlled phase II–III trial. J. Clin. Oncol. 2021, 39, 3002–3011. [Google Scholar] [CrossRef] [Scilit]
  17. Furuse, J.; Ueno, M.; Ikeda, M. Systemic therapy for hepatocellular carcinoma: Current status and future perspectives. Jpn. J. Clin. Oncol. 2021, 51, 1363–1371. [Google Scholar] [CrossRef] [Scilit]
  18. Liu, Z.; Lin, Y.; Zhang, J.; Zhang, Y.; Li, Y.; Liu, Z.; Li, Q.; Luo, M.; Liang, R.; Ye, J. Molecular targeted and immune checkpoint therapy for advanced hepatocellular carcinoma. J. Exp. Clin. Cancer Res. 2019, 38, 447. [Google Scholar] [CrossRef] [Scilit]
  19. Chulpanova, D.S.; Kitaeva, K.V.; Green, A.R.; Rizvanov, A.A.; Solovyeva, V.V. Molecular aspects and future perspectives of cytokine-based anti-cancer immunotherapy. Front. Cell Dev. Biol. 2020, 8, 402. [Google Scholar] [CrossRef] [Scilit]
  20. Ishihara, J.; Ishihara, A.; Sasaki, K.; Lee, S.S.-Y.; Williford, J.-M.; Yasui, M.; Abe, H.; Potin, L.; Hosseinchi, P.; Fukunaga, K.; et al. Targeted antibody and cytokine cancer immunotherapies through collagen affinity. Sci. Transl. Med. 2019, 11, eaau3259. [Google Scholar] [CrossRef] [Scilit]
  21. Berraondo, P.; Sanmamed, M.F.; Ochoa, M.C.; Etxeberria, I.; Aznar, M.A.; Pérez-Gracia, J.L.; Rodríguez-Ruiz, M.E.; Ponz-Sarvise, M.; Castañón, E.; Melero, I. Cytokines in clinical cancer immunotherapy. Br. J. Cancer 2019, 120, 6–15. [Google Scholar] [CrossRef] [Scilit]
  22. Zahavi, D.; Weiner, L. Monoclonal antibodies in cancer therapy. Antibodies 2020, 9, 34. [Google Scholar] [CrossRef] [Scilit]
  23. Sahin, U.; Türeci, Ö. Personalized vaccines for cancer immunotherapy. Science 2018, 359, 1355–1360. [Google Scholar] [CrossRef] [Scilit]
  24. Jahanafrooz, Z.; Baradaran, B.; Mosafer, J.; Hashemzaei, M.; Rezaei, T.; Mokhtarzadeh, A.; Hamblin, M.R. Comparison of DNA and mRNA vaccines against cancer. Drug Discov. Today 2020, 25, 552–560. [Google Scholar] [CrossRef] [Scilit]
  25. Liu, S.; Jiang, Q.; Zhao, X.; Zhao, R.; Wang, Y.; Wang, Y.; Liu, J.; Shang, Y.; Zhao, S.; Wu, T.; et al. A DNA nanodevice-based vaccine for cancer immunotherapy. Nat. Mater. 2021, 20, 421–430. [Google Scholar] [CrossRef] [Scilit]
  26. Zhao, J.; Song, Y.; Liu, D. Clinical trials of dual-target CAR T cells, donor-derived CAR T cells, and universal CAR T cells for acute lymphoid leukemia. J. Hematol. Oncol. 2019, 12, 17. [Google Scholar] [CrossRef] [Scilit]
  27. Shah, N.N.; Ahn, K.W.; Litovich, C.; He, Y.; Sauter, C.; Fenske, T.S.; Hamadani, M. Is autologous transplant in relapsed DLBCL patients achieving only a PET+ PR appropriate in the CAR T-cell era? Blood J. Am. Soc. Hematol. 2021, 137, 1416–1423. [Google Scholar] [CrossRef] [Scilit]
  28. Castenmiller, C.; Keumatio-Doungtsop, B.-C.; van Ree, R.; de Jong, E.C.; van Kooyk, Y. Tolerogenic immunotherapy: Targeting DC surface receptors to induce antigen-specific tolerance. Front. Immunol. 2021, 12, 643240. [Google Scholar] [CrossRef] [Scilit]
  29. Wculek, S.K.; Cueto, F.J.; Mujal, A.M.; Melero, I.; Krummel, M.F.; Sancho, D. Dendritic cells in cancer immunology and immunotherapy. Nat. Rev. Immunol. 2020, 20, 7–24. [Google Scholar] [CrossRef] [Scilit]
  30. Zhang, C.; Liu, Y. Targeting NK cell checkpoint receptors or molecules for cancer immunotherapy. Front. Immunol. 2020, 11, 1295. [Google Scholar] [CrossRef] [Scilit]
  31. Myers, J.A.; Miller, J.S. Exploring the NK cell platform for cancer immunotherapy. Nat. Rev. Clin. Oncol. 2021, 18, 85–100. [Google Scholar] [CrossRef] [Scilit]
  32. Wolf, B.J.; Choi, J.E.; Exley, M.A. Novel approaches to exploiting invariant NKT cells in cancer immunotherapy. Front. Immunol. 2018, 9, 384. [Google Scholar] [CrossRef] [Scilit]
  33. Bae, E.-A.; Seo, H.; Kim, I.-K.; Jeon, I.; Kang, C.-Y. Roles of NKT cells in cancer immunotherapy. Arch. Pharmacal Res. 2019, 42, 543–548. [Google Scholar] [CrossRef] [Scilit]
  34. Lee, S.N.; Jin, S.M.; Shin, H.S.; Lim, Y.T. Chemical strategies to enhance the therapeutic efficacy of toll-like receptor agonist based cancer immunotherapy. Acc. Chem. Res. 2020, 53, 2081–2093. [Google Scholar] [CrossRef] [Scilit]
  35. Chuang, Y.-C.; Tseng, J.-C.; Huang, L.-R.; Huang, C.-M.; Huang, C.-Y.F.; Chuang, T.-H. Adjuvant effect of toll-like receptor 9 activation on cancer immunotherapy using checkpoint blockade. Front. Immunol. 2020, 11, 1075. [Google Scholar] [CrossRef] [Scilit]
  36. Huang, X.; Zhang, X.; Lu, M. Recent trends in the development of Toll-like receptor 7/8-targeting therapeutics. Expert Opin. Drug Discov. 2021, 16, 869–880. [Google Scholar] [CrossRef] [Scilit]
  37. Loisel, S.; Ohresser, M.; Pallardy, M.; Daydé, D.; Berthou, C.; Cartron, G.; Watier, H. Relevance, advantages and limitations of animal models used in the development of monoclonal antibodies for cancer treatment. Crit. Rev. Oncol./Hematol. 2007, 62, 34–42. [Google Scholar] [CrossRef] [Scilit]
  38. Lin, E.Y.; Xi, W.; Aggarwal, N.; Shinohara, M.L. Osteopontin (OPN)/SPP1: From its biochemistry to biological functions in the innate immune system and the central nervous system (CNS). Int. Immunol. 2023, 35, 171–180. [Google Scholar] [CrossRef] [Scilit]
  39. Sodek, J.; Ganss, B.; McKee, M.D. Osteopontin. Crit. Rev. Oral Biol. Med. 2000, 11, 279–303. [Google Scholar] [CrossRef] [Scilit]
  40. Dai, J.; Li, B.; Shi, J.; Peng, L.; Zhang, D.; Qian, W.; Hou, S.; Zhao, L.; Gao, J.; Cao, Z.; et al. A humanized anti-osteopontin antibody inhibits breast cancer growth and metastasis in vivo. Cancer Immunol. Immunother. 2010, 59, 355–366. [Google Scholar] [CrossRef] [Scilit]
  41. Song, J.; Sun, J.; Jing, S.; Zhang, T.; Wang, J.; Liu, Y. A high level of secreted phosphoprotein 1 is associated with macrophage infiltration and poor prognosis in hepatocellular carcinoma. iLIVER 2023, 2, 26–35. [Google Scholar] [CrossRef] [Scilit]
  42. Wang, J.; Hao, F.; Fei, X.; Chen, Y. SPP1 functions as an enhancer of cell growth in hepatocellular carcinoma targeted by miR-181c. Am. J. Transl. Res. 2019, 11, 6924–6937. [Google Scholar]
  43. Xu, W.; Bi, Z.; Lu, L.; Feng, F.; Chen, L.; Zhang, C. Role of osteopontin in cancer: From pathogenesis to therapeutics (Review). Oncol. Rep. 2025, 54, 136. [Google Scholar] [CrossRef] [Scilit]
  44. Kozakov, D.; Hall, D.R.; Xia, B.; Porter, K.A.; Padhorny, D.; Yueh, C.; Beglov, D.; Vajda, S. The ClusPro web server for protein-protein docking. Nat. Protoc. 2017, 12, 255–278. [Google Scholar] [CrossRef] [Scilit]
  45. McGlynn, K.A.; Petrick, J.L.; London, W.T. Global epidemiology of hepatocellular carcinoma: An emphasis on demographic and regional variability. Clin. Liver Dis. 2015, 19, 223–238. [Google Scholar]
  46. Simon, T.G.; King, L.Y.; Chong, D.Q.; Nguyen, L.H.; Ma, Y.; VoPham, T.; Giovannucci, E.L.; Fuchs, C.S.; Meyerhardt, J.A.; Corey, K.E.; et al. Diabetes, metabolic comorbidities, and risk of hepatocellular carcinoma: Results from two prospective cohort studies. Hepatology 2018, 67, 1797–1806. [Google Scholar] [CrossRef] [Scilit]
  47. Jinjuvadia, R.; Patel, S.; Liangpunsakul, S. The association between metabolic syndrome and hepatocellular carcinoma: Systemic review and meta-analysis. J. Clin. Gastroenterol. 2014, 48, 172–177. [Google Scholar]
  48. Inoue, M.; Noda, M.; Kurahashi, N.; Iwasaki, M.; Sasazuki, S.; Iso, H.; Tsugane, S. Impact of metabolic factors on subsequent cancer risk: Results from a large-scale population-based cohort study in Japan. Eur. J. Cancer Prev. 2009, 18, 240–247. [Google Scholar] [CrossRef] [Scilit]
  49. Makarova-Rusher, O.V.; Altekruse, S.F.; McNeel, T.S.; Ulahannan, S.; Duffy, A.G.; Graubard, B.I.; Greten, T.F.; McGlynn, K.A. Population attributable fractions of risk factors for hepatocellular carcinoma in the United States. Cancer 2016, 122, 1757–1765. [Google Scholar] [CrossRef] [Scilit]
  50. McGlynn, K.A.; Petrick, J.L.; El-Serag, H.B. Epidemiology of hepatocellular carcinoma. Hepatology 2021, 73, 4–13. [Google Scholar] [CrossRef] [Scilit]
  51. Kumari, R.; Sahu, M.K.; Tripathy, A.; Uthansingh, K.; Behera, M. Hepatocellular carcinoma treatment: Hurdles, advances and prospects. Hepatic Oncol. 2018, 5, HEP08. [Google Scholar] [CrossRef] [Scilit]
  52. Rimassa, L.; Pressiani, T.; Merle, P. Systemic treatment options in hepatocellular carcinoma. Liver Cancer 2019, 8, 427–446. [Google Scholar] [CrossRef] [Scilit]
  53. Piñero, F.; Silva, M.; Iavarone, M. Sequencing of systemic treatment for hepatocellular carcinoma: Second line competitors. World J. Gastroenterol. 2020, 26, 1888–1900. [Google Scholar] [CrossRef] [Scilit]
  54. Shin, H.D.; Park, B.L.; Cheong, H.S.; Yoon, J.-H.; Kim, Y.J.; Lee, H.-S. SPP1 polymorphisms associated with HBV clearance and HCC occurrence. Int. J. Epidemiol. 2007, 36, 1001–1008. [Google Scholar] [CrossRef] [Scilit]
  55. Wang, W.; Liu, X.; Wei, P.; Ye, F.; Chen, Y.; Shi, L.; Zhang, X.; Li, J.; Lin, S.; Yang, X. SPP1 and CXCL9 promote non-alcoholic steatohepatitis progression based on bioinformatics analysis and experimental studies. Front. Med. 2022, 9, 862278. [Google Scholar] [CrossRef] [Scilit]
  56. Farrokhi, V.; Chabot, J.R.; Neubert, H.; Yang, Z. Assessing the Feasibility of Neutralizing Osteopontin with Various Therapeutic Antibody Modalities. Sci. Rep. 2018, 8, 7781. [Google Scholar] [CrossRef] [Scilit]
  57. Dong, R.; Srikanth, A.; Tharehalli, U.; Seufferlein, T.; Schirmbeck, R.; Lechel, A. CD44 upregulation in chronic liver disease marks the transition to hepatocellular carcinoma and portends poor prognosis. Br. J. Cancer 2026, 134, 555–566. [Google Scholar] [CrossRef] [Scilit]
  58. Hassn Mesrati, M.; Syafruddin, S.E.; Mohtar, M.A.; Syahir, A. CD44: A Multifunctional Mediator of Cancer Progression. Biomolecules 2021, 11, 1850. [Google Scholar] [CrossRef] [Scilit]
  59. Shu, M.; Qu, J.; Luo, S.; Xiao, T.; Xiang, Z.; Yan, L.; Liu, J.; Liu, Y.; Lu, X.; Peng, X. Prospects of CD44 in hepatocellular carcinoma: An emerging biomarker and therapeutic target. EJMO 2025, 2025, 025240260. [Google Scholar] [CrossRef] [Scilit]
  60. Wen, Y.; Jeong, S.; Xia, Q.; Kong, X. Role of Osteopontin in Liver Diseases. Int. J. Biol. Sci. 2016, 12, 1121–1128. [Google Scholar] [CrossRef] [Scilit]
  61. Yu, X.; Zheng, Y.; Zhu, X.; Gao, X.; Wang, C.; Sheng, Y.; Cheng, W.; Qin, L.; Ren, N.; Jia, H.; et al. Osteopontin promotes hepatocellular carcinoma progression via the PI3K/AKT/Twist signaling pathway. Oncol. Lett. 2018, 16, 5299–5308. [Google Scholar] [CrossRef] [Scilit]
  62. Zhao, H.; Chen, Q.; Alam, A.; Cui, J.; Suen, K.C.; Soo, A.P.; Eguchi, S.; Gu, J.; Ma, D. The role of osteopontin in the progression of solid organ tumour. Cell Death Dis. 2018, 9, 356. [Google Scholar] [CrossRef] [Scilit]
  63. Klement, J.D.; Poschel, D.B.; Lu, C.; Merting, A.D.; Yang, D.; Redd, P.S.; Liu, K. Osteopontin Blockade Immunotherapy Increases Cytotoxic T Lymphocyte Lytic Activity and Suppresses Colon Tumor Progression. Cancers 2021, 13, 1006. [Google Scholar] [CrossRef] [Scilit]
  64. Moorman, H.R.; Poschel, D.; Klement, J.D.; Lu, C.; Redd, P.S.; Liu, K. Osteopontin: A Key Regulator of Tumor Progression and Immunomodulation. Cancers 2020, 12, 3379. [Google Scholar] [CrossRef] [Scilit]
  65. Gu, Y.; Taifour, T.; Bui, T.; Zuo, D.; Pacis, A.; Poirier, A.; Attalla, S.; Fortier, A.-M.; Sanguin-Gendreau, V.; Pan, T.-C.; et al. Osteopontin is a therapeutic target that drives breast cancer recurrence. Nat. Commun. 2024, 15, 9174. [Google Scholar] [CrossRef] [Scilit]
  66. Hashimoto, K.; Okamoto, K.; Takayanagi, H. Bone Voyage: OPN’s Path from Skeleton to Systemic Immunosuppression. Cancer Res. 2025, 85, 3189–3191. [Google Scholar] [CrossRef] [Scilit]
  67. Sherman, B.T.; Panzade, G.; Imamichi, T.; Chang, W. DAVID Ortholog: An integrative tool to enhance functional analysis through orthologs. Bioinformatics 2024, 40, btae615. [Google Scholar] [CrossRef] [Scilit]
  68. Chin, C.-H.; Chen, S.-H.; Wu, H.-H.; Ho, C.-W.; Ko, M.-T.; Lin, C.-Y. cytoHubba: Identifying hub objects and sub-networks from complex interactome. BMC Syst. Biol. 2014, 8, S11. [Google Scholar] [CrossRef] [Scilit]
  69. Abramson, J.; Adler, J.; Dunger, J.; Evans, R.; Green, T.; Pritzel, A.; Ronneberger, O.; Willmore, L.; Ballard, A.J.; Bambrick, J.; et al. Accurate structure prediction of biomolecular interactions with AlphaFold 3. Nature 2024, 630, 493–500. [Google Scholar] [CrossRef] [Scilit]
  70. Baek, M.; DiMaio, F.; Anishchenko, I.; Dauparas, J.; Ovchinnikov, S.; Lee, G.R.; Wang, J.; Cong, Q.; Kinch, L.N.; Schaeffer, R.D.; et al. Accurate prediction of protein structures and interactions using a three-track neural network. Science 2021, 373, 871–876. [Google Scholar] [CrossRef] [Scilit]
  71. Larsson, P.; Wallner, B.; Lindahl, E.; Elofsson, A. Using multiple templates to improve quality of homology models in automated homology modeling. Protein Sci. 2008, 17, 990–1002. [Google Scholar] [CrossRef] [Scilit]
  72. Buchan, D.W.A.; Jones, D.T. The PSIPRED Protein Analysis Workbench: 20 years on. Nucleic Acids Res. 2019, 47, W402–W407. [Google Scholar] [CrossRef] [Scilit]
  73. Colovos, C.; Yeates, T.O. Verification of protein structures: Patterns of nonbonded atomic interactions. Protein. Sci. 1993, 2, 1511–1519. [Google Scholar] [CrossRef] [Scilit]
  74. Laskowski, R.A.; MacArthur, M.W.; Moss, D.S.; Thornton, J.M. PROCHECK: A program to check the stereochemical quality of protein structures. J. Appl. Crystallogr. 1993, 26, 283–291. [Google Scholar] [CrossRef] [Scilit]
  75. Bowie, J.U.; Lüthy, R.; Eisenberg, D. A method to identify protein sequences that fold into a known three-dimensional structure. Science 1991, 253, 164–170. [Google Scholar] [CrossRef] [Scilit]
  76. Mobini, S.; Chizari, M.; Rismani, E.; Mafakher, L.; Sadrzadeh, M.J.; Vosough, M. Targeting CD84 protein on myeloid-derived suppressor cells as a novel immunotherapy in solid tumors. Comput. Methods Programs Biomed. 2025, 261, 108607. [Google Scholar] [CrossRef] [Scilit]
  77. Ashkenazy, H.; Abadi, S.; Martz, E.; Chay, O.; Mayrose, I.; Pupko, T.; Ben-Tal, N. ConSurf 2016: An improved methodology to estimate and visualize evolutionary conservation in macromolecules. Nucleic Acids Res. 2016, 44, W344–W350. [Google Scholar] [CrossRef] [Scilit]
  78. Jespersen, M.C.; Peters, B.; Nielsen, M.; Marcatili, P. BepiPred-2.0: Improving sequence-based B-cell epitope prediction using conformational epitopes. Nucleic Acids Res. 2017, 45, W24–W29. [Google Scholar] [CrossRef] [Scilit]
  79. Ponomarenko, J.; Hòa, H.; Li, W.; Fusseder, N.; Bourne, P.; Sette, A.; Peters, B. ElliPro: A new structure-based tool for the prediction of antibody epitopes. BMC Bioinform. 2009, 9, 514. [Google Scholar] [CrossRef] [Scilit]
  80. Haubrich, T.A.; Bingham, J.T.; Jani, J.P.; Blasina, A.; Ladetzki-Baehs, K.; Tesar, M.; Chapman, J.G.; Ponsel, D.; North, M.A. OSTEOPONTIN Antibodies. U.S. Patent US20110165170A1, 7 July 2011. [Google Scholar]
  81. Abanades, B.; Wong, W.K.; Boyles, F.; Georges, G.; Bujotzek, A.; Deane, C.M. ImmuneBuilder: Deep-Learning models for predicting the structures of immune proteins. Commun. Biol. 2023, 6, 575. [Google Scholar] [CrossRef] [Scilit]
  82. Smith, C.A.; Kortemme, T. Structure-Based Prediction of the Peptide Sequence Space Recognized by Natural and Synthetic PDZ Domains. J. Mol. Biol. 2010, 402, 460–474. [Google Scholar] [CrossRef] [Scilit]
  83. Smith, C.A.; Kortemme, T. Predicting the Tolerated Sequences for Proteins and Protein Interfaces Using RosettaBackrub Flexible Backbone Design. PLoS ONE 2011, 6, e20451. [Google Scholar] [CrossRef] [Scilit]
  84. Brenke, R.; Hall, D.R.; Chuang, G.Y.; Comeau, S.R.; Bohnuud, T.; Beglov, D.; Schueler-Furman, O.; Vajda, S.; Kozakov, D. Application of asymmetric statistical potentials to antibody-protein docking. Bioinformatics 2012, 28, 2608–2614. [Google Scholar] [CrossRef] [Scilit]
  85. Xue, L.C.; Rodrigues, J.P.; Kastritis, P.L.; Bonvin, A.M.; Vangone, A. PRODIGY: A web server for predicting the binding affinity of protein-protein complexes. Bioinformatics 2016, 32, 3676–3678. [Google Scholar] [CrossRef] [Scilit]
Figure 1. Integration of HCC, obesity, and type 2 diabetes gene sets and prioritization of extracellular candidates. (A) Three-way overlap between genes upregulated in TCGA-LIHC, obesity-associated protein-coding genes, and type 2 diabetes-associated protein-coding genes. Twenty-nine genes were shared among the three lists. (B) STRING protein–protein interaction network of the 14 common genes annotated to the extracellular region. CytoHubba analysis using the maximal clique centrality algorithm ranked SPP1 as the highest-scoring candidate.
Jgbg 01 00019 g001
Figure 2. Diagnostic and prognostic evaluation of SPP1 in TCGA-LIHC. (A) Receiver operating characteristic curve evaluating the ability of SPP1 expression to distinguish 371 primary HCC samples from 50 solid-tissue normal samples. The area under the curve was 0.714, and the optimal cutoff determined using the Youden index was 2147. (B) Kaplan–Meier overall-survival curves for patients with high and low SPP1 expression, categorized according to the median untransformed expression value. High SPP1 expression was associated with poorer overall survival (log-rank p < 0.001). Shaded areas surrounding each curve represent the 95% confidence intervals of the estimated survival probabilities. (C) Forest plot of the multivariable Cox proportional-hazards model adjusted for age, sex, and pathological stage. Points represent adjusted hazard ratios, horizontal lines represent 95% confidence intervals, and the dashed vertical line indicates a hazard ratio of 1. Female sex and pathological stage I were used as reference categories.
Jgbg 01 00019 g002
Figure 3. Prediction of the secondary and tertiary structure of Osteopontin protein and its binding sites. (A) Cartoon view of the model using PyMOL (v 3.0.3). This model represents a computational prediction with moderate validation scores (ERRAT 49.67, 74.5% most favored Ramachandran regions) and should be interpreted as an exploratory structural hypothesis. (B) The secondary structural analysis of Osteopontin using PSIPRED 4.0, showing regions of disorder, helix, and strand. (C) Cartoon view of the predicted functional residues of the Osteopontin protein using the ConSurf web server, with a color gradient from cyan (variable) to purple (highly conserved). Key functional motifs include: RGD motif (residues 159–161), SVVYGLR motif (residues 162–168), calcium-binding domain (residues 216–228), heparin-binding domain, and CD44 receptor-binding domain. (D) The potential conformational B-cell epitopes of Osteopontin protein (residues 185–230 in cartoon view) predicted using ElliPro from the IEDB server. (E) The potential conformational B-cell epitopes of OPN (residues 235–253 in cartoon view). The structural model represents a computational prediction, and experimental validation is required to confirm the accessibility and functional relevance of these predicted epitope regions.
Jgbg 01 00019 g003
Figure 4. Molecular dynamics analysis of Osteopontin (SPP1) structure behavior. (A) Backbone root mean square deviation (RMSD) over 100 ns simulation shows progressive increase during the first ~80 ns and gradual approach toward a plateau near 1.6 nm, consistent with slow convergence under the simulated conditions. (B) Radius of gyration (Rg) profile showing consistent protein compactness around 2.7 nm throughout the trajectory. (C) Residue-wise root mean square fluctuation (RMSF) plot reveals local flexibility, with peaks around residue 120 indicating regions of intrinsic dynamics relevant for epitope accessibility. These analyses provide exploratory insights into OPN conformational behavior.
Jgbg 01 00019 g004
Figure 5. Molecular docking and antibody optimization. (A) Cartoon view of scFv antibodies- Osteopontin complexes. (B) Schematic pipeline of antibody optimizations by generating mutated CDRH2 and CDRH3. A ranked table of amino acid types for each position is the output of sequence_tolerance protocol (Rosie). Top 5 predicted sequences are above the dashed line.
Jgbg 01 00019 g005
Table 1. Univariable and multivariable Cox proportional-hazards analyses of overall survival in TCGA-LIHC. Female sex and pathological stage I were used as reference categories. The multivariable analysis included 341 patients with complete age, sex, pathological stage, expression, and survival information.
ModelVariableHR95% CIp-Value
UnivariableSPP1, log2 expression1.131.07–1.18<0.001
UnivariableHigh versus low SPP12.121.48–3.04<0.001
MultivariableSPP1, log2 expression1.111.06–1.18<0.001
MultivariableAge, per year1.010.99–1.020.300
MultivariableMale versus female0.830.56–1.220.340
MultivariableStage II versus stage I1.190.72–1.950.490
MultivariableStage III versus stage I2.451.60–3.76<0.001
MultivariableStage IV versus stage I4.801.45–15.840.010
Table 2. Structure validation of the predicted model.
ProteinVerify3D (%) 1ERRAT (%) 1Ramachandran Plot Quality (%)
Most FavoredAdditionally AllowedGenerously AllowedDisallowed
Osteopontin 287.5849.6774.517.55.82.2
1 Verify3D: 3D-1D profile score; ERRAT: Atomic non-bonded interaction score; 100 is the best, and 0 is the worst. 2 The reported validation metrics indicate moderate structural quality suitable for exploratory analysis but below typical high-resolution experimental structures.
Table 3. Molecular docking analysis of complexes.
Protein-Protein ComplexChainWeighted SCOREΔG (kcal mol−1)Kd (M) *Number of Hydrogen Bonds
MOR6990—OsteopontinHeavy−347.9−7.43.8 × 10−62
Light−373.5−8.64.7 × 10−78
MOR6990_CDRH3—OsteopontinHeavy−380.7−11.25.90 × 10−99
Light−459.5−7.43.60 × 10−63
MOR6990_1_CDRH2-CDRH3—OsteopontinHeavy−362.4−10.13.90 × 10−815
Light−397.4−8.11.10 × 10−62
MOR6990_2_CDRH2-CDRH3—OsteopontinHeavy−467.3−9.68.70 × 10−811
Light−564.1−7.62.80 × 10−63
MOR6991—OsteopontinHeavy−376.4−9.12.3 × 10−77
Light−450.5−8.83.6 × 10−710
MOR6991_1_CDRH3—OsteopontinHeavy−575.4−10.52.00 × 10−811
Light−653.8−92.60 × 10−76
MOR6991_2_CDRH3—OsteopontinHeavy−565−11.26.30 × 10−914
Light−633.8−7.91.60 × 10−67
MOR6991_1_CDRH2-CDRH3—OsteopontinHeavy−505.1−118.90 × 10−99
Light−566.5−8.29.40 × 10−79
MOR6993—OsteopontinHeavy−389.9−7.91.7 × 10−62
Light−481.6−7.72.3 × 10−63
MOR6993_1_CDRH3—OsteopontinHeavy−489.5−9.21.70 × 10−710
Light−568−7.62.50 × 10−69
* The scFv binds OPN as a single structural unit (VH + VL), and per-chain Kd values represent predicted affinity contributions of each chain to the overall binding interface.
Disclaimer/Publisher’s Note: The statements, opinions and data contained in all publications are solely those of the individual author(s) and contributor(s) and not of MDPI and/or the editor(s). MDPI and/or the editor(s) disclaim responsibility for any injury to people or property resulting from any ideas, methods, instructions or products referred to in the content.