


Abstract
We investigated the influence of age on the debilitating effect of glare for glare sources applied to the task or to the eye. Low-contrast logMAR letters were presented on a computer monitor, and the visual performance of 66 adults (23 to 66 yrs.) was measured under three conditions: no glare, ocular disability glare and task disability glare. A significant decline in visual performance with age was found in each condition. Factoring out the decline due to age alone (the ‘no-glare’ condition), a large, significant (p < 0.001) effect of age on ocular disability glare (a decline of 0.089 logMAR units per decade) remained, as did a very small effect on task disability glare (a decline of 0.026 logMAR units per decade, p = 0.051). These results show that different mechanisms are responsible for the impact of the two types of disability glare, indicating the need to differentiate between them in their classification.
1. Introduction
Light is normally thought of, and referred to, in very positive terms. However, there can be negative effects on a person when there is too much light—it can cause discomfort, a reduction in visual performance, or both. In this study, we have examined the different ways in which glare can produce visual disability.
Howarth (2026) [1] classified the fundamental ways in which visual performance can be reduced by glare, differentiating between whether light affects the eye (‘ocular disability glare’) or the task (‘task disability glare’). This distinction is important because the term “disability glare” is used differently in different contexts. Lighting specialists only consider this term to refer to disability caused by scatter within the eye (e.g., [2]), and similarly, the Optometrist will only be concerned with reduced vision caused by ocular cataracts or eye surgery. An ergonomist, on the other hand, may be concerned with the disability caused by the reflection of light from a computer screen, or the reduction in visual performance when looking through a misted-up car windscreen. The person wanting to take money from an ATM machine, who is unable to read the text on the screen because of the bright sunlight, would typically say that the problem is one of ‘glare’, and as the problem suffered by the person is a loss of visual performance, a user-centred classification would term this ‘task disability glare’. Indeed, the description of the visual loss when light affects the task (rather than the eye) as ‘disability glare’ has been present in the ergonomic literature for some time (e.g., [3]) as well as having common parlance, e.g., the use of “anti-glare filters” in front of computer monitors.
In considering reduction in visual performance, it is important to recognise the mechanism involved so that contributing factors can be identified. One such instance is the issue of how disability glare affects the person as they age. Almost invariably, the textbooks tell us that as a person ages the effect of disability glare increases, and there is clear evidence of this [4,5,6,7,8,9,10,11,12,13,14,15,16,17,18,19,20]. However, these studies all examine disability in the context of the effect on the eye. If the disability occurs because the task is affected by the glare, then one might expect that any visual performance decline would be less dependent upon age. The ubiquitous idea that the disability from glare increases universally with age is not necessarily true, even though this idea is pervasive in gerontology (e.g., [21,22]).
On theoretical grounds, visual performance in general is expected to decrease with age, and the manner in which it does so is well known (see, e.g., [23]). Although the effect of ocular disability glare is expected to increase significantly with age, the effect of task disability glare might be expected to be almost independent of age. Older people have a lower sensitivity to contrast (e.g., [24]), which will affect their performance in the absence of glare as well as in its presence, and so the relative decline in performance when the glare affects the task might be small. This hypothesis about task disability glare is generated, on theoretical grounds, from previous work, but it has not been verified experimentally to date.
The issue is important in the context of understanding how visual performance is affected under various lighting conditions. Road signage and driving are a case in point, where the driver’s visual performance can be affected by glare generated in a number of ways. The sun, or oncoming car headlights, will provide scattering within the eye, causing dazzle and a reduction in retinal contrast. On the other hand, it is the contrast of the task which is affected by fog and rain, or by the misting up of the windscreen [25,26,27,28,29]. These are different mechanisms, and age might be expected to affect them differently.
The purpose of the study was to investigate the effect of age on task disability glare and on ocular disability glare, and the study had two aims. The first was to measure the impact of task disability glare with increasing age. The second was to compare the magnitude of task disability glare with that of ocular disability glare across the same age range. Any differences in age-related impacts of the two types of glare would imply different underlying mechanisms, and consequently independence.
2. Methods
To examine the effect of age on glare, we measured the visual performance of 66 adults on a low-contrast task under three conditions: no glare, task disability glare and ocular disability glare.
2.1. Procedure
The research follows the tenets of the Declaration of Helsinki, and prior approval for the study was obtained from the Ethical Committee of Loughborough University. Each participant was presented with an explanation of the research and provided written informed consent before participating.
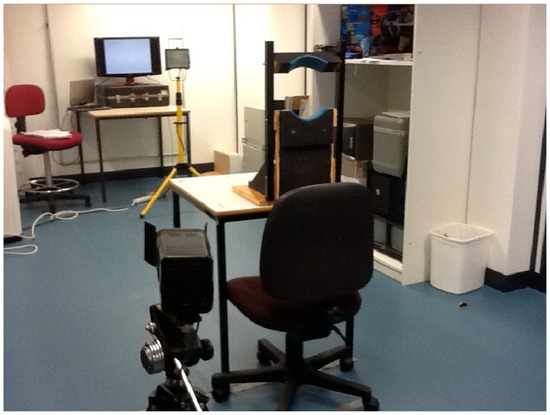
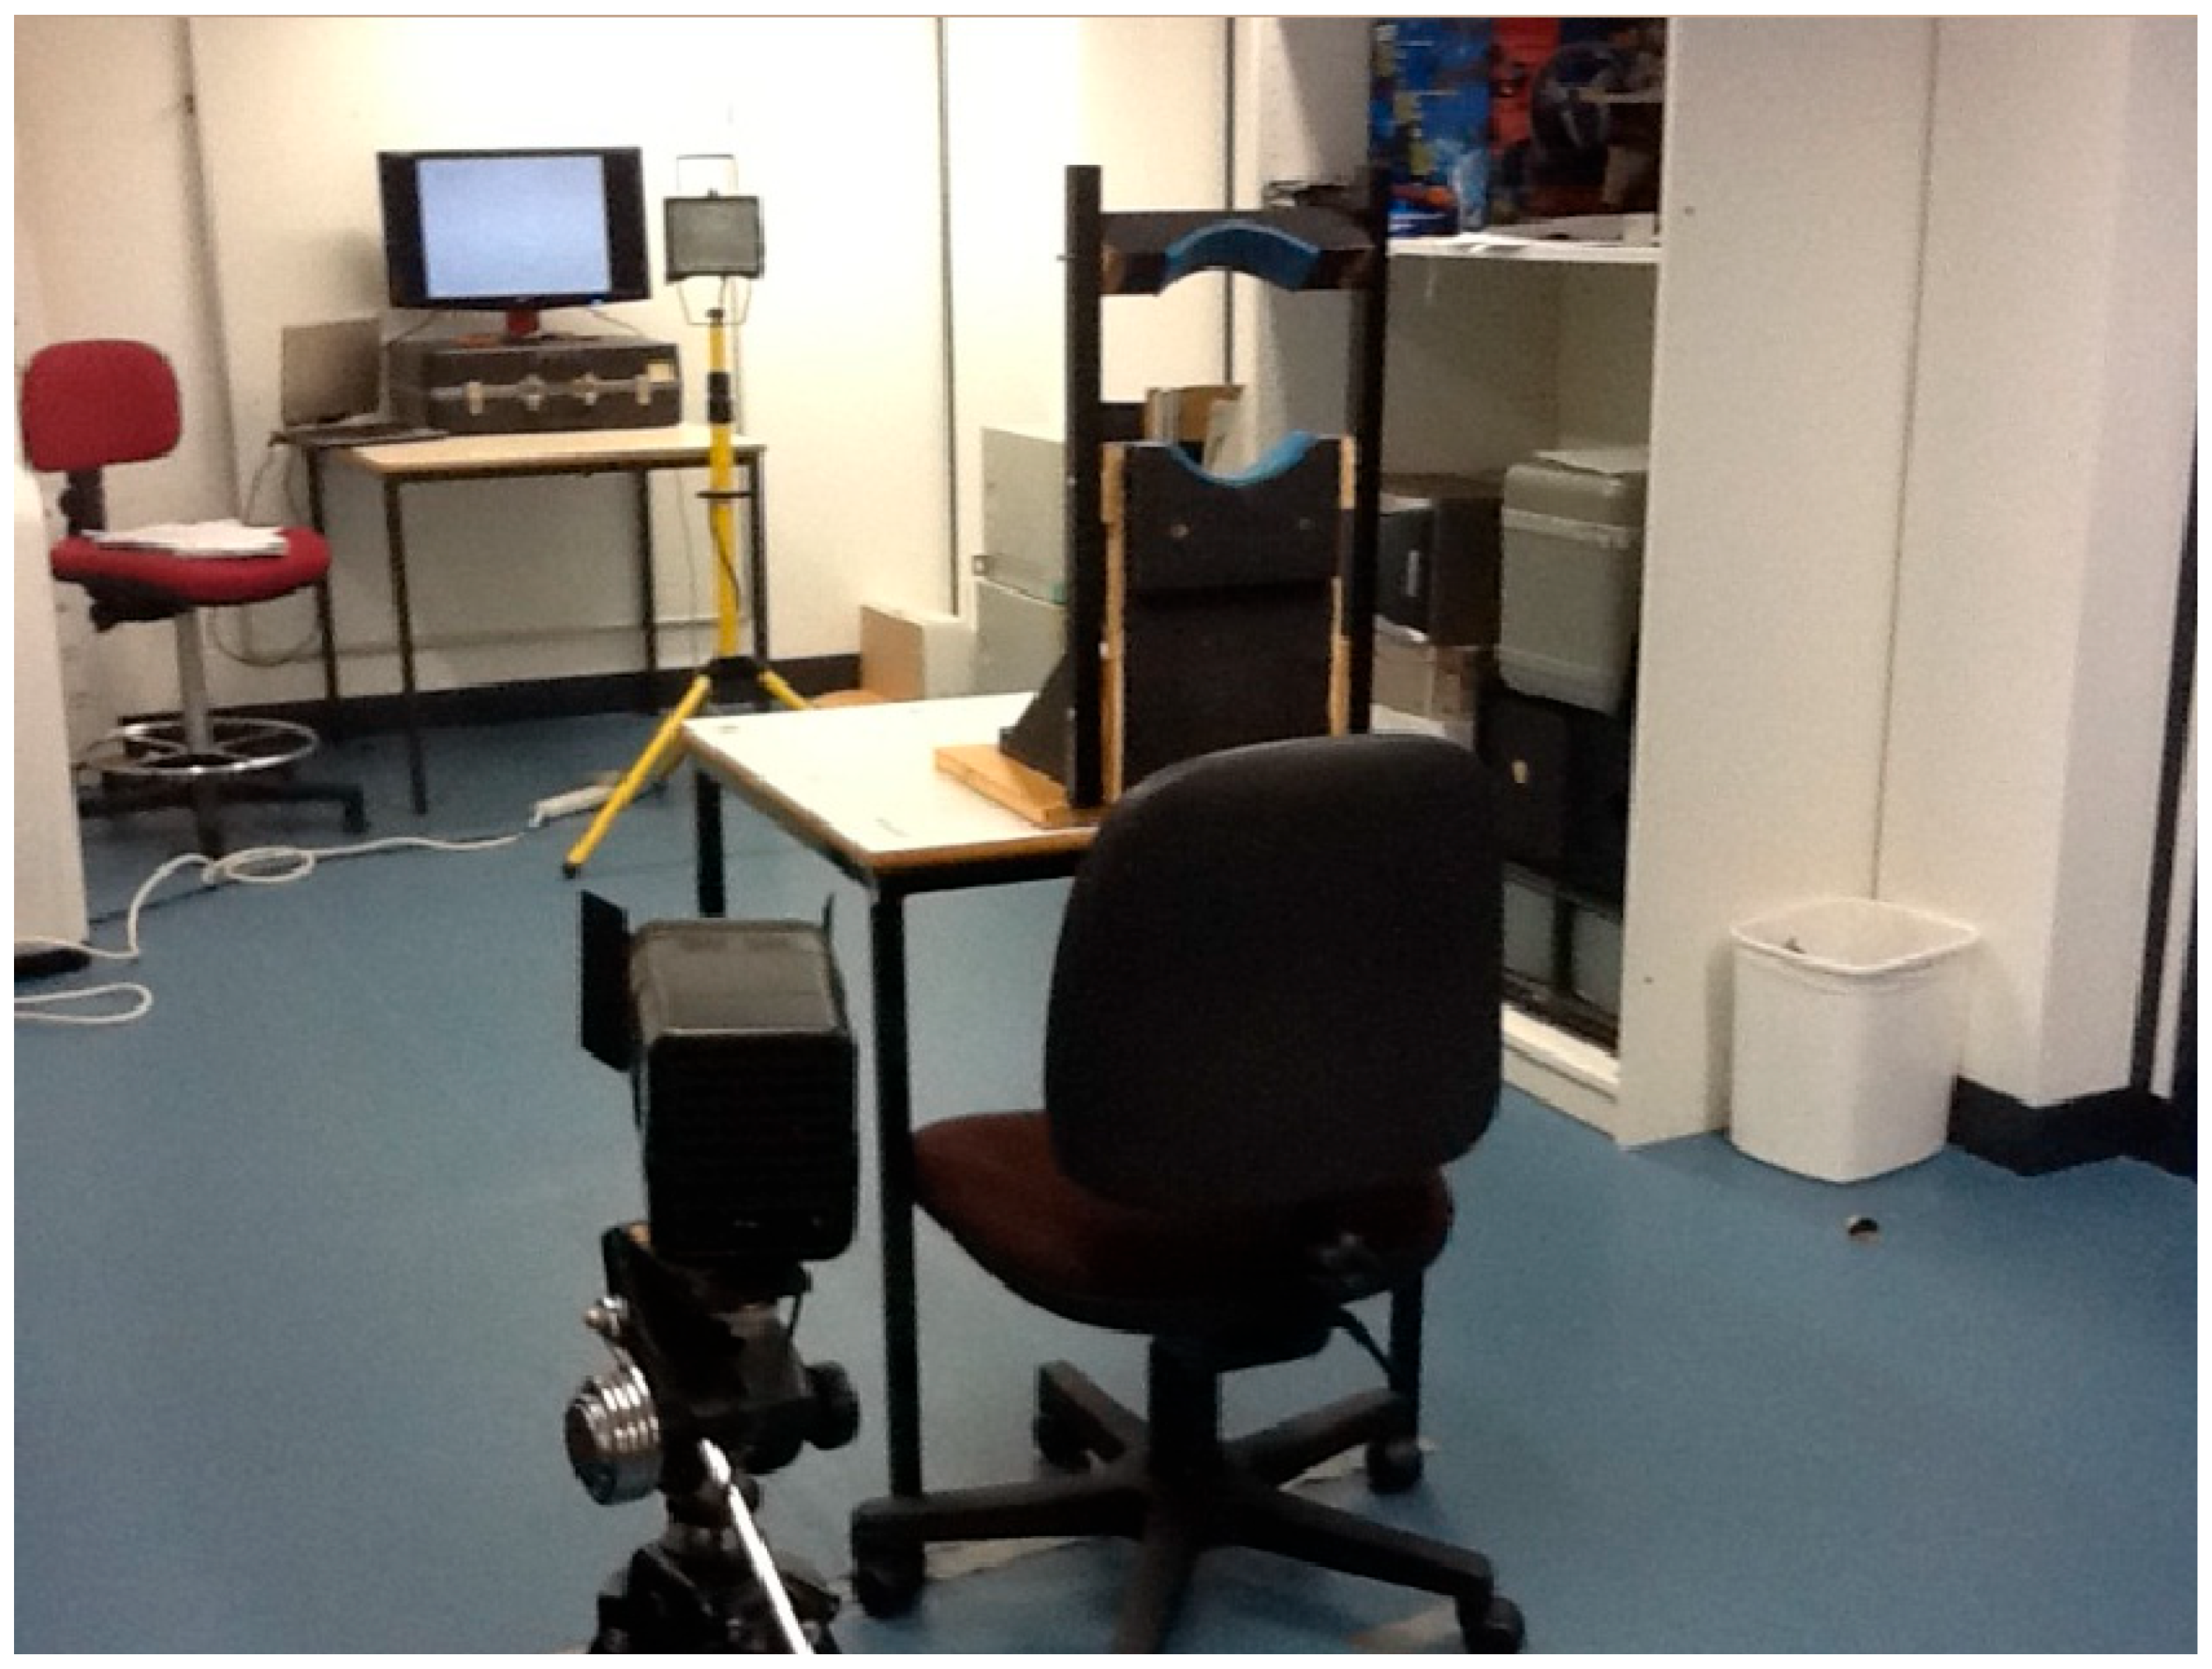
The experiment was performed under normal environmental lighting in the laboratory. Visual performance was measured with the participant sitting 4 m from the computer monitor (Figure 1).
Figure 1.
The experimental equipment, showing the screen, headrest and the two lamps. The location of the lamps during the tests is described in the text.
Participants sat with their head fixed in position by means of a headrest for standardisation of test position. Monocular vision with the preferred eye was employed throughout the study. The participants were instructed to read out letters presented on a monitor using a forced-choice method of testing, following a standard procedure [30].
2.2. Measurements Taken
The stimulus was a series of low-contrast log MAR letters (Log10 of the Minimum Angle of Resolution) of geometric progression. The MAR is taken as the stroke width of the letters, which is one-fifth of their vertical angular subtense. A logMAR progression was used not only because the difficulty increases in equal steps, but also because changing letter size by the same proportion provides an equal interval scale [30]. This was important in our experiment because it allowed us to perform mathematical operations (subtraction) in comparing the results found in the different conditions. As a consequence, there was no need to match or normalise the glare conditions.
The letters chosen for the chart were a series of ten 5 × 4 (height to width ratio) non-serif letters, ZUDPERNVHF of equal legibility and readability [30,31], which are standard letters for British visual acuity testing [32].
The test letters were created using Adobe Illustrator CS6 (Adobe Inc., San Jose, CA, USA) and were presented on a computer monitor of matted surface; Acer model GD245HQ (Acer Inc., Xizhi District, New Taipei City, Taiwan), with dimensions 60 cm by 35 cm and a refresh rate greater than 60 Hz. A total of 77 different slides were produced as a Microsoft PowerPoint presentation, with each slide containing a single letter.
The letters were categorised into 14 groups, with each group having 5 letters of the same size. The change in size of each group followed a logarithmic progression with a step size of 0.1 log unit. The largest letter was 8 cm high, and the smallest was 0.4 cm. The stimulus contrast (defined as (Luminanceletter − Luminancebackground)/Luminancebackground [the letter luminance being 50 cd/m2 and background luminance being 60 cd/m2]) (in the absence of glare) was 17%.
Visual performance was recorded as the visual acuity score obtained by counting every letter read correctly [4]. This procedure, in which each correctly identified letter adds 0.02 logMAR units to the score, allows interpolation between the lines, providing a finer scale.
2.3. Test Conditions
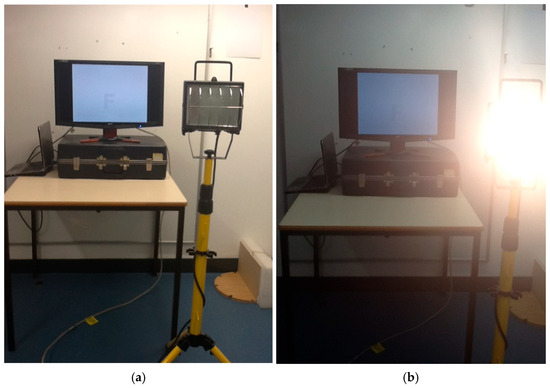
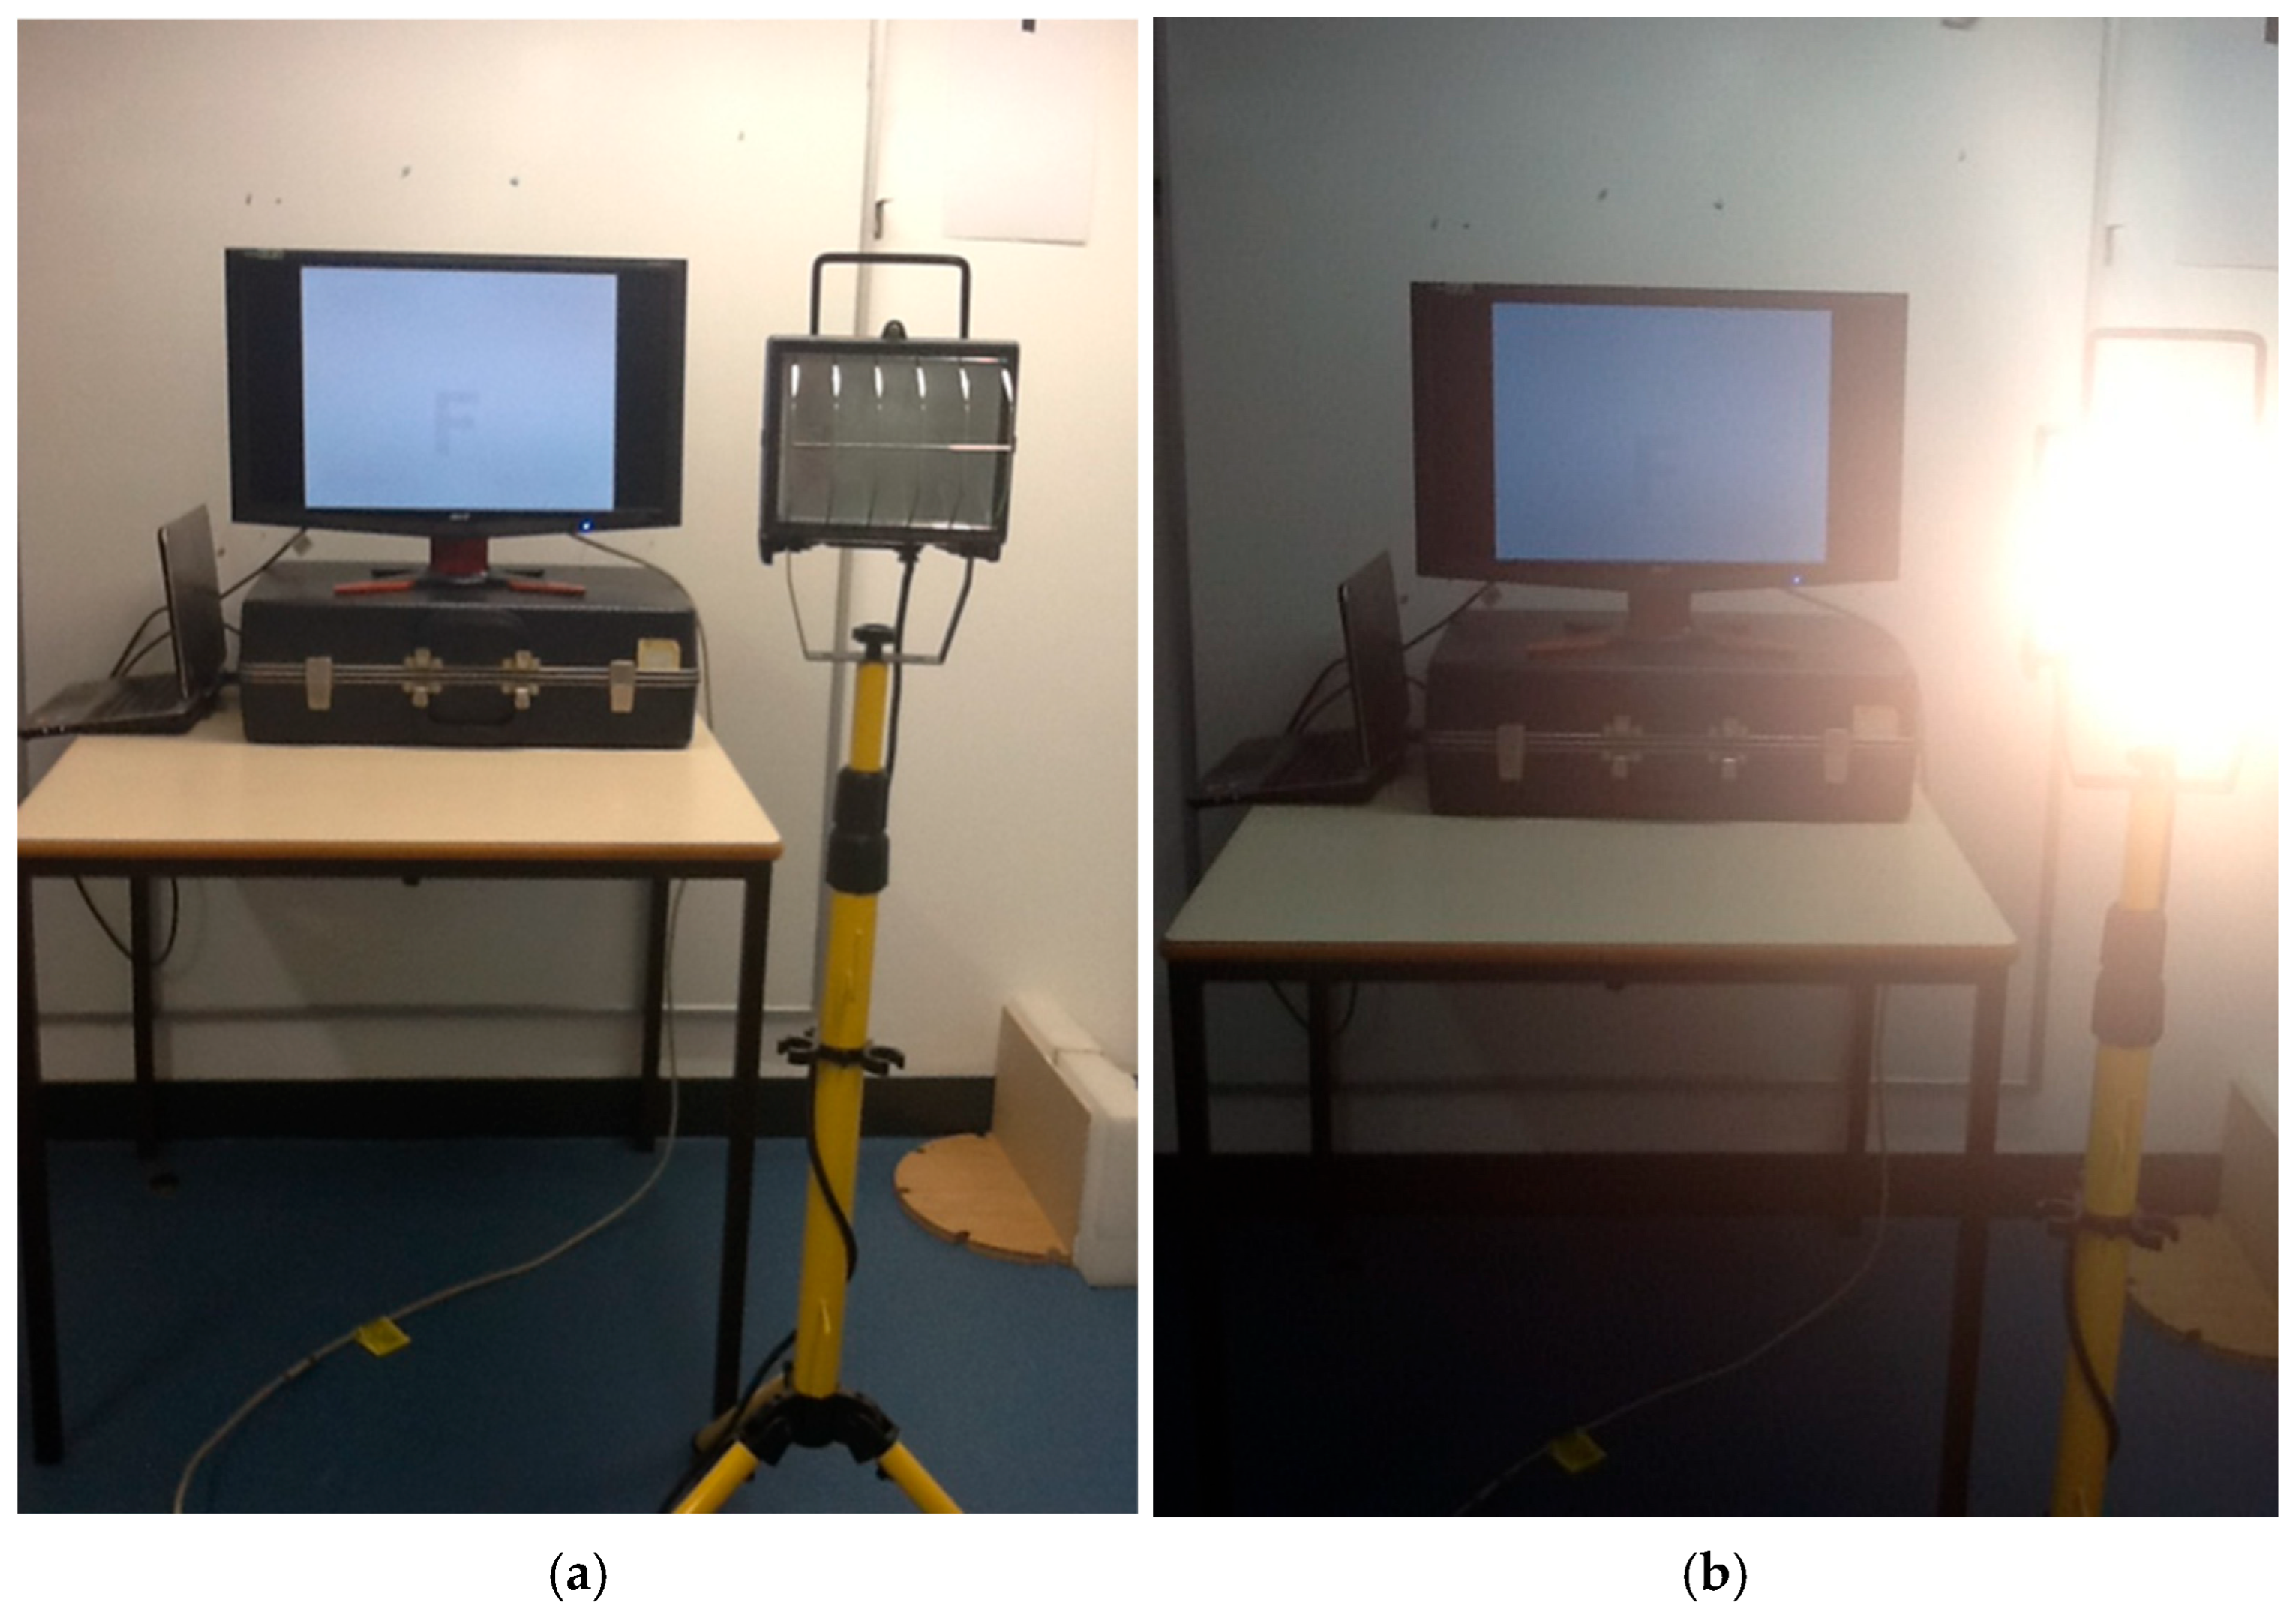
- No glare: this is the control for each participant. The screen was viewed under normal laboratory lighting, which provided illuminance of 700 lux in the plane of the eye and 700 lux in the plane of the screen (Figure 2a).Figure 2. The no glare (a) and the ocular disability glare (b) set-ups.
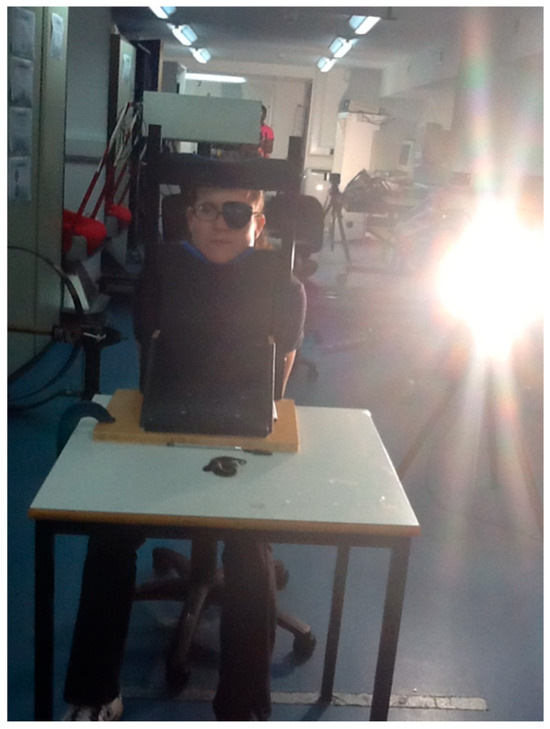
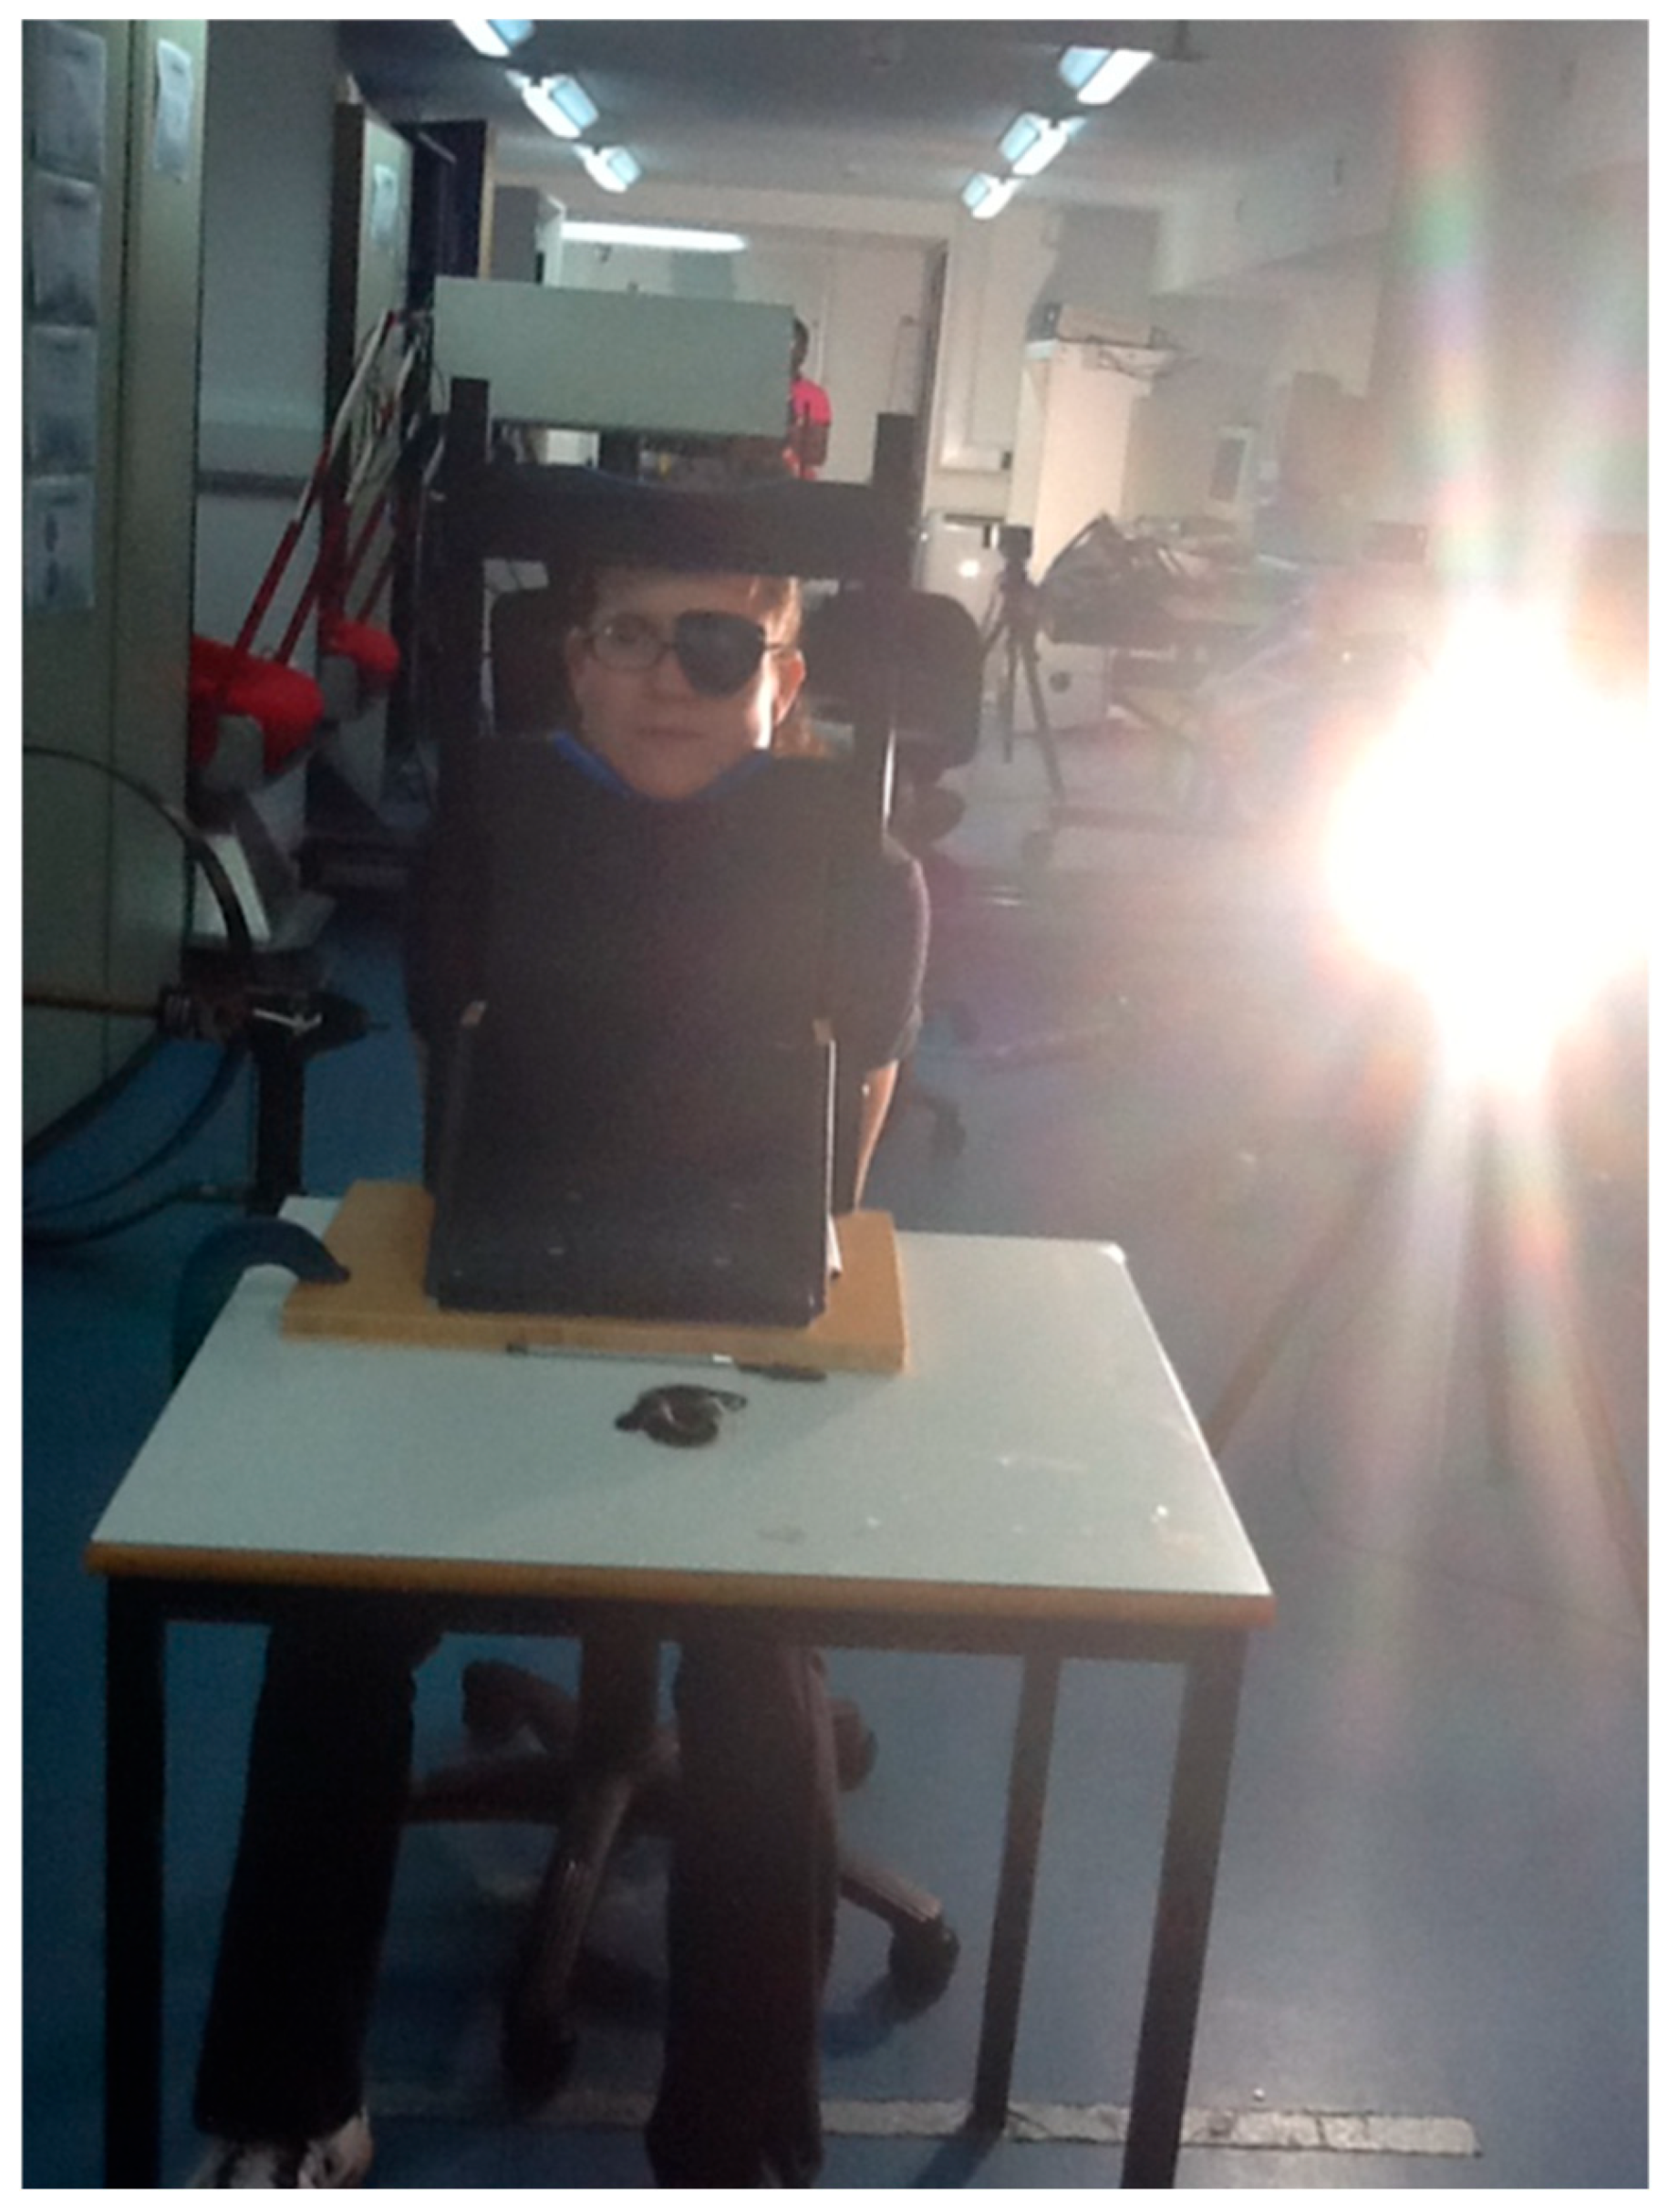
- Task disability glare condition: a 240 V 1000 W Kaiser 3007 SFK photoflood lamp (Kaiser Fototechnik, Buchen, Germany) was positioned 5 m from the screen, to the left of the participant at an angle 60° to the midline of the screen. The positioning was in such a way that uniform illumination was provided by the lamp over the task and background. The lamp produced a luminance of 158,000 cd/m2 and an illuminance of 780 lux (in the vertical plane) on the screen (Figure 3).Figure 3. A participant undergoing a visual performance test under a task disability glare test condition. The photograph was taken from the monitor position.
- Ocular disability glare condition: a 240 V 500 W MAX, linear tungsten halogen lamp was positioned 2.9 m from the participant. The glare source was positioned at 4° from the line of sight of the participant’s eye. The lamp produced luminance of 158,000 cd/m2 and illuminance of 780 lux (in the vertical plane) at the line of sight of the eye of the participant (Figure 2b).
Adequate time was allowed for the participant to adapt after exposure to a glare test condition. In the pilot study visual performance was worst under the ocular glare condition, therefore this condition was presented first, to minimise the effect of memory, with the order of the other conditions assigned randomly.
2.4. Participants
Participants were recruited from staff and students of Loughborough University and international visitors attending a conference at the University. In total, 81 participants (47 male and 34 female) were tested, ranging in age from 23 to 66 years (mean age, 42 years). All participants volunteered to take part in the study after they were approached in person and no reward was given to the participants for taking part in the study.
Participants used their normal correction during this research and there were no exclusion criteria. All testing was conducted with normal pupils, to provide typical visual conditions. None of the participants reported any ocular abnormalities other than refractive errors. Subjects were measured under all 3 conditions and consequently acted as their own controls: any ocular abnormality or uncorrected refractive error would be present in all conditions.
2.5. Data Analysis
Obvious extreme outliers were first removed, after which the data was cleaned further by setting an objective (to prevent researcher bias) exclusion criterion. In order to do this, the data was split into groups of seven on the basis of increasing age and the Mean, SD and SE were calculated for each group. The data from any participant who had any of their results more than ±3 SE from the group mean was excluded from the analysis.
The effect of ocular and task disability glare was calculated as the difference in the no-glare visual acuity score and the visual acuity score under the respective disability glare [4].
A regression analysis was performed to evaluate the effect of age on visual performance score under the three test conditions. For simplicity, a linear model was used. The effect of ocular and task disability glare as a function of age was examined, followed by an analysis of the difference between these two effects as a function of age, using Student’s t-test.
3. Results
3.1. Visual Performance and Age
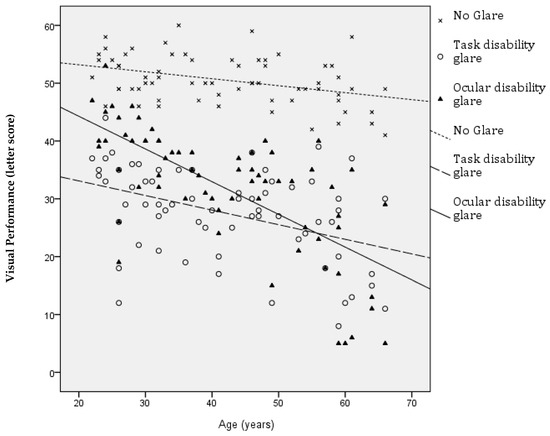
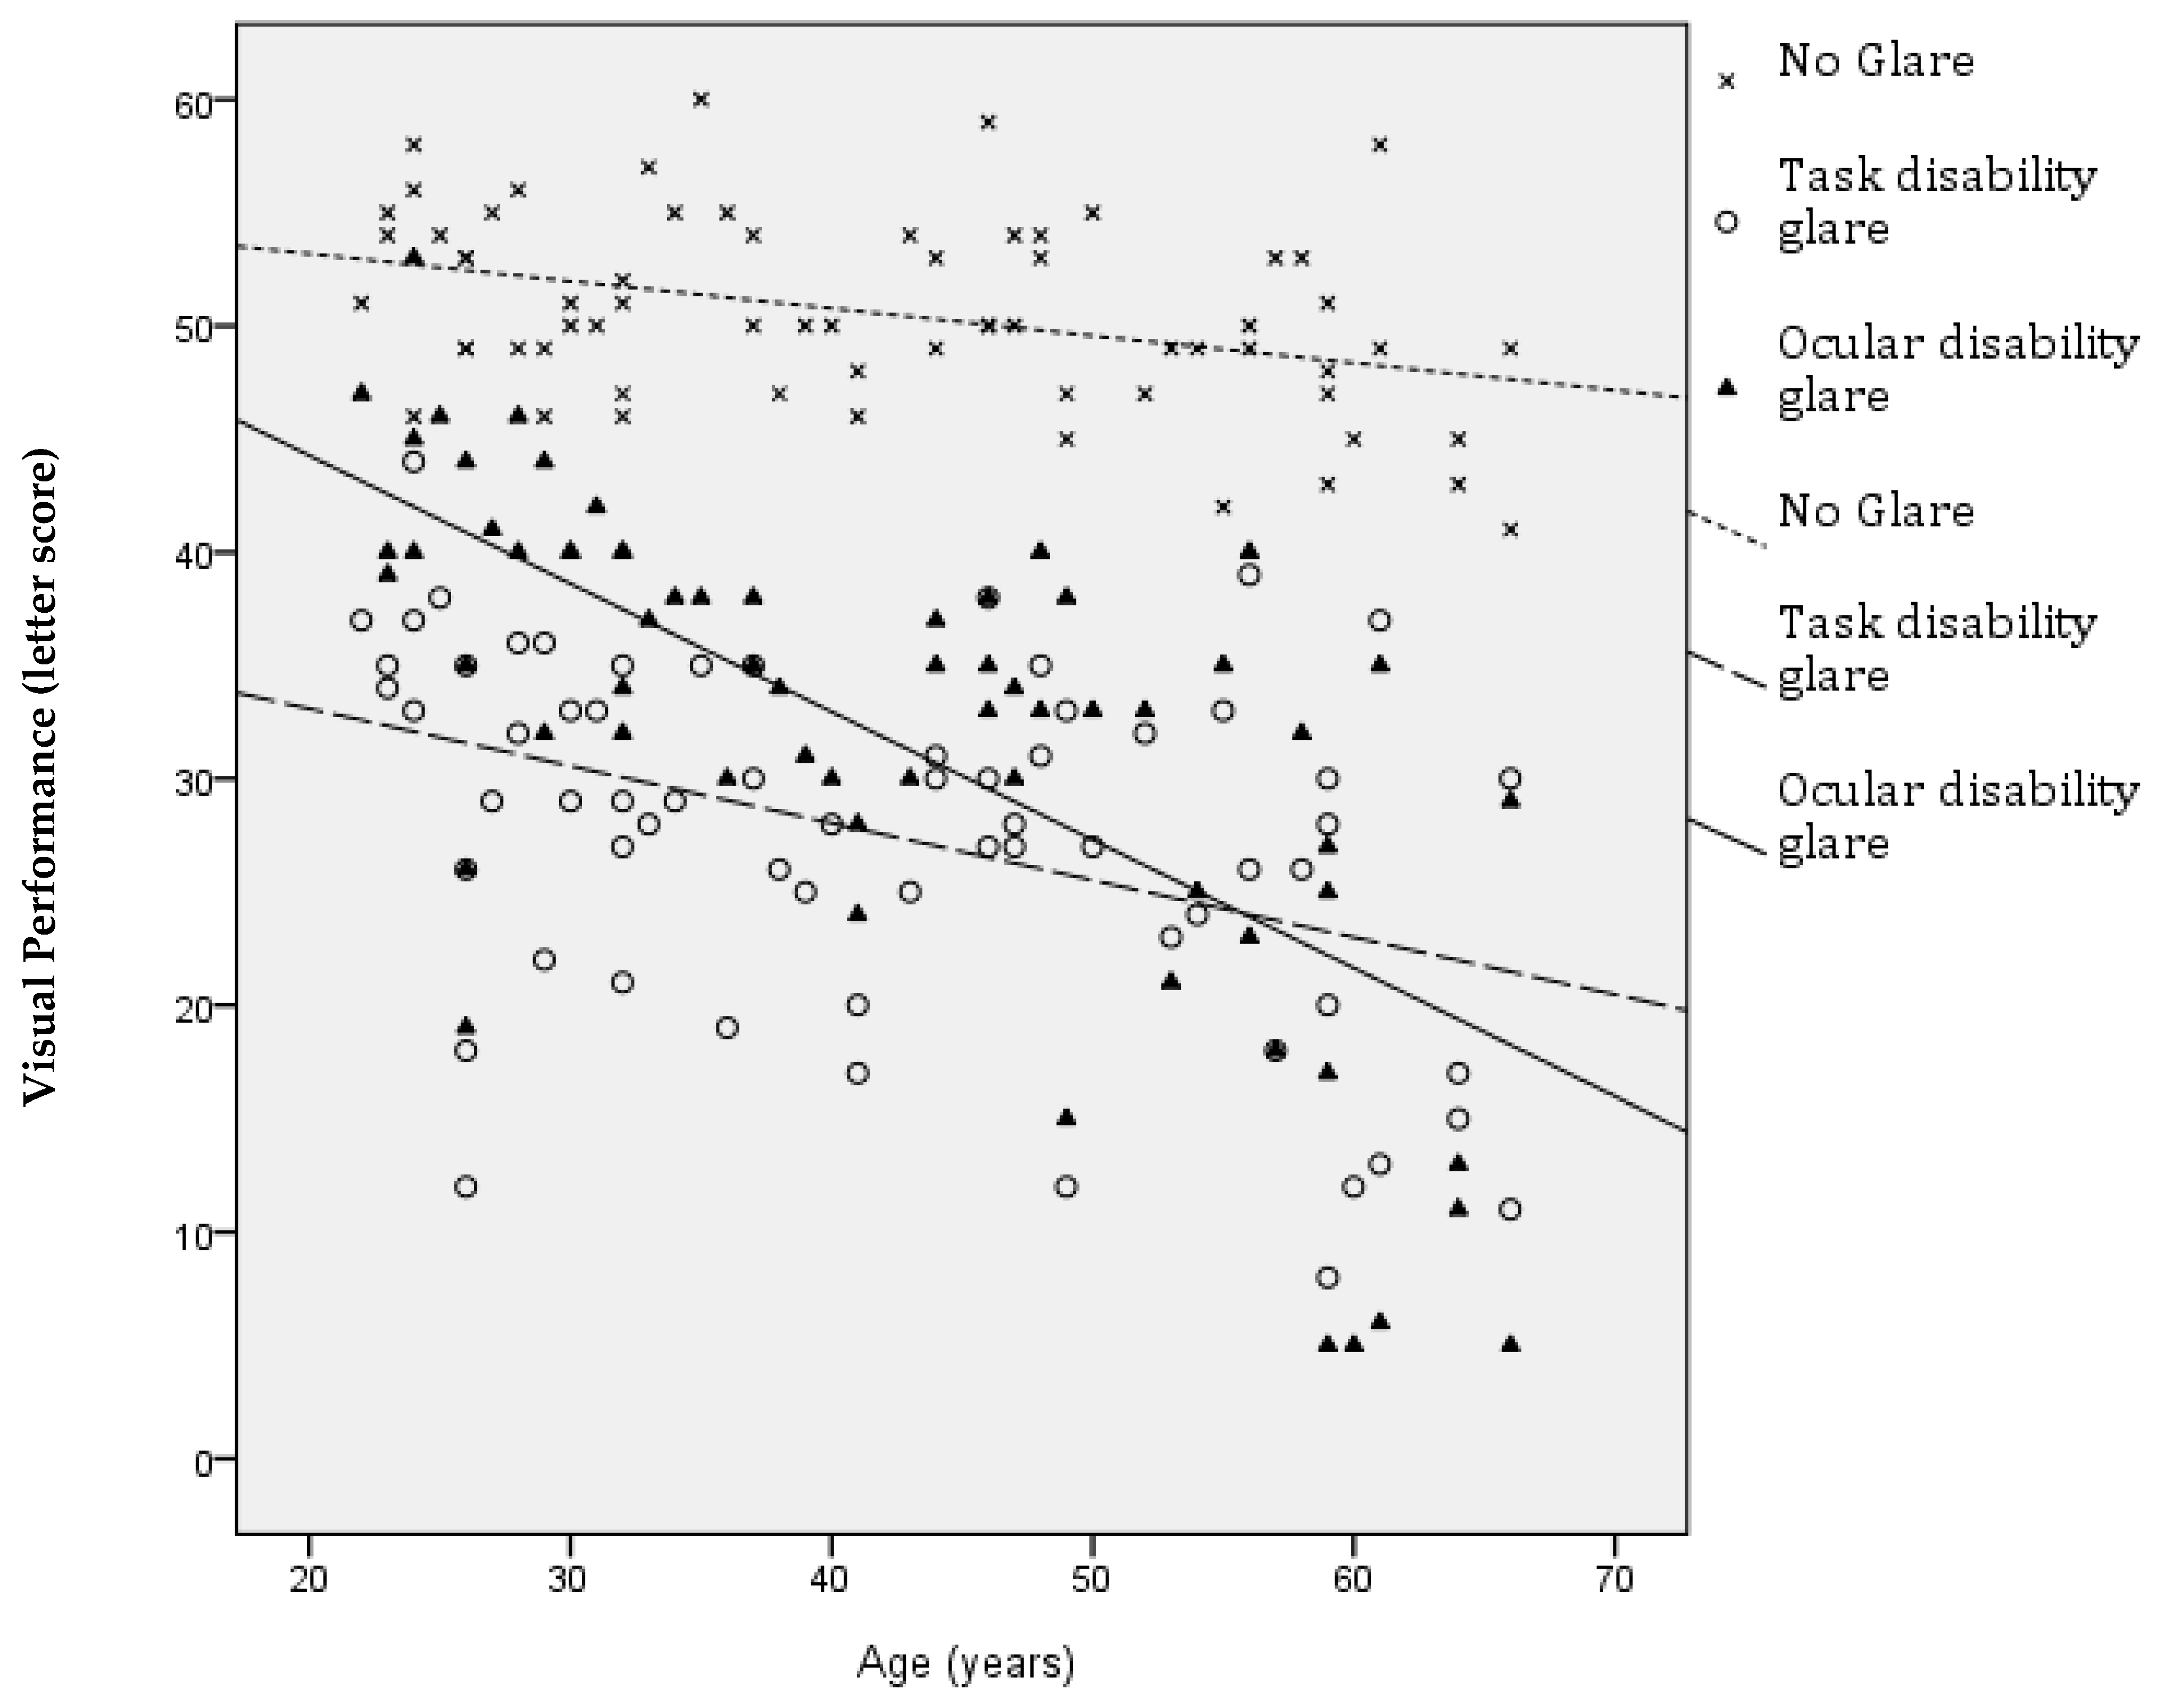
The scatterplot of visual performance without glare (X) as a function of age in Figure 4 shows a negative relationship between the two variables. The regression model analysis of this relationship was statistically significant at p = 0.001, with age contributing to 14.8% of the variation (R2 = 0.148).
Figure 4.
Visual performance (low contrast LogMAR letter score) under no glare, ocular disability glare, and task disability glare as a function of age.
Visual performance under the ocular disability glare condition was observed to decrease with age and the regression analysis indicated a highly significant effect (p < 0.0001, R2 = 0.485).
Finally, a negative relationship between age and visual performance under task disability glare was shown, and again the regression analysis of this relationship was highly significant at p < 0.0001, R2 = 0.178.
3.2. Age and Visual Performance Under Glare Conditions
In order to examine the effect of age on the decline in visual performance as a consequence of glare, we first need to remove the effect of age itself on visual performance from the data. This was performed by subtracting, for each individual, the performance under each glare condition from the performance under the no glare condition.
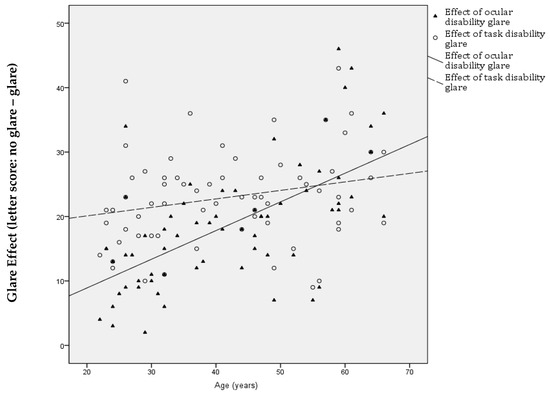
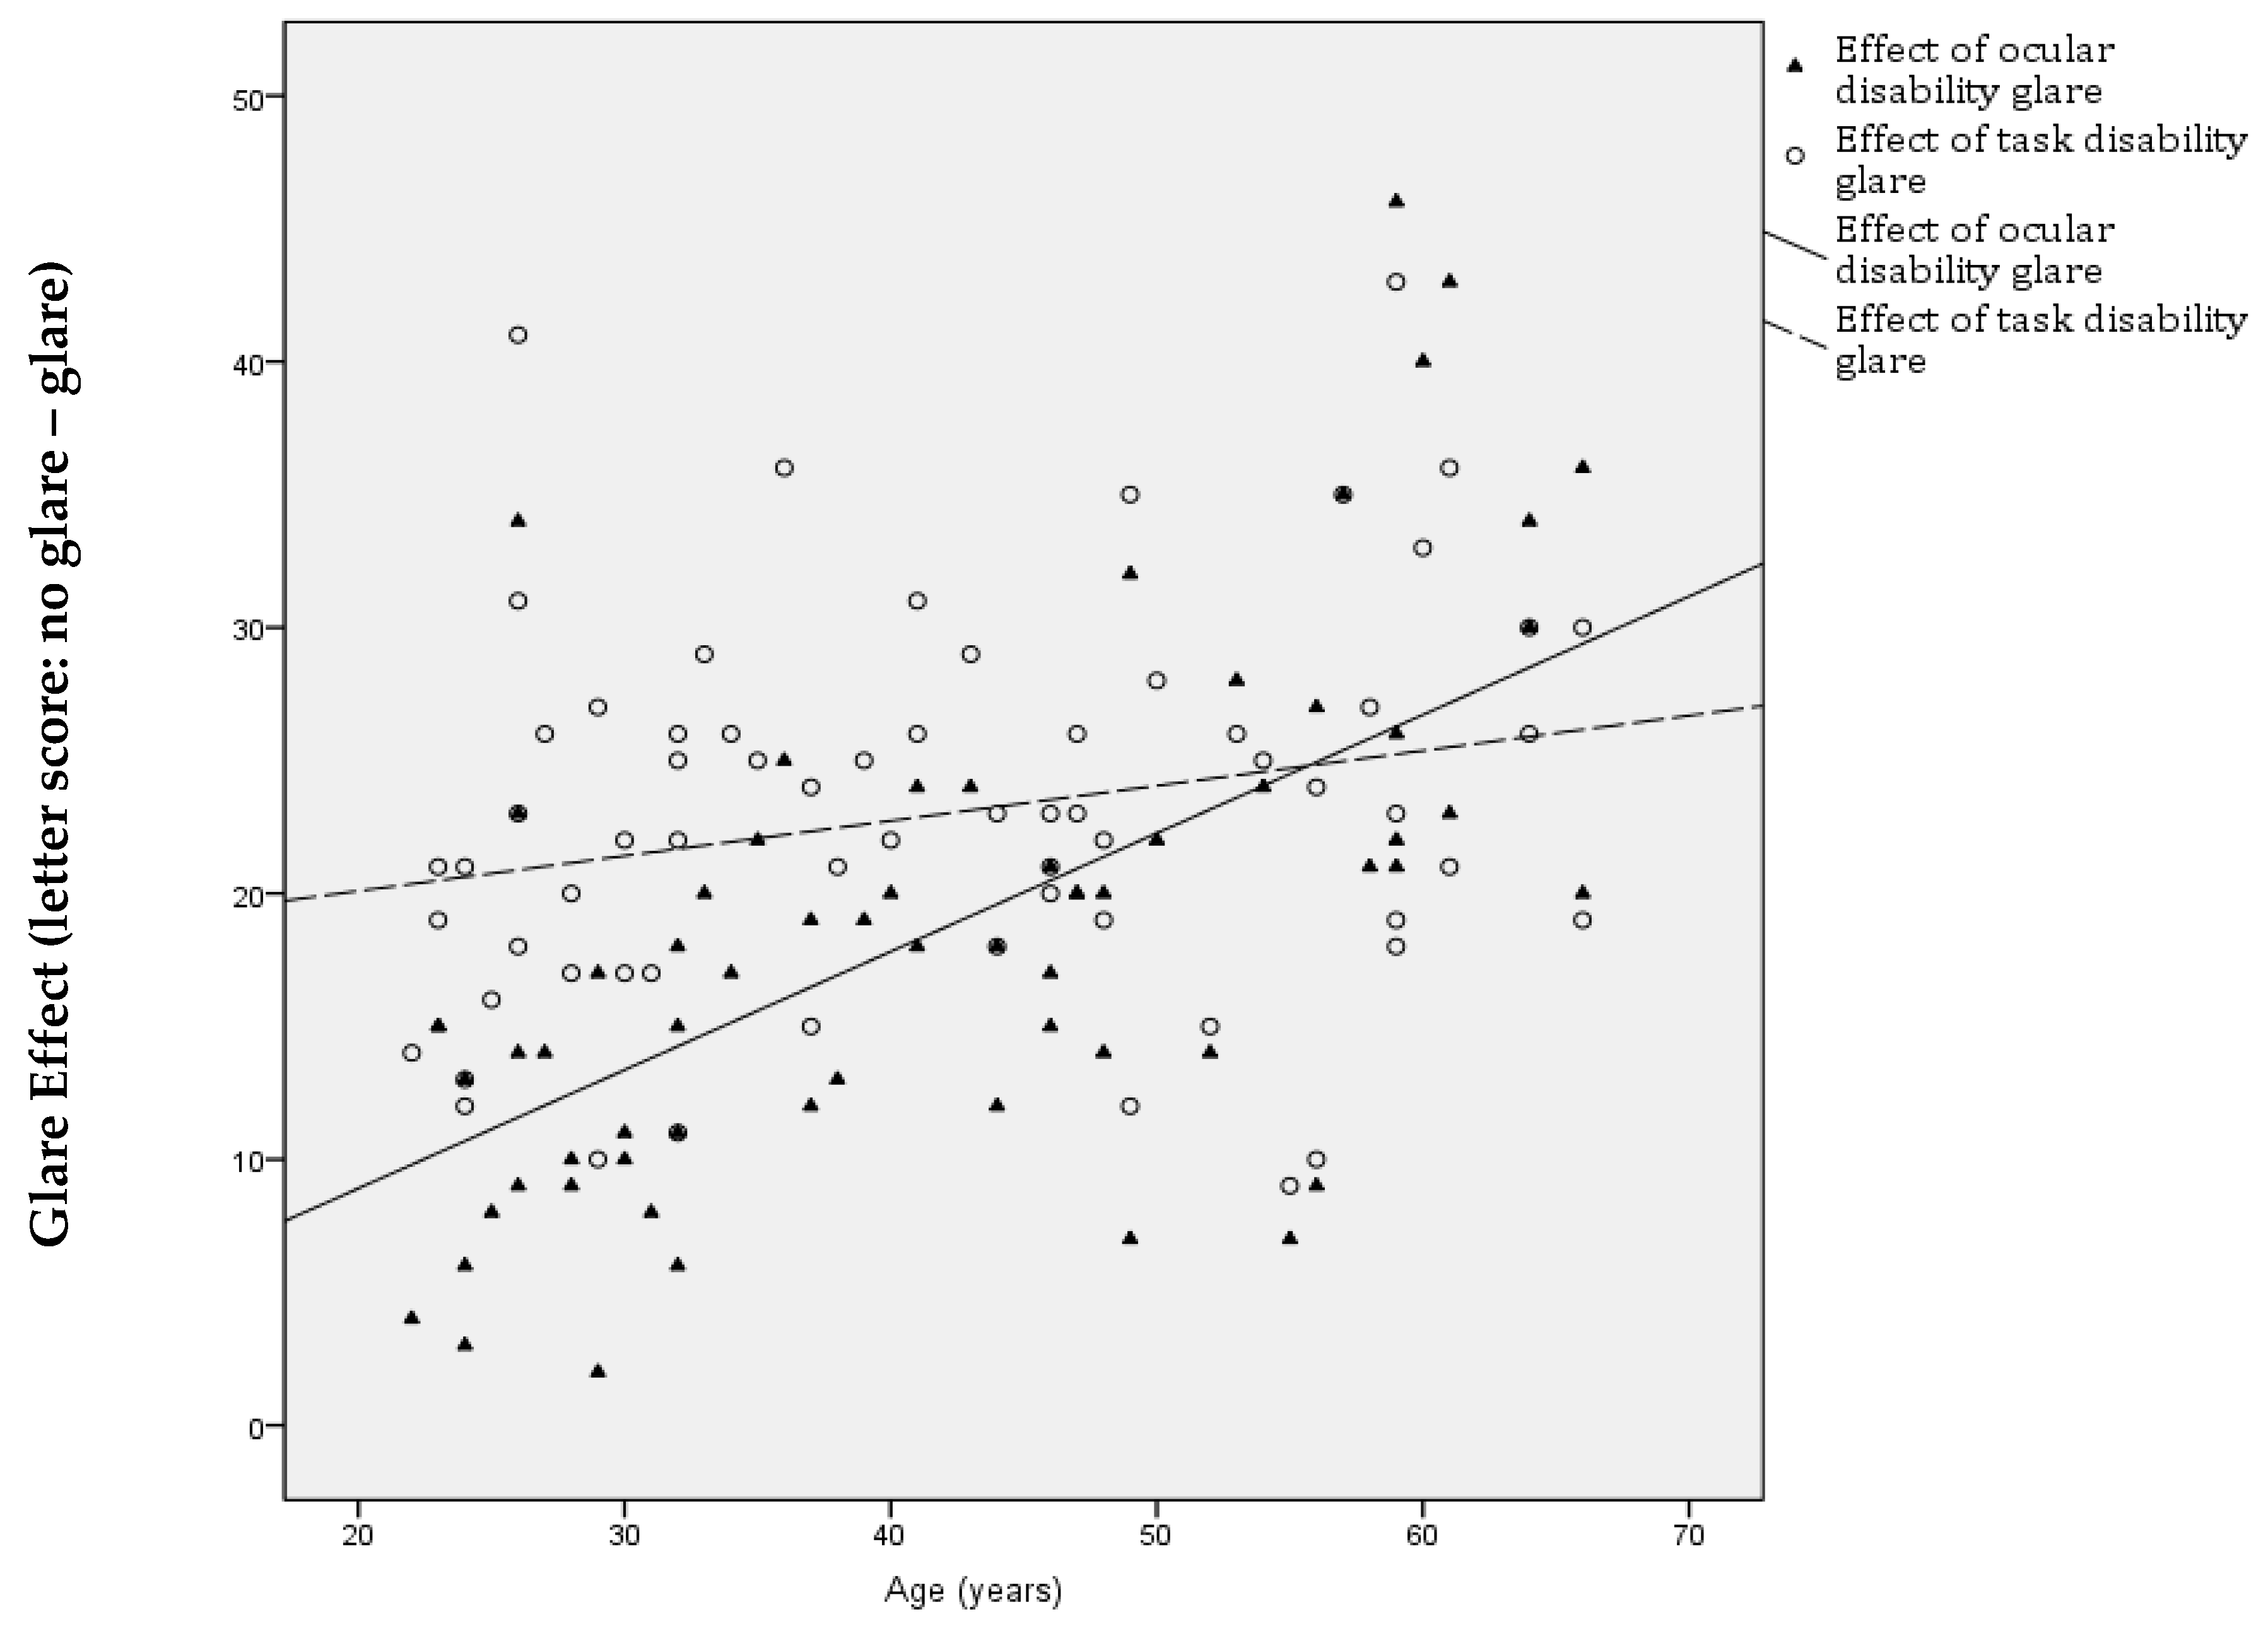
If age were to have no influence on the disabling effect of the glare, we would expect the regression line(s) in Figure 5 to be horizontal. Neither have this form and we can conclude that the effect of both ocular and task disability glare increases with age.
Figure 5.
Differential effect of task and ocular disability glare on visual performance with age (difference in letter score between no glare and glare conditions).
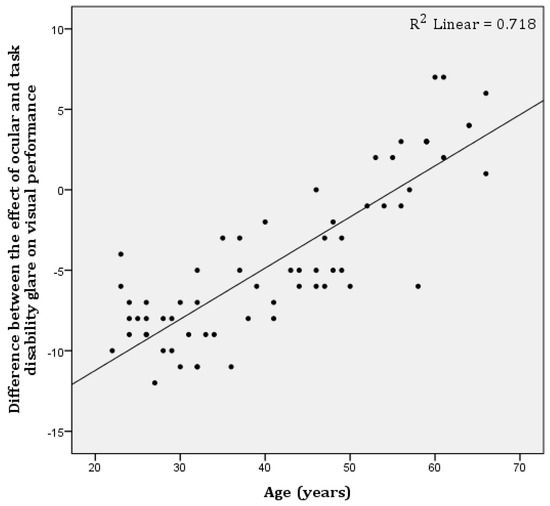
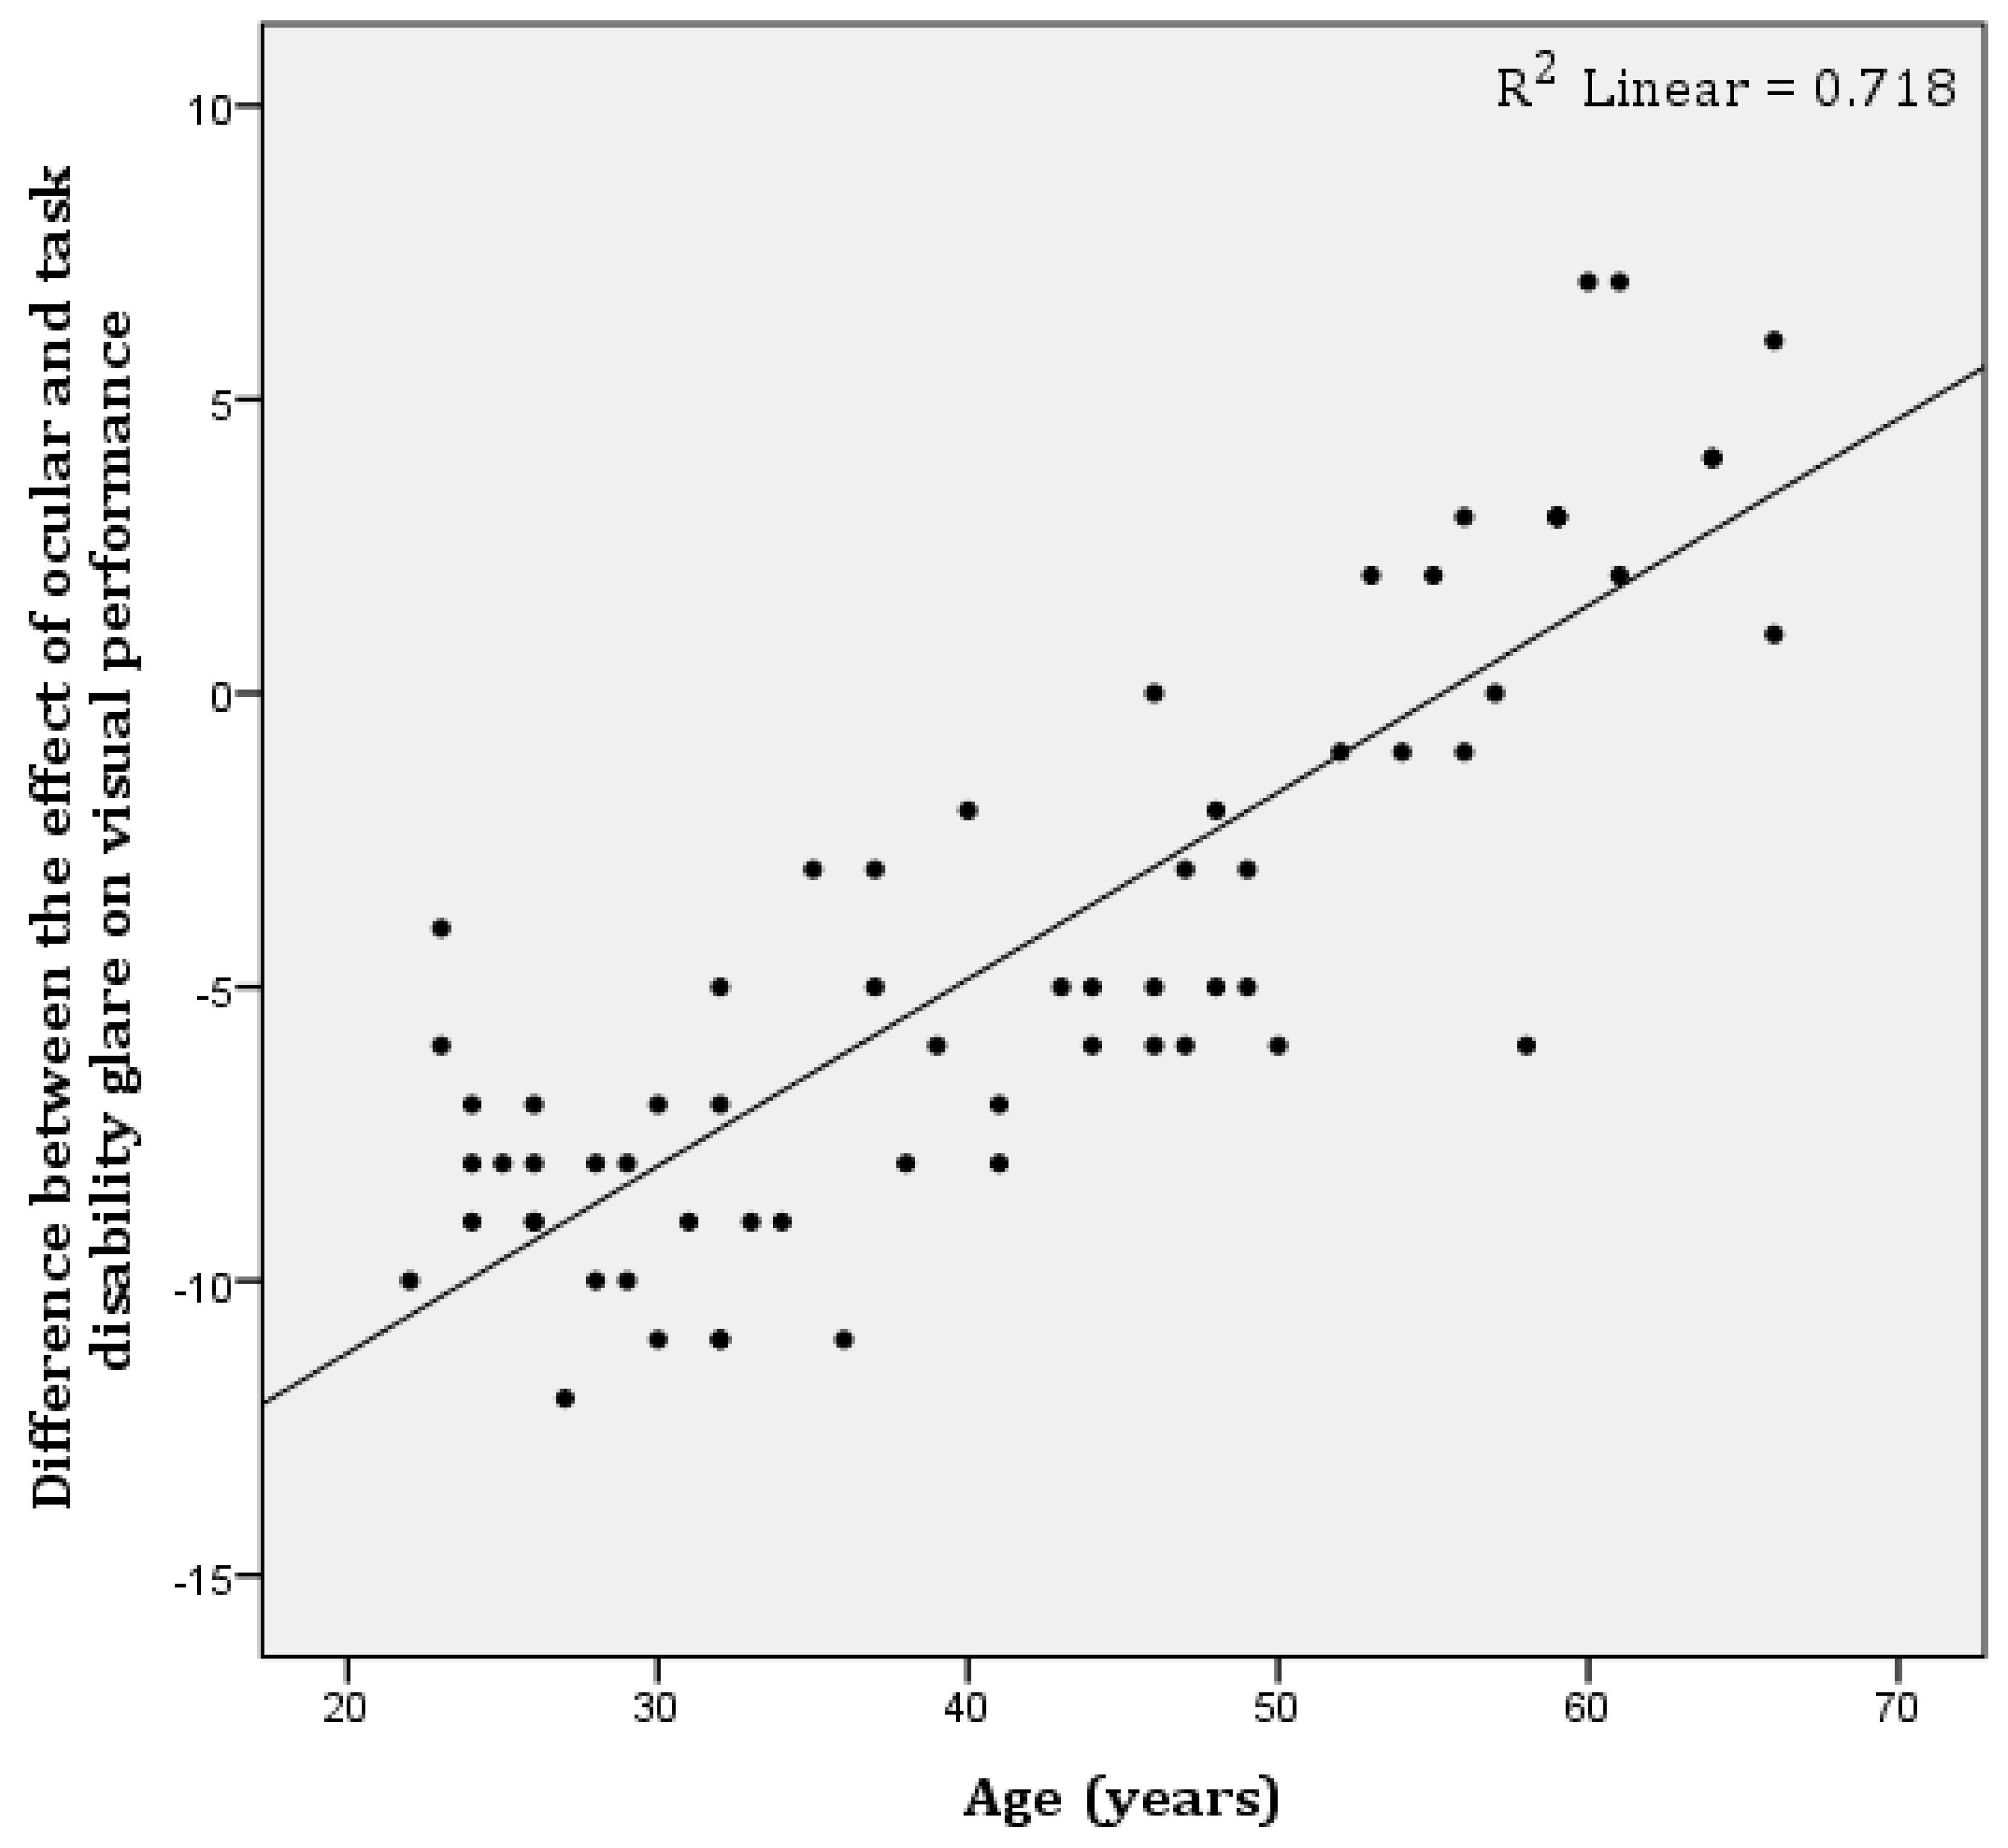
To compare the relative declines, we then examined the difference between acuity/letter scores as a function of age. Figure 6 shows the scatterplot of the difference between the effect (decline in visual performance) of ocular and task disability glare as a function of age. If both effects were accounted for by age alone, we would expect the regression lines to be horizontal. If age has a similar compounding effect on both types of glare, we expect lines with parallel slopes, but as we can see from the figure and the analysis provided in Table 1, the two effects are different.
Figure 6.
Difference between the effect (decline in low contrast visual performance) of ocular and task disability glare on visual performance as a function of age.
Table 1.
The regression data for all three conditions, and for the two glare conditions when the “no glare” score was removed.
4. Discussion
The results support previous reports that both visual performance and susceptibility to disability glare increase with age [4,33,34,35,36,37,38]. A decline in visual performance as a function of age was found in all three conditions, the greatest decline being under ocular disability glare and the least being in the glare-free condition. The R2 values for ocular and task disability glare indicated that age was responsible for 38.3% and 5.8% of the variation in visual performance over and above the decline that was found under the ‘no-glare’ condition.
The increased influence of light shone on the eye as age increased supports the findings of Bailey and Bullimore (1991) and Elliot and Bullimore (1993) [4,33]. This was expected. The decline in visual performance under conditions of ocular disability glare is due to intraocular light scatter within the eye (which lowers the contrast of the retinal image) and as the eye ages, the amount of scatter increases [7,15,16]. This explains why encountering headlamps on main beam, or full sun, is more of a problem for the older driver than for the younger.
There was a large variation in visual performance seen amongst the sample used, and this is likely to be partly a consequence of the use of the low-contrast targets. Their use provides a measure which is far more sensitive to small differences than is the use of high-contrast targets, such as those found on an Optometrist’s standard letter chart [39]. Also, although some previous studies have controlled for variables such as pupil size, in our study we evaluated visual performance under natural conditions, and it is likely that the between-subject variability was increased as a consequence. An additional factor is that our sample was not specifically examined for ocular pathology, and so we might expect some differences because of the range of preclinical (asymptomatic) ocular abnormalities, such as cataract or pathology, which may impact visual performance under glare-free conditions. The reduction in the “no glare” score could produce a range effect: participants with a lower score will have a reduced range of change possible. However, given the aims of the study, inter-subject variability is factored into the experiment through the within-subject design, and any such effects will not affect the conclusions.
The changes seen with the sample are of value as indicative of the performance across this age range within the general population in an everyday context (other than at St. James Park, Newcastle, the natural world is generally not high contrast [40]). The use of low-contrast characters instead of a high-contrast chart provides both a more sensitive measure and a visual test which is more representative of the natural environment. From the regression lines of Figure 4, we can measure the changes between the ages of 25 and 65. The ocular disability glare scores decline from 41.4 to 18.8 and the task disability scores from 31.8 to 21.8. These are large changes, and we might expect further declines for older people and those with ocular pathology. The practical implication is that the designers of any form of visual display for use by older people need to maximise the contrast of the display.
In summary, although the effect of age on task disability glare may not have been particularly strong, the difference between the age effects on the two different forms of disability glare is clear, as seen in Figure 6. This difference can be accounted for simply by considering that the mechanism of the disability is different in the two cases—in one the contrast of the target is reduced, in the other it is the contrast of the retinal image that suffers [41,42]. The conclusion that there are two independent mechanisms producing this decline in performance under these different conditions supports the need (1) to distinguish between, and classify, two distinct types of disability glare, task disability glare and ocular disability glare, based on the physical and physiological basis for the decline in visual performance.
Funding
This research received no external funding.
Institutional Review Board Statement
The research follows the tenets of the Declaration of Helsinki, and prior approval for the study was obtained from the Ethical Committee of Loughborough University.
Informed Consent Statement
Informed consent was obtained from all subjects involved in the study.
Data Availability Statement
The raw data is present in the figures.
Conflicts of Interest
The author declares no conflicts of interest.
References
- Howarth, P.A. Towards a better understanding of glare: Classification on the basis of its effect. Theor. Appl. Ergon. 2026. [Google Scholar]
- Commission Internationale de I’Eclairage. CIE Equations for Disability Glare; CIE Report 146; CIE: Vienna, Austria, 2002. [Google Scholar]
- Garciai, K.D.; Wierwille, W.W. Effect of Glare on Performance of a VDT Reading-Comprehension Task. Hum. Factors J. Hum. Factors Ergon. Soc. April. 1985, 27, 163–173. [Google Scholar] [CrossRef] [Scilit] [PubMed]
- Bailey, I.L.; Bullimore, M. A new test for the evaluation of disability glare. Optom. Vis. Sci. 1991, 68, 911. [Google Scholar] [CrossRef] [Scilit] [PubMed]
- De Waard, P.; IJspeert, J.; Van Den Berg, T.; De Jong, P. Intraocular light scattering in age-related cataracts. Investig. Ophthalmol. Vis. Sci. 1992, 33, 618–625. [Google Scholar]
- Hemenger, R.P. Intraocular light scatter in normal vision loss with age. Appl. Opt. 1984, 23, 1972–1974. [Google Scholar] [CrossRef] [Scilit] [PubMed]
- Hennelly, M.; Barbur, J.; Edgar, D.; Woodward, E. The effect of age on the light scattering characteristics of the eye. Ophthalmic Physiol. Opt. 1998, 18, 197–203. [Google Scholar] [CrossRef] [Scilit]
- Herrero-Gracia, A.; Hernández-Andrés, R.; Luque, M.J.; Díez-Ajenjo, M.A. Age-related changes in contrast sensitivity function under different illumination conditions. Clin. Exp. Optom. 2025, 108, 880–885. [Google Scholar] [CrossRef] [Scilit] [PubMed]
- Holladay, L. The fundamentals of glare and visibility. J. Optom. Soc. 1926, 12, 271–319. [Google Scholar] [CrossRef] [Scilit]
- Holladay, L. Action of a light-source in the field of view in lowering visibility. J. Optom. Soc. 1927, 14, 1–15. [Google Scholar] [CrossRef] [Scilit]
- Kuroda, T.; Fujikado, T.; Ninomiya, S.; Maeda, N.; Hirohara, Y.; Mihashi, T. Effect of aging on ocular light scatter and higher order aberrations. J. Refract. Surg. 2002, 18, S598–S602. [Google Scholar] [CrossRef] [Scilit] [PubMed]
- Spieringhs, R.M.; Smet, K.; Cuijpers, R.; Heynderickx, I.; Hanselaer, P. Road Marking Contrast Threshold for the Elderly and the Impact of Glare. LEUKOS 2024, 21, 109–124. [Google Scholar] [CrossRef] [Scilit]
- Stiles, W. The nature and effects of glare. Illum. Eng. 1929, 22, 304–312. [Google Scholar]
- Wolf, E. Glare and Age. Arch. Ophthalmol. 1960, 64, 502–514. [Google Scholar] [CrossRef] [Scilit] [PubMed]
- Van den Berg, T. Analysis of intraocular straylight, especially in relation to age. Optom. Vis. Sci. Off. Publ. Am. Acad. Optom. 1995, 72, 52. [Google Scholar] [CrossRef] [Scilit] [PubMed]
- Vos, J.J. Disability glare-a state of the art report. CIE J. 1984, 3, 39–53. [Google Scholar]
- Vos, J.J. Age dependence of glare effects and their significance in terms of visual ergonomics. Light. Aging Vis. Health 1995, 11, 25. [Google Scholar]
- Vos, J.J. Reflections on glare. Light Res. Technol. 2003, 35, 163–175. [Google Scholar] [CrossRef] [Scilit]
- Vos, J.J. On the cause of disability glare and its dependence on glare angle, age and ocular pigmentation. Clin. Exp. Optom. 2003, 86, 363–370. [Google Scholar] [CrossRef] [Scilit] [PubMed]
- Yuan, R.; Yager, D.; Guethlein, M.; Oliver, G.; Kapoor, N.; Zhong, R. Controlling unwanted sources of threshold change in disability glare studies: A prototype apparatus and procedure. Optom. Vis. Sci. 1993, 70, 976. [Google Scholar] [PubMed]
- Charness, N.; Boot, W.R. Aging and Information Technology Use: Potential and Barriers. Curr. Dir. Psychol. Sci. 2009, 18, 253–258. [Google Scholar]
- Fozard, J.L.; Kearns, W.D. Impacts of technology interventions on communication in aging and aged persons. In Gerontechnology: Growing Old in a Technological Society; Lesnoff-Caravaglia, G., Ed.; Charles Thomas: Springfield, IL, USA, 2007; pp. 271–291. [Google Scholar]
- Owsley, C. Aging and Vision. Vis. Res. 2011, 51, 1610–1622. [Google Scholar] [CrossRef] [Scilit] [PubMed]
- Haegerstrom-Portnoy, G.; Schneck, M.E.; Brabyn, J.A. Seeing into old age: Vision function beyond acuity. Optom. Vis. Sci. 1999, 76, 141–158. [Google Scholar] [CrossRef] [Scilit] [PubMed]
- Boyce, P. Lighting for Driving: Roads, Vehicles, Signs, and Signals: Roads, Vehicles, Signs, and Signals; CRC Press: Boca Raton, FL, USA, 2024. [Google Scholar]
- Carlson, P.J. 2015 Can traffic signs be too bright on low-volume roads? Transp. Res. Rec. 2015, 2472, 101–108. [Google Scholar] [CrossRef] [Scilit]
- Dixon, K.; Park, E.S.; Brewer, M.; Wu, L.; Geedipally, S.; Srinivasan, R.; Rista, E. Guidelines for Treatments to Mitigate Opposite Direction Crashes; Transportation Research Board: Washington, DC, USA, 2022. [Google Scholar]
- Ni, R.; Bian, Z.; Guindon, A.; Andersen, G.J. 2012 Aging and the detection of imminent collisions under simulated fog conditions. Accid. Anal. Prev. 2012, 49, 525–531. [Google Scholar] [CrossRef] [Scilit] [PubMed]
- Ungewiss, J.; Schiefer, U.; Eichinger, P.; Wörner, M.; Crabb, D.P.; Jones, P.R. Does intraocular straylight predict night driving visual performance? Correlations between straylight levels and contrast sensitivity, halo size, and hazard recognition distance with and without glare. Front. Hum. Neurosci. 2022, 16, 910620. [Google Scholar] [CrossRef] [Scilit] [PubMed]
- Bailey, I.L.; Lovie, J. New design principles for visual acuity letter charts. Am. J. Optom. Physiol. Opt. 1976, 53, 740. [Google Scholar] [CrossRef] [Scilit]
- McMonnies, C.W.; Ho, A. Analysis of errors in letter acuity measurements. Clin. Exp. Optom. 1996, 79, 144–151. [Google Scholar] [CrossRef] [Scilit]
- BS 4274-1; Visual Acuity Test Types. Specification for Test Charts for Clinically Determining Distance Visual Acuity. British Standard Institution: London, UK, 1968.
- Elliott, D.B.; Bullimore, M.A. Assessing the reliability, discriminative ability, and validity of disability glare tests. Investig. Ophthalmol. Vis. Sci. 1993, 34, 108–119. [Google Scholar]
- Fisher, A.; Christie, A. A note on disability glare. Vis. Res. 1965, 5, 565–571. [Google Scholar] [CrossRef] [Scilit] [PubMed]
- IJspeert, J.; De Waard, P.; Van den Berg, T.; De Jong, P. The intraocular straylight function in 129 healthy volunteers; dependence on angle, age and pigmentation. Vis. Res. 1990, 30, 699–707. [Google Scholar] [CrossRef] [Scilit] [PubMed]
- LeClaire, J.; Nadler, M.; Weiss, S.; Miller, D. A new glare tester for clinical testing: Results comparing normal subjects and variously corrected aphakic patients. Arch. Ophthalmol. 1982, 100, 153. [Google Scholar] [PubMed]
- Longobardi, G. On the variability of the disability glare factor. Atti Fond. Giorgio Ronchi 1973, 28, 653. [Google Scholar]
- Norton, T.T.; Corlis, D.A.; Bailey, J.E. The Psychophysical Measurement of Visual Function; Richmond Products: Albuquerque, NM, USA, 2002. [Google Scholar]
- Regan, D.; Neima, D. Low-contrast letter charts as a test of visual function. Ophthalmology 1983, 90, 1192–1200. [Google Scholar] [CrossRef] [Scilit] [PubMed]
- Frazor, R.A.; Wilson, S.; Geisler, W.S. Local luminance and contrast in natural images. Vis. Res. 2006, 46, 1585–1598. [Google Scholar] [CrossRef] [Scilit] [PubMed]
- Aslam, T.M.; Haider, D.; Murray, I.J. Principles of disability glare measurement: An ophthalmological perspective. Acta Ophthalmol. Scand. 2007, 85, 354–360. [Google Scholar] [CrossRef] [Scilit] [PubMed]
- Howarth, P.A. Vision visual work. In Evaluation of Human Work, 3rd ed.; Wilson John, R., Wilson Nigel Corlett, E., Eds.; CRC Press: London, UK, 2005; pp. 664–692. [Google Scholar]

Disclaimer/Publisher’s Note: The statements, opinions and data contained in all publications are solely those of the individual author(s) and contributor(s) and not of MDPI and/or the editor(s). MDPI and/or the editor(s) disclaim responsibility for any injury to people or property resulting from any ideas, methods, instructions or products referred to in the content. |
© 2026 by the author. Licensee MDPI, Basel, Switzerland. This article is an open access article distributed under the terms and conditions of the Creative Commons Attribution (CC BY) license.