


Abstract
The quasi-two-dimensional van der Waals material GdTe3 serves as a prototypical platform for studying the intricate interactions between charge density waves and antiferromagnetic, high-mobility transport. In this work, we achieve the molecular beam epitaxial growth of monolayer GdTe3 thin film on epitaxial graphene grown on the Si-terminated surface of SiC(0001) substrates. Using in situ reflection high-energy electron diffraction and scanning tunneling microscopy, we confirm a flat, step-flow growth mode of the GdTe3 film. The X-ray photoelectron spectroscopy and low-temperature ARPES measurements reveal the electronic structure properties of GdTe3, especially the Fermi surface topology and energy band dispersions, resolving the presence of multiple rotationally twisted domains.
1. Introduction
Rare-earth tellurides (RTe3, R = La, Ce, Pr, Nd, Sm, Gd, Tb, Dy, Ho, Er, and Tm) have emerged as a fertile platform for investigating correlated electron phenomena, owing to their unique combination of charge density wave (CDW) order [1,2,3,4,5,6,7,8], high carrier mobility [9], and magnetism [10,11,12,13]. Among them, GdTe3 stands out as a prototypical quasi-two-dimensional van der Waals material that exhibits unidirectional CDW [14,15,16,17], antiferromagnetic ordering [18,19,20], and remarkably high electron mobility [21], as previously established by scanning tunneling spectroscopy and transport measurements. In contrast to the well-developed common tellurides for IR applications [22,23], this material exhibits a CDW transition below 380 K, and steep bands crossing the Fermi level have been reported throughout the CDW-ordered phase [24]. In addition, complex low-temperature phase transitions have also been documented in previous studies [25,26]. These coexisting properties render the electronic structure of GdTe3 a subject of considerable fundamental interest, with implications for both the understanding of low-dimensional physics and the exploration of potential device applications. Despite significant progress achieved by angle-resolved photoemission spectroscopy (ARPES) studies on cleaved bulk GdTe3—which have revealed phenomena such as Fermi surface nesting, band folding, and steep bands traversing the CDW gap [24,27]—systematic investigations on the temperature-dependent band structure evolution of the monolayer regime remain scarce. More critically, the electronic structure characterization of high-quality GdTe3 thin film grown by molecular beam epitaxy (MBE), an essential step toward thickness-controlled and substrate-engineered heterostructures, constitutes a notable gap in the literature. This deficiency largely stems from the growth challenges associated with monolayer telluride films and the complexity of disentangling substrate-induced effects.
In this work, we address these issues by achieving high-quality MBE growth of monolayer GdTe3 thin film on epitaxial graphene grown on the Si-terminated surface of a SiC(0001) (Gr/SiC) substrate. The combined reflection high-energy electron diffraction (RHEED), scanning tunneling microscopy (STM), and X-ray photoelectron spectroscopy (XPS) results clearly identify the surface lattice constants, step-flow growth mode and chemical states of the grown GdTe3 films. Further in situ low-temperature ARPES measurements clearly reveal the Fermi surface topology and band dispersions of monolayer GdTe3, unveiling the 0°, 30°, and 60° in-plane rotational domains and the characteristic gap opening feature of the grown GdTe3 film.
2. Materials and Methods
The preparation and characterization of GdTe3 thin film were performed in a combined MBE-STM-ARPES ultra-high vacuum system with the base pressure maintained at 2 × 10⁻¹⁰ mbar. The MBE and STM systems were manufactured by GC Innovation (Changzhou) Co., Ltd., Changzhou, China. The ARPES system was manufactured by Fermion Instruments (Shanghai Co., Ltd., Shanghai, China). The substrate for the growth of GdTe3 was a Gr/SiC substrate. Specifically, a 3 mm wide Si-polar 6H-SiC(0001) wafer (bought from Hefei Kejing Materials Technology Co., Ltd., Hefei, China) was roughly degassed and then subjected to 12–15 cycles of high-temperature flashing at 1450 °C to induce Si sublimation for preparing the monolayer graphene (Gr) termination layer. The epitaxial growth of GdTe3 thin film was achieved by co-evaporation of Gd at 1280 °C and Te at 340 °C, respectively, while the Gr/SiC substrate was kept at 210 °C during the growth, ensuring a flux ratio of approximately 1:30 and a stable growth rate of about 8 min per layer. The in situ RHEED was used for monitoring the growth process, and the in-plane lattice constant of monolayer GdTe3 relative to graphene was extracted from the diffraction stripes spacing of the RHEED patterns. After growth, the surface morphology was characterized by room-temperature STM. The in situ low-temperature (approximately 10 K) XPS and ARPES measurements were performed via a DA30 analyzer (Scienta Omicron AB, Uppsala, Sweden) to analyze the electronic structure. The monochromatic X-ray source for XPS was Al Kα (1486.7 eV) with a resolution limit of ~0.3 eV, while the UV source for ARPES was a monochromatized He lamp (He I, 21.218 eV), with a light spot size of ~1 mm2. RHEED and ARPES raw data were processed and graphically rendered in MATLAB R2025b. STM raw data were processed in WSxM 5.0. XPS spectra were fitted using Avantage v6.9.0 and plotted in Origin 2026.
3. Results and Discussion
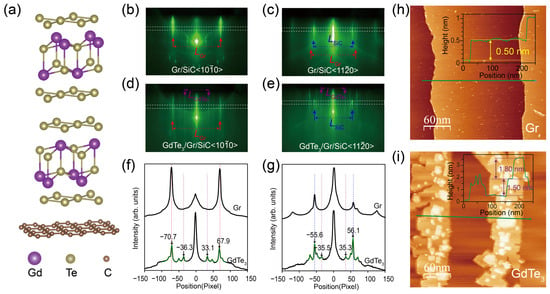
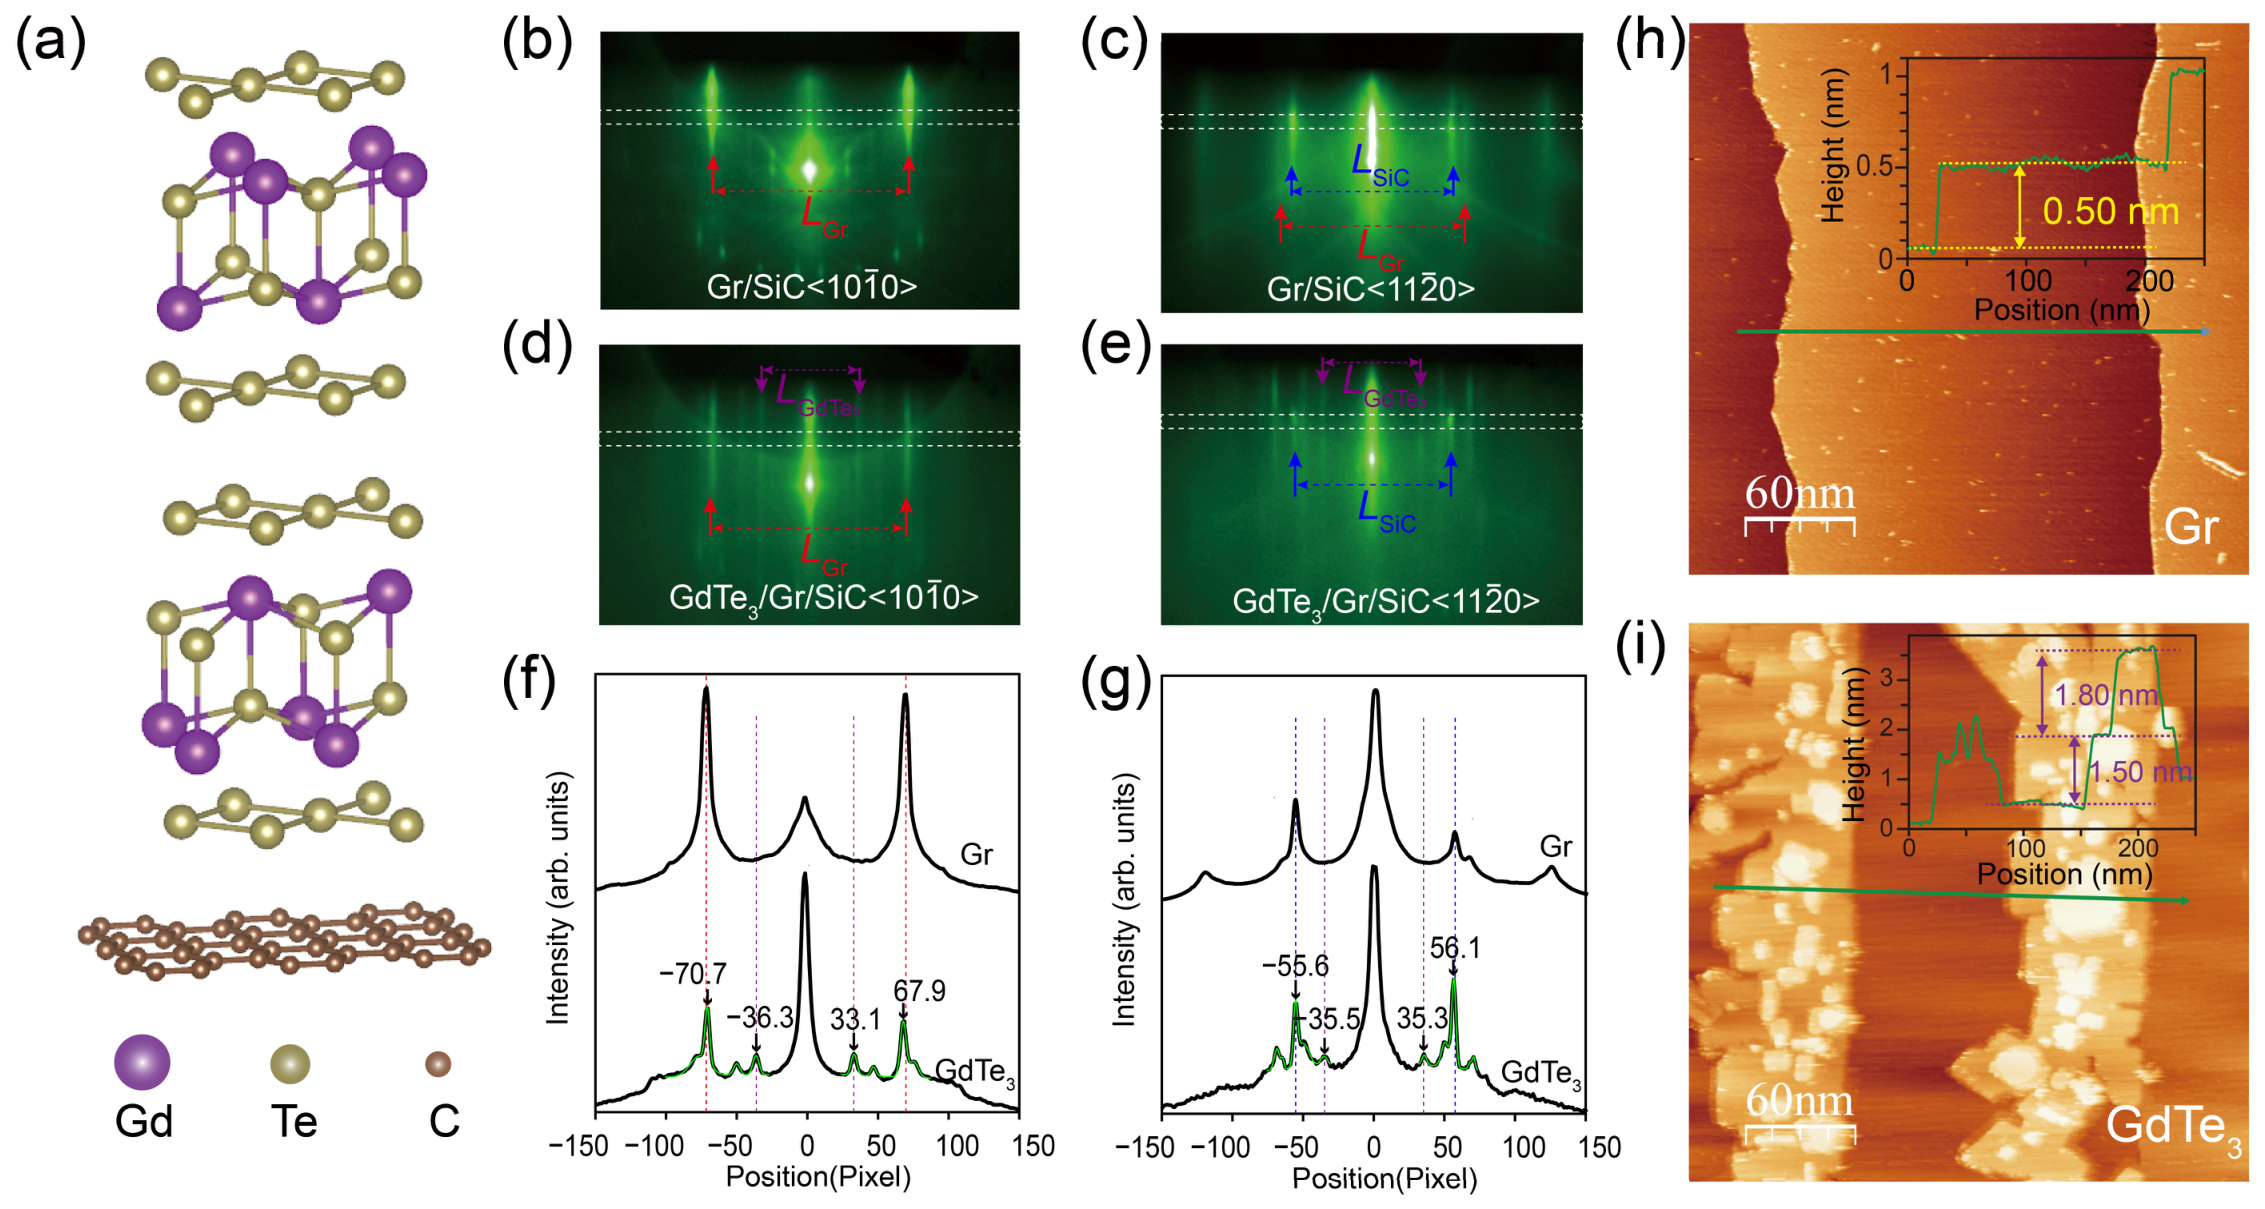
Figure 1a presents a schematic of the lattice structure of one unit cell of GdTe3 on a monolayer Gr. GdTe3 is a typical van der Waals material which possesses a quasi-two-dimensional layered orthorhombic structure, with one unit cell consisting of two double-corrugated Gd-Te slabs sandwiched between the Te square net monolayer sheets. Previous experiments reported the lattice constant of GdTe3 as a = 4.316 Å, b = 4.325 Å and c = 25.6 Å [21]. Figure 1b,c show the RHEED patterns of a Gr/SiC substrate prepared by the aforementioned method, which provides superior flatness and controllability under similar processing routines and fits our experimental requirements compared with similar processing routines [28]. Along the SiC direction [Figure 1b], only the (1 × 1) diffraction stripes of Gr can be observed, and these are indicated by the red arrows, while along the SiC direction [Figure 1c], the (1 × 1) diffraction stripes of SiC (indicated by the blue arrows) show much higher intensity than the (1 × 1) diffraction stripes of Gr (indicated by the red arrows) [29]. The diffraction stripes spacing (LGr and LSiC) can serve as references for determining the in-plane lattice constants. Figure 1d,e show the RHEED patterns of a grown GdTe3 film on the Gr/SiC substrate. In addition to the diffraction stripes of the Gr/SiC substrate, multiple sets of diffraction stripes appear after growth. The (1 × 1) diffraction stripes of grown GdTe3 are indicated by the purple arrows shown in Figure 1d,e. The other sets of diffraction stripes are from the rotational domains of GdTe3 film and will be discussed later in the ARPES results.
Figure 1.
(a) Schematic of the lattice structure of monolayer GdTe3 on epitaxial graphene/SiC(0001); (b,c) RHEED patterns of the Gr/SiC substrate along the SiC and directions, respectively; (d,e) RHEED patterns of the grown GdTe3 film along the SiC and directions, respectively; (f) intensity distribution curves along the white dashed rectangle regions shown in (b,d); (g) intensity distribution curves along the white dashed rectangle regions shown in (c,e). The green curves shown in (f,g) are the multiple Gaussian peaks fitting results for the raw data curves; (h,i) STM topographic images of (h) the Gr/SiC substrate and (i) the grown GdTe3 film, respectively. The insets in (h,i) are the height profiles along the green lines.
To quantitively determine diffraction stripes spacings, we plot the intensity distribution curves along the white dashed rectangle regions of RHEED patterns, as shown in Figure 1f,g. The diffraction peaks positions are determined by multiple Gaussian peaks fitting on the raw data curves, and the green curves shown in Figure 1f,g are the fitting results. Along the SiC direction, the (1 × 1) diffraction stripes of Gr (lattice constant of graphene aGr = 2.46 Å) serve as reference; then, the lattice constant of GdTe3 is calculated as , where aGr = 2.46 Å is the lattice constant of Gr. Along the SiC direction, only the (1 × 1) diffraction stripes of SiC can be observed in Figure 1g; therefore, the lattice constant of SiC aSiC = 3.08 Å serves as a reference; then, the lattice constant of GdTe3 is calculated as . These values are close to the reported bulk GdTe3 sample [21], and the small differences may due to the interfacial strain effect.
To further confirm the surface morphology of the epitaxial film, in situ STM characterizations were subsequently performed. In Figure 1h, the STM image of Gr/SiC substrate shows atomical flatness and regular terraces. In Figure 1i, the GdTe3 film grows along the step edges, exhibiting a step-flow growth mode. The height from the substrate to the first layer of GdTe3 is approximately 15.0 Å. Considering that the out-of-plane lattice constant of bulk GdTe3 is about 25.6 Å, we conclude that the first layer of GdTe3 consists of a half-unit-cell layer and a van der Waals gap of approximately 0.2 nm, namely the monolayer GdTe3. The relative height of the locally covered second-layer island is about 18.0 Å, higher than that of the first layer and a previous report [30]; therefore, we speculate the possible originations to be from an additional Te sheet on top of the second half-unit-cell layer or residual Te atoms formed under the Te-rich growth atmosphere, effectively forming a Gd2Te7 monolayer. This agrees well with prior reports; missing or extra Te atomic layers produce a ±0.3 nm height difference between the second and first layers [30]. This extra Te atomic layer of Gd2Te7 can also explain the peak-splitting behavior seen in the following XPS results.
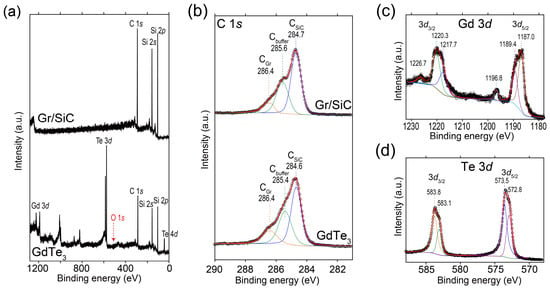
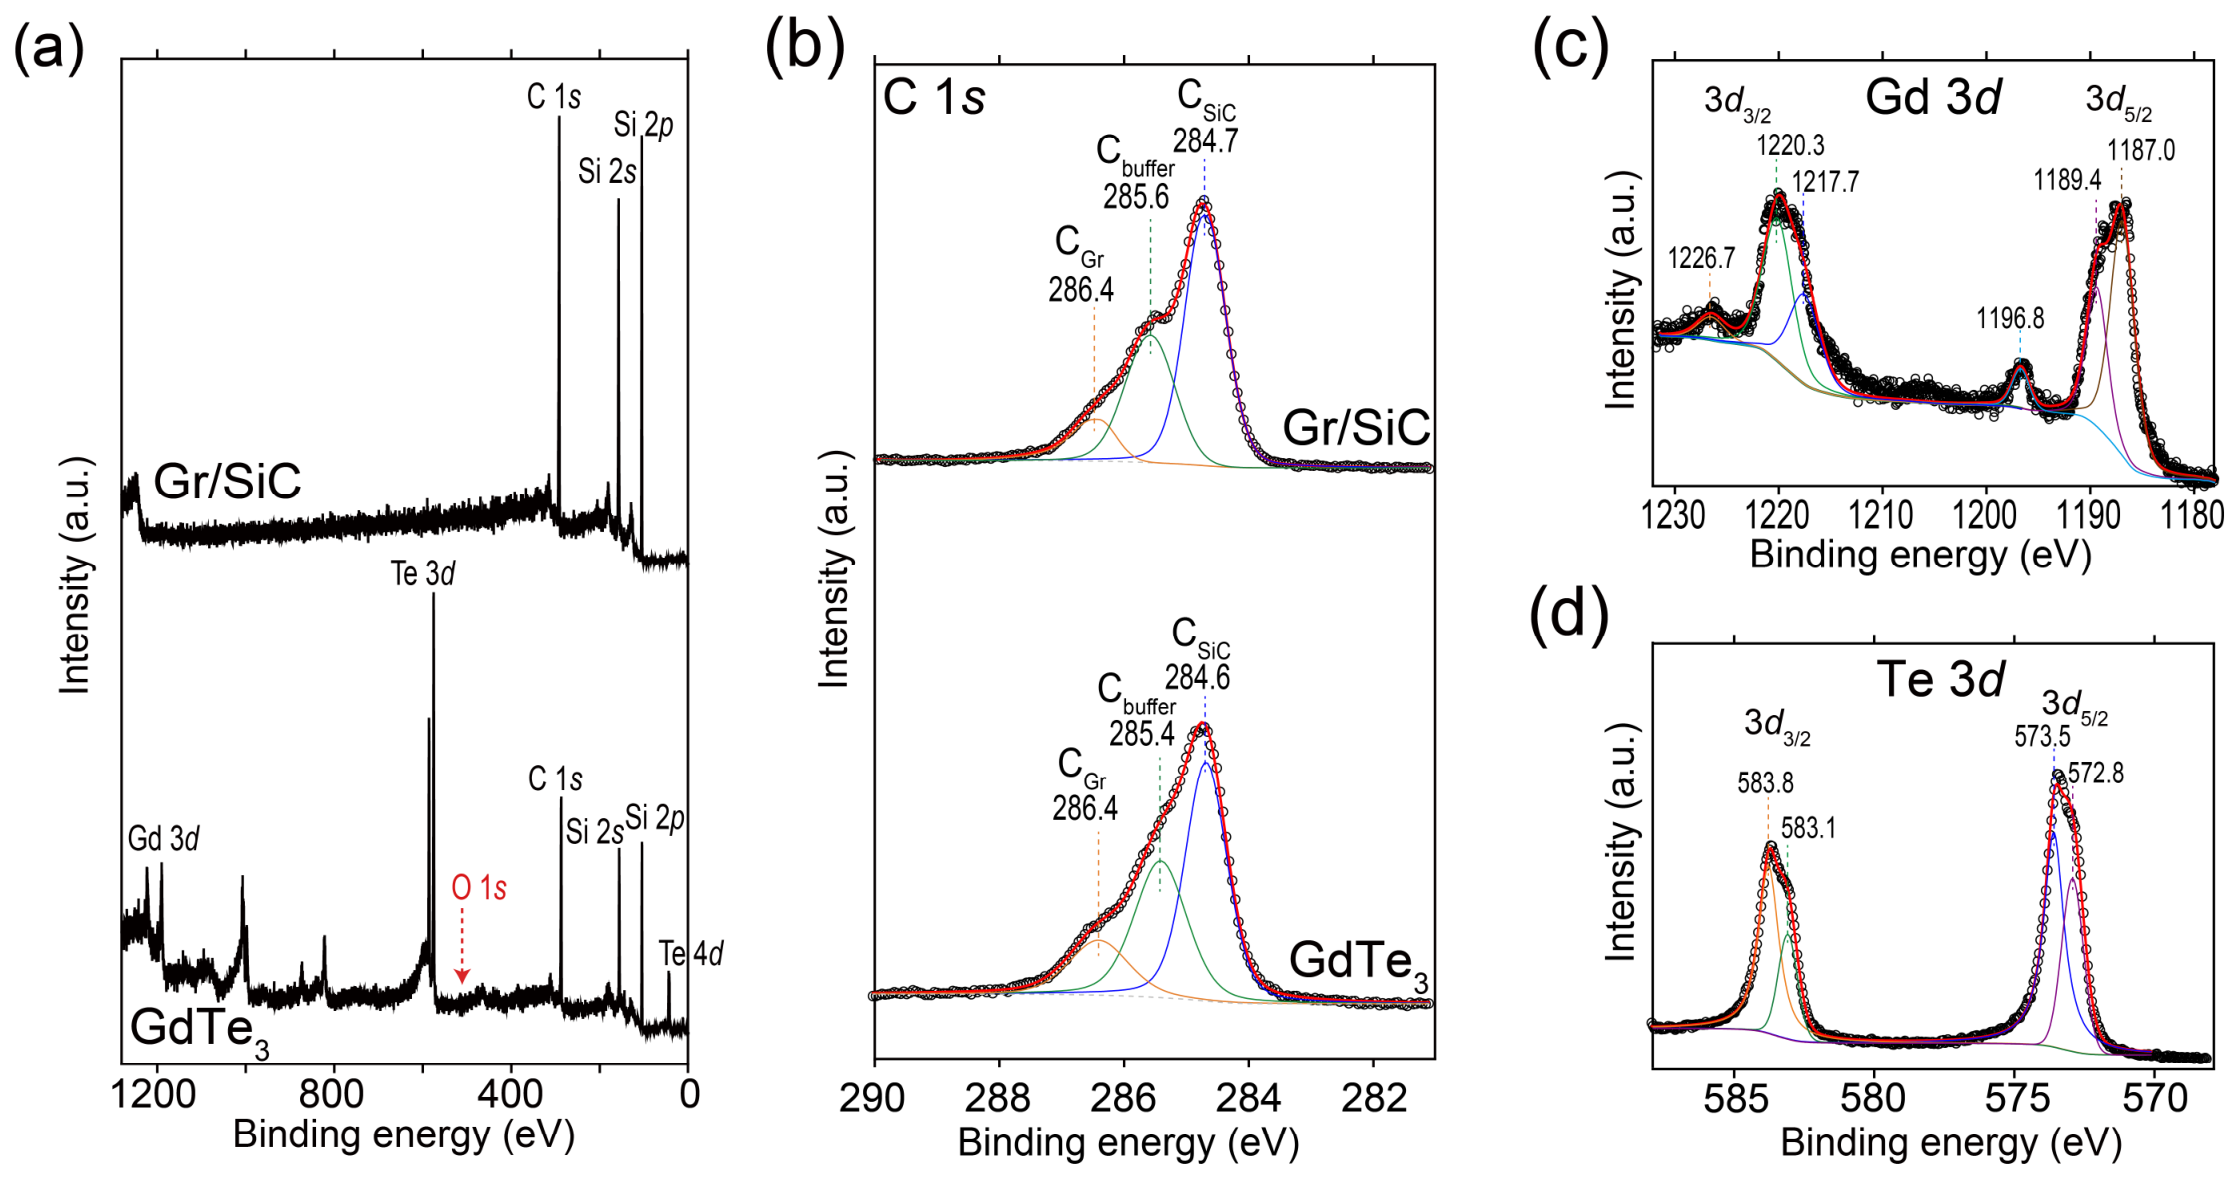
Subsequently, we used XPS to further confirm the chemical states of the grown GdTe3 film. The survey XPS spectra of both the Gr/SiC substrate and the GdTe3 film are shown in Figure 2a. No significant oxygen contamination peaks appear after growth, demonstrating the high surface cleanliness of the grown GdTe3 film. Figure 2b presents the C 1s core-level spectra of the Gr/SiC and the GdTe3 film; the peak near ~286.4 eV (CGr) is the characteristic signal from epitaxial graphene, the intermediate peak at ~285.6 eV (Cbuffer) originates from the interfacial buffer carbon layer, and the peak near ~284.7 eV (CSiC) is the carbon signal from bulk SiC substrate. The peak positions barely shift after the growth of GdTe3 (slight differences in CGr and CSiC are within the resolution limit of XPS setup), indicating that interfacial interactions such as charge transfer between the substrate and thin film are negligible. The Gd 3d and Te 3d core-level spectra of the GdTe3 film are shown in Figure 2c,d. We can observe double-peak structures in the Gd 3d core-level spectra due to the spin-orbit splitting of Gd 3d3/2 (1217.7 eV and 1220.3 eV) and Gd 3d5/2 (1187.0 eV and 1189.4 eV), accompanied by characteristic satellite peaks (1196.8 eV and 1226.7 eV) at approximately 9.8 eV above the main lines, which originate from the 4f7 multiple structure and are consistent with those observed in trivalent Gd compounds [31,32]. The double-peak structure of the Gd 3d3/2 and 3d5/2 peaks may also indicate the inequivalent local chemical environment for the Gd atoms between the topmost Gd2Te7 monolayer and the underlying GdTe3 layer. The characterized Te 3d double peaks are located at 583.1 eV, 583.8 eV (3d3/2) and 572.8 eV, 573.5 eV (3d5/2), and both spin-orbits components are deconvoluted into two peaks with an area ratio of approximately 1:2, corresponding to −2 oxidation state of the Gd-Te sheets and metallic zero-valent state of monolayer Te sheets in the GdTe3 lattice, respectively.
Figure 2.
(a) Survey XPS spectra of the Gr/SiC substrate and the GdTe3 film. The position expected for the O 1s peak is marked by the red arrow; (b) C 1s core-level spectra of the Gr/SiC and the GdTe3 film. The three fitted C 1s components correspond to epitaxial graphene (286.4 eV, CGr), the SiC interfacial buffer carbon layer (285.6 eV, Cbuffer), and bulk SiC substrate carbon (284.7 eV, CSiC), respectively; (c) Gd 3d core-level spectrum with spin-orbit split 3d5/2 and 3d5/2 peaks; (d) Te 3d core-level spectrum deconvoluted into Te2− (majority) and Te0 components for both 3d5/2 and 3d5/2 spin-orbit branches. The colored curves in (b–d) are the multiple Lorentzian peaks fitting results for the spectra.
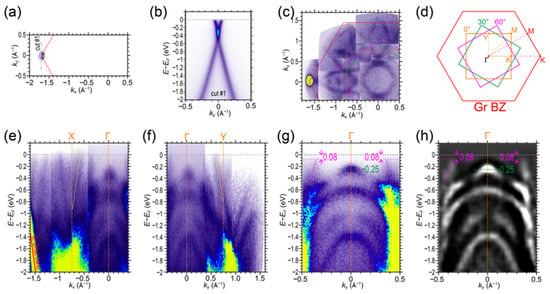
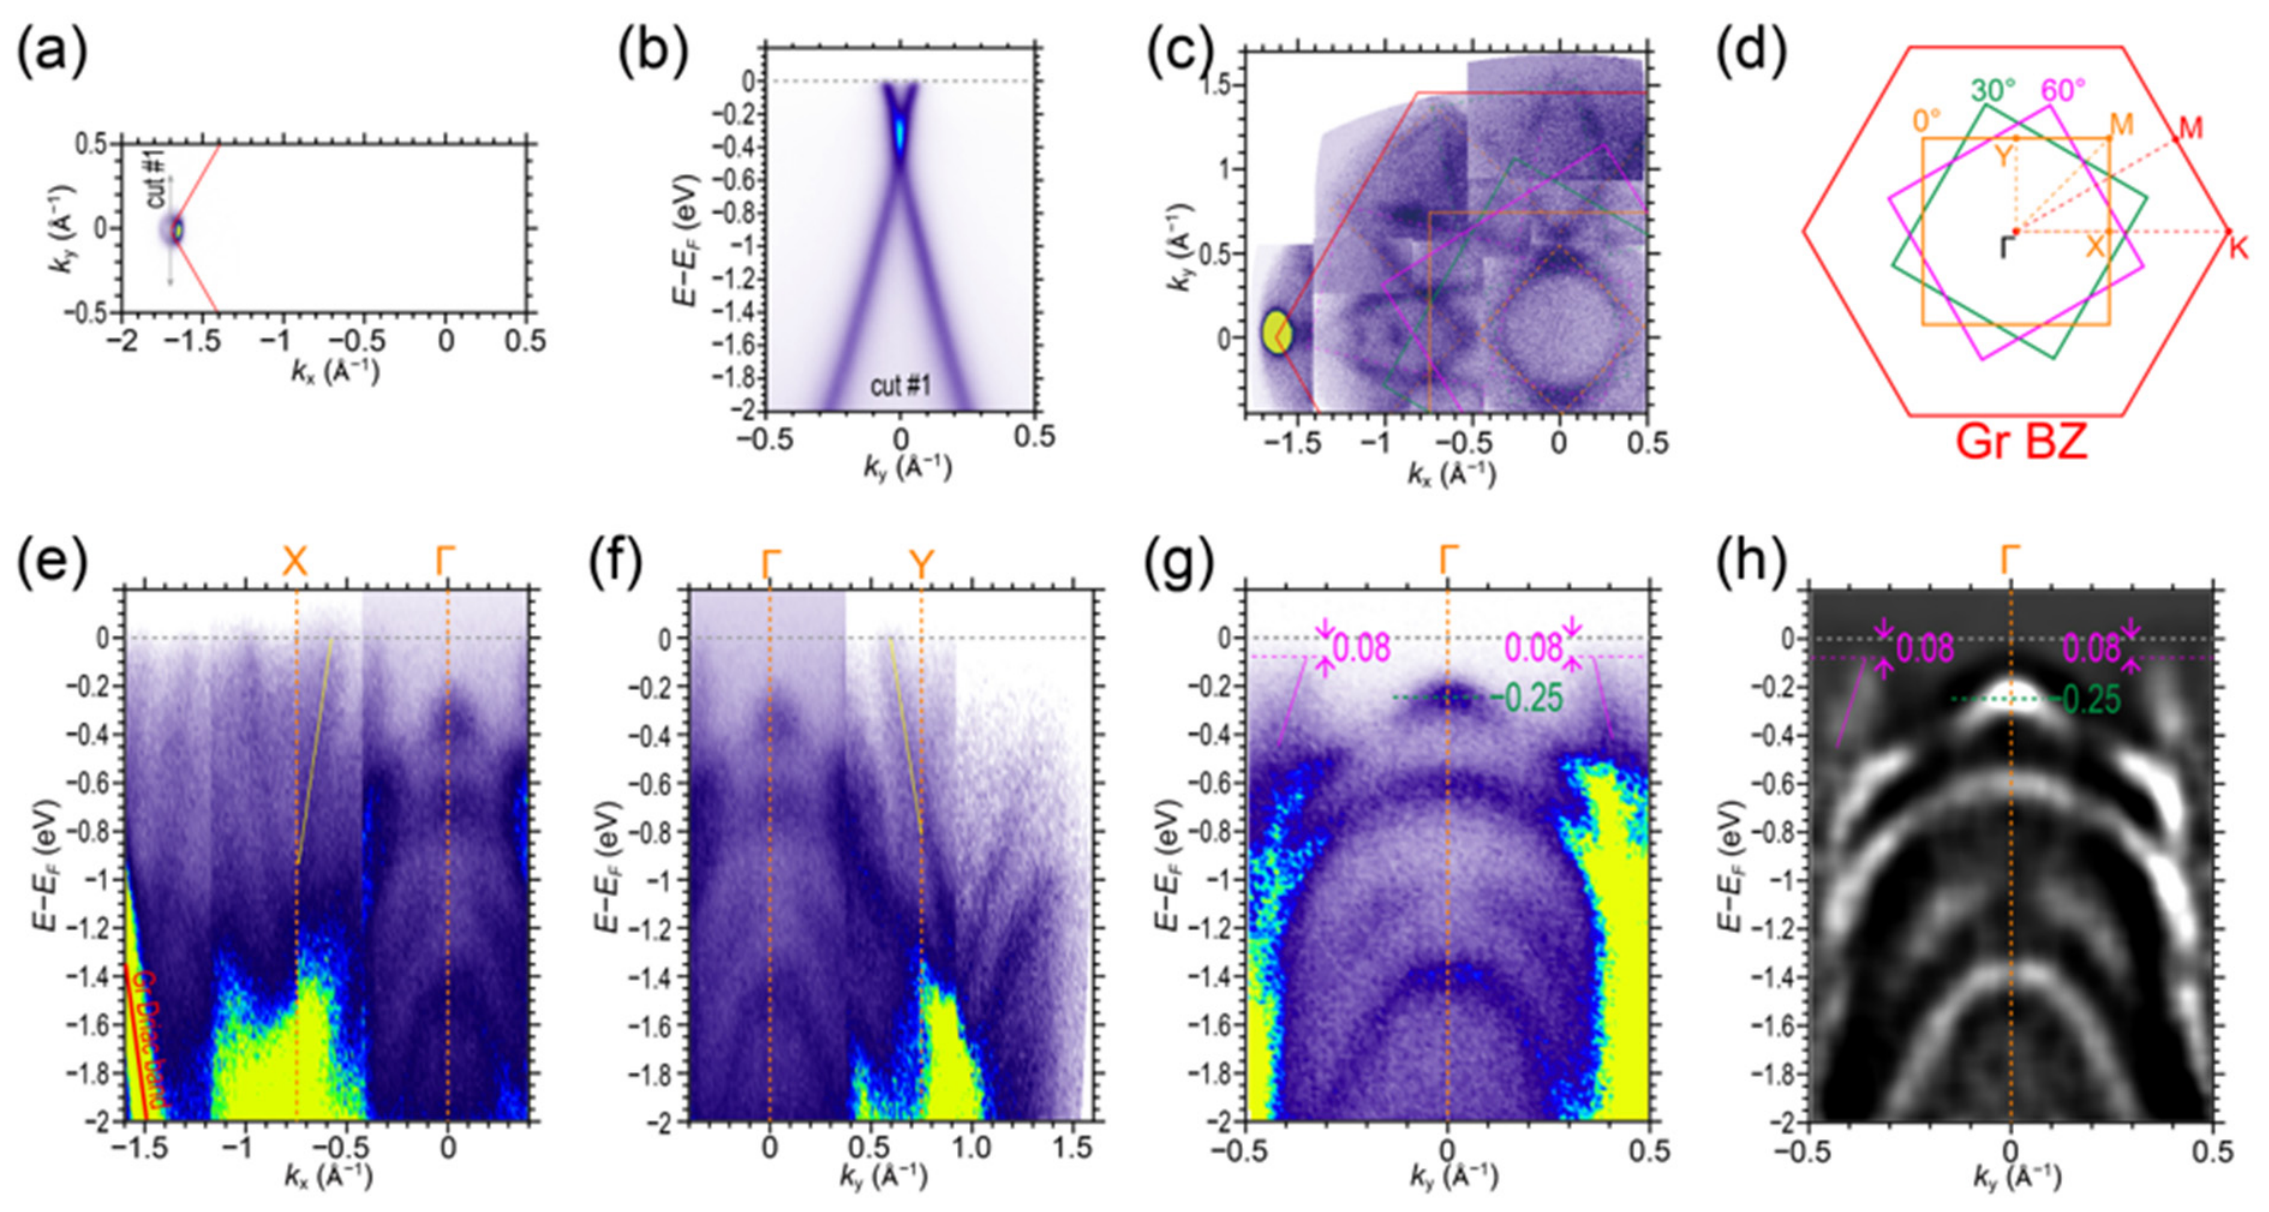
To further investigate the band structures of the GdTe3 film, we conducted ARPES characterizations on the GdTe3 film. Figure 3a,b present the Fermi surface mapping and the cut spectra along cut #1 direction of the Gr/SiC substrate, showing a characterized mono Dirac cone at the Brillouin zone (BZ) corner of Gr, indicating the high quality and the monolayer thickness of the prepared Gr substrate. Figure 3c displays the Fermi surface mapping of the GdTe3 film. With the positioning calibration of the Gr Dirac cone, the red hexagon in Figure 3c is the Gr BZ. Due to the lattice symmetry mismatch between the Gr and GdTe3, the Fermi surface structure of GdTe3 film shows a rotational feature, depicted by the colored dashed lines in Figure 3c. The rotational feature is schematically illustrated in Figure 3d. Compared to the hexagonal Gr BZ, the GdTe3 BZ shows three rotational angles of 0°, 30° and 60°, shown as the orange, green and magenta squares in Figure 3d. This rotational feature indicates the existence of rotational domains in the grown GdTe3 film, also resulting in the extra diffraction stripes in the RHEED patterns of the GdTe3 film [Figure 1d,e]. Similar multiple-rotational-domain phenomena have also been previously observed in cases on MBE-grown 1T’-WSe2 film on Gr [33].
Figure 3.
(a) Fermi surface mapping of the Gr/SiC substrate; the red lines are the BZ boundary of Gr; (b) cut spectra of the Gr/SiC substrate along the cut #1 direction shown in (a). (c) Fermi surface mapping of the GdTe3 film; (d) schematic of rotational BZs of GdTe3. The red hexagons shown in (c,d) are the BZ of Gr, while the orange, green and magenta squares are the 0°, 30° and 60° rotational BZs of GdTe3, respectively. The orange, green and magenta dashed lines in (c) depict the Fermi surface structures of corresponding 0°, 30° and 60° rotational GdTe3 domains; (e,f) cut spectra along the kx X-Γ (e) and ky Γ-Y (f) directions, respectively; (g,h) zoomed-in spectra around the Γ point (g) and the corresponding second-derivative spectra (h).
Figure 3e,f present the cut spectra along the kx (X-Γ) and ky (Γ-Y) directions. The red line shown in Figure 3e indicates the Dirac cone band from the Gr substrate. Within the GdTe3 BZ, a steep band depicted by the yellow lines in Figure 3e,f crosses the Fermi level at kx = −0.58 Å−1 and ky = 0.58 Å−1, which is the same as the reported bulk GdTe3 [24,27]. Figure 3g,h present the zoomed-in spectra and the corresponding second derivative around the Γ point. A hole-type valence band is at the Γ point, with a valence band maximum (VBM) of −0.25 eV (marked by the green dashed line). The band depicted by the magenta lines in Figure 3g,h shows a vanishing signal from −0.08 eV below the Fermi level at ky = ±0.36 Å−1, which is considered as the characterized CDW gap opening feature in GdTe3. Both the VBM and CDW gap size values agree with the reported bulk GdTe3 sample [27].
4. Conclusions
MBE growth of high-quality monolayer GdTe3 remains challenging due to severe Te desorption, Gd oxidation, and lattice mismatch, while previous studies mostly adopt exfoliated bulk crystals. Here, we have successfully achieved high-quality MBE growth of GdTe3 film on Gr/SiC substrates via Te-rich flux and ultra-high vacuum conditions, as confirmed by the RHEED patterns and STM characterization. A comprehensive investigation of the film’s chemical and electronic structures has been carried out using XPS and ARPES. Specifically, we provide detailed XPS spectra of the GdTe3 film, revealing the fine spectral features of the Gd core levels and the coexistence of two distinct Te valence states of the Gd-Te and Te sheets in the GdTe3 lattice, which bridges the lack of prior research and is crucial for a deeper understanding of its chemical state properties. We also identify the characterized valence band at the Γ point, the CDW gap opening feature at ky = ±0.36 Å−1, and the characterized steep band crossing the Fermi level, providing the high mobility carriers in GdTe3. All these band structure features agree with previous ARPES studies on the bulk GdTe3 samples.
Furthermore, in situ ARPES measurements reveal the Fermi surface from the 0°, 30°, and 60° rotational domains, which have been absent in previous studies on thin-film GdTe3 and are essential for a comprehensive understanding of its electronic behavior. However, the superposition of signals from these rotational domains complicates the unambiguous identification of the CDW Fermi surface nesting vectors and the corresponding band folding feature. Nevertheless, our study not only enriches the characterization database of rare-earth tellurides but also provides an experimental reference for growing epitaxial films on similar substrates, offering a pathway to tune and understand the effects of rotational domains in such heterostructures. Future work may focus on selecting substrates with closer lattice matching to the orthorhombic GdTe3 structure or employing buffer layers to enforce single-domain growth, which would enable a more definitive investigation of the CDW gap and its interplay with magnetism in the monolayer limit.
Author Contributions
Conceptualization, Y.Z. and X.Q.; methodology, Y.G. and X.Q.; software, Y.Z.; validation, Y.Z.; formal analysis, Y.G., X.Q. and Y.Z.; investigation, Y.G. and X.Q.; resources, Y.Z.; data curation, Y.Z. and Y.G.; writing—original draft preparation, Y.G.; writing—review and editing, Y.Z.; visualization, Y.G. and Y.Z.; supervision, Y.Z.; project administration, Y.Z.; funding acquisition, Y.Z. All authors have read and agreed to the published version of the manuscript.
Funding
This research was funded by the Natural Science Foundation of Jiangsu Province (Nos. BK20243011, BK20233001), and the Quantum Science and Technology-National Science and Technology Major Project (2021ZD0302803).
Institutional Review Board Statement
Not applicable.
Informed Consent Statement
Not applicable.
Data Availability Statement
Data is available upon request to corresponding author for avoiding the possible unauthorized usage of the raw data.
Conflicts of Interest
The authors declare no conflicts of interest.
Abbreviations
The following abbreviations are used in this manuscript:
| CDW | Charge density wave |
| ARPES | Angle-resolved photoemission spectroscopy |
| MBE | Molecular beam epitaxy |
| Gr/SiC | Epitaxial graphene grown on the Si-terminated surface of SiC(0001) |
| RHEED | Reflection high-energy electron diffraction |
| STM | Scanning tunneling microscopy |
| XPS | X-ray photoelectron spectroscopy |
| Gr | Graphene |
| BZ | Brillouin zone |
| VBM | Valence band maximum |
References
- DiMasi, E.; Aronson, M.C.; Mansfield, J.F.; Foran, B.; Lee, S. Chemical pressure and charge-density waves in rare-earth tritellurides. Phys. Rev. B 1995, 52, 14516. [Google Scholar] [CrossRef] [Scilit] [PubMed]
- Malliakas, C.D.; Kanatzidis, M.G. Divergence in the Behavior of the Charge Density Wave in RETe3 (RE = Rare-Earth Element) with Temperature and RE Element. J. Am. Chem. Soc. 2006, 128, 12612. [Google Scholar] [CrossRef] [Scilit] [PubMed]
- Ru, N.; Condron, C.L.; Margulis, G.Y.; Shin, K.Y.; Laverock, J.; Dugdale, S.B.; Toney, M.F.; Fisher, I.R. Effect of chemical pressure on the charge density wave transition in rare-earth tritellurides RTe3. Phys. Rev. B 2008, 77, 035114. [Google Scholar] [CrossRef] [Scilit]
- Laverock, J.; Dugdale, S.B.; Major, Z.; Alam, M.A.; Ru, N.; Fisher, I.R.; Santi, G.; Bruno, E. Fermi surface nesting and charge-density wave formation in rare-earth tritellurides. Phys. Rev. B 2005, 71, 085114. [Google Scholar] [CrossRef] [Scilit]
- Zhou, F.; Williams, J.; Sun, S.; Malliakas, C.D.; Kanatzidis, M.G.; Kemper, A.F.; Ruan, C.-Y. Nonequilibrium dynamics of spontaneous symmetry breaking into a hidden state of charge-density wave. Nat. Commun. 2021, 12, 566. [Google Scholar] [CrossRef] [Scilit] [PubMed]
- Malliakas, C.; Billinge, S.J.L.; Kim, H.J.; Kanatzidis, M.G. Square Nets of Tellurium: Rare-Earth Dependent Variation in the Charge-Density Wave of RETe3 (RE = Rare-Earth Element). J. Am. Chem. Soc. 2005, 127, 6510. [Google Scholar] [CrossRef] [Scilit] [PubMed]
- Brouet, V.; Yang, W.L.; Zhou, X.J.; Hussain, Z.; Moore, R.G.; He, R.; Lu, D.H.; Shen, Z.X.; Laverock, J.; Dugdale, S.B.; et al. Angle-resolved photoemission study of the evolution of band structure and charge density wave properties in RTe3 (R = Y, La, Ce, Sm, Gd, Tb, and Dy). Phys. Rev. B 2008, 77, 235104. [Google Scholar] [CrossRef] [Scilit]
- Wang, Y.; Petrides, I.; McNamara, G.; Hosen, M.M.; Lei, S.; Wu, Y.-C.; Hart, J.L.; Lv, H.; Yan, J.; Xiao, D.; et al. Axial Higgs mode detected by quantum pathway interference in RTe3. Nature 2022, 606, 896. [Google Scholar] [CrossRef] [Scilit] [PubMed]
- Yumigeta, K.; Qin, Y.; Li, H.; Blei, M.; Attarde, Y.; Kopas, C.; Tongay, S. Advances in Rare-Earth Tritelluride Quantum Materials: Structure, Properties, and Synthesis. Adv. Sci. 2021, 8, 2004762. [Google Scholar] [CrossRef] [Scilit] [PubMed]
- Ru, N.; Chu, J.H.; Fisher, I.R. Magnetic properties of the charge density wave compounds RTe3 (R = Y, La, Ce, Pr, Nd, Sm, Gd, Tb, Dy, Ho, Er, and Tm). Phys. Rev. B 2008, 78, 012410. [Google Scholar] [CrossRef] [Scilit]
- Higashihara, T.; Asama, R.; Nakamura, R.; Watanabe, M.; Tomoda, N.; Hasiweder, T.J.; Fujisawa, Y.; Okada, Y.; Iwasaki, T.; Watanabe, K.; et al. Magnetotransport properties in van der Waals RTe3 (R = La, Ce, Tb). Phys. Rev. B 2024, 109, 134404. [Google Scholar] [CrossRef] [Scilit]
- Deguchi, K.; Okada, T.; Chen, G.F.; Ban, S.; Aso, N.; Sato, N.K. Magnetic order of rare-earth tritelluride CeTe3 at low temperature. J. Phys. Conf. Ser. 2009, 150, 042023. [Google Scholar] [CrossRef] [Scilit]
- Iyeiri, Y.; Okumura, T.; Michioka, C.; Suzuki, K. Magnetic properties of rare-earth metal tritellurides RTe3 (R = Ce, Pr, Nd, Gd, Dy). Phys. Rev. B 2003, 67, 144417. [Google Scholar]
- Cao, Z.-Y.; Chen, H.; Qian, G.-J.; Shi, Y.-H.; Qi, Q.; Han, X.-H.; Yang, H.-T.; Gao, H.-J. Tuning the Charge Density Wave and Low-Energy Magnetic States with Nanoscale Strains in GdTe3. Chin. Phys. Lett. 2025, 42, 100702. [Google Scholar] [CrossRef] [Scilit]
- Chen, Y.; Wang, P.; Wu, M.; Ma, J.; Wen, S.; Wu, X.; Li, G.; Zhao, Y.; Wang, K.; Zhang, L.; et al. Raman spectra and dimensional effect on the charge density wave transition in GdTe3. Appl. Phys. Lett. 2019, 115, 151905. [Google Scholar] [CrossRef] [Scilit]
- Zocco, D.A.; Hamlin, J.J.; Grube, K.; Chu, J.H.; Kuo, H.H.; Fisher, I.R.; Maple, M.B. Pressure dependence of the charge-density-wave and superconducting states in GdTe3, TbTe3, and DyTe3. Phys. Rev. B 2015, 91, 205114. [Google Scholar]
- Lee, S.; Kim, E.; Bang, J.; Park, J.; Kim, C.; Wulferding, D.; Cho, D. Melting of Unidirectional Charge Density Waves across Twin Domain Boundaries in GdTe3. Nano Lett. 2023, 23, 11219. [Google Scholar] [CrossRef] [Scilit] [PubMed]
- Wan, Y.M.; Cheng, E.J.; Ma, H.Y.; Yang, X.F.; Hou, X.F.; Chen, X.J.; Zhang, X.; Xi, C.Y.; Zhong, Z.C.; Liu, J.P.; et al. Magnetic field induced Weyl state in the van der Waals—Type antiferromagnet GdTe3. Phys. Rev. B 2023, 108, 205132. [Google Scholar] [CrossRef] [Scilit]
- Raghavan, A.; Romanelli, M.; May-Mann, J.; Aishwarya, A.; Aggarwal, L.; Singh, A.G.; Bachmann, M.D.; Schoop, L.M.; Fradkin, E.; Fisher, I.R.; et al. Atomic-scale visualization of a cascade of magnetic orders in the layered antiferromagnet GdTe3. npj Quantum Mater. 2024, 9, 47. [Google Scholar] [CrossRef] [Scilit]
- Guo, Q.; Bao, D.; Zhao, L.J.; Ebisu, S. Novel magnetic behavior of antiferromagnetic GdTe3 induced by magnetic field. Phys. B Condens. Matter 2021, 617, 413153. [Google Scholar] [CrossRef] [Scilit]
- Lei, S.; Lin, J.; Jia, Y.; Gray, M.; Topp, A.; Farahi, G.; Klemenz, S.; Gao, T.; Rodolakis, F.; McChesney, J.L.; et al. High mobility in a van der Waals layered antiferromagnetic metal. Sci. Adv. 2020, 6, eaay6407. [Google Scholar] [CrossRef] [Scilit] [PubMed]
- Mochalov, L.; Nezhdanov, A.; Usanov, D.; Markelov, A.; Trushin, V.; Chidichimo, G.; De Filpo, G.; Gogova, D.; Mashin, A. A new method for synthesis of As-Te chalcogenide films. Superlattices Microstruct. 2017, 111, 173. [Google Scholar] [CrossRef] [Scilit]
- Tai, Y.; Zhang, X.; Li, J.; Zheng, Y.; Liu, G.; Zhang, J.; Zeng, G.; Yakubov, K.; Alla, C. Research on ultra-thin cadmium telluride heterojunction thin film solar cells. Renew. Sustain. Energy Rev. 2025, 207, 114996. [Google Scholar] [CrossRef] [Scilit]
- Liu, J.S.; Huan, S.C.; Liu, Z.H.; Liu, W.L.; Liu, Z.T.; Lu, X.L.; Huang, Z.; Jiang, Z.C.; Wang, X.; Yu, N.; et al. Electronic structure of the high-mobility two-dimensional antiferromagnetic metal GdTe3. Phys. Rev. Mater. 2020, 4, 114005. [Google Scholar] [CrossRef] [Scilit]
- Kopaczek, J.; Yumigeta, K.; Ibrahim, A.; Sayyad, M.Y.; Sinha, S.; Sailus, R.; Hays, P.; Moosavy, S.T.R.; Susarla, S.; Ataca, C.; et al. Experimental and Theoretical Studies of the Surface Oxidation Process of Rare-Earth Tritellurides. Adv. Electron. Mater. 2023, 9, 2201129. [Google Scholar] [CrossRef] [Scilit]
- Dutta, P.; Chandra, S.; Maria, I.; Debnath, K.; Rawat, D.; Soni, A.; Waghmare, U.V.; Biswas, K. Lattice Instability Induced Concerted Structural Distortion in Charged and van der Waals Layered GdTe3. Adv. Funct. Mater. 2024, 34, 2312663. [Google Scholar] [CrossRef] [Scilit]
- Regmi, S.; Bin Elius, I.; Sakhya, A.P.; Jeff, D.; Sprague, M.; Mondal, M.I.; Jarrett, D.; Valadez, N.; Agosto, A.; Romanova, T.; et al. Observation of momentum-dependent charge density wave gap in a layered antiferromagnet GdTe3. Sci. Rep. 2023, 13, 18618. [Google Scholar] [CrossRef] [Scilit] [PubMed]
- Yazdi, G.R.; Vasiliauskas, R.; Iakimov, T.; Zakharov, A.; Syväjärvi, M.; Yakimova, R. Growth of large area monolayer graphene on 3C-SiC and a comparison with other SiC polytypes. Carbon 2013, 57, 477. [Google Scholar] [CrossRef] [Scilit]
- Xu, X.; Meng, Q.; Tian, Q.; Zong, J.; Wang, K.; Zhang, Y. Selectable growth and electronic structures of two-dimensional layered InSe and In2Se3 films. Appl. Phys. Lett. 2024, 125, 113104. [Google Scholar] [CrossRef] [Scilit]
- Xu, Z.; Ji, S.-H.; Tang, L.; Wu, J.; Li, N.; Cai, X.; Chen, X. Molecular Beam Epitaxy Growth and Electronic Structures of Monolayer GdTe3. Chin. Phys. Lett. 2021, 38, 077102. [Google Scholar] [CrossRef] [Scilit]
- Dell’Angela, M.; Costantini, R.; Morgante, A.; Singh, A.; Fisher, I.R.; Panaccione, G.; Cilento, F. Time resolved core level spectroscopy reveals light-induced structural changes in GdTe3. Phys. B Condens. Matter 2025, 717, 417762. [Google Scholar] [CrossRef] [Scilit]
- Cai, X.; Lu, Z.; Xu, Z.; Meng, F.; Zhang, Q.; Gu, L.; Feng, J.; Ji, S.-H.; Li, N.; Chen, X. Growth of (111)-Orientated GdTe and TmTe Thin Films by van der Waals Molecular Beam Epitaxy. J. Phys. Chem. C 2021, 125, 15465. [Google Scholar] [CrossRef] [Scilit]
- Ugeda, M.M.; Pulkin, A.; Tang, S.; Ryu, H.; Wu, Q.; Zhang, Y.; Wong, D.; Pedramrazi, Z.; Martín-Recio, A.; Chen, Y.; et al. Observation of topologically protected states at crystalline phase boundaries in single-layer WSe2. Nat. Commun. 2018, 9, 3401. [Google Scholar] [CrossRef] [Scilit] [PubMed]
Disclaimer/Publisher’s Note: The statements, opinions and data contained in all publications are solely those of the individual author(s) and contributor(s) and not of MDPI and/or the editor(s). MDPI and/or the editor(s) disclaim responsibility for any injury to people or property resulting from any ideas, methods, instructions or products referred to in the content. |
© 2026 by the authors. Licensee MDPI, Basel, Switzerland. This article is an open access article distributed under the terms and conditions of the Creative Commons Attribution (CC BY) license.