


Abstract
Antimicrobial peptides (AMPs) are found widely as part of nonspecific immune defenses. One class of AMPs forms stable pores in membranes, including the two chemically distinct membranes found in the Gram-negative cell envelope. As the Gram-negative cell envelope is a significant barrier to drug development, some have hypothesized that these AMPs could be used clinically, either alone or in combination with other drugs that cannot cross the Gram-negative cell envelope on their own. Here, we use atomic force microscopy (AFM), fluorescence spectroscopy, and fluorescence microscopy to elucidate the biomechanical changes that occur in Escherichia coli treated with various concentrations of the pore-forming AMP magainin 2 (MAG2). We find that near the minimum inhibitory concentration, MAG2 induces a loss of cell stiffness and a decrease in cell height consistent with pore formation and cellular leakage. Surprisingly, treatment with high concentrations of MAG2 leads to cells becoming stiffer and increasing in height. We confirmed that MAG2 forms pores at high concentrations using a standard propidium iodide (PI) uptake assay, in which PI is added to a cell suspension and is detected only after pores form in the cell membrane. However, when PI was added after 30 min of treatment with high concentrations of MAG2, less PI fluorescence was observed than in the standard PI uptake assay, indicating that movement across the cell membrane was restricted at the end of our experiments. We also observed that the modulus of the cell envelope increased with increasing MAG2 concentration, consistent with greater packing of MAG2 into the cell envelope membranes. Finally, our AFM images in air revealed that cells formed blebs when treated with high concentrations of MAG2. These data suggest that MAG2 initially forms pores at high concentrations, but as membrane packing increases, movement across the cell envelope becomes restricted. Understanding the concentration-dependent restriction of movement across the cell envelope could be important if AMPs are to be used clinically.
1. Introduction
Antimicrobial peptides (AMPs) comprise a diverse group of proteins isolated from various organisms [1,2,3]. AMPs act as part of the innate immune system and serve as a first line of defense against invading pathogens. These peptides are often short, containing fewer than 50 amino acid residues, and many selectively interact with bacteria. Their selectivity likely stems from differences in membrane composition between eukaryotic and prokaryotic cells, specifically the charge of the lipid heads that comprise the cellular surface [2,4,5,6]. While most eukaryotic cells have zwitterionic phospholipids in their cell membranes, most bacteria have negatively charged phospholipids, which facilitate interaction with cationic AMPs [7]. The outer membrane of Gram-negative bacteria, composed of lipopolysaccharides in the outer leaflet and phospholipids on the inner leaflet, is also negatively charged, so AMPs interact with the outer and cell membranes of these bacteria.
Most AMPs are membrane-active, disrupting bacterial membranes, usually through pore formation [4,8]. Recently, there has been increased interest in whether AMPs might be a viable treatment for bacterial infections, as altering the membrane composition to resist them is more complicated than altering an enzyme to become antibiotic-resistant. Polymyxins, membrane-active lipoproteins, have emerged as treatments for bacterial infections for similar reasons [9,10,11]. However, polymyxins serve as a last resort antibiotic for internal treatment of drug-resistant infections due to their serious side effects. Thus, co-opting AMPs as a part of the immune system might be a gentler but equally effective approach. Furthermore, treatment with pore-forming AMPs could act synergistically with other antibiotics and potentially re-sensitize bacteria that have developed resistance [12,13,14]. Likewise, as the Gram-negative outer membrane remains a barrier to drug development [15,16], pore-forming AMPs that disrupt the outer membrane could be used in tandem with new antibiotics previously demonstrated to be ineffective against Gram-negative bacteria because the compound could not cross both membranes in the cell envelope [12].
One of the best-studied classes of AMPs is the cationic, membrane-active, α-helical peptides, a model of which is magainin 2 (MAG2) [17,18,19,20]. MAG2 was isolated from the skin of the frog Xenopus laevis when researchers sought to understand how these frogs prevented wound infections while living in an aquatic environment surrounded by bacteria [17]. Like many AMPs, MAG2 is initially unstructured in fluid. The interaction between the cationic amino acid residues and the anionic bacterial lipids causes the peptide to adopt an α-helical structure with the helical axis parallel to the membrane [4]. When MAG2 adopts this conformation, it forms a hydrophobic face, which is used as a wedge to push the lipid tails apart, reorienting the helix within the lipid bilayer, where it combines with other MAG2 helices to form a toroidal pore. In Gram-negative cells, this process happens first in the outer membrane, then again in the cell (inner) membrane [21]. Once the cell membrane becomes permeable, potassium ions are rapidly detected, indicating an efflux of cytoplasmic contents, which eventually leads to cell death [22].
Much of the previous work with MAG2, including ours, has been carried out at or near the minimum inhibitory concentration (MIC). We define the MIC as the lowest concentration of peptide that prevents visible growth in a broth dilution assay and have previously reported a value of 16.5 µM MAG2 for the Escherichia coli (E. coli) strain ZK1056 [23]. In this previous work, we used atomic force microscopy (AFM) to examine changes in bacterial biomechanics during MAG2 treatment at the MIC. AFM is a scanning probe technique that produces high-resolution, topographic images [24,25]. Once identified, the probe can also press on bacteria, providing information on changes in cell stiffness and cell envelope rigidity. In our previous work, we determined that cells lost turgor pressure during treatment with MAG2, but it was not concurrent with pore formation; cells maintained their turgor pressure for five to ten minutes after propidium iodide (PI) uptake assays indicated pore formation had occurred [23]. We also demonstrated that AFM force measurements could detect changes in cell envelope rigidity induced by MAG2 insertion, and that cells treated with MAG2 exhibited more adhesion events than untreated cells.
However, if AMPs are to be used in a clinical setting, they must be applied at many times the MIC to ensure a consistent dose sufficient to kill the pathogenic bacteria. What is the effect on the bacterium when the concentration of MAG2 applied is increased? This work describes the biomechanical changes that occur when E. coli is treated with a MAG2 concentration well above the MIC. Unexpectedly, the cells’ stiffness and height increased when 125 or 500 µM MAG2 was applied, despite PI indicating that pores had formed. However, when PI was added after MAG2, far less PI was able to cross the cell membrane than when PI was added before MAG2 addition, indicating that high concentrations of MAG2 could restrict movement across the cell membrane, posing a challenge if AMPs are to be used as a gateway for other molecules. The E. coli cell envelope became more rigid during treatment, and blebs were observed, possibly due to increased membrane packing caused by MAG2. This work provides insight into how AMPs might affect different biomechanical responses in bacteria at higher concentrations.
2. Experimental Section
2.1. Preparation of Magainin 2
Genscript (Piscataway, NJ, USA) synthesized Magainin 2 (GIGKWLHSAKKFGKAFVGEIMNS, MAG2) containing an F5W mutation for more straightforward quantitation [26], with >95% purity. The peptide came lyophilized with approximately 10 mg per tube, which was rehydrated in distilled water to create a concentrated stock solution. The stock concentration was determined by measuring the absorbance at 280 nm, and the peptide was diluted in the appropriate solution for downstream experiments. Previous work has shown that this mutation does not affect the peptide’s properties [26,27]. Circular Dichroism (CD) spectra were consistent with an α-helical folding pattern, and the ratio of [θ]220/[θ]209 was identical to the parent MAG2. Both versions of MAG2 had equivalent ability to release calcein dye from egg phosphatidyl glycerol large unilamellar vesicles (LUVs).
2.2. Preparation of E. coli Coated Surfaces
Coverslips with E. coli ZK1056, a K12-derived strain, were prepared as described previously [23]. Briefly, glass coverslips were cleaned in a Herrick plasma cleaner on medium power for 3 min. Once clean, a drop of Corning Cell-Tak (Corning Life Sciences, Bedford, MA, USA, diluted 1:5 with 5% acetic acid) was applied to the center of the coverslip and allowed to dry overnight. In the morning, the coverslips were washed copiously in water and allowed to dry at room temperature. Bacteria were collected from a log phase culture and washed in HEPES-metals (HM) buffer (10 mM HEPES buffer, 0.1 mM MgCl2, and 1 mM CaCl2, pH 7.6, calculated osmolality 23.3 mOsm/kg). Approximately 107 cells were deposited onto the dried Cell-Tak and allowed to adhere for about 2 h at room temperature, after which nonadherent cells were rinsed off with buffer. Care was taken to ensure the cells did not dry on the coverslip.
2.3. Images and Force Curves Obtained by Atomic Force Microscopy
Images of bacteria in HM buffer were obtained in intermittent contact mode using an Asylum Research/Oxford Instruments (Santa Barbara, CA, USA) MFP-3D Atomic Force Microscope (AFM) equipped with silicon nitride tips with a nominal spring constant of 0.32 N/m [23,28]. Scans were obtained at a 20 × 20 µm scale before selecting a smaller region containing several bacteria to optimize imaging parameters and select cells for force analysis. Cells remained in buffer for the entire experiment. Cell heights were determined at the center of the longitudinal axis of cells captured in 20 × 20 µm scans from at least three experiments.
Once cells had been identified for force measurements, a spot was selected in the center of the cell, and a single force curve was obtained in which the tip moved toward the bacterium, contacted the surface, and pressed into the cell until a force of 2.5 nN was registered, before retracting back to the starting position. If the initial force curve appeared acceptable (i.e., it did not contain any jagged transitions that might reflect the tip slipping off the cell), 5 more force curves were obtained at the same spot. These measurements were labeled as time 0.
MAG2 resuspended in HM was applied after the cells had been identified and initial force curves obtained. Every 5 min after the AMP was added, force curves were obtained on the cells, collecting 5–6 force curves per cell. Each cell is considered a biological replicate, and each force curve is a technical replicate. However, we included cells grown in at least three separate log-phase cultures in our analysis. After 30 min, a final image was captured to ensure that the cells had not shifted or become damaged due to force acquisition. A total of 26 untreated cells, 31 cells treated with 25 µM MAG2, 40 cells treated with 125 µM MAG2, and 46 cells treated with 500 µM MAG2 were subjected to force data collection.
To determine the cell’s stiffness (cellular spring constant, kcell), the cell and the cantilever are modeled as two linear springs pushing against each other, as given in Equation (1) [29]. The actual spring constant of the cantilever (kcantilever) was determined for each cantilever using the thermal method [30], while the effective spring constant (keffective) was determined from the slope of the linear compression using the MFP-3D software (version 18) in IgorPro (version 6). The kcell is directly related to the cellular turgor pressure [28,31].
The rigidity of the cell envelope was determined by fitting the nonlinear transition with the MFP-3D software in Igor Pro using the Hertz model to determine Young’s Modulus. The tip radius was 10 nm, the half angle was 36°, and Poisson’s ratio for the E. coli was set to 0.5.
2.4. Propidium Iodide Uptake Assay
Propidium iodide (PI) was used to assess the integrity of the cell membrane before and after treatment with MAG2, following procedures described in Overton et al. [23]. E. coli were grown to mid-log phase, at which time they were collected by centrifugation and washed with 10 mL of 10 mM sodium phosphate buffer, pH 7.4 (calculated osmolality 30 mOsm/kg). After washing, the cells were resuspended in enough buffer to produce an OD600 of 0.5.
In a standard PI uptake assay, 3 mL of cell suspension were added to a quartz cuvette and mixed with PI to a final concentration of 20 µg/mL. The cuvette was placed in a Duetta spectrophotometer (Horiba Scientific Instruments, Piscataway, NJ, USA), and the instrument was set to measure fluorescence (λex = 535/5 nm, λem = 617/5 nm) every 5 s once the experiment began. The sample was allowed to equilibrate for 2–4 min after readings started, allowing PI to diffuse into the periplasmic space, where it remains until the cell membrane is disrupted [32]. The run was paused once the system had finished equilibrating, and MAG2 was added to achieve the appropriate concentration. The cuvette was inverted to mix the contents and was returned to the instrument in under 10 s. Fluorescence was monitored for at least 15 min after the addition of MAG2.
Once the run was completed, the fluorescence intensity immediately preceding the addition of MAG2 was identified. That intensity was subtracted from all subsequent measurements to account for any cells with non-specific membrane permeabilization at the beginning of the experiment. The average intensity at a given time was determined from at least three separate experiments for each MAG2 concentration. The standard error was also calculated for each time point.
In a delayed PI uptake assay, the experiment was set up as described above; however, PI was not added until 30 min after MAG2 addition (Supplemental Figure S1). 250 µL of cell suspension was pipetted into six wells of an untreated polystyrene 48-well plate. Three wells were used for standard PI uptake, and three were used for matched samples of a delayed PI uptake. By performing these experiments in tandem, the only difference between the matched wells should be the addition of PI, thereby increasing our confidence in any comparison between the two samples.
The plate was placed in a BioTek Synergy HTX fluorescence plate reader (BioTek Instruments, Winooski, VT, USA) with excitation and emission filters of 540/35 nm and 590/20 nm, respectively. PI was added to a final concentration of 20 µg/mL in three of the six wells. The plate was allowed to equilibrate for 4 min, and an initial fluorescence intensity reading was obtained. The appropriate concentration of AMP was added to all 6 wells containing the cell suspension, and the plate was allowed to sit for 30 min at room temperature. Next, PI was added to the remaining three wells treated with AMP to a final concentration of 20 µg/mL. The plate was allowed to equilibrate for a further 4 min before the PI fluorescence was recorded again. The initial fluorescence intensity was used to account for any permeabilized cells present before the addition of the AMP. The delayed PI uptake intensity was compared to the standard PI uptake intensity, and the percentage of fluorescence was calculated for at least three trials per condition. The experiment was repeated three times using bacteria from different log cultures.
2.5. Fluorescence Microscopy
Cell-coated coverslips prepared as described above for AFM experiments were treated with the appropriate concentration of MAG2 for 30 min, then gently rinsed with HM buffer. The Invitrogen BacLight live/dead bacterial viability kit (Eugene, OR, USA), containing PI and the membrane-permeable dye SYTO 9, was used according to the manufacturer’s instructions and previously reported protocols [23]. After staining, the cells were imaged using an Olympus ix70 (Olympus, Center Valley, PA, USA) inverted fluorescence microscope with an Olympus Plan C N 100X oil objective (numerical aperture of 1.25). Images of cells stained with SYTO 9 were captured using an Olympus ET-FITC filter, while cells stained with PI were imaged with an Olympus ET-TRITC filter. Images were imported to ImageJ (version 1.54p), where they were overlaid, and a scale bar was added.
3. Results and Discussion
3.1. Changes in Cell Stiffness Are Dependent on the Concentration of MAG2
Magainin 2 (MAG2) is a pore-forming, cationic, alpha-helical peptide. We previously demonstrated that treating E. coli ZK1056 with MAG2 at or near the minimum inhibitory concentration (MIC, 16.5 µM) results in rapid cell membrane permeabilization and eventual loss of turgor pressure [23]. However, MAG2 would need to be applied at higher concentrations if it is to be used in a clinical setting, either alone or as a vehicle to allow other drugs access to the cell, and we are interested in how applying high concentrations might change the bacterial biophysics. While high concentrations of MAG2 can damage eukaryotic cells, our experiments with human embryonic kidney 293 (HEK 293) cells showed excessive permeabilization only at the highest concentration (Supplemental Figure S2), and it was highly selective for bacteria compared to HEK 293 cells (Supplemental Figure S3).
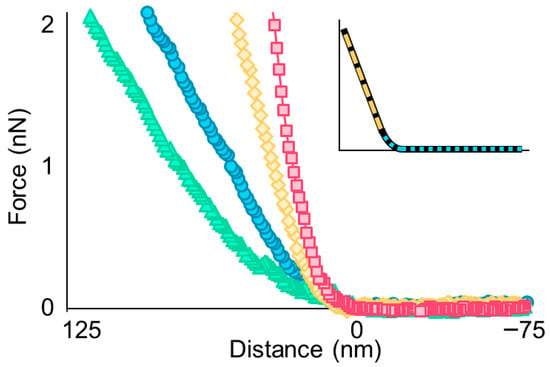
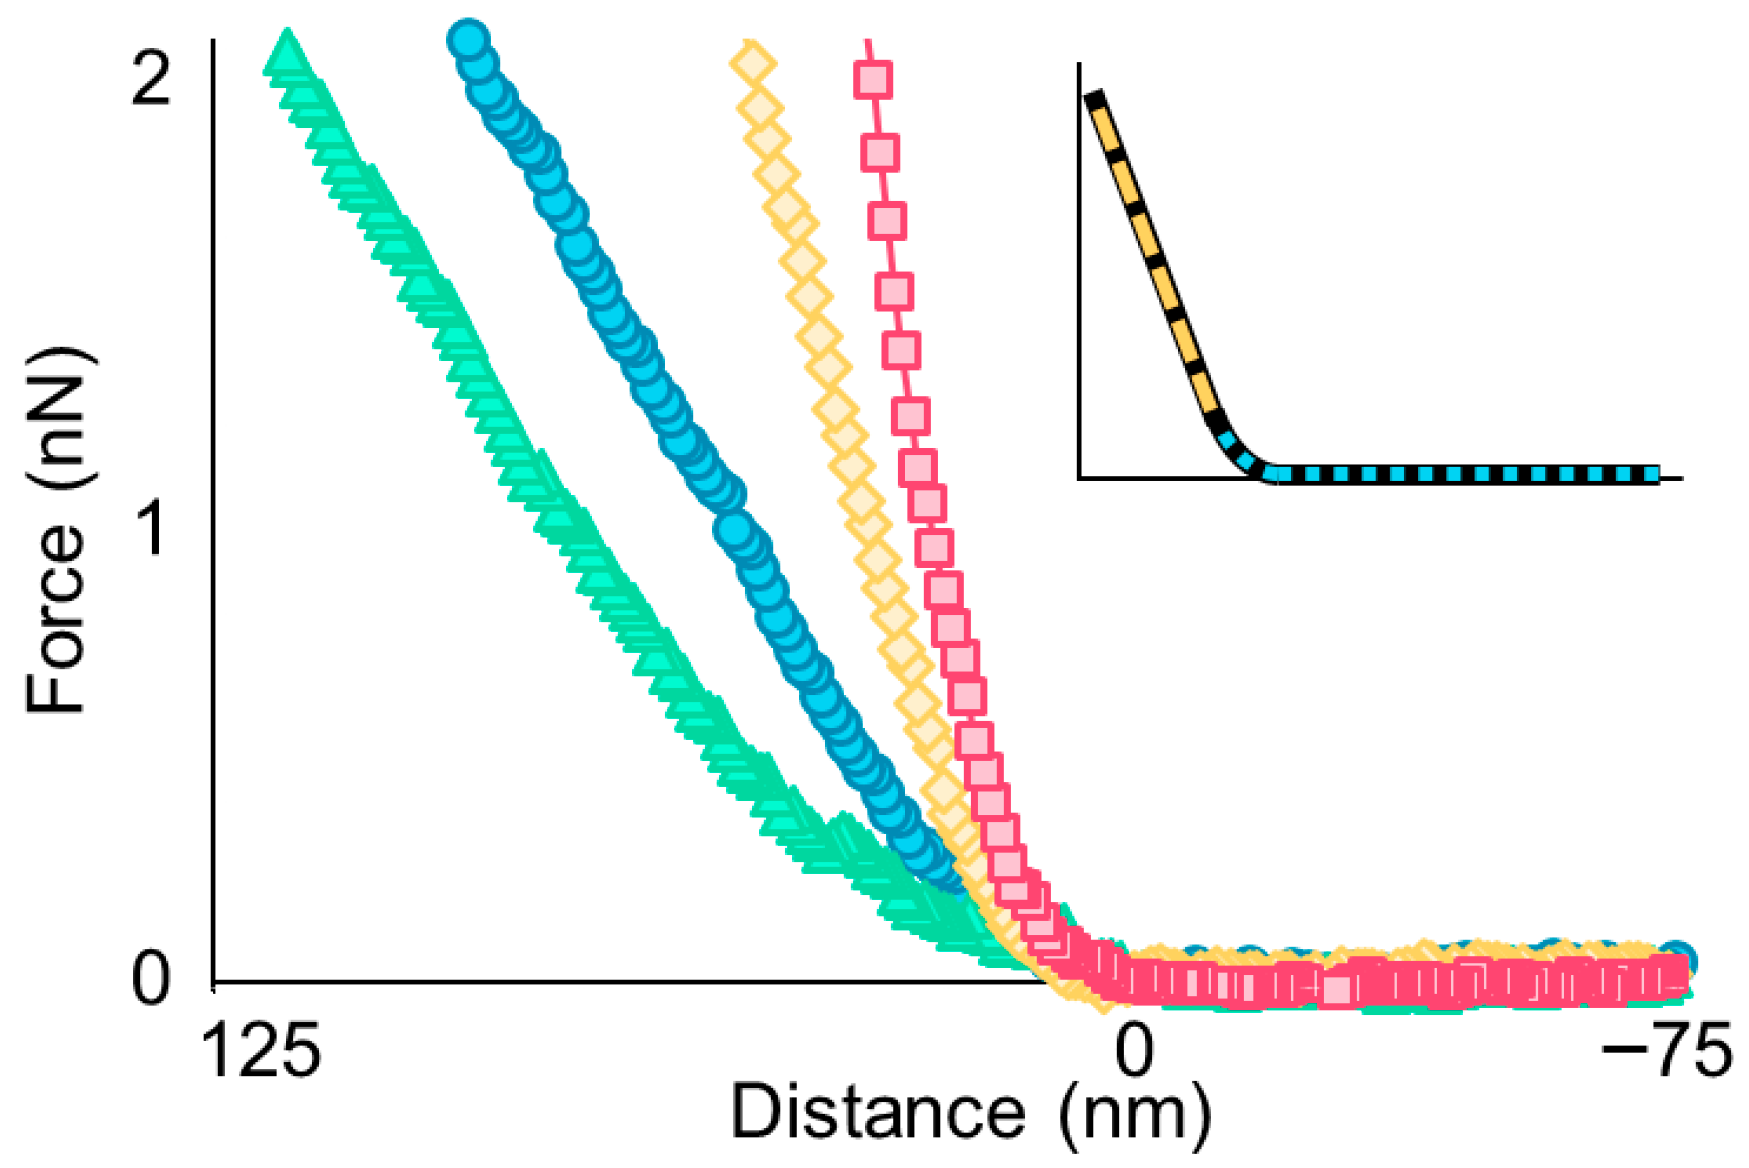
To understand how treatment with high concentrations of MAG2 affected the E. coli biomechanics, we used atomic force microscopy (AFM) to collect force-distance measurements, both extension and retraction curves, during treatment [25]. Representative extension curves are shown in Figure 1. The indentation depth varied depending on treatment. In untreated cells, the set force of 2.5 nN produced an indentation of approximately 75–100 nm, while cells treated with 25 µM MAG2 had an increased indentation (~120–200 nm). Cells treated with higher concentrations of MAG2 had shallower indentation depths (~30–60 nm for cells treated with 125 µM MAG2 and ~15–40 nm for cells treated with 500 µM MAG2). Importantly, images taken after force acquisition revealed that cells remained intact during the process.
Figure 1.
Representative force-distance extension curves obtained on untreated cells (blue circles) and cells treated with 25 µM MAG2 (green triangles), 125 µM MAG2 (yellow diamonds), or 500 µM MAG2 (pink squares) at 30 min. The inset highlights the regions examined to determine the cellular spring constant (kcell), marked with a yellow, long-dashed line, and the region fit with the Hertz model to determine Young’s modulus, marked with a blue, short-dashed line.
The extension curve provides two pieces of information: the cellular spring constant and Young’s modulus. As the tip compresses the cell, it produces an initial nonlinear deformation (Figure 1, inset). This region is fit using the Hertz model to generate Young’s modulus, which reflects the rigidity of the cell envelope [33]. While not a perfect model for Gram-negative bacteria, our results focus on changes over time, so any errors in the model are applied equally across the data. The nonlinear regime is followed by the linear compression, modeled as the compression of two springs (Figure 1, inset). The slope of the linear compression, as shown in Equation (1), is used in conjunction with the cantilever’s spring constant to calculate the cellular spring constant, which directly relates to the cell’s turgor pressure [28,31,34]. The average kcell at time 0 was nearly identical across groups (Supplemental Table S1) and consistent with other studies using this strain of E. coli [35] and other Gram-negative bacteria [36,37,38,39,40].
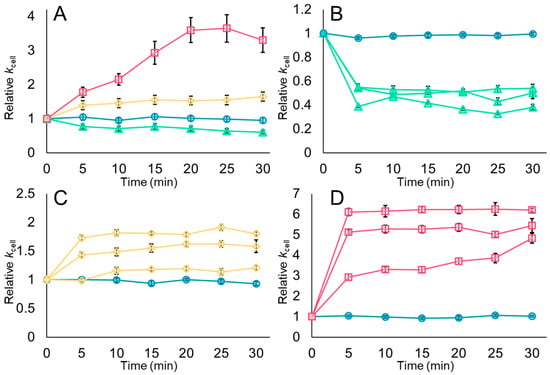
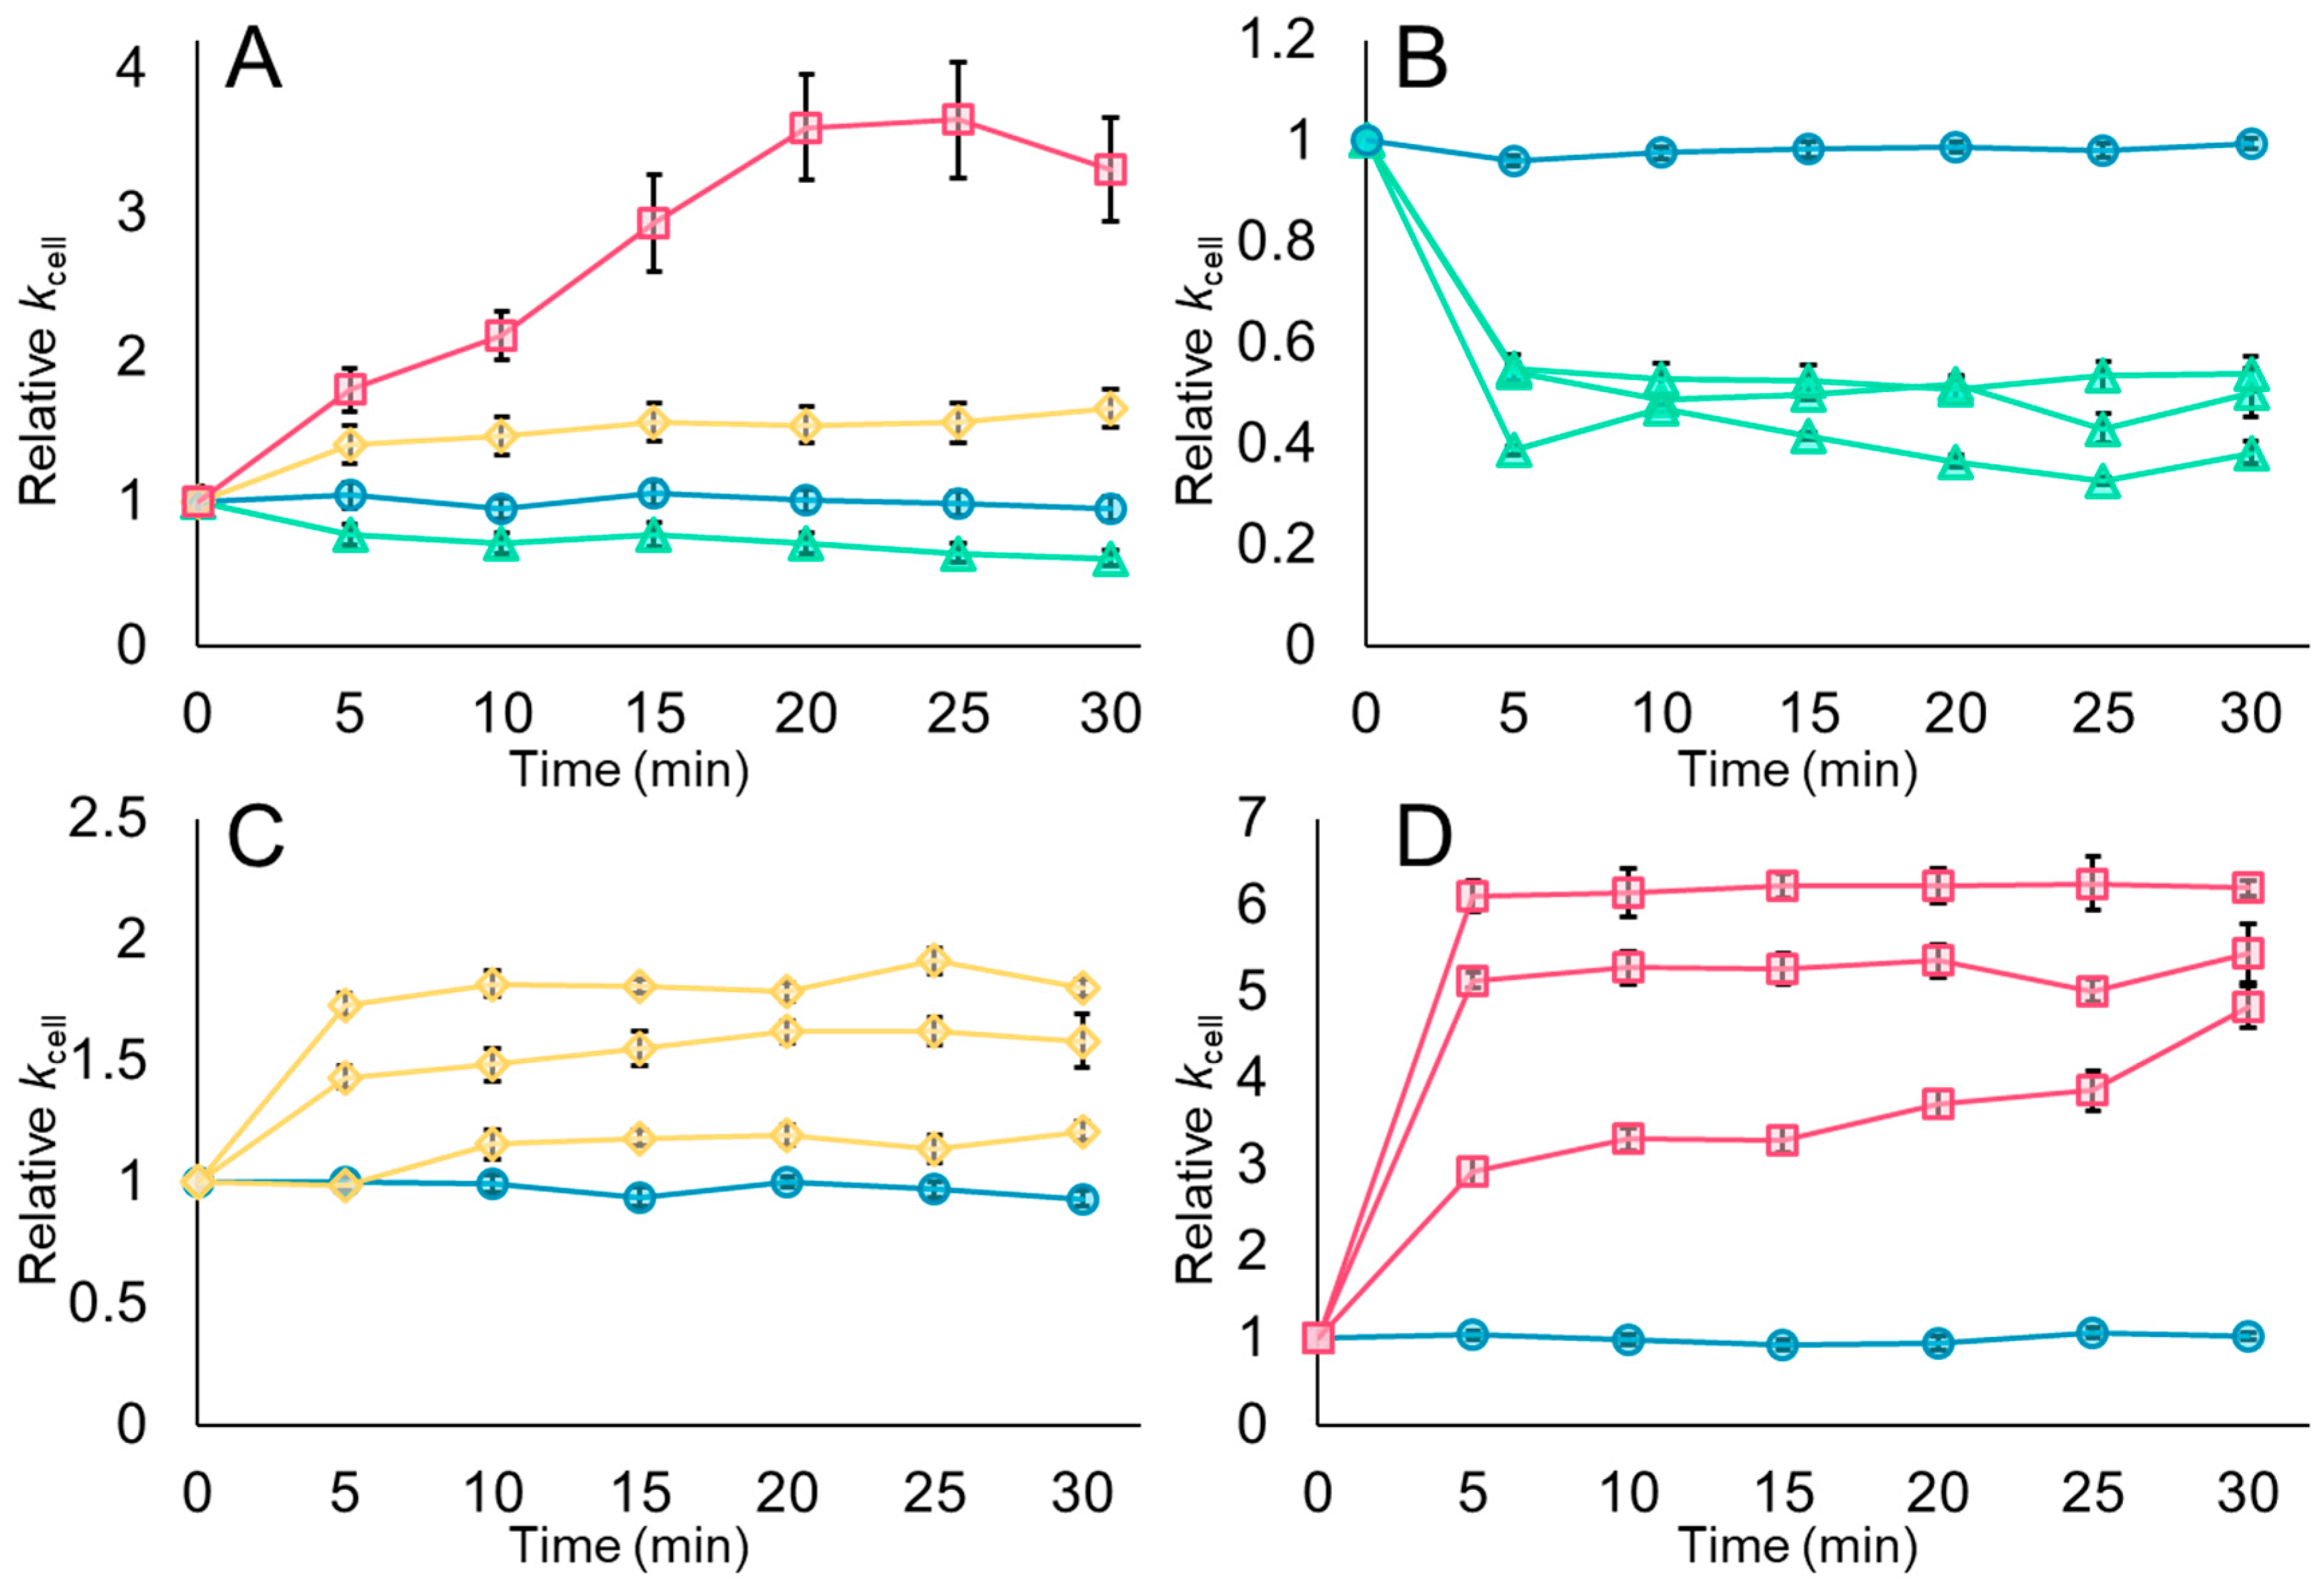
Cells were prepared on a glass coverslip coated with Cell-Tak and remained submerged in HEPES-metals (HM) buffer during the initial AFM imaging. Force measurements were obtained before and at five-minute intervals following peptide addition, totaling 30 min, before capturing a final, high-resolution image. In separate experiments, untreated cells were monitored for 30 min and maintained consistent cell stiffness with minimal variation throughout the experiment (Figure 2, blue circles; Supplemental Figure S4).
Figure 2.
Changes in the cellular spring constant depend upon the concentration of MAG2 used. Cell stiffness measurements were obtained under near-native conditions every five minutes. Measurements were then normalized to the value at time 0. The average relative kcell and standard error are shown for all untreated cells (blue circles) and all cells treated with 25 µM MAG2 (green triangles), 125 µM MAG2 (yellow diamonds), or 500 µM MAG2 (pink squares) in panel (A). The average relative kcell and standard deviation of four individual cells, one untreated and three treated, are shown in panels (B–D), following the same color scheme. These cells represent the 26 untreated cells, 31 cells treated with 25 µM MAG2, 40 cells treated with 125 µM MAG2, and 46 cells treated with 500 µM MAG2. Error bars are present for each point in all panels, but many cannot be distinguished from the marker.
However, after 5 min of treatment with 25 µM MAG2 (1.5 times the MIC), the cellular spring constant dropped considerably and remained approximately 50% lower than the starting spring constant over the 30 min period (Figure 2A,B, green triangles; Supplemental Figure S5). The data we collected during treatment with 25 µM MAG2 were similar to those from our previous work, in which the same strain of E. coli was treated with 16.5 µM MAG2 in 10 mM phosphate buffer [23]. In both instances, cells treated with MAG2 concentrations near the MIC became more compressible within the first 5–10 min, and they were unable to recover within this time frame. This pattern is consistent with the formation of pores in the membranes, which allows the exchange of cytoplasmic components with the surrounding environment. While the decrease in cellular spring constant is dramatic, the cells retain enough turgor pressure to maintain their shape during imaging.
Unexpectedly, E. coli treated with 125 µM MAG2, a concentration 7.6 times greater than the MIC, became stiffer over time (Figure 2A,C, yellow diamonds; Supplemental Figure S6). Within 5–10 min of treatment, the cellular spring constant increased to 1.5 times its initial value. Likewise, the cellular spring constants increased in cells treated with 500 µM MAG2 (30 times the MIC; Figure 2A,D, pink squares; Supplemental Figure S7), but the increase was much larger: cellular spring constants were 3–6 times higher than before the addition of MAG2. The increased cellular spring constant for both concentrations suggests that water can still cross the cell envelope and enter the cytoplasm in response to the higher osmolarity in the cytoplasm than in the surrounding buffer [41], but the movement out of the cytoplasm appears to be restricted in a concentration dependent manner, allowing fluid to build up inside the cell and thus increasing cell stiffness due to increased turgor pressure.
Colistin, also known as polymyxin E, is a cyclic lipopeptide considered a “last resort” antibiotic [42,43]. While not identical to an AMP, it shares some features with MAG2, including its cationic state and ability to disrupt bacterial membranes. Treatment of several different Gram-negative bacteria with colistin results in an increase in the cellular spring constant [36,44,45]. While investigating the interaction between colistin and Acinetobacter baumannii, Soon et al. observed that the cellular spring constant of several colistin-sensitive strains decreased at low concentrations but increased at high concentrations, a finding similar to ours [36]. The authors proposed that colistin interacts with the cell envelope in a concentration-dependent manner, destabilizing it at low concentrations and stabilizing it at high concentrations, possibly by interacting with the outer membrane lipopolysaccharides.
3.2. The Cell Surface Becomes Rougher After Treatment, and High Concentrations of MAG2 Cause Increased Cell Heights
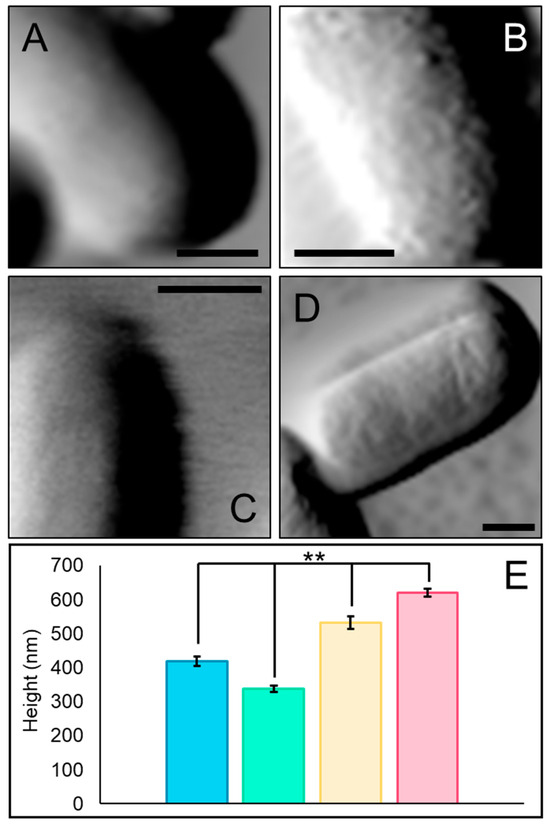
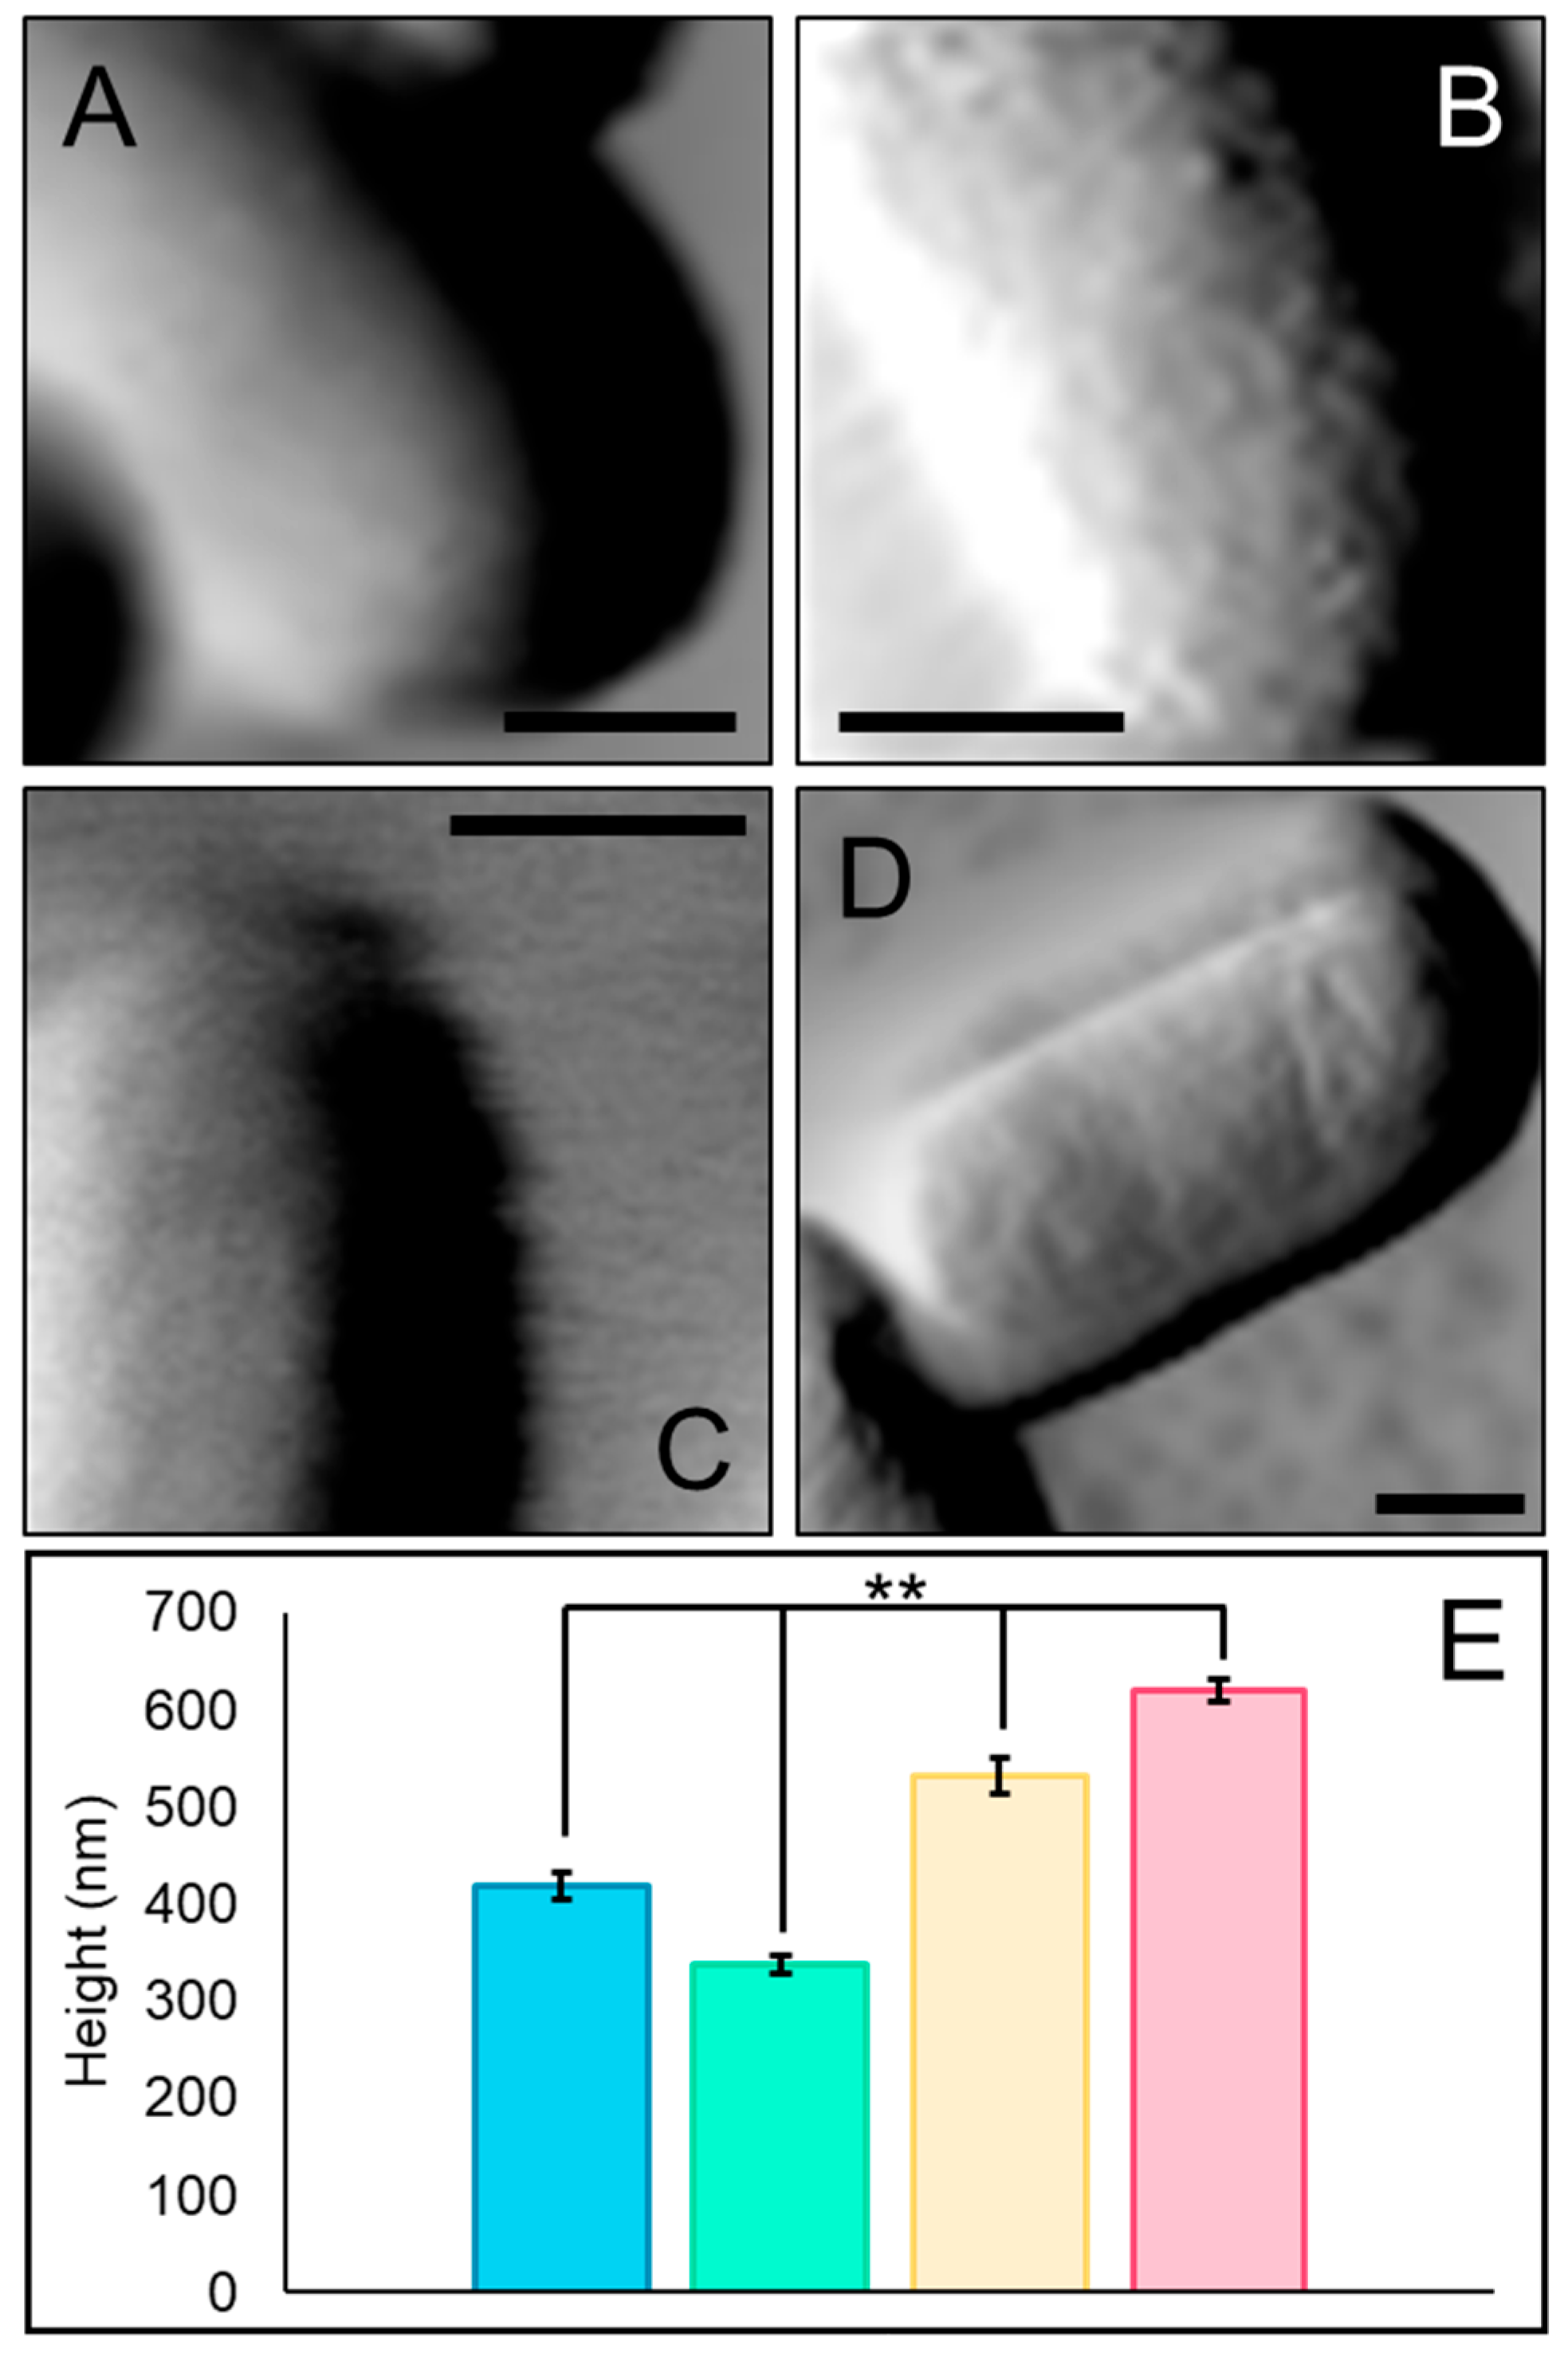
The images obtained under near-native conditions at the end of the 30-min incubation reflect the changes in the cellular spring constant determined from the force measurements. Amplitude images were used to evaluate the surface roughness (Rq), while height images were used to determine the cell’s height at the midpoint of the longitudinal axis (Figure 3 and Supplemental Table S2). The untreated cells displayed a smooth surface devoid of pili or other appendages, which do not typically adhere to the bacterial surface and are therefore not captured in images obtained in fluid (Figure 3A).
Figure 3.
Treatment with MAG2 alters the cell surface and cell height. Representative amplitude images taken in fluid of untreated cells (A) and cells treated with 25 µM MAG2 (B), 125 µM MAG2 (C), and 500 µM MAG2 (D) are shown (n for untreated, 25 µM MAG2, 125 µM MAG2, and 500 µM MAG2 are 26, 31, 40, and 46, respectively). Each scale bar is 0.5 microns. The average cell heights and standard errors are given in panel (E), where untreated cells are shown in blue (418 ± 14 nm), and cells treated with 25 µM MAG2 (373 ± 9.2 nm), 125 µM MAG2 (533 ± 19 nm), and 500 µM MAG2 (621 ± 12 nm) are shown in green, yellow, and pink, respectively. Cell heights were determined at the center of the longitudinal axis, and each condition was statistically different from the others (n for untreated, 25 µM MAG2, 125 µM MAG2, and 500 µM MAG2 are 46, 84, 53, and 61, respectively). All data were acquired after 30 min of treatment. ** p ≤ 0.005 by Student’s t-Test.
Treatment with any concentration of MAG2 caused the cell surface to appear rough, and the average Rq value for each group of treated cells was statistically different from that of untreated cells, though not different from each other (Supplemental Table S2). After treatment with 25 µM MAG2 for 30 min, the bacterial surface became rough and pitted, reflecting the rearrangement of the cell envelope as pores formed in the membranes (Figure 3B). Changes in the roughness of the bacterial surface are likely heightened by the decrease in turgor pressure, which causes the cells to deflate by ~100 nm (Figure 3E, green). However, because our experiments are carried out in fluid, we have confidence that the surface roughness is a feature of MAG2 interacting with the cell envelope rather than an imaging artifact. Indeed, other studies carried out in fluid have also observed increased surface roughness associated with near MIC application of pore-forming AMPs [44,46,47].
Cells treated with 125 or 500 µM MAG2 also appeared rougher than untreated cells (Figure 3C,D). However, on average, the cells treated with 125 µM MAG2 were just over 100 nm taller than the untreated cells (Figure 3E, yellow). Cell heights increased gradually, following a pattern similar to that of cell stiffness (Supplemental Figure S8A). Cells treated with 500 µM MAG2 were, on average, ~200 nm taller (Figure 3E, pink) and reached their maximum height after 5 min of treatment (Supplemental Figure S8B). They maintained that height for the 30 min during which cells were monitored, consistent with the significant increase in cellular spring constant observed in cells treated with 500 µM MAG2.
The increased cell stiffness and height observed during treatment with 125 µM MAG2 and 500 µM MAG2 were surprising compared to the patterns observed in cells treated with 25 µM MAG2. While others have reported increases in cell height during treatment with AMPs, no accompanying decrease in height at lower concentrations was reported [48,49]. A deflated cell is consistent with the established mechanism of MAG2, in which pore formation allows the uncontrolled flow of cytoplasmic contents to the environment, particularly intracellular ions [19,22], eventually establishing equilibrium [4]. Yet our data suggests that E. coli are inflated rather than deflated when treated with higher concentrations of MAG2. This inflation may indicate that MAG2 adopts an alternative structure in the bacterial membranes when applied at high concentrations.
3.3. MAG2 Permeabilizes the Cell Membrane Even at High Concentrations, but Movement Across the Cell Membrane Is Reduced at the End of Treatment with High Concentrations of MAG2
To better understand how MAG2 behaved in the cell membrane at high concentrations, we used propidium iodide (PI) to determine if membrane permeabilization had occurred. PI cannot cross an intact cell membrane; however, if MAG2 forms pores in the membrane, PI can enter the cytoplasm and intercalate into DNA, which can be detected by fluorescence spectroscopy or microscopy [32]. While PI cannot cross an intact cell membrane, it can cross the outer membrane and accumulate in the periplasmic space, so while this assay relies on MAG2 interacting with both bacterial membranes, a signal is only apparent once the cell membrane has been breached.
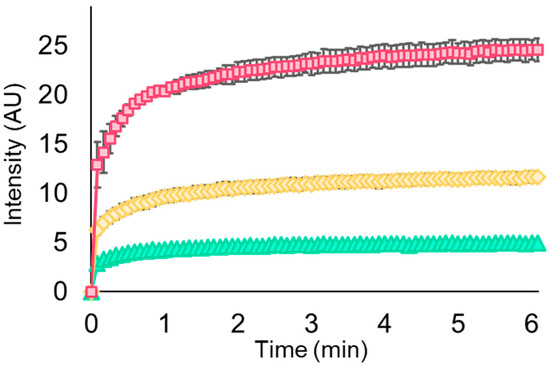
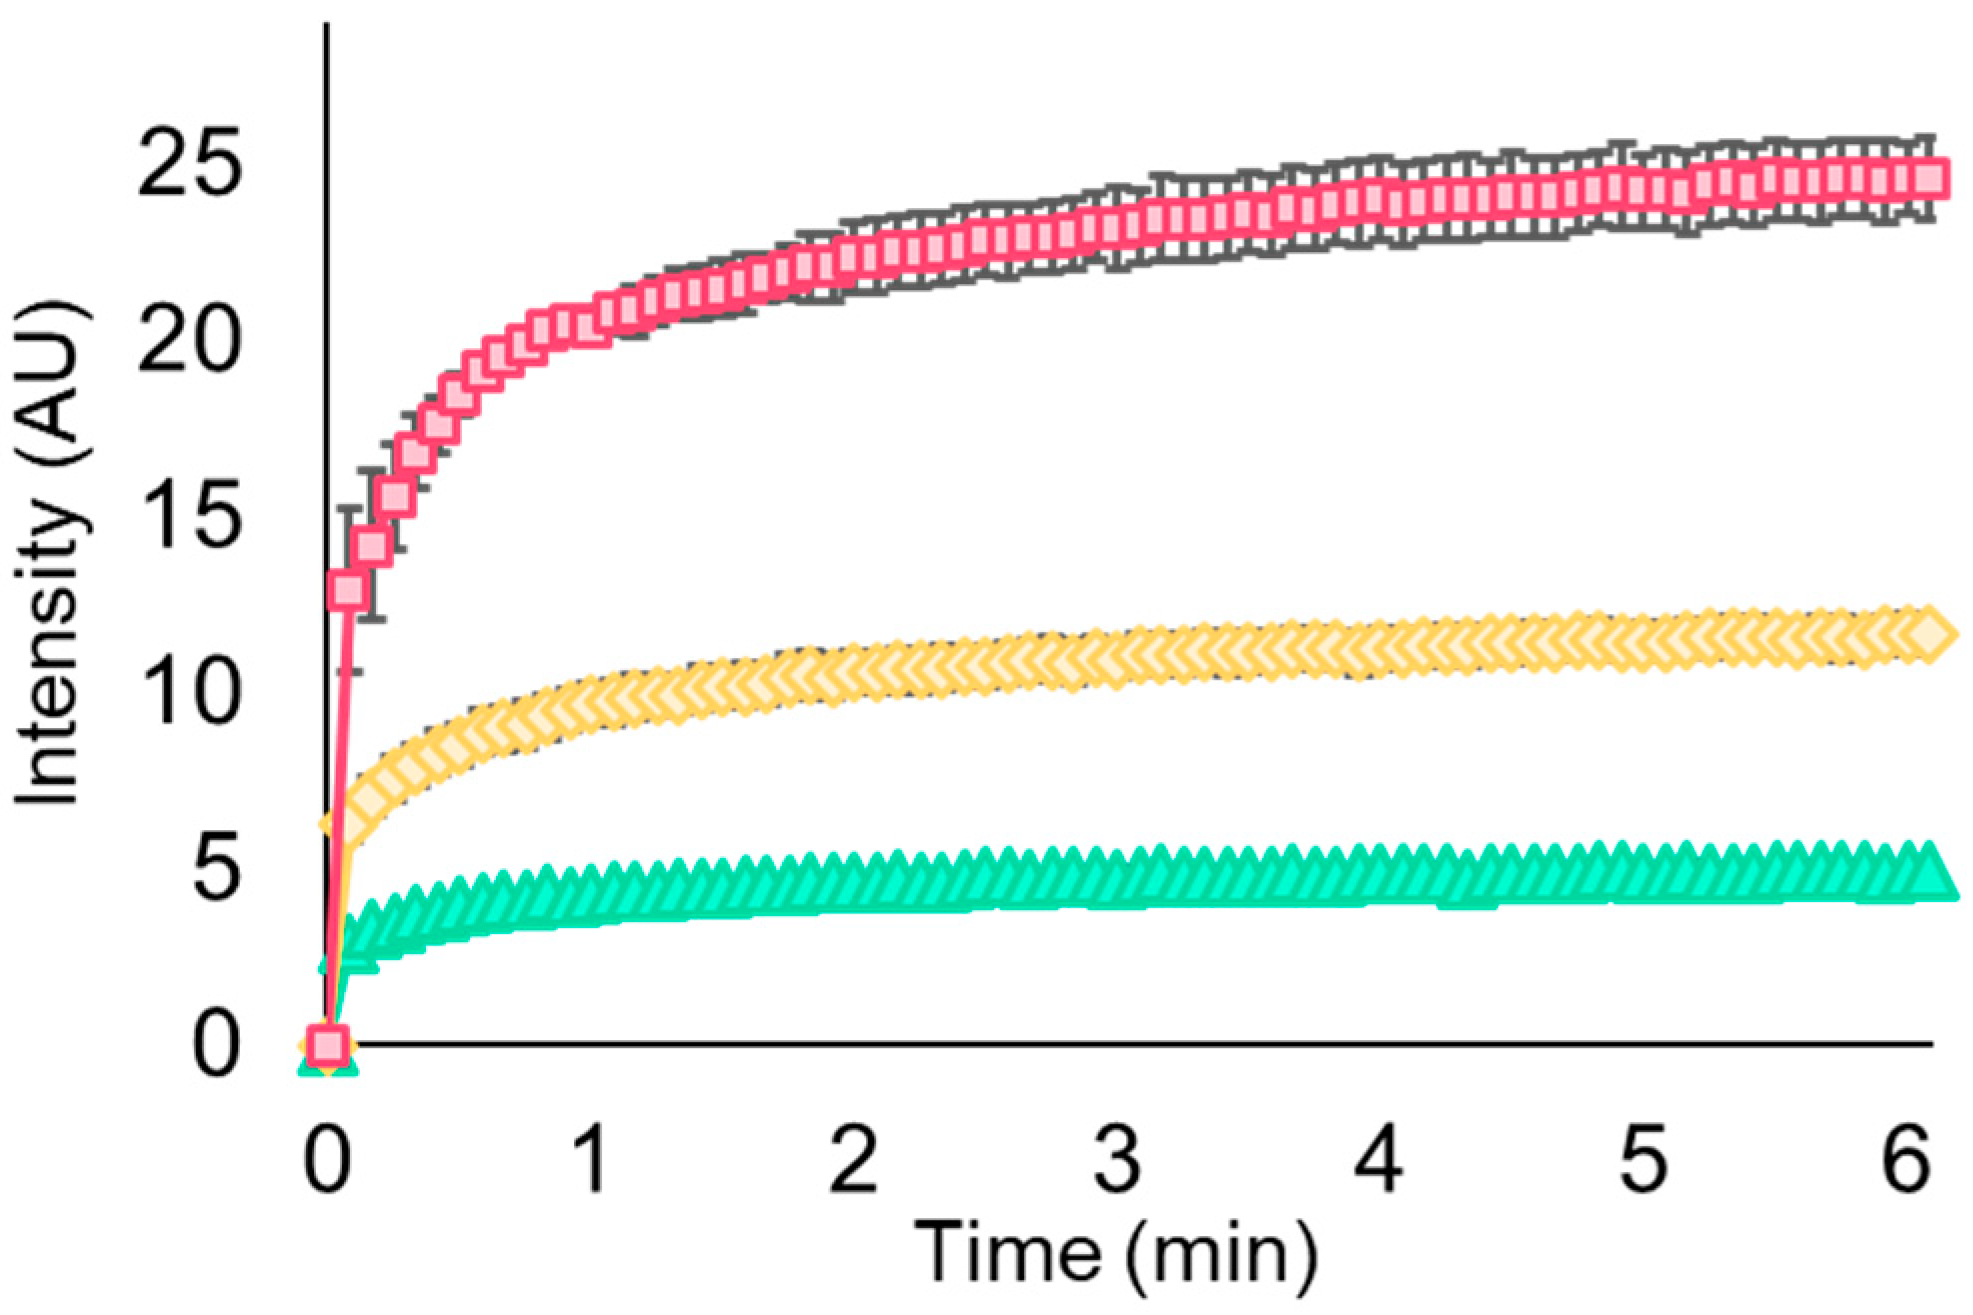
We have previously used fluorescence spectroscopy to show that concentrations of MAG2 at the MIC induce rapid pore formation in the E. coli cell membrane [23]. In a standard PI uptake assay, cells were equilibrated with PI before adding MAG2. When MAG2 was added to the suspension at a final concentration of 25 µM, fluorescence increased rapidly before the PI-binding equilibrium was established (Figure 4, green triangles), consistent with our previously published data [23]. We performed equivalent PI uptake experiments using 125 µM MAG2 and 500 µM MAG2, and observed PI uptake on a similar time scale, but noted that the fluorescence intensity at equilibrium increased as the concentration of MAG2 increased (Figure 4, yellow diamonds and pink squares, respectively). These experiments suggest that not only is the cell membrane permeabilized rapidly when any concentration of MAG2 is added, but higher concentrations of MAG2 also allow increased PI uptake.
Figure 4.
Propidium iodide fluorescence increases with increasing MAG2 concentration. The PI fluorescence intensity was determined every five seconds for cells treated with 25 µM MAG2 (green triangles), 125 µM MAG2 (yellow diamonds), or 500 µM MAG2 (pink squares). The average intensity and its standard error were determined from at least three independent experiments. Error bars are present for each point, but many are not distinguishable from the marker.
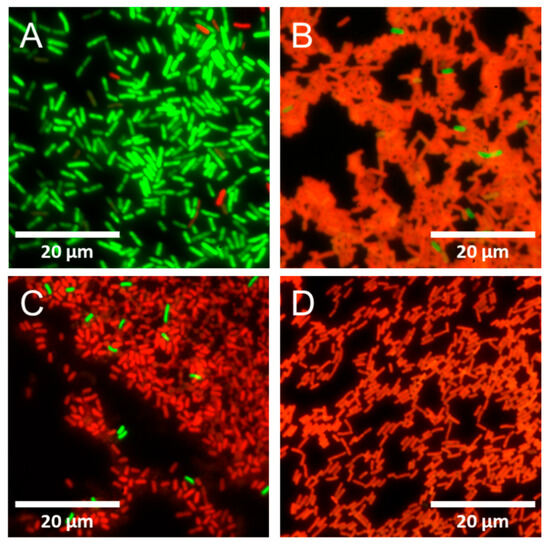
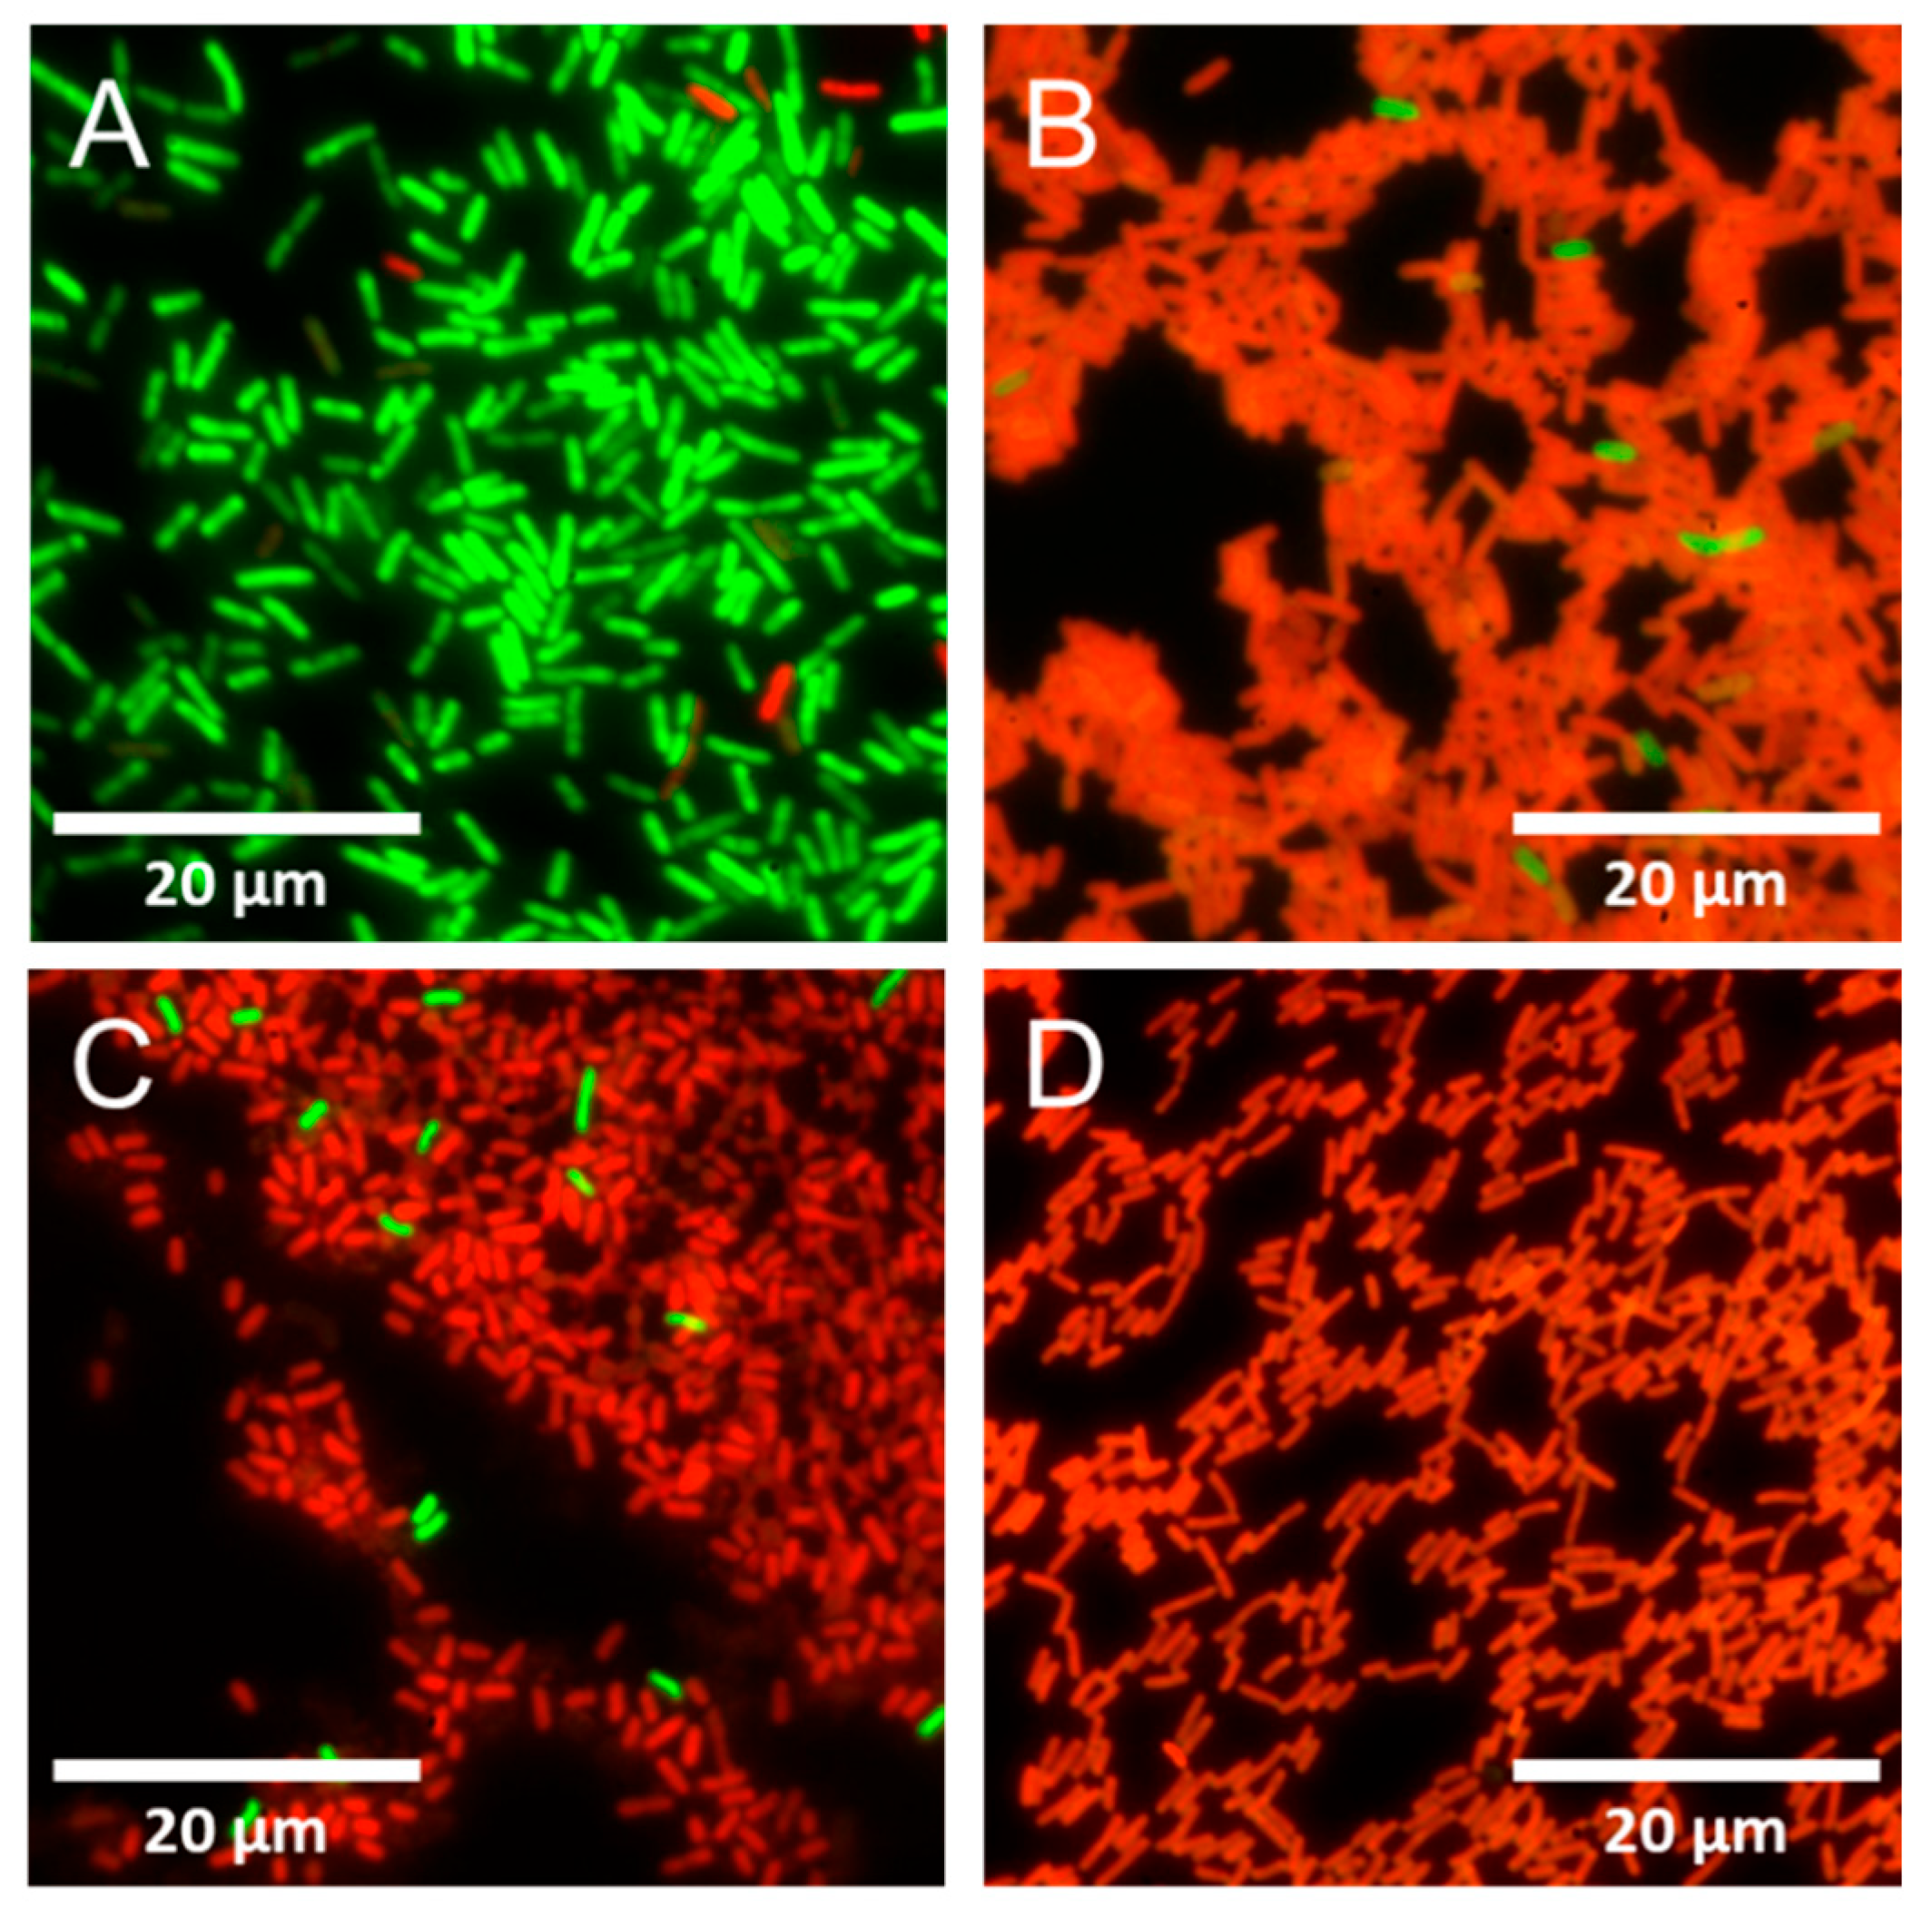
Next, we treated adhered E. coli samples with 25 µM, 125 µM, or 500 µM MAG2 for 30 min. Then, we used Invitrogen’s BacLight live/dead fluorescence staining kit to determine if the cell membrane was intact post-treatment [50]. This kit includes the membrane-permeable dye SYTO 9, which stains all cells green, and PI (vide supra). If the bacterial cell membrane has been permeabilized, PI can enter the cell, where it outcompetes SYTO 9 for intercalation into DNA, causing the cells to fluoresce red. While this procedure is often referred to as live/dead staining, we are not interested in cell viability but rather in whether the membrane has been permeabilized.
The untreated cells are primarily green, and samples contain few (if any) red cells, consistent with cells grown to log phase (Figure 5A). However, when cells were treated with 25 µM MAG2, most cells were permeabilized, with only a few cells exhibiting green fluorescence (Figure 5B). The same is true when cells were treated with 125 µM MAG2 (Figure 5C) or 500 µM MAG2 (Figure 5D). Since live/dead staining occurs after MAG2 treatment is complete, we determined that PI, SYTO 9, and presumably other small molecules can still enter the cell through the cell membrane after 30 min, and the membranes are likely at least somewhat permeable at the end of our AFM experiments.
Figure 5.
Propidium iodide can cross the cell membrane after 30 min of treatment with MAG2. Representative live/dead images of untreated cells (A) and cells treated with 25 µM MAG2 (B), 125 µM MAG2 (C), and 500 µM MAG2 (D) are shown. The membrane-permeable dye SYTO 9 enters all cells and emits green fluorescence. When cell membranes are permeabilized, PI can enter the cell and out-compete the SYTO 9, causing cells to fluoresce red. An accessible version of this figure using cyan in place of green and magenta in place of red is available in the Supporting Information (Supplemental Figure S9).
To quantitatively determine the extent to which the cell membrane remained permeable during treatment with MAG2, we performed delayed PI uptake experiments, as outlined in Supplemental Figure S1. In standard PI uptake assays, PI is added before MAG2, and it rapidly enters the cell upon addition of MAG2, reaching equilibrium within 2 min (Figure 4). Once the PI enters the cell, its favorable interaction with the DNA effectively traps it, so any subsequent changes in cell membrane permeability as MAG2 continues to accumulate would not be observed. In a delayed PI uptake assay, the PI is added to the cell suspension after 30 min of MAG2 treatment, providing information about the cell membrane’s permeability at the end of the experiment (Supplemental Figure S1). Matched samples used in a standard PI uptake assay and delayed PI uptake assay are then compared to determine how cell membrane permeability differs at the end of the MAG2 treatment compared to the beginning (Table 1). It is also worth noting that the plate reader produced much greater variation across experiments conducted on different days, making matched samples even more critical.
Table 1.
Averages, standard deviations, and percent uptake of tandem standard and delayed PI uptake fluorescence experiments.
Paired experiments showed that E. coli treated with 25 µM MAG2 take up PI at the same level regardless of whether it is added at the beginning or end of 30-min treatments, producing nearly identical fluorescence measurements for the standard and delayed PI uptake (100 ± 2% uptake, Table 1). The equipotent fluorescence intensity indicates that the pores formed under these conditions remain stable throughout our 30-min experiments, consistent with the loss of turgor pressure we observe and the known mechanism of MAG2. However, the delayed PI uptake experiments revealed that PI movement across the cell membrane is restricted after 30 min of treatment with 125 µM MAG2; the fluorescence intensity from the delayed PI uptake was only 65 ± 7% of that of the corresponding standard PI uptake (Table 1). The PI uptake was further restricted when cells were treated with 500 µM, with the delayed PI uptake fluorescence intensity only 31 ± 6% of the tandem standard PI uptake (Table 1). Comparing the delayed and standard PI uptake experiments indicates a timeline in which MAG2 forms pores in the cell membrane as soon as the peptide is introduced to the cells. These pores would allow the rapid influx of water from the environment and efflux of ions as equilibrium takes over, and remain stable throughout our 30-min experiments at low MAG2 concentrations. However, at higher concentrations, as MAG2 continues to accumulate in the cell membrane during treatment, the membrane’s permeability decreases as it remodels into a conformation that disfavors the movement of larger charged molecules, such as PI, while still allowing small molecules, such as water, to diffuse in. As water flows down the equilibrium gradient, it causes the cell to swell, which increases the height and turgor pressure we observe with AFM.
Why then did we observe the accumulation of PI in our fluorescence microscopy, if the delayed PI uptake indicated that movement of PI across the cell envelope is restricted after 30 min? The accumulation of PI in the fluorescence microscopy is likely due to the additional time required for staining, which could allow sufficient accumulation of PI despite reduced uptake, making cells appear red. Taken together, these results indicate that, while movement across the cell envelope may be restricted, the envelope does not completely seal off.
3.4. Higher Concentrations of MAG2 Lead to More Rigid Cell Envelopes
We can investigate the packing of MAG2 in the cell envelope using our AFM force experiments. The nonlinear transition in force-indentation curves that occurs as the tip compresses the cell envelope can be fit with the Hertz model to determine Young’s modulus, providing valuable information about the structure’s rigidity [33]. However, the nonlinear regime reflects the compression of the cell envelope as a whole, so the changes that occur cannot be explicitly assigned to one membrane over the other based on Young’s modulus alone. Furthermore, any model relies on assumptions that do not perfectly fit Gram-negative bacteria, though our initial measurements fall within the same range as previously reported values [48,51,52]. While the Hertz model has limitations, we apply it consistently across the entire data set and focus on changes rather than absolute values.
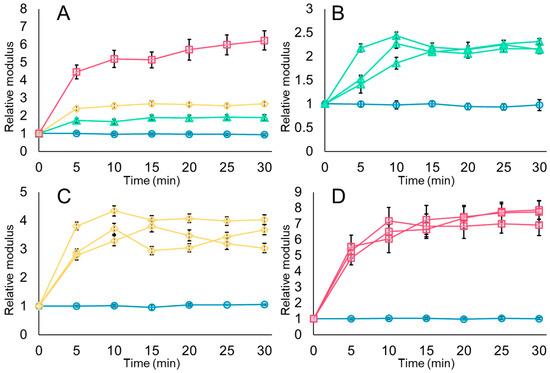
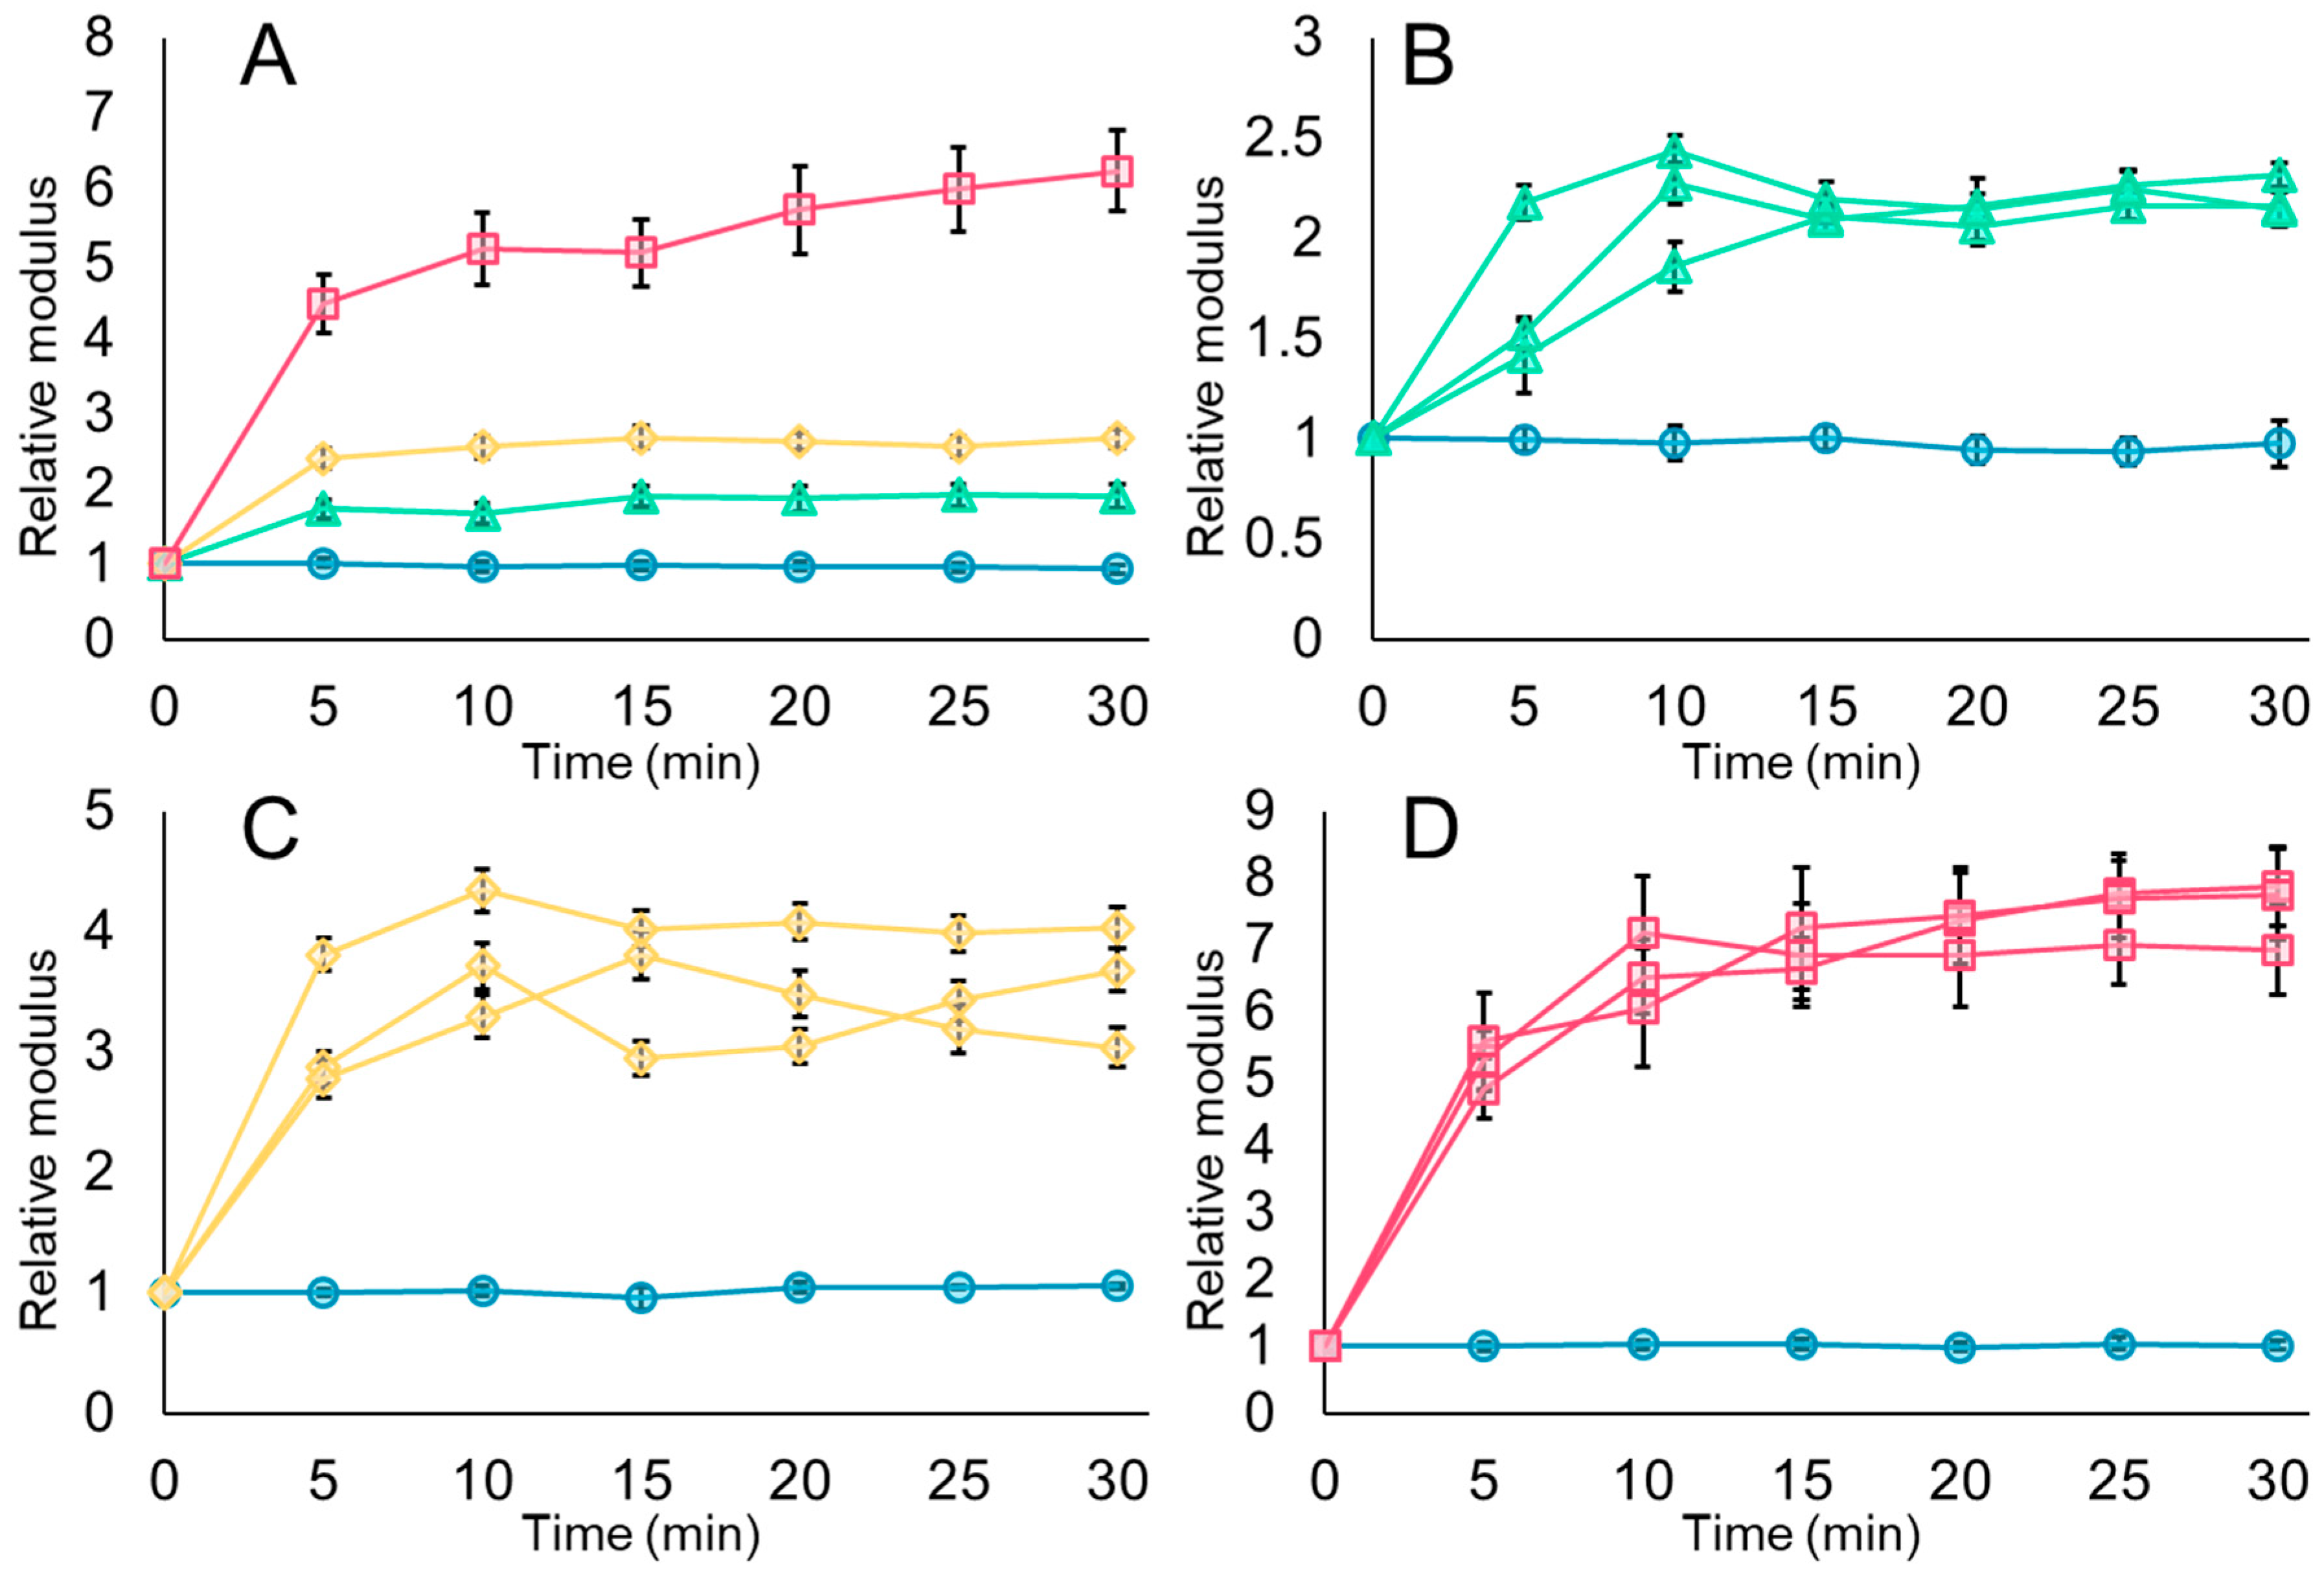
The rigidity of untreated E. coli cell envelopes did not change during the AFM force experiments (Figure 6, blue circles; Supplemental Figure S10), indicating that our measurements do not alter the biomechanics of the cell envelope. However, when E. coli were treated with 25 µM MAG2, the cell envelopes became around twice as rigid as before the MAG2 was applied (Figure 6A,B, green triangles; Supplemental Figure S11). Our previous work, in which we conducted force experiments with E. coli using 16.5 µM MAG2 in a 10 mM phosphate buffer, suggested that the cell envelope becomes more flexible during MAG2 pore formation [23]. We likely observed increased cell envelope rigidity in the experiments presented here due to the presence of the divalent cations Mg2+ and Ca2+ in the HM buffer. To relieve the charge–charge repulsion between the phosphate groups on neighboring lipid A molecules, Mg2+ acts as a bridge, forming a network that stabilizes the outer membrane [53,54,55,56]. Cationic AMPs will replace divalent cations on the surface of the outer membrane during their initial interaction with the bacterium [1,57,58], but adding Mg2+ and Ca2+ to the surrounding fluid would allow cations to return to the surface once MAG2 has inserted into the membrane, rigidifying the outer membrane by increased packing from MAG2 insertion and through stabilization by divalent cations.
Figure 6.
MAG2 rigidifies the cell envelope in a concentration-dependent manner. Force-indentation curves were collected under near-native conditions every five minutes and then used in the Hertz model to calculate Young’s modulus, a measurement of cell envelope rigidity. Average moduli at each time point were then normalized to the value at time 0. The average relative moduli and standard error are shown for all untreated cells (blue circles) and all cells treated with 25 µM MAG2 (green triangles), 125 µM MAG2 (yellow diamonds), or 500 µM MAG2 (pink squares) in panel (A). The average relative moduli and standard deviation of four individual cells, one untreated and three treated, are shown in panels (B–D), following the same color scheme. These cells represent the 26 untreated cells, 31 cells treated with 25 µM MAG2, 40 cells treated with 125 µM MAG2, and 46 cells treated with 500 µM MAG2. Error bars are present for each point in all panels, but many cannot be distinguished from the marker.
The cell envelopes of E. coli treated with 125 µM MAG2 were stiffer than both the untreated and 25 µM MAG2-treated cells (Figure 6A,C, yellow diamonds; Supplemental Figure S12), as were cells treated with 500 µM MAG2 (Figure 6A,D, pink squares; Supplemental Figure S13). Since the AFM buffer remains the same, the increase in cell envelope rigidity likely stems from the additional MAG2 in the system, rather than from the presence of divalent cations. The increased cell envelope rigidity suggests several possible scenarios for how additional MAG2 interacts with the bacterial membranes: that the MAG2 has wholly inserted into the cell and outer membranes and rigidifies the cell envelope by compacting the membrane contents, or that the MAG2 forms some network covering the surface of the cell after pore formation has occurred, stabilizing the outer membrane. As discussed above, cationic AMPs will displace the Mg2+ on the surface of the outer membrane as the first step in pore formation. If the membranes are full, the extra MAG2 could accumulate on the surface, held in place by the negatively charged LPS.
Either of these scenarios would be consistent with the increased turgor pressure we observe in these cells. In the first scenario, the insertion of MAG2 into the membranes could directly seal off the cell by compressing the membrane contents and preventing cytoplasmic leakage of larger ionic complexes, while still allowing water through. By contrast, in the second scenario, stabilizing the outer membrane with a network of MAG2 on the surface could prevent cytoplasmic loss across the outer membrane, creating a system in which MAG2 forms pores in the cell membrane, while the outer membrane prevents cytoplasmic loss to the environment.
Other bacteria treated with increasing concentrations of AMP also show increased cell envelope rigidity [48,52,59]. Quilès et al. exposed nascent Pseudomonas fluorescens biofilms and planktonic cells to increasing concentrations of a dermaseptin S4 derivative, which also permeabilizes the bacterial membranes [49]. They found a slight increase in cell envelope rigidity in planktonic cells when treated with four times the MIC, but much stiffer cell envelopes when treated with 32 times the MIC, and suggested a model in which the accumulation of AMP in the membrane prevents bacterial lysis, as we have suggested above.
Work with the Gram-positive bacterium Bacillus subtillis exposed to another pore-forming peptide, LL-37, showed increased cell envelope rigidity after treatment [60]. The authors suggest that the rigidity comes not from LL-37 interacting with the cell membrane but from interactions with the peptidoglycan layer. Interactions between AMPs and the peptidoglycan may also contribute to the increased cell envelope rigidity observed in Gram-negative bacteria; we cannot exclude this interaction from our system. However, while interactions between MAG2 and the peptidoglycan layer would increase the rigidity of the cell envelope, it seems unlikely that those interactions alone would account for the increased turgor pressure and cell height we observe. Furthermore, PI uptake experiments indicate that MAG2 is at least initially located in the outer and inner membranes during pore formation, and the stability derived from the interactions between the hydrophobic face of the MAG2 helix and the lipid tails suggests that it could be more thermodynamically favorable for MAG2 to remain in the lipid bilayer.
3.5. Imaging in Air Reveals Membrane Blebbing in E. coli Treated with 125 or 500 µM MAG2
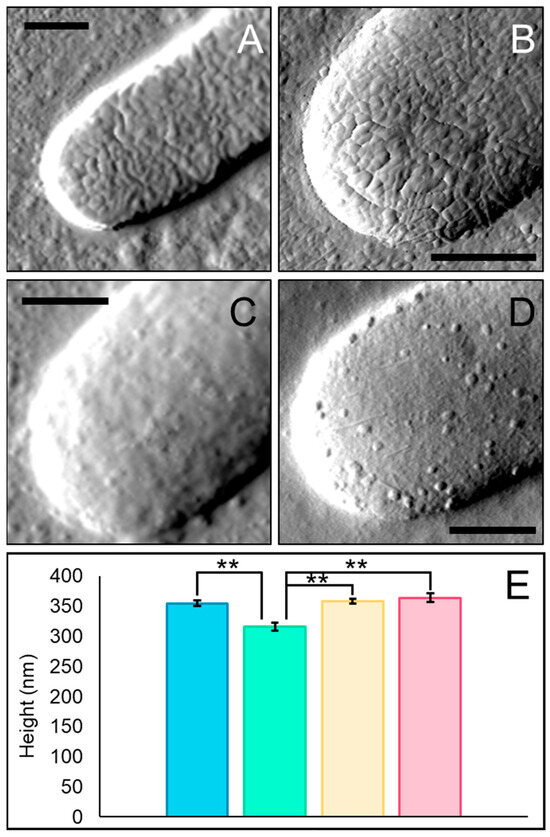
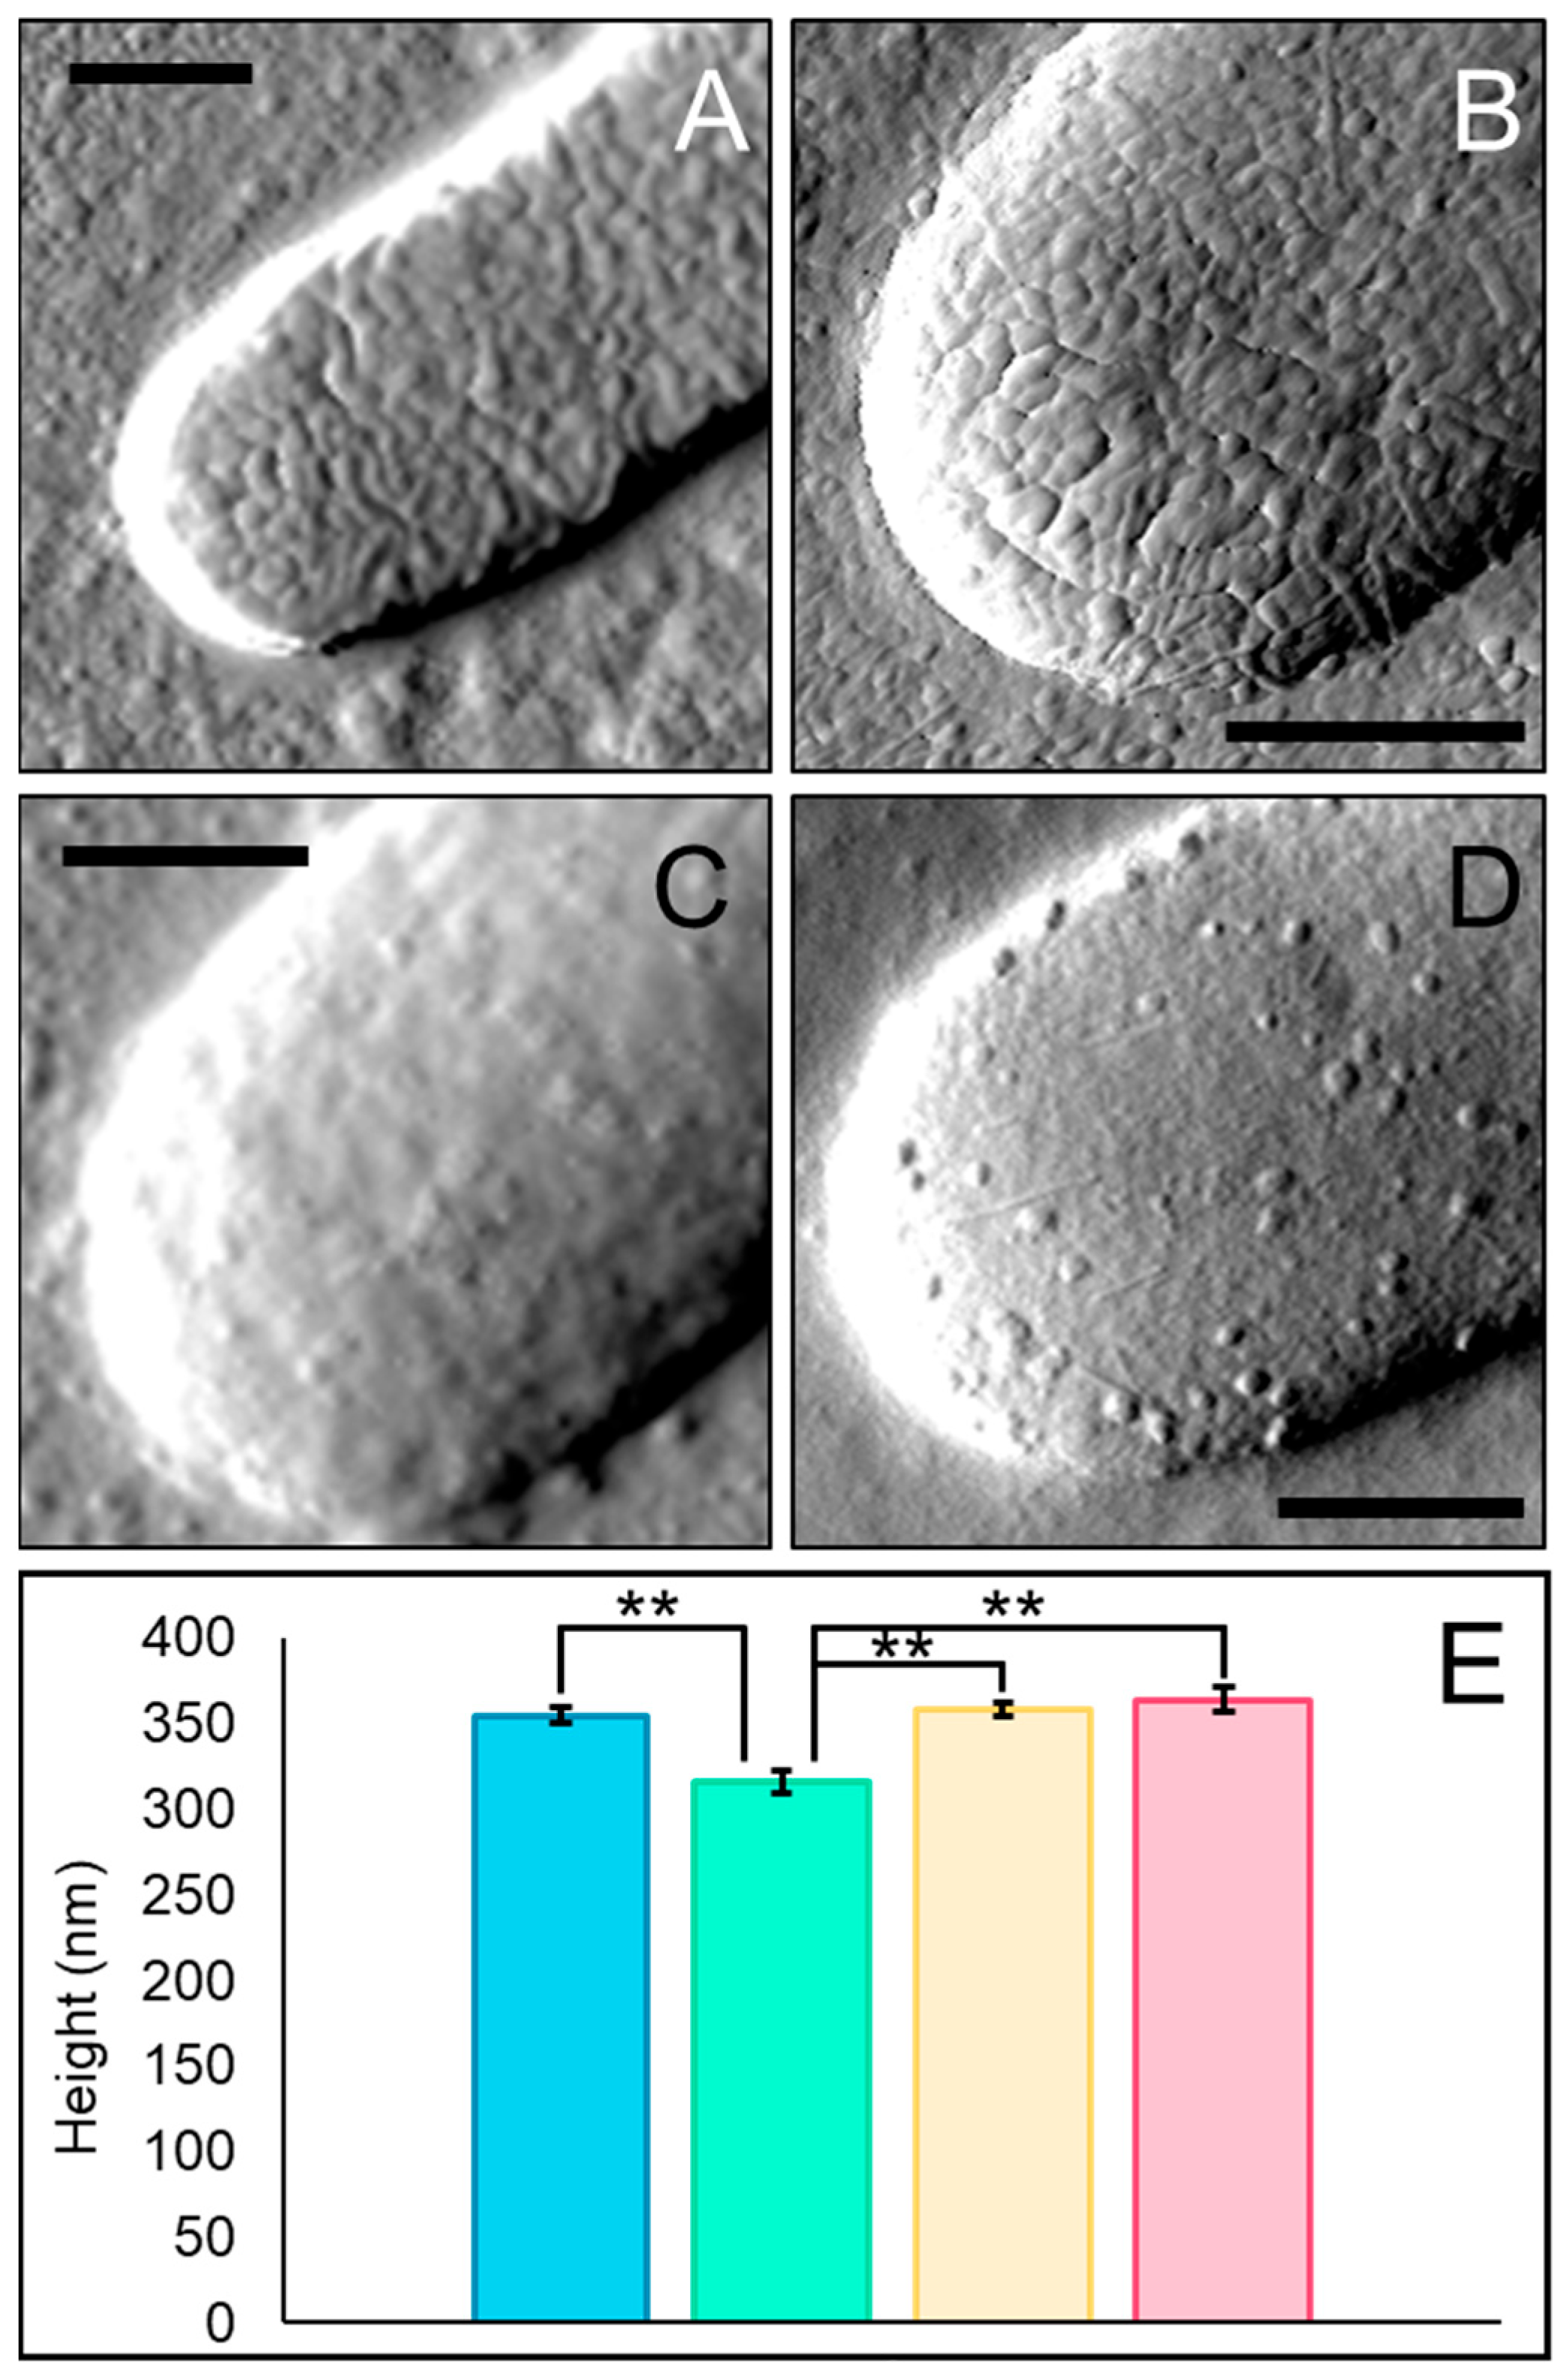
To investigate whether MAG2 increased cell envelope rigidity through membrane insertion or ionic surface attraction, we imaged bacteria in air after 30 min of treatment to capture increased detail of the cell surface. The untreated bacteria have a wrinkled surface, and surface appendages are visible (Figure 7A), consistent with images of other bacteria imaged in the air [61]. Untreated cells imaged in air were roughly 75 nm shorter than the untreated cells imaged in fluid (Figure 3E), reflecting the loss of additional water from the cell due to imaging in air. Cells treated with 25 µM MAG2 are still wrinkled, but less than the untreated cells (Figure 7B). These cells were also shorter than the untreated cells imaged in air, likely due to the loss of cytoplasmic contents during treatment (Figure 7E). Surprisingly, the cells treated with 25 µM MAG2 and imaged in air were about the same height as those imaged in fluid (Figure 3E), suggesting that this height might be the lower limit for the permeabilized cells to maintain their shape during imaging.
Figure 7.
Blebs form on the surface of cells treated with high concentrations of MAG2. Representative amplitude images taken in air of untreated cells (A) and cells treated with 25 µM MAG2 (B), 125 µM MAG2 (C), and 500 µM MAG2 (D) are shown (n for untreated, 25 µM MAG2, 125 µM MAG2, and 500 µM MAG2 are 63, 42, 57, and 55, respectively). Each scale bar is 0.5 microns. The average cell heights and standard errors are given in panel (E), where untreated cells are shown in blue (354 ± 4.4 nm), and cells treated with 25 µM MAG2 (316 ± 3.2 nm), 125 µM MAG2 (358 ± 4.2 nm), and 500 µM MAG2 (364 ± 7.4 nm) are shown in green, yellow, and pink, respectively. Cell heights were determined at the center of the longitudinal axis (n for untreated, 25 µM MAG2, 125 µM MAG2, and 500 µM MAG2 are 43, 38, 41, and 45, respectively). All data were acquired after 30 min of treatment. ** p ≤ 0.005 by Student’s t-Test.
The cells treated with 125 µM MAG2 lack the wrinkles observed in the other cells but have tiny blebs forming on the surface, which are not removed by repeated imaging (Figure 7C). Likewise, cells treated with 500 µM MAG2 also exhibit surface blebs, which are more pronounced (Figure 7D). While fewer than 5% of cells treated with 25 µM MAG2 have blebs, ~75% of cells treated with 125 µM MAG2 and nearly 100% of cells treated with 500 µM MAG2 have blebs on their surface. Bleb formation can signal an increase in material packed into a membrane and is one way to relieve membrane packing stress [62]. Unlike the cells imaged in liquid, cells treated with high concentrations of MAG2 imaged in air were approximately the same height as the untreated cells imaged in air, rather than taller, though they were still taller than those treated with 25 µM MAG2 (Figure 7E). Since these cells were treated with 125 µM or 500 µM MAG2 in liquid, water presumably entered the cells, leading to increased cell stiffness and cell envelope rigidity we observed when experiments were conducted in fluid. However, when the cells were dried for imaging, water could escape through the cell envelope, as we observed with the untreated cells.
Bleb formation has been observed in previous optical and electron microscopy studies with MAG2 [22], early AFM imaging of MAG2-treated cells in air [63], and in experiments using various other AMPs [63,64,65,66]. Together with the concentration-dependent increase in fluorescence intensity observed in standard PI uptake assays (Figure 4), bleb formation suggests that MAG2 inserts into membranes rather than forming a peptide network on the cell’s surface. However, blebs were not captured in our images obtained in fluid. Imaging in fluid increases the difficulty of capturing dynamic surface structures, and blebs could possibly evade the AFM probe as it moves across the surface. It is possible that removing excess Mg2+ and Ca2+ when imaging in air allows us to capture blebs on the bacterial surface. Removing the extra cations by imaging in air could destabilize the outer membrane and favor, or at least allow us to capture, bleb formation. Dehydration of the cell surface can make various features more apparent, so dehydration may also contribute to the capture of blebs on the surface of cells treated with high concentrations of MAG2. While we cannot rule out that these blebs formed due to drying, we propose that the blebs visible in the air images were also present in our fluid images but could only be revealed after the sample dried.
4. Conclusions
We used AFM, fluorescence spectroscopy, and fluorescence microscopy to investigate concentration-dependent changes in bacterial biomechanics in E. coli treated with the pore-forming AMP MAG2. We propose that when E. coli are treated with concentrations of MAG2 near the MIC, pores form quickly in the outer and cell membranes by creating and relieving curvature stress, as described by several studies from the Weisshaar group [21,67,68,69,70]. After several minutes, the MAG2 pores stabilize, allowing cytoplasmic material to flow through the cell envelope and into the environment. We observe these features in our data as increased PI uptake (1–2 min after MAG2 addition), followed by increased cell envelope rigidity and decreased turgor pressure and cell height (5–10 min after MAG2 addition).
Initially, pores still form when high concentrations of MAG2 are added, as indicated by the increased fluorescence in the standard PI uptake assay (1–2 min after MAG2 addition). However, as the excess MAG2 continues to enter the inner and outer membranes (5–15 min after MAG2 addition), the cell envelope continues to rigidify, and MAG2 likely rearranges the membranes to adopt a conformation in which movement of materials from the cytoplasm to the environment becomes restricted. We observe a concomitant increase in turgor pressure and height during this process. The same curvature-relief mechanism that dictates the initial interactions of MAG2 with the cell likely persists as more MAG2 is incorporated into the membranes, eventually leading to bleb formation. Given the interest in using AMPs in a clinical setting, either alone or in combination with other compounds, it is essential to understand how these peptides behave at varying concentrations. If applied at too high a concentration, our data suggest that other compounds introduced simultaneously may not be able to enter the cell in time to reach an intercellular target before an AMP, such as MAG2, restricts movement across the cell envelope, potentially limiting its application. To better define this phenomenon, future experiments using model membranes to investigate membrane packing, such as electrophysiological or circular dichroism experiments, will be needed. Furthermore, as these results were obtained using a single bacterial species, a broader range of bacteria should be used to assess the extent of these findings, and experiments to determine the consequences for antibiotic transport across the cell envelope must be conducted.
Supplementary Materials
The following supporting information can be downloaded at: https://www.mdpi.com/article/10.3390/appliedphys2010003/s1, Supplemental Methods; Supplemental Figure S1: Standard and delayed PI uptake schematic; Supplemental Figure S2: Fluorescent images of HEK 293 cells treated with MAG2; Supplemental Figure S3: PI uptake of HEK 293 cells treated with MAG2; Supplemental Figures S4–S7: Additional cells’ average cellular spring constant over time; Supplemental Figure S8: Cell height measurements over time; Supplemental Figure S9: Accessible version of Figure 5; Supplemental Figures S10–S13: Additional cells’ average Young’s modulus over time; Supplemental Table S1: Average cellular spring constants and Young’s moduli at time 0; Supplemental Table S2: Average roughness (Rq) in AFM images.
Author Contributions
Conceptualization, C.B.V.; Methodology, C.B.V.; Validation, C.B.V.; Formal Analysis, R.Z., J.A., S.S., J.R. and C.B.V.; Investigation, R.Z., J.A., S.S., J.R. and C.B.V.; Resources, C.B.V.; Writing—Original Draft Preparation, C.B.V.; Writing—Review & Editing, C.B.V.; Visualization, C.B.V.; Supervision, C.B.V.; Project Administration, R.Z., J.A., S.S., J.R. and C.B.V.; Funding Acquisition, C.B.V. All authors have read and agreed to the published version of the manuscript.
Funding
This work was supported by grant 22-5546 from the Roy J. Carver Charitable Trust to C.B.V.
Institutional Review Board Statement
Not applicable.
Informed Consent Statement
Not applicable.
Data Availability Statement
The raw data supporting the conclusions of this article will be made available by the authors on request.
Acknowledgments
The authors thank Megan E. Núñez, Eileen M. Spain, and Megan A. Ferguson for their helpful discussions throughout this project.
Conflicts of Interest
The authors declare no conflict of interest.
References
- Hancock, R.E.; Scott, M.G. The Role of Antimicrobial Peptides in Animal Defenses. Proc. Natl. Acad. Sci. USA 2000, 97, 8856–8861. [Google Scholar] [CrossRef] [Scilit]
- Lai, Y.; Gallo, R.L. AMPed Up Immunity: How Antimicrobial Peptides Have Multiple Roles in Immune Defense. Trends Immunol. 2009, 30, 131–141. [Google Scholar] [CrossRef] [Scilit]
- Shagaghi, N.; Palombo, E.A.; Clayton, A.H.; Bhave, M. Antimicrobial Peptides: Biochemical Determinants of Activity and Biophysical Techniques of Elucidating Their Functionality. World J. Microbiol. Biotechnol. 2018, 34, 62. [Google Scholar] [CrossRef] [Scilit] [PubMed]
- Bechinger, B. The SMART Model: Soft Membranes Adapt and Respond, Also Transiently, in the Presence of Antimicrobial Peptides. J. Pept. Sci. 2015, 21, 346–355. [Google Scholar] [CrossRef] [Scilit]
- Sani, M.-A.; Separovic, F. How Membrane-Active Peptides Get into Lipid Membranes. Acc. Chem. Res. 2016, 49, 1130–1138. [Google Scholar] [CrossRef] [Scilit]
- Wieprecht, T.; Apostolov, O.; Seelig, J. Binding of the Antibacterial Peptide Magainin 2 Amide to Small and Large Unilamellar Vesicles. Biophys. Chem. 2000, 85, 187–198. [Google Scholar] [CrossRef] [Scilit] [PubMed]
- Silhavy, T.J.; Kahne, D.; Walker, S. The Bacterial Cell Envelope. Cold Spring Harb. Perspect. Biol. 2010, 2, a000414. [Google Scholar] [CrossRef] [Scilit] [PubMed]
- Li, S.; Wang, Y.; Xue, Z.; Jia, Y.; Li, R.; He, C.; Chen, H. The Structure-Mechanism Relationship and Mode of Actions of Antimicrobial Peptides: A Review. Trends Food Sci. Technol. 2021, 109, 103–115. [Google Scholar] [CrossRef] [Scilit]
- Peschel, A.; Sahl, H.-G.G. The Co-Evolution of Host Cationic Antimicrobial Peptides and Microbial Resistance. Nat. Rev. Microbiol. 2006, 4, 529–536. [Google Scholar] [CrossRef] [Scilit]
- Mahlapuu, M.; Håkansson, J.; Ringstad, L.; Björn, C. Antimicrobial Peptides: An Emerging Category of Therapeutic Agents. Front. Cell. Infect. Microbiol. 2016, 6, 194. [Google Scholar] [CrossRef] [Scilit]
- Lazzaro, B.P.; Zasloff, M.; Rolff, J. Antimicrobial Peptides: Application Informed by Evolution. Science 2020, 368, eaau5480. [Google Scholar] [CrossRef] [Scilit]
- Wesseling, C.M.J.; Martin, N.I. Synergy by Perturbing the Gram-Negative Outer Membrane: Opening the Door for Gram-Positive Specific Antibiotics. ACS Infect. Dis. 2022, 8, 1731–1757. [Google Scholar] [CrossRef] [Scilit]
- Zhou, Y.; Peng, Y. Synergistic Effect of Clinically Used Antibiotics and Peptide Antibiotics against Gram-Positive and Gram-Negative Bacteria. Exp. Ther. Med. 2013, 6, 1000–1004. [Google Scholar] [CrossRef] [Scilit]
- Marquette, A.; Bechinger, B. Biophysical Investigations Elucidating the Mechanisms of Action of Antimicrobial Peptides and Their Synergism. Biomolecules 2018, 8, 18–40. [Google Scholar] [CrossRef] [Scilit]
- Lewis, K. The Science of Antibiotic Discovery. Cell 2020, 181, 29–45. [Google Scholar] [CrossRef] [Scilit] [PubMed]
- Cook, M.A.; Wright, G.D. The Past, Present, and Future of Antibiotics. Sci. Transl. Med. 2022, 14, eabo7793. [Google Scholar] [CrossRef] [Scilit] [PubMed]
- Zasloff, M. Magainins, a Class of Antimicrobial Peptides from Xenopus Skin: Isolation, Characterization of Two Active Forms, and Partial CDNA Sequence of a Precursor. Proc. Natl. Acad. Sci. USA 1987, 84, 5449–5453. [Google Scholar] [CrossRef] [Scilit]
- Soravia, E.; Martini, G.; Zasloff, M. Antimicrobial Properties of Peptides from Xenopus Granular Gland Secretions. FEBS Let. 1988, 228, 337–340. [Google Scholar] [CrossRef] [Scilit]
- Westerhoff, H.; Juretić, D.; Hendler, R.; Zasloff, M. Magainins and the Disruption of Membrane-Linked Free-Energy Transduction. Proc. Natl. Acad. Sci. USA 1989, 86, 6597–6601. [Google Scholar] [CrossRef] [Scilit]
- Cruciani, R.A.; Barker, J.L.; Durell, S.R.; Raghunathan, G.; Guy, H.R.; Zasloff, M.; Stanley, E.F. Magainin 2, a Natural Antibiotic from Frog Skin, Forms Ion Channels in Lipid Bilayer Membranes. Eur. J. Pharmacol. 1992, 226, 287–296. [Google Scholar] [CrossRef] [Scilit]
- Yang, Z.; Weisshaar, J.C. HaloTag Assay Suggests Common Mechanism of E. coli Membrane Permeabilization Induced by Cationic Peptides. ACS Chem. Biol. 2018, 13, 2161–2169. [Google Scholar] [CrossRef] [Scilit]
- Matsuzaki, K.; Sugishita, K.; Harada, M.; Fujii, N.; Miyajima, K. Interactions of an Antimicrobial Peptide, Magainin 2, with Outer and Inner Membranes of Gram-Negative Bacteria. Biochim Biophys. Acta—Biomembr. 1997, 1327, 119–130. [Google Scholar] [CrossRef] [Scilit]
- Overton, K.; Greer, H.M.; Ferguson, M.A.; Spain, E.M.; Elmore, D.E.; Núñez, M.E.; Volle, C.B. Qualitative and Quantitative Changes to Escherichia coli during Treatment with Magainin 2 Observed in Native Conditions by Atomic Force Microscopy. Langmuir 2019, 36, 650–659. [Google Scholar] [CrossRef] [Scilit] [PubMed]
- Formosa-Dague, C.; Duval, R.E.E.; Dague, E. Cell Biology of Microbes and Pharmacology of Antimicrobial Drugs Explored by Atomic Force Microscopy. Semin. Cell Dev. Biol. 2018, 73, 165–176. [Google Scholar] [CrossRef] [Scilit]
- Goss, J.W.; Volle, C.B. Using Atomic Force Microscopy to Illuminate the Biophysical Properties of Microbes. ACS Appl. Bio. Mater. 2019, 3, 143–155. [Google Scholar] [CrossRef] [Scilit] [PubMed]
- Matsuzaki, K.; Murase, O.; Tokuda, H.; Funakoshi, S.; Fujii, N.; Miyajima, K. Orientational and Aggregational States of Magainin 2 in Phospholipid Bilayers. Biochemistry 1994, 33, 3342–3349. [Google Scholar] [CrossRef] [Scilit]
- Wade, H.M.; Darling, L.E.O.; Elmore, D.E. Hybrids Made from Antimicrobial Peptides with Different Mechanisms of Action Show Enhanced Membrane Permeabilization. Biochim. Biophys. Acta—Biomembr. 2019, 1861, 182980. [Google Scholar] [CrossRef] [Scilit]
- Volle, C.B.; Ferguson, M.A.; Aidala, K.E.; Spain, E.M.; Núñez, M.E. Quantitative Changes in the Elasticity and Adhesive Properties of Escherichia coli ZK1056 Prey Cells During Predation by Bdellovibrio Bacteriovorus 109J. Langmuir 2008, 24, 8102–8110. [Google Scholar] [CrossRef] [Scilit] [PubMed]
- Velegol, S.B.; Logan, B.E. Contributions of Bacterial Surface Polymers, Electrostatics, and Cell Elasticity to the Shape of AFM Force Curves. Langmuir 2002, 18, 5256–5262. [Google Scholar] [CrossRef] [Scilit]
- Hutter, J.L.; Bechhoefer, J. Calibration of Atomic-force Microscope Tips. Rev. Sci. Instrum. 1993, 64, 1868–1873. [Google Scholar] [CrossRef] [Scilit]
- Arnoldi, M.; Fritz, M.; Bäuerlein, E.; Radmacher, M.; Sackmann, E.; Boulbitch, A. Bacterial Turgor Pressure Can Be Measured by Atomic Force Microscopy. Phys. Rev. E 2000, 62, 1034–1044. [Google Scholar] [CrossRef] [Scilit] [PubMed]
- Sharifian, M.; Wilhelm, M.J.; Dai, H.-L. Label-Free Optical Method for Quantifying Molecular Transport Across Cellular Membranes In Vitro. J. Phys. Chem. Lett. 2016, 7, 3406–3411. [Google Scholar] [CrossRef] [Scilit] [PubMed]
- Krieg, M.; Fläschner, G.; Alsteens, D.; Gaub, B.M.; Roos, W.H.; Wuite, G.J.; Gaub, H.E.; Gerber, C.; Dufrêne, Y.F.; Müller, D.J. Atomic Force Microscopy-Based Mechanobiology. Nat. Rev. Phys. 2018, 1, 41–57. [Google Scholar] [CrossRef] [Scilit]
- Yao, X.; Walter, J.; Burke, S.; Stewart, S.; Jericho, M.H.; Pink, D.; Hunter, R.; Beveridge, T.J. Atomic Force Microscopy and Theoretical Considerations of Surface Properties and Turgor Pressures of Bacteria. Colloids Surf. B Biomemb. 2002, 23, 213–230. [Google Scholar] [CrossRef] [Scilit]
- Rodgers, N.; Murdaugh, A. Chlorhexidine-Induced Elastic and Adhesive Changes of Escherichia coli Cells within a Biofilm. Biointerphases 2016, 11, 031011. [Google Scholar] [CrossRef] [Scilit]
- Soon, R.L.; Nation, R.L.; Harper, M.; Adler, B.; Boyce, J.D.; Tan, C.-H.; Li, J.; Larson, I. Effect of Colistin Exposure and Growth Phase on the Surface Properties of Live Acinetobacter baumannii Cells Examined by Atomic Force Microscopy. Int. J. Antimicrob. Agents 2011, 38, 493–501. [Google Scholar] [CrossRef] [Scilit]
- Vadillo-Rodriguez, V.; Beveridge, T.J.; Dutcher, J.R. Surface Viscoelasticity of Individual Gram-Negative Bacterial Cells Measured Using Atomic Force Microscopy. J. Bacteriol. 2008, 190, 4225–4232. [Google Scholar] [CrossRef] [Scilit]
- Arce, F.T.; Carlson, R.; Monds, J.; Veeh, R.; Hu, F.Z.; Stewart, P.S.; Lal, R.; Ehrlich, G.D.; Avci, R. Nanoscale Structural and Mechanical Properties of Nontypeable Haemophilus influenzae Biofilms. J. Bacteriol. 2009, 191, 2512–2520. [Google Scholar] [CrossRef] [Scilit]
- Zhang, W.; Hughes, J.; Chen, Y. Impacts of Hematite Nanoparticle Exposure on Biomechanical, Adhesive, and Surface Electrical Properties of Escherichia coli Cells. Appl. Environ. Microbiol. 2012, 78, 3905–3915. [Google Scholar] [CrossRef] [Scilit]
- Pillet, F.; Formosa-Dague, C.; Baaziz, H.; Dague, E.; Rols, M.-P. Cell Wall as a Target for Bacteria Inactivation by Pulsed Electric Fields. Sci. Rep. 2016, 6, 19778. [Google Scholar] [CrossRef] [Scilit] [PubMed]
- Stock, J.B.; Rauch, B.; Roseman, S. Periplasmic Space in Salmonella typhimurium and Escherichia coli. J. Biol. Chem. 1977, 252, 7850–7861. [Google Scholar] [CrossRef] [Scilit]
- Andrade, F.F.; Silva, D.; Rodrigues, A.; Pina-Vaz, C. Colistin Update on Its Mechanism of Action and Resistance, Present and Future Challenges. Microorganisms 2020, 8, 1716. [Google Scholar] [CrossRef] [Scilit]
- Hamel, M.; Rolain, J.-M.; Baron, S.A. The History of Colistin Resistance Mechanisms in Bacteria: Progress and Challenges. Microorganisms 2021, 9, 442. [Google Scholar] [CrossRef] [Scilit] [PubMed]
- Mortensen, N.P.; Fowlkes, J.D.; Sullivan, C.J.; Allison, D.P.; Larsen, N.B.; Molin, S.; Doktycz, M.J. Effects of Colistin on Surface Ultrastructure and Nanomechanics of Pseudomonas aeruginosa Cells. Langmuir 2009, 25, 3728–3733. [Google Scholar] [CrossRef] [Scilit]
- Mularski, A.; Wilksch, J.; Hanssen, E.; Li, J.; Tomita, T.; Pidot, S.J.; Stinear, T.; Separovic, F.; Strugnell, D. A Nanomechanical Study of the Effects of Colistin on the Klebsiella pneumoniae AJ218 Capsule. Eur. Biophys. J. 2017, 46, 351–361. [Google Scholar] [CrossRef] [Scilit]
- Su, H.-N.; Chen, Z.-H.; Song, X.-Y.; Chen, X.-L.; Shi, M.; Zhou, B.-C.; Zhao, X.; Zhang, Y.-Z. Antimicrobial Peptide Trichokonin VI-Induced Alterations in the Morphological and Nanomechanical Properties of Bacillus subtilis. PLoS ONE 2012, 7, e45818–e45828. [Google Scholar] [CrossRef] [Scilit] [PubMed]
- Fantner, G.E.; Barbero, R.J.; Gray, D.S.; Belcher, A.M. Kinetics of Antimicrobial Peptide Activity Measured on Individual Bacterial Cells Using High-Speed Atomic Force Microscopy. Nat. Nanotechnol. 2010, 5, 280–285. [Google Scholar] [CrossRef] [Scilit] [PubMed]
- Quilès, F.; Barth, D.; Peric, O.; Fantner, G.E.; Francius, G. Parietal Structures of Escherichia coli Can Impact the D-Cateslytin Antibacterial Activity. ACS Chem. Biol. 2020, 15, 2801–2814. [Google Scholar] [CrossRef] [Scilit]
- Quilès, F.; Saadi, S.; Francius, G.; Bacharouche, J.; Humbert, F. In Situ and Real Time Investigation of the Evolution of a Pseudomonas fluorescens Nascent Biofilm in the Presence of an Antimicrobial Peptide. Biochim. Biophys. Acta—Biomembr. 2016, 1858, 75–84. [Google Scholar] [CrossRef] [Scilit]
- Stocks, S. Mechanism and Use of the Commercially Available Viability Stain, BacLight. Cytom. Part A 2004, 61A, 189–195. [Google Scholar] [CrossRef] [Scilit]
- Mathelié-Guinlet, M.; Grauby-Heywang, C.; Martin, A.; Février, H.; Moroté, F.; Vilquin, A.; Béven, L.; Delville, M.-H.; Cohen-Bouhacina, T. Detrimental Impact of Silica Nanoparticles on the Nanomechanical Properties of Escherichia coli, Studied by AFM. Colloid Interface Sci. 2018, 529, 53–64. [Google Scholar] [CrossRef] [Scilit]
- Freudenthal, O.; Quilès, F.; Francius, G. Discrepancies between Cyclic and Linear Antimicrobial Peptide Actions on the Spectrochemical and Nanomechanical Fingerprints of a Young Biofilm. ACS Omega 2017, 2, 5861–5872. [Google Scholar] [CrossRef] [Scilit] [PubMed]
- Leive, L. Release of Lipopolysaccharide by EDTA Treatment of E. coli. Biochem. Biophys. Res. Commun. 1965, 21, 290–296. [Google Scholar] [CrossRef] [Scilit]
- Coughlin, R.T.; Tonsager, S.; McGroarty, E.J. Quantitation of Metal Cations Bound to Membranes and Extracted Lipopolysaccharide of Escherichia coli. Biochemistry 1983, 22, 2002–2007. [Google Scholar] [CrossRef] [Scilit]
- Amro, N.A.; Kotra, L.P.; Wadu-Mesthrige, K.; Bulychev, A.; Mobashery, S.; Liu, G. High-Resolution Atomic Force Microscopy Studies of the Escherichia coli Outer Membrane: Structural Basis for Permeability. Langmuir 2000, 16, 2789–2796. [Google Scholar] [CrossRef] [Scilit]
- Clifton, L.A.; Skoda, M.W.A.; Brun, A.P.L.; Ciesielski, F.; Kuzmenko, I.; Holt, S.A.; Lakey, J.H. Effect of Divalent Cation Removal on the Structure of Gram-Negative Bacterial Outer Membrane Models. Langmuir 2015, 31, 404–412. [Google Scholar] [CrossRef] [Scilit]
- Rosenfeld, Y.; Shai, Y. Lipopolysaccharide (Endotoxin)-Host Defense Antibacterial Peptides Interactions: Role in Bacterial Resistance and Prevention of Sepsis. Biochim. Biophys. Acta—Biomembr. 2006, 1758, 1513–1522. [Google Scholar] [CrossRef] [Scilit] [PubMed]
- Rivera, M.; Hancock, R.E.; Sawyer, J.G.; Haug, A.; McGroarty, E.J. Enhanced binding of polycationic antibiotics to lipopolysaccharide from an aminoglycoside-supersusceptible, tolA mutant strain of Pseudomonas aeruginosa. Antimicrob. Agents Chemother. 1988, 32, 649–655. [Google Scholar] [CrossRef] [Scilit]
- Pinzón-Arango, P.A.; Nagarajan, R.; Camesano, T.A. Interactions of Antimicrobial Peptide Chrysophsin-3 with Bacillus anthracis in Sporulated, Germinated, and Vegetative States. J. Phys. Chem. B 2013, 117, 6364–6372. [Google Scholar] [CrossRef] [Scilit]
- Pogoda, K.; Piktel, E.; Deptuła, P.; Savage, P.B.; Lekka, M.; Bucki, R. Stiffening of Bacteria Cells as a First Manifestation of Bactericidal Attack. Micron 2017, 101, 95–102. [Google Scholar] [CrossRef] [Scilit]
- Volle, C.B.; Ferguson, M.A.; Aidala, K.E.; Spain, E.M.; Núñez, M.E. Spring Constants and Adhesive Properties of Native Bacterial Biofilm Cells Measured by Atomic Force Microscopy. Colloids Surf. B Biointerfaces 2008, 67, 32–40. [Google Scholar] [CrossRef] [Scilit]
- Zamani, E.; Johnson, T.J.; Chatterjee, S.; Immethun, C.; Sarella, A.; Saha, R.; Dishari, S.K. Cationic Π-Conjugated Polyelectrolyte Shows Antimicrobial Activity by Causing Lipid Loss and Lowering Elastic Modulus of Bacteria. ACS Appl. Mater. Interfaces 2020, 12, 49346–49361. [Google Scholar] [CrossRef] [Scilit]
- Meincken, M.; Holroyd, D.L.; Rautenbach, M. Atomic Force Microscopy Study of the Effect of Antimicrobial Peptides on the Cell Envelope of Escherichia coli. Antimicrob. Agents Chemother. 2005, 49, 4085–4092. [Google Scholar] [CrossRef] [Scilit] [PubMed]
- Rowe-Magnus, D.A.; Kao, A.Y.; Prieto, A.C.; Pu, M.; Kao, C. Cathelicidin Peptides Restrict Bacterial Growth via Membrane Perturbation and Induction of Reactive Oxygen Species. mBio 2019, 10, e02021-19. [Google Scholar] [CrossRef] [Scilit]
- Sawyer, J.G.; Martin, N.L.; Hancock, R.E. Interaction of Macrophage Cationic Proteins with the Outer Membrane of Pseudomonas aeruginosa. Infect. Immun. 1988, 56, 693–698. [Google Scholar] [CrossRef] [Scilit]
- Sass, V.; Schneider, T.; Wilmes, M.; Körner, C.; Tossi, A.; Novikova, N.; Shamova, O.; Sahl, H.-G. Human β-Defensin 3 Inhibits Cell Wall Biosynthesis in Staphylococci. Infect. Immun. 2010, 78, 2793–2800. [Google Scholar] [CrossRef] [Scilit] [PubMed]
- Sochacki, K.A.; Barns, K.J.; Bucki, R.; Weisshaar, J.C. Real-Time Attack on Single Escherichia coli Cells by the Human Antimicrobial Peptide LL-37. Proc. Natl. Acad. Sci. USA 2011, 108, E77–E81. [Google Scholar] [CrossRef] [Scilit]
- Rangarajan, N.; Bakshi, S.; Weisshaar, J.C. Localized Permeabilization of E. coli Membranes by the Antimicrobial Peptide Cecropin A. Biochemistry 2013, 52, 6584–6594. [Google Scholar] [CrossRef] [Scilit] [PubMed]
- Agrawal, A.; Weisshaar, J.C. Effects of Alterations of the E. coli Lipopolysaccharide Layer on Membrane Permeabilization Events Induced by Cecropin A. Biochim. Biophys. Acta—Biomembr. 2018, 1860, 1470–1479. [Google Scholar] [CrossRef] [Scilit]
- Yang, Z.; Choi, H.; Weisshaar, J.C. Melittin-Induced Permeabilization, Re-Sealing, and Re-Permeabilization of E. coli Membranes. Biophys. J. 2018, 114, 368–379. [Google Scholar] [CrossRef] [Scilit]

Disclaimer/Publisher’s Note: The statements, opinions and data contained in all publications are solely those of the individual author(s) and contributor(s) and not of MDPI and/or the editor(s). MDPI and/or the editor(s) disclaim responsibility for any injury to people or property resulting from any ideas, methods, instructions or products referred to in the content. |
© 2026 by the authors. Licensee MDPI, Basel, Switzerland. This article is an open access article distributed under the terms and conditions of the Creative Commons Attribution (CC BY) license.