


Abstract
Wildfires are an increasing environmental and civil protection challenge across Southern Europe under intensifying climate variability and extreme heat conditions. This study presents a reproducible, climate-informed framework for analysing seasonal fire weather variability across Italy using the Canadian Fire Weather Index (FWI) system. The work was conducted during a Short-Term Scientific Mission funded by the NERO COST Action CA22164 at the University of Milan in September 2025. A harmonised Seasonal FWI dataset for Italy covering 2007–2024 was developed using Copernicus Climate Data Store products, Climate Data Operators (CDO), and R-based statistical workflows. Seasonal FWI metrics were spatially aggregated across 35 Italian ecoregions to evaluate temporal variability and regional fire danger patterns. Results reveal pronounced interannual variability, with mean FWI values ranging from approximately 16 in 2020 to 24 in 2016. Although no statistically significant monotonic trend was detected during 2007–2024, seasonal FWI values consistently exceeded the historical 1970–2000 baseline (~10–15), indicating a shift towards a higher fire danger regime. Figures illustrate the analysed ecoregions, regional burned area trends, and relationships between mean seasonal FWI and burned area. The openly available dataset and reproducible workflow provide a foundation for future climate-informed fire danger assessment and civil protection decision-support systems.
1. Introduction
Wildfires are becoming an increasingly critical environmental and civil protection challenge across Southern Europe, with growing impacts on ecosystems, infrastructure, economic activities, and human safety. Mediterranean regions are particularly vulnerable due to the combined effects of climate variability, prolonged droughts, extreme heat events, land-use change, and expanding wildland–urban interfaces. Recent extreme wildfire seasons across Europe have highlighted the need for improved climate-informed fire danger assessment and preparedness strategies [1]. Among the most widely adopted operational fire danger metrics, the Canadian Fire Weather Index (FWI) system provides a standardised framework for assessing the influence of meteorological conditions on fire ignition potential and propagation dynamics [2]. Although the FWI system has been extensively applied in wildfire risk studies and operational services worldwide, its harmonised integration with climate datasets and reproducible workflows at regional scales remains limited in Southern Europe, particularly for Italy.
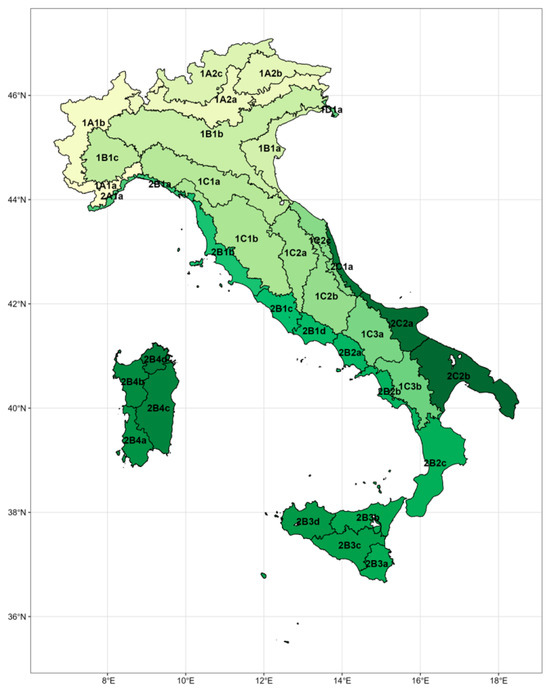
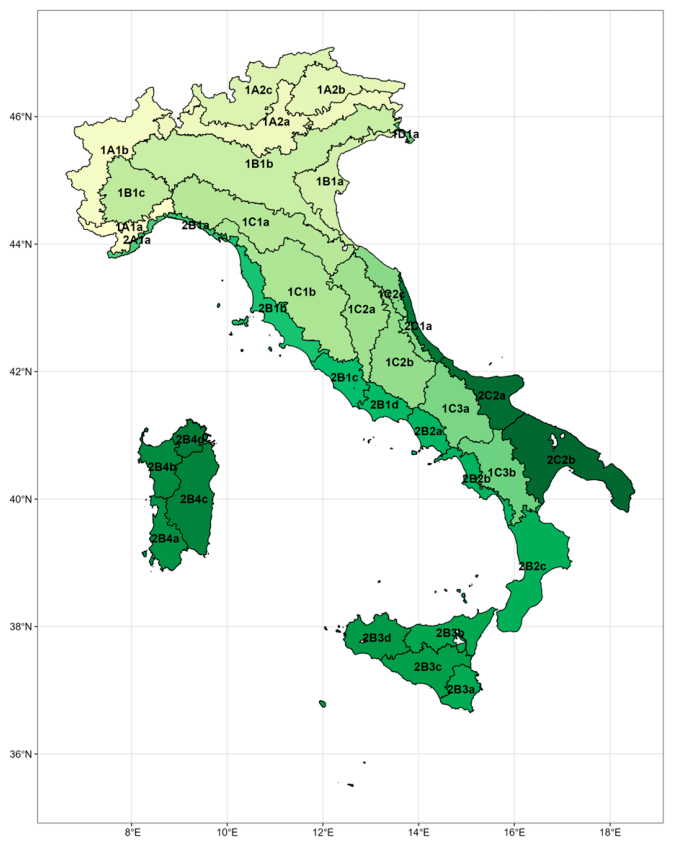
Italy represents a highly heterogeneous fire-prone environment, characterised by strong climatic gradients and contrasting fire regimes between northern, central, and southern regions. While historically higher fire activity has been concentrated in southern and insular areas, recent years have shown increasing fire occurrence and severity in regions previously considered less vulnerable. Understanding the spatial and temporal variability of fire weather conditions across Italian ecoregions is therefore essential for supporting adaptation planning and operational wildfire management. Figure 1 presents the spatial distribution of the 35 Italian ecoregions analysed in this study.
Figure 1.
Partitioning of the Italian territory into 35 terrestrial ecoregional sections (ecoregions), following [3], representing the spatial framework used to contextualise forest fire vulnerability. The color gradient is applied to visually distinguish between the 35 individual ecoregional sections, which are nested within the broader biogeographical provinces of Italy. The predictive modeling in this study targets the finer subsection level within the Alpine chain, focusing on four specific zones in northern Italy: 1A1b (Western Alps), 1A2a (Central-Eastern Alps), 1A2b (Eastern Alps), and 1A2c (Southern Limestone Alps).
This study was conducted as part of a Short-Term Scientific Mission (STSM) funded by the European Network on Extreme Fire Behaviour (NERO—COST Action CA22164 [4]) and hosted at the Forest Lab of the University of Milan under the supervision of Prof. Giorgio Vacchiano during September 2025. The principal objective was to develop a reproducible climate-informed framework for analysing seasonal fire weather variability across Italy using Copernicus climate datasets, geospatial preprocessing tools, and statistical analyses. Particular emphasis was placed on harmonising Fire Weather Index data across 35 Italian ecoregions and evaluating relationships between seasonal fire danger indicators and observed burned area patterns.
2. Methods
2.1. Climate and Geospatial Datasets
Climatic and geospatial datasets were obtained from European and national repositories, with primary emphasis on the Copernicus Climate Data Store. Seasonal NetCDF datasets covering the main fire season (June–September) were processed for the 2007–2024 period. Climate Data Operators (CDO) were used to standardise projection systems, spatial resolution, and grid structure, ensuring consistent spatial analysis across Italy’s ecological regions. The analysis focused on 35 Italian ecoregions (Figure 1) to capture regional variability in fire weather conditions and burned-area dynamics. Geospatial processing and statistical analyses were implemented using reproducible R-based workflows.
2.2. Fire Weather Index Framework and Statistical Analysis
The Canadian Fire Weather Index (FWI) system [2] was adopted as the principal indicator of seasonal fire danger. The FWI is a dimensionless numeric scale where higher values represent more severe fire weather conditions; generally, values below 10 indicate low fire danger, while values exceeding 20 to 30 signal high to extreme fire risk depending on local fuel types. The analysis considered the main FWI components, including the Drought Code (DC), Build-Up Index (BUI), Initial Spread Index (ISI), and Fire Weather Index (FWI), which collectively characterise fuel dryness and potential fire behaviour based on daily observations of temperature, relative humidity, wind speed, and 24 h precipitation.
The statistical framework included:
- Temporal and spatial aggregation: Seasonal and annual aggregation of FWI metrics across national and ecoregional scales.
- Descriptive statistics: Calculation of mean, median, and variability indicators to characterise interannual fire weather behaviour.
- Trend analysis: Linear regression and Mann–Kendall tests were applied to evaluate temporal trends in FWI metrics and burned area.
- Regression analysis: Relationships between seasonal FWI indicators and observed burned area were examined to assess the explanatory capacity of climate-driven fire weather conditions.
2.3. Reproducibility and Open Data
All workflows were designed to ensure transparency and reproducibility. The processed Seasonal Fire Weather Index dataset for Italy (2007–2024), together with supporting scripts and documentation, was openly published on Figshare [5].
3. Results and Discussion
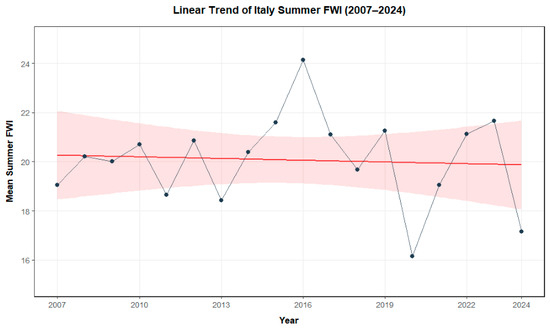
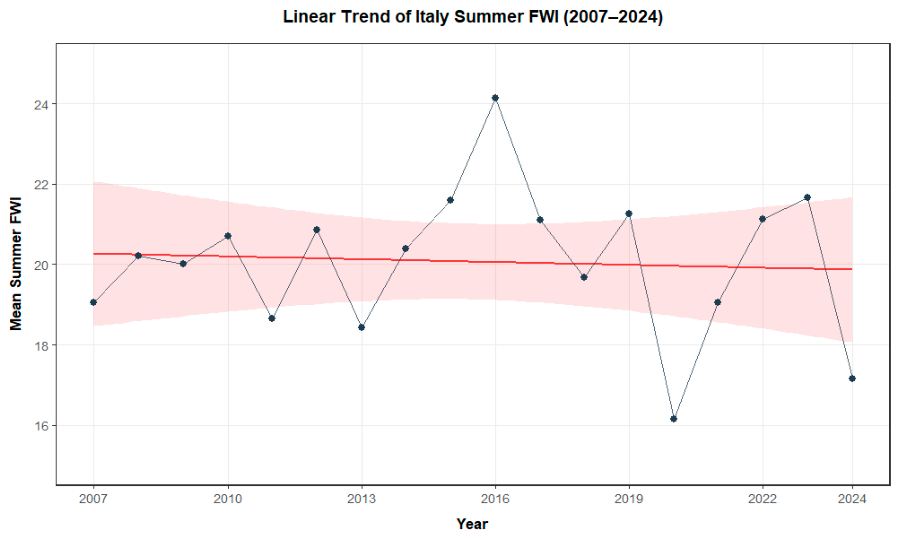
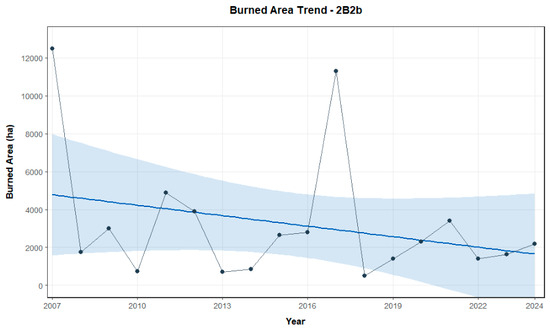
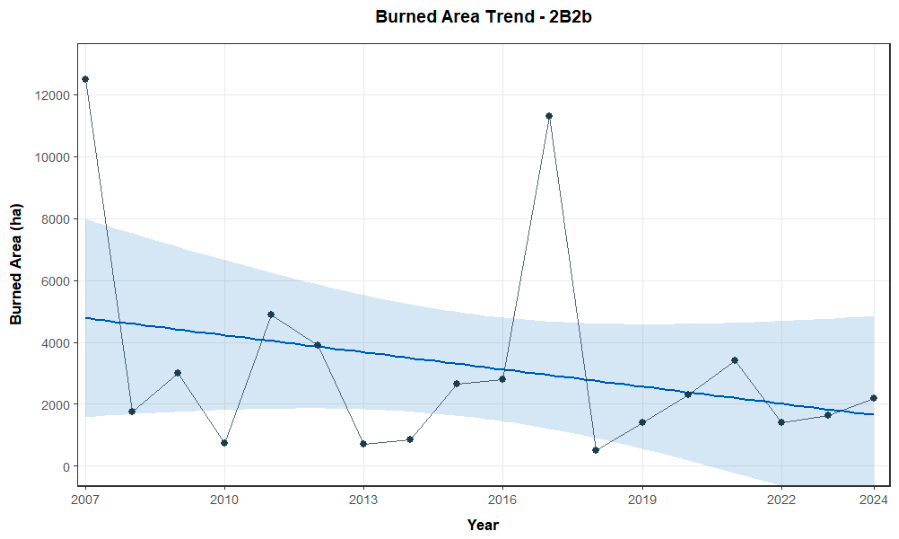
Analysis of the aggregated FWI dataset revealed substantial interannual variability in seasonal fire danger across Italy during 2007–2024. Mean seasonal FWI values ranged from approximately 16 in 2020 to 24 in 2016, indicating strong year-to-year fluctuations associated with climate variability. At the national scale, neither linear regression nor Mann–Kendall analyses identified statistically significant monotonic trends during the study period. Similar behaviour was observed across several ecoregions, suggesting that short-term oscillations and extreme seasons currently dominate observed fire weather dynamics. However, comparison with the historical 1970–2000 baseline (mean FWI approximately 10–15) indicates that contemporary fire danger conditions consistently exceed historical averages, suggesting a broader shift toward elevated fire weather conditions across Italy. On a national scale, the long-term historical trajectory of fire weather shows significant interannual variability, featuring prominent danger peaks in extreme years like 2017 and sharp declines in wetter summers like 2020, resulting in a flat overall linear baseline (Figure 2). Concurrently, the annual burned area within each ecoregion was assessed, highlighting strong downward trend components despite immense, climate-driven interannual spikes observed during high-activity fire seasons (Figure 3).
Figure 2.
Linear trend of the mean summer Fire Weather Index (FWI) in Italy from 2007 to 2024. The solid red line represents the ordinary least squares linear regression, shaded by a 95% confidence interval (light pink ribbon), demonstrating a stable long-term baseline despite pronounced interannual variability. Prominent fire danger peaks are visible in extreme seasons (e.g., 2016), contrasted by sharp declines during characteristically wetter summers (e.g., 2020).
Figure 3.
Linear trend of the annual burned area within the 2B2b ecoregion from 2007 to 2024. The solid blue line represents the ordinary least squares linear regression, shaded by a 95% confidence interval (light blue ribbon), highlighting a strong downward trend component over the long term at the ecoregional scale. This systematic decline persists despite immense, climate-driven interannual spikes observed during high-activity fire seasons, most notably at the beginning of the time series (2007) and during the extreme 2017 season.
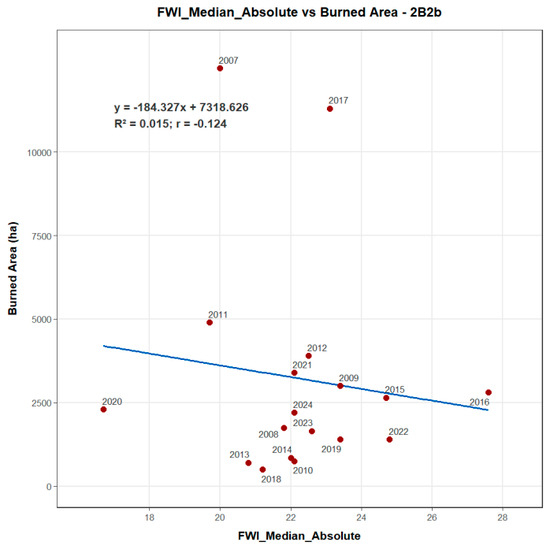
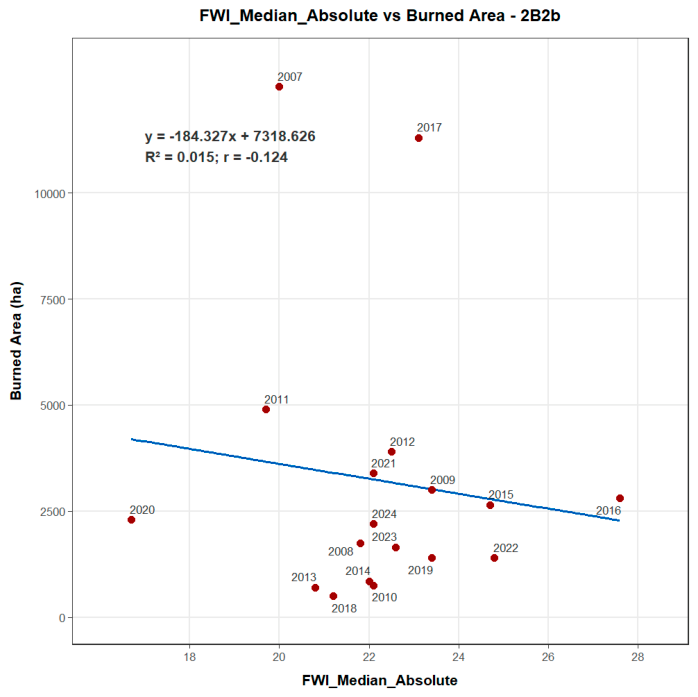
Regional analyses revealed contrasting burned-area tendencies among Italian ecoregions, including declining trends in some regions despite persistent fire weather variability. An example of a declining burned-area trend is presented in Figure 3. These differences likely reflect the combined influence of local climate variability, vegetation characteristics, land management practices, and suppression capacity. Regression analyses between FWI mean absolute values and observed burned area showed positive relationships across multiple ecoregions (or negative relationships as shown in Figure 4), supporting the relevance of FWI metrics for understanding spatial fire danger dynamics. Although fire occurrence and burned area are influenced by multiple human and environmental factors, the observed associations reinforce the operational value of climate-informed fire danger indicators for preparedness and early warning applications.
Figure 4.
Scatter plot and linear regression analysis between the median absolute Fire Weather Index (FWI) and annual burned area within the 2B2b ecoregion from 2007 to 2024. The solid blue line represents the ordinary least squares regression line. Individual data points are labelled by year, illustrating a weak, non-significant negative correlation heavily influenced by extreme anomaly years—such as the massive wildfire seasons of 2007 and 2017—which decouple from typical climate-driven fire weather expectations at this specific ecoregional scale.
The extreme seasons of 2016 and 2022 correspond with documented periods of exceptional wildfire activity across Europe [6]. These years were characterised by elevated seasonal FWI values and substantial fire impacts requiring extensive emergency response mobilisation. The results demonstrate the capacity of harmonised FWI datasets to support the identification of anomalous fire danger conditions and strengthen climate-informed preparedness strategies. The workflow developed in this study integrates Copernicus climate products, CDO-based preprocessing, and reproducible statistical analysis into a transferable framework suitable for future climate applications and operational adaptation. The openly available dataset constitutes the first harmonised multi-ecoregion Seasonal FWI assessment for Italy derived from consistent climate data sources.
4. Conclusions
This study established a reproducible climate-informed framework for analysing seasonal fire weather variability across Italy using harmonised Copernicus climate datasets and the Canadian Fire Weather Index system. Although no statistically significant national-scale trend was detected during 2007–2024, the results reveal substantial interannual variability and consistently elevated fire danger conditions relative to the historical 1970–2000 baseline. The observed relationships between seasonal FWI indicators and burned area (Figure 4) highlight the operational relevance of climate-informed fire danger assessment for wildfire preparedness and civil protection planning. Extreme fire seasons such as 2016 and 2022 further demonstrate the importance of integrating climate services into wildfire risk management frameworks. The openly published Seasonal Fire Weather Index dataset for Italy [5] provides a foundation for future research and operational applications, including the integration of long-term reanalysis datasets and climate projections (1970–2098), derivation of ecoregion-specific fire danger thresholds, and development of probabilistic seasonal outlooks. The framework is designed to support the transition from reactive wildfire response toward proactive and climate-informed preparedness strategies across Southern Europe.
Author Contributions
Conceptualization, G.V. and L.A.E.; methodology, G.V.; software, L.A.E.; validation, G.V.; formal analysis, L.A.E.; investigation, L.A.E.; resources, L.A.E.; data curation, L.A.E.; writing—original draft preparation, L.A.E.; writing—review and editing, J.P.P.; visualization, L.A.E.; supervision, G.V. All authors have read and agreed to the published version of the manuscript.
Funding
Support for this research was provided by the European Network on Extreme Fire Behaviour (NERO—COST Action CA22164), through the funding of a Short-Term Scientific Mission (STSM) conducted at the Forest Lab, Department of Agricultural and Environmental Sciences, University of Milan, under the supervision of Prof. Giorgio Vacchiano (September 2025).
Data Availability Statement
All data sets generated and analysed during the current study, along with the corresponding processing scripts [5], have been deposited in the Figshare repository and can be accessed via the following URI: https://figshare.com/articles/dataset/Seasonal_Fire_Weather_Index_Analysis_Italy_2007_2024_/30218152 (accessed on 10 February 2026).
Acknowledgments
This research was supported by the RISC_PLUS project, reference number 0031_RISC_PLUS_6_E, co-funded by the European Regional Development Fund (ERDF) under the Interreg VI-A Spain–Portugal Cooperation Programme (POCTEP) 2021–2027. Additional support was provided by FCT-Fundação para a Ciência e a Tecnologia, I.P., and by the European Commission Recovery and Resilience Facility, under the projects UID/04423/2025 (https://doi.org/10.54499/UID/04423/2025), UID/PRR/04423/2025 (https://doi.org/10.54499/UID/PRR/04423/2025), and LA/P/0101/2020 (https://doi.org/10.54499/LA/P/0101/2020).
Conflicts of Interest
The authors declare no conflicts of interest.
References
- Jolly, W.M.; Cochrane, M.A.; Freeborn, P.H.; Holden, Z.A.; Brown, T.J.; Williamson, G.J.; Bowman, D.M. Climate-induced variations in global wildfire danger from 1979 to 2013. Nat. Commun. 2015, 6, 7537. [Google Scholar] [CrossRef] [Scilit] [PubMed]
- Canadian Forest Service. Canadian Forest Fire Weather Index (FWI) System. Natural Resources Canada. 2016. Available online: https://cwfis.cfs.nrcan.gc.ca/background/summary/fwi (accessed on 15 December 2025).
- Blasi, C.; Capotorti, G.; Copiz, R.; Guida, D.; Mollo, B.; Smiraglia, D.; Zavattero, L. Classification and mapping of the ecoregions of Italy. Plant Biosyst.—Int. J. Deal. Asp. Plant Biol. 2014, 148, 1255–1345. [Google Scholar] [CrossRef] [Scilit]
- NERO—COST Action CA22164. European Network on Extreme Fire Behaviour. 2025. Available online: https://nero-network.eu/ (accessed on 10 February 2026).
- Espinosa, L.A.; Vacchiano, G. Seasonal Fire Weather Index Analysis—Italy (2007–2024). Figshare. Dataset. 2025. Available online: https://figshare.com/articles/dataset/Seasonal_Fire_Weather_Index_Analysis_Italy_2007_2024_/30218152 (accessed on 10 February 2026).
- Faivre, N.; Jin, Y.; Goulden, M.L.; Randerson, J.T. Spatially explicit comparisons of fire-induced carbon emissions from low-severity and high-severity forest fire regimes. Glob. Change Biol. 2014, 20, 2224–2235. [Google Scholar]
Disclaimer/Publisher’s Note: The statements, opinions and data contained in all publications are solely those of the individual author(s) and contributor(s) and not of MDPI and/or the editor(s). MDPI and/or the editor(s) disclaim responsibility for any injury to people or property resulting from any ideas, methods, instructions or products referred to in the content. |
© 2026 by the authors. Licensee MDPI, Basel, Switzerland. This article is an open access article distributed under the terms and conditions of the Creative Commons Attribution (CC BY) license.