Proceeding Paper

Energy, Economic, and Environmental (3-E) Analysis of Energy Recovery from Sewage Sludge in Municipal Wastewater Treatment Plants †

1
Green Sustainable Solutions, Puškarićeva ulica 15, 10250 Stupnik, Croatia
2
Faculty of Engineering, University of Rijeka, Vukovarska 58, 51000 Rijeka, Croatia
*
Author to whom correspondence should be addressed.
Presented at the 1st International Online Conference on Environment (IOCE 2026), 2–4 March 2026; Available online: https://sciforum.net/event/IOCE2026.
Environ. Earth Sci. Proc. 2026, 42(1), 14; https://doi.org/10.3390/eesp2026042014
Published: 7 July 2026
(This article belongs to the Proceedings of The 1st International Online Conference on Environments)

Abstract

The article presents an energy, economic and environmental (3-E) analysis of a reference wastewater treatment plant (WWTP) with a capacity of 200,000 population equivalent (PE). The analysis includes sewage sludge treatment, anaerobic digestion (AD), combined heat and power (CHP), and mono-incineration of solar-dried sludge. The specific investment cost for the reference WWTP is 435 €/PE. Annual costs for operation and maintenance are estimated at 26 €/(PE·y) and the energy costs are 5 €/(PE·y). The annual energy demands are 32 kWhel/(PE·y) of electricity and 14 kWhth/(PE·y) of thermal energy for digesters’ heating. For a specific sludge quantity of 20 kgDS/(PE·year), the biogas production is 245 Nm3/tDS or 5 m3/(PE·y). Biogas-driven CHP supplies 10.3 kWh/(PE·year) of electricity and 14.7 kWh/(PE·year) of thermal energy, which meets 30% of the electrical demand and 100% of the thermal energy demand. Total (capital and operation) costs of sludge mono-incineration are evaluated at 300 €/tDM or 6 €/PE. The heating value of digested and solar-dried sludge is 2 kWh/kgWM. The total cost of the solar drying system is 30 €/PE while the sludge solar drying rate is 370 kgDM/(m2·y). The environmental analysis showed that the on-site carbon footprint of the reference WWTP is 50 kgCO2eq/(PE·y), with the largest contributions arising from N2O emissions during wastewater treatment, CO2 from sludge mono-incineration, and CO2 from biogas combustion in the CHP unit.

1. Introduction

Municipal wastewater treatment plants (WWTPs) are essential urban facilities for protecting public health and water ecosystems [1], but at the same time they are also associated with substantial capital expenditure, operating costs, and strict environmental regulations [2]. Aside from wastewater treatment, WWTPs generate large amounts of sewage sludge, and managing this sludge is both energy- and cost-intensive [3]. Sewage sludge is increasingly being interpreted not just as a waste stream but also as a secondary resource containing recoverable energy, nutrients and material value [4,5]. This transition is particularly important in the European Union, where the revised urban wastewater framework places stronger emphasis on greenhouse gas reduction, circularity, and energy autonomy [6]. Within this context, sludge-to-energy pathways are attracting scientific and practical interest [7]. Previous studies have shown that anaerobic digestion, combined heat and power (CHP) using biogas, thermal or solar drying, and mono-incineration, gasification, and pyrolysis can improve the energy and resource efficiency of WWTPs [8,9]. The overall performance of sludge treatment methods depend on the plant size, the sewage sludge properties, local energy prices, regulatory context, and the degree of process integration [10]. Recent research emphasizes that sludge treatment should be assessed through integrated energy, economic, and environmental criteria [11].
Rodríguez-García et al. [12] benchmarked 24 WWTPs across six typologies using life-cycle analysis (LCA) and showed that wastewater treatment methods affect the plant environmental and economic performance. Organic matter removal plants were found to be less costly in environmental and economic terms while more demanding reuse plants exhibited higher cost and environmental impact. Kamble et al. [13] evaluated the performance of WWTPs in India and identified electricity use, effluent emissions, and heavy metals as major contributors to the overall plant impact. Soil biotechnology achieved the lowest environmental impact while the aerated lagoons presented high electricity and chemical consumption. Abdallah et al. [14] compared septic tanks, conventional gravity sewers, and small-bore sewers using a cost-integrated life-cycle approach, finding that septic tanks were the least financially feasible, the conventional gravity sewers had the largest environmental footprint while small-bore sewers were the most favored in terms of overall economic and environmental performance. Campana et al. [15] studied the energy autonomy of WWTPs, optimizing PV, wind, storage, and treatment integration, finding that a renewable energy share of 70% achieved the lowest net present cost.
A considerable amount of research has also focused on sewage sludge reduction strategies. The quantity of sewage sludge generated in WWTPs can be reduced either within the wastewater treatment line or the sludge treatment line [16]. Strategies along the wastewater treatment line include techniques such as the use of chemical uncouplers [17], microbial predation [18], membrane bioreactors (MBRs) [19], and oxidation reduction systems with oxic-settling-anaerobic (OSA) processes [20]. Strategies along the sludge treatment line include thickening, anaerobic digestion, thermal hydrolysis, ozonation, ultrasound, wet oxidation, dewatering, thermal drying, and incineration [21,22,23]. Digestion and pretreatment reduce organic solids, while dewatering and drying reduce the water content and the transport volume.
Although the literature contains extensive information on wastewater and sewage sludge treatment processes and their performance, fewer studies provide the 3-E evaluation of sewage sludge treatment methods with the investment and operational costs of WWTPs. Even fewer studies assess these aspects with the energy recovery potential, and the associated environmental impacts. The present study is motivated by the new WWTP under construction in Rijeka, Croatia, which will feature biogas production from anaerobic digestion along with sludge solar drying.

2. The WWTP Case Study

The new WWTP in Rijeka, Croatia, is planned as the central wastewater treatment facility for the city with a design capacity of 200,000 PE. The required effluent limits are 25 mgO2/L for the biological oxygen demand over 5 days (BOD5), 125 mgO2/L for the chemical oxygen demand (COD), and 35 mgDS/L for total suspended solids. The total (wastewater + infiltration) flow ranges from 42,400 m3/d in dry-weather up to 63,500 m3/d in wet-weather conditions. The average wastewater flow (infiltration excluded) is 32,650 m3/d [24].
The influent wastewater contains relatively high levels of municipal pollution. The influent design concentrations are: BOD5 285 mg/L, COD 635 mg/L, and suspended solids equal to 367 mg/L, total nitrogen 52 mg/L, and total phosphorus 9 mg/L. The corresponding daily pollutant loads are: BOD5 of 12,076 kg/d, COD of 26,918 kg/d, suspended solids equal to 15,542 kg/d, total nitrogen 2192 kg/d, and total phosphorus 380 kg/d [24].
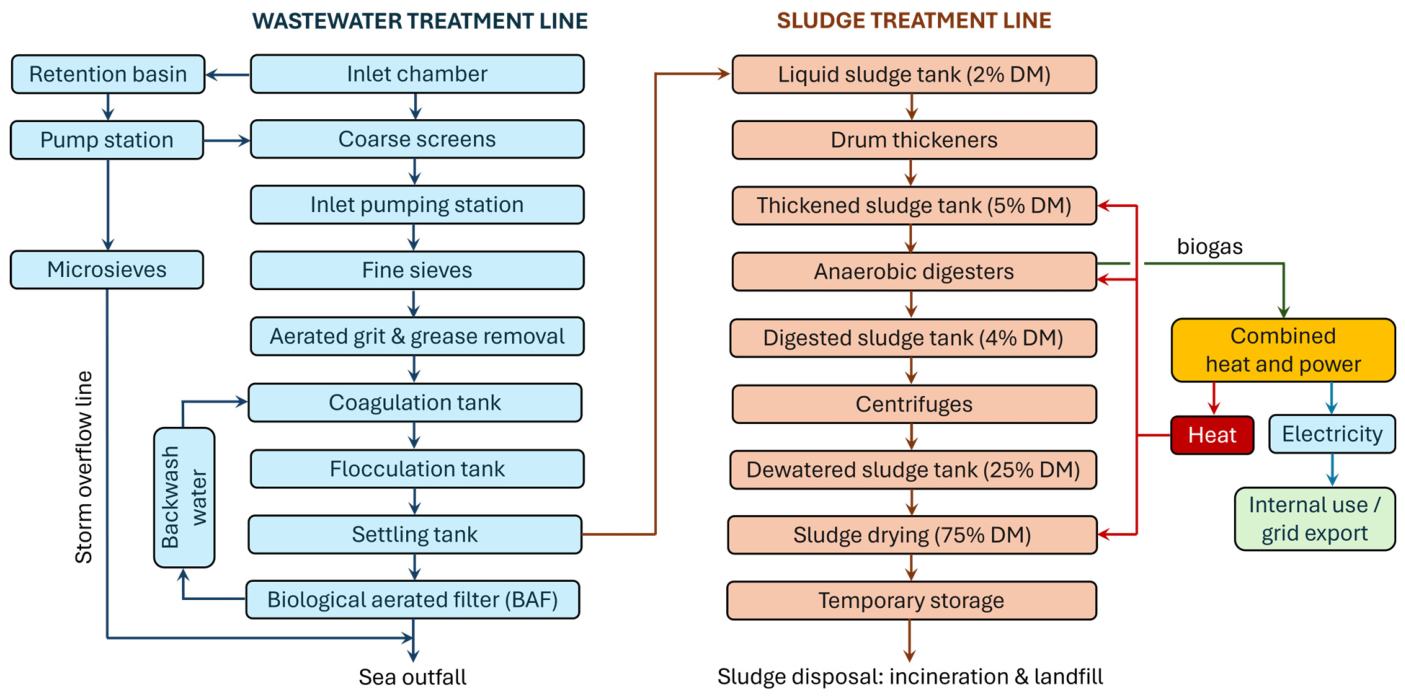
The treatment train of WWTP Rijeka is shown in Figure 1 and consists of mechanical treatment, biological treatment, sludge treatment, and marine discharge through the existing submarine outfall. Mechanical treatment includes coarse screens, an inlet pumping station, fine screens, septage reception, an aerated grit and grease chamber, and lamella primary settling tanks. In the primary treatment stage, the plant uses ferric chloride (FeCl3) for coagulation and a polymer for flocculation, which improves solid capture, lowers the load sent to biological treatment, and reduces energy demand for aeration and mixing. The selected biological process is a biological aerated filter (BAF).
Sewage sludge captured in the settling tank is first thickened and thereafter sent to the mesophilic anaerobic digesters. The planned WWTP Rijeka includes two anaerobic digesters, each with a volume of 3300 m3. Thickened sludge is stored in a 120 m3 tank while the digested sludge is stored in another 120 m3 tank. Centrifugal dewatering raises the dry matter content to 25%, after which thermal and solar drying will increase the dry matter content to 75%. In wet-weather conditions with heavy rainfall, the retention basin captures the first and most polluted runoff, allowing partial settling of suspended solids. The storm overflow activates only during intense rainfall, discharging mechanically clarified excess water into the sea, while the retained, more polluted fraction is subsequently pumped back to the main wastewater treatment line.
The biogas from anaerobic digestion runs an internal combustion engine for combined heat and power (CHP) generation to meet the energy needs of the WWTP. The recovered thermal energy is used for heating the anaerobic digesters, preheating the incoming thickened sludge and assisting sludge drying processes. The generated electricity is used to supply on-site electricity consumers or is exported to the grid. The sewage sludge production is estimated at 11 tonnes of dry matter per day, or 4000 tonnes per year (t/y). Other residuals include 1400 t/y of screenings, 634 t/y of sand, 372 t/y of grease, and 50 t/y of septage reception [24].

3. Economic Analysis

3.1. Specific Investment Cost

According to official sources, the main investment costs for the new Rijeka WWTP are €70 million VAT excluded or €87 million VAT included [25]. These costs include plant design, permitting, procurement, construction, testing, commissioning, staff training, and demonstration of operating costs during the trial operation. At a design capacity of 200,000 PE, the specific investment costs per population equivalent are 435 €/PE. A typical breakdown of capital expenditure for WWTPs is: civil construction 50%, mechanical equipment 20%, electrical and control systems 15%, engineering and design 10%, and site preparation 5% [25]. Economy-of-scale effects apply on WWTPs: as the plant capacity increases, the specific investment cost (SIC) in €/PE decreases, as determined by
S I C = S I C 0 P E P E 0 n 1 P E
In Equation (1), SIC0 and PE0 are the known costs and treatment capacity of a referent WWTP while n is the scaling exponent that describes the economy of scale and typically ranges from 0.60 to 0.80. Equation (1) can be reduced to the following form:
S I C = C 1 P E n 1 ,   where   C 1 = C 0 P E 0 n
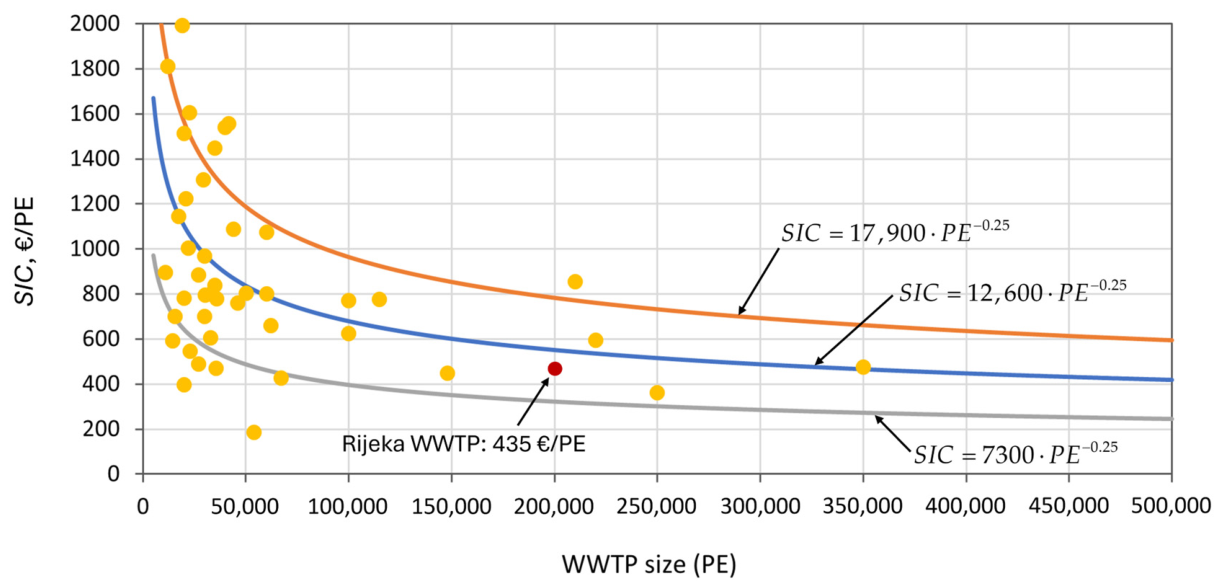
For new WWTPs in Croatia with secondary treatment, the analysis of the available data revealed that the cost scaling exponent is n = 0.75 while the multiplying constant is on average C1 = 12,600. The available data comes at high variance, and the standard deviation of the multiplying constant is σC1 = 5300. This means that 68% of WWTPs are expected to fall within the range of SIC = 7300–17,900 · PE−0.25, as shown in Figure 2. For Croatian WWTPs with secondary treatment, the average trend follows, which means that larger plants are generally more cost-efficient on a per capita basis. The planned Rijeka WWTP, at 200,000 PE and about €435/PE, lies within the expected cost range.

3.2. Operation and Maintenance Cost

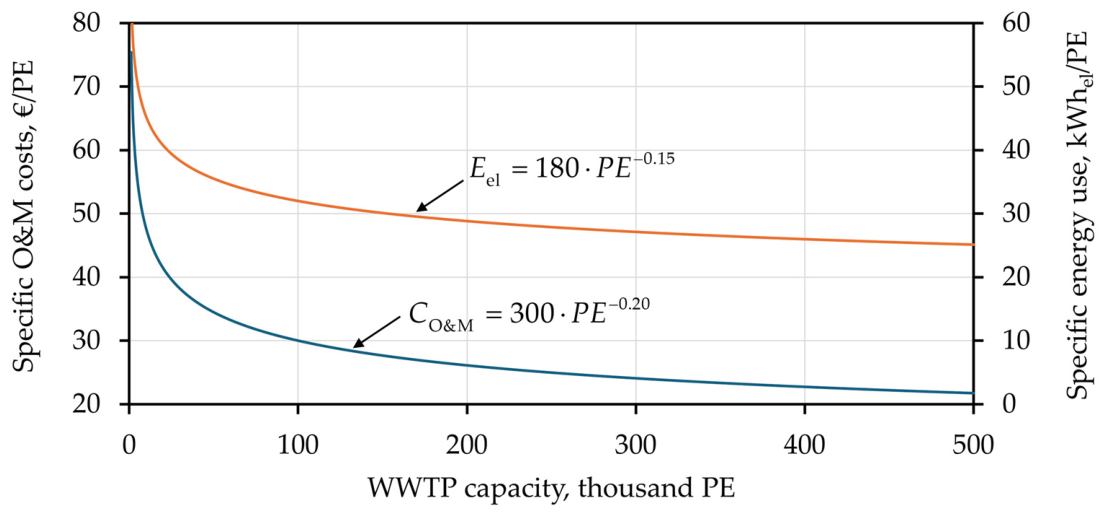
The operation and maintenance (O&M) costs of WWTPs vary with plant capacity, technologies involved, and wastewater and sludge treatment methods. An Austrian research report found median O&M costs of 20 €/(PE·year) for large WWTPs (≥100,000 PE) [26], while official Austrian statistics report annual O&M costs of 21 €/(PE·year) for WWTPs > 100,000 PE and 45 €/(PE·year) for WWTPs in the 5000–20,000 PE range [27]. For small activated sludge wastewater systems, the literature reports substantially higher O&M costs. For small plants, the average yearly O&M costs are 65–110 €/PE for WWTPs with 500 PE and 55–90 €/PE for WWTPs with 1000 PE [28]. All the above costs have been updated to 2025 price levels. Overall, these studies suggest that O&M costs for municipal WWTPs can range from around 20–30 €/PE·year for larger conventional plants to well above 50 €/PE·year for smaller facilities. This suggests that WWTP O&M costs exhibit economies of scale, similar to the specific investment cost (SIC), although data from real plants show substantial variability depending on plant size, configuration, and operating conditions. A tentative correlation between specific O&M costs and plant size is plotted in Figure 3, inspired by the correlation shown in [29]. This correlation estimates O&M costs at 26 €/(PE·y) for the Rijeka WWTP with 200,000 PE secondary treatment capacity.

4. Energy Analysis

4.1. Energy Consumption

4.1.1. Electricity Demand

The energy demand of WWTPs accounts for 10–30% of total O&M costs. The energy costs of WWTPs depend on plant size, wastewater properties and load, sewage sludge treatment methods, and energy recovery from biogas. Typical energy use range between 0.5 and 2.0 kWh/m3 of treated wastewater, and the specific energy use is in the range of 20–45 kWh/PE for modern facilities [30,31]. A representative breakdown of electricity demand is 0.3–0.5 kWh/(PE·y) for screens, 1.7–2.2 kWh/(PE·y) for aerated grit chambers, 0.4–0.6 kWh/(PE·y) for primary sedimentation, 17.2–25.8 kWh/(PE·y) for aeration tanks, 1.2–2.3 kWh/(PE·y) for secondary sedimentation, 0.7–1.1 kWh/(PE·y) for sludge thickening, and 3.0–4.0 kWh/(PE·y) for sludge dewatering [29]. Excluding water pumping, the total electricity demand range is between 24.5 kWh/(PE·y) and 36.5 kWh/(PE·y).
In the EU-27, electricity prices for non-household consumers in 2025 were mostly in the range between 0.12 and 0.20 €/kWh. The EU-27 average electricity price for non-household consumers was 0.156 €/kWh, which is close to the average non-household electricity price in Croatia in 2025 (0.16 €/kWh) [32]. The corresponding WWTP energy costs, excluding wastewater pumping, are estimated at 3.82–5.69 €/(PE·y) when the average electricity price is assumed, which corresponds to an energy cost share of 15–22% in total O&M costs. For the WWTP Rijeka, the specific electrical energy use is 29 kWhel/(PE·y), estimated from the correlation plotted in Figure 3. Thus, the specific cost of electricity is 5.1 €/(PE·y), which represents 20% of the specific O&M costs.

4.1.2. Thermal Energy Demand for Anaerobic Digestion

The thermal energy demand of the anaerobic digesters can be estimated from the annual sludge production of 4000 tDM. Assuming thickened sludge with 5% dry matter (i.e., 50 kgDM/m3), the annual sludge flow to the digesters is 80,000 m3/y, or 219.2 m3/day. With a hydraulic retention time of 25 days, the required digester volume is 5480 m3. Increasing the digester volume by 20% for the gas space, the total volume becomes 6600 m3, or two digesters of 3300 m3 each. Based on the calculated digester surface (2 × 1072 m2), a heat transfer coefficient of 0.5 W/(m2K), and an average year-round temperature difference of 25 K between the digesters and the ambient, the annual heat loss is estimated at 235,000 kWh/year, or 1.2 kWh/(PE·y) for a plant size of 200,000 PE. Even more thermal energy is required to heat the thickened sludge entering the anaerobic digesters. This thermal energy is calculated as 2310 MWh/y (11.6 kWh/(PE·y)), taking that the sludge flow quantity is 80,000 m3/y, and assuming a sludge density of 1050 kg/m3, a specific heat capacity of 1.1 Wh/(kg·K) and a temperature difference of 25 K between incoming stream and the digesters. The total specific thermal energy demand for anaerobic digestion is therefore 12.8 kWh/(PE·y), and with an additional 10% allowance for auxiliary and distribution losses, the overall thermal energy requirement is approximately 14 kWh/(PE·y).

4.1.3. Thermal Energy Demand for Sludge Drying

Following anaerobic digestion and the breakdown of organic matter, the sludge quantity is assumed to decrease by 35%, from 4000 tDM/year of raw sludge to 2600 tDM/year of digested sludge. After centrifugal dewatering, the digested sludge has a dry matter content of 25%. Drying 1 kgDM of sludge from a dry matter content of 25% to 75% requires the removal of 2.7 kg of water. The thermodynamic minimum thermal energy for the evaporation of 1 kg of water is 2500 kJ/kgw or 0.7 kWhth/kgw. However, real drying systems operate with thermal energy demands close to qw = 1 kWhth/kgw [33]. Consequently, the specific thermal energy demand for sewage sludge thermal drying can be estimated from
q drying = q w 1 DM in 1 DM out = 1   kWh th kg w 1 0 . 25 1 0.75 kg w kg DM = 2.7   kWh th kg DM
Assuming that the specific sewage sludge load is 20 kgDM/(PE·y) and that after anaerobic digestion this quantity is reduced to 13 kgDM/(PE·y), the thermal energy demand for sludge drying is 35.1 kWhth/(PE·y). If supplied by natural gas, this amount of thermal energy is equivalent to 3.5 m3/(PE·y). As an alternative, solar drying can be considered for new WWTPs. Assuming an average annual solar irradiation of 1300 kWh/(m2·y) and a surface solar absorptivity of 0.80, the achievable evaporation rate is 1000 kgw/(m2·y), assuming again 1 kWhth/kgw. This indicates that drying 2600 tDM/year of digested sludge from 25% to 75% dry matter would require the removal of approximately 7000 tw/y, which corresponds to a total solar drying area of 7000 m2. On this basis, the specific solar drying capacity for sewage sludge is estimated at 370 kgDM/(m2·y).
In solar drying systems, electricity is needed to power the air ventilation system and the sludge turning, mixing, and distributing device. The reported specific electricity consumption per tonne of evaporated water is 20–40 kWh/tw for natural ventilation while forced ventilation may increase the electricity consumption to 60–120 kWh/tw. A pilot-scale solar sludge drying system in Greece consumed 83 kWh/tw, of which 52 kWh/tw was used by the exhaust ventilator and indoor mixing fans, while 31 kWh/tw was used by the turning drum [34]. The authors also report a specific water evaporation rate of 1460 kgw/(m2·y) and a sludge drying rate of 390 kgDM/(m2·y). The specific installation costs were estimated at 24 €/PE [34], which updates into 32 €/PE in present-day prices. Thus, in the case of the Rijeka WWTP, the addition of solar drying would increase the specific electricity demand by 3 kWhel/(PE·y), raising the total specific electricity consumption to 32 kWhel/(PE·y).
In the summer, sewage sludge can be dried almost completely, reaching 90% dry matter content. On the other hand, in spring and autumn, partial drying is achieved, with dry matter contents ranging from 50% to 75%. In winter, low temperatures reduce the drying performance, and supplementary fossil fuel drying may be necessary.

4.2. Energy Recovery

4.2.1. Biogas from Anaerobic Digestion

For the Rijeka WWTP, with a design capacity of 200,000 PE, the annual sewage sludge production is estimated at 4000 tDM, corresponding to 55 gDM/(PE·day), or 20 kgDM/(PE·y). The sludge stabilization option is anaerobic digestion (AD) with a retention time of 25 days and an operating temperature of 38 °C. The sludge is assumed to contain 70% organic dry matter (ODM), of which 50% is biodegradable [35,36], resulting in an estimated dry matter reduction of 35% during digestion. Assuming a specific biogas yield of 0.7 m3 per kg of dry organic matter reduced [37,38], the specific biogas production is 245 m3/tDM, equivalent to approximately 5 m3/(PE·y), obtained as 0.7 × (0.35 × 4,000,000)/200,000.
The biogas properties and composition are summarized in Table 1, as reported in [34]. The biogas is utilized in a combined heat and power (CHP) unit. Assuming an average lower heating value of 6 kWh/m3, and a conversion efficiency of 35% for electricity and 50% for heat, the resulting specific outputs are 2.1 kWhel/m3 and 3 kWhth/m3. For the annual sludge production of 4000 tDM, this corresponds to an annual energy generation of 2058 MWhel/y and 2940 MWhth/y. Expressed per one PE, the AD + CHP energy recovery unit could supply 10.3 kWhel/(PE·y) and 14.7 kWhth/(PE·y). Relative to the previously calculated energy demands of 32 kWhel/(PE·y) for electricity consumers and 14 kWhth/(PE·y) for anaerobic digester heating, the recovered energy from the AD + CHP could supply about 30% of the WWTP’s electricity demand and enable full thermal self-sufficiency.

4.2.2. Thermal Energy from Sludge Incineration

With an annual sewage sludge quantity of 4000 tDM, and assuming that the sludge contains 70% organic dry matter (ODM), the initial ODM is 2800 t/y. If 50% of this organic fraction is degraded during anaerobic digestion, the degraded portion equals 1400 t/y. This means that after anaerobic digestion, the remaining organic dry matter is 1400 t/y within a total dry matter quantity of 2600 tDM/y. Finally, this means that anaerobic digestion reduces the organic dry matter fraction from an initial value of 0.70 down to 0.538. The lower heating value of the digested sludge can be determined from the ODM and DM after anaerobic digestion and solar drying, using the empirical correlation from [39]
L H V w = 21.7 ( ± 0.56 ) O D M 17.7 ( ± 1.1 ) ( 1 D M ) ,   MJ / kg WM
Using ODM = 0.538 and DM = 0.75 as inputs for the above correlation returns an LHV on a wet basis of 6.7–7.8 MJ/kgWM, corresponding to 2.0 kWh/kgWM, on average. Digested sludge typically achieves heating values lower than those of raw sludge; however, it can still be used in thermal recovery processes such as mono-incineration or co-combustion. The costs of sludge mono-incineration in Croatia are estimated between 200 and 400 €/tDM, depending on plant capacity, sludge composition and the resulting requirements for flue gases treatment, ash disposal costs, and local regulations. On average, the total (capital and operation) costs of sludge mono-incineration are estimated at 300 €/tDM or 6 €/PE, which is comparable to the costs found in Austria and Germany [40,41].

5. Environmental Analysis

The greenhouse gases emission expressed in tonnes of CO2 equivalent are reported in Table 2. The specific electricity consumption is 32 kWhel/(PE·y) while the carbon intensity of the grid-mix electricity in Croatia is 109 gCO2/kWhel [42]. The methane slip is assumed as 100 gCH4/(PE·y), based on representative values within the reported ranges for the main sources of methane slip [43]: dissolved methane in wastewater (1–5 gCH4/PE·y), digester leaks (10–30 gCH4/PE·y), CHP unit leaks (5–20 gCH4/PE·y), and sewage sludge storage (10–100 gCH4/PE·y). Emissions from biogas combustion were calculated assuming a biogas composition of 60% CH4 and 40% CO2, giving 1.97 kgCO2/m3 of biogas. For sludge incineration, the carbon content in the digested sludge is assumed as 50% of the organic dry matter content, yielding 0.50 × 0.538 = 269 gC/kgDM, which converts into CO2 according to the stoichiometric ratio 44/12 = 3.667 kgCO2/kgC. The emissions of N2O from wastewater treatment is 1.6% of total influent total nitrogen (2192 kgN/day), corresponding to an emission factor of 0.016 kgN2O/kgN, according to IPCC guidelines [44]. Finally, N2O emissions from sewage sludge incineration are assumed as 1.2 kgN2O/tDM, following IPCC guidelines for incineration of municipal solid waste and sewage sludge [45].
The largest emission categories are N2O emissions from wastewater treatment (34%), sludge incineration (25.7%), and biogas combustion (19.4%), followed by N2O from sludge incineration (8.3%), indirect CO2 emissions from grid electricity (7.0%) and unintentional methane slip (5.6%). The estimated total annual emissions is nearly 10,000 tonnes of CO2 equivalent, corresponding to a specific carbon footprint of 50 kgCO2eq/(PE·y). This value is consistent with those found in the literature. One study of Scandinavian WWTPs found carbon footprints in the range between 7 and 108 kgCO2eq/(PE·y) [46]. Another study determined that WWTPs in Greece operate, on average, with an on-site carbon footprint of 56.5 kgCO2eq/(PE·y) and an off-site carbon footprint of 16.9 kgCO2eq/(PE·y) [47]. In addition to greenhouse gases, the WWTP operation is associated with other air- and water-related pollutants. The main air-related pollutants are odor compounds such as hydrogen sulfide (H2S), ammonia, mercaptans, and amines. These are monitored at the air ventilation discharge. Water-related pollutants are monitored at the plant outlet and include wastewater pH, conductivity, dissolved oxygen, COD, BOD5, settleable solids and total suspended solids, total nitrogen, ammonia, phosphorus, orthophosphates, total fats and mineral oils, and anionic and cationic detergents.

6. Comparison with Other WWTP Case Studies

The performance of the Rijeka WWTP is comparable to other WWTP case studies found in the literature. The electricity demand of 32 kWh/(PE·y) corresponds to 0.54 kWh/m3 when expressed relatively to the average wastewater flow of 60 m3/(PE·y). This value is equal to the average value found in large WWTPs in Greece, 32 kWh/(PE·y), but lower than the values found in small WWTPs, 48–137 kWh/(PE·y) [47]. It is also within the range of electricity demand of WWTPs in Poland, between 0.25 and 1.06 kWh/m3 [48]. The Castiglione Torinese WWTP in Italy (2.7 million PE) reports an annual electricity demand of 24.7 kWhel/(PE·y) and a thermal energy demand of 18.2 kWhth/(PE·y) [49], while the thermal energy demand for the sludge line at the WWTP Rijeka is 14 kWhth/(PE·y). The electricity demand of the Rijeka WWTP is within the energy performance range of modern WWTPs and closer to larger and more energy efficient plants. In Rijeka, anaerobic digestion and CHP supplies 30% of the electricity demand and 100% of thermal energy. This is comparable to the values found in the literature. For instance, biogas-generated electricity typically supplies between 25 and 60% of the electricity demand in WWTPs [50].
The estimated 435 €/PE for Rijeka is consistent with the European range for medium-to-large secondary-treatment plants [11,25], while the projected O&M cost of 26 €/(PE·y) aligns with the Austrian benchmark of 20–21 €/(PE·y) reported by Haslinger et al. [26] and the official Austrian statistics for plants > 100,000 PE [27,41]. The estimated solar drying rate of 370 kgDM/(m2·y) is typical for the solar drying performance under Mediterranean climate conditions [34]. Specific installation costs of solar drying are estimated at 32 €/PE. Environmentally, the estimated carbon footprint of 50 kgCO2eq/(PE·y) is similar to the Greek average of 56.5 kgCO2eq/(PE·y) [47] and the 73–91 kgCO2eq/(PE·y) range that Ranieri et al. [51] reported for aerobic and anaerobic WWTPs in southern Italy. Marinelli et al. [52] also documented specific carbon footprints between 40 and 200 kgCO2eq/(PE·y) across 12 Italian plants of different sizes. The proposed integration of anaerobic digestion, combined heat and power, solar drying, and mono-incineration at the Rijeka WWTP produces a 3-E evaluation score that is competitive in the European contexts.

7. Conclusions

The energy, economic, and environmental (3-E) assessment of the new WWTP in Rijeka, Croatia, revealed that the specific investment costs are 435 €/PE while the energy demand is 32 kWh/(PE·y) of electricity and 14 kWh/(PE·y) of thermal energy. For an annual sewage sludge production of 4000 tDM, anaerobic digestion produces 245 m3/tDM of biogas, and the associated CHP supplies 10.3 kWhel/(PE·y) and 14.7 kWhth/(PE·y), which is sufficient to cover 30% of the plant electricity demand and the full thermal demand for digester heating. The environmental analysis showed an on-site carbon footprint of 50 kgCO2eq/(PE·y), with the dominant contributors being N2O emissions from wastewater treatment, CO2 from sludge mono-incineration, and CO2 from biogas combustion in the CHP unit. Future research could include off-site greenhouse gas emissions, alternative treatment methods for sewage sludge such as co-incineration, pyrolysis, gasification, and nutrient recovery. However, it should be noted that, as regulatory requirements tighten and sludge treatment moves towards more advanced energy and nutrient recovery technologies, WWTPs will be facing higher operating and compliance costs that could be transferred to final users through higher water supply and wastewater tariffs.

Author Contributions

Conceptualization, D.Đ. and P.B.; methodology, P.B. and I.W.; software, D.Đ.; validation, I.W. and V.D.; formal analysis, V.D. and P.B.; investigation, I.W. and P.B.; resources, D.Đ.; data curation, P.B.; writing—original draft preparation, D.Đ.; writing—review and editing, P.B. and V.D.; visualization, I.W.; supervision, V.D.; project administration, I.W.; funding acquisition, D.Đ. All authors have read and agreed to the published version of the manuscript.

Funding

The authors acknowledge the institutional support of University of Rijeka, Faculty of Engineering. The authors are grateful for the support provided through the research grants UNIRI-IZ-25-186 (Sustainable Energy Solutions for Emission Reduction in Maritime Transport and Ports) and UNIRI-IZ-25-271 (Fuel Cell Integration into Ship Power Systems) within the funding scheme European Union—NextGenerationEU. The funding institution was not involved in the study design, collection, analysis, interpretation of data, the writing of this article or the decision to submit it for publication.

Institutional Review Board Statement

Not applicable.

Informed Consent Statement

Not applicable.

Data Availability Statement

All data necessary to reproduce and verify the results of this study is included in the article.

Conflicts of Interest

Author Dinko Đurđević is the founder of the company Green Sustainable Solutions d.o.o. The work presented here forms part of the research conducted for his PhD thesis carried out at the Faculty of Engineering, University of Rijeka, Croatia. The remaining authors declare that the research was conducted in the absence of any commercial or financial relationships that could be construed as a potential conflict of interest.

Abbreviations

The following abbreviations are used in this manuscript:
ADAnaerobic digestion
BAFBiological aerated filter
BOD5Biochemical oxygen demand over 5 days
CHPCombined heat and power
CODChemical oxygen demand
DMDry matter
LCALife-cycle analysis
LHVLower heating value
O&MOperation and maintenance
ODMOrganic dry matter
PEPopulation equivalent
SICSpecific investment cost
WMWet matter
WWTPWastewater treatment plant

References

  1. Shamshad, J.; Ur Rehman, R. Innovative approaches to sustainable wastewater treatment: A comprehensive exploration of conventional and emerging technologies. Environ. Sci. Adv. 2025, 4, 189–222. [Google Scholar] [CrossRef]
  2. Obaideen, K.; Shehata, N.; Sayed, E.T.; Abdelkareem, M.A.; Mahmoud, M.S.; Olabi, A.G. The role of wastewater treatment in achieving sustainable development goals (SDGs) and sustainability guideline. Energy Nexus 2022, 7, 100112. [Google Scholar] [CrossRef]
  3. Gallego-Valero, L.; Moral-Parajes, E.; Román-Sánchez, I.M. Wastewater Treatment Costs: A Research Overview through Bibliometric Analysis. Sustainability 2021, 13, 5066. [Google Scholar] [CrossRef]
  4. Capodaglio, A.G.; Callegari, A. Energy and resources recovery from excess sewage sludge: A holistic analysis of opportunities and strategies. Resour. Conserv. Recycl. Adv. 2023, 19, 200184. [Google Scholar] [CrossRef]
  5. Lima, D.; Appleby, G.; Li, L. A Scoping Review of Options for Increasing Biogas Production from Sewage Sludge: Challenges and Opportunities for Enhancing Energy Self-Sufficiency in Wastewater Treatment Plants. Energies 2023, 16, 2369. [Google Scholar] [CrossRef]
  6. Capodaglio, A.G. Energy Audits and Energy Efficiency of Urban Wastewater Systems, Following UWWTP Directive 2024/3019. Water 2025, 17, 2049. [Google Scholar] [CrossRef]
  7. Nkuna, S.G.; Olwal, T.O.; Chowdhury, S.P.D.; Ndambuki, J.M. A review of wastewater sludge-to-energy generation focused on thermochemical technologies: An improved technological, economical and socio-environmental aspect. Clean. Waste Syst. 2024, 7, 100130. [Google Scholar] [CrossRef]
  8. Yang, M.; Vander Elst, M.; Smets, I.; Zhang, H.; Li, S.; Baeyens, J.; Deng, Y. Reviewing Improved Anaerobic Digestion by Combined Pre-Treatment of Waste-Activated Sludge (WAS). Sustainability 2024, 16, 6419. [Google Scholar] [CrossRef]
  9. Bianchini, A.; Bonfiglioli, L.; Pellegrini, M.; Saccani, C. Sewage sludge drying process integration with a waste-to-energy power plant. Waste Manag. 2015, 42, 159–165. [Google Scholar] [CrossRef] [PubMed]
  10. Đurđević, D.; Žiković, S.; Blecich, P. Sustainable Sewage Sludge Management Technologies Selection Based on Techno-Economic-Environmental Criteria: Case Study of Croatia. Energies 2022, 15, 3941. [Google Scholar] [CrossRef]
  11. Cicekalan, B.; Kosar, S.; Cingoz, S.; Eyit, N.; Evren Ersahin, M.; Ozgun, H. Techno-economic and environmental assessment of different municipal wastewater treatment systems. J. Water Process Eng. 2023, 53, 103822. [Google Scholar] [CrossRef]
  12. Rodríguez-García, G.; Molinos-Senante, M.; Hospido, A.; Hernández-Sancho, F.; Moreira, M.T.; Feijoo, G. Environmental and economic profile of six typologies of wastewater treatment plants. Water Res. 2011, 45, 5997–6010. [Google Scholar] [CrossRef] [PubMed]
  13. Kamble, S.; Singh, A.; Kazmi, A.; Starkl, M. Environmental and economic performance evaluation of municipal wastewater treatment plants in India: A life cycle approach. Water Sci. Technol. 2019, 79, 1102–1112. [Google Scholar] [CrossRef] [PubMed]
  14. Abdallah, M.; Shanableh, A.; Elshazly, D.; Feroz, S. Techno-economic and environmental assessment of wastewater management systems: Life cycle approach. Environ. Impact Assess. Rev. 2020, 82, 106378. [Google Scholar] [CrossRef]
  15. Campana, P.E.; Mainardis, M.; Moretti, A.; Cottes, M. 100% renewable wastewater treatment plants: Techno-economic assessment using a modelling and optimization approach. Energy Convers. Manag. 2021, 239, 114214. [Google Scholar] [CrossRef]
  16. Wang, Q.; Wei, W.; Gong, Y.; Yu, Q.; Li, Q.; Sun, J.; Yuan, Z. Technologies for reducing sludge production in wastewater treatment plants: State of the art. Sci. Total Environ. 2017, 587–588, 510–521. [Google Scholar] [CrossRef] [PubMed]
  17. Fang, F.; Hu, H.-L.; Qin, M.-M.; Xue, Z.-X.; Cao, J.-S.; Hu, Z.-R. Effects of metabolic uncouplers on excess sludge reduction and microbial products of activated sludge. Bioresour. Technol. 2015, 185, 1–6. [Google Scholar] [CrossRef] [PubMed]
  18. Bhadrecha, P.; Singh, S.; Kumari, I.; Bhatia, D. Biological and Thermo-chemical Treatment Technologies for Sustainable Sludge Management. In Sustainable Management and Utilization of Sewage Sludge; Rajput, V.D., Yadav, A.N., Jatav, H.S., Singh, S.K., Minkina, T., Eds.; Springer: Cham, Switzerland, 2022; pp. 97–123. [Google Scholar] [CrossRef]
  19. Mofatto, P.M.B.; Cosenza, A.; Di Trapani, D.; Mannina, G. Reducing wasted sewage sludge from wastewater treatment: Comparison of two membrane bioreactor pilot plants. J. Water Process Eng. 2024, 58, 104847. [Google Scholar] [CrossRef]
  20. Di Costanzo, N.; Carraturo, F.; Salamone, M.; Aliberti, F.; Masi, S.; Caniani, D.; Mancini, I.M.; Pirozzi, F.; Esposito, G.; Di Capua, F. Single-stage C-N-P removal and ultra-low net sludge production driven by cyclic oxygen exposure and side-stream acidogenesis in an intermittent-aeration IFAS-OSA system. Bioresour. Technol. 2026, 454, 134766. [Google Scholar] [CrossRef] [PubMed]
  21. Ferrentino, R.; Langone, M.; Fiori, L.; Andreottola, G. Full-Scale Sewage Sludge Reduction Technologies: A Review with a Focus on Energy Consumption. Water 2023, 15, 615. [Google Scholar] [CrossRef]
  22. Hii, K.; Baroutian, S.; Parthasarathy, R.; Gapes, D.J.; Eshtiaghi, N. A review of wet air oxidation and thermal hydrolysis technologies in sludge treatment. Bioresour. Technol. 2014, 155, 289–299. [Google Scholar] [CrossRef] [PubMed]
  23. Bougrier, C.; Albasi, C.; Delgenès, J.P.; Carrère, H. Effect of ultrasonic, thermal and ozone pre-treatments on waste activated sludge solubilisation and anaerobic biodegradability. Chem. Eng. Process. Process Intensif. 2006, 45, 711–718. [Google Scholar] [CrossRef]
  24. Elektroprojekt d.d. Environmental Impact Study of the Public Drainage System of the Rijeka Agglomeration; Elektroprojekt d.d.: Zagreb, Croatia, 2015; Available online: https://www.eib.org/attachments/registers/160971353.pdf (accessed on 16 April 2026).
  25. N1info. HRK 522.6m Contract for Wastewater Processing Plant in Rijeka Signed. 28 December 2021. Available online: https://n1info.hr/english/news/hrk-522-6m-contract-for-wastewater-processing-plant-in-rijeka-signed/ (accessed on 16 April 2026).
  26. Haslinger, J.; Lindtner, S.; Krampe, J. Operating costs and energy demand of wastewater treatment plants in Austria: Benchmarking results of the last 10 years. Water Sci. Technol. 2016, 74, 2620–2626. [Google Scholar] [CrossRef] [PubMed]
  27. Federal Ministry of Agriculture and Forestry, Climate and Environmental Protection, Regions and Water Managementy. Sewage Treatment Plants in Austria. Available online: https://www.bmluk.gv.at/en/topics/water/water-quality-and-water-protection/sewage-treatment-plants-in-austria-.html (accessed on 16 April 2026).
  28. Rizzo, A.; Bresciani, R.; Martinuzzi, N.; Masi, F. French Reed Bed as a Solution to Minimize the Operational and Maintenance Costs of Wastewater Treatment from a Small Settlement: An Italian Example. Water 2018, 10, 156. [Google Scholar] [CrossRef]
  29. Wendland, A. Lesson C2: Operation Costs of Wastewater Treatment Plants; EMWATER E-Learning Course, Project Funded by the European Union: Ahrensburg, Germany, 2003; Available online: https://kh.aquaenergyexpo.com/wp-content/uploads/2023/01/Lesson-C2-Operation-Costs-Of-Wastewater-Treatment-Plants.pdf (accessed on 16 April 2026).
  30. Hamawand, I. Energy Consumption in Water/Wastewater Treatment Industry—Optimisation Potentials. Energies 2023, 16, 2433. [Google Scholar] [CrossRef]
  31. Masło, A.; Czarnota, J.; Szaja, A.; Szulzyk-Cieplak, J.; Łagód, G. The Enhancement of Energy Efficiency in a Wastewater Treatment Plant through Sustainable Biogas Use: Case Study from Poland. Energies 2020, 13, 6056. [Google Scholar] [CrossRef]
  32. Eurostat. Electricity Prices for Non-Household Consumers—Biannual Data; European Commission: Luxembourg, 2025; Available online: https://ec.europa.eu/eurostat/databrowser/view/nrg_pc_205/default/table?lang=en (accessed on 16 April 2026).
  33. Đurđević, D.; Blecich, P.; Jurić, Ž. Energy Recovery from Sewage Sludge: The Case Study of Croatia. Energies 2019, 12, 1927. [Google Scholar] [CrossRef]
  34. Mathioudakis, V.L.; Kapagiannidis, A.G.; Athanasoulia, E.; Paltzoglou, A.D.; Melidis, P.; Aivasidis, A. Sewage Sludge Solar Drying: Experiences from the First Pilot-Scale Application in Greece. Dry. Technol. 2013, 31, 519–526. [Google Scholar] [CrossRef]
  35. Posligua, P.; Peñaherrera, M.; Villegas, E.; Banchón, C. Gravimetric evolution during sewage sludge biostabilization. J. Ecol. Eng. 2018, 19, 76–85. [Google Scholar] [CrossRef]
  36. Yeneneh, A.M.; Sen, T.K.; Kayaalp, A.; Ang, H.M. Effect of primary sludge to waste activated sludge mixing ratio on anaerobic digester performance. Desalin. Water Treat. 2017, 71, 79–84. [Google Scholar] [CrossRef]
  37. Mukawa, J.; Pająk, T.; Rzepecki, T.; Banaś, M. Energy Potential of Biogas from Sewage Sludge after Thermal Hydrolysis and Digestion. Energies 2022, 15, 5255. [Google Scholar] [CrossRef]
  38. Dauknys, R.; Mažeikienė, A. Research of parameters affecting sludge digestion process. Water Environ. J. 2018, 32, 179–185. [Google Scholar] [CrossRef]
  39. Komilis, D.; Kissas, K.; Symeonidis, A. Effect of organic matter and moisture on the calorific value of solid wastes: An update of the Tanner diagram. Waste Manag. 2014, 34, 249–255. [Google Scholar] [CrossRef] [PubMed]
  40. Morello, R.; Di Capua, F.; Esposito, G.; Pirozzi, F.; Fratino, U.; Spasiano, D. Sludge minimization in mainstream wastewater treatment: Mechanisms, strategies, technologies, and current development. J. Environ. Manag. 2022, 319, 115756. [Google Scholar] [CrossRef] [PubMed]
  41. Amann, A.; Weber, N.; Krampe, J.; Rechberger, H.; Zoboli, O.; Zessner, M. Operation and performance of Austrian wastewater and sewage sludge treatment as a basis for resource optimization. Water 2021, 13, 2998. [Google Scholar] [CrossRef]
  42. Energy Institute Hrvoje Požar. Energy in Croatia 2024: Annual Report; Energy Institute Hrvoje Požar: Zagreb, Croatia, 2026; Available online: https://eihp.hr/wp-content/uploads/2026/01/Energija-u-HR-2024_web.pdf (accessed on 17 April 2026).
  43. Schaum, C.; Fundneider, T.; Cornel, P. Analysis of methane emissions from digested sludge. Water Sci. Technol. 2016, 73, 1599–1607. [Google Scholar] [CrossRef] [PubMed]
  44. Bartram, D.; Short, M.D.; Ebie, Y.; Farkas, J. Chapter 6. IPCC 2019 Refinement to the 2006 IPCC Guidelines for National Greenhouse Gas Inventories; IPCC: Geneva, Switzerland, 2019; Available online: https://www.ipcc-nggip.iges.or.jp/public/2019rf/pdf/5_Volume5/19R_V5_6_Ch06_Wastewater.pdf (accessed on 17 April 2026).
  45. IPCC. Incineration and Open Burning of Waste. In 2006 IPCC Guidelines for National Greenhouse Gas Inventories; Eggleston, H.S., Buendia, L., Miwa, K., Ngara, T., Tanabe, K., Eds.; IGES: Hayama, Japan, 2006; Volume 5, Chapter 5, pp. 5.1–5.26. Available online: https://www.ipcc-nggip.iges.or.jp/public/2006gl/pdf/5_Volume5/V5_5_Ch5_IOB.pdf (accessed on 17 April 2026).
  46. Gustavsson, D.J.; Tumlin, S. Carbon footprints of Scandinavian wastewater treatment plants. Water Sci. Technol. 2013, 68, 887–893. [Google Scholar] [CrossRef] [PubMed]
  47. Goliopoulos, N.; Mamais, D.; Noutsopoulos, C.; Dimopoulou, A.; Kounadis, C. Energy Consumption and Carbon Footprint of Greek Wastewater Treatment Plants. Water 2022, 14, 320. [Google Scholar] [CrossRef]
  48. Masłoń, A.; Czarnota, J.; Szaja, A.; Szulzyk-Cieplak, J.; Łagód, G. Assessment of Energy Self-Sufficiency of Wastewater Treatment Plants—A Case Study from Poland. Energies 2024, 17, 1164. [Google Scholar] [CrossRef]
  49. Gandiglio, M.; Lanzini, A.; Soto, A.; Leone, P.; Santarelli, M. Enhancing the Energy Efficiency of Wastewater Treatment Plants through Co-digestion and Fuel Cell Systems. Front. Environ. Sci. 2017, 5, 70. [Google Scholar] [CrossRef]
  50. Sarpong, G.; Gude, V.G. Codigestion and combined heat and power systems energize wastewater treatment plants—Analysis and case studies. Renew. Sustain. Energy Rev. 2021, 144, 110937. [Google Scholar] [CrossRef]
  51. Ranieri, E.; D’Onghia, G.; Ranieri, F.; Lopopolo, L.; Gregorio, S.; Ranieri, A.C. Performance of wastewater treatment plants in emission of greenhouse gases. Bioresour. Technol. 2024, 404, 130897. [Google Scholar] [CrossRef] [PubMed]
  52. Marinelli, E.; Radini, S.; Foglia, A.; Lancioni, N.; Piasentin, A.; Eusebi, A.L.; Fatone, F. Validation of an evidence-based methodology to support regional carbon footprint assessment and decarbonisation of wastewater treatment service in Italy. Water Res. 2021, 207, 117831. [Google Scholar] [CrossRef] [PubMed]
Figure 1. Wastewater and sewage sludge treatment lines of the studied WWTP.
Eesp 42 00014 g001
Figure 2. Specific investment costs (SICs) of Croatian WWTPs with secondary treatment.
Eesp 42 00014 g002
Figure 3. Specific operation and maintenance (O&M) costs and specific energy use of WWTPs.
Eesp 42 00014 g003
Table 1. Biogas properties and composition.
Biogas properties
lower heating value20–25 MJ/m3
explosion limit in air6–12%
self-ignition temperature650–750 °C
density1.0–1.2 kg/m3
Biogas composition
methane (CH4)55–70%
carbon dioxide (CO2)30–45%
hydrogen sulfide (H2S)0.5–1.0%
ammonia (NH3)0.05–0.10%
water vapor (H2O)1–5%
Table 2. Greenhouse gas emissions from WWTP Rijeka.
Emission CategorySpecific ValueMultiplierCarbon EquivalentEmissions, tCO2eq/y
CO2—electricity consumption32 kWh/PE200,000 PE109 gCO2/kWhel697.6
CH4—methane slip100 gCH4/PE200,000 PE28 kgCO2/kgCH4560.0
CO2—biogas combustion in CHP 245 m3/tDM 4000 tDM/y1.97 kgCO2/m31930.6
CO2—sludge incineration269 gC/kgDM2600 tDM/y3.667 kgCO2/kgC2564.7
N2O—wastewater treatment0.016 kgN2O/kgN2192 kgN/d265 kgCO2/kgN2O3392.3
N2O—sludge incineration1.2 kgN2O/tDM2600 tDM/y265 kgCO2/kgN2O826.8
Total emissions9972.0 tCO2eq/y
Specific emissions50 kgCO2eq/(PE·y)
Disclaimer/Publisher’s Note: The statements, opinions and data contained in all publications are solely those of the individual author(s) and contributor(s) and not of MDPI and/or the editor(s). MDPI and/or the editor(s) disclaim responsibility for any injury to people or property resulting from any ideas, methods, instructions or products referred to in the content.