


Abstract
The present study (1) examined sex- and language-based measurement invariance of the science self-efficacy scale using PISA 2006 and 2015 U.S. data (N = 11,323) and (2) evaluated six large language models (ChatGPT, DeepSeek, Grok, Copilot, MetaAI, Gemini) in generating invariance approximations from prompt content and pre-existing model knowledge. Multigroup confirmatory factor analysis (MG-CFA) established empirical invariance benchmarks across sex and language groups. The same six LLMs were prompted to generate plausible fit-index values (CFI, RMSEA) and invariance decisions without access to empirical response data. Approximation discrepancy and agreement with the MG-CFA benchmarks were assessed using RMSE, MAE, Cronbach’s α and intraclass correlation coefficients (ICCs). MG-CFA supported full measurement invariance across sex and language groups in both cycles. In contrast, LLMs showed strong apparent consistency for CFI (α = 0.857) but poor convergence with empirical data (single-measure ICC = 0.302 for CFI, 0.024 for RMSEA). Discrepancies were often large enough to affect invariance interpretations and the models often overestimated model fit while producing invariance decisions that were not always aligned with the empirical MG-CFA benchmarks. Findings support the science self-efficacy scale’s cross-group validity but caution that current off-the-shelf LLMs, when prompted to generate plausible psychometric approximations without empirical data, produce unreliable outputs for high-stakes psychometric decisions. Implications, limitations and future directions are discussed.
1. Introduction
Sex and language gaps in STEM fields remain a persistent concern (e.g., Aizawa, 2024; Beckmann & Fervers, 2024) and the importance of ensuring equity and fairness in educational assessments has received increased attention (Appels, 2024). These gaps could be influenced by a variety of factors, including but not limited to societal norms, educational opportunities and psychological constructs (e.g., Verdugo-Castro et al., 2022), such as science self-efficacy (e.g., Aizawa, 2024; Miles & Naumann, 2021). Grounded in Bandura’s theory of self-efficacy (e.g., Bandura, 1977), science self-efficacy is defined as an individual’s belief in their capacity to successfully execute tasks and solve problems within the domain of science. Science self-efficacy has been shown to be a significant predictor of academic and non-academic STEM outcomes where higher science self-efficacy is usually associated with positive outcomes (e.g., Ballen et al., 2017; Sakellariou & Fang, 2021). While prior research has established the importance of measurement invariance for the science self-efficacy construct (e.g., Uysal & Arıkan, 2018), the present study leverages these established invariance findings as a critical benchmark. However, it is crucial to articulate the precise nature of the task being evaluated. The present study does not provide the raw PISA data to the LLMs for computational analysis. Rather, the models are prompted to provide realistic estimates based on the prompt content and their pre-existing model knowledge. The core contribution of the present study lies not in replicating these known invariance patterns but in using them as empirical benchmarks to evaluate whether large language models (LLMs) generate plausible psychometric approximations that align with data-driven MG-CFA results. This reframing is essential because it addresses the timely question of whether these models generate empirically reliable psychometric approximations when data access is unavailable or restricted (Ray, 2023). This inquiry is particularly critical given the potential for LLMs to generate superficially coherent but factually incorrect conclusions in validity argumentation (Xue & Appleton, 2026; Fan et al., 2026), a phenomenon that poses significant risks for high-stakes educational and psychological measurement contexts.
According to Bandura (1997), an individual’s beliefs about their abilities are influenced by their personal (e.g., sex) and ecological (e.g., culture) background. As such, a sex and language gap is present in science self-efficacy where females typically report lower science self-efficacy, similar to non-native English speakers (e.g., Ardasheva et al., 2018; Miles & Naumann, 2021). Measurement invariance is one approach to addressing the sex and language gaps in science self-efficacy (e.g., Kane, 2013), as it allows valid comparisons between sex groups regarding their science self-efficacy and it ascertains that a measure of science self-efficacy operates similarly across different populations (e.g., sex or language) (Liou & Lin, 2021; Vandenberg & Lance, 2000). Kane’s (2013) validation argument framework guides the methodological rationale of the present study, particularly the evaluation of whether score interpretations are appropriate across diverse populations and whether the properties of scores support the intended interpretations and uses (Cook et al., 2015; Kane, 2013).
Large-scale assessments such as PISA provide extensive data sources to understand and to assess student performance at different levels. Additionally, PISA 2006 and PISA 2015 cycles particularly focused on the science domain which enables comprehensive examinations of science-specific contextual factors (e.g., science self-efficacy) of adolescents (OECD, 2009, 2017). Therefore, the present study sought to examine the sex- and language-related measurement invariance for U.S. adolescents who participated in PISA 2006 and PISA 2015.
The use of LLMs for psychometric tasks is an emerging area of research. Prior work has shown that generative AI may assist with test development, item review and some forms of preliminary psychometric judgment (H. Li et al., 2025; Pereira et al., 2024). However, these applications differ substantially from formal measurement analysis. In the present study, the LLMs were not provided with raw PISA data, item-level response matrices or covariance matrices, nor were they asked to execute statistical code. Instead, they were prompted to generate plausible CFI, RMSEA and measurement invariance decisions based on their pre-trained knowledge and the information contained in the prompt. Thus, the LLM task is best understood as a test of knowledge-based psychometric approximation rather than a test of statistical computation or formal evidence synthesis (Marshall et al., 2020; Ray, 2023).
Measurement invariance provides a useful test case for this type of AI benchmarking because the analytic framework is highly standardized and central to validity evidence based on internal structure (Gómez-Benito et al., 2018). Configural, metric, scalar and strict invariance are routinely evaluated using fit indices and change-in-fit criteria such as ΔCFI and ΔRMSEA (Browne & Cudeck, 1993; Chen, 2007; Hu & Bentler, 1999; Vandenberg & Lance, 2000). This standardization allows LLM-generated estimates to be compared directly with empirical MG-CFA benchmarks. If LLMs can approximate these outcomes accurately, they may have limited value as preliminary tools for generating hypotheses or orienting users to possible psychometric patterns. If they cannot, their outputs may create an “illusion of expertise” (Puccio et al., 2025) or “illusion of consensus” (Z. Li et al., 2026; Wang et al., 2022) by providing confident but empirically unsupported conclusions.
Recent research has raised concerns that LLMs can generate coherent but factually incorrect outputs in technical and validity-related contexts (Bender et al., 2021; Fan et al., 2026; Roberts et al., 2024; Xue & Appleton, 2026). This concern is especially important in educational and psychological measurement where claims about measurement invariance can influence whether group comparisons are considered valid. The present study therefore benchmarks six publicly available LLMs (i.e., ChatGPT, DeepSeek, Grok, Microsoft Copilot, MetaAI and Gemini) against empirical MG-CFA results from PISA 2006 and 2015. The goal is not to determine whether LLMs can perform measurement invariance analysis or replace statistical analysis. CFI, RMSEA and changes in these indices are data-dependent statistics that require empirical response data, covariance matrices or model output. Rather, the present study evaluates whether LLMs nevertheless generate plausible numerical approximations and invariance decisions from pre-trained knowledge alone and whether those outputs correspond to empirical MG-CFA benchmarks. Thus, the latent capability evaluated here is not formal statistical estimation, but empirical calibration of data-absent psychometric approximations, namely, whether LLMs’ plausible-looking numerical outputs and invariance decisions are aligned with a study-specific empirical benchmark. The present study aims to evaluate whether LLM-generated psychometric approximations align with empirical MG-CFA benchmarks and to clarify the risks of relying on plausible but unverified AI-generated outputs in psychometric decision-making. In the present study, the MG-CFA analyses serve as the empirical benchmark rather than the primary methodological novelty. Establishing measurement invariance of the PISA science self-efficacy scale across sex and language groups is necessary because it provides the data-driven standard against which the LLM-generated estimates can be evaluated. Therefore, the main contribution of the present study is the second component which is to test whether general-purpose LLMs produce empirically accurate or merely plausible-looking psychometric approximations when they are not given the underlying item-level data, covariance matrices or statistical output. This distinction is important because an LLM that produces plausible but inaccurate fit indices or invariance decisions could mislead researchers who use AI tools for rapid evidence synthesis, literature reviews or preliminary psychometric judgment. Grounded in this benchmark-and-evaluation framework, the following research questions have guided the present study:
- RQ1. What empirical measurement invariance benchmarks are established for the science self-efficacy scale across sex and language groups in PISA 2006 and 2015 using multigroup confirmatory factor analysis (MG-CFA)?
- RQ2. How accurately do six widely available large language models (ChatGPT, DeepSeek, Grok, Copilot, MetaAI and Gemini) approximate measurement invariance outcomes for the science self-efficacy scale from prompt content and pre-existing model knowledge when compared with the empirical MG-CFA benchmarks?
- RQ3. To what degree do the LLMs converge with one another and agree with the MG-CFA benchmarks in their estimated fit indices and invariance decisions?
2. Methods
2.1. Participants
The present study utilized data from both U.S. cohorts of 15- and 16-year-olds in two PISA cycles (Table 1) with a total sample of 11,323 participants: 5611 from the 2006 cycle and 5712 from the 2015 cycle. Of the participants, 49.38% self-reported their sex as female (n = 2771) and 50.60% as male (n = 2839) in PISA 2006 and 49.96% self-reported as female (n = 2854) and 50.04% as male (n = 2858) in PISA 2015. In PISA 2006, 86.65% of the participants indicated their primary language as English (n = 4862), 10.82% reported another language (N = 607) and 2.53% did not report any language (n = 142) and in PISA 2015, 80.53% indicated their primary language as English (n = 4600), 18.57% as another language (n = 1061) and 0.86% did not report any language (n = 51). Ethical approval is not applicable to the present study, as the data that supported the present study were publicly available in the PISA 2006 and PISA 2015 data repositories, as well as AI-generated.
Table 1.
Demographic characteristics of U.S. participants in PISA 2006 and 2015.
2.2. Science Self-Efficacy in PISA 2006 and PISA 2015
PISA 2006 and PISA 2015 have been the only PISA cycles where science self-efficacy has been measured (OECD, 2009, 2017). Science self-efficacy in PISA 2006 and PISA 2015 (Table 2) was measured by using the same eight items in which the participants were required to respond to how well they would perform in given science tasks (OECD, 2009, 2017). Sample items included: “Recognize the science question that underlies a newspaper report on a health issue” and “Discuss how new evidence can lead you to change your understanding about the possibility of life on Mars.” A four-point response scale that comprised “1 = I could do this easily”, “2 = I could do this with a bit of effort”, “3 = I would struggle to do this on my own” and “4 = I couldn’t do this” was used. McDonald’s (1999) omega (ω) for internal consistency for the total scale was ω = 0.87 in PISA 2006 and ω = 0.90 in PISA 2015.
Table 2.
Items of the science self-efficacy scale in PISA 2006 and PISA 2015.
2.3. Data Preprocessing
The datasets that were analyzed for the present study were obtained from the publicly available PISA 2006 and PISA 2015 data repositories. Missing data were handled using fully conditional specification imputation with one completed dataset and ten iterations (Enders et al., 2018; Van Buuren, 2007). This procedure was used to create a complete analytic dataset for the MG-CFA benchmark models. However, because only one imputed dataset was used, imputation uncertainty was not propagated into the subsequent measurement invariance analyses. Accordingly, the MG-CFA results should be interpreted as study-specific empirical benchmarks based on the stated preprocessing decisions. Sex variable was re-coded as 0 = male and 1 = female. Similarly, the language status variable was re-coded as 0 = other language and 1 = English. Final student sampling weights were applied in the MG-CFA analyses to account for unequal selection probabilities and to improve the representativeness of parameter estimates. However, the MG-CFA models did not fully incorporate the complete PISA complex sampling design through replicate weights or a fully design-based SEM procedure. Therefore, the reported CFA fit indices and invariance comparisons should be interpreted as weighted, model-based estimates. The hierarchical structure of the data was considered conceptually because students were nested within schools, but school clustering was not explicitly modeled in the MG-CFA framework (Kline, 2016; OECD, 2017).
2.4. Data Analytic Approach
The datasets that were analyzed for the present study were obtained from the publicly available PISA data repository (https://www.oecd.org/en/about/programmes/pisa/pisa-data.html, 9 February 2026). A multigroup confirmatory factor analysis (MG CFA) was performed in R (R Core Team, 2026) using the lavaan (Rosseel, 2012) and semTools (Jorgensen et al., 2022) packages. The final student sampling weight was incorporated in the MG-CFA models, but replicate weights were not used. Therefore, standard errors and fit statistics should be interpreted within the weighted model-based CFA framework rather than as fully design-based PISA estimates. Although the science self-efficacy items in PISA 2006 and PISA 2015 used a four-category ordinal response scale, the indicators were treated as approximately continuous and estimated using maximum likelihood. This decision was made for several reasons. First, the sample sizes were large in both cycles and prior simulation work suggests that treating Likert-type indicators as continuous can be acceptable when items have four or more response categories and the goal is to evaluate broad factor-structure and invariance patterns (Rhemtulla et al., 2012; Robitzsch, 2020). Second, maximum likelihood estimation has been used in prior large-scale assessment studies examining measurement invariance with PISA-type questionnaire scales (Ding et al., 2022; Munck et al., 2018). Third, the present study required a consistent empirical benchmark across cycles, groups and invariance levels for comparison with the LLM-generated CFI and RMSEA estimates. Therefore, the continuous-indicator ML approach was retained for the primary MG-CFA analyses and the empirical benchmarks should be interpreted as continuous-indicator MG-CFA benchmarks rather than ordinal threshold-based invariance results.
Model fit was evaluated using the comparative fit index (CFI) and the root mean square error of approximation (RMSEA). These two indices were selected because they were the fit indices requested from the LLMs and therefore served as the common basis for comparing LLM-generated approximations with the empirical MG-CFA benchmark. The CFI was defined as:
where and are the chi-square statistic and degrees of freedom for the target model and and are the corresponding values for the null (independence) model. The RMSEA was computed as:
where is the sample size.
To assess measurement invariance across sex and language groups, we tested a sequence of increasingly constrained models: configural (same factor structure across groups), metric (equal factor loadings), scalar (equal intercepts) and strict (equal residual variances). The change in fit between nested models was evaluated using the magnitude of change in CFI and RMSEA between successive models. Following Chen’s (2007) recommendations, invariance was considered established when changes in model fit remained within the recommended thresholds, namely |ΔCFI| < 0.010 and |ΔRMSEA| < 0.015. Because the present study used these values for threshold-based invariance decisions, the interpretation focused on the size of the change rather than the direction of the change.
AI-based Analytical Approach. Complementing the traditional MG-CFA, an AI-based prompting approach adapted from H. Li et al. (2025) was implemented to generate knowledge-based approximations of measurement invariance outcomes (also see Pereira et al., 2024). This procedure was not intended to perform formal measurement invariance analysis because the LLMs were not given raw response data, covariance matrices or statistical model output. The LLMs used were DeepSeek, ChatGPT, Grok, Microsoft Copilot, Meta AI and Gemini. All models were accessed through their default consumer-facing web interfaces in December 2025. Because these systems were accessed through consumer interfaces rather than APIs, backend model identifiers, temperatures, top-p, seed values and other decoding parameters were not always visible or user-controllable. No browsing, retrieval tools, file uploads, PISA datasets, covariance matrices or statistical output were used. To ensure ecological validity and reflect common user accessibility, the default and unpaid versions of these models were used. The selection of these six specific models was guided by their broad public availability and representation of distinct developer ecosystems (i.e., OpenAI, DeepSeek, xAI, Microsoft, Meta and Google) where they captured a cross-section of current consumer-facing LLM capabilities. The present study does not aim to provide an exhaustive inventory of all available LLMs. Rather, it constitutes an initial and proof-of-concept exploration intended to demonstrate the potential and variability of LLM-generated knowledge-synthesized approximations of measurement invariance outcomes. Consequently, certain prominent models, such as Claude (Anthropic), were not included due to practical constraints in access and the present study’s deliberate focus on a manageable and illustrative set of models rather than a comprehensive benchmarking effort.
A standardized prompting protocol was employed for all models to ensure consistency. No PISA datasets, covariance matrices, statistical outputs or full technical report files were uploaded to the LLMs. The models received only the standardized text prompt reproduced below, including the item wording and response scale. The interaction began with the query: “Do you understand the concept of measurement invariance across sex and language in ordinal scales?” without providing the datasets to the LLMs. Upon confirmation, the following prompt was provided:
“You will act as a psychometric expert. Your task is to estimate measurement invariance for the science self-efficacy scale used in PISA 2006 and 2015 for the United States.
Refer to the following documents: PISA 2006 Technical Report and PISA 2015 Technical Report. These reports contain full details on the science self-efficacy items, the four point response scale and the sampling design.
Here’s the background:
PISA 2006 and 2015 focused heavily on science. The science self-efficacy scale consists of the same eight items in both cycles. Students responded on a four-point scale:
1 = “I could do this easily”
2 = “I could do this with a bit of effort”
3 = “I would struggle to do this on my own”
4 = “I couldn’t do this”
Your task is as follows:
For U.S. participants in PISA 2006 and separately for PISA 2015, estimate the following model fit indices (CFI and RMSEA):
1. For the overall sample (all students).
2. For females and males separately.
3. For English speakers and speakers of other languages separately.
Then, for sex and language groups separately, estimate CFI and RMSEA for each level of measurement invariance:
• Configural invariance (same factor structure)
• Metric invariance (equal factor loadings)
• Scalar invariance (equal intercepts)
• Strict invariance (equal residual variances)
Using your estimates, compute ΔCFI and ΔRMSEA between successive invariance levels (e.g., metric vs. configural, scalar vs. metric, strict vs. scalar). Based on Chen’s (2007) criteria (|ΔCFI |< 0.010 and ΔRMSEA < 0.015), state whether each level of invariance is established.
Important note:
I understand you cannot provide exact empirical values. Give realistic estimates based on your knowledge of typical fit indices for well-behaved scales in large samples.
Here are the eight science self-efficacy items:
• [Item 1] Recognize the science question that underlies a newspaper report on a health issue.
• [Item 2] Explain why earthquakes occur more frequently in some areas than in others.
• [Item 3] Describe the role of antibiotics in the treatment of disease.
• [Item 4] Identify the science question associated with the disposal of garbage.
• [Item 5] Predict how changes to an environment will affect the survival of certain species.
• [Item 6] Interpret the scientific information provided on the labelling of food items.
• [Item 7] Discuss how new evidence can lead you to change your understanding about the possibility of life on Mars.
• [Item 8] Identify the better of two explanations for the formation of acid rain.
Now proceed with your estimations.”
Although the prompt referred to the PISA reports, these reports were not uploaded or provided as full-text documents. The reports are publicly available online and the reference to them was intended only to orient the models toward the relevant public documentation. Thus, the LLMs relied on the prompt content and any pre-existing knowledge embedded in the models, not on supplied empirical files or statistical outputs. The AI-generated outputs for CFI, RMSEA and their changes (ΔCFI, ΔRMSEA) across invariance levels were systematically recorded for each model and each PISA cycle. It is necessary to address the issue of output variability given the stochastic nature of LLM text generation. For the present study, a single query was issued to each model per condition. This design decision was intentional and aligned with the exploratory and proof-of-concept objectives of the present research, as it does not seek to train or fine-tune LLMs for specialized psychometric tasks, nor does it aim to establish the within-model reliability of LLM outputs through repeated sampling. Instead, the single-query approach reflects a realistic and end-user scenario in which a researcher or practitioner might pose a question to a publicly available LLM and receive a single and seemingly authoritative response. Characterizing the variability across multiple independent runs falls outside the scope of this initial demonstration of LLM potential and limitations while being methodologically valuable for future research. This approach is consistent with early-stage exploratory evaluations of LLM capabilities in other domains where single-inference assessments provide a first look at model behavior before more resource-intensive repeated-measures designs are justified (Abdurahman et al., 2025; H. Li et al., 2025; Roberts et al., 2024). Future investigations should systematically examine the stability of LLM invariance estimates through multiple query iterations and assess the impact of temperature and other generation parameters.
Evaluation. To evaluate convergence and divergence between the AI-estimated values and the empirical MG-CFA results, three related but conceptually distinct quantities were considered: estimation accuracy, consistency and absolute agreement. The MG-CFA results were treated as study-specific empirical benchmarks derived from the analytic pipeline described above, not as an uncontested ground truth. First, the AI-generated fit indices and invariance decisions were tabulated alongside the MG-CFA benchmarks to allow qualitative comparisons of whether invariance was claimed versus empirically established.
Approximation discrepancy was evaluated using the root mean square error (RMSE) and mean absolute error (MAE) which quantify how far the LLM-generated plausible fit-index values were from the empirical MG-CFA benchmarks. These quantities should be interpreted as indices of empirical calibration in a data-absent prompting task, not as conventional statistical estimation error. These accuracy metrics were computed separately for each invariance level (configural, metric, scalar, strict and overall model fit) and each PISA cycle (2006 and 2015). For each LLM, RMSE and MAE were defined as:
where denotes the empirical fit index (CFI or RMSEA) from MG-CFA for a given condition (i.e., a specific combination of invariance level and cycle), is the corresponding estimate from a given LLM and is the number of conditions within each grouping. This approach allowed us to evaluate both systematic tendency toward over- or under-approximation and overall discrepancy in the data-absent approximation task.
RMSE and MAE served as the primary analyses for evaluating approximation discrepancy relative to the empirical MG-CFA benchmark. As supplementary descriptive analyses, Cronbach’s alpha and intraclass correlation coefficients (ICCs) were computed to summarize apparent consistency and numerical agreement across sources of estimates. Cronbach’s alpha was interpreted only as an index of consistency in the pattern of estimates across conditions. It was not interpreted as evidence of accuracy because high consistency among LLM-generated values can occur even when those values differ systematically from the MG-CFA benchmark. Similarly, the ICC analysis was used only as a descriptive agreement index and does not imply that MG-CFA and LLM outputs are substantively interchangeable raters. For ICC analyses, the empirical MG-CFA benchmark and the six LLM outputs were treated as seven sources of estimates for the same set of fit-index conditions. This “source” framing was used only as an analytic device to quantify numerical agreement between the empirical benchmark and the LLM-generated estimates on the same scale. The LLMs were not assumed to be statistically independent raters because commercial models may share overlapping training information, common statistical conventions, or similar response generation tendencies. In this context, low ICC values indicate that the LLM-generated estimates did not align closely with the MG-CFA benchmark even if the LLMs showed consistency among themselves.
Cronbach’s alpha was calculated as:
where k is the number of sources of estimates, is the variance of the th source across all conditions and is the variance of the summed scores across sources. In the present context, alpha reflects the degree to which sources show consistent patterns of estimates across conditions. It does not indicate whether the LLM estimates are accurate relative to MG-CFA.
Intraclass correlation coefficients were estimated using a two-way mixed effects model with absolute agreement (ICC type A, model “two-way mixed”). The single-measure ICC was defined as:
where is the variance due to the target (i.e., the invariance condition), is the variance due to raters (systematic differences among the seven sources) and is the residual variance. This coefficient reflects the degree of absolute agreement for a single rater.
The average-measures ICC was computed as:
with raters which represented the reliability of the mean of the seven raters. For both ICC estimates, 95% confidence intervals were reported and the null hypothesis that the ICC equals zero was tested using an F-test. Separate analyses were performed for CFI and RMSEA.
3. Results
3.1. Model Fit and Measurement Invariance: PISA 2006
Table 3 presents model fit indices for the science self-efficacy scale in the PISA 2006 cycle which were estimated by MG-CFA and six LLMs, stratified by sex and language groups. For the MG-CFA benchmark, the overall sample demonstrated excellent model fit (CFI = 0.975, RMSEA = 0.059). Sex-based analyses revealed a comparable and strong fit for both males (CFI = 0.978, RMSEA = 0.058) and females (CFI = 0.966, RMSEA = 0.066). Language groups also showed excellent fit with the other language group (CFI = 0.975, RMSEA = 0.056) performing marginally better than the English group (CFI = 0.973, RMSEA = 0.061). Among the LLMs, in this single-query set of outputs, Copilot generated the highest CFI and lowest RMSEA values across most subgroups which indicated values that would conventionally be interpreted as an excellent fit. Other models like ChatGPT, DeepSeek, Gemini, Grok and MetaAI also estimated good to excellent model fit with CFI values predominantly above 0.95 and RMSEA values below 0.06. The measurement invariance analyses for PISA 2006 (Table 4) revealed strong evidence for full measurement invariance across both sex and language groups according to the continuous-indicator MG-CFA benchmark. For sex-related invariance, configural invariance showed excellent fit (CFI = 0.973, RMSEA = 0.062). Metric (|ΔCFI| = 0.001, |ΔRMSEA| = 0.004), scalar (|ΔCFI| = 0.007, |ΔRMSEA| = 0.003) and strict invariance (|ΔCFI| = 0.003, |ΔRMSEA| = 0.002) were all established, as all changes in fit indices fell within the recommended thresholds (Chen, 2007). The language-related invariance results were also strong with metric, scalar and strict models showing small changes in RMSEA (|ΔRMSEA| = 0.003 to 0.004) and negligible changes in CFI (|ΔCFI| ≤ 0.001) which fully supported invariance.
Table 3.
Model fit indices for PISA 2006.
Table 4.
Measurement invariance results for PISA 2006.
The LLMs’ estimates for measurement invariance showed considerable variation. For sex-related invariance, Copilot and ChatGPT consistently estimated that full strict invariance was established with minimal changes in fit indices (e.g., Copilot |ΔCFI| ≤ 0.005, |ΔRMSEA| ≤ 0.001). DeepSeek, Grok and Gemini also estimated that invariance was largely supported, although it was with slightly larger changes in CFI (e.g., Gemini |ΔCFI| = 0.013) values at the scalar and strict levels. In contrast, MetaAI estimated a progressive degradation in fit which concluded that scalar and strict invariance were not established (e.g., Strict |ΔCFI| = −0.020). For language-related invariance, a similar pattern emerged. Copilot and ChatGPT again estimated full invariance (e.g., Copilot |ΔCFI| ≤ 0.005, |ΔRMSEA| ≤ 0.002). However, DeepSeek, Gemini and MetaAI estimated that scalar and strict invariance were not supported primarily due to large changes in CFI values (e.g., Gemini Scalar |ΔCFI| = 0.017; MetaAI Strict |ΔCFI| = 0.021).
3.2. Model Fit and Measurement Invariance: PISA 2015
Table 5 presents the model fit indices for the PISA 2015 cycle. The MG-CFA model for the overall sample demonstrated acceptable fit (CFI = 0.970, RMSEA = 0.076). Sex-based analyses showed acceptable fit for both males (CFI = 0.970, RMSEA = 0.081) and females (CFI = 0.967, RMSEA = 0.074). Language groups showed acceptable fit for English speakers (CFI = 0.970, RMSEA = 0.075) and speakers of other languages (CFI = 0.967, RMSEA = 0.081). In this single-query set of outputs, Copilot again generated the highest CFI and lowest RMSEA values across most subgroups. The other LLMs also generated values that would conventionally be interpreted as good to excellent fit. The measurement invariance analysis for PISA 2015 (Table 6), using the continuous-indicator MG-CFA benchmark, showed similar patterns across sex and language. For sex-related invariance, configural invariance was supported (CFI = 0.969, RMSEA = 0.077). Metric invariance was supported with small changes in fit (|ΔCFI| = 0.001, |ΔRMSEA| = 0.005). Scalar invariance also remained within Chen’s (2007) criteria (|ΔCFI| = 0.006, |ΔRMSEA| = 0.001) and strict invariance showed the largest but still acceptable change (|ΔCFI| = 0.009, |ΔRMSEA| = 0.003). Similarly, language-related invariance was fully supported. After configural invariance was established (CFI = 0.969, RMSEA = 0.076), metric (|ΔCFI| = 0.000, |ΔRMSEA| = 0.006), scalar (|ΔCFI| = 0.000, |ΔRMSEA| = 0.004) and strict invariance (|ΔCFI| = 0.001, |ΔRMSEA| = 0.003) all remained within the recommended thresholds.
Table 5.
Model fit indices for PISA 2015.
Table 6.
Measurement invariance results for PISA 2015.
The LLMs’ estimates for PISA 2015 continued to show divergence from the MG-CFA benchmark and from each other. For sex-related invariance, Copilot, ChatGPT and DeepSeek estimated that full strict invariance was established. Gemini estimated that strict invariance was not supported (|ΔCFI| = 0.016) whereas MetaAI generated values indicating non-invariance from the metric level onward. For language-related invariance, Copilot and ChatGPT again estimated full invariance. DeepSeek, Gemini and MetaAI estimated that scalar and strict invariance were not established with Gemini and MetaAI showing particularly large changes in CFI at the strict level (|ΔCFI| = 0.020 and |ΔCFI| = 0.022, respectively).
3.3. RMSE and MAE
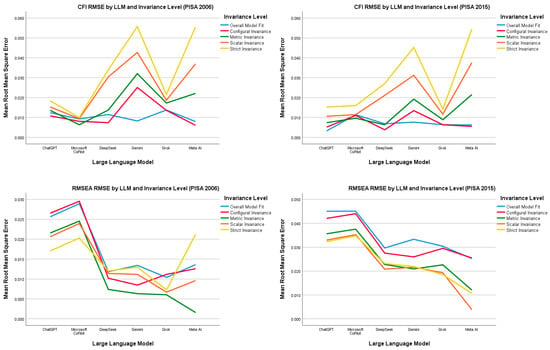
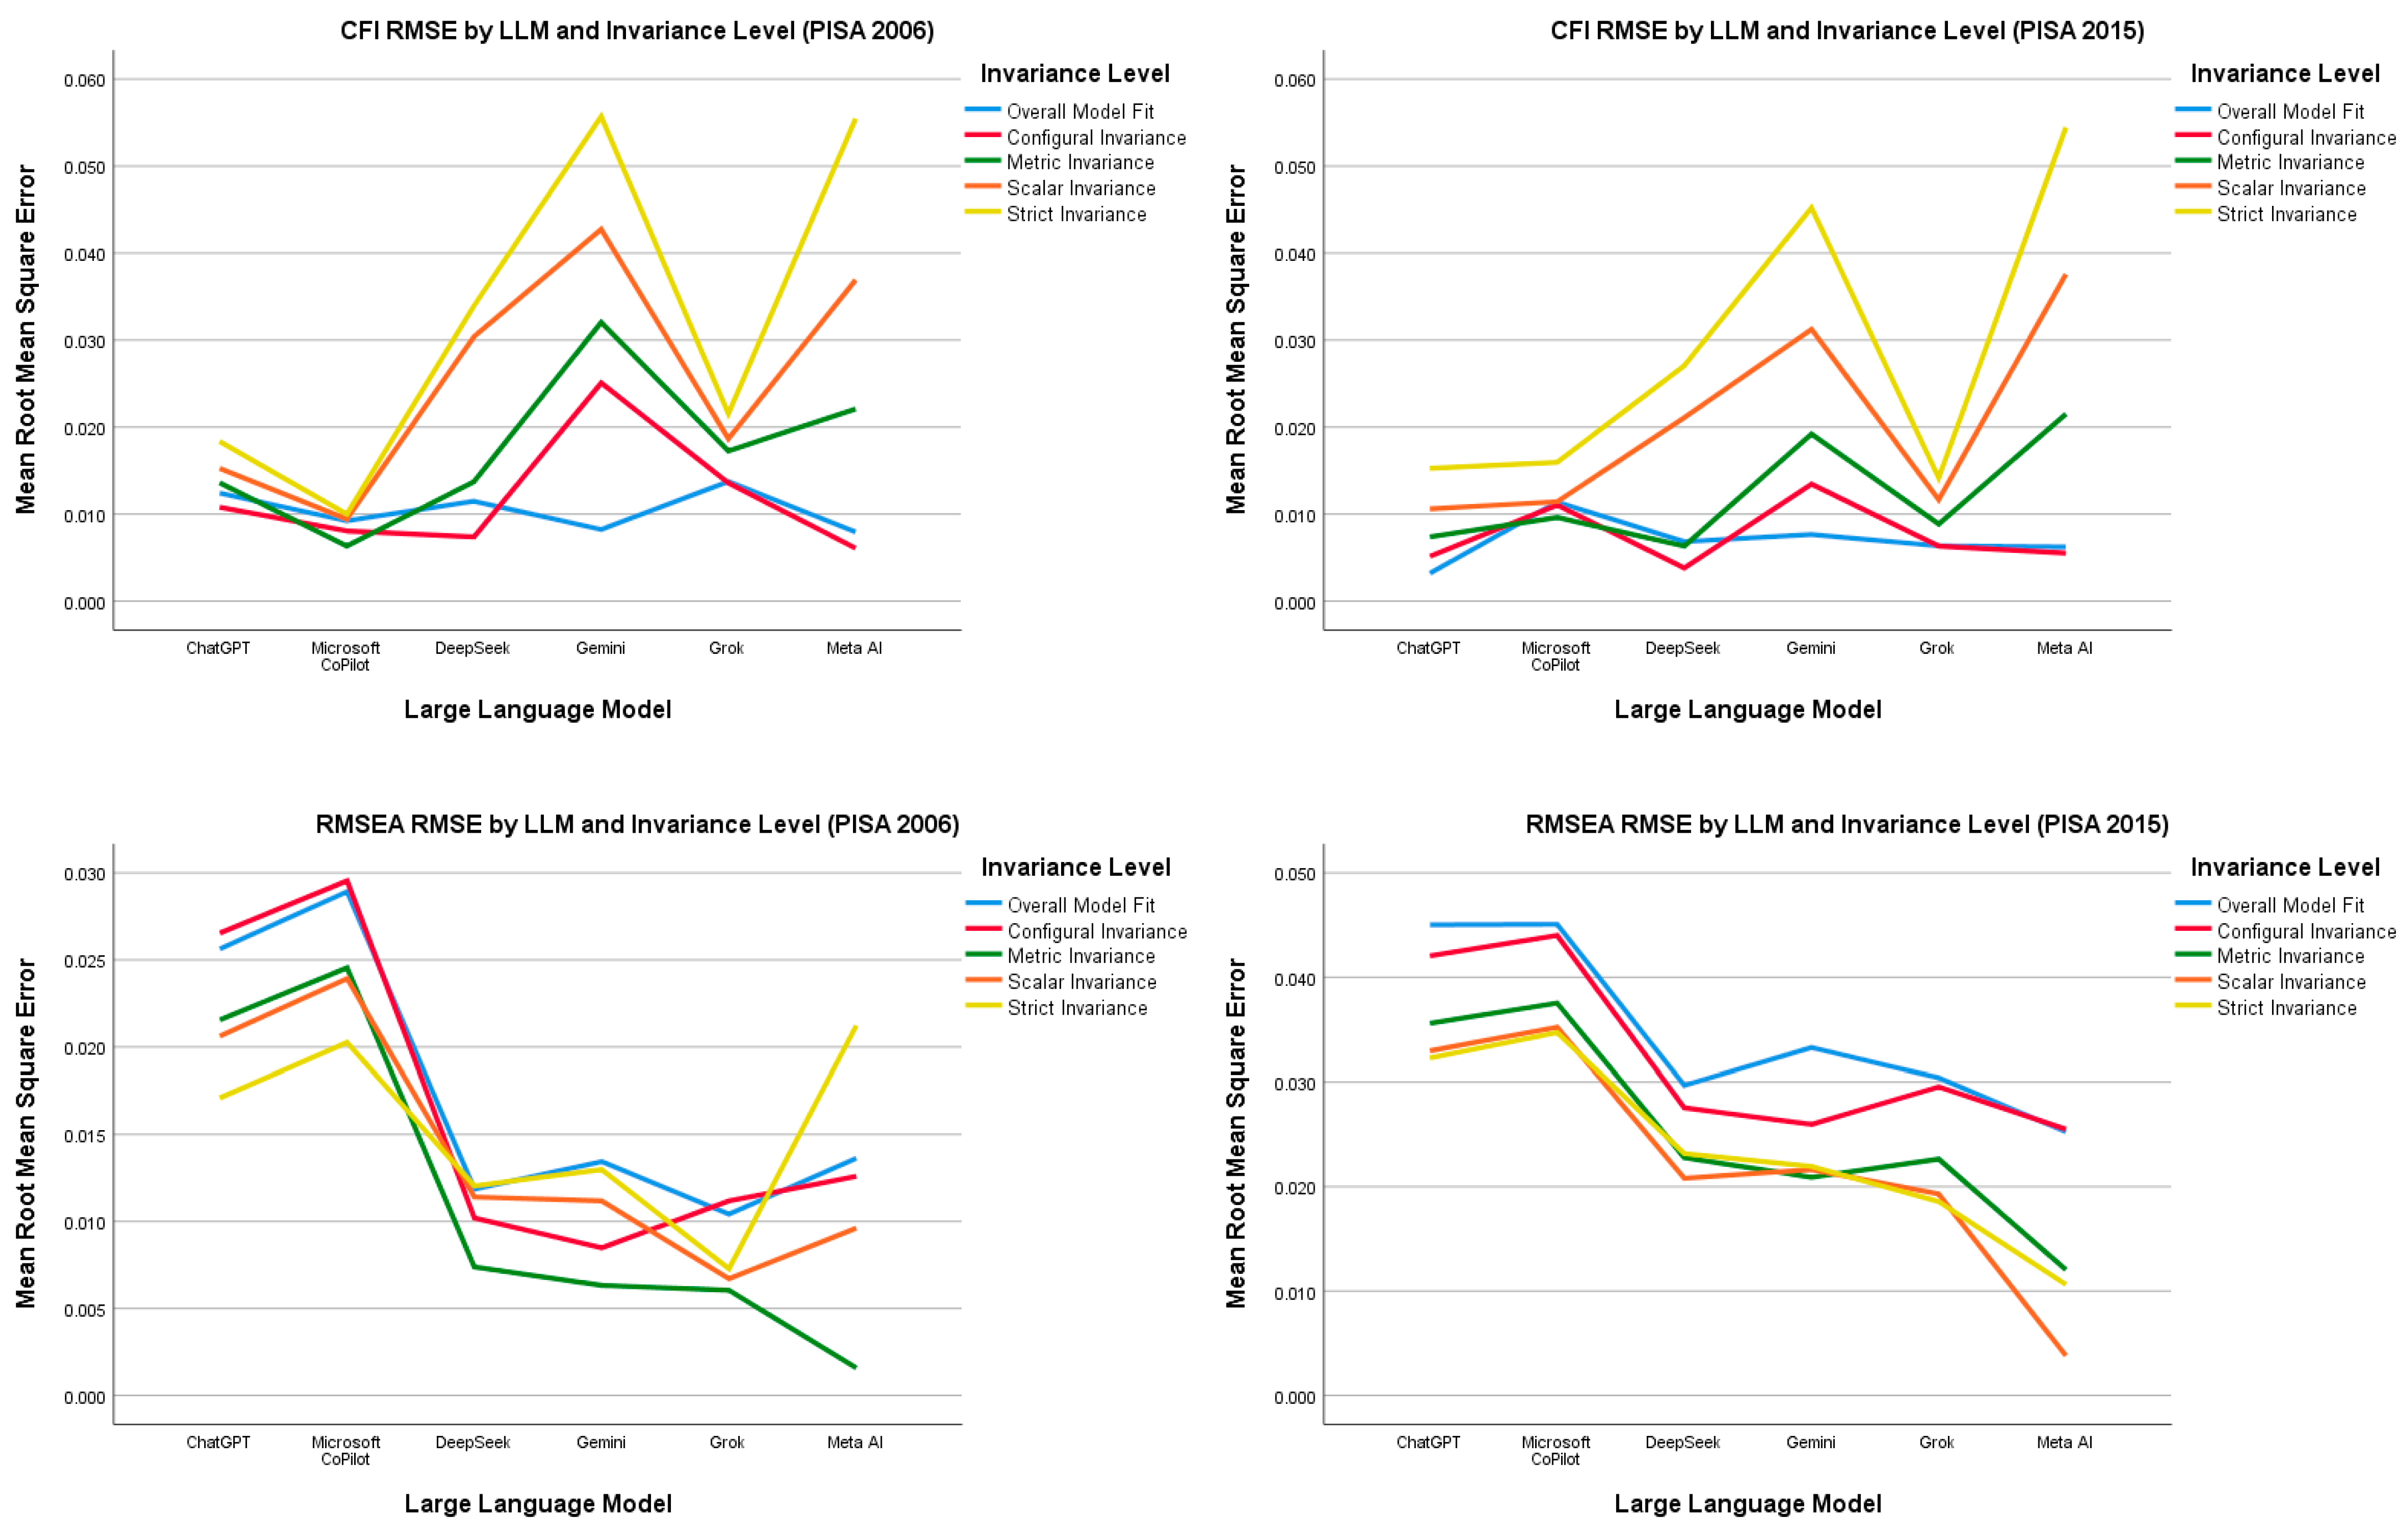
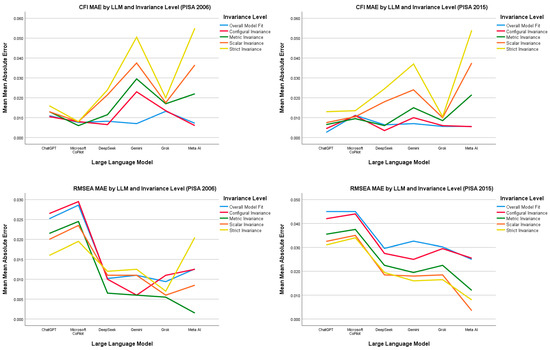
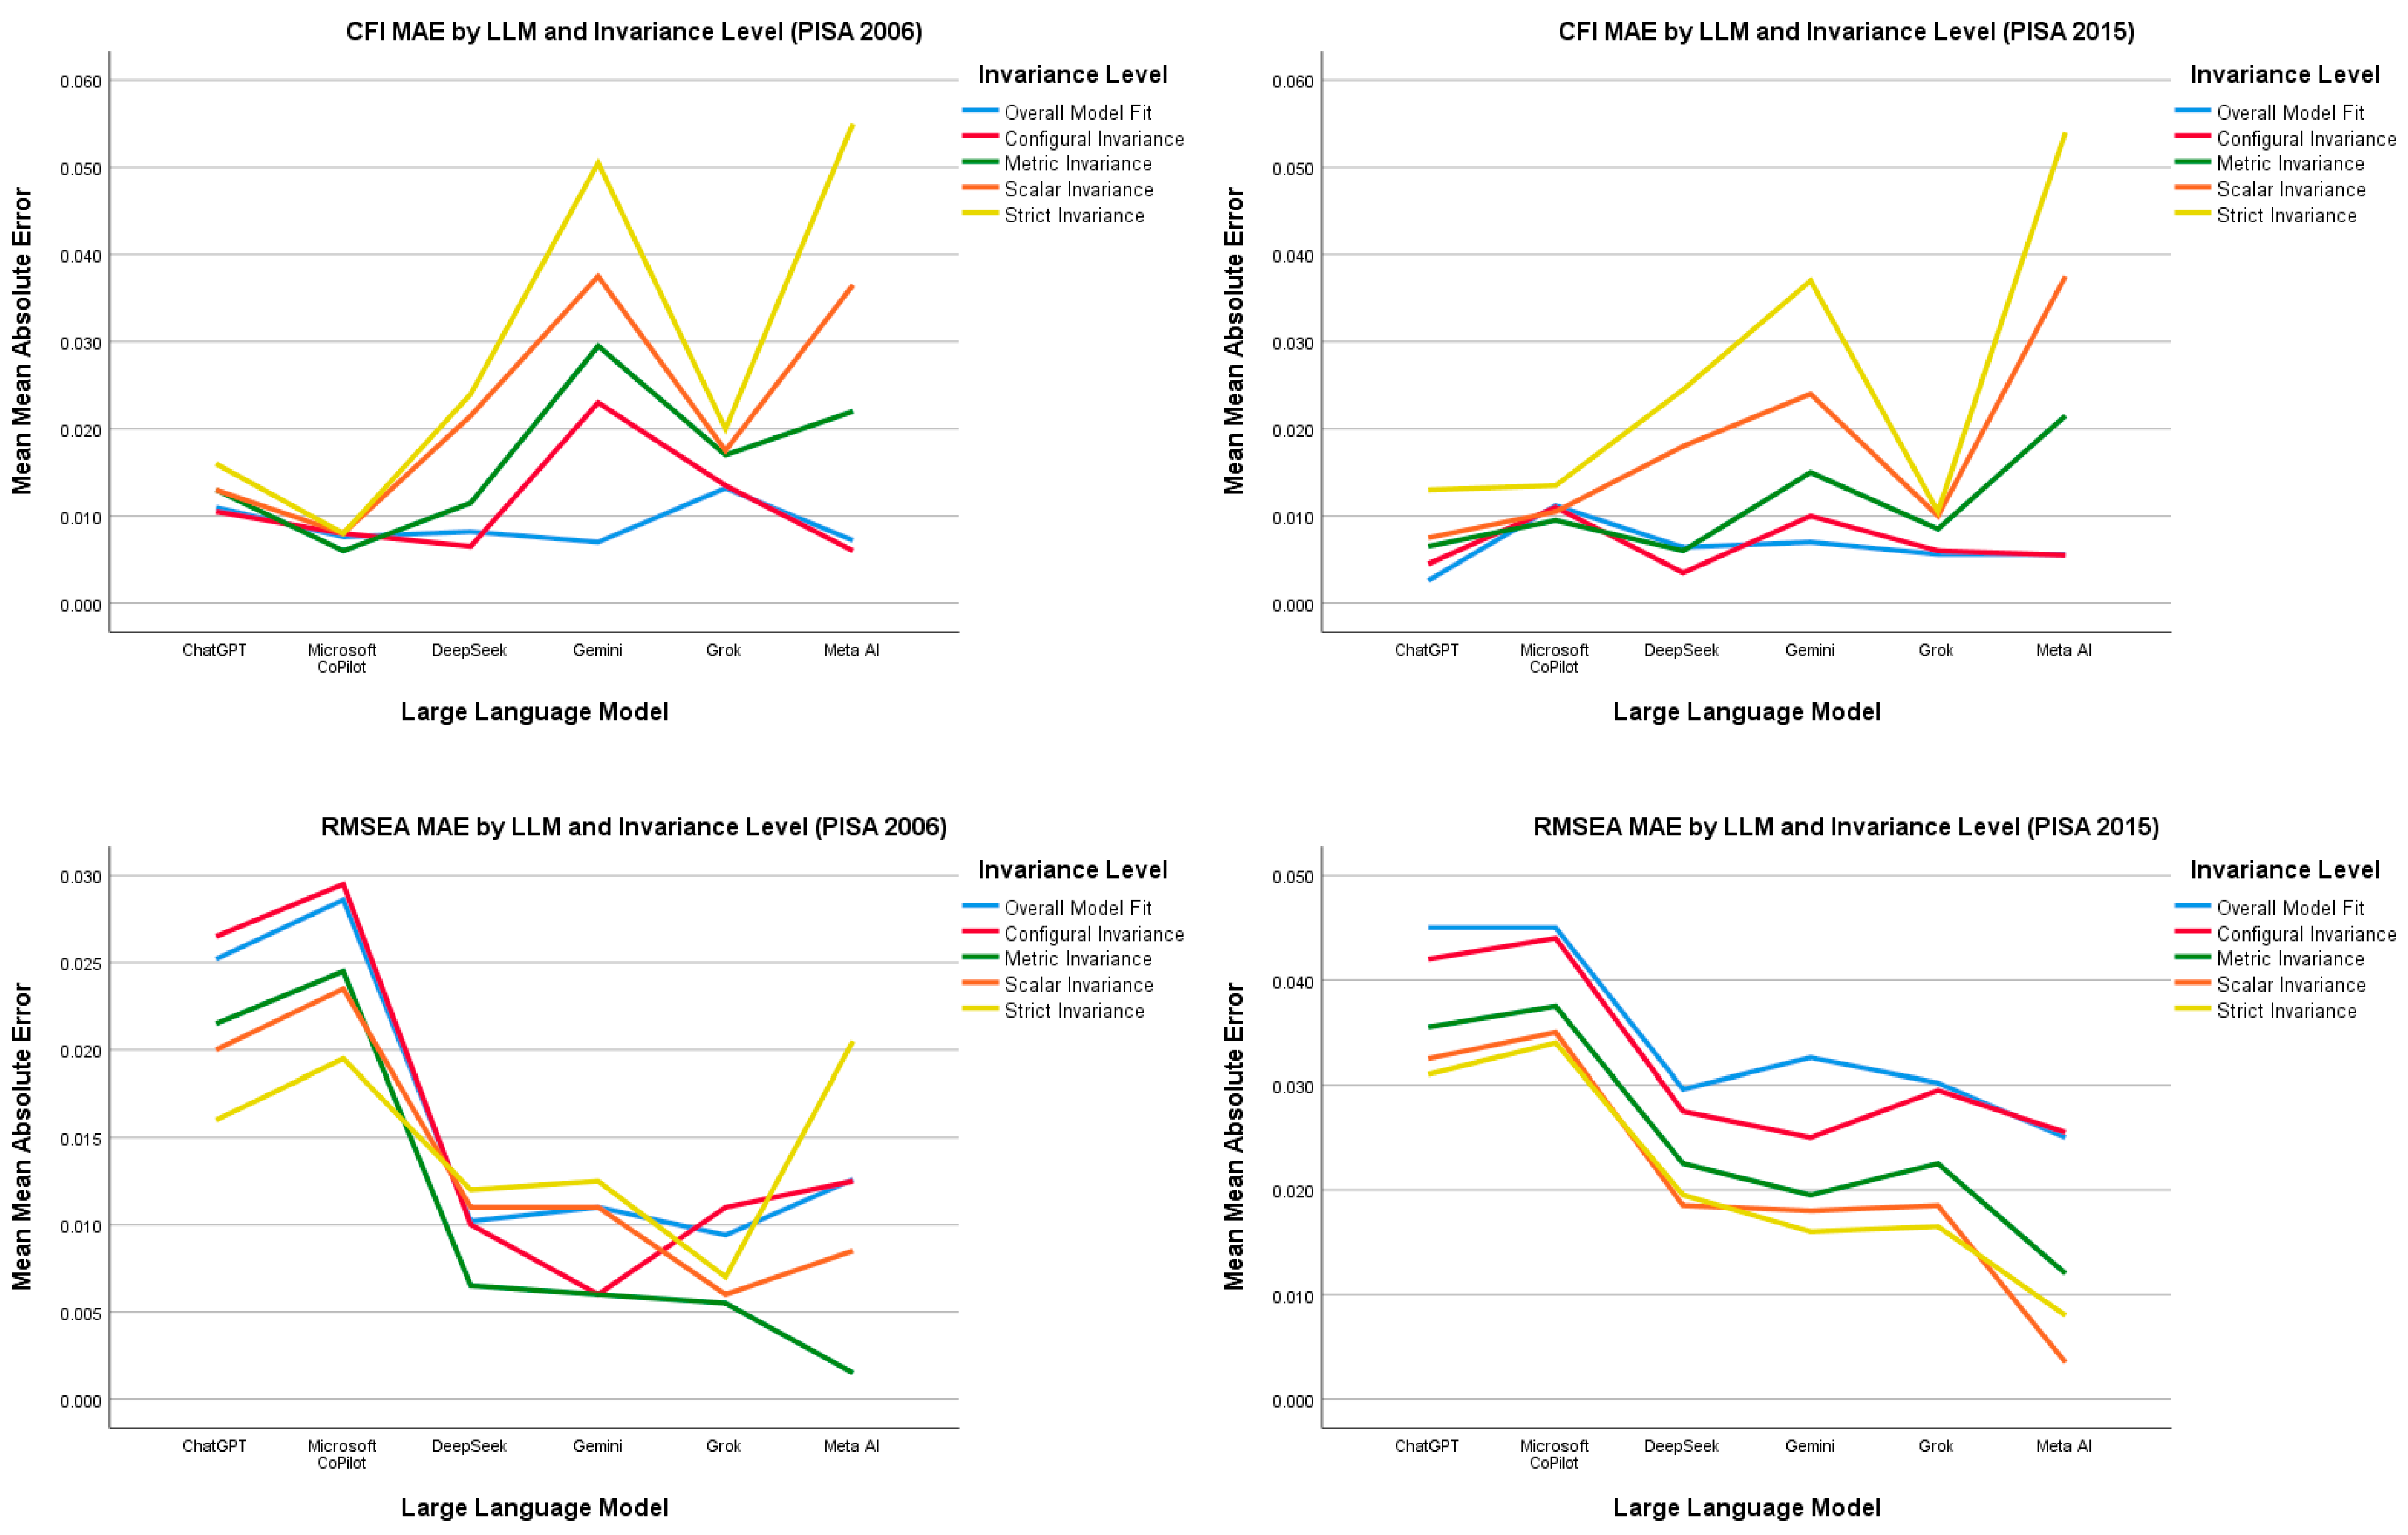
To quantitatively assess the discrepancy between the plausible fit-index values generated by the six large language models (LLMs) and the empirical multigroup confirmatory factor analysis (MG-CFA) benchmarks (Table 7), we computed the root mean square error (RMSE) and mean absolute error (MAE) for both the comparative fit index (CFI) and the root mean square error of approximation (RMSEA). These discrepancy metrics were calculated separately for each LLM, each invariance level (configural, metric, scalar, strict and overall model fit) and each PISA cycle (2006 and 2015). Given the volume of data generated by this comprehensive disaggregation, the following synthesis emphasized overarching patterns and key contrasts (Figure 1 and Figure 2) rather than providing an exhaustive and level-by-level recitation of all value ranges. Complete numerical results are available in Table 7. Because each LLM was queried once per condition, model-by-model differences should be interpreted descriptively and cautiously as results from a single standardized prompting instance rather than as stable estimates of each model’s general performance.
Table 7.
Results of RMSE and MAE analyses.
Figure 1.
RMSE by index, by LLM, by invariance level, and by PISA cycle.
Figure 2.
MAE by index by LLM by invariance level and by PISA cycle.
For PISA 2006 CFI estimates, errors varied notably across models and invariance levels with a clear divergence between the most and least accurate LLMs. In this single-query evaluation, Copilot yielded the smallest RMSE and MAE values across several invariance levels (e.g., RMSE ≤ 0.010 at metric and strict levels) which indicated the closest approximation to the MG-CFA benchmark in this set of outputs. In contrast, Gemini and MetaAI produced larger errors in this set of outputs, particularly at the scalar and strict invariance levels where discrepancies for Gemini reached RMSE = 0.056 and for MetaAI RMSE = 0.055. At the overall model fit level (i.e., baseline models without invariance constraints), errors were comparatively moderate for all models (RMSE ≤ 0.014).
A different pattern emerged for RMSEA estimates in PISA 2006. Whereas Copilot had excelled in CFI accuracy, it exhibited some of the largest RMSEA errors (e.g., RMSE = 0.030 at the configural level). Conversely, MetaAI which had performed poorly on CFI demonstrated the smallest RMSEA errors at the metric and scalar levels (RMSE = 0.002 and 0.010, respectively). Despite large CFI errors, Gemini produced relatively accurate RMSEA estimates at the configural level (RMSE = 0.008). This inverse relationship between CFI and RMSEA accuracy across models suggested that LLMs may be drawing upon discordant information from their training corpora regarding these two commonly reported fit indices.
For PISA 2015, CFI errors were generally smaller than those observed in 2006, particularly at the configural and metric levels where RMSE values for DeepSeek and ChatGPT were below 0.006. At the stricter invariance levels (scalar and strict), MetaAI and Gemini again emerged as the least accurate models with MetaAI reaching RMSE = 0.054 at the strict level. RMSEA errors in PISA 2015 were notably larger across all invariance levels compared to CFI errors. Copilot and ChatGPT consistently produced the largest RMSEA discrepancies (e.g., RMSE = 0.044 and 0.045 at configural and overall fit levels, respectively), while MetaAI demonstrated the smallest errors across nearly all RMSEA comparisons which included remarkably low values at the scalar (RMSE = 0.004) and strict (RMSE = 0.011) levels. Across both cycles and indices, no single LLM achieved uniformly high accuracy. Rather, model performance was highly dependent on the specific fit index being estimated and the level of invariance under consideration.
3.4. Consistency and Intraclass Correlation
To further evaluate the distinction between apparent consistency and agreement with the empirical benchmark, consistency-style and intraclass correlation analyses were conducted separately for the CFI and RMSEA estimates (Table 8). These analyses were supplementary to the RMSE and MAE results which provide the most direct comparison between LLM-generated values and the empirical MG-CFA benchmark. Cronbach’s alpha was interpreted as evidence of consistency in the pattern of estimates whereas ICCs were interpreted as evidence of absolute agreement across the MG-CFA benchmark and LLM-generated estimates. For CFI, Cronbach’s α was 0.857 which indicates that the sources showed a relatively consistent pattern of CFI estimates across conditions. This should be interpreted as apparent consistency among generated outputs rather than evidence of independent consensus among models. However, this consistency should not be interpreted as accuracy. The single-measure ICC was 0.302 (95% CI [0.141, 0.508]). This indicated limited absolute agreement between individual sources and the empirical benchmark. The average-measures ICC was higher at 0.752 (95% CI [0.534, 0.878]), but this value reflects agreement for an averaged set of sources rather than the accuracy of any individual LLM. Therefore, the CFI results indicate that generated estimates may show a shared pattern while still diverging meaningfully from the MG-CFA benchmark.
Table 8.
Consistency and intraclass correlation coefficients for CFI and RMSEA estimates.
For RMSEA, Cronbach’s α was markedly lower at 0.438 which indicates weaker consistency in the pattern of RMSEA estimates. The single-measure ICC was negligible at 0.024 (95% CI [−0.003, 0.079]), indicating very poor absolute agreement with the empirical benchmark. The average-measures ICC was also low (0.147, 95% CI [−0.021, 0.376]). These results indicate that RMSEA estimates were both less consistent across sources and poorly aligned with the MG-CFA values.
Importantly, the ICC analyses included the MG-CFA values as one source of estimates. Therefore, the low single-measure ICC for CFI (0.302) and the negligible ICC for RMSEA (0.024) indicate weak absolute agreement between the LLM-generated estimates and the empirical benchmark. When interpreted alongside the RMSE and MAE results, these findings show that consistency among generated estimates is not equivalent to accuracy. This distinction is central to the present study: LLMs may produce outputs that appear mutually consistent, particularly for CFI, while still failing to reproduce data-driven psychometric results.
4. Discussion
4.1. Summary of Findings
The present study pursued two interrelated objectives: establishing measurement invariance of the science self-efficacy scale across sex and language groups for U.S. adolescents using PISA 2006 and 2015 data and benchmarking six large language models’ ability to generate plausible invariance approximations based on prompt content and pre-existing model knowledge. Multigroup confirmatory factor analysis supported full measurement invariance across both grouping variables in both cycles which provided robust validity evidence consistent with prior research (e.g., Uysal & Arıkan, 2018). In contrast, the six LLMs exhibited systematic divergence from the empirical MG-CFA benchmarks. Although the CFI estimates showed high apparent consistency across sources (Cronbach’s α = 0.857), this consistency did not imply accuracy or independent consensus. Absolute agreement with the empirical benchmark was limited for CFI (single-measure ICC = 0.302) and negligible for RMSEA (single-measure ICC = 0.024), while RMSE and MAE showed meaningful approximation discrepancies relative to MG-CFA. Errors frequently exceeded practically meaningful thresholds for fit-index estimation and the models often overestimated model fit while producing invariance decisions that were not always aligned with the empirical MG-CFA benchmarks (Chen, 2007). Because the MG-CFA results supported full invariance across sex and language groups in both cycles, the concern is not that LLMs uniformly claimed invariance when empirical invariance was absent. Rather, the concern is that their numerical estimates and some model-level decisions were unreliable relative to the empirical benchmark. This pattern which is described as an “illusion of consensus” (Z. Li et al., 2026) suggests that current off-the-shelf LLMs may produce outputs that appear coherent and mutually consistent while remaining weakly aligned with empirical psychometric benchmarks. The term is descriptive and does not imply that the models provide independent confirmation of one another’s outputs.
4.2. Discussion of Findings
The MG-CFA findings strengthened the validity argument for the PISA science self-efficacy scale within Kane’s (2013) framework, particularly the implication inference concerning appropriate score interpretations across diverse populations. Full measurement invariance across language groups in both cycles suggested that observed gaps between English-speaking and other language groups (Ardasheva et al., 2018) can reflect genuine differences in the latent construct rather than measurement artifacts. The sex-based invariance results provided a similar foundation for meaningful cross-group comparisons which aligned with Bandura’s (1997) theorizing that self-efficacy beliefs, as shaped by personal and contextual factors, can be validly compared when measurement equivalence holds.
Turning to the LLM findings, the observed pattern (i.e., consistency among generated estimates coupled with weak absolute agreement and meaningful RMSE/MAE errors relative to MG-CFA) directly addresses the present study’s main research question regarding the reliability of LLM-generated psychometric approximations when empirical data are not provided (Ray, 2023). The models’ convergence on a common but inaccurate pattern of estimates may reflect shared response generation tendencies rather than genuine statistical reasoning (Bender et al., 2021). This phenomenon has been documented in other domains where LLMs generate plausible yet ungrounded outputs (Xue & Appleton, 2026; Fan et al., 2026) and the present study extends this concern to the high-stakes context of psychometric validation. The tendency to overestimate model fit which is, descriptively, an “optimism bias” could be consistent with LLMs defaulting to prototypical well-fitting values. One possible explanation is that published psychometric studies often report acceptable or excellent model fit, but the present design cannot directly examine the models’ training corpora or establish this mechanism. However, because the present study used a single query per model per condition, differences among individual LLMs should be treated as exploratory and descriptive rather than as definitive evidence that one model is consistently more accurate than another. When prompted to generate plausible invariance approximations for a new scale, the models may have generated prototypical fit patterns rather than values calibrated to the specific characteristics of the science self-efficacy measure.
Building on H. Li et al. (2025), who demonstrated ChatGPT’s moderate accuracy in estimating item difficulty but limitations with item discrimination, the present study examined a more abstract and data-dependent construct: group-level measurement invariance. The poorer performance observed here suggests that LLM estimates may become less reliable when psychometric tasks require information about latent covariance structures rather than more surface-level item features. Unlike item difficulty which may sometimes be approximated from item wording alone, invariance testing requires information about how factor structures and measurement parameters behave across groups. The present findings suggest that current general-purpose LLMs do not reliably approximate this type of data-dependent psychometric evidence from pre-trained knowledge alone (Roberts et al., 2024). Within Kane’s (2013) validation argument framework, reliance on such LLM-generated estimates would undermine the entire chain of validity evidence, as the implication inference would rest on erroneous or unsupported conclusions.
5. Conclusions
The present study established full measurement invariance of the science self-efficacy scale across sex and language groups for U.S. adolescents in PISA 2006 and 2015 which strengthened the validity evidence supporting its use in equity-focused STEM research. In contrast, despite exhibiting some inter-model consistency, six widely available large language models did not reliably reproduce the empirical fit-index patterns and invariance decisions when prompted to generate plausible approximations from prompt content and pre-existing model knowledge without access to the underlying data. This apparent “illusion of consensus” highlights the risks of relying on current off-the-shelf LLMs for substantive psychometric validation. Traditional and data-driven methods such as MG-CFA should remain the primary empirical basis for establishing measurement invariance. While LLMs may serve useful roles in ancillary tasks, they are not yet reliable tools for generating evidence within a validity argument.
5.1. Implications
Two primary implications emerge from these findings. First, the establishment of full measurement invariance across language and sex groups provides strong empirical support for the valid use of the PISA science self-efficacy scale in U.S. educational and psychological research. These results substantiated the implication inference within Kane’s (2013) framework and suggest that observed disparities in science self-efficacy between demographic groups (Aizawa, 2024; Beckmann & Fervers, 2024) are not artifacts of measurement bias. The findings also reinforced the value of routine invariance testing across assessment cycles.
Second, the present study delivers a cautionary message regarding the application of current off-the-shelf LLMs for generating psychometric validity-related approximations without empirical data. The apparent “illusion of consensus” in which generated outputs show surface-level consistency while diverging from empirical data poses a significant risk to the integrity of validation arguments in high-stakes educational and psychological contexts. Therefore, researchers should continue to rely on traditional and data-driven methods such as MG-CFA as the primary empirical basis for establishing measurement invariance. At present, LLM outputs should not be used as supporting evidence within a validity argument. Their most appropriate roles may potentially lie in ancillary tasks such as code generation, syntax debugging or pedagogical illustration where factual accuracy is either verifiable or non-critical. The development of specialized and fine-tuned models trained specifically on psychometric data and theory may eventually overcome these limitations, but such advances would themselves require rigorous empirical validation.
5.2. Limitations and Future Research
The Several limitations of the present study warrant acknowledgment. The present study utilized default and unpaid versions of six LLMs to maximize ecological validity whereas advanced paid versions with larger context windows or enhanced capabilities might yield different results. In addition, because the models were accessed through consumer-facing interfaces rather than APIs, exact backend model identifiers and generation parameters were not always visible or user-controllable which limits full reproducibility. The findings are confined to a single construct (science self-efficacy) within the U.S. context which could limit generalizability to other psychological constructs, languages or educational systems. The single-query design does not characterize with-in-model variability, although it aligns with the present study’s proof-of-concept objectives and reflects a realistic end-user scenario. As a result, model-by-model comparisons should be interpreted cautiously because observed differences may reflect both systematic model characteristics and variability associated with a particular generation. Future research should employ multiple independent runs per condition to assess the stability of LLM outputs and explore techniques such as self-consistency prompting or ensemble averaging. Although standardized, the prompting protocol did not incorporate advanced strategies like chain-of-thought reasoning or few-shot examples which may improve estimation accuracy. Accordingly, the LLM component should be interpreted as a test of empirical calibration in plausible value generation, not as a test of conventional statistical estimation or verified psychometric knowledge retrieval. Therefore, the findings should be interpreted as evaluating plausible value generation rather than formal literature retrieval or meta-analytic synthesis. The six LLMs should not be interpreted as fully independent sources of evidence because commercial models may share overlapping training materials, common statistical reporting conventions or similar response generation patterns. Therefore, inter-model consistency should be interpreted descriptively rather than as evidence of independent reliability or consensus.
In addition, the MG-CFA models treated the four-category science self-efficacy items as approximately continuous indicators. Although this decision was supported by prior methodological work, prior large-scale assessment applications and the large sample sizes in PISA, the present study did not test ordinal threshold-based invariance. Future research should conduct sensitivity analyses using ordinal estimators such as WLSMV to examine whether the invariance conclusions are robust across estimation approaches and whether threshold-level invariance yields the same substantive interpretation. Another methodological consideration is the treatment of the PISA complex sampling design. Although final student sampling weights were applied, the MG-CFA analyses did not incorporate replicate weights or fully design-based SEM estimation. Future research could examine whether the empirical benchmark values and invariance conclusions are robust when using PISA replicate weights or other approaches that more completely account for the multistage sampling design. The missing data procedure is another methodological consideration. The present study used a single imputed dataset which does not propagate imputation uncertainty into the MG-CFA estimates. Future research could examine the robustness of the empirical benchmark values using multiple imputations with pooled invariance results or full-information maximum likelihood approaches when compatible with the model specification. The present study also focused the MG-CFA reporting on CFI, RMSEA, ΔCFI and ΔRMSEA because these indices were used as the direct basis for evaluating the LLM-generated approximations. Future extensions could provide a fuller CFA diagnostic supplement including factor loadings, item residuals, χ2/df, TLI and parameter-level invariance results.
A promising direction lies in hybrid AI–human workflows wherein LLMs assist with time-intensive but verifiable tasks such as drafting analysis code or summarizing methodological literature while human experts retain final decision-making authority. Ultimately, the development of psychometrically informed and fine-tuned models may ad-dress current limitations, but rigorous validation of such models would be essential. As LLM capabilities evolve, longitudinal reassessments will be necessary to determine whether performance improves with newer model versions and whether models can provide calibrated uncertainty estimates for their outputs.
Author Contributions
O.R. and D.K.L.L. have equally contributed to the present research and are therefore co-first authors. O.R. led and contributed to project administration, conceptualization, investigation, methodology, data curation, software, formal analysis, visualization, writing—original draft and writing—review and editing. D.K.L.L. led and contributed to project administration, conceptualization, investigation, methodology, data curation, software, formal analysis, visualization, writing—original draft and writing—review and editing. All authors have read and agreed to the published version of the manuscript.
Funding
The authors did not receive any financial support for the research, authorship, and/or publication of the present study.
Institutional Review Board Statement
An ethics approval statement was not applicable, as publicly available datasets (i.e., PISA 2006 and PISA 2015) as well as AI-generated datasets were used. The present study has been conducted according to the American Psychological Association’s ethical standards.
Informed Consent Statement
Informed consent was not applicable as publicly available datasets (i.e., PISA 2006 and PISA 2015) as well as AI-generated datasets were used.
Data Availability Statement
The PISA 2006 and 2015 datasets are publicly available through the OECD PISA database. LLM-generated outputs and analysis materials are available from the corresponding author upon reasonable request.
Conflicts of Interest
The authors declare no conflicts of interest.
References
- Abdurahman, S., Ziabari, A. S., Moore, A., Bartels, D., & Dehghani, M. (2025). A primer for evaluating large language models in social science research. Advances in Methods and Practices in Psychological Science, 8(2), 25152459251325174. [Google Scholar] [CrossRef] [Scilit]
- Aizawa, I. (2024). The role of language on assessment outcomes: An analysis of calculation and explanation questions in science classrooms. Assessment & Evaluation in Higher Education, 50(1), 67–82. [Google Scholar] [CrossRef] [Scilit]
- Appels, L. (2024). The face of education: The quest for educational quality and equity through international large-scale assessments [Doctoral dissertation, University of Antwerp]. Available online: https://hdl.handle.net/10067/2022720151162165141 (accessed on 3 May 2026).
- Ardasheva, Y., Carbonneau, K. J., Roo, A. K., & Wang, Z. (2018). Relationships among prior learning, anxiety, self-efficacy, and science vocabulary learning of middle school students with varied English language proficiency. Learning and Individual Differences, 61, 21–30. [Google Scholar] [CrossRef] [Scilit]
- Ballen, C. J., Wieman, C., Salehi, S., Searle, J. B., & Zamudio, K. R. (2017). Enhancing diversity in undergraduate science: Self-efficacy drives performance gains with active learning. CBE—Life Sciences Education, 16(4), ar56. [Google Scholar] [CrossRef] [Scilit] [PubMed]
- Bandura, A. (1977). Self-efficacy: Toward a unifying theory of behavioral change. Psychological Review, 84(2), 191–215. [Google Scholar] [CrossRef] [Scilit] [PubMed]
- Bandura, A. (1997). Self-efficacy: The exercise of control. W.H. Freeman and Company. Available online: https://psycnet.apa.org/record/1997-08589-000 (accessed on 18 April 2026).
- Beckmann, J., & Fervers, L. (2024). Does study counselling foster STEM intentions and reduce the STEM gender gap? Evidence from a randomized controlled trial. Educational Research and Evaluation, 29(3–4), 147–170. [Google Scholar] [CrossRef] [Scilit]
- Bender, E. M., Gebru, T., McMillan-Major, A., & Shmitchell, S. (2021). On the dangers of stochastic parrots: Can language models be too big? In Proceedings of the 2021 ACM conference on fairness, accountability, and transparency (pp. 610–623). ACM. [Google Scholar] [CrossRef] [Scilit]
- Browne, M. W., & Cudeck, R. (1993). Alternative ways of assessing model fit. In K. A. Bollen, & J. S. Long (Eds.), Testing structural equation models (pp. 136–162). Sage. [Google Scholar]
- Chen, F. F. (2007). Sensitivity of goodness of fit indexes to lack of measurement invariance. Structural Equation Modeling: A Multidisciplinary Journal, 14(3), 464–504. [Google Scholar] [CrossRef] [Scilit]
- Cook, D. A., Brydges, R., Ginsburg, S., & Hatala, R. (2015). A contemporary approach to validity arguments: A practical guide to Kane’s framework. Medical Education, 49(6), 560–575. [Google Scholar] [CrossRef] [Scilit] [PubMed]
- Ding, Y., Yang Hansen, K., & Klapp, A. (2022). Testing measurement invariance of mathematics self-concept and self-efficacy in PISA using MGCFA and the alignment method. European Journal of Psychology of Education, 38(2), 709–732. [Google Scholar] [CrossRef] [Scilit]
- Enders, C. K., Keller, B. T., & Levy, R. (2018). A fully conditional specification approach to multilevel imputation of categorical and continuous variables. Psychological Methods, 23(2), 298–317. [Google Scholar] [CrossRef] [Scilit] [PubMed]
- Fan, K., Bialo, J. A., & Li, H. (2026). The use of AI tools to develop and validate Q-matrices. arXiv, arXiv:2602.08796. [Google Scholar] [CrossRef] [Scilit]
- Gómez-Benito, J., Sireci, S., Padilla, J. L., Hidalgo, M. D., & Benítez, I. (2018). Differential Item Functioning: Beyond validity evidence based on internal structure. Psicothema, 30(1), 104–109. [Google Scholar] [CrossRef] [Scilit] [PubMed]
- Hu, L., & Bentler, P. M. (1999). Cutoff criteria for fit indexes in covariance structure analysis: Conventional criteria versus new alternatives. Structural Equation Modeling: A Multidisciplinary Journal, 6(1), 1–55. [Google Scholar] [CrossRef] [Scilit]
- Jorgensen, T. D., Pornprasertmanit, S., Schoemann, A. M., & Rosseel, Y. (2022). semTools: Useful tools for structural equation modeling [R package version 0.5-6]. Available online: https://CRAN.R-project.org/package=semTools (accessed on 7 May 2026).
- Kane, M. T. (2013). Validating the interpretations and uses of test scores. Journal of Educational Measurement, 50(1), 1–73. [Google Scholar] [CrossRef] [Scilit]
- Kline, R. B. (2016). Principles and practice of structural equation modeling (4th ed.). The Guilford Press. Available online: https://psycnet.apa.org/record/2015-56948-000 (accessed on 8 May 2026).
- Li, H., Aldib, R., & Marchong, C. (2025). The use of ChatGPT for reading test development and validation: Two case studies. In C. A. Chapelle, G. H. Beckett, & B. E. Gray (Eds.), Researching generative AI in applied linguistics (pp. 219–234). Iowa State University Digital Press. [Google Scholar] [CrossRef] [Scilit]
- Li, Z., Yi, W., & Chen, J. (2026). Accuracy paradox: Addressing epistemic, manipulative, and societal risks of hallucination in AI governance. Computer Law & Security Review, 61, 106311. [Google Scholar] [CrossRef] [Scilit]
- Liou, P., & Lin, J. J. (2021). Comparisons of science motivational beliefs of adolescents in Taiwan, Australia, and the United States: Assessing the measurement invariance across countries and genders. Frontiers in Psychology, 12, 674902. [Google Scholar] [CrossRef] [Scilit] [PubMed]
- Marshall, I. J., Johnson, B. T., Wang, Z., Rajasekaran, S., & Wallace, B. C. (2020). Semi-automated evidence synthesis in health psychology: Current methods and future potential. Health Psychology Review, 14(1), 145–158. [Google Scholar] [CrossRef] [Scilit] [PubMed]
- McDonald, R. P. (1999). Test theory: A unified treatment. Lawrence Erlbaum Associates Publishers. Available online: https://psycnet.apa.org/record/1999-02770-000 (accessed on 29 April 2026).
- Miles, J. A., & Naumann, S. E. (2021). Science self-efficacy in the relationship between gender & science identity. International Journal of Science Education, 43(17), 2769–2790. [Google Scholar] [CrossRef] [Scilit]
- Munck, I., Barber, C., & Torney-Purta, J. (2018). Measurement invariance in comparing attitudes toward immigrants among youth across Europe in 1999 and 2009: The alignment method applied to IEA CIVED and ICCS. Sociological Methods & Research, 47(4), 687–728. [Google Scholar] [CrossRef] [Scilit]
- OECD. (2009). PISA 2006 technical report. OECD Publishing. [Google Scholar] [CrossRef] [Scilit]
- OECD. (2017). PISA 2015 assessment and analytical framework: Science, reading, mathematic, financial literacy and collaborative problem solving. OECD Publishing. [Google Scholar] [CrossRef] [Scilit]
- Pereira, D. S. M., Mourão, F., Ribeiro, J. C., Costa, P., Guimarães, S., & Pêgo, J. M. (2024). ChatGPT as an item calibration tool: Psychometric insights in a high-stakes examination. Medical Teacher, 47(4), 677–683. [Google Scholar] [CrossRef] [Scilit] [PubMed]
- Puccio, B., Castagna, F., Tucker, A., & Veltri, P. (2025). Towards medical AI misalignment: A preliminary study. arXiv, arXiv:2505.18212v1. [Google Scholar] [CrossRef] [Scilit]
- Ray, P. P. (2023). ChatGPT: A comprehensive review on background, applications, key challenges, bias, ethics, limitations and future scope. Internet of Things and Cyber-Physical Systems, 3, 121–154. [Google Scholar] [CrossRef] [Scilit]
- R Core Team. (2026). R: A language and environment for statistical computing. R Foundation for Statistical Computing. Available online: https://www.R-project.org/ (accessed on 5 May 2026).
- Rhemtulla, M., Brosseau-Liard, P. É., & Savalei, V. (2012). When can categorical variables be treated as continuous? A comparison of robust continuous and categorical SEM estimation methods under suboptimal conditions. Psychological Methods, 17(3), 354–373. [Google Scholar] [CrossRef] [Scilit] [PubMed]
- Roberts, J., Baker, M., & Andrew, J. (2024). Artificial intelligence and qualitative research: The promise and perils of large language model (LLM) ‘assistance’. Critical Perspectives on Accounting, 99, 102722. [Google Scholar] [CrossRef] [Scilit]
- Robitzsch, A. (2020). Why ordinal variables can (almost) always be treated as continuous variables: Clarifying assumptions of robust continuous and ordinal factor analysis estimation methods. Frontiers in Education, 5, 589965. [Google Scholar] [CrossRef] [Scilit]
- Rosseel, Y. (2012). lavaan: An R package for structural equation modeling. Journal of Statistical Software, 48(2), 1–36. [Google Scholar] [CrossRef] [Scilit]
- Sakellariou, C., & Fang, Z. (2021). Self-efficacy and interest in STEM subjects as predictors of the STEM gender gap in the US: The role of unobserved heterogeneity. International Journal of Educational Research, 109, 101821. [Google Scholar] [CrossRef] [Scilit]
- Uysal, N. K., & Arıkan, Ç. A. (2018). Measurement invariance of science self-efficacy scale in PISA. International Journal of Assessment Tools in Education, 5(2), 325–338. [Google Scholar] [CrossRef] [Scilit]
- Van Buuren, S. (2007). Multiple imputation of discrete and continuous data by fully conditional specification. Statistical Methods in Medical Research, 16(3), 219–242. [Google Scholar] [CrossRef] [Scilit] [PubMed]
- Vandenberg, R. J., & Lance, C. E. (2000). A review and synthesis of the measurement invariance literature: Suggestions, practices, and recommendations for organizational research. Organizational Research Methods, 3(1), 4–70. [Google Scholar] [CrossRef] [Scilit]
- Verdugo-Castro, S., García-Holgado, A., & Sánchez-Gómez, M. C. (2022). The gender gap in higher STEM studies: A systematic literature review. Heliyon, 8(8), e10300. [Google Scholar] [CrossRef] [Scilit] [PubMed]
- Wang, X., Wei, J., Schuurmans, D., Le, Q., Chi, E., Narang, S., Chowdhery, A., & Zhou, D. (2022). Self-consistency improves chain of thought reasoning in language models. arXiv, arXiv:2203.11171. [Google Scholar] [CrossRef] [Scilit]
- Xue, K., & Appleton, J. J. (2026). Evaluating general-purpose multimodal AI for Q-matrix generation from math items: A cognitive diagnostic modeling exploration. Journal of Educational Measurement, 63(1), e70028. [Google Scholar] [CrossRef] [Scilit]

Disclaimer/Publisher’s Note: The statements, opinions and data contained in all publications are solely those of the individual author(s) and contributor(s) and not of MDPI and/or the editor(s). MDPI and/or the editor(s) disclaim responsibility for any injury to people or property resulting from any ideas, methods, instructions or products referred to in the content. |
© 2026 by the authors. Licensee MDPI, Basel, Switzerland. This article is an open access article distributed under the terms and conditions of the Creative Commons Attribution (CC BY) license.