


Abstract
Traditional sensory booths provide controlled conditions for food evaluation, but physical facilities remain limited by cost, space, and flexibility. This study developed a virtual reality sensory booth laboratory and assessed participant experience and post-session symptoms during a single-session usability study. The application was developed in Unity 2022.3.10f1 for Oculus Quest 2 and included calibration, sensory evaluation, and end-scene modules. A total of 325 participants completed the assessment, including 176 females and 149 males, with a mean age of 24.58 years (SD 3.82). Post-VR experience ratings were favourable, with mean scores ranging from 6.825 for immersion to 8.077 for overall experience with VR, and a composite score of 7.369. The most frequent symptoms were blurred vision (42.15%), eye strain (40.00%), and difficulty focusing (37.85%). Mean Kennedy Simulator Sickness Questionnaire scores were 15.558 for nausea, 21.201 for oculomotor discomfort, 30.153 for disorientation, and 24.661 for total SSQ. Principal component analysis indicated shared variation across the five experience ratings; the first three components explained 84.49% of variance. Clustering identified groups with high, moderate, and lower experience ratings. Higher post-VR ratings were consistently associated with lower symptom burden and SSQ scores. The findings support further development of the booth as complementary sensory laboratory infrastructure, with participant familiarisation, calibration, and symptom monitoring. Sensory-product responses and equivalence to conventional booths were not evaluated.
1. Introduction
The sensory evaluation of food products is central to academic research and industrial product development in food science and technology. Traditional sensory booths, designed according to established guidance such as ISO 8589:2007 [1], provide standardised conditions that minimise external distractions and control lighting, noise, ventilation, and spatial layout [2,3]. These booths support reliable and replicable data collection for product attributes such as taste, texture, aroma, and appearance [4]. However, this level of methodological standardisation requires substantial financial investment, dedicated laboratory space, and fixed infrastructure. These constraints can limit the scalability, flexibility, and accessibility of sensory testing. In addition, the isolated nature of the traditional booth can reduce ecological validity because food products are rarely consumed in sterile and solitary conditions in everyday life [5].
In response to these limitations, immersive technologies, especially virtual reality (VR), have gained increasing attention in sensory science [6]. VR can place a participant in a contextually relevant consumption environment, such as a café, park, dining room, or food service setting, while maintaining a level of experimental control that is difficult to achieve in real-world testing [7,8]. Previous studies have shown that immersive environments can influence engagement, hedonic response, emotion, and perceived sensory attributes [9,10]. These effects depend on the product and context: a virtual barn increased the perceived pungency of identical blue cheese [7], whereas a virtual concert elicited more positive emotions for dark chocolate without a significant overall context effect on liking [11]. Studies reviewed in Zulkarnain et al. [10,12] also report context-dependent liking and engagement, including higher liking in congruent consumption settings. Such findings indicate selective contextual effects rather than a uniform improvement in sensory responses. Within this context, digital tools should not be positioned as replacements for conventional sensory booths. Instead, these tools can function as complementary extensions that help bridge the gap between controlled laboratory testing and complex real-world consumption contexts [5].
This study was designed to develop and empirically assess a VR sensory booth laboratory as a complementary digital extension of conventional sensory infrastructure. The system was framed as an augmentation of the physical sensory booth rather than a replacement. The assessment focused on five post-VR experience ratings and their associations with concurrently reported symptom burden, including eye strain, disorientation, blurred vision, and general discomfort. Understanding this relationship is important for developing practical protocols that allow sensory scientists to deploy VR tools safely, consistently, and without overstating the maturity of the technology.
Research Gap
The physical design of sensory evaluation facilities has long been guided by standardisation to control environmental sources of bias. ISO 8589:2007 provides guidance on the physical requirements for sensory analysis laboratories, including lighting, ventilation, noise reduction, and spatial layout to support reproducibility and data integrity [1,2]. These specifications form the basis of conventional sensory testing infrastructure in academic and industrial settings. However, the capital and spatial demands of such facilities can create barriers for smaller laboratories and limit flexibility when research questions require investigation of contextual factors, such as eating environment, social setting, or product use situation [3].
The recognition that consumption context can shape food perception has encouraged the development of more ecologically valid testing approaches [12,13]. Earlier attempts to manipulate context within traditional booths, such as changing ambient lighting or adding background sounds, provided useful but limited solutions [13]. Immersive technologies offer a more flexible alternative by allowing participants to experience virtual consumption contexts without leaving the laboratory. VR has therefore been increasingly explored as a platform for presenting context-rich sensory evaluation environments [11].
Several studies have demonstrated the feasibility of integrating VR into sensory assessment protocols. For example, comparisons among virtual booth, park, and food-court settings showed product-specific differences in JAR and CATA responses and immersion ratings for biscuits and orange juice [9]. Dynamic context testing found that identical blue cheese was perceived as more pungent in a virtual barn [7]. A chocolate study reported context-dependent emotional responses, while overall liking and intensity responses did not differ significantly across contexts [11]. Reviews indicate that engagement and affective responses can change in immersive eating contexts, but the direction and magnitude depend on the product, environment, and study design [10,12]. Augmented reality research has also combined real-world visual elements with digital overlays to create hybrid testing environments [14].
Despite this growing body of evidence, an important gap remains in the systematic assessment of VR sensory booths as complementary laboratory infrastructure rather than direct substitutes for physical booths. Many studies have focused on product ratings, emotional responses, or contextual effects, while fewer studies have provided data-driven evaluations of the operational requirements needed to deploy VR systems in sensory laboratories [15]. In particular, the relationship between participant satisfaction with the VR experience and concurrent VR-induced symptom burden, including oculomotor strain, disorientation, and general discomfort, has not been sufficiently characterised through a multivariate framework [15]. This relationship is essential for developing protocols that balance technological innovation with participant welfare.
Simulator sickness, commonly assessed using the Kennedy Simulator Sickness Questionnaire (SSQ), has been studied extensively in aviation, simulation, and gaming contexts, but its use in food sensory testing environments remains relatively limited [16]. The SSQ produces nausea, oculomotor, disorientation, and total scores, allowing a multidimensional assessment of symptom burden. A review of VR research reported a predominantly negative association between presence and cybersickness, while also noting mixed findings and uncertainty about the direction of this relationship [17]. However, the symptom profile associated with the seated and constrained posture typical of sensory booth evaluation has not been examined in sufficient detail.
This study addresses this gap by presenting the VR sensory booth as a complementary tool inspired by, but not fully compliant with, ISO 8589:2007 sensory laboratory guidance. The VR environment is not intended to replicate all controlled conditions of a physical booth. Instead, it functions as a flexible digital extension that can support sensory evaluation workflows while enabling controlled manipulation of virtual context. The present work contributes a multivariate characterisation of the relationship between post-VR experience and participant comfort, together with an exploratory grouping of participant experience ratings. This approach provides operational insights for calibration, symptom monitoring, headset setup, hygiene, staff training, data quality control, and stop criteria.
The primary objective of this study was to evaluate the usability, participant comfort, and operational requirements of the VR sensory booth laboratory through a pilot multivariate assessment. Five post-VR experience variables were assessed, including immersion, graphics quality, interaction, VR technology quality, and overall experience with VR. These ratings were analysed together with 16 VR-related symptoms, Kennedy SSQ scores, principal component analysis, cluster analysis, and Spearman correlations between post-VR experience and symptom outcomes. The aim was to move beyond descriptive usability reporting and identify participant acceptance profiles that can inform practical laboratory management recommendations. The analysed outcomes were participant experience and post-session comfort. JAR, CATA, and liking tasks were implemented in the application, but their product responses were not analysed in this assessment.
2. Materials and Methods
This section provides a detailed account of the methodological procedures employed in developing the VR sensory booth application, recruiting participants, conducting the experimental sessions, measuring key variables, and performing statistical analyses. The methods are structured to offer sufficient detail for reproducibility by other research groups.
2.1. VR Sensory Booth Application Development
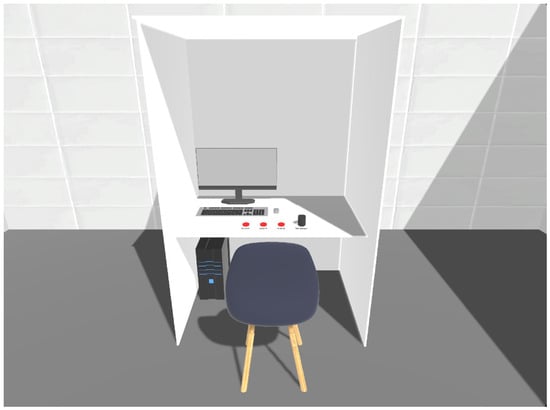
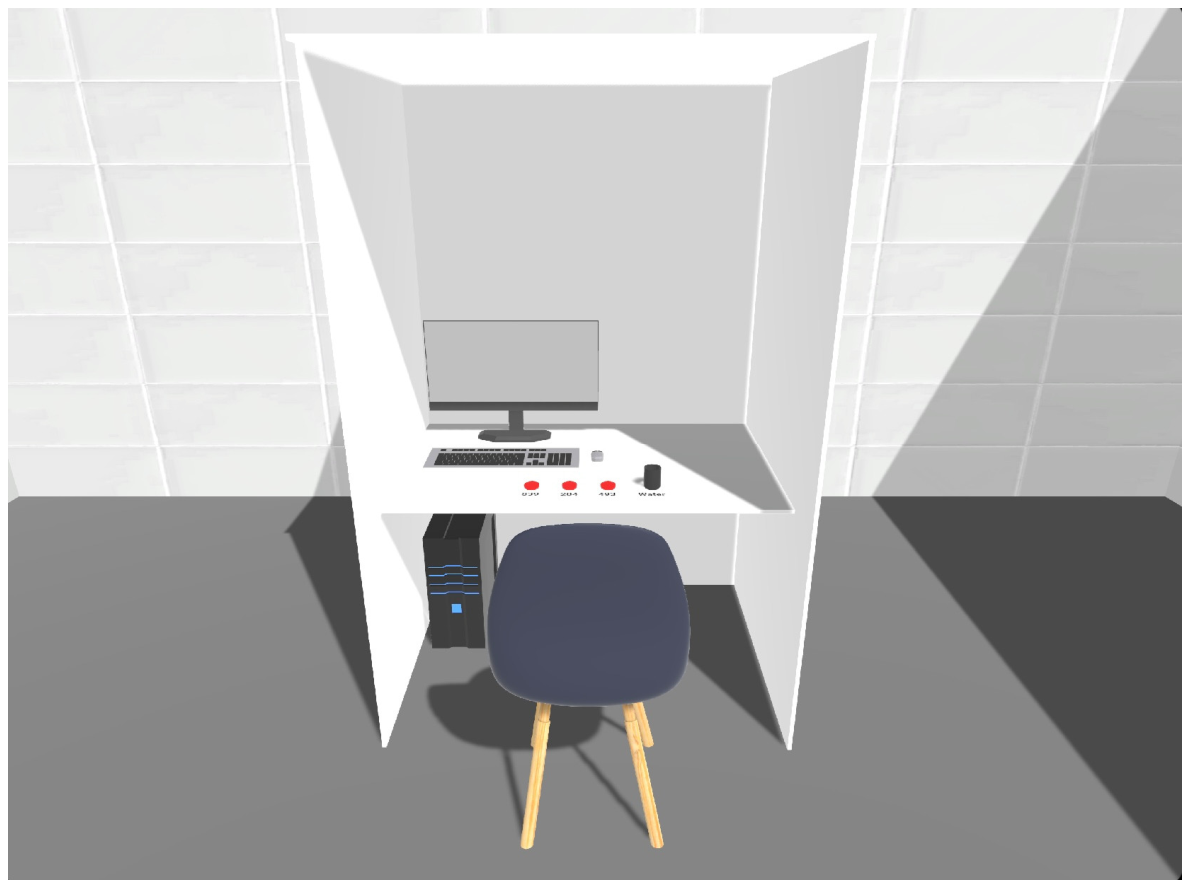
The VR sensory booth application (Figure 1) was developed using the Unity game engine (version 2022.3.10f1; Unity Technologies, San Francisco, CA, USA), specifically designed for the Oculus Quest 2 head-mounted display (Reality Labs, Meta Platforms Inc., Menlo Park, CA, USA). The software required several essential plugins, including the OpenXR Plugin version 1.8.2 (Unity Technologies), Oculus Integration version 57.0, and Oculus SDK version 1.3.2 (Meta Platforms Inc.), to enable proper hand tracking and device communication.
Figure 1.
Structure of the virtual reality sensory booth laboratory application developed in Unity 2022.3.10f1 for Oculus Quest 2. The system includes a configuration and calibration layer, a sensory evaluation layer, and an end scene to support structured sensory-task workflow.
The virtual booth environment was designed to closely emulate the physical sensory booth at the Hungarian University of Agriculture and Life Sciences (MATE). Its visual design was inspired by ISO 8589:2007 sensory laboratory guidance, using white or light grey walls and a virtual daylight lighting setting of approximately 6500 K. Virtual settings do not establish physical illumination or ventilation conditions; these depend on the laboratory and headset. The virtual booth dimensions were set to 1 m in width, 1 m in depth, and 2.5 m in height, containing a virtual computer monitor, a chair, a glass of water, and a three-digit randomised sample indicator that mimicked standard sensory testing protocols.
The application architecture comprised three distinct software layers, each serving a specific functional role in the testing workflow. The first layer was the configuration and calibration layer, which allowed both the laboratory assistant and the participant to adjust several parameters to accommodate individual participant needs before the actual sensory evaluation began. This layer included adjustments for participant height relative to the virtual desk, the distance at which food samples appeared to be placed, overall scene clarity, and a specific accommodation option for participants who wore eyeglasses. Calibration was performed once per participant at the start of their session. Furthermore, this layer contained a welcome screen, a digital consent form, a hand-tracking tutorial, and a sample-indicator tutorial. The hand-tracking tutorial trained participants to use the Oculus Quest 2 hand interaction features, specifically teaching the pinch motion using the index finger and thumb to select virtual objects. The sample-indicator tutorial allowed participants to practise picking up virtual food samples and returning them to their designated positions, simultaneously enabling the laboratory assistant to confirm that the physical sample placement in the real world corresponded correctly with its virtual representation.
The second layer was the sensory evaluation layer, which served as the core testing component of the application. This layer implemented two sensory-task formats: the just-about-right (JAR) scale and the check-all-that-apply (CATA) method. Two distinct sensory booth scenes, designated as SB1 and SB2, were implemented, both following the same procedural workflow while allowing the laboratory assistant to change product samples and sensory attributes as needed for different studies. Within this layer, participants first viewed a digital instruction page, then proceeded to evaluate virtual food samples labelled with randomised three-digit codes. The JAR questionnaire appeared first for each sample, followed by the CATA questionnaire, and this sequence repeated for each sample evaluated. After completing the attribute evaluations, participants rated their overall preference and liking using a five-point Likert scale. All instructional text, sample images, three-digit sample numbers, and attribute lists for both JAR and CATA tasks could be modified within the Unity editor. JAR, CATA, preference, and liking responses were functional components of the workflow and were not analysed as outcomes in the present usability assessment.
The third and final layer was the end scene, which simply informed participants that the experiment had concluded and thanked them for their participation. The laboratory assistant could then restart the application from the Unity interface to prepare for the next participant. The technical specifications, resource availability, software repository, and developer documentation for the VR Sensory Booth method are summarised in Table 1.
Table 1.
Specifications table for the VR Sensory Booth method [15].
2.2. Participants
A total of 325 participants were recruited for the pilot empirical assessment. The participant group comprised 176 female participants and 149 male participants. The mean age of the participant group was 24.58 years, with a standard deviation of 3.82 years. Participants were recruited from the university community using convenience sampling, primarily through word-of-mouth and student community networks. This recruitment approach was appropriate for the present pilot study, which aimed to evaluate the practical application, usability, and participant experience of the virtual sensory laboratory rather than to obtain a population-representative sample. All participants provided informed consent before participating. The study protocol was approved by the institutional ethics committee, and all procedures were conducted in accordance with the Declaration of Helsinki. Participants’ prior VR experience was not systematically recorded in the analysed dataset.
2.3. Experimental Procedure
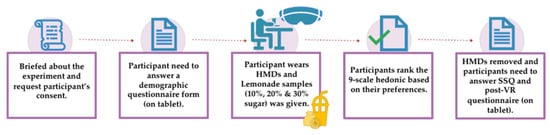
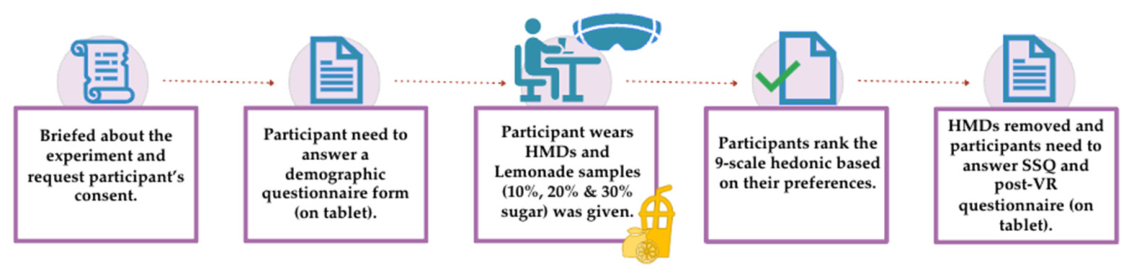
The session workflow is summarised in Figure 2. Upon arrival at the laboratory, each participant was greeted by a trained laboratory assistant who explained the purpose of the study and the operation of the VR headset. Participants first completed the digital consent form within the VR application. Following consent, the laboratory assistant guided each participant through the configuration and calibration layer, adjusting the virtual booth settings to match the participant’s height and visual needs. Before the formal evaluation, participants completed in-session familiarisation through the hand-tracking and sample-indicator tutorials, practising the pinch gesture and sample manipulation until they felt comfortable. The analysed dataset did not contain systematic records of procedural difficulties or the time required for individual familiarisation steps.
Figure 2.
Experimental workflow for the pilot usability assessment of the virtual reality sensory booth laboratory. Participants completed consent, headset calibration, hand-tracking training, sample-indicator practice, sensory evaluation tasks, post-VR experience ratings, and symptom assessment.
After calibration and training, participants entered the sensory evaluation layer. They were instructed to evaluate the presented food samples, which were physically placed on a table within reach while wearing the headset. The virtual environment displayed the corresponding three-digit sample code next to each physical sample, ensuring alignment between the virtual and real-world stimuli. Participants completed the JAR and CATA questionnaires in sequence for each sample, followed by the preference and liking ratings. The reported approximate duration of 20–30 min per participant covered the calibration, in-session familiarisation, and evaluation sequence. Familiarisation preceded the formal tasks within that session; separate training before attendance was not documented in the available study records. Separate phase durations were not available in the analysed dataset.
2.4. Measures
Immediately after completing the sensory evaluation tasks and before removing the headset, participants rated five VR experience variables on 10-point scales ranging from 1 (very poor) to 10 (excellent). These variables were immersion, which assessed the sense of being present in the virtual environment; graphics quality, which evaluated the visual fidelity of the virtual booth; interaction, which measured the ease and naturalness of using the hand-tracking controls; VR technology quality, which captured the overall technical performance of the headset and software; and overall experience, which asked for a global satisfaction rating for the session. A composite VR experience score was later calculated as the mean of these five individual ratings.
Following the experience ratings, participants reported the severity of 16 VR-related symptoms using a 0 to 3 scale, where 0 indicated no symptom, 1 indicated mild symptoms, 2 indicated moderate symptoms, and 3 indicated severe symptoms. The 16 symptoms were general discomfort, fatigue, headache, eye strain, difficulty focusing, salivation increasing, sweating, nausea, difficulty concentrating, fullness of head, blurred vision, dizziness with eyes open, dizziness with eyes closed, vertigo, stomach awareness, and burping. For each participant, a total symptom count was computed as the number of symptoms with a severity rating of 1 or higher, and symptom frequency was defined as the proportion of participants who reported each specific symptom. The symptom count was distinguished from the symptom severity sum, calculated by adding the 16 severity ratings (possible range 0–48). These indices describe the breadth and intensity of reported symptoms, respectively.
The same 16 symptom items were also used to calculate Kennedy Simulator Sickness Questionnaire scores [16]. Each symptom was scored from 0 to 3. The nausea score was calculated as the sum of general discomfort, salivation increasing, sweating, nausea, difficulty concentrating, stomach awareness, and burping, multiplied by 9.54. The oculomotor score was calculated as the sum of general discomfort, fatigue, headache, eye strain, difficulty focusing, difficulty concentrating, and blurred vision, multiplied by 7.58. The disorientation score was calculated as the sum of difficulty focusing, nausea, fullness of head, blurred vision, dizziness with eyes open, dizziness with eyes closed, and vertigo, multiplied by 13.92. The total SSQ score was calculated as the sum of the three unscaled subscale sums, multiplied by 3.74 [16,18]. Thus, general discomfort, difficulty focusing, nausea, difficulty concentrating, and blurred vision contribute to two subscale sums and are counted twice in the total. This follows Kennedy’s weighting scheme and differs from multiplying the sum of 16 unique item ratings by 3.74.
2.5. Statistical Analysis
All statistical analyses were conducted in XLSTAT-Student 2025.2.0.1432 (Addinsoft, Paris, France) within Microsoft Excel 16.109531 (Microsoft Corporation, Redmond, WA, USA). Descriptive statistics included means, standard deviations, medians, minima, maxima, and symptom frequencies for post-VR experience variables, VR-related symptoms, total symptom count, and SSQ scores. Principal component analysis was performed on the correlation matrix of the five post-VR experience variables. During the earlier revision, descriptive statistics, PCA, participant-ID linkage, Kruskal–Wallis tests, SSQ scoring, and correlations were independently rechecked in Python using NumPy and SciPy. SDs use the sample denominator (n − 1), and IQRs are the difference between the 75th and 25th percentiles. For the present editorial revision, these checks were repeated in Python 3.12.14 with NumPy 2.3.5 and SciPy 1.18.1; the reported findings were reproduced. The saved Ward node tree and participant assignments were retained.
Participant profiles were identified by agglomerative hierarchical clustering with Euclidean distance and Ward’s method on all five PCA scores derived from standardised experience ratings. Retaining all five scores preserves Euclidean distances in the standardised rating space. The workbook’s three-cluster solution and participant assignments were retained; cluster sizes were 151, 119, and 55. The saved node tree was independently checked against Ward increases in within-cluster inertia. High, moderate, and lower acceptance are descriptive labels for the rating profiles, rather than validated psychological categories. Differences across clusters were assessed separately for symptom count and symptom severity sum using tie-corrected Kruskal–Wallis tests. Spearman correlations were calculated between the five experience ratings, their composite mean, and symptom count, SSQ nausea, SSQ oculomotor, SSQ disorientation, and corrected SSQ total. Correlation p-values were recomputed using the two-sided asymptotic t approximation. Analyses were exploratory, with unadjusted p < 0.05 used as the significance criterion.
3. Results
3.1. Participant Demographics
The results of the empirical assessment are organised into six subsections, beginning with participant demographics, followed by post-VR experience ratings, symptom and SSQ outcomes, principal component analysis, cluster analysis, and the relationship between post-VR experience and SSQ scores.
A total of 325 participants completed the pilot empirical assessment. The participant group included 176 females (54.15%) and 149 males (45.85%). Age ranged from 18 to 42 years, with a mean of 24.58 years (SD 3.82); female participants had a mean age of 24.45 years (SD 3.56), and male participants had a mean age of 24.72 years (SD 4.11). Table 2 summarises the demographic profile of the participant group.
Table 2.
Participant demographic characteristics (N = 325).
3.2. VR Experience Ratings
Post-VR experience ratings were generally favourable across the five evaluated dimensions. The highest mean score was observed for overall experience with VR (mean 8.077, SD 1.467, median 9), followed by VR technology quality (mean 7.655, SD 1.371, median 8), interaction (mean 7.218, SD 1.882, median 8), graphics quality (mean 7.068, SD 1.718, median 7), and immersion (mean 6.825, SD 1.891, median 7). The composite post-VR experience score, calculated as the mean of the five ratings, had a mean of 7.369 (SD 1.251), a median of 7.6, and a range from 2.60 to 9.60. Immersion and interaction showed similar variability, both greater than the variability in the global evaluation of the VR session. Table 3 presents the full descriptive statistics.
Table 3.
Descriptive statistics for VR experience ratings (N = 325, scale 1–10).
3.3. Symptom Assessment
Assessment of symptom prevalence showed a mean total symptom count of 3.538 (SD 3.336), with a median of 3 symptoms per participant (Q1–Q3: 1–5; IQR 4) and a range from 0 to 16. Sixty-nine participants (21.23%) reported no symptoms, while a smaller number reported many symptoms. This concentration at low counts with a longer upper tail explains the SD relative to the mean; the mean and SD are therefore supplemented by the median and IQR. The most frequently reported symptoms were blurred vision, reported by 137 participants (42.15%), eye strain, reported by 130 participants (40.00%), and difficulty focusing, reported by 123 participants (37.85%). Salivation increasing was reported by 101 participants (31.08%), fullness of head by 100 participants (30.77%), and general discomfort by 96 participants (29.54%). Difficulty concentrating was reported by 82 participants (25.23%), fatigue by 74 participants (22.77%), dizziness with eyes open by 65 participants (20.00%), sweating by 49 participants (15.08%), dizziness with eyes closed by 47 participants (14.46%), vertigo by 41 participants (12.62%), headache by 37 participants (11.38%), nausea by 26 participants (8.00%), stomach awareness by 24 participants (7.38%), and burping by 18 participants (5.54%). Mean severity scores were low across all symptoms, with the highest values observed for blurred vision (0.588), eye strain (0.542), difficulty focusing (0.523), salivation increasing (0.449), and fullness of head (0.415). These findings indicate that visual and oculomotor complaints were more prominent than nausea-dominant symptoms. Table 4 presents the full symptom profile.
Table 4.
Frequency and severity of reported VR-related symptoms (N = 325).
Kennedy SSQ scoring showed a mean nausea score of 15.558 (SD 19.956), a mean oculomotor score of 21.201 (SD 23.772), a mean disorientation score of 30.153 (SD 35.833), and a mean SSQ total score of 24.661 (SD 26.722). Median values were 9.54 for nausea, 15.16 for oculomotor, 13.92 for disorientation, and 14.96 for SSQ total. The scores were dispersed and positively skewed; median and IQR values are reported in Table 5. Subscales use different multipliers, so their numerical means should not be treated as directly comparable indicators of symptom predominance. Table 5 summarises the descriptive SSQ results.
Table 5.
Simulator Sickness Questionnaire [16] subscale and total score descriptive statistics (N = 325).
3.4. Principal Component Analysis
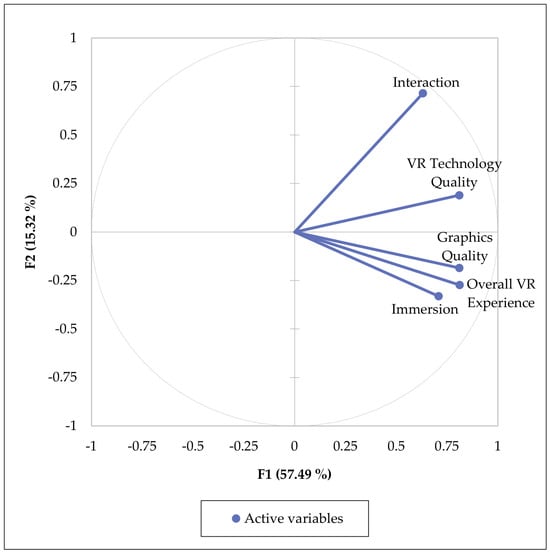
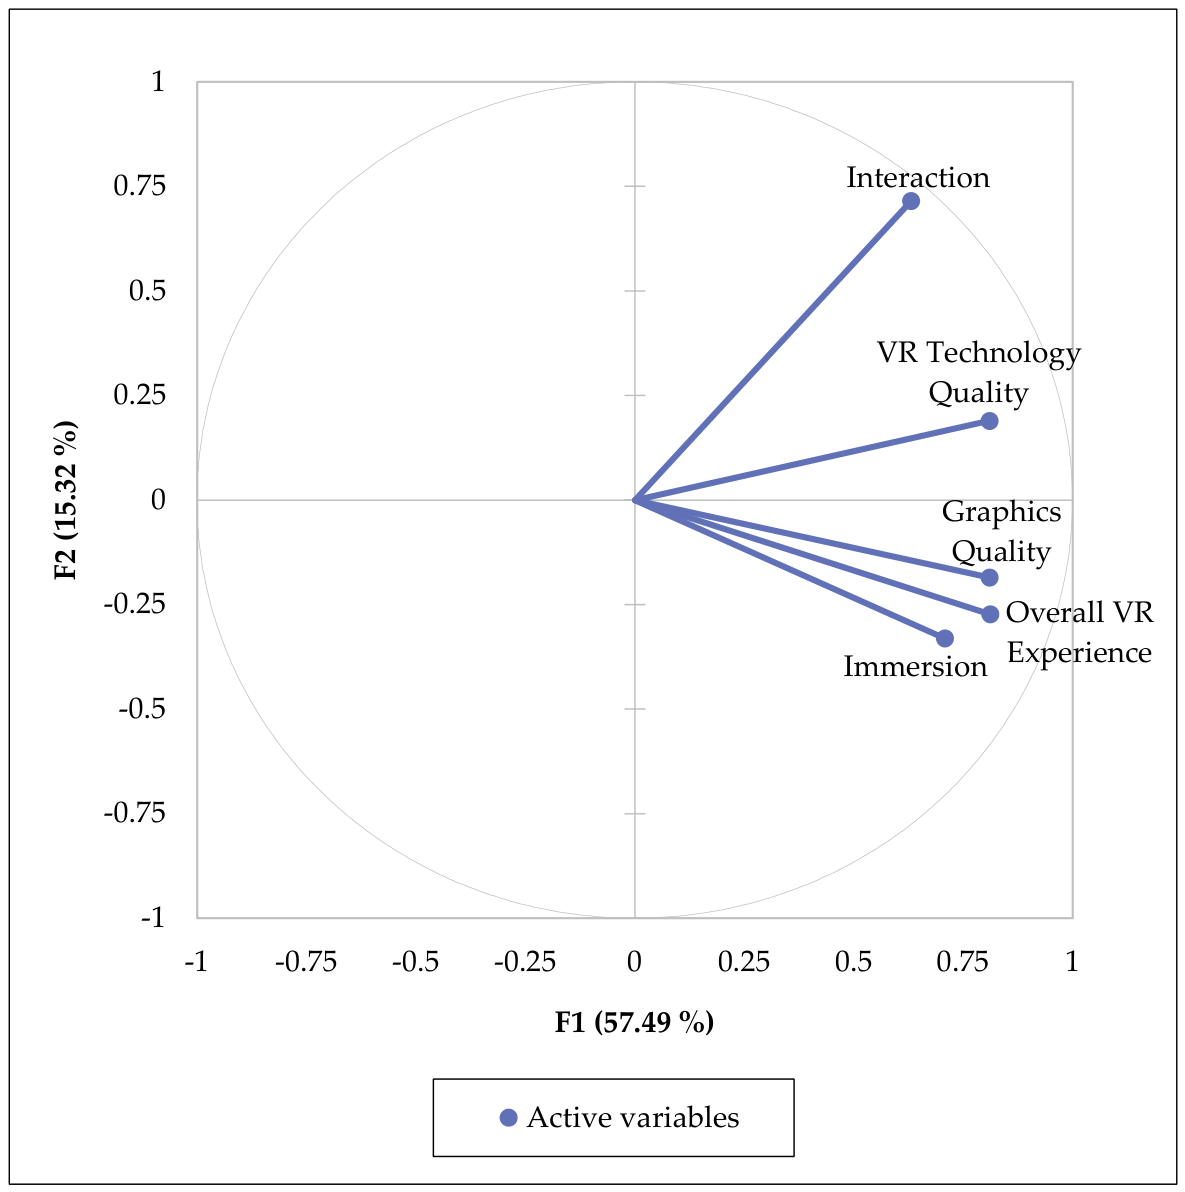
Principal component analysis was performed on the correlation matrix of the five post-VR experience variables using XLSTAT. PC1 had an eigenvalue of 2.874 and explained 57.49% of the total variance; PC2 explained an additional 15.32%. Together, PC1 and PC2 explained 72.81%. Because this cumulative variance was below 80%, PC3 was additionally examined. PC3 explained a further 11.68%, increasing cumulative explained variance to 84.49% (Table 6).
Table 6.
Principal component analysis results for the five post-VR experience variables (N = 325).
Variable rows report correlations with components from XLSTAT. Original component signs are retained. Eigenvalues and correlations are rounded to three decimals; variance percentages to two.
Figure 3 presents the PC1–PC2 correlation circle. All five variables had positive correlations with PC1, indicating dominant shared variation across the post-VR ratings. PC2 was most strongly related to interaction. PC3 is reported numerically in Table 6, with immersion having the largest absolute variable–component correlation. PC2 and PC3 had eigenvalues below 1 and are interpreted descriptively.
Figure 3.
Correlation circle of the first two principal components for the five post-VR experience variables. PC1 explained 57.49% of the total variance and PC2 explained 15.32%, giving a cumulative explained variance of 72.81%. Results were obtained from PCA of the correlation matrix using XLSTAT. The vectors reproduce the exact XLSTAT variable–component correlations.
3.5. Cluster Analysis
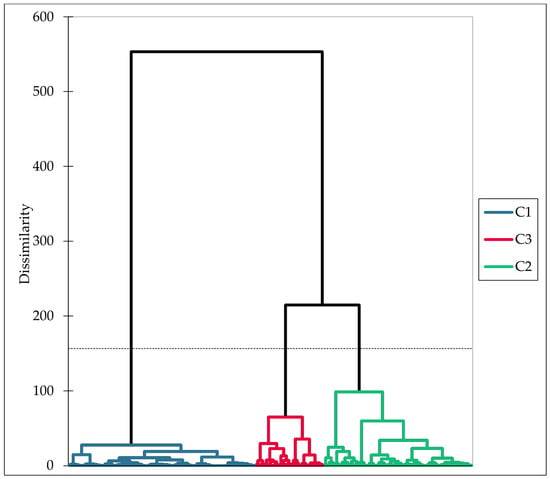
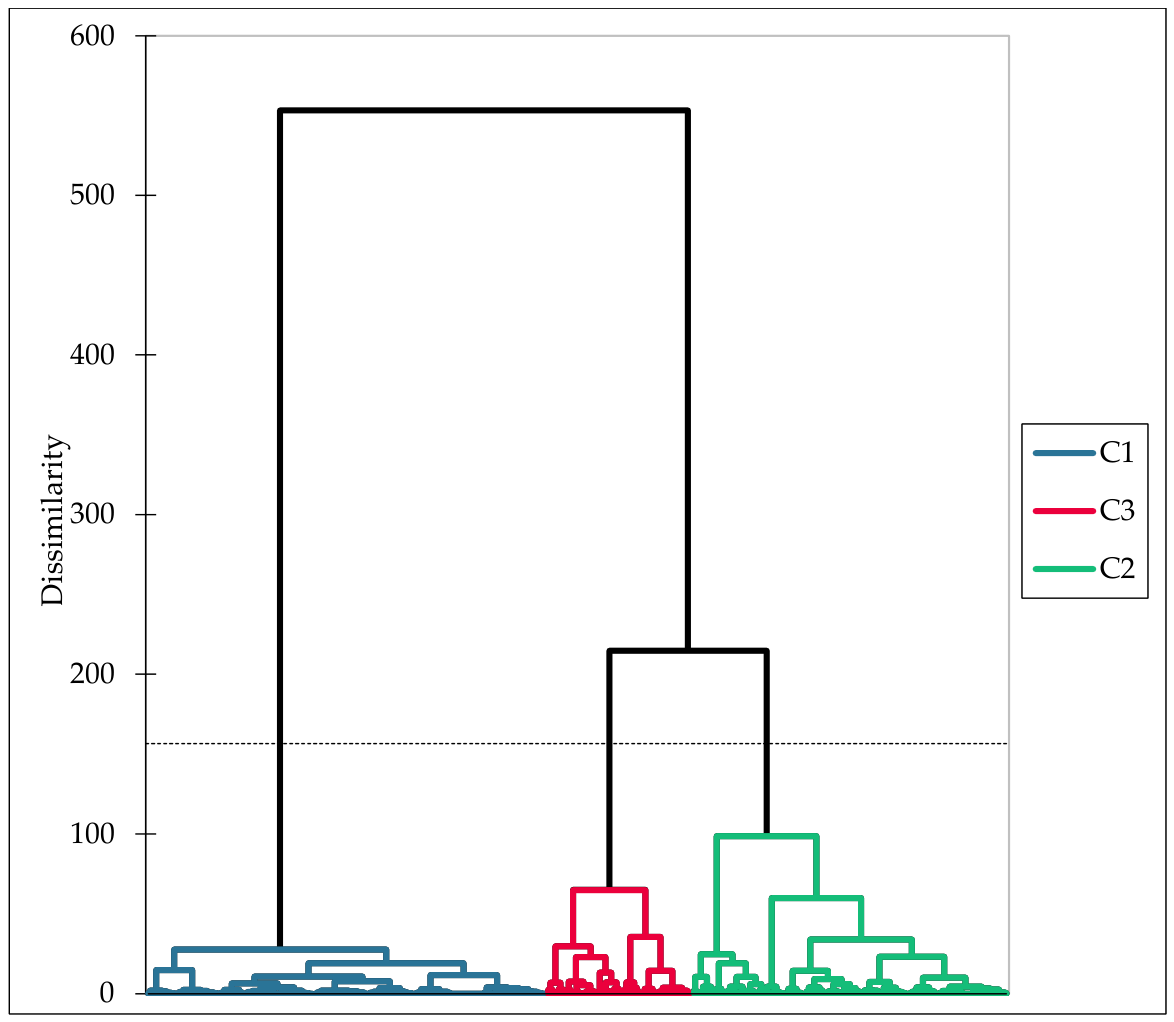
Agglomerative hierarchical clustering identified three participant rating profiles. The high acceptance cluster included 151 participants (46.46%), the moderate acceptance cluster 119 (36.62%), and the lower acceptance cluster 55 (16.92%). Composite experience scores were 8.397 (SD 0.453), 6.955 (SD 0.636), and 5.440 (SD 0.896), respectively. Mean symptom counts were 2.464 (SD 2.705; median 2), 4.218 (SD 3.530; median 4), and 5.018 (SD 3.572; median 5). In contrast, mean symptom severity sums were 3.046 (SD 3.619), 5.773 (SD 5.745), and 6.836 (SD 5.676). Both outcomes showed greater symptom burden in groups with lower experience ratings. Table 7 reports the cluster statistics with the outcomes clearly distinguished.
Table 7.
Experience ratings, symptom counts, and symptom severity sums in the retained three-cluster solution (N = 325). Count denotes the number of items rated ≥ 1 (0–16); severity sum denotes the sum of all 16 item ratings (0–48).
Figure 4 presents the retained three-cluster solution and its cut in the original Ward node tree. Symptom count differed across the three clusters, H(2) = 32.612, p = 8.29 × 10⁻⁸. The separate analysis of symptom severity sum gave H(2) = 33.609, p = 5.03 × 10⁻⁸. These results describe differences between rating profiles and do not establish that symptoms caused lower ratings.
Figure 4.
Dendrogram reconstructed from the workbook’s Ward node tree using all five PCA scores of standardised experience ratings. The horizontal axis shows participants in leaf order; individual labels are omitted for readability. Dissimilarity is the Ward increase in within-cluster inertia. The dashed cut at 156.66 retains high (n = 151), moderate (n = 119), and lower (n = 55) acceptance profiles; the bars identify the corresponding leaf groups. Labels describe experience-rating profiles.
3.6. Relationship Between Post-VR Experience and SSQ Scores
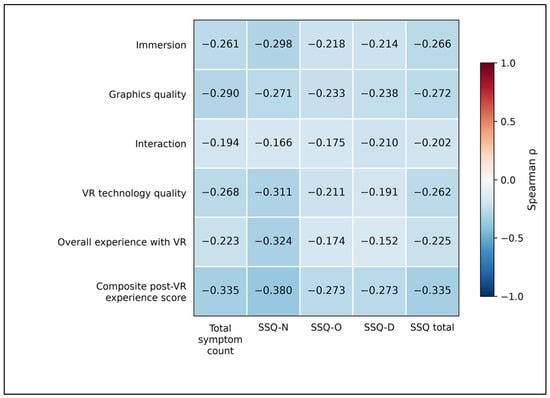
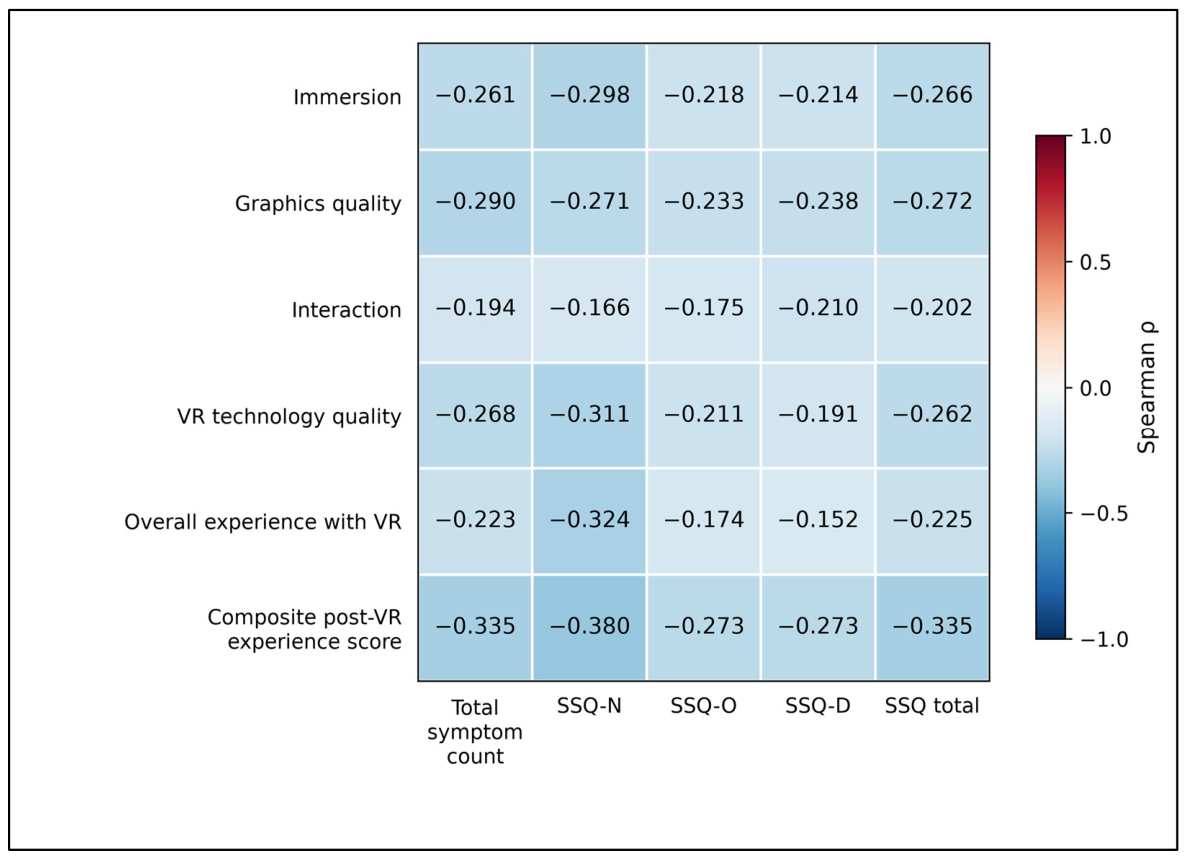
Spearman correlation analysis showed that higher post-VR experience ratings were consistently associated with lower symptom burden and lower SSQ scores. Figure 5 presents these relationships as a Spearman correlation heatmap based on the correlation matrix. All post-VR experience variables showed significant negative correlations with total symptom count, SSQ nausea, SSQ oculomotor, SSQ disorientation, and SSQ total. The correlation coefficients ranged from ρ = −0.152 to ρ = −0.380, indicating weak to moderate associations.
Figure 5.
Spearman correlations between six post-VR experience measures and five symptom outcomes (N = 325). Cells show ρ to three decimal places on a common −1 to +1 scale. SSQ-N, SSQ-O, and SSQ-D denote nausea, oculomotor, and disorientation scores. Negative values indicate that higher experience ratings were associated with lower symptom burden. SSQ total was recalculated using the overlapping item weights of Kennedy’s scoring scheme. All displayed associations had unadjusted two-sided p < 0.05; the analysis is exploratory.
The composite post-VR experience score showed the strongest overall pattern. It was negatively correlated with total symptom count (ρ = −0.335, p < 0.0001), SSQ nausea (ρ = −0.380, p < 0.0001), SSQ oculomotor (ρ = −0.273, p < 0.0001), SSQ disorientation (ρ = −0.273, p < 0.0001), and SSQ total (ρ = −0.335, p < 0.0001). Among the individual post-VR variables, the strongest associations were observed between overall experience with VR and SSQ nausea (ρ = −0.324, p < 0.0001), VR technology quality and SSQ nausea (ρ = −0.311, p < 0.0001), immersion and SSQ nausea (ρ = −0.298, p < 0.0001), and graphics quality and total symptom count (ρ = −0.290, p < 0.0001).
Interaction showed the weakest but still significant negative associations with symptom and SSQ outcomes, with correlations ranging from ρ = −0.166 for SSQ nausea to ρ = −0.210 for SSQ disorientation. Overall experience with VR also showed significant negative correlations with SSQ outcomes, although the association with SSQ disorientation was the weakest among these results (ρ = −0.152, p = 0.006). These findings indicate that better post-VR experience ratings were associated with lower nausea, lower oculomotor burden, lower disorientation, lower total SSQ score, and fewer reported symptoms.
4. Practical Recommendations
The empirical findings from this pilot assessment, including the identification of three participant clusters with different symptom burdens and the negative relationships between post-VR experience ratings and SSQ outcomes, inform a set of practical recommendations for establishing and operating a VR sensory booth laboratory. These proposed recommendations connect the participant experience and symptom findings with operational considerations for laboratory use; their effectiveness was not tested in this assessment. Twelve recommendations are organised into technical, procedural, safety, and human-factor categories, as summarised in Table 8.
Table 8.
Practical recommendations for VR sensory booth laboratory management.
Regarding the physical space and equipment setup, we recommend that laboratory managers designate a dedicated room for VR sensory testing that is separate from the area where conventional booth tests are conducted. This room should be free of reflective surfaces that could interfere with the headset’s tracking cameras and should have sufficient electrical outlets for charging multiple headsets. For participant safety, the pre-screening protocol should ask about recent sleep deprivation, medication that affects balance, or a known history of severe motion sickness, as these factors have been linked to increased cybersickness susceptibility [19,20]. The cleaning schedule is critical for maintaining hygiene, especially during periods of high testing throughput, and we suggest using disposable face masks or covers in addition to wiping down the headset foam padding.
The software workflow should begin with a calibration menu that allows the participant to adjust the virtual scene to their eye height and the distance of the sample tray, as we observed that individual differences in height significantly affected the comfort of the reaching motion required to pick up the sample. We also recommend that the tutorial scene be mandatory for all first-time participants, as the hand-tracking interaction variable showed substantial variability in our study, and a brief training period can help reduce frustration for those in the lower acceptance cluster [21]. After the session, the symptom questionnaire should be administered immediately, and any participant reporting a symptom severity of 3 on any item should be offered a break and water before leaving the room.
The calibration of the headset for each participant is perhaps the most straightforward yet impactful recommendation. The Oculus Quest 2 includes manual lens-spacing adjustment, and staff should be trained to demonstrate its use to participants. In our study, the high prevalence of blurred vision (42.15%) and eye strain (40.00%) supports attention to headset adjustment and visual comfort. For sample handling, we advise that the physical food samples be placed on a simple white tray within arm’s reach of the participant, positioned to match the location of the virtual sample indicator in the VR scene, thus minimising the cognitive load of reaching for a real object while seeing a virtual one.
Staff training should include a session where the staff member goes through the entire VR protocol as a participant, allowing them to understand the sensory experience firsthand. This training should also cover how to encourage participants to report symptoms early, as some individuals may be hesitant to complain, and how to distinguish between mild discomfort that can be managed with a short break and more severe symptoms that require session termination. For data quality, automated validation checks within the VR application should verify that all required JAR and CATA responses have been completed before allowing the participant to advance to the next sample, preventing incomplete data sets that would later require manual correction.
Technical documentation should be kept in the form of a digital logbook that includes timestamps for each session, the headset used, any error messages encountered, and the participant’s anonymous ID. Over time, this log will help identify patterns of hardware failure or software bugs that require patch updates. Finally, the emergency procedures should be posted visibly in the laboratory and rehearsed with staff quarterly. Participants should be informed at the start of the session that they can remove the headset at any time without penalty, and staff should have a clear path to the participant’s chair to assist with headset removal if needed. These twelve recommendations collectively provide a comprehensive framework for safe and efficient VR sensory testing, informed by the experience and symptom findings and by broader digital sensory laboratory literature [22]. Their effectiveness requires prospective evaluation.
5. Discussion
The PCA indicated substantial shared variation among the five post-VR experience ratings. PC1 explained 57.49% of variance and showed positive correlations with all five variables, indicating that favourable ratings tended to co-occur. PC2 explained 15.32%, while PC3 contributed a further 11.68%, bringing cumulative explained variance to 84.49% (Table 6). Because PC2 and PC3 had eigenvalues below 1, these components were interpreted descriptively. Halo effects have been discussed in evaluations of other technologies [23], but the present PCA did not test that mechanism. The interaction findings motivate further investigation of gesture recognition and hand-tracking stability [24].
The cluster analysis showed heterogeneity in participant ratings and symptom burden. High, moderate, and lower acceptance profiles comprised 151 (46.46%), 119 (36.62%), and 55 (16.92%) participants, with composite experience means of 8.397, 6.955, and 5.440. The corresponding symptom-count means were 2.464, 4.218, and 5.018; the distinct severity-sum means were 3.046, 5.773, and 6.836. The verified count test was H(2) = 32.612, p = 8.29 × 10⁻⁸, and the severity-sum test was H(2) = 33.609, p = 5.03 × 10⁻⁸. Separating these outcomes resolves the earlier reporting inconsistency. The results support attention to differences in participant comfort, but they do not validate pre-screening thresholds or show that discomfort caused lower ratings. A brief history of motion sickness, visual discomfort, balance problems, or negative VR exposure could be considered in future screening protocols [19].
The post-VR experience ratings and SSQ scores reflected related but distinct dimensions of system performance. Post-VR ratings captured immersion, graphics quality, interaction, technical quality, and global evaluation of the session, whereas SSQ scores captured physical comfort and simulator sickness burden. All correlations between post-VR experience variables and SSQ outcomes were negative and statistically significant, indicating that better post-VR evaluations were accompanied by lower symptom burden. The composite post-VR experience score showed the strongest overall pattern, especially for SSQ nausea (ρ = −0.380, p < 0.0001), SSQ total (ρ = −0.335, p < 0.0001), and total symptom count (ρ = −0.335, p < 0.0001). However, the magnitude of these associations was weak to moderate rather than strong. This result indicates that favourable usability does not remove the need for active symptom monitoring.
These findings have direct practical relevance for VR sensory laboratories. Visual clarity, headset fit, interpupillary distance adjustment, lens cleanliness, text readability, and session duration are likely to influence both subjective acceptance and physical comfort. The prominence of blurred vision, eye strain, and difficulty focusing suggests that calibration and optical setup should be treated as routine operational checks rather than optional refinements. Immediate reporting of early symptoms remains essential because a participant can rate the system positively while still experiencing relevant discomfort.
The composite experience score was negatively associated with symptom count (ρ = −0.335). This weak-to-moderate association leaves substantial variation in experience ratings uncharacterised by symptom count alone. Squaring ρ does not establish the percentage of experience variation caused by symptoms, and these concurrent ratings cannot determine the direction of the relationship. Among the individual measures, graphics quality (ρ = −0.290) and immersion (ρ = −0.261) were more strongly associated with symptom count than overall experience (ρ = −0.223). These patterns motivate evaluation of visual clarity, headset fit, lens position, and text readability, but improvements in these settings were not experimentally tested here [25].
Limitations and Future Work
The participants came from a university community and were relatively young (mean age 24.58 years, SD 3.82; range 18–42). These results should not be generalised automatically to older adults or broader populations. Age, visual characteristics, digital familiarity, and cultural context may affect interaction, visual fatigue, motion sickness, and the evaluation of immersive systems. Future validation should broaden the age distribution and cultural and socioeconomic representation. Participants’ prior VR experience was not systematically recorded; its potential influence on interaction familiarity, comfort, and symptom susceptibility could therefore not be evaluated.
The assessment used a single headset, Oculus Quest 2. The findings have not been validated on HTC Vive Pro, Valve Index, Pico, or other HMD systems. Display technology, refresh rate, field of view, latency, lens design, device weight, fit, weight distribution, and ergonomics may influence visual comfort, interaction, and symptom burden [21,25]. Comparative studies should assess user experience and symptoms alongside these hardware characteristics.
Each participant completed one session, so habituation, repeated exposure, and accumulated fatigue could not be assessed. No conventional-booth comparator or pre-session symptom baseline was available in the analysed dataset. Post-session symptom reports therefore do not establish changes attributable to VR. The analysed outcomes were experience ratings and symptoms; JAR, CATA, and liking responses were not available for this analysis. Consequently, this study does not demonstrate equivalence or improvement in sensory-product measurement relative to conventional testing.
Future research should measure prior VR exposure and examine repeated sessions in more diverse participant groups. Cross-platform comparisons should evaluate display and interaction characteristics together with experience ratings and symptom burden. Within-participant comparisons of conventional and VR booths are also needed to test agreement in sensory-product responses [5,6,7]. Habituation deserves investigation rather than assumption [20]. Standardised reporting should document headset model, display settings, field of view, latency, calibration, interaction method, session duration, and symptom monitoring.
The broader implication of this study is that the VR sensory booth should be positioned as a complementary tool rather than a replacement for conventional booths. The system offers practical advantages, such as the ability to simulate lighting conditions, product package designs, digital interfaces, or eating environments without physical reconstruction. At the same time, the usability data and symptom profiles show that safe deployment requires structured laboratory management. The evidence supports a practical framework that combines pre-screening, calibration, hygiene, post-session SSQ monitoring, early symptom reporting, and clear stop criteria. This framework can help sensory science laboratories integrate VR tools responsibly while monitoring participant welfare and data quality [22]. The recommendations are operational proposals rather than a validated assurance of safety.
6. Conclusions
This single-session assessment of 325 participants found favourable overall experience with the VR sensory booth, alongside heterogeneous post-session symptom burden. Experience ratings tended to vary together, and participants with lower ratings reported more symptoms and higher severity sums. The negative associations with SSQ outcomes were weak to moderate and do not establish causality. Visual symptoms, particularly blurred vision, eye strain, and difficulty focusing, were common enough to warrant routine monitoring.
The booth offers a feasible prototype for complementing conventional sensory laboratory infrastructure. Its operational use should include participant familiarisation, individual calibration, headset hygiene, alignment of physical samples with virtual indicators, prompt symptom reporting, and clear procedures for stopping a session. These recommendations are informed by the observed experience and symptom patterns; their effectiveness has not yet been tested. Favourable usability alone does not establish sensory measurement equivalence or assure participant comfort.
Further validation should include broader age and cultural groups, systematically recorded prior VR exposure, repeated sessions, and alternative HMDs. Direct comparisons with conventional booths using actual sensory-product outcomes are needed before drawing conclusions about sensory testing performance.
Author Contributions
Conceptualization, A.H.Z., C.T., B.B. and A.G.; methodology, A.H.Z. and B.B.; validation, A.H.Z., C.T., B.B. and A.G.; formal analysis, A.H.Z. and B.B.; investigation, A.H.Z., C.T., B.B. and A.G.; data curation, A.H.Z., C.T., B.B. and A.G.; writing—original draft preparation, A.H.Z., C.T., B.B. and A.G.; writing—review and editing, A.H.Z., C.T., B.B. and A.G.; visualization, A.H.Z.; supervision, A.H.Z. and A.G. All authors have read and agreed to the published version of the manuscript.
Funding
This research received no external funding.
Institutional Review Board Statement
The study was conducted in accordance with the Declaration of Helsinki and approved by the MATE internal ethics committee on 7 September 2023 (approval number: MATE-BC/2098-1/2023).
Informed Consent Statement
Informed consent was asked and obtained from all subjects involved in the study.
Data Availability Statement
Dataset available on request from the authors.
Acknowledgments
B.B. and C.T. are grateful for the support of the Doctoral School of Agricultural and Food Sciences, MATE. B.B. is supported by the EKÖP-26-D/MATE-8 university Research Scholarship Programme of the Ministry for Culture and Innovation from the source of the National Research, Development and Innovation Fund. C.T. also gratefully acknowledges the financial support from the China Scholarship Council (CSC) and the Stipendium Hungaricum Scholarship Programme. This work was supported by the Research Excellence Programme and the Flagship Research Groups Programme of the Hungarian University of Agriculture and Life Sciences.
Conflicts of Interest
The authors declare no conflicts of interest.
References
- ISO 8589:2007; Sensory Analysis—General Guidance for the Design of Test Rooms. International Organization for Standardization: Geneva, Switzerland, 2007.
- Eggert, J.; Zook, K. Physical Requirement Guidelines for Sensory Evaluation Laboratories: Spons. by ASTM Committee E-18 on Sensory Evaluation of Materials and Products; ASTM special technical publication no. 913; ASTM: Philadelphia, PA, USA, 1986. [Google Scholar]
- Stone, H.; Bleibaum, R.N.; Thomas, H.A. Sensory Evaluation Practices, 5th ed.; Academic Press: London, UK, 2021. [Google Scholar]
- Khatwani, S. Sensory Evaluation Techniques for Food. S.l.; Educohack Press: New Delhi, India, 2025. [Google Scholar]
- Low, J.Y.; Antlej, K.; Garvey, E.C.; Wang, Q.J. Recreating digital context: Navigating the future of food sensory studies through recent advances and applications. Curr. Opin. Food Sci. 2024, 57, 101176. [Google Scholar] [CrossRef] [Scilit]
- Crofton, E.C.; Botinestean, C.; Fenelon, M.; Gallagher, E. Potential applications for virtual and augmented reality technologies in sensory science. Innov. Food Sci. Emerg. Technol. 2019, 56, 102178. [Google Scholar] [CrossRef] [Scilit]
- Stelick, A.; Penano, A.G.; Riak, A.C.; Dando, R. Dynamic Context Sensory Testing–A Proof of Concept Study Bringing Virtual Reality to the Sensory Booth. J. Food Sci. 2018, 83, 2047–2051. [Google Scholar] [CrossRef] [Scilit] [PubMed]
- Bhavadharini, B.; Monica, V.; Anbarasan, R.; Mahendran, R. Virtual, augmented, and mixed reality as a versatile tool in food consumer behavior evaluation: Recent advances in aroma, taste, and texture incorporation. Comp. Rev. Food Sci. Food Safe 2023, 22, 4925–4956. [Google Scholar] [CrossRef] [Scilit] [PubMed]
- Zulkarnain, A.H.; Gere, A. Application of Different Sensory Methods in Virtual Reality Sensory Analysis: Evaluating the Impact of Immersive Environments on Food Perception. Meas. Food 2026, 23, 100303. [Google Scholar] [CrossRef] [Scilit]
- Zulkarnain, A.H.B.; Moskowitz, H.R.; Kókai, Z.; Gere, A. Enhancing consumer sensory science approach through augmented virtuality. Curr. Res. Food Sci. 2024, 9, 100834. [Google Scholar] [CrossRef] [Scilit] [PubMed]
- Kong, Y.; Sharma, C.; Kanala, M.; Thakur, M.; Li, L.; Xu, D.; Harrison, R.; Torrico, D.D. Virtual Reality and Immersive Environments on Sensory Perception of Chocolate Products: A Preliminary Study. Foods 2020, 9, 515. [Google Scholar] [CrossRef] [Scilit] [PubMed]
- Giezenaar, C.; Hort, J. A narrative review of the impact of digital immersive technology on affective and sensory responses during product testing in digital eating contexts. Food Res. Int. 2021, 150, 110804. [Google Scholar] [CrossRef] [Scilit] [PubMed]
- Dacremont, C.; Sester, C. Context in food behavior and product experience—A review. Curr. Opin. Food Sci. 2019, 27, 115–122. [Google Scholar] [CrossRef] [Scilit]
- Dong, Y.; Sharma, C.; Mehta, A.; Torrico, D.D. Application of Augmented Reality in the Sensory Evaluation of Yogurts. Fermentation 2021, 7, 147. [Google Scholar] [CrossRef] [Scilit]
- Zulkarnain, A.H.B.; Kókai, Z.; Gere, A. Immersive sensory evaluation: Practical use of virtual reality sensory booth. MethodsX 2024, 12, 102631. [Google Scholar] [CrossRef] [Scilit] [PubMed]
- Kennedy, R.S.; Lane, N.E.; Berbaum, K.S.; Lilienthal, M.G. Simulator Sickness Questionnaire: An Enhanced Method for Quantifying Simulator Sickness. Int. J. Aviat. Psychol. 1993, 3, 203–220. [Google Scholar] [CrossRef] [Scilit] [PubMed]
- Weech, S.; Kenny, S.; Barnett-Cowan, M. Presence and Cybersickness in Virtual Reality Are Negatively Related: A Review. Front. Psychol. 2019, 10, 158. [Google Scholar] [CrossRef] [Scilit] [PubMed]
- Bimberg, P.; Weissker, T.; Kulik, A. On the Usage of the Simulator Sickness Questionnaire for Virtual Reality Research. In Proceedings of the 2020 IEEE Conference on Virtual Reality and 3D User Interfaces Abstracts and Workshops (VRW), Atlanta, GA, USA; IEEE: New York, NY, USA, 2020; pp. 464–467. [Google Scholar] [CrossRef] [Scilit]
- Kourtesis, P.; Papadopoulou, A.; Roussos, P. Cybersickness in Virtual Reality: The Role of Individual Differences, Its Effects on Cognitive Functions and Motor Skills, and Intensity Differences during and after Immersion. Virtual Worlds 2024, 3, 62–93. [Google Scholar] [CrossRef] [Scilit]
- Yang, Y.; Kang, S.; Kim, M.; Kim, G.J.; Kim, H. BalanceVR: Balance training to increase tolerance to cybersickness in immersive virtual reality. Virtual Real. 2025, 29, 39. [Google Scholar] [CrossRef] [Scilit]
- Molina, G.; Gimeno, J.; Portalés, C.; Casas, S. A comparative analysis of two immersive virtual reality systems in the integration and visualization of natural hand interaction. Multimed. Tools Appl. 2022, 81, 7733–7758. [Google Scholar] [CrossRef] [Scilit]
- Cosme, F.; Rocha, T.; Marques, C.; Barroso, J.; Vilela, A. Innovative Approaches in Sensory Food Science: From Digital Tools to Virtual Reality. Appl. Sci. 2025, 15, 4538. [Google Scholar] [CrossRef] [Scilit]
- Kraciuk, J.; Kacperska, E.M.; Idzik, M. The Halo Effect as a Factor Influencing Consumer Trust in Innovative Technological Solutions. Sustainability 2026, 18, 2984. [Google Scholar] [CrossRef] [Scilit]
- Voigt-Antons, J.-N.; Kojic, T.; Ali, D.; Moller, S. Influence of Hand Tracking as a Way of Interaction in Virtual Reality on User Experience. In Proceedings of the 2020 Twelfth International Conference on Quality of Multimedia Experience (QoMEX), Athlone, Ireland; IEEE: New York, NY, USA, 2020; pp. 1–4. [Google Scholar] [CrossRef] [Scilit]
- Porcino, T.; Reilly, D.; Clua, E.; Trevisan, D. A guideline proposal for minimizing cybersickness in VR-based serious games and applications. In Proceedings of the 2022 IEEE 10th International Conference on Serious Games and Applications for Health(SeGAH), Sydney, Australia; IEEE: New York, NY, USA, 2022; pp. 1–8. [Google Scholar] [CrossRef] [Scilit]

Disclaimer/Publisher’s Note: The statements, opinions and data contained in all publications are solely those of the individual author(s) and contributor(s) and not of MDPI and/or the editor(s). MDPI and/or the editor(s) disclaim responsibility for any injury to people or property resulting from any ideas, methods, instructions or products referred to in the content. |
© 2026 by the authors. Licensee MDPI, Basel, Switzerland. This article is an open access article distributed under the terms and conditions of the Creative Commons Attribution (CC BY) license.