


Abstract
Background/Objectives: Palmitic acid (PA), the most abundant saturated fatty acid in circulation, is elevated in obese individuals and has been implicated in promoting inflammation. However, its effects on inflammatory cytokine production in microglial cells and the involvement of cell surface receptors remain poorly characterized. Methods: In this study, we treated BV2 murine microglial cells with 200 µM PA or bovine serum albumin (BSA) control for 24 h and assessed IL-1β expression using semi-quantitative RT-PCR and/or ELISA. The roles of toll-like receptor (TLR)-2, TLR-4, G-protein-coupled receptor (GPR) 40, and GPR120 were investigated using siRNA knockdown and/or pharmacological inhibition. Results: Our studies found that PA treatment significantly increased IL-1β production as well as the mRNA expression of TLR-2, TLR-4, GPR40, and GPR120 compared to BSA controls. IL-1β expression correlated positively with TLR-2, TLR-4, and GPR40 levels. RNAi silencing of TLR-2, TLR-4, or GPR40 substantially diminished IL-1β expression in cells exposed to both BSA and PA. In contrast, neither RNAi silencing nor pharmacological inhibition of GPR120 suppressed IL-1β expression, suggesting that GPR120 may not mediate PA-induced inflammation. Conclusions: Our studies suggest that PA-induced production of IL-1β may be mediated via TLR-2, TLR-4, and GPR40, and that these cell surface receptors may serve as important molecular links between saturated fatty acids (SFAs) and neuroinflammation.
1. Introduction
As the resident immune cells of the brain, microglia play a key role in maintaining homeostasis by constantly surveying the central nervous system [1]. These cells express a range of toll-like receptors (TLRs), a family of pattern-recognition receptors (PRRs) that recognize various pathogen-associated molecular patterns (PAMPs) and danger-associated molecular patterns (DAMPs) [2,3]. For example, TLR-2 recognizes cell wall components of Gram-positive bacteria, while TLR-4 recognizes cell wall components of Gram-negative bacteria. In response to microbes, dead cells, or other antigens, microglia become activated and produce elevated levels of inflammatory mediators such as cytokines and chemokines. Evidence suggests that both TLR-2 and TLR-4 may be involved in obesity-associated inflammation and metabolic syndrome [4,5].
Pharmacological inhibition of TLR-4 with TAK-242 partially blocks stearic acid-induced insulin resistance and inflammation in muscle cells [6]. TLR-4 and TLR-2 have been shown to mediate PA-induced activation of nuclear factor (NF)-κB [7]. Furthermore, loss-of-function of TLR-4 mitigates high-fat diet-induced obesity [8,9], insulin resistance [10], and inflammation in liver and adipose tissue [10,11]. Studies have also shown that TLR-4 may be involved in PA-induced IL-8 expression in human aortic vascular smooth muscle cells [12] and chemokine production in beta cells [13].
Free fatty acids (FFAs) play critical roles in many cellular processes, including energy provision, cell signaling, and membrane structural integrity [14]. Palmitic acid (PA), the most abundant saturated fatty acid (SFA) in circulation, has been reported to promote the production of pro-inflammatory cytokines in various cell types. For example, PA increases the production of interleukin (IL)-1β in HaCaT keratinocytes and bone marrow-derived macrophages [15,16], IL-6 in HaCaT keratinocytes, astrocytes, and adipocytes [15,17,18], and tumor necrosis factor (TNF)-α in HaCaT keratinocytes, C2C12 skeletal muscle cells, astrocytes, and adipocytes [15,17,18,19].
FFAs not only elicit their effects through intracellular metabolism but also act as extracellular signaling molecules at cell surface receptors. FFAs have been shown to bind to free fatty acid receptors such as G-protein-coupled receptor 40 (GPR40) and GPR120. GPR40 reportedly has high affinity for medium- and long-chain saturated and unsaturated FFAs [20]. GPR120 has been reported to have high affinity for unsaturated FAs, including ω-3 FAs [20,21,22]. GPR120 has been reported to mediate alpha-linolenic acid (ALA)-induced secretion of glucagon-like peptide-1 (GLP-1) in human and murine enteroendocrine cells [20]. GPR40 has been reported to mediate long-chain FA-induced secretion of cholecystokinin in I cells from murine duodenal mucosa [23]. Intracerebroventricular treatment with GW9508, a non-specific agonist for GPR40 and GPR120, reduces energy efficiency and the expression of inflammatory genes in the hypothalamus [24]. GPR120 knockdown significantly attenuates PA-induced expression of TNF-α and IL-6 in visceral adipocytes differentiated from human mesenchymal stem cells [18].
Our laboratory has previously reported that PA induces lipotoxicity in microglial cells [25]. However, the effects of PA on inflammatory cytokine production in microglial cells have not been well-characterized. Furthermore, while TLR-2, TLR-4, GPR40, and GPR120 have been reported to be expressed in microglia [1,24,26,27], the involvement of these cell surface receptors in the PA-induced inflammatory response in microglia cells has not been examined. Therefore, this study was undertaken to examine how PA affects IL-1β production in microglia cells and whether any of the aforementioned cell surface receptors are required for PA-induced production of IL-1β.
2. Materials and Methods
2.1. Cell Culture and Transfections
BV2 murine microglial cells were provided by Dr. Jau-Shyong Hong (National Institutes of Health) and cultured in DMEM (Hyclone Laboratories, Logan, UT, USA) with 10% fetal calf serum (FCS) (ThermoFisher Scientific, Waltham, MA, USA) at 37 °C with 5% CO2. For transfection experiments, BV2 cells were plated in 12-well plates at 30,000 cells per well. Transfections were performed using 200 ng of either control siRNA or gene-specific siRNA targeting TLR2, TLR4, GPR40, or GPR120 (Santa Cruz Biotechnology, Dallas, TX, USA) with glial-mag transfection reagent (OZ Biosciences, San Diego, CA, USA) according to the manufacturer’s protocol. Knockdown of TLR2, TLR4, GPR40, and GPR120 expression was verified to be at least 50% by RT-PCR using primers from Santa Cruz Biotechnology following the manufacturer’s instructions.
2.2. Preparation of PA, AH7614, GW1100, and DC260126
PA (Sigma-Aldrich, St. Louis, MO, USA) was dissolved in 100% ethanol, then conjugated to fatty acid-free BSA (Sigma-Aldrich, St. Louis, MO, USA) in PBS at a 2.5:1 molar ratio to yield a 5 mM stock solution, as previously described [25,28,29]. AH7614, GW1100, and DC260126 were purchased from Cayman Chemical (Ann Arbor, MI, USA) and reconstituted in DMSO.
2.3. RNA Extraction
Following treatment, the culture medium was removed. TRI reagent (Molecular Research Center, Cincinnati, OH, USA) was added to lyse the cells. RNA was then extracted from the lysates as previously described [30,31].
2.4. Semi-Quantitative Reverse-Transcription Polymerase Chain Reaction (RT-PCR)
Reverse transcription was performed as previously described [32,33]. The resulting cDNA was subjected to PCR amplification using gene-specific sense and antisense primers for mouse elongation factor-1α (EF-1α), a housekeeping gene, and IL-1β, which were synthesized by Eurofins Genomics (Louisville, KY, USA). PCR reactions were performed as previously described [30,34]. The primer sequences were as follows: EF-1α sense, 5′-GCATGGTGGTTACCTTTGCT-3′ and antisense, 5′-CAGCAACATTGCCTCGTCTA-3′; IL-1β sense, 5′-GCCCATCCTCTGTGACTCAT-3′ and antisense, 5′-AGGCCACAGGTATTTTGTCG-3′. EF-1α and IL-1β were amplified for 21 and 29 cycles, respectively. PCR products were separated by electrophoresis on 2.0% agarose gels, and images were captured using a UVP GelDoc-It™ imaging system (UVP, Upland, CA, USA). Band intensities were quantified and then normalized to EF-1α expression levels within the same sample.
2.5. Enzyme-Linked Immunosorbent Assay (ELISA)
BV2 cells were seeded at a density of 50,000 cells per well in 12-well plates and allowed to adhere overnight. Cells were then pretreated with various pharmacological inhibitors for 30 min, followed by exposure to 200 µM PA or BSA control for 24 h. Upon completion of treatment, culture medium was aspirated, and cells were washed with PBS before lysis with 150 µL of RIPA buffer (Sigma-Aldrich, St. Louis, MO, USA) for 30 min at 4 °C. Cell lysates were collected and centrifuged at 14,000 rpm for 10 min at 4 °C. Total protein concentration was determined using the Pierce™ BCA Protein Assay Kit (ThermoFisher Scientific, Waltham, MA, USA). Lysates were then diluted 1:2 with sample diluent, and IL-1β protein levels were quantified using the mouse IL-1β ELISA kit from Biolegend (San Diego, CA, USA) according to the manufacturer’s protocol.
2.6. Statistical Analyses
Data were expressed as mean ± SD. Statistical comparisons were conducted using unpaired t-tests or two-way ANOVA with Tukey’s post hoc test in GraphPad Prism version 6 (Boston, MA, USA). Significance was set at p < 0.05.
3. Results
3.1. PA Increased the Production of IL-1β in BV2 Microglia Cells
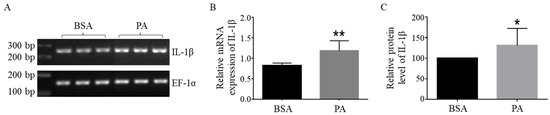
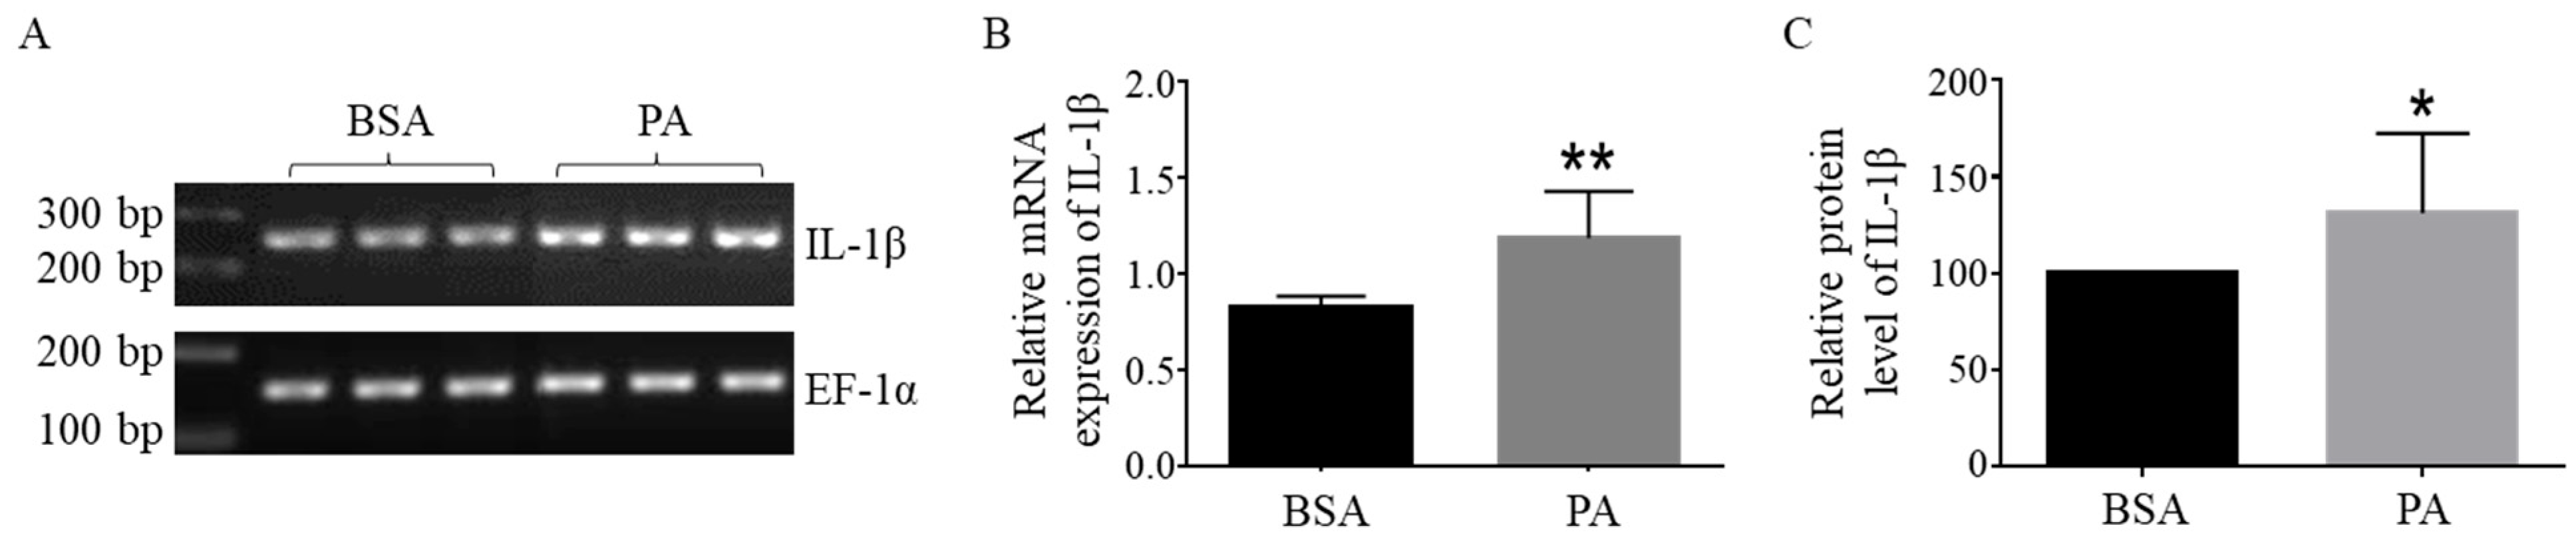
Our previous studies have demonstrated that 200 µM PA for 24 h induces lipotoxicity in BV2 cells [28]. Our dose–response and time-course analyses further confirmed this concentration and duration as optimal for IL-1β induction. In this study, BV2 cells were treated with 200 µM PA or an equal volume of BSA for 24 h, and the expression of IL-1β was determined at the mRNA level using semi-quantitative RT-PCR and at the protein level using ELISA. The mRNA level of IL-1β was normalized against EF-1α, and the protein level of IL-1β was normalized against the total amount of protein. The 24 h treatment with 200 µM PA significantly increased the mRNA level of IL-1β compared to BSA-treated cells (Figure 1A,B). The protein level of IL-1β was also increased by PA treatment compared to BSA-treated cells (Figure 1C).
Figure 1.
PA increased IL-1β production in BV2 microglia cells. The cells were treated with either BSA or 200 µM PA for 24 h. (A,B) The mRNA level of IL-1β was determined using semi-quantitative RT-PCR. (C) The protein level of IL-1β was determined using ELISA. The data presented were representative of three independent experiments. Each experiment was performed in three biological replicates (n = 3). Data were expressed as mean ± SD. Statistical analysis was performed using an unpaired t-test. *, p < 0.05 vs. BSA. **, p < 0.01 vs. BSA.
3.2. TLR-4 Knockdown Decreased IL-1β Expression in BSA- and PA-Treated Cells
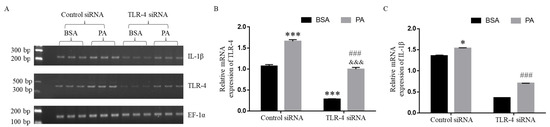
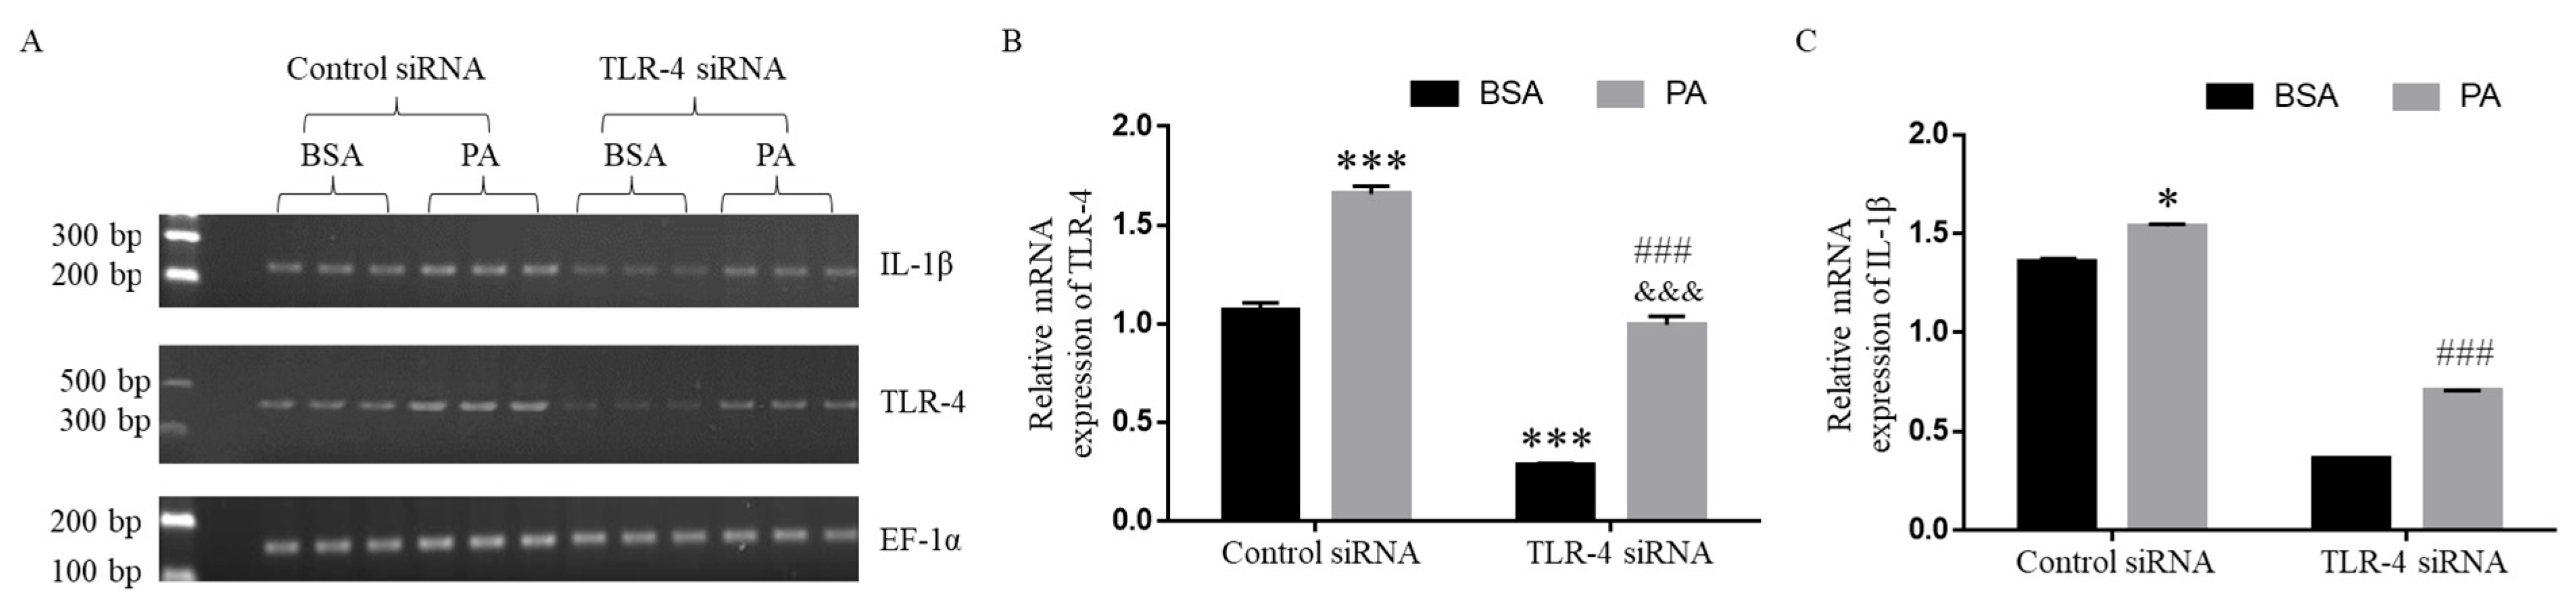
In order to examine whether TLR-4 was involved in PA-induced IL-1β expression, BV2 cells were transfected with control or TLR-4 siRNA for 24 h and then treated with BSA or 200 µM PA for an additional 24 h. The mRNA expression of EF-1α, IL-1β, and TLR-4 was examined using semi-quantitative RT-PCR, and the mRNA expression of IL-1β and TLR-4 was normalized against EF-1α. As shown in Figure 2A,B, the mRNA expression of TLR-4 was significantly lower in TLR-4 siRNA-transfected cells compared to the corresponding control siRNA-transfected cells following treatment with BSA and PA, respectively. Our data also showed that PA treatment significantly increased TLR-4 expression compared to BSA in both control siRNA-transfected and TLR-4 siRNA-transfected cells. As shown in Figure 2A,C, PA treatment increased the expression of IL-1β compared to the corresponding BSA control in both control siRNA-transfected and TLR-4 siRNA-transfected cells. Furthermore, TLR-4 knockdown significantly decreased IL-1β expression in both control siRNA-transfected and TLR-4 siRNA-transfected cells (Figure 2A,C). Our data also showed that the expression level of TLR-4 correlated with the expression level of IL-1β. These data suggest that TLR-4 may be involved in mediating IL-1β expression in both BSA-treated and PA-treated cells.
Figure 2.
TLR-4 knockdown significantly attenuated IL-1β expression in BV2 microglia cells. Cells were transfected with control or TLR-4 siRNA for 24 h, followed by treatment with BSA or 200 µM PA for an additional 24 h. TLR-4 (A,B) and IL-1β (A,C) mRNA levels were assessed by semi-quantitative RT-PCR. The data (mean ± SD) presented were representative of three independent experiments. Each experiment was performed in three biological replicates (n = 3). Data were analyzed by two-way ANOVA with Tukey’s multiple comparison test. *, p < 0.05 vs. BSA/control siRNA; ***, p < 0.001 vs. BSA/control siRNA; ###, p < 0.001 vs. BSA/TLR-4 siRNA; &&&, p < 0.001 vs. PA/control siRNA.
3.3. TLR-2 Knockdown Attenuated IL-1β Expression in BSA- and PA-Treated Cells
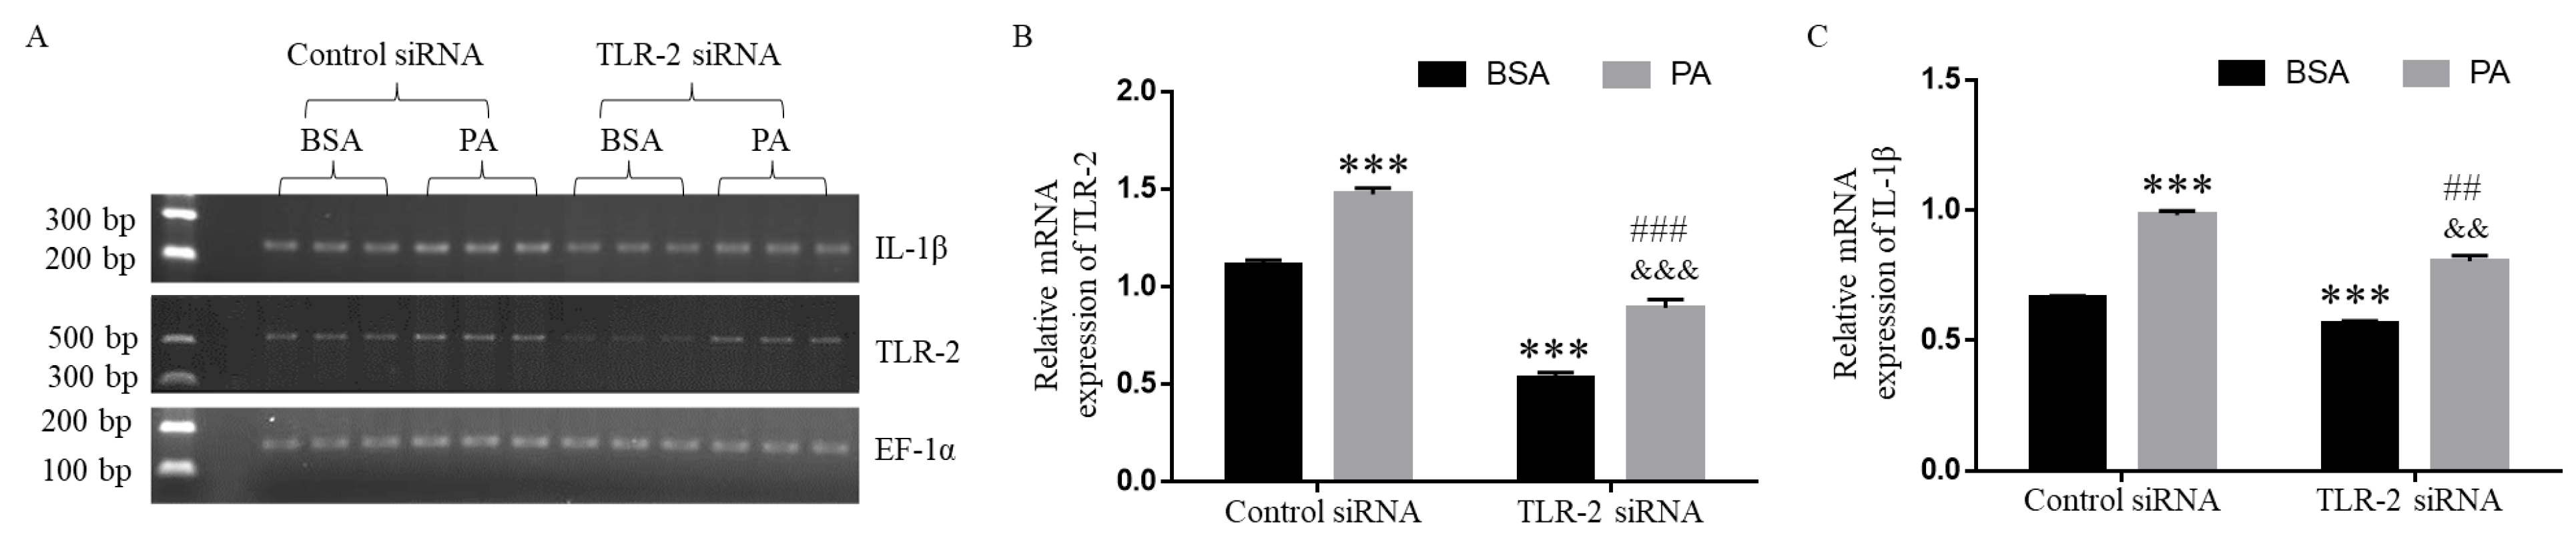
In order to examine whether TLR-2 was involved in PA-induced IL-1β expression, BV2 cells were transfected with control or TLR-2 siRNA for 24 h and then treated with BSA or 200 µM PA for an additional 24 h. The mRNA expression of EF-1α, IL-1β, and TLR-2 was examined by semi-quantitative RT-PCR, and the mRNA expression of IL-1β and TLR-2 was normalized against EF-1α. As shown in Figure 3A,B, TLR-2 expression was significantly lower in cells transfected with TLR-2 siRNA compared to those transfected with control siRNA. PA treatment significantly elevated TLR-2 expression relative to BSA control in both control and TLR-2 siRNA-transfected cells. Furthermore, PA treatment increased the expression of IL-1β compared to BSA control in both control siRNA-transfected and TLR-2 siRNA-transfected cells. TLR-2 knockdown significantly reduced IL-1β expression in both BSA- and PA-treated cells relative to their respective control siRNA-transfected cells (Figure 3A,C). Our data also showed that the expression level of TLR-2 correlated with the expression level of IL-1β. These data suggest that TLR-2 may be involved in mediating IL-1β expression in both BSA-treated and PA-treated cells.
Figure 3.
TLR-2 knockdown reduced IL-1β mRNA expression in BV2 microglia cells. Cells were transfected with control or TLR-2 siRNA for 24 h, followed by treatment with BSA or 200 µM PA for 24 h. TLR-2 (A,B) and IL-1β (A,C) mRNA levels were measured by semi-quantitative RT-PCR. Data (mean ± SD) represent three independent experiments. Each experiment was performed in three biological replicates (n = 3). Data were analyzed by two-way ANOVA with Tukey’s post hoc test. ***, p < 0.001 vs. BSA/control siRNA; ##, p < 0.01 vs. BSA/TLR-2 siRNA; ###, p < 0.001 vs. BSA/TLR-2 siRNA; &&, p < 0.01 vs. PA/control siRNA; &&&, p < 0.001 vs. PA/control siRNA.
3.4. Inhibition of GPR40 Attenuated IL-1β Expression in BSA- and PA-Treated Cells
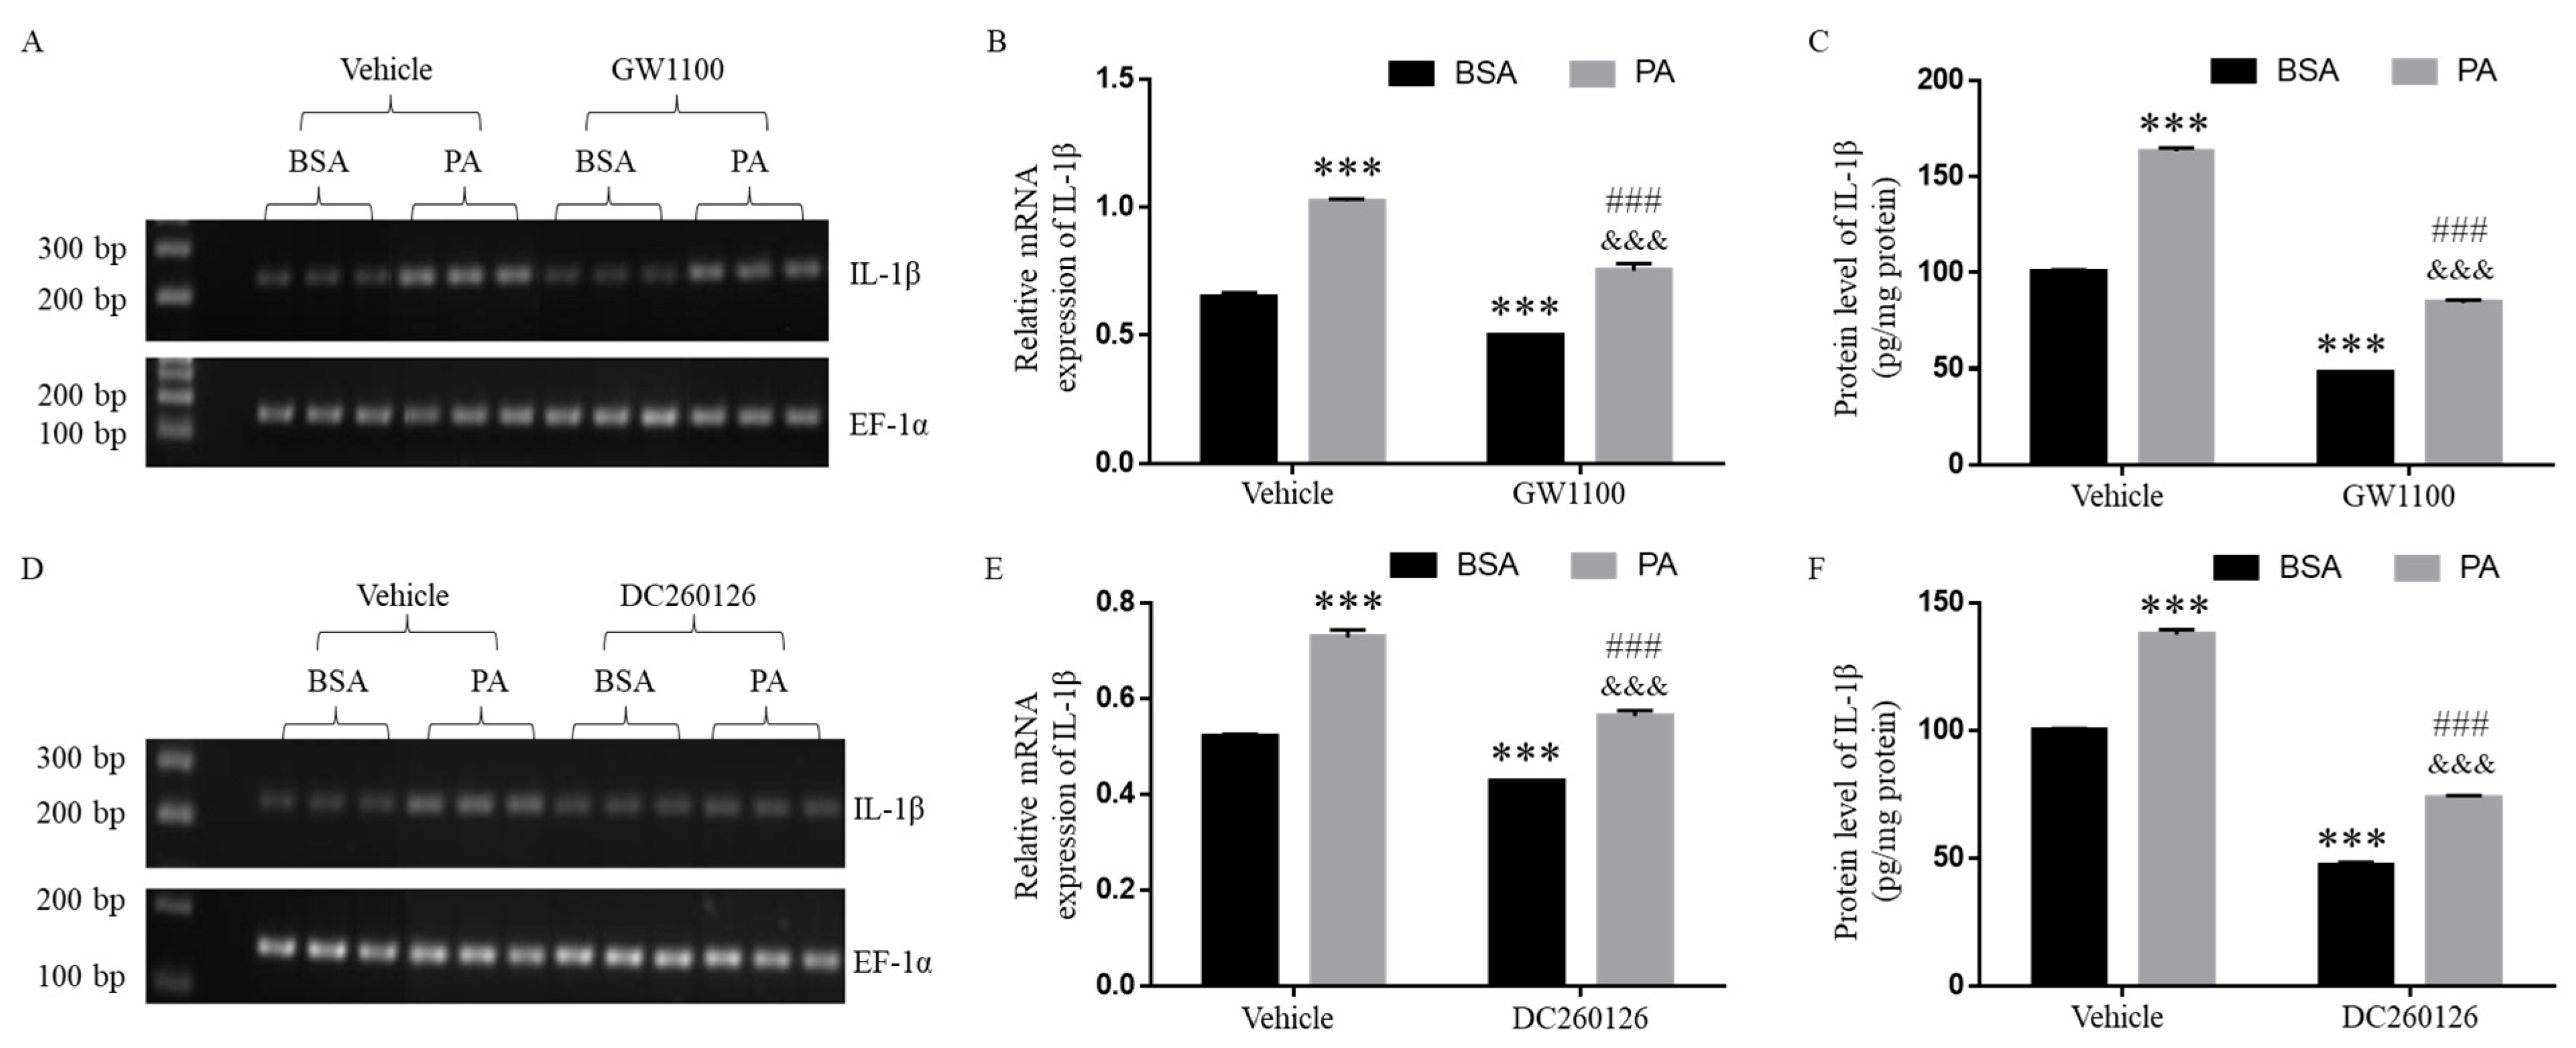
In order to investigate the potential involvement of GPR40 in PA-induced IL-1β expression, we examined the effects of GPR40 antagonists, GW1100 and DC260126, on IL-1β expression. BV2 cells were pre-treated with 5 µM GW1100, 10 µM DC260126, or an equal volume of DMSO vehicle for one hour and then treated with BSA or 200 µM PA for an additional 24 h. The mRNA expression levels of EF-1α and IL-1β were assessed by semi-quantitative RT-PCR, and IL-1β mRNA expression was normalized against EF-1α. As shown in Figure 4, PA treatment significantly increased IL-1β expression at the mRNA and protein levels compared to the corresponding BSA controls treated with vehicle, GW1100, or DC260126. Moreover, the extent of PA-induced IL-1β expression in cells treated with GW1100 (Figure 4A–C) or DC260126 (Figure 4D–F) appeared to be lower compared to vehicle-treated cells. These findings suggest that GPR40 may be involved in regulating the basal level of IL-1β expression in BSA-treated controls as well as PA-induced IL-1β expression.
Figure 4.
Pharmacological inhibition with GW1100 and DC260126 decreased IL-1β production in BV2 microglia cells. Cells were pre-treated with vehicle, 5 µM GW1100 (A–C), or 10 µM DC260126 (D–F) for one hour, then exposed to BSA or 200 µM PA for 24 h. IL-1β mRNA (A,B,D,E) and protein levels (C,F) were assessed by semi-quantitative RT-PCR and ELISA, respectively. Data (mean ± SD) represent three independent experiments. Each experiment was performed in three biological replicates (n = 3). Data were analyzed by two-way ANOVA with Tukey’s post hoc test. ***, p < 0.001 vs. BSA/Vehicle; ###, p < 0.001 vs. BSA/inhibitor; &&&, p < 0.001 vs. PA/Vehicle.
3.5. GPR40 Knockdown Decreased IL-1β Expression in BSA- and PA-Treated Cells
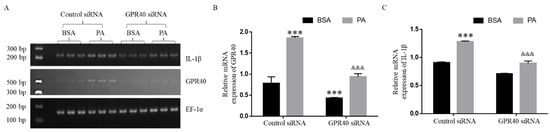
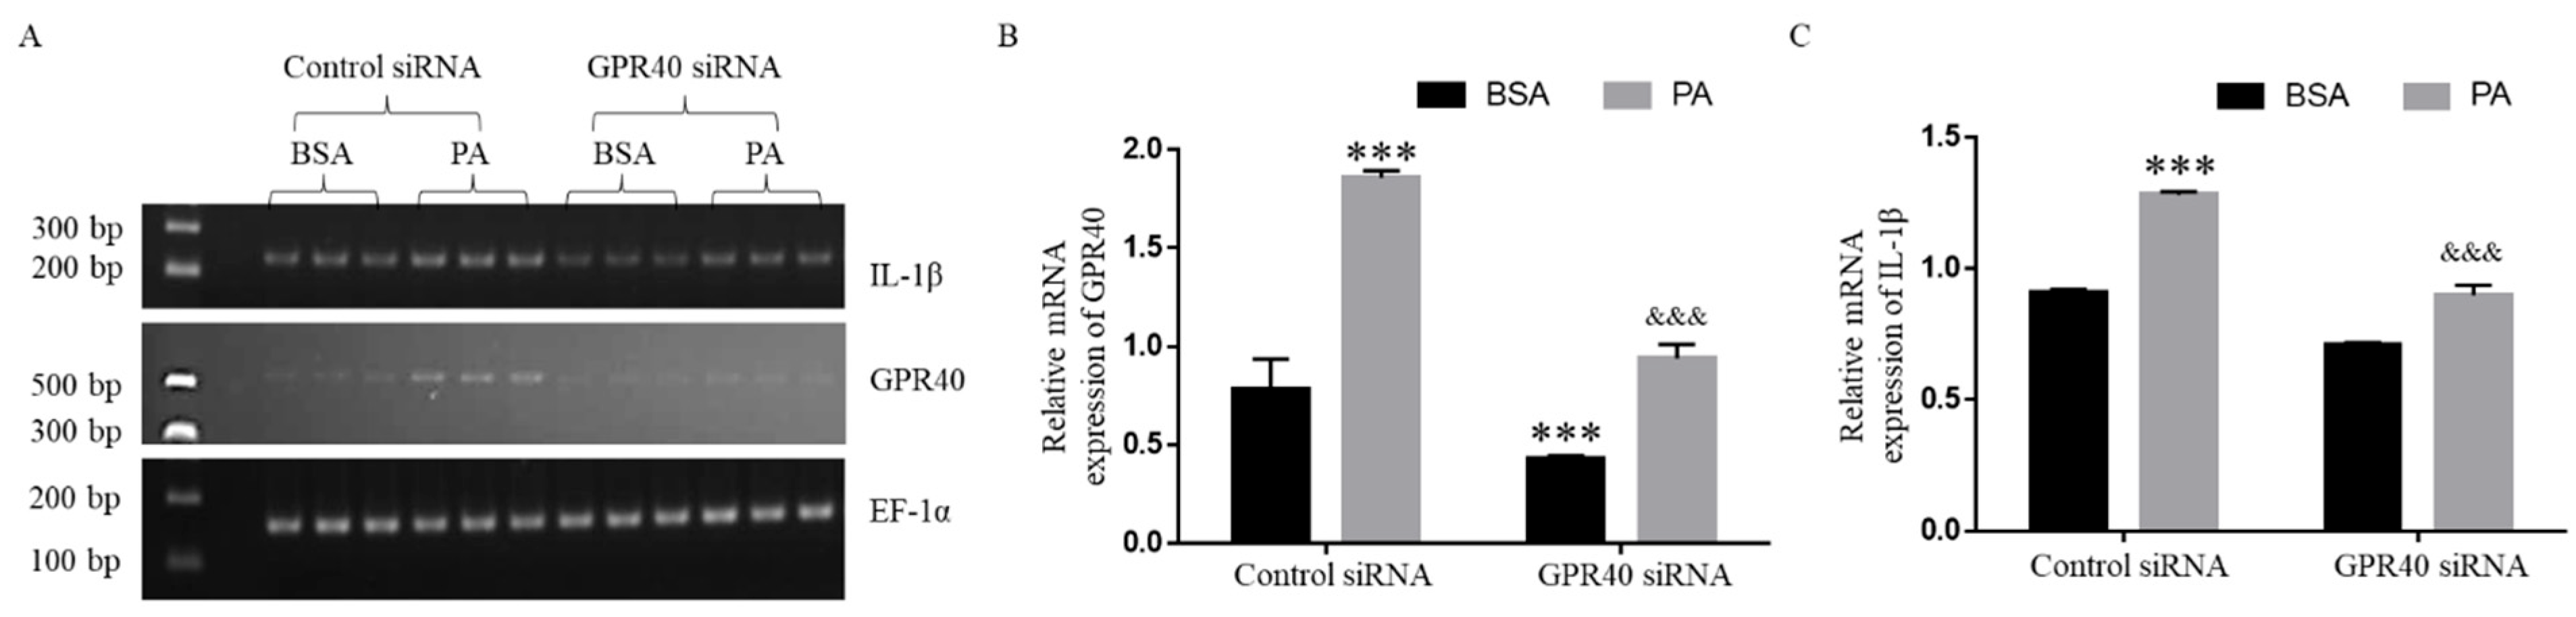
In order to further examine the role of GPR40 in PA-induced IL-1β expression, BV2 cells were transfected with control or GPR40 siRNA for 24 h, followed by treatment with BSA or 200 µM PA for 24 h. The mRNA expression levels of EF-1α, IL-1β, and GPR40 were examined by semi-quantitative RT-PCR, and the mRNA expression of IL-1β and GPR40 was normalized against EF-1α. As shown in Figure 5A,B, the GPR40 mRNA level was significantly lower in cells transfected with GPR40 siRNA compared to those transfected with control siRNA. PA treatment significantly elevated GPR40 expression compared to BSA in both control and GPR40 siRNA-transfected cells. Consistently, PA treatment increased the expression of IL-1β compared to BSA in both control siRNA-transfected and GPR40 siRNA-transfected cells. Furthermore, GPR40 knockdown significantly reduced IL-1β expression in both BSA- and PA-treated cells relative to their respective control siRNA-transfected cells (Figure 5A,C). The extent to which PA increased IL-1β expression was smaller in GPR40 siRNA-transfected cells than in control siRNA-transfected cells. Our data also showed that the expression level of GPR40 correlated with the expression level of IL-1β. These data suggest that GPR40 may play a role in mediating PA-induced expression of IL-1β.
Figure 5.
GPR40 knockdown reduced IL-1β mRNA expression in BSA- and PA-treated cells. BV2 microglia cells were transfected with either control or GPR40 siRNA, followed by treatment with BSA or 200 µM PA for 24 h. The mRNA levels of GPR40 (A,B) and IL-1β (A,C) were determined by semi-quantitative RT-PCR. The data (mean ± SD) presented were representative of three independent experiments. Each experiment was performed in three biological replicates (n = 3). Data were analyzed with two-way ANOVA and Tukey’s multiple comparison test. ***, p < 0.001 vs. BSA/control siRNA; &&&, p < 0.001 vs. PA/control siRNA.
3.6. Inhibition of GPR120 Did Not Attenuate IL-1β Expression in Microglia Cells
To investigate the potential involvement of GPR120 in PA-induced IL-1β expression, BV2 cells were pre-treated with 10 µM AH7614, a GPR120 antagonist, or an equal volume of DMSO vehicle for one hour, then treated with BSA or 200 µM PA for 24 h. The mRNA expression levels of EF-1α and IL-1β were assessed by semi-quantitative RT-PCR, and IL-1β mRNA expression was normalized against EF-1α. The protein level of IL-1β was assessed by ELISA. PA treatment significantly increased IL-1β expression at both the mRNA (Figure 6A,B) and protein (Figure 6C) levels compared to the corresponding BSA controls treated with either vehicle or AH7614. Furthermore, treatment with AH7614 significantly elevated IL-1β expression compared to the corresponding vehicle controls treated with BSA or PA (Figure 6). These findings suggest that GPR120 may not be responsible for elevated IL-1β expression in PA-treated cells compared to BSA controls.
Figure 6.
AH7614 treatment enhanced IL-1β production in BV2 microglia cells. Cells were pre-treated with either vehicle or 10 µM AH7614 for one hour, followed by treatment with BSA or 200 µM PA for 24 h. The mRNA (A,B) and protein (C) levels of IL-1β were determined by semi-quantitative RT-PCR and ELISA, respectively. Data were presented as mean ± SD and representative of three independent experiments. Each experiment was performed in three biological replicates (n = 3). Statistical significance was determined using two-way ANOVA with Tukey’s multiple comparison test. ***, p < 0.001 vs. BSA/vehicle; ###, p < 0.001 vs. BSA/AH7614; &&&, p < 0.001 vs. PA/vehicle.
3.7. GPR120 Knockdown Did Not Attenuate PA-Induced Production of IL-1β in Microglia Cells
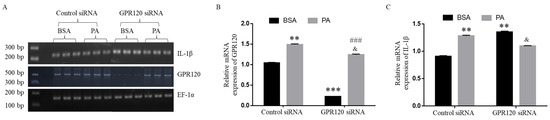
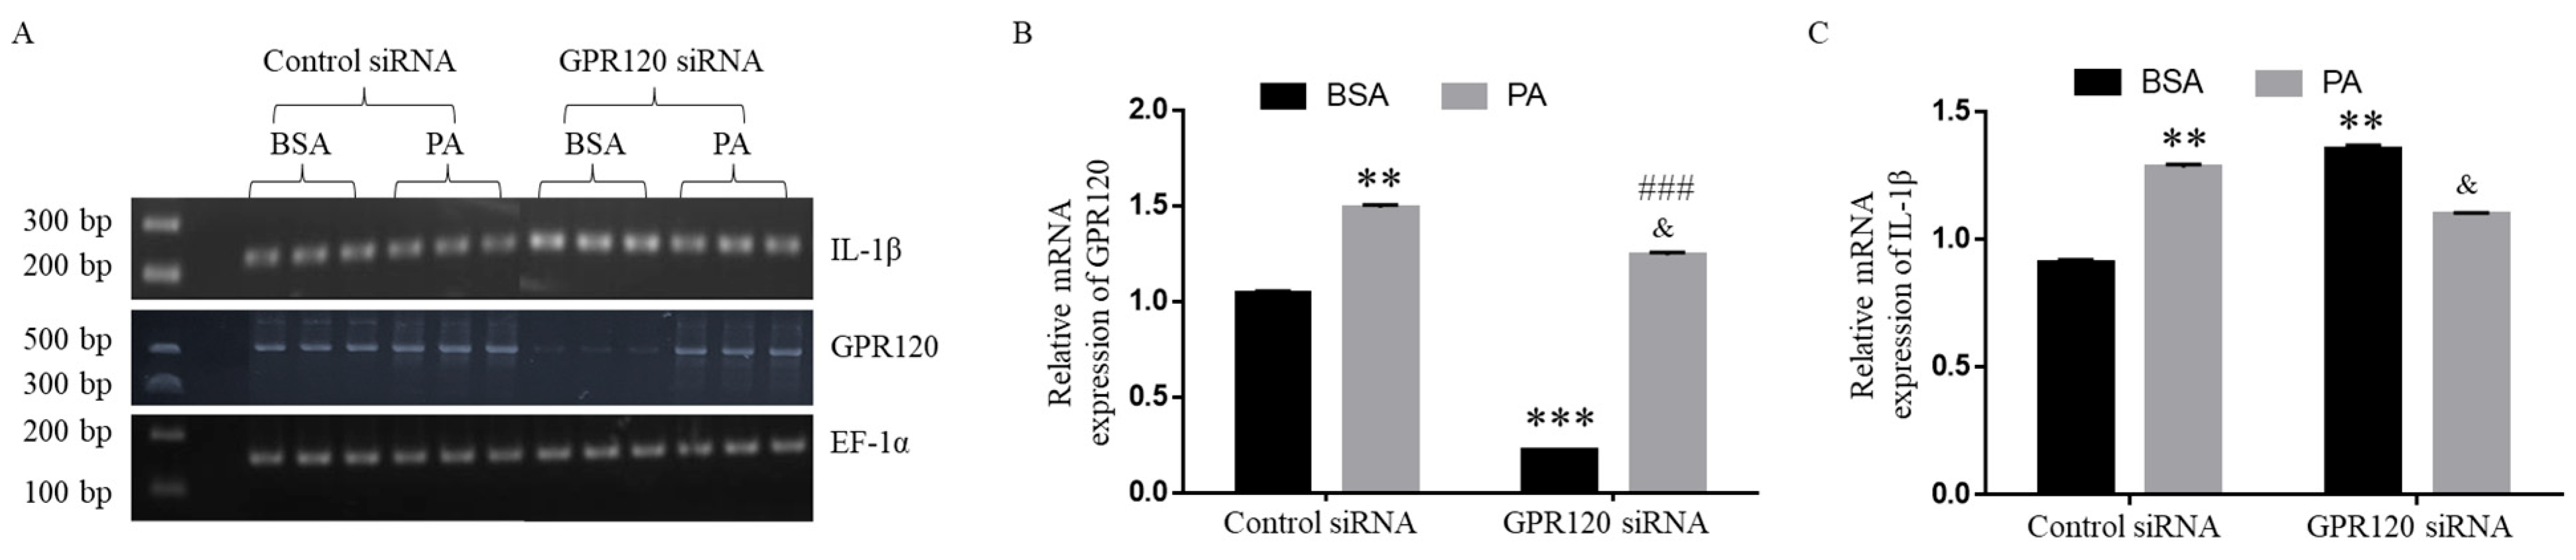
To further investigate the role of GPR120 in PA-induced IL-1β expression, BV2 cells were transfected with control or GPR120 siRNA for 24 h, followed by treatment with BSA or 200 µM PA for an additional 24 h. The mRNA expression levels of EF-1α, IL-1β, and GPR120 were assessed by semi-quantitative RT-PCR, and the mRNA expression of IL-1β and GPR120 was normalized against EF-1α. As shown in Figure 7A,B, GPR120 expression was significantly reduced in cells transfected with GPR120 siRNA compared to the corresponding controls transfected with control siRNA. PA treatment significantly elevated GPR120 expression compared to its respective corresponding BSA controls in cells transfected with control siRNA or GPR120 siRNA. As shown in Figure 7A,C, in cells transfected with control siRNA, PA treatment significantly increased IL-1β expression relative to the BSA control. In contrast, knockdown of GPR120 abolished this response in GPR120 siRNA-transfected cells, in which PA treatment produced a modest reduction in IL-1β expression compared to its BSA control. These data suggest that the basal level of IL-1β expression was inversely correlated with GPR120 expression level and that GPR120 may not be a mediator of the induction of IL-1β by PA.
Figure 7.
GPR120 knockdown potentiated IL-1β production in BV2 microglia cells. Cells were transfected with control or GPR120 siRNA and then treated with BSA or 200 µM PA for 24 h. The mRNA levels of GPR120 (A,B) and IL-1β (A,C) were determined by semi-quantitative RT-PCR. Data (mean ± SD) were representative of three independent experiments. Each experiment was performed in three biological replicates (n = 3). Data were analyzed with two-way ANOVA and Tukey’s multiple comparison test. **, p < 0.01 vs. BSA/control; ***, p < 0.001 vs. BSA/control; &, p < 0.05 vs. PA/control; ###, p < 0.001 vs. PA/control.
4. Discussion
Obesity and metabolic syndrome are associated with chronic low-grade inflammation in various tissues, including blood, liver, muscle, and hypothalamus [35,36,37,38]. PA is reportedly elevated in obese children, adolescents, and adults [39,40,41]. As a master regulator of inflammatory reactions in the immune system, IL-1β has been suggested to play an important role in the elaboration of neuroinflammation and cognitive function and has been implicated in the pathogenesis of many neurological conditions, such as major depressive disorder, Parkinson’s disease, and Alzheimer’s disease (AD) [42,43,44].
Our study demonstrated that elevated PA levels increased IL-1β mRNA and protein production in microglial cells. The expression levels of TLR-2 and TLR-4 correlated with IL-1β expression, and knockdown of TLR-2 and TLR-4 reduced IL-1β expression in both BSA-treated and PA-treated cells compared to their respective control siRNA-transfected cells. These data suggest that TLR-2 and TLR-4 mediate PA-induced IL-1β expression in microglial cells.
Consistent with our findings, TLR-4 has been reported to mediate PA-induced IL-8 expression in human aortic vascular smooth muscle cells [12]. Gupta et al. reported that PA-induced release of TNF-α and IL-6 in astrocytes is mediated by TLR-4 rather than TLR-2 [17]. Wang et al. demonstrated that pharmacological inhibition of NF-κB and administration of TLR-4-neutralizing antibody suppress PA-induced production of pro-inflammatory mediators [45]. Nicholas et al. reported that TLR-4 mediates PA-induced IL-1β production in human dendritic cells [46]. Additionally, TLR-2 and TLR-4 mRNA expression is increased in PA-treated murine macrophages, correlating with elevated TNF-α production [47].
Although PA has been proposed as a TLR-4 ligand, evidence for direct physical binding of PA to TLR-4 remains insufficient [48]. Molecular simulations suggest that multiple PA molecules destabilize the TLR4/MD2 complex, rendering PA an unlikely TLR-4 ligand [49]. Therefore, further studies are needed to elucidate the mechanisms by which TLR-2 and TLR-4 mediate PA-induced inflammatory gene expression.
Both GPR-40 and GPR-120 have been shown to bind to FFAs [50,51]. GPR40 plays a key role in fatty acid modulation of insulin secretion, and its activation attenuates chronic inflammation-induced effects on pancreatic β-cell health and function, promoting insulin secretion and synthesis [52,53,54]. Loss of GPR-40 protects mice from obesity-induced hyperinsulinemia, hepatic steatosis, and hypertriglyceridemia [22], while GPR40 overexpression leads to β-cell dysfunction, hyperinsulinemia, and diabetes in mice [22]. GPR120 reportedly mediates anti-inflammatory and insulin-sensitizing effects [22,55]. ω-3-FFAs produce robust anti-inflammatory and insulin-sensitizing effects, both in vivo and in vitro, in a GPR120-dependent manner [55]. Activation of GPR120 via its agonist, GPR120 Compound A, exerts potent anti-inflammatory effects on macrophages in vitro and in obese mice in vivo [55].
Our study also found that the expression levels of GPR40 and GPR120 were elevated in PA-treated microglia cells compared to BSA-treated controls. The expression level of GPR40 correlated with the expression level of IL-1β. GPR40 knockdown also reduced the expression level of IL-1β in BSA-treated cells as well as PA-treated cells compared to their respective control siRNA-transfected cells, suggesting that GPR-40 may also be involved in mediating PA-induced IL-1β expression in microglia cells. As for GPR120, when its expression level was reduced to a minimal level by transfection with GPR120 siRNA, the mRNA expression of IL-1β was significantly enhanced. For cells transfected with control siRNA, PA increased the mRNA expression of both GPR120 and IL-1β. For cells transfected with GPR120 siRNA, the mRNA level of GPR120 was reduced to a minimal level in BSA-treated cells, but significantly increased by treatment with PA. Our data suggest that PA increases the mRNA expression of GPR120 and that GPR120 expression may not be a mediator of PA-induced expression of IL-1β.
Studies have linked TLR expression to various neurological conditions. Expression of TLR-2 and TLR-4 is reportedly upregulated in the brains of patients with Alzheimer’s disease (AD), Parkinson’s disease (PD), insulin resistance, and type 2 diabetes [56,57]. TLR2 polymorphism has been associated with increased risk of PD [58]. Elevated microglial TLR4 levels may contribute to the development of AD [59], while TLR2 knockout in mice prevented memory impairment following Aβ1–42 immunization [60]. Our data suggest that TLR-2, TLR-4, and GPR40 may serve as important molecular links between SFAs and neuroinflammation.
It should be noted that BV2 cells, as an immortalized murine microglial cell line, do express key PRRs, including TLR-2 and TLR-4, and mount robust inflammatory responses to PAMPs such as LPS [61] and SFAs, as demonstrated in our studies. Nevertheless, they may not faithfully recapitulate the behavior of primary or human microglia, given well-documented species-specific differences in immune receptor expression, cytokine profiles, TLR signaling, and transcriptional regulation [62,63]. Future studies in primary human microglia, induced pluripotent stem cells (iPSCs)-derived microglial models, or humanized murine systems would therefore strengthen the translational relevance of our findings.
Semi-quantitative RT-PCR and SYBR Green-based qPCR are both widely used for gene expression analysis, each with distinct advantages. Although semi-quantitative RT-PCR lacks the sensitivity and dynamic range of qPCR, it allows us to simultaneously visualize PCR products and confirm amplification specificity [64]. SYBR Green-based qPCR offers greater sensitivity, enabling detection of low-abundance transcripts and modest fold-changes, with melt curve analysis helping to distinguish true amplicons from non-specific products. However, because SYBR Green intercalates non-selectively into any double-stranded DNA, rigorous primer design, DNase treatment, and melt curve validation are essential to minimize false-positive signals [65,66,67]. In the present study, PCR conditions were optimized, and the cycle number before the plateau phase of PCR amplification of each gene was selected to ensure valid quantification.
PA is the most abundant SFA in the human body and a major constituent of the Western diet, accounting for approximately 20–30% of total fatty acids in human plasma [68]. Under fasting conditions, circulating FFA concentrations in healthy individuals typically range between 100 and 400 µM, with PA representing a substantial fraction of this pool [69]. In the postprandial state, plasma FFA concentrations can rise considerably, particularly in individuals with metabolic dysfunction [70]. In obese individuals and those with type 2 diabetes mellitus (T2DM), plasma FFA concentrations are chronically elevated, often exceeding 600–800 µM, with PA disproportionately enriched relative to unsaturated fatty acids [69,70]. The concentration of 200 µM PA used in the present study, therefore, falls within the upper range of physiologically relevant plasma FFA concentrations.
Pathological elevation of circulating SFAs may lead to lipotoxicity and chronic low-grade systemic inflammation, insulin resistance, and endoplasmic reticulum (ER) stress across multiple cell types, including macrophages, hepatocytes, and pancreatic β-cells [71,72]. While this study focuses on cell surface receptor involvement in PA-induced IL-1β production, PA is known to activate microglia through multiple mechanisms, including NLRP3 inflammasome activation and ER stress induction [73,74]. Such microglial activation may contribute to neuroinflammatory cascades that exacerbate amyloid-β plaque deposition and tau hyperphosphorylation in AD [75]. Future work should examine downstream mediators, including NF-κB, MAPK, and MyD88, to further elucidate the signaling pathways involved.
5. Conclusions
Our studies demonstrate that PA increased the expression of IL-1β, TLR2, TLR4, GPR-40, and GPR-120. The expression level of IL-1β correlated with TLR2, TLR-4, and GPR-40, but not with GPR-120. PA-induced expression of IL-1β and cell surface receptors may, in turn, alter microglial responses to other PAMPs and DAMPs, potentially affecting their capacity to survey the brain and maintain homeostasis. Our findings indicate that elevated circulating SFAs could induce brain inflammation, potentially contributing to the adverse neurological consequences of obesity and metabolic syndrome. The data further suggest that targeting TLR2, TLR4, and GPR40 expression may reduce inflammation and may represent promising pharmacological targets for developing neuroprotective therapeutics.
Author Contributions
Conceptualization, H.Z.; methodology, S.M. and V.J.; validation, V.J. and S.M.; formal analysis, V.J. and H.Z.; investigation, S.M. and V.J.; resources, H.Z.; data curation, V.J. and H.Z.; writing—original draft preparation, V.J.; writing—review and editing, H.Z.; supervision, H.Z.; project administration, H.Z.; funding acquisition, H.Z. All authors have read and agreed to the published version of the manuscript.
Funding
This research received no external funding.
Institutional Review Board Statement
Not applicable.
Informed Consent Statement
Not applicable.
Data Availability Statement
The data that support the findings of this study are available from the corresponding author upon reasonable request.
Conflicts of Interest
The authors declare no conflicts of interest.
Abbreviations
The following abbreviations are used in this manuscript:
| BSA | Bovine serum albumin |
| FCS | Fetal calf serum |
| IL | Interleukin |
| TLR | Toll-like receptor |
| GPR | G-protein-coupled receptor |
References
- Fiebich, B.L.; Batista, C.R.; Saliba, S.W.; Yousif, N.M.; De Oliveira, A.C. Role of microglia TLRs in neurodegeneration. Front. Cell. Neurosci. 2018, 12, 329. [Google Scholar] [CrossRef] [Scilit] [PubMed]
- Frederiksen, H.R.; Haukedal, H.; Freude, K. Cell Type Specific Expression of Toll-Like Receptors in Human Brains and Implications in Alzheimer’s Disease. BioMed Res. Int. 2019, 1, 7420189. [Google Scholar] [CrossRef] [Scilit] [PubMed]
- Colonna, M.; Butovsky, O. Microglia function in the central nervous system during health and neurodegeneration. Ann. Rev. Immunol. 2017, 35, 441–468. [Google Scholar] [CrossRef] [Scilit]
- Watanabe, Y.; Nagai, Y.; Takatsu, K. Activation and regulation of the pattern recognition receptors in obesity-induced adipose tissue inflammation and insulin resistance. Nutrients 2013, 5, 3757–3778. [Google Scholar] [CrossRef] [Scilit] [PubMed]
- Fessler, M.B.; Rudel, L.L.; Brown, J.M. Toll-like receptor signaling links dietary fatty acids to the metabolic syndrome. Curr. Opin. Lipidol. 2009, 20, 379–385. [Google Scholar] [CrossRef] [Scilit]
- Hussey, S.E.; Liang, H.; Costford, S.R.; Klip, A.; DeFronzo, R.A.; Sanchez-Avila, A.; Ely, B.; Musi, N. TAK-242, a small-molecule inhibitor of Toll-like receptor 4 signaling, unveils similarities and differences in lipopolysaccharide-and lipid induced inflammation and insulin resistance in muscle cells. Biosci. Rep. 2012, 33, 37–47. [Google Scholar] [PubMed]
- Huang, S.; Rutkowsky, J.M.; Snodgrass, R.G.; Ono-Moore, K.D.; Schneider, D.A.; Newman, J.W.; Adams, S.H.; Hwang, D.H. Saturated fatty acids activate TLR-mediated proinflammatory signaling pathways. J. Lipid Res. 2012, 53, 2002–2013. [Google Scholar] [CrossRef] [Scilit]
- Milanski, M.; Degasperi, G.; Coope, A.; Morari, J.; Denis, R.; Cintra, D.E.; Tsukumo, D.M.; Anhe, G.; Amaral, M.E.; Takahashi, H.K.; et al. Saturated fatty acids produce an inflammatory response predominantly through the activation of TLR4 signaling in hypothalamus: Implications for the pathogenesis of obesity. J. Neurosci. 2009, 29, 359–370. [Google Scholar] [CrossRef] [Scilit]
- Davis, J.E.; Gabler, N.K.; Walker-Daniels, J.; Spurlock, M.E. Tlr-4 deficiency selectively protects against obesity induced by diets high in saturated fat. Obesity 2008, 16, 1248–1255. [Google Scholar] [CrossRef] [Scilit]
- Shi, H.; Kokoeva, M.V.; Inouye, K.; Tzameli, I.; Yin, H.; Flier, J.S. TLR4 links innate immunity and fatty acid–induced insulin resistance. Clin. Investig. 2006, 116, 3015–3025. [Google Scholar]
- Engelmann, C.; Sheikh, M.; Sharma, S.; Kondo, T.; Loeffler-Wirth, H.; Zheng, Y.B.; Novelli, S.; Hall, A.; Kerbert, A.; Macnaughtan, J.; et al. Toll-like receptor 4 is a therapeutic target for prevention and treatment of liver failure. J. Hepatol. 2020, 73, 102–112. [Google Scholar] [CrossRef] [Scilit]
- Quan, J.; Liu, J.; Gao, X.; Liu, J.; Yang, H.; Chen, W.; Li, W.; Li, Y.; Yang, W.; Wang, B. Palmitate induces interleukin-8 expression in human aortic vascular smooth muscle cells via Toll-like receptor 4/nuclear factor-κB pathway. Diabetes 2014, 6, 33–41. [Google Scholar] [CrossRef] [Scilit] [PubMed]
- Eguchi, K.; Manabe, I.; Oishi-Tanaka, Y.; Ohsugi, M.; Kono, N.; Ogata, F.; Yagi, N.; Ohto, U.; Kimoto, M.; Miyake, K.; et al. Saturated fatty acid and TLR signaling link β cell dysfunction and islet inflammation. Cell Metab. 2012, 5, 518–533. [Google Scholar] [CrossRef] [Scilit] [PubMed]
- Hussain, G.; Schmitt, F.; Loeffler, J.P.; Aguilar, J.L. Fatting the brain: A brief of recent research. Front. Cell. Neurosci. 2013, 7, 144. [Google Scholar] [CrossRef] [Scilit]
- Zhou, B.R.; Zhang, J.A.; Zhang, Q.; Permatasari, F.; Xu, Y.; Wu, D.; Yin, Z.Q.; Luo, D. Palmitic acid induces production of proinflammatory cytokines interleukin-6, interleukin-1β, and tumor necrosis factor-α via a NF-κB-dependent mechanism in HaCaT keratinocytes. Mediat. Inflamm. 2013, 2013, 530429. [Google Scholar]
- Wen, H.; Gris, D.; Lei, Y.; Jha, S.; Zhang, L.; Huang, M.T.; Brickey, W.J.; Ting, J.P. Fatty acid–induced NLRP3-ASC inflammasome activation interferes with insulin signaling. Nat. Immunol. 2011, 12, 408–415. [Google Scholar] [CrossRef] [Scilit]
- Gupta, S.; Knight, A.G.; Gupta, S.; Keller, J.N.; Bruce-Keller, A.J. Saturated long-chain fatty acids activate inflammatory signaling in astrocytes. J. Neurochem. 2012, 120, 1060–1071. [Google Scholar] [CrossRef] [Scilit] [PubMed]
- Rodriguez-Pacheco, F.; Gutierrez-Repiso, C.; Garcia-Serrano, S.; Alaminos-Castillo, M.A.; Ho-Plagaro, A.; Valdes, S.; Garcia-Arnes, J.; Gonzalo, M.; Andrade, R.J.; Moreno-Ruiz, F.J.; et al. The pro-/anti-inflammatory effects of different fatty acids on visceral adipocytes are partially mediated by GPR120. Eur. J. Nutr. 2017, 56, 1743–1752. [Google Scholar]
- Jové, M.; Planavila, A.; Sánchez, R.M.; Merlos, M.; Laguna, J.C.; Vázquez-Carrera, M. Palmitate induces tumor necrosis factor-α expression in C2C12 skeletal muscle cells by a mechanism involving protein kinase C and nuclear factor-κB activation. Endocrinology 2006, 147, 552–561. [Google Scholar]
- Bianchini, G.; Nigro, C.; Sirico, A.; Novelli, R.; Prevenzano, I.; Miele, C.; Beguinot, F.; Aramini, A. A new synthetic dual agonist of GPR120/GPR40 induces GLP-1 secretion and improves glucose homeostasis in mice. Biomed. Pharmacother. 2021, 139, 111613. [Google Scholar] [CrossRef] [Scilit]
- Oh, D.Y.; Walenta, E. Omega-3 fatty acids and FFAR4. Front. Endocrinol. 2014, 5, 115. [Google Scholar] [CrossRef] [Scilit]
- Talukdar, S.; Olefsky, J.M.; Osborn, O. Targeting GPR120 and other fatty acid-sensing GPCRs ameliorates insulin resistance and inflammatory diseases. Trends Pharmacol. Sci. 2011, 32, 543–550. [Google Scholar] [CrossRef] [Scilit]
- Liou, A.P.; Lu, X.; Sei, Y.; Zhao, X.; Pechhold, S.; Carrero, R.J.; Raybould, H.E.; Wank, S. The G-protein− coupled receptor GPR40 directly mediates long-chain fatty acid− induced secretion of cholecystokinin. Gastroenterology 2011, 140, 903–912. [Google Scholar] [CrossRef] [Scilit]
- Dragano, N.R.; Solon, C.; Ramalho, A.F.; de Moura, R.F.; Razolli, D.S.; Christiansen, E.; Azevedo, C.; Ulven, T.; Velloso, L.A. Polyunsaturated fatty acid receptors, GPR40 and GPR120, are expressed in the hypothalamus and control energy homeostasis and inflammation. Neuroinflammation 2017, 14, 91. [Google Scholar] [CrossRef] [Scilit] [PubMed]
- Urso, C.; Zhou, H. Role of CD36 in palmitic acid lipotoxicity in neuro-2a neuroblastoma cells. Biomolecules 2021, 11, 1567. [Google Scholar] [CrossRef] [Scilit]
- Xiao, J.; Cai, T.; Fang, Y.; Liu, R.; Flores, J.J.; Wang, W.; Gao, L.; Liu, Y.; Lu, Q.; Tang, L.; et al. Activation of GPR40 attenuates neuroinflammation and improves neurological function via PAK4/CREB/KDM6B pathway in an experimental GMH rat model. Neuroinflammation 2021, 18, 160. [Google Scholar] [CrossRef] [Scilit]
- Hara, T.; Hirasawa, A.; Ichimura, A.; Kimura, I.; Tsugimoto, G. Free fatty acid receptors FFAR1 and GPR120 as novel therapeutic targets for metabolic disorders. Pharm. Sci. 2011, 100, 3594–3601. [Google Scholar] [CrossRef] [Scilit]
- Urso, C.; Zhou, H. Palmitic acid lipotoxicity in microglia cells is ameliorated by unsaturated fatty acids. Int. J. Mol. Sci. 2021, 22, 9093. [Google Scholar] [CrossRef] [Scilit] [PubMed]
- Urso, C.; Zhou, H. Palmitic acid-induced defects in cell cycle progression and cytokinesis in Neuro-2a cells. Cell Cycle 2022, 21, 1048–1057. [Google Scholar] [CrossRef] [Scilit]
- Lasala, N.; Zhou, H. Effects of maternal exposure to LPS on the inflammatory response in the offspring. Neuroimmunology 2007, 189, 95–101. [Google Scholar] [CrossRef] [Scilit] [PubMed]
- Surriga, O.; Ortega, A.; Jadeja, V.; Bellafronte, A.; Lasala, N.; Zhou, H. Altered hepatic inflammatory response in the offspring following prenatal LPS exposure. Immunol. Lett. 2009, 123, 88–95. [Google Scholar] [CrossRef] [Scilit]
- Le Rouzic, V.; Corona, J.; Zhou, H. Postnatal development of hepatic innate immune response. Inflammation 2011, 34, 576–584. [Google Scholar] [CrossRef] [Scilit]
- Zhou, H. Region specific effects of maternal immune activation on offspring neuroimmune function. Open J. Immunol. 2015, 5, 51–63. [Google Scholar] [CrossRef] [PubMed]
- Ortega, A.; Jadeja, V.; Zhou, H. Postnatal development of lipopolysaccharide-induced inflammatory response in the brain. Inflamm. Res. 2011, 60, 175–185. [Google Scholar] [CrossRef] [Scilit]
- Kreutzer, C.; Peters, S.; Schulte, D.M.; Fangmann, D.; Türk, K.; Wolff, S.; van Eimeren, T.; Ahrens, M.; Beckmann, J.; Schafmayer, C.; et al. Hypothalamic inflammation in human obesity is mediated by environmental and genetic factors. Diabetes 2017, 66, 2407–2415. [Google Scholar] [CrossRef] [Scilit]
- Park, E.J.; Lee, J.H.; Yu, G.Y.; He, G.; Ali, S.R.; Holzer, R.G.; Österreicher, C.H.; Takahashi, H.; Karin, M. Dietary and genetic obesity promote liver inflammation and tumorigenesis by enhancing IL-6 and TNF expression. Cell 2010, 140, 197–208. [Google Scholar] [CrossRef] [Scilit]
- Wu, H.; Ballantyne, C.M. Skeletal muscle inflammation and insulin resistance in obesity. Clin. Investig. 2017, 127, 43–54. [Google Scholar] [CrossRef] [Scilit]
- Sagrillo-Fagundes, L.; Assunção Salustiano, E.M.; Ruano, R.; Markus, R.P.; Vaillancourt, C. Melatonin modulates autophagy and inflammation protecting human placental trophoblast from hypoxia/reoxygenation. Pineal Res. 2018, 65, e12520. [Google Scholar] [CrossRef] [Scilit]
- Ubhayasekera, S.J.; Staaf, J.; Forslund, A.; Bergsten, P.; Bergquist, J. Free fatty acid determination in plasma by GC-MS after conversion to Weinreb amides. Anal. Bioanal. Chem. 2013, 405, 1929–1935. [Google Scholar] [CrossRef] [Scilit] [PubMed]
- Staaf, J.; Ubhayasekera, S.J.; Sargsyan, E.; Chowdhury, A.; Kristinsson, H.; Manell, H.; Bergquist, J.; Forslund, A.; Bergsten, P. Initial hyperinsulinemia and subsequent β-cell dysfunction is associated with elevated palmitate levels. Pediatr. Res. 2016, 80, 267–274. [Google Scholar] [CrossRef] [Scilit] [PubMed]
- Melo, H.M.; da Silva, G.D.; Sant’Ana, M.R.; Teixeira, C.V.; Clarke, J.R.; Coreixas, V.S.; de Melo, B.C.; Fortuna, J.T.; Forny-Germano, L.; Ledo, J.H.; et al. Palmitate is increased in the cerebrospinal fluid of humans with obesity and induces memory impairment in mice via pro-inflammatory TNF-α. Cell Rep. 2020, 30, 2180–2194. [Google Scholar] [CrossRef] [Scilit]
- Tsai, S.J. Effects of interleukin-1beta polymorphisms on brain function and behavior in healthy and psychiatric disease conditions. Cytokine Growth Factor Rev. 2017, 37, 89–97. [Google Scholar] [CrossRef] [Scilit]
- Shaftel, S.S.; Griffin, W.S.; O’Banion, M.K. The role of interleukin-1 in neuroinflammation and Alzheimer disease: An evolving perspective. Neuroinflammation 2008, 5, 7. [Google Scholar] [CrossRef] [Scilit]
- Liu, X.; Quan, N. Microglia and CNS interleukin-1: Beyond immunological concepts. Front. Neurol. 2018, 9, 8. [Google Scholar] [CrossRef] [Scilit]
- Wang, Z.; Liu, D.; Wang, F.; Liu, S.; Zhao, S.; Ling, E.A.; Hao, A. Saturated fatty acids activate microglia via Toll-like receptor 4/NF-κB signalling. Br. J. Nutr. 2012, 107, 229–241. [Google Scholar] [CrossRef] [Scilit] [PubMed]
- Nicholas, D.A.; Zhang, K.; Hung, C.; Glasgow, S.; Aruni, A.W.; Unternaehrer, J.; Payne, K.J.; Langridge, W.H.; De Leon, M. Palmitic acid is a toll-like receptor 4 ligand that induces human dendritic cell secretion of IL-1β. PLoS ONE 2017, 12, e0176793. [Google Scholar] [CrossRef] [Scilit] [PubMed]
- Tsai, Y.W.; Lu, C.H.; Chang, R.C.; Hsu, Y.P.; Ho, L.T.; Shih, K.C. Palmitoleic acid ameliorates palmitic acid-induced proinflammation in J774A. 1 macrophages via TLR4-dependent and TNF-α-independent signalings. Prostaglandins Leukot. Essent. Fat. Acids 2021, 169, 102270. [Google Scholar] [CrossRef] [Scilit]
- Zhou, H.; Urso, C.; Jadeja, V. Saturated fatty acids in obesity-associated inflammation. Inflamm. Res. 2020, 13, 1–4. [Google Scholar] [CrossRef] [Scilit]
- Lancaster, G.I.; Langley, K.G.; Berglund, N.A.; Kammoun, H.L.; Reibe, S.; Estevez, E.; Weir, J.; Mellett, N.A.; Pernes, G.; Conway, J.R.; et al. Evidence that TLR4 is not a receptor for saturated fatty acids but mediates lipid-induced inflammation by reprogramming macrophage metabolism. Cell Metab. 2018, 27, 1096–1110. [Google Scholar] [CrossRef] [Scilit] [PubMed]
- Hirasawa, A.; Takeuchi, M.; Hara, T.; Hirata, A.; Tanabe, S.; Umeda, N. Fatty Acids Receptors. In Bioactive Lipid Mediators: Current Reviews and Protocols; Springer: Tokyo, Japan, 2015; pp. 139–154. [Google Scholar]
- Itoh, Y.; Kawamata, Y.; Harada, M.; Kobayashi, M.; Fujii, R.; Fukusumi, S.; Ogi, K.; Hosoya, M.; Tanaka, Y.; Uejima, H.; et al. Free fatty acids regulate insulin secretion from pancreatic β cells through GPR40. Nature 2003, 422, 173–176. [Google Scholar] [CrossRef] [Scilit]
- Kebede, M.; Alquier, T.; Latour, M.G.; Semache, M.; Tremblay, C.; Poitout, V. The fatty acid receptor GPR40 plays a role in insulin secretion in vivo after high-fat feeding. Diabetes 2008, 57, 2432–2437. [Google Scholar] [CrossRef] [Scilit]
- Vettor, R.; Granzotto, M.; De Stefani, D.; Trevellin, E.; Rossato, M.; Farina, M.G.; Milan, G.; Pilon, C.; Nigro, A.; Federspil, G.; et al. Loss-of-function mutation of the GPR40 gene associates with abnormal stimulated insulin secretion by acting on intracellular calcium mobilization. Clin. Endocrinol. Metab. 2008, 93, 3541–3550. [Google Scholar] [CrossRef] [Scilit]
- Verma, M.K.; Sadasivuni, M.K.; Yateesh, A.N.; Neelima, K.; Mrudula, S.; Reddy, M.; Smitha, R.; Biswas, S.; Chandravanshi, B.; Pallavi, P.M.; et al. Activation of GPR40 attenuates chronic inflammation induced impact on pancreatic β-cells health and function. BMC Cell Biol. 2014, 15, 24. [Google Scholar] [CrossRef] [Scilit]
- Oh, D.Y.; Walenta, E.; Akiyama, T.E.; Lagakos, W.S.; Lackey, D.; Pessentheiner, A.R.; Sasik, R.; Hah, N.; Chi, T.J.; Cox, J.M.; et al. A Gpr120-selective agonist improves insulin resistance and chronic inflammation in obese mice. Nat. Med. 2014, 20, 942–947. [Google Scholar] [CrossRef] [Scilit]
- Reyna, S.M.; Ghosh, S.; Tantiwong, P.; Meka, C.R.; Eagan, P.; Jenkinson, C.P.; Cersosimo, E.; DeFronzo, R.A.; Coletta, D.K.; Sriwijitkamol, A.; et al. Elevated toll-like receptor 4 expression and signaling in muscle from insulin-resistant subjects. Diabetes 2008, 57, 2595–2602. [Google Scholar] [CrossRef] [Scilit]
- Dasu, M.R.; Devaraj, S.; Park, S.; Jialal, I. Increased toll-like receptor (TLR) activation and TLR ligands in recently diagnosed type 2 diabetic subjects. Diabetes Care 2010, 33, 861–868. [Google Scholar] [CrossRef] [Scilit]
- Kalinderi, K.; Bostantjopoulou, S.; Katsarou, Z.; Fidani, L. TLR9− 1237 T/C and TLR2− 194 to− 174 del polymorphisms and the risk of Parkinson’s disease in the Greek population: A pilot study. Neurol. Sci. 2013, 34, 679–682. [Google Scholar] [CrossRef] [Scilit]
- Go, M.; Kou, J.; Lim, J.E.; Yang, J.; Fukuchi, K.I. Microglial response to LPS increases in wild-type mice during aging but diminishes in an Alzheimer’s mouse model: Implication of TLR4 signaling in disease progression. Biochem. Biophys. Res. Commun. 2016, 479, 331–337. [Google Scholar] [CrossRef] [Scilit] [PubMed]
- Vollmar, P.; Kullmann, J.S.; Thilo, B.; Claussen, M.C.; Rothhammer, V.; Jacobi, H.; Sellner, J.; Nessler, S.; Korn, T.; Hemmer, B. Active immunization with amyloid-β 1–42 impairs memory performance through TLR2/4-dependent activation of the innate immune system. J. Immunol. 2010, 185, 6338–6347. [Google Scholar] [CrossRef] [Scilit] [PubMed]
- Henn, A.; Lund, S.; Hedtjärn, M.; Schrattenholz, A.; Pörzgen, P.; Leist, M. The suitability of BV2 cells as alternative model system for primary microglia cultures or for animal experiments examining brain inflammation. ALTEX-Altern. Anim. Exp. 2009, 26, 83–94. [Google Scholar] [CrossRef] [Scilit] [PubMed]
- Butovsky, O.; Jedrychowski, M.P.; Moore, C.S.; Cialic, R.; Lanser, A.J.; Gabriely, G.; Koeglsperger, T.; Dake, B.; Wu, P.M.; Doykan, C.E.; et al. Identification of a unique TGF-β–dependent molecular and functional signature in microglia. Nat. Neurosci. 2014, 17, 131–143. [Google Scholar] [CrossRef] [Scilit]
- Gosselin, D.; Skola, D.; Coufal, N.G.; Holtman, I.R.; Schlachetzki, J.C.M.; Sajti, E.; Bhatt, D.L.; Mandell, M.A.; Gennady, G.; Glass, C.K.; et al. An environment-dependent transcriptional network specifies human microglia identity. Science 2017, 356, eaal3222. [Google Scholar] [CrossRef] [Scilit]
- Valasek, M.A.; Repa, J.J. The power of real-time PCR. Adv. Physiol. Educ. 2005, 29, 151–159. [Google Scholar] [CrossRef] [Scilit]
- Ririe, K.M.; Rasmussen, R.P.; Wittwer, C.T. Product differentiation by analysis of DNA melting curves during the polymerase chain reaction. Anal. Biochem. 1997, 245, 154–160. [Google Scholar] [CrossRef] [Scilit]
- Nolan, T.; Hands, R.E.; Bustin, S.A. Quantification of mRNA using real-time RT-PCR. Nat. Protoc. 2006, 1, 1559–1582. [Google Scholar] [CrossRef] [Scilit] [PubMed]
- Bustin, S.A.; Nolan, T. Pitfalls of quantitative real-time reverse-transcription polymerase chain reaction. J. Biomol. Tech. 2004, 15, 155–166. [Google Scholar]
- Carta, G.; Murru, E.; Banni, S.; Manca, C. Palmitic acid: Physiological role, metabolism and nutritional implications. Front. Physiol. 2017, 8, 902. [Google Scholar] [CrossRef] [Scilit] [PubMed]
- Karpe, F.; Dickmann, J.R.; Frayn, K.N. Fatty acids, obesity, and insulin resistance: Time for a reevaluation. Diabetes 2011, 60, 2441–2449. [Google Scholar] [CrossRef] [Scilit]
- Boden, G. Obesity and free fatty acids. Endocrinol. Metab. Clin. N. Am. 2008, 37, 635–646. [Google Scholar] [CrossRef] [Scilit]
- Cnop, M.; Foufelle, F.; Velloso, L.A. Endoplasmic reticulum stress, obesity and diabetes. Trends Mol. Med. 2012, 18, 59–68. [Google Scholar] [CrossRef] [Scilit]
- Ly, L.D.; Xu, S.; Choi, S.K.; Ha, C.M.; Thoudam, T.; Cha, S.K.; Wiederkehr, A.; Wollheim, C.B.; Lee, I.K.; Park, K.S. Oxidative stress and calcium dysregulation by palmitate in type 2 diabetes. Exp. Mol. Med. 2020, 49, e291. [Google Scholar] [CrossRef] [Scilit] [PubMed]
- Yang, C.; Sui, G.; Wang, L.; Chen, Z.; Wang, F. MiR-124 Prevents the Microglial Proinflammatory Response by Inhibiting the Activities of TLR4 and Downstream NLRP3 in Palmitic Acid-Treated BV2 Cells. J. Mol. Neurosci. 2022, 72, 496–506. [Google Scholar] [CrossRef] [Scilit] [PubMed]
- Yu, Q.; Yang, Y.; Xu, T.; Cai, Y.; Yang, Z.; Yuan, F. Palmitoleic acid protects microglia from palmitate-induced neurotoxicity in vitro. PLoS ONE 2024, 19, e0297031. [Google Scholar] [CrossRef] [Scilit]
- Kinney, J.W.; Bemiller, S.M.; Murtishaw, A.S.; Leisgang, A.M.; Salazar, A.M.; Lamb, B.T. Inflammation as a central mechanism in Alzheimer’s disease. Alzheimers Dement. 2018, 4, 575–590. [Google Scholar] [CrossRef] [Scilit] [PubMed]


Disclaimer/Publisher’s Note: The statements, opinions and data contained in all publications are solely those of the individual author(s) and contributor(s) and not of MDPI and/or the editor(s). MDPI and/or the editor(s) disclaim responsibility for any injury to people or property resulting from any ideas, methods, instructions or products referred to in the content. |
© 2026 by the authors. Licensee MDPI, Basel, Switzerland. This article is an open access article distributed under the terms and conditions of the Creative Commons Attribution (CC BY) license.