
- Article

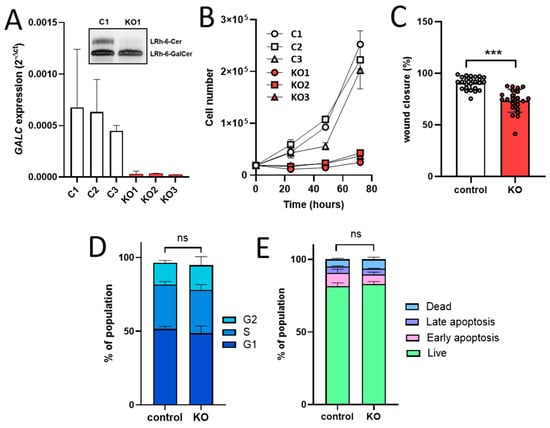
Background/Objectives: Mitochondrial plasticity, reflected by the capacity of cancer cells to shift between oxidative phosphorylation and glycolytic metabolism in response to genetic alterations and changes in the tumor microenvironment, represents a key feature of melanoma progression. Sphingolipids contribute to the metabolic adaptations that support tumor development. Previous studies have demonstrated that β-galactosylceramidase (GALC), a lysosomal enzyme involved in sphingolipid metabolism, alters lipid composition and promotes a pro-oncogenic phenotype in melanoma cells. Here, we investigated the impact of GALC knockout (KO) on mitochondrial energy metabolism in human melanoma. Methods: CRISPR/Cas9-mediated gene editing was used in BRAF(V600E) mutated A2058 human melanoma cells to generate nine GALC KO clones and three control clones. Targeted analyses of the mitochondrial sphingolipid profile, transcriptomic profiling, and mitochondrial structural and functional assessments, including the Seahorse Mito-Stress Test, were performed in GALC KO and control cell clones. Results: GALC loss induced sphingolipid-mediated reprogramming of mitochondrial metabolism in the absence of major structural alterations. This metabolic phenotype was characterized by bioenergetic insufficiency, potentially resulting from a sphingolipid-driven impairment of mitochondrial respiratory chain function. Conclusions: Overall, our findings indicate that GALC loss suppresses mitochondrial metabolism through sphingolipid-mediated mechanisms and provides new insights into the potential exploitation of mitochondrial metabolic vulnerabilities for the development of therapeutic strategies targeting melanoma.
4 October 2026