


Abstract
Capillary electrophoresis with Capacitively Coupled Contactless Conductivity Detection (CE-C4D) offers high analytical efficiency and low sample consumption. However, commercial instrumentation remains cost-prohibitive for resource-limited or citizen science settings. Here, we report the design, fabrication, and experimental validation of a low-cost, modular CE-C4D platform based on open hardware architectures (dual C4D, Arduino, RAMPS, and syringe pump modules), FDM 3D-printed parts, 3D printer hardware, Luer-standard medical supplies for pneumatic integrity, and a commercial DC–DC converter. Pressure-driven flow tests demonstrated excellent pneumatic and hydrodynamic stability, yielding variation coefficients below 0.5% for displaced sample plugs. Low-pressure Dual-Opposite Injections of nanoliter-scale sample plugs were implemented using custom hollow-electrode manifolds and a motorized medical three-way valve. Operating under suppressed electroosmotic flow in 2.3 M acetic acid, simultaneous separation of inorganic ions (K+, Ca2+, Mg2+, NO3−, Cl−, SO42−) was achieved in synthetic and commercial hydroponic nutrient samples in less than 5 min for single-detector readings and 12 min for dual-point detection. Dual-point detection enables in-line auto-verification of assay validity, continuously confirming electromigration velocity, peak identity, and hydrodynamic consistency. The hardware achieves reliable run-to-run repeatability and robust fluidic control, providing an accessible, replicable instrument foundation for decentralized chemical profiling and quantitative analytical methods.
1. Introduction
In various experimental scenarios, obtaining an accurate description of the system requires qualitative and quantitative information on multiple analytes. This requires the use of selective sensors or the separation of analytes prior to detection. An effective option for the latter is combining capillary electrophoresis with Capacitively Coupled Contactless Conductivity Detection (CE-C4D).
The separation technique is well established and offers several advantages, such as being modelable [1,2], portable and miniaturizable [3], using minimal sample volumes, generating low waste, providing high separation power without moving parts [3,4] and achieving high separation efficiency with short analysis times [5]. Additionally, since basic instrumental foundations can now be obtained from accessible electronic and electromechanical components, such systems hold significant potential within the context of citizen science [4]. Meanwhile, C4D units are versatile, operate without direct sample contact, and can be constructed with relative ease at low cost. Focusing predominantly— though not exclusively—on electrophoretic separations, numerous reviews about C4D have been published over the years, showcasing advancements in miniaturization, lab-on-a-chip systems, and portable instrumentation. These works also highlight significant progress in integrated circuits, algorithmic signal processing, electrode architecture, differential configurations, hybrid detection cells, and 3D fabrication, among others [6,7,8,9,10,11,12,13].
The construction of CE equipment, incorporating C4Ds or other detectors, has been documented and reviewed on several occasions at both laboratory and portable scales [1,2,3,4,5,14,15], even including applications for space exploration [16]. Regarding open-source hardware [17], several alternatives exist, many of which are documented in thematic articles [18]. Beyond individual open-source components, full-scale open platforms have also demonstrated value. Among these, a truly remarkable project is OpenCE [19], whose extensive documentation facilitates its implementation, particularly in developing countries. These types of instruments have been utilized in diverse contexts, including environmental monitoring and water-quality assessment, as well as quality control and counterfeit drug detection [20].
CE instruments usually use polyimide-coated fused silica capillaries conditioned for electrophoretic separation in a suitable background electrolyte (BGE). Consequently, filling these capillaries with BGE is required prior to introducing analytes [21]. This can be achieved hydrodynamically, either via gravity-driven hydrostatic height differences or by applying external pressure or vacuum. This principle, based on pressure differentials, can also be applied to inject sample plugs via pressure injection (PI). Alternatively, the introduction of ionized analytes can be performed using the same hardware applied during separation, namely via electrokinetic injection (EKI). Both PI and EKI can be carried out at a single capillary inlet or at both ends. In the dual-inlet configuration, commonly referred to as Dual-Opposite Injection (DOI) [21,22,23,24], at least two PIs must be performed sequentially, whereas EKI allows for simultaneous introduction [22,23]. This can subsequently lead to a Dual Opposite-Direction electrophoretic separation, which has been implemented to separate small anions and cations [25,26].
Although EKI can always be performed in a CE instrument, a classic argument against it is the potential lack of reproducibility due to the effect that each sample matrix may exert (matrix bias) on the electrokinetic entry of ionized analytes [3,5,21,23]. Similarly, when performed manually, injection relying on height differences and timing can be problematic due to poor repeatability. Consequently, implementation of an automated pneumatic PI system is advantageous. In turn, a pneumatic system, particularly one operating under low-pressure control where leaks are not easily detected as major failures, demands connections with guaranteed tightness. Because commercial analytical chemistry supplies carry high costs, turning to alternative standards is practically indispensable under budget-constrained conditions.
Hydroponic nutrients were analyzed as an application case to showcase the practical utility of the CE-C4D instrument. These nutrients are small ions detectable with C4D units. Furthermore, they can be separated using a high-voltage power supply (HVPS) operating at relatively low voltage and power, making the required hardware more accessible and less hazardous. Therefore, coherent qualitative profiles of these nutrients serve as an ideal benchmark to validate the instrument’s electrokinetic and hydrodynamic integrity. At this hardware development stage, primary emphasis is deliberately placed on operational repeatability and profile consistency across consecutive runs of a given experiment, rather than exhaustive analytical method optimization (e.g., maximizing sensitivity or minimizing limits of detection). Nevertheless, demonstrating run-to-run repeatability provides a reliable physical foundation upon which dedicated quantitative methods can subsequently be developed.
Furthermore, tracking daily nutrient consumption during crop cycles has been studied using ion-selective electrodes [27,28,29,30,31] and other techniques [32]. Currently, online systems exist for continuous monitoring of hydroponic nutrients via CE [33], offering high automation for steps like technique switching and sample collection at a cost near 50,000 USD, excluding operational costs.
Interest in recurrent monitoring stems from the valuable insights provided by nutritional changes [34]. On one hand, it supports optimizing nutrient replenishment on a selective, plant demand basis, rather than as a single bulk addition based on overall conductivity drops, which is common practice. This approach enables early detection of specific deficiencies or excesses, potentially optimizing biomass and target metabolite production or signaling the onset of diseases [32]. On the other hand, it is critical for water conservation. When one or more ions accumulate after repeated additions, they can act as antagonists causing nutrient imbalance in plant uptake or even induce toxicity [28,29], which often leads to discarding significant volumes of nutrient rich water [31,32]. Such waste directly contradicts the efficiency of hydroponic systems, which typically use about 10% of the water needed for conventional soil farming [35,36].
In terms of costs, commercial standard capillary electrophoresis instruments typically range from 20,000 to over 100,000 USD [15]. In non-commercial domains, full costs are only occasionally reported, with figures ranging from microchip systems down to 500 USD (which also require factoring in the cost of lab-on-a-chip manufacturing technology) [37], to modular configurations totaling approximately 7500 USD (where around 4000 USD corresponds solely to the commercial C4D unit) [38] and around 11,600 USD (5800 USD for the electrophoresis module itself) [39]. Meanwhile, cost estimates for OpenCE (including labor, 2021 prices) range from approximately 9200 to 9800 USD [19].
In relation to the present study, the concept of assembling analytical instrumentation from commercially available modular parts [38], often framed through the Lego block analogy [39], has been demonstrated for CE systems utilizing plug-and-play microfluidic and electrophoretic components. Here, this concept applies in a slightly different manner. The HVPS is a commercial device that essentially functions as a plug-and-play unit. However, most of the standardized elements used in this work were not originally designed as analytical plug-and-play components for capillary electrophoresis. Instead, they originate primarily from electromechanical components of open-source 3D printers (e.g., nozzles, stepper motors), aligning with the concept of hacking 3D printers into laboratory robots [40], and from medical or nursing consumables. Regarding the latter, given the need for leak-tight pneumatic connections in cost-sensitive scenarios, Luer standard medical supplies were adopted to guarantee fully sealed connections. Along with other standardized components, the setup incorporates three-way valves (3WVs) for multiple routing functions (including a motorized unit, M3WV, for automated low-pressure injections), hypodermic needles, syringes and plunger stoppers. Because the majority of these components are readily available at medical supply stores at low cost, their accessibility is significantly enhanced. Additionally, some parts are derived from existing open-source hardware with precise assembly instructions and worldwide availability, leveraging fully documented and tested designs such as a Syringe Pump (SP) [41], slightly modified C4D units [42,43], RAMPS (RepRap Arduino Mega Pololu Shield) [44] and Arduino [45] boards. This strategy drastically reduces costs, promotes citizen science, and improves overall accessibility on a global scale. The integration of these components, together with custom 3D-printed parts, yields a functional CE system featuring dual C4D detection and Dual-Opposite Injection capability, with a total cost of around 1200 USD. Some of its primary performance aspects are demonstrated in the context of the simultaneous separation of small anions and cations.
Crucially, the main goal of this manuscript is to report and validate the physical instrument, its fabrication paradigms, and its automated fluidic and electrical integration. Consequently, the presented experimental runs are intended to prove hardware capability and operational repeatability under real operational conditions, deliberately setting aside matrix-specific analytical optimizations that typically belong to method-development studies. Beyond its potential analytical utility, constructing the instrument fosters a deeper understanding of its operation, facilitating troubleshooting and serving as an accessible platform for training, regardless of whether open-hardware designs are intended for critical quality control methods or primarily targeted at research, development and educational settings [15].
2. Design
The prototype essentially integrates three main systems. The first is the high-voltage (HV) system, which drives the selective electrophoretic migration of species and enables EKI. The second is the pneumatic system, which operates across two regimes: high pressure for capillary washing and low pressure for controlled fluid handling and sample injection. Finally, the dual C4D system monitors electrophoretic runs by recording raw Analog-to-Digital Converter (ADC) counts that track conductivity changes.
A programmable 0 to −10 kV DC-DC converter [46] was used as the HVPS (Section 3.8). This strategic design choice balances analytical resolution with operational feasibility. These electric potentials are sufficient for electrophoretic migration of small ions while maintaining a relatively stable thermal profile within the capillary, although external thermostatting (at laboratory level, e.g., air conditioning) remains advisable. Crucially, for citizen science applications, insulation requirements are met using standard Polyvinyl Chloride (PVC) tape or similar, avoiding the high costs of specialized materials. Additionally, Polylactic Acid (PLA) or Polyethylene Terephthalate Glycol (PETG) 3D-printed structures can provide adequate operator safety when printed with strategic slicing settings, such as applying high perimeter counts around high-voltage metallic components.
The pneumatic injection system (Section 3.4) is based on low-pressure accumulation (reservoir bottle) and maintenance (with an SP) circuit, with release regulated by the motion of a M3WV. The gradual opening of this valve alters the flow area through the progressive intersection of two circular apertures. This geometric transition ensures a progressive rather than instantaneous pressure transfer, thereby enabling Progressive Pressure Injection (PPI). These M3WVs can be custom-fabricated, bypassing the need for commercial low-pressure valves, which often require dedicated service pressure. Furthermore, standard ON/OFF valves lack the capability for gradual pressure changes, potentially compromising sample plug integrity through hydraulic shock (water hammer), and dispersion. Concurrently, capillary rinsing/flushing requires higher pressures (20–30 psi) to overcome significant hydraulic resistance. In this work, an external rechargeable mini-compressor (5 V USB) was employed (Section 3.3).
Manual selection between pressurized air for washing or injection—as well as flow routing toward either the anode or cathode—is managed by a 3WV-based Pneumatic Routing Manifold (PRM). The PRM (Section 3.6) is strategically positioned in close proximity to both hollow-electrode manifolds (HEMs; see next) to minimize dead volumes within the pneumatic circuit. Crucially, these three-way valves are confined to the pneumatic circuit and serve solely to transmit pressure. Neither the buffer solution nor the sample come into contact with them, meaning that they introduce no dead volume into the electrophoretic flow path, which comprises a single capillary connecting two vials. This setup enables direct actuation from both electrodes, facilitating not only simple hydrodynamic injections but also DOI protocols. Given that the integrated DC-DC converters lack polarity reversal capabilities, the ability to introduce samples from either electrode remains a significant advantage, regardless of the electroosmotic flow (EOF) conditions. The HEMs serve as pneumatic–electric interfaces that mechanically protect the internal fused-silica capillary while integrating 3WVs to facilitate both capillary feedthrough and pressurized air delivery. Their 3D-printed frameworks ensure precise alignment of the hollow electrodes (implemented via standard hypodermic needles), accommodate the 3WVs, and feature internal female-threaded ports at their bases for seamless compatibility with male-threaded vial holders. Additionally, the inter-component clearance was optimized to enhance dielectric isolation and prevent electrical arcing. More details can be obtained in Section 3.1.
At the design level, the HEM used here can be compared with another originally reported for chemical cytometry [47]. First, both consist of an assembly of 3D-printed parts acting as electrode holder, capillary holder, and pressure gas inlet, complemented by a fourth component—the vial holders. That design relied on narrow passages for both the capillary and the electrode, which were intended to ensure airtightness and prevent gas leakage at high pressure. This approach was identified as problematic in a subsequent publication [48]. Specifically, the authors noted that the original injector had a serious limitation, as a narrow and long hole was required to snugly hold the narrow capillary and electrode to minimize leaking during pressurized operation. The authors highlighted that machining was difficult and that capillaries and electrodes occasionally broke within the hole, making the extraction of broken fragments usually futile. Consequently, that study reduced the number of 3D-printed parts and introduced other structural modifications. Later, a more recent version [49] incorporated an aseptic design, preserving means to sterilize the system between analyses. In that version, similarly to our work, a cylindrical vial holder was externally threaded, replacing previous clamped blocks.
All three referenced designs required high-performance resin 3D printers, with only the vial holders in the latest version being printed on a more accessible Anycubic Photon M3 (which remains a resin-based system). In contrast, to enhance overall accessibility, our work relied exclusively on a filament Fused Deposition Modeling (FDM) 3D printer (Creality Ender 3 V2). Furthermore, airtightness is delegated entirely to non-printed components. Just as in our design and in other custom-built instruments, the vial holders are positioned manually (unlike commercial CE systems or external modules, such as a fully automated 3D printed open-source autosampler [50]). Among other structural differences, our implementation utilizes hollow electrodes, does not use platinum wire, and avoids soldering in the HEM assembly.
Although numerous C4D variants have been reported, this work employed the open-source detector designs developed by do Lago [42,43], with a modification to the excitation circuitry. The original excitation oscillator was not populated, and the excitation signal was instead supplied externally through an additional wire connected to a custom-built Arduino UNO [43] shield incorporating a commercial signal generator module based on the Analog Devices AD9833 programmable waveform generator (refer to Section 3.9 and to Figure S1 in the Supplementary Material for details). This configuration is similar to that reported using an AD9834 [14] and allows for frequency tuning to optimize Signal-to-Noise Ratios (SNRs) and enhance sensitivity [51,52]. By varying the excitation signal dynamically during the electrophoretic run, the simultaneous recording of migration time, excitation, and signal produces multi-way multivariate data, enabling the use of chemometric techniques with high potential for resolving overlapping components [53,54]. The AD9833 module provides amplitude adjustment through an MCP41010 digital potentiometer, while a simple external passive circuit was implemented to provide an adjustable DC offset. The amplitude and DC offset were adjusted prior to the measurements to reproduce the voltage levels and waveform characteristics specified at the test points in the C4D assembly instructions [41]. The resulting configuration therefore preserved the original C4D detector architecture while providing external control of the excitation frequency and amplitude.
The Arduino UNO board (Section 3.8) served as the central interface for the C4D and other instrument subsystems. In addition to interfacing with the C4D signal generator described above, the Arduino integrated the conditioned HVPS-monitoring signals Imon and Vmon (Electrophoretic Current and Voltage monitoring, respectively), a Serial Peripheral Interface (SPI) bus to control both the signal generator and the digital potentiometer used for HVPS voltage regulation, and a relay for the HVPS enable function. As a safety measure, power to the relay remains disconnected as long as the front cover of the instrument is open, preventing accidental activation of the HVPS via software (Section 3.10).
Regarding the main control and interface circuitry (Section 3.5), the system includes several dedicated Printed Circuit Boards (PCBs): a power distribution board (PCB_PDB), an HVPS interface board (PCB_HVPS), an analog signal conditioning board (PCB_MON) and a RAMPS (RepRap Arduino Mega Pololu Shield) [44]. The PCB_PDB receives the main 12 V supply and distributes regulated outputs of 9 V (for the C4D detectors) and 12 V. Some of these outputs are protected by resettable fuses. The board also includes additional screw terminal outputs reserved for future expansions. The HVPS interface board (PCB_HVPS) provides electrical and mechanical interfacing between the HVPS DC-DC converter and the system wiring by routing the male header pins to screw terminal blocks. This allows convenient access to the 12 V input supply, control signals (enable and voltage adjustment), and monitoring outputs. The PCB_MON interface board provides an analog signal-conditioning stage for HVPS monitoring signals, enabling their acquisition with microcontroller-based systems operating in a 0–5 V input range. The board features dedicated input ports for both positive (+10 kV) and negative (−10 kV) HVPS configurations. Users must connect the monitor to the corresponding port based on the supply polarity. While native Vmon outputs span approximately ±10 V, Imon signals operate within a significantly narrower voltage range. The conditioning stage handles signal scaling and polarity correction (ensuring a positive-only output for the Arduino ADC).
Additionally, the RAMPS (1.4) serves as the central control hub for the instrument’s electromechanical components (Section 3.4.1 and Section 3.7). This platform was selected for its modularity and the availability of uncommitted headers reserved for future expansions, such as additional M3WVs, LCD interfaces, interior lighting, and thermal control elements (heating/cooling). The system utilizes Pololu-style power drivers to actuate the NEMA 17 stepper motors. In the baseline configuration, the X-axis is dedicated to the pressurization SP for injection, while the Z-axis controls the M3WV, although the design remains flexible. Setting aside potential future electromechanical upgrades, we opted to report a partially manual version at this stage, allowing for a simpler instrumental setup [4]. Additionally, the RAMPS board facilitates the connection of essential sensors, including the injection pressure sensor, a Hall effect sensor for M3WV positioning, and a thermistor for system temperature tracking. Furthermore, the open-source code allows for the potential migration of all UNO-managed functions to the RAMPS board to implement a more integrated configuration, although this would require independent firmware adaptation by the user.
Consistent with the Arduino/RAMPS boards and the C4D sensors, the SP employed is also open-source hardware. Although various open-source SP designs [55,56] could fulfill the injection pressure maintenance task, we selected a model [41] featuring adjustable 3D-printed components specifically designed to keep the piston actuation centered within the chosen syringe.
Another design objective was to minimize reliance on specialized laboratory consumables for the pneumatic system and to avoid relying on 3D-printed parts for airtightness, owing to the risk of interlayer leaks inherent to FDM printing (discussed below in the context of FDM printing airtightness limitations). While conventional 6 mm pneumatic tubing and fittings were employed, the integration of various Luer-standard clinical nursing supplies is particularly noteworthy. Indeed, cross-compatibility between these two standards is easily achieved. This approach ensures adequate leak-tightness and fluid delivery while drastically reducing costs and improving accessibility, as these components are readily available at local medical supply stores.
This rationale also extends to the use of stainless-steel needle electrodes as a replacement for platinum (Pt) filaments or electrodes. Specifically, a 16 G × 1 ½″ (O.D. 1.6 mm, I.D. 1.2 mm, 36 mm length) surgical steel needle was selected as the hollow electrode due to its chemical inertness and structural rigidity. This mechanical robustness facilitates machining a notch into the needle (Section 3.1) to allow pressurized air to enter and exit the vial headspace directly. This prevents airflow through the distal needle orifice, which would otherwise induce bubbling or liquid backflow during decompression. The needle’s internal diameter was chosen to accommodate a standard fused-silica capillary (363 ± 10 µm O.D. for all reported experiments) while maintaining sufficient clearance for pressurized air flow and preventing unwanted capillary wicking between the needle’s inner wall and the capillary’s exterior.
To facilitate electrical coupling from the DC-DC converter, the needle is integrated into a 3D-printer nozzle via a press-fit assembly (refer to the HEM in Section 3.1.3). An M6 nut is then threaded onto the nozzle to secure the HV lead. Consequently, all electrical interfaces are established through mechanical interference and compression, thereby obviating the need for soldering. From an electrical standpoint, the choice of a solder-less coupling is particularly advantageous in high-voltage applications, as it simplifies the fabrication process and mitigates the risk of corona discharge or dielectric breakdown often associated with irregular solder geometries. The use of stainless steel for the nozzle, needle and nut ensures superior corrosion resistance and long-term electrical stability, mitigating the risk of electrolytic oxidation in high-voltage environments where humidity or electrolyte leakage may occur. Additionally, while needles underwent preventative biannual replacement, the stainless-steel components exhibited no evidence of corrosion or fouling after prolonged operational cycles in CE.
Although the vials are independent components (here, Agilent vials and caps were used), the interface where the electrode nozzle mates with the vial cap warrants careful consideration to ensure a reliable sealing mechanism. Modeled using OpenSCAD [57], the upper portion of each vial holder incorporates a male thread (Figure 1) designed to mate with the corresponding female thread located at the base of the HEM (see also Section 3.1.3 HEM Lower-Interface Block). By facilitating precise vertical displacement of the vials, this threaded engagement regulates the internal liquid level and drives the protruding nozzle interface into direct physical contact with the vial cap, establishing a pneumatic seal while allowing the hollow-needle electrode and capillary to pierce the cap and submerge into the liquid. The vial holders feature a hexagonal geometry to facilitate manual grip and allow for accurate turn-counting during positioning. Furthermore, lateral viewing slots were integrated into the holder walls to monitor the liquid level and ensure the correct immersion of the needle and capillary, and the design incorporates a flat front surface to facilitate sample labeling.
Figure 1.
Design and prototype of the custom vial holder. (a) 3D rendering of the model; (b) FDM 3D-printed physical prototype containing an inserted vial.
The use of FDM 3D printers was a fundamental design premise to ensure widespread accessibility and broader adoption. It is important to note that for those tasks requiring airtight integrity, FDM-manufactured components were avoided due to the inherent risk of gas leakage between layers in such printed parts. Therefore, all gas channels are constructed from metal (needles and 3D-printing nozzles), injection-molded plastic components (3WVs and syringes), or standard pneumatic hardware (6 mm pneumatic tubing and syringe plunger stoppers). The 3D-printed parts serve exclusively to position and secure these pre-existing components. A standard layer height of 0.2 mm was utilized, with the exception of the HEM–Lower-Interface Block and vial holders, where a finer resolution of 0.12 mm was applied to ensure the precision of the mating threads.
For most structural 3D-printed components, printing with either PLA or PETG is suitable. However, for each HEM, given the direct contact of the printed parts with high voltage at the nozzle, PETG was selected. This material offers superior interlayer cohesion, reducing the risk of leakage currents through the printed body (in addition to using insulating lacquer, refer to the HEM in Section 3.1.3). It is also recommended to achieve 100% solid plastic by applying a high perimeter count. This forces the printer to trace continuous concentric rings around the nozzle and needle housing, creating a dense and homogeneous plastic wall around the high potential zone. Additionally, slightly increasing the extrusion width in the slicer is advisable. This forces the extruded plastic to squash against the previous line, eliminating microscopic voids between passes.
The main structure (Section 3.2) serves as the central chassis, providing mechanical support for all system components while ensuring operator safety. The frame can be fabricated from various materials (wood, acrylic, etc.) and may even be fully or partially 3D printed. Essentially, it must feature two horizontal tiers with a 90 mm clearance and a rigid vertical front panel, all of which must be suitable for drilling and supporting mounted components. The entire instrument is housed within a protective wooden enclosure, and the front interface features a dual-pane transparent acrylic design.
Regarding the electrophoretic technique, the BGE was not optimized in terms of separation nor conductivity signal. Instead, 2.3 M acetic acid (HAc) was used throughout all experiments, as it has already demonstrated its chemical stability in terms of EOF suppression but also its high compatibility with C4D detection [58]. While such optimization would be necessary for specific analytes of interest, it is sufficient for the purpose of demonstrating the system’s capabilities. Nonetheless, to ensure predictability and to validate the experimental results, the method and the behavior of various ions under these conditions were previously simulated using PeakMaster 5.4 and electroMicroTransport 21.07 software [59,60].
The Graphical User Interface (GUI) was developed in Python 3.12 [61], primarily utilizing PyQt5 [62], pyqtgraph [63], pySerial [64], and NumPy [65], and enables serial communication with Arduino UNO and MEGA microcontrollers (Section 4.3). Although it is focused on providing the primary functions necessary to operate the system reliably, the codebase remains open for community-driven modifications and feature enhancements. Further details regarding its functionality and operation are provided in Section 4 (Operating Instructions).
In the current configuration presented in this report, the instrument requires external temperature control, such as a climate-controlled laboratory environment. However, with the addition of a few components (such as Peltier modules and cooling fans) and leveraging existing electronic capabilities on the RAMPS board, the system could be rendered portable. In this regard, it is worth noting that its overall volume (the protective enclosure (Section 3.10) has overall dimensions of 54 × 45 × 25 cm) and total weight (9 kg, with the enclosure accounting for 50%) remain easily manageable for a single operator. Furthermore, powered by a 12 V battery, the instrument could operate autonomously in field settings.
Table 1 contains the Bill of Materials, while Table 2 outlines the design file summary. Additionally, Table S1 lists the STL files for all 3D-printed components.
Table 1.
Bill of materials.
Table 2.
Design file summary (please refer to the Supplementary Materials section for details).
3. Build Instructions
This section provides step-by-step instructions for assembling and installing the system components. Alongside the inline figures, the editable CAD model is provided in the CE-C4D.skp file, which can be edited using SketchUp Online [68]. This file focuses on the primary components, offering an additional resource for visualizing the main assembly and understanding system architecture.
3.1. Hollow Electrode Manifold (HEM)
The instrument utilizes a custom additively manufactured manifold designed for simultaneous pressurized fluid control and HV application. This assembly is built from medical supplies (a 3WV and a needle), a 3D printing nozzle and a nut (both made of stainless steel), and 3D-printed components joined by standard mechanical fasteners, which also double as anchoring points for securing the structure onto a vertical support (a perforated acrylic panel in this work).
3.1.1. HEM-Mounting Bracket
To simplify manufacturing and ensure system modularity, a universal split-block design was implemented for the HEM mounting brackets. As shown in Figure 2a–c, this assembly consists of two 3D-printed components and a 3WV. The Key-retaining block and the Mating clamping block were designed to securely enclose the 3WV while providing a versatile interface for structural integration. The Key-retaining block structurally locks the blue 3WV handle in place to prevent accidental shifting. As visible in (a), an M5 nut is inserted into the Key-retaining block, while an M5 screw (20 mm length) inserts directly into the blue handle to hold the 3WV firmly. This arrangement ensures the 3WV remains properly centered, accommodating minor design variations across different brands. This specific fastener assembly is optional and should only be installed if required. For structural attachment to the vertical panel, both components feature integrated captive nut slots designed for M3 screws. This allows either half to serve as the primary anchor, depending on how the bracket is oriented for the anode or cathode configuration. Consequently, the entire assembly can be rotated 180°, enabling the lateral port of the 3WV (utilized for pressurized air delivery) to be oriented precisely according to specific experimental requirements. A hypodermic needle is coupled to the downward-facing male Luer connector (d and e), such that both the 3WV and the needle are axially traversed by the fused-silica capillary.
Figure 2.
HEM mounting and spacing subassembly: (a) Expanded view of the HEM mounting bracket, showing the Key-retaining block (bottom), the 3WV (center), and the Mating clamping block (top) alongside the M3 fasteners. (b) Perspective view of the assembled bracket. (c) Bottom view of the mounting assembly. (d) Hollow-needle electrodes featuring a custom lateral notch and elastomeric plunger stoppers. (e) Needle coupled to the 3WV. (f) Structural integration of the 3D-printed spacer block (black) with the needle–valve assembly, featuring four M3 through-screws positioned for alignment.
Needle (Hollow Electrode)
As depicted in Figure 2, a 16 G × 1 ½″ needle was modified to function as a hollow electrode. This was achieved by machining a 5 mm notch (d), positioned 20 mm from the plastic–metal interface, using a rotary tool equipped with standard cutting and polishing discs. This notch is designed to align with the vial headspace to allow efficient pressurization and venting cycles. After traversing two plunger stoppers (d and e), the needle establishes electrical contact with a 3D printing nozzle at the base (see HEM–Lower-Interface Block). Beyond its electrical and pneumatic functions, the rigid-needle structure provides critical mechanical protection to the fragile capillary to be housed within.
3.1.2. HEM-Spacer
As illustrated in Figure 2f, the intermediate section consists of a monolithic 3D-printed component designed to provide the necessary housing for the 3WV-needle assembly. Additionally, it incorporates through-holes for four M3 bolts, which facilitate the structural connection and securing of the central section to the lower manifold base.
3.1.3. HEM–Lower-Interface Block
Figure 3 provides a comprehensive overview of the Lower-Interface Block, showcasing individual components, modifications, and their structural integration. The lower manifold base was designed to accommodate an HV lead–nut–nozzle assembly (a). This section houses a stainless steel nozzle connected to an HV lead via a stainless steel threaded nut (b). It is noteworthy that the nozzle is positioned such that its conical tip extends through the base, remaining exposed to provide a mechanical compression interface with the vial caps (c,h). The bottom of this base (c) features an internal (female) thread for mating with the vial holders. To enhance its dielectric properties, both the lower manifold base and the bottom surface of the intermediate spacer were dip-coated in HV insulating lacquer (b,c).
Figure 3.
Lower-Interface Block components, modifications, and structural integration: (a) Electrical connection between the HV lead and the 3D-printer nozzle using an M6 nut. (b) Top view of the 3D-printed Lower-Interface Block housing the lead–nut–nozzle assembly. (c) Bottom view of the block’s concentric cavity, showing the nozzle seating and the threaded interface for vial holders. (d) 3D-printer nozzles flanking the drill bit utilized for inner-diameter modification. (e) Close-up of the modified hollow-needle electrode press-fitted through the nozzle, highlighting the drilled hole in the M6 nut for the HV lead. (f) Bottom view of the HEM assembly, demonstrating the needle protrusion through the lower block and the female thread for vial holders. (g) Complete needle–nut–nozzle subassembly with the fused silica capillary axially threaded. (h) Detailed view of the nozzle–vial cap interface, highlighting the appreciable deformation upon engagement.
HV Lead–Nut–Nozzle
The electrical interface is prepared through a two-step modification process of the conductive components (see Figure 3). Initially, a 3D-printer nozzle with an original 0.8 mm orifice (smaller than the outer diameter of the 16 G needle) is selected. This orifice is subsequently enlarged using a 1.5 mm drill bit (d). Since the 16 G needle has an outer diameter of approximately 1.6 mm, this slight undersizing ensures a press-fit assembly and maintains a robust electrical contact as the needle is forced through the nozzle (e), thereby obviating the need for solder joints.
Following the nozzle modification, a 2 mm hole is drilled through the flat face of an M6 nut (e) to accommodate a HV lead. After the lead is passed through the nut, the latter is threaded onto the modified nozzle, securing the electrical connection (a). This procedure is replicated for each electrode assembly to facilitate the individual connection of the leads from the HVPS.
Once the needles are positioned, the capillary ends should protrude slightly from both electrodes (g). Upon achieving pneumatic integrity (h), the vial headspace aligns with the machined notch (g) in the needle, enabling liquid displacement in the capillary via pressurized air. Simultaneously, both the needle tip and the capillary end are submerged within the vial’s liquid phase, establishing the electrical biasing necessary for electrophoretic separation.
3.1.4. HEM-Assembly
As shown in Figure 2b, assembly begins by securing the 3WV within the HEM mounting bracket. To join both halves, the lower right M3 screw shown in Figure 2a is tightened. An M3 × 20 mm length is selected for standalone bracket assembly, whereas an M3 × 40 mm screw is employed if it also anchors the assembly to the front panel. Then, as can be seen in Figure 2f, four M3 × 40 mm bolts are aligned starting from the bracket and passed through the HEM-Spacer. Subsequently, the needle is carefully guided coaxially through the nozzle to facilitate the mechanical interface required for efficient charge transfer (Figure 3e). Finally, the bolts are tightened into the four captive nuts housed within the HEM–Lower-Interface Block (Figure 3f). This fastening sequence exerts a downward axial force on the 3WV, which in turn depresses the needle hub. This mechanical engagement is critical for compressing the needle’s taper against the nozzle’s upper surface, effectively establishing the primary pneumatic seal at the top of the nozzle. This configuration is illustrated in Figure 3h and similarly, the taper that seals the upper surface of the nozzle can be observed in Figure 3g.
Sealing of the Nozzle–Needle Interface
During vial pressurization, the needle penetrates the vial cap, which establishes contact with the lower conical interface of the nozzle, as shown in Figure 3h. While the press-fit between the needle and the nozzle ensures electrical continuity, it does not inherently guarantee a pneumatic seal along the internal contact circumference. Consequently, to prevent compressed air from escaping through the nozzle’s internal bore, the upper extremity must be hermetically sealed.
Pneumatic integrity relies on a critical seal formed at the top of the conductive 3D-printer nozzle. While the large plastic molding constitutes the needle hub (accommodating a Luer cone), the hermetic seal is specifically achieved by a very small, often nearly imperceptible taper at the immediate junction between the metal cannula and the plastic hub molding (Figure 3g). This sealing interface is further reinforced by two elastomeric plunger stoppers (Figure 2d), to ensure a robust hermetic seal under pressure.
3.2. Instrument Frame
The CE assembly requires a frame constructed from wood, acrylic, or similar materials, featuring two horizontal tiers with a 90 mm clearance in this specific setup. The frame used in this work is shown in Figure 4. The lower tier is intended to house the electronics. Here, the use of standoffs is prescribed to elevate the PCBs and prevent damage from potential liquid spills. Positioned above this, an intermediate shelf (b) provides the layout to accommodate some pressure-injection system components (such as the SP and M3WV), while the flat vertical front panel (a) provides a standardized array of mounting holes for the various components detailed in subsequent sections. To ensure experimental flexibility, the structure should ideally be made of an easily drillable material with perforations for routing 6 mm pneumatic tubing, passing cables, mounting NEMA motors and screws, among others. Additionally, specific cutouts might be necessary for high-voltage power supply wiring and DC-DC converters, and breadboards can optionally be mounted on the vertical walls to facilitate multiple electrical connections (b).
Figure 4.
Frame: (a) Front view. (b) Rear view.
3.3. Pneumatic Washing Circuit
As shown in Figure 5, the compressor must be held in a case that is mounted to the Frame (a). The case is secured to the frame using two M3 screws and nuts. Additionally, a 6 mm pneumatic tube of sufficient length (310 mm here) must be prepared to route the line from the compressor, through the wall and under the middle base, toward the central area that will be located between the electrodes (b). To secure the tube at certain points, 6 mm parametric clips are used [69].
Figure 5.
Pneumatic Washing Circuit: (a) Compressor with case, connected through the side wall of the frame with 6 mm pneumatic tubing. (b) Routing of the tubing beneath the middle base of the frame.
3.4. Pneumatic Injection Circuit
The pneumatic injection module integrates a pressurized air reservoir and an actuation assembly featuring a Motorized 3WV (M3WV), facilitating the precisely timed and regulated discharge of pressurized air into the vials. In its idle state, the M3WV isolates the accumulated pressure supply path while venting the downstream lines leading to the electrodes to the atmosphere. This venting pathway is exclusively utilized during injection sequences to relieve low residual pressures following an injection (additional 3WVs dedicated to general system venting are discussed in Section 3.9). If high flush pressure is accidentally directed toward the injection circuit during operation, this default configuration protects the low-pressure sensor (see Figure 6 for additional details).
Figure 6.
Detailed components and assembly of the motorized three-way valve (M3WV) system: (a) Close-up of the 3D-printed Rotary Coupler with the 3WV key installed via press-fit. (b) Details of the coupler-to-shaft attachment for the NEMA 17 stepper motor. (c) Insertion of neodymium magnets into the coupler’s circumference for magnetic indexing. (d) Partial assembly showing the Mounting Support interfaced with the NEMA 17 motor. (e) The 3D-printed Mounting Support featuring notches for valve ports and 40 mm M3 screws. (f) Fully assembled module showing the digital magnetic field sensor, the 6 mm pneumatic tubing, and the male Luer fitting. (g) Frame-Mounting Bracket designed for securing the assembly to the instrument base using cable ties and M3 screws.
3.4.1. Motorized 3WV (M3WV)
As shown in Figure 6, a Rotary Coupler (a) and a Mounting Support (e) were designed and 3D-printed. The Rotary Coupler features a circular geometry, housing the key of a 3WV via a press-fit connection and providing a secure attachment for the NEMA 17 stepper motor shaft (b). Neodymium magnets (c) can be inserted and glued at specific points along its circumference to signal discrete positions. To achieve the configuration proposed in this work, when inserting the magnet exactly as depicted in (c), the 3WV handle must be engaged with the Rotary Coupler such that the front male and bottom female Luer ports are interconnected while the rear female port is occluded. This alignment corresponds to the fluidic state shown in (a), where the forward-facing stem of the valve handle is physically obscured from view by the front male Luer port.
The Mounting Support interfaces with the opposite side of the 3WV handle. This component includes notches to accommodate the three 3WV ports and facilitates the attachment of the assembly to the NEMA 17 motor (d) using 40 mm M3 screws (e). A generic Hall sensor signal conditioning board is mounted onto this support (f) and interfaced with the RAMPS board, as is the M3WV stepper motor. This sensor can vary and it must be positioned to ensure proper sensitivity to the magnet embedded within the Rotary Coupler. A 23 mm long pneumatic tubing (f) is connected to the male port of the M3WV, routed through the front of the frame, and terminated with a male Luer fitting (f). Beyond industrial sources for male Luer fittings, standard intravenous administration sets from local medical supply vendors include extension lines with male Luer terminals. These fit seamlessly into 6 mm pneumatic tubing to provide a tight, leak-free connection. Finally, a Frame Mounting Bracket (g) was printed to secure the NEMA 17 motor using cable ties and to fix the M3WV assembly to the instrument’s intermediate horizontal base via M3 screws.
3.4.2. Pressurized Air-Injection System
The described M3WV must be integrated into a pressurized air-injection system, further details of which are provided in Figure 7.
Figure 7.
A detailed view of the pressurized air-injection system: (a) An MPX5010DP differential pressure sensor, a 6 mm push-to-connect union tee, and a 6 mm push-to-connect union elbow installed on the frame’s side wall. (b) A standalone tubing assembly for air distribution. (c) A tubing assembly interfaced with the pressure sensor and the M3WV. (d) M3WV with a male Luer fitting protruding through the front panel. (e) SP with a 10 mL syringe. (f) An overview of the complete system assembly (shown without the accumulator). (g) An accumulator bottle featuring a 6 mm push-to-connect fitting.
As shown in Figure 7, the system requires a low-pressure sensor (a) to enable the configuration of the injection setpoint, and it must be pneumatically linked to both an accumulator (g) and a tubing assembly (b). In this implementation, we used an NXP MPX5010DP differential pressure sensor [70], which features a maximum differential pressure rating of approximately 1.45 psi relative to the reference port (left open to the atmosphere). The tubing assembly can be configured using 6 mm pneumatic components and/or 3WVs, as convenient, and it serves as the pressurized air distribution network for the injection system (the 3WVs enable partial circuit isolation, which is useful for pneumatic leak detection). As shown in the bottom-right corner of Figure 7b, a 3WV functions as the primary interface, featuring a free female Luer port for a SP and a short blue tube leading to the pressure sensor. This valve connects to an intermediate 3WV acting as a T-junction, where the path splits into two lines: a long blue tube equipped with a terminal 3WV for connection to the M3WV, and a transparent tube ending in a dedicated 3WV used for manual pre-pressurization to minimize the SP workload and displacement. The tubing assembly can be seen connected in (c), while in (d), the output of the M3WV is shown having traversed the front panel of the frame. Finally, the SP in (e) is shown to be connected to the system in (f). The accumulator bottle will be mounted on the back wall of the case upon the final assembly of the entire instrument (Section 3.10).
3.5. Main Electronic Interfaces
The primary electronic interfaces must be mounted at the bottom rear of the frame. To prevent contact with potential liquid spills, 3D-printed plastic standoffs (or similar) should be used, securing the components with M3 bolts and nuts. Alternatively, to optimize space, these interfaces can be oriented vertically and fastened to the intermediate horizontal base. The reverse side of the electronics compartment, highlighting localized hardware details, is depicted in Figure 8.
Figure 8.
Main electronic interfaces: (a) Rear view of the instrument’s bottom section showing the PCBs, the RAMPS board, and the wired inputs/outputs from the PCB_PDB (such as 12 V IN, 9 V OUT, and 12 V OUT) along with their associated labels. (b) A digital potentiometer (HVPS regulation) mounted on a service breadboard, and a 5 V relay (HVPS enable). (c) HVPS control board (PCB_HVPS). (d) Current/voltage signal conditioning and monitoring board (PCB_MON). (e) Power distribution board (PCB_PDB).
Comprehensive details for each PCB are available in the Supplementary Material. Information regarding the RAMPS board can be found on its webpage [44]. Additionally, a 5 V relay (for HVPS activation) and an MCP41010 digital potentiometer (for HVPS voltage regulation) are required. These components were positioned on a side wall, located behind the SP stepper.
3.6. Pneumatic Routing Manifold (PRM): Assembly and HEM Front-Panel Integration
Pressurized air flow for both washing (W) and injection (I) protocols is managed by a Pneumatic Routing Manifold (PRM). As illustrated in Figure 9a, the PRM consists of two interconnected three-way valves (3WVs). To facilitate manual operation, the 3WV keys are fitted with 3D-printed control knobs (3WVKCK—three-way Valve Key Control Knob) through a press-fit assembly.
Figure 9.
Detailed view of the Pneumatic Routing Manifold and its integration with the HEMs: (a) PRM component breakdown: a 6 mm push-to-connect union elbow with a male Luer adapter, two 3WVs equipped with 3WVKCKs, and a Luer extender (two male Luer connectors joined by a 22 mm segment of pneumatic tubing). (b) A PRM integrated with the lateral port of an anode HEM at the upper stage, while the lower stage is connected to the washing and injection air sources. (c) Lateral view of the assembly shown in (b). (d) A top-down view of the fully connected pneumatic system, illustrating the arrangement of the PRM and both HEMs secured to the instrument’s front panel.
The lower 3WV, oriented with its male Luer port pointing upward and its side female Luer port facing the interior of the instrument, provides ports to select between W and I air sources. Both “W” and “I” are to be labeled at suitable locations on the 3WVKCK. If ports W and I are inadvertently connected during a rinse cycle, the M3WV in its idle state blocks the pressurized air, thereby protecting the low-pressure sensor from damage.
The upper 3WV allows the user to selectively direct the airflow to either HEM. To clearly define the fluidic routing, the labels “A” and “C” are to be positioned appropriately on the 3WVKCK, allowing the air to be targeted exclusively to either the Anode or the Cathode, respectively. An extender, consisting of two male Luer connectors joined by a 22 mm segment of pneumatic tubing, is attached to the available female Luer port.
Subsequently, the PRM is connected to the first HEM (the red anode block in Figure 9b,c) and to the respective W and I air supplies via male Luer connectors. Finally, the second HEM is integrated into the circuit via the Luer extender. As shown in the top-down view in Figure 9d, both HEMs are fastened to the instrument’s front panel. In this assembly, M3 screws pass through the panel from the rear to thread into captive M3 nuts embedded within the HEMs (the tightening process is illustrated by the screwdriver in the figure). This mounting configuration, along with the connections to the M3WV and the washing air line, ensures a rigid and modular pneumatic setup.
3.7. Initial Wiring and Connections
To facilitate assembly, a preliminary, partial electrical connection of the systems is recommended at this stage. This step requires a perforated or drillable chassis structure. For optimal cable management, self-adhesive cable clips were used to secure the wiring.
As can be seen in Figure 10, the high-voltage electrode wiring (a) must be neatly routed beneath the middle base and along the sidewalls toward the PCB_HVPS, where the DC-DC converter is connected. The GND electrode cable must be connected to the terminal block closest to the front of the instrument (on the right in the image). The RAMPS board (b) must also be connected to a power bus channel on the PCB_PDB without resettable fuse protection, to be energized later with 12 V (not at this stage). The SP stepper motor (c) must be connected to the X-axis port on the RAMPS board using a standard NEMA 17 motor cable, and a stepper driver must be installed for this axis. Similarly, wire the M3WV stepper motor (d) to the Z-axis port on the RAMPS board and install its respective stepper driver (once the instrument is powered on, it must be verified that all stepper drivers supply adequate current for proper motor operation). For the M3WV, wire the Hall sensor signal conditioning board to the RAMPS AUX-3 port, mapping the connections as follows: the signal pin to D49, GND to GND, and 5 V to 5 V. Also, wire pins 1, 2, and 3 of the MPX5010DP pressure sensor (e) to the RAMPS AUX-1 port, mapping the connections as follows: pin 1 (signal) to A3, pin 2 to GND, and pin 3 to 5 V. Finally, wire a standard 100 kΩ Negative-Temperature Coefficient (NTC) thermistor (e) to the RAMPS T0 port (pin A13 and GND). For detailed schematics and RAMPS pinout configurations, refer to the official documentation [44]. Flash the RAMPS firmware (CE-C4D-RAMPS.ino) using a USB cable connected to the Arduino MEGA board.
Figure 10.
Initial wiring: (a) Wiring for both high-voltage electrodes routed toward the PCB_HVPS. (b) Unfused 12 V supply to the RAMPS board from the PCB_PDB. (c) Wiring from the SP stepper motor to the RAMPS. (d) Wiring for both the Hall sensor conditioning board and the M3WV stepper motor directed toward the RAMPS. (e) Connections for the pressure and temperature sensors. Note that for (d,e), the physical connections on the RAMPS board end are omitted for clarity (refer to the text for specific pin mappings).
3.8. Dual C4D and High-Voltage Control Unit
At this stage, the dual C4D and high-voltage control unit, based on an Arduino UNO, must be installed. For each C4D, the unit must provide power, establish communication to retrieve the measured signal, and control a signal generator to supply the excitation signal. Regarding the HVPS, the unit is responsible for controlling a digital potentiometer to regulate the voltage, managing a relay to activate the HVPS, and receiving the conditioned voltage and current-monitoring signals. Additionally, several connections must be established between the PCB_HVPS and the PCB_MON. Multiple connection details can be observed in Figure 11.
Figure 11.
Dual C4D and high-voltage control unit: (a) A control unit mounted on its mounting bracket with the signal generator already connected. (b) A control unit shield showing pinout and connection indicators. (c) An auxiliary breadboard hosting the digital potentiometer for HVPS voltage regulation, with downward wiring to the PCB_HVPS. (d) PCB_HVPS showing upward connections to the HVPS-enable relay and the digital potentiometer. For clarity, the left and right terminal blocks are labeled as 1 and 11, respectively. (e) A fully wired digital potentiometer with upward connections to the shield. (f) PCB_HVPS (left) interfacing with the PCB_MON (right), showing conditioned Vmon and Imon signal lines routed upward to the shield. For further details, refer to the main text and schematic diagrams.
As shown in panel (a) of Figure 11, a 3D-printed control unit Mounting Bracket is attached to the instrument chassis. This bracket supports an Arduino UNO board equipped with an auxiliary prototype shield (Prototype shield v.5), which in turn connects to a face-down AD9833 Direct Digital Synthesis (DDS) signal-generator module and its corresponding wiring.
As illustrated in panel (b), a detailed view of the shield is presented (refer to Figure S2 for the circuit schematic). The female header sockets needed for the signal-generator module are outlined by a yellow box. Located on the left are the right-angle male headers that connect to pins 3 (DAT, white), 4 (CLK, violet), 5 (FSYNC, green), and 8 (CS, brown), as depicted in the wiring of panel (a). Two white rectangles are also highlighted, corresponding to the connectors for each C4D unit, designated as C4Da for the anode and C4Dc for the cathode. Each connector includes six header sockets, arranged from left to right as GND (brown), excitation signal (magenta), 9 V (VIN, cyan), CS (light blue), SDO (D12, white), and CLK (D13, green). Pins 6 and 7 act as CSc and CSa for the cathode and anode, respectively. The output signal from the Programmable Gain Amplifier (PGA) pin of the AD9833 Module is routed to the excitation input of each C4D through a coupling capacitor. The signal is then connected to the wiper of a multi-turn potentiometer, allowing the DC offset to be manually adjusted independently for each C4D. This external circuit was added as a consequence of the C4D modification described earlier in the Design section. At the lower center, header sockets for 5 V (red) and GND (brown) are provided to supply power to various components. The remaining highlighted header sockets will be discussed in due course.
Figure 11c shows an internal side view of the instrument featuring a breadboard. Traversing the section from the top-left corner are the two 5 V and GND wires connected to the sockets described in panel (b). The breadboard hosts a 100 kΩ MCP41100 digital potentiometer [71], which was previously soldered onto a SOIC-8 to DIP-8 breakout board. From top to bottom, the connected terminals consist of the 5 V line and three lines routed to the PCB_HVPS, specifically Signal GND (white), Remote Adjustment (gray), and 5 V reference (violet). A portion of a blue relay is also visible, with its wiring described later. Notably, its activation signal originates from pin 2, and upon switching this relay ties the HVPS enable signal to GND, thereby activating the power supply.
Panel (d) illustrates several connections on the PCB_HVPS. On the left, two wires (blue and green) run upward from terminal blocks 3 and 4 toward the aforementioned relay, where they are to be connected to the common (COM) and normally open (NO) terminals. Terminal block 3 corresponds to the HVPS GND, while terminal block 4 carries its Enable signal. On the right, the three wires originating from the breadboard (Signal GND, Remote Adjustment and 5 V reference) are visible. The remaining connections of the digital potentiometer shown in panel (c) are displayed in panel (e). The three wires routing upward must connect to the shield for SPI communication, specifically CS (blue, pin D9), SCK (green, pin D13), and SDI (yellow, pin D11), while the lower connection (black) is GND.
Figure 11f shows the PCB_HVPS (left) and the PCB_MON (right). The lower edge of the former houses the 12 V power supply terminal block originating from the PCB_PDB (using a 12 V output protected by resettable fuses). The vertical row of terminal blocks features the connections for Imon (green, terminal block 2), HVPS GND and Enable signal (blue and green, terminal blocks 3 and 4, respectively), the three lines to the digital potentiometer (white, gray, and violet, terminal blocks 5, 6, and 7, respectively), Vmon (yellow, terminal block 8), and GND (blue, terminal block 9). These last two, along with Imon, link to the rear side of the PCB_MON (refer to the schematics), which also hosts a dual 5 V power supply terminal block. On the front of the PCB_MON, a triple-terminal block features GND in the center, with the conditioned Vmon and Imon signals (yellow and green wires, respectively) running upward to connect to shield pins A1 and A2. For a detailed overview, please refer to the schematic in Figure S2. Depending on the HVPS polarity, ensure Vmon and Imon are correctly routed to PCB_MON, and flash the Arduino UNO firmware (CE-C4D-UNO.ino), setting flagHVposit = true inside the .ino file for a positive supply (or false for a negative supply).
The 9 V power for both the Arduino UNO and the C4D is to be supplied from the PCB_PDB via a dedicated cable equipped with a male DC barrel jack to a screw-terminal adapter. The connection to the PCB_PDB is shown in Figure 8, specifically at the screw-terminal blocks located downstream of the 7809 voltage regulator via the white 9 V and brown GND wires.
3.9. Capillary and Dual C4D Installation
At this stage, it is assumed that two C4D units have been assembled according to the do Lago design, incorporating the described excitation circuit modification (see Figure S2). Several installation steps and components are identical for both C4D assemblies, as shown in Figure 12.
Figure 12.
Capillary and dual C4D installation assembly steps: (a) Capillary tube and anti-vibration fixation components over a C4D unit. (b) The 3WV and female Luer caps. (c) A custom adjustable C4D Mount. (d) Two repurposed C4D units and two female Luer caps shown before insertion into the FLCB. (e) Auxiliary 3WVs (primary vertical and secondary lateral) for each HEM. (f) Capillary tube piercing and passing through an elastomeric plunger tip. (g) An elastomeric plunger tip inserted into the upper port of a primary 3WV, with the capillary threaded through a female Luer cap. (h) A female Luer cap tightened to compress the elastomeric plunger tip and ensure a hermetic seal. (i) C4D unit threaded by the capillary, with the Luer cap fully inserted into the 3D-printed FLCB. (j) A capillary secured to a first C4D unit, showing an additional inverted syringe barrel tip prepared for the symmetrical installation of the second C4D. (k) An overview of the C4D sensors installed on the instrument chassis with the capillary passing through them.
In Figure 12, a segment of the utilized 50 cm capillary tube (363 µm O.D. and 75 µm I.D.) is shown entering one of the C4D units (a). To prevent signal-altering vibrations, modified syringe barrel tips were utilized. These components were cut at the 0.2 mL mark and diameter-adapted using wrapping tape to achieve a tight press-fit within the C4D case. Elastomeric plunger tips were added for final fixation and to dampen potential vibrations, without requiring a hermetic seal. One of the required 3WVs is depicted alongside two female Luer caps intended for subsequent integration (b). A custom 3D-printed adjustable C4D Mount is shown in panel (c). It was designed to securely hold the C4D case, ensuring strict alignment and capillary centering while allowing precise horizontal positioning along the main instrument chassis. Although only one mount is depicted here, the complete system requires a pair of asymmetrical left and right mounts, one for each C4D case (d). Regarding the cases, if reprinted, utilizing a conductive filament would be recommended to allow them to function as Faraday shields [72], minimizing stray capacitance and improving the SNR. However, these specific C4D units were repurposed from a previous instrumental setup. Therefore, to adapt them to the current architecture, a custom 3D-printed female Luer cap bracket (FLCB) was designed and glued to each C4D case. This component, visible as the white piece, houses the female Luer caps, which are shown in position prior to full insertion. Notably, the internal stems of these caps were precut to provide a clearance path for the capillary.
To provide a straight path toward the C4D, a primary auxiliary 3WV is installed vertically at the upper Luer port of each HEM (e). In this configuration, the valve acts as a T-junction, allowing the capillary to pass straight through its main bore. Consequently, the handle must remain strictly stationary to avoid shearing the capillary. A secondary auxiliary 3WV is coupled laterally to the side port of the primary valve. This lateral 3WV is manually operated to provide either an airtight seal or atmospheric venting following rinsing procedures or during vial manipulation within injection sequences (described in the Operating Instructions). Washing operations utilize high pressures that can exacerbate depressurization transients. Abruptly venting a pressurized, liquid-filled vial can induce unwanted backflow through the needle toward the rest of the pneumatic circuit. To mitigate this, the manual configuration and positioning of the lateral valves allow the operator to perform a gradual, controlled depressurization. While this gradual depressurization could be readily automated in future iterations, atmospheric venting remains critical during injection sequences, despite the lower pressures involved. Specifically, it isolates the system to prevent manual vial manipulation from causing pressure fluctuations that would result in spurious fluid movement inside the capillary. Additionally, venting directly through these lateral valves rather than utilizing the atmospheric port of the M3WV provides a critical operational safeguard. Doing so would otherwise require using the M3WV for venting. In that scenario, if the 3WV becomes mispositioned (for instance, due to an endstop failure), high washing pressures could inadvertently reach the low-pressure sensor and damage it.
The next step is to install the capillary. First, a modified elastomeric plunger tip is required, with its lower-diameter cylindrical extension removed if present. The capillary must then be used to pierce and pass through the elastomeric plunger tip (f), leaving an exposed length of approximately 11.5 cm. The capillary must be threaded through the precut internal stem of one of the female Luer caps (g), which is subsequently tightened onto the upper female Luer port (h). At this stage, it should be noted that this elastomeric plunger tip is strictly required to ensure a hermetic seal. Since only the capillary passes through, this assembly compresses the elastomeric element, ensuring that neither gases nor liquids can escape. Next, the capillary must be threaded through a C4D unit, which rests on its respective adjustable C4D mount (i). In this position, the female Luer cap becomes fully inserted into the FLCB beneath the C4D case. Following this, the components illustrated in (a) must be positioned at the top of the first C4D unit (j). Another inverted syringe barrel tip is also visible, prepared to perform the same function for the second C4D unit. This same inversion logic applies to both the orientation of the components, such as the Luer caps, and the installation sequence. Specifically, the assembly steps must be executed in reverse order, proceeding from (j) back to (f), to correctly position and secure the remaining free end of the capillary through the second C4D.
The full assembly is illustrated in panel (k). This view shows the C4D mounts and the female Luer caps secured to their respective chassis and FLCB using M3 screws. Additionally, the C4D units are connected to the interface on the Arduino Uno shield. Upon completion, and as standard practice, both capillary ends must protrude approximately 2 mm beyond the electrode tips. Prior to use, the outer polyimide coating must be removed (e.g., via burning and cleaning with ethanol). Additionally, verify that the capillary ends are flat, correcting them if necessary.
3.10. Protective Enclosure and Final Hardware Assembly
The entire instrument must be housed within a protective enclosure. In this work, a wooden enclosure was selected due to its insulating properties and ease of modification. The housing features external dimensions of 540 mm × 450 mm × 250 mm and internal dimensions of 494 mm × 404 mm × 247 mm (width × height × depth), utilizing a 3 mm thick (540 mm × 450 mm) rear panel. However, these dimensions are not strict and can be modified, provided the instrument fits properly with all covers closed. The installation of several required components can be observed in Figure 13.
Figure 13.
Final hardware assembly: (a) An external 12 V power switch and adapter for 12 V IN. (b) An internal view of the power switch assembly. (c) An external view of the power interface and USB cutout. (d) Fixed guide channel for the upper acrylic sheet. (e) A sliding-guide channel for the lower sliding sash. (f) Side view of the guide channel arrangement on the chassis. (g) A 3D-printed foot with its mounting screw. (h) A safety-limit switch for relay coil control. (i) A bottom-right view showing feet, channels, and switch wiring. (j) An underside wiring path guided by 6 mm parametric clips. (k) Disconnected relay 5 V power wires. (l) The final connection between the relay and the lid safety switch. (m) A PVC injection bottle holder and visible pneumatic tubing. (n) Tubing connection to the push-to-connect union tee. (o) Transparent acrylic sheets and a custom 3D-printed handle. (p) Lower sliding sheet raised to allow operator access. (q) An external view of the final integrated assembly.
In Figure 13, panels (a), (b) and (c) relate to the external 12 V power supply, which was provided by a laboratory bench power supply during the early testing stages to obtain a rough estimate of the power consumption of the system. The current draw never exceeded 3 A, and therefore it could be replaced with a standard 12 V, 5 A switching-mode power supply. In panel (a), the upper portion shows an ON/OFF switch connected to a female DC barrel jack to screw terminal adapter compatible with the 12 V IN shown in Figure 8a. Panel (b) shows the assembly from inside the instrument enclosure, while panel (c) provides an exterior view, indicating that the external power supply must be connected via banana plugs. Additionally, a lower cutout allows passage for two USB cables to be connected to the Arduino UNO and MEGA boards.
Panels (d), (e) and (f) correspond to the slotted guide channels designed to secure and guide the transparent acrylic covers. As illustrated in panel (f), each side of the front interface requires one fixed guide channel (d) positioned at the upper third, and two sliding guide channels (e) arranged below it. These channels can be secured to the wood using any screws that fit the holes provided in the designs. Panel (g) displays one of the four 3D-printed feet along with its corresponding wood screw for chassis mounting.
Rather than interrupting the HVPS enable line switched by the relay itself, the energization of the relay coil is managed by a normally open safety limit switch (h). This configuration provides a robust, hardware-level safety interlock, ensuring that the relay cannot be energized unless the sliding cover is fully closed. By decoupling HVPS activation from the GUI software (v1.0), the system ensures fail-safe operator protection against electrical hazards, even in the event of software crashes, freezes, or communication timeouts. A bottom-right view of the enclosure is provided in panel (i), showcasing the two feet on that side, the upward-pointing slotted channels, and the switch secured to the wood with its wiring routed underneath the instrument. Finally, panel (j) illustrates the continuation of this wiring path, utilizing the same 6 mm parametric clips used to secure the 6 mm pneumatic tubing to neatly guide the cables.
At this stage, the instrument must be carefully inserted into its enclosure. Panel (k) displays two disconnected red wires alongside an orange wire. The latter carries the relay trigger signal and must be connected to pin 2 of the control unit shield. Regarding the red wires, one extends from the relay module’s 5 V power terminal, while the other supplies 5 V from the auxiliary breadboard. Consequently, these red wires are to be mated with the green lines originating from panel (j), as illustrated in the final assembly shown in panel (l).
Panel (m) depicts a section of standard 110 mm PVC pipe, which is to be secured to the rear panel of the enclosure using two screws and nuts. Subsequently, the bottle shown in Figure 7g must be inserted into this pipe. Panel (n) shows that the pneumatic tubing from this bottle is to be connected to the 6 mm push-to-connect union tee of the pressurized air-injection system, thereby completing the pneumatic circuit. The full schematic diagram can be consulted in Figure S3.
The front interface features a dual-pane design consisting of a fixed transparent upper window and a lower vertical sliding sash. Panel (o) displays two transparent acrylic sheets (2 mm thick; 520 mm wide). The upper sheet (150 mm high) is designed to be inserted into the slotted fixed guide channels located at the upper third of the chassis on both sides of the enclosure. The lower acrylic sheet (300 mm high), which must first be fitted with a custom 3D-printed handle, is to be inserted into the lower sliding guide channels. As demonstrated in panel (p), this lower sheet can be raised in front of the fixed upper sheet, allowing the operator to work comfortably. Lastly, panel (q) presents the final integrated assembly.
A schematic diagram of the complete device is shown in Figure S4.
4. Operating Instructions
4.1. General Considerations
- Pre-stabilize the workspace ambient temperature if necessary to ensure C4D signal stability. Maintaining a constant temperature is critical when comparing multiple analytical runs.
- If required, the generator gain (RPotGen in the GUI) and frequency of the excitation sine wave can be adjusted. Gain ranges from 0 to 10,000 (default 5000), though signal artifacts were observed at the extremes with this specific signal generator–C4D design combination. The generator supports up to 12.5 MHz, but exceeding 5–6 MHz is not recommended. The instrument’s startup frequency is set to 1 MHz, matching the original design [42,43].
- If needed, the operator must adjust the current limits on the Pololu stepper drivers following standard tuning procedures for 3D-printer boards. Exact settings may vary, provided they deliver sufficient torque to drive both the M3WV and the SP while avoiding motor overheating.
- While the system requires only two vial holders for operation, the use of multiple color-coded units is recommended to facilitate the rapid identification of various reagents, such as BGEs and samples.
4.2. System Initialization and Warm-Up
- CE-C4D-GUI installation: Install the required dependencies using requirements.txt and configure the Arduino serial ports in configPorts.txt beforehand (if needed).
- Power supply connection: Connect an external power supply to the instrument using 12 V banana plugs.
- Power on: Switch the instrument ON.
- PC communication: Connect the USB cables from both the Arduino UNO and MEGA boards to a Python-equipped PC.
- CE-C4D-GUI execution: Launch the GUI Python script (CE-C4D-GUI.py).
- Enclosure adjustment: Raise the lower cover for comfortable operational access.
Upon startup, the M3WV automatically homes using the Hall effect sensor and proceeds to its idle position. The GUI will then begin plotting real-time data for injection pressure, temperature, and both C4D signals. The C4D baselines must appear stable and free of drift. If any drift is observed, allow the system to warm up for a few minutes until equilibration is reached. High voltage and electrophoretic current readings will remain at zero until CE is actively initiated.
4.3. Graphical User Interface (GUI)
The GUI is shown in Figure 14. It provides real-time monitoring of key experimental variables, including C4D signals, electrophoretic current and voltage, injection pressure, and temperature (all acquired data are systematically recorded in a daily log file). Furthermore, the interface features a dedicated serial console for bidirectional data exchange (e.g., to perform PPI). It also streamlines operational procedures such as data exportation, timer resets, and the adjustment of signal generator parameters (e.g., gain and frequency). Specialized functions include the programming of EKI protocols—specifying voltage, duration, and ramps—as well as the definition of the CE HVPS output as a percentage of its nominal range (0 to −10 kV) and its associated ramp time. Also, the GUI manages the activation and deactivation of the high-voltage field.
Figure 14.
Graphical User Interface for system control and data acquisition: (a) Main dashboard featuring real-time monitoring of C4D signals (ADC counts), electrophoretic current (µA), voltage (V), injection pressure (psi), and temperature (°C). The interface includes a serial console for microcontroller communication and control widgets for data exportation, time reset (t0), and signal generator tuning (gain and frequency). Specialized controls for EKI allow the voltage to be programmed (as a percentage of the nominal range), hold time, and rising/falling ramps, with the EK Inj button executing the sequence. Specific controls for the HVPS enable the output to be set as a percentage of the nominal range (0 to −10 kV) and the ramp duration to be defined for the onset of the CE. The ENHV and DISHV buttons enable and disable the high-voltage field, respectively. Finally, (b,c) provide a detailed view of the rising current and voltage ramps during the initialization of the CE process.
4.4. Capillary Washing and Conditioning
Prior to initiating the capillary washing sequence, ensure that all pneumatic lines, Luer connections, and vial-to-nozzle interfaces are completely airtight where required. In this study, the capillary was rinsed with ultrapure water for 10 min and subsequently conditioned with 2.3 M HAc BGE for 10 min, both at 20 psi. Conventional NaOH conditioning was omitted because EOF was not required for the CE separations.
A generic protocol for a single conditioning liquid is outlined below, which should be repeated for each solution as necessary.
- PRM configuration: on the PRM, select W (Washing) on the lower 3WV, and either A or C on the upper 3WV, depending on whether washing is initiated from the anode or cathode, respectively. In this example, select A to wash from the anode.
- Atmospheric venting: open the system to the atmosphere using the anode’s lateral auxiliary 3WV (visible in Figure 12e). The capillary end at the cathode must remain free and exposed to the atmosphere.
- Vial preparation: fill a vial with the rinsing or conditioning liquid and cap it. The liquid level must leave an appropriate headspace that aligns with the electrode slot. An air gap of approximately 10 mm below the cap keeps both the capillary and the electrode needle submerged while ensuring adequate headspace. Crucially, a constant (and equal at two vials) liquid level and headspace volume must be maintained across all utilized vials.
- Vial mounting and circuit sealing: insert the vial into a vial holder, guiding the capillary and electrode needle through the cap orifice. Raise and thread the holder into the HEM, tightening until the interface between the cap and the nozzle cone achieves an airtight seal. Taking advantage of the holder’s hexagonal geometry, the exact number of turns can be counted to ensure reproducible tightening. Verify that the vial headspace aligns with the electrode slot. Finally, close the anode’s lateral auxiliary 3WV to enable vial pressurization.
- Pressurization: apply a pressure of 20–30 psi. An improper seal will be detected via the audible feedback of escaping air, which in this work was also monitored on the compressor display. Then, allow the required time to elapse according to the selected protocol, and verify fluid outflow at the capillary outlet, observed as slow droplet formation at the cathode.
- Depressurization: to initiate depressurization, slowly and gradually open the anode’s lateral auxiliary 3WV. This process can be monitored via the audible feedback of escaping air or on the compressor display.
- Vial removal: once the system pressure equilibrates with atmospheric pressure, unthread the vial holder and withdraw it vertically, taking care not to damage the capillary as it passes through the cap orifice.
4.5. Sample and/or Analyte Injection
Sample and/or analyte injection can be performed at either a single electrode (single-end injection—SEI) or both electrodes (DOI). The following steps outline the protocol for a DOI, assuming the procedure is halted prior to the second injection for an SEI, and that the capillary has been pre-filled with BGE. Furthermore, injection can be executed using either an electric field (EKI) or pressure (PI). Given that EOF was absent in this work, EKI is fundamentally associated with the introduction of ions, whereas PI involves the introduction of sample plugs containing ions and/or neutral molecules (which, if introduced, will remain stationary during subsequent CE separations).
For PPI, manual pre-pressurization close to the desired setpoint is recommended. This process utilizes an auxiliary syringe and the dedicated 3WV coupled to a section of transparent tubing, illustrated in Figure 7b. Once an approximate value is reached, the precise setpoint must be configured via the GUI console using the SPx.y command (e.g., SP0.5 for a pressure of 0.5 psi). Thereafter, the syringe pump modulates the system volume as needed to achieve the pressure setpoint. The system actively maintains this value against any variations (such as temperature fluctuations) until receiving the SP0 command via the console, which terminates automatic regulation.
4.5.1. Dual-Opposite Electrokinetic Injection (DOI-EKI)
It should be noted that because the hardware architecture required for EKI is identical to that utilized for CE, specific EKI analytical results are not explicitly reported in this work. Since successfully operating a CE separation inherently demonstrates robust control over the high-voltage and timing parameters needed for injection, the system’s EKI capability is fundamentally verified. Nonetheless, a step-by-step protocol for DOI-EKI is detailed below:
- Vial preparation and mounting: fill two vials with identical sample volumes and place them into their respective holders. Loosely thread both holders into the HEMs so they are securely supported with the capillary and electrode tips submerged. For a SEI, substitute the sample vial at the non-injecting electrode with a BGE-filled vial. Note that during EKI, the valve positions on the PRM 3WVs do not actively influence the injection process. However, it is recommended to open the lateral auxiliary 3WVs to vent the circuit to atmospheric pressure, thereby preventing unintended residual pressures (e.g., from manual vial manipulation during capillary insertion or removal) from causing spurious hydrodynamic fluid movement.
- Parameter configuration: in the GUI, configure the EKI voltage and time parameters within the field labeled “%HV_t_ti_te”. The entered values must be separated by underscores (‘_’) to represent the voltage (as a percentage of the nominal range), the plateau hold time, and the rising and falling ramp times, respectively.
- Close the front cover.
- Injection execution: click the “EK Inj.” button. The GUI button will turn yellow while the electric field remains active and will revert to gray once the injection sequence concludes.
- Vial removal: Open the front cover, and then unthread and remove the vials from the HEMs.
4.5.2. Dual-Opposite Progressive Pressure Injection (DOI-PPI)
This procedure must be conducted with the front cover open to allow manual manipulation of some 3WVs. This poses no safety risks, not only because the cover interlock mechanism prevents enabling the HVPS, but also because no electric field is utilized during this stage. This example sequence describes sample introduction via DOI-PPI, first through the anode and then through the cathode. However, the order can be reversed or executed as a SEI at only one of the capillary ends.
- System stabilization: Establish a pressure setpoint and wait for the pneumatic injection circuit to stabilize.
- PRM Configuration: On the PRM, select I (Injection) and A to direct airflow toward the anode.
- Anode venting: Open the anode’s lateral auxiliary 3WV to the atmosphere, and verify that the opposite capillary end at the cathode is open.
- Vial preparation: Fill a vial with the sample and cap it, ensuring an adequate air gap to maintain an appropriate headspace.
- Vial mounting and air-tightness: Insert the sample vial into the holder and thread it into the anode HEM until an airtight seal is achieved. Finally, close the anode’s lateral auxiliary 3WV to enable vial pressurization.
- Injection execution: to initiate a PPI, send a command with the PPIx_y_z syntax via the GUI console. For instance, PPI1_4_1 specifies a 1 s progressive opening, a 4 s plateau hold time, and a 1 s progressive closing. Following the injection sequence, the M3WV automatically reverts to its idle state.
- Venting: Open the anode’s lateral auxiliary 3WV to the atmosphere.
- Vial removal: Unthread and remove the vial from the anode, leaving that capillary end open.
- Opposite-end sequence: to perform PPI at the opposite end of the capillary, select C on the PRM. Repeat the electrode venting, mounting, sealing, execution, local venting, and removal steps for the opposite end, reversing the anode and cathode roles and tailoring the PPI parameters as required for the second injection.
Consequently, the second injection hydrodynamically displaces the first sample plug. Thus, pressure and duration must be determined from prior optimization trials considering the sample nature and the target analyte balance. While identical plug lengths are not required, total displacement of the initial plug from the capillary must be avoided.
Furthermore, as reported in other work [73], introducing defined BGE post-injection plugs can be a useful strategy to advance sample zones further into the capillary. These post-injections will also cause further sample displacement, which must be managed consistently to ensure that a defined portion of the sample plug remains within the capillary at both ends. It should be noted that this positioning, alongside the implementation of a voltage ramp, minimizes sample loss caused by Joule heating and thermal liquid expansion upon voltage application [74]. Additionally, while displacing the sample plugs inward shortens the effective migration distance and systematically alters migration times, method reproducibility is maintained as long as these operational parameters are consistently applied. Moreover, this spatial displacement is particularly advantageous in configurations utilizing a single detector (usually centered along the capillary length), where species migrating simultaneously from opposite ends could otherwise overlap. Introducing specific BGE plugs, via a preliminary transport sequence [2,23], creates a controlled temporal offset between sample zones, resolving potential signal codetection without requiring physical repositioning of the detector.
Finally, under the conditions of suppressed or zero EOF implemented in this work, applying the electric field guarantees that despite bidirectional introduction of both species, cations migrate solely toward the cathode and anions toward the anode.
4.6. Capillary Electrophoresis (CE)
Following sample introduction at one or both capillary ends, two vials filled with BGE housed in vial holders must be threaded into each HEM. During this operation, the lateral auxiliary 3WVs must remain open to the atmosphere to submerge the electrodes and capillary tips. Because this configuration prepares the system for conventional electrophoretic separation rather than pneumatic actuation, achieving an airtight seal is not required.
The liquid levels in both BGE vials must be strictly equalized to prevent gravity-driven hydrodynamic flow (siphoning effects) across the capillary. Additionally, to mitigate BGE depletion (in terms of pH and conductivity) and ensure reproducible migrations, the BGE within these vials must be replenished with fresh electrolyte every three to five electrophoretic runs.
- GUI parameter configuration: Specify the high-voltage output level in the input field labeled “% nominal HV”, and define the voltage ramp duration in the “t Ramp EC (s)” field to control the transition to the target voltage.
- Enclosure securing: Lower the movable front safety cover.
- High-voltage enabling: Initiate the capillary electrophoresis separation by clicking the ENHV (enable high voltage) button, which will turn red, while the DISHV (disable high voltage) button transitions from green to gray.
- High-voltage disabling: After the required separation time has elapsed, terminate the electric field by pressing the DISHV button, which will revert to green as the ENHV button returns to gray.
- Data export: to save the analytical results, enter a file name in the FileName field and click the Export button. This generates a .csv file containing the migration times along with the corresponding detector signals from both C4D channels.
Referring back to Figure 14, a blank electrophoretic run using 2.3 M HAc as the BGE is displayed over a 70 s window. Due to the configured 10 s initial ramp, both the electrophoretic current (b) and the high voltage (c) gradually stabilize over this initial period. Conversely, since the electric field is deactivated without a ramp at approximately 64 s, the real-time plots in panel (a) show an almost instantaneous drop in both curves. Additionally, both C4D traces exhibit a minor increase during the initial ramp and a slight decrease following deactivation. In (a), the initial ramps from (b) and (c) are obscured due to a time-axis shift. The display range and visual parameters of all four lower panels (current, voltage, pressure, and temperature) are readily adjustable via mouse controls, leveraging the native interactive features of the PyQtGraph library [63].
5. Validation
In this work, the ambient temperature was kept at 20 °C for all experiments, unless noted otherwise. Daily BGE solutions were prepared by diluting concentrated HAc in ultrapure water. Both the BGE and the samples were degassed by sonication prior to use. Additionally, it is recommended that all liquids introduced into the capillary be filtered through 0.22 µm pore size disposable filters.
The instrument must perform at least two primary functions in a consistent and reproducible manner. First, it must manage the controlled-pressure introduction of small sample volumes into the capillary. Second, it must maintain a stable electric field during electrophoretic runs to prevent distortions such as peak shifts. Evaluating the performance of these two functions concurrently through replicated electrophoretic runs is insufficient for diagnostic purposes. While a joint evaluation can confirm proper operation under optimal conditions, it fails to isolate the source of error when discrepant results arise. In such scenarios, it is critical to determine whether the variance stems from the injection system, the HVPS, or both.
5.1. Pneumatic Injection System
The performance of the pressure-driven injection system was evaluated as follows. First, the capillary (75 μm I.D., 50 cm length) was filled with ultrapure water, yielding low baseline readings on the C4D units. A vial containing 2.3 M HAc was then secured into one of the HEMs. Pressure was allowed to accumulate within the injection system and subsequently released into the vial (time zero), driving the HAc into the capillary and displacing the water. Data acquisition continued until the HAc front reached its closest C4D unit. This procedure was repeated for both electrodes at pressures of 0.3, 0.4, and 0.5 psi. The resulting curves, normalized between 0 and 1, are presented in Figure 15.
Figure 15.
Pneumatic injections. Pressure-driven HAc displacement profiles at different injection pressures from both ends of the capillary. Insets are included to better visualize the differences between similar curves. a.u.: arbitrary units.
As shown in Figure 15, the displacement curves are highly consistent for identical pressure values and entry ends. Additionally, dispersion increases at lower pressures because the extended transit time within the capillary promotes diffusive events along the front. These curves were analyzed to pinpoint the exact times at which the half-maximal normalized response was reached, with the data compiled in Table 3.
Table 3.
Average injection times required to reach a 50% variation in the C4D signals ( 50%) and their coefficients of variation (CV%).
Table 3 shows CV values below 1%, indicating high reproducibility, particularly for the injections at 0.5 psi. Using the values of , P, and the capillary geometry parameters, the distance to the closest C4D sensors can be approximated. Despite slight variations, the values averaged around 13 cm, closely matching the physical position of the detectors. The stability of the pneumatic pressure system, even over the extended periods reported here, is a promising indicator for conventional injections, which typically last only a few seconds. Furthermore, long-term stability could be advantageous for narrower capillaries, where literature reports indicate that hydrodynamic pumping can be combined with electrophoretic separations without significant peak broadening under laminar flow conditions [2]. These straightforward experiments, involving only water and BGE, could be implemented following capillary conditioning or routinely between sample runs as a diagnostic tool to ensure the capillary is not partially clogged or obstructed. Consequently, if artifacts arise during electrophoretic separations, this protocol allows users to readily determine whether the issues stem from the injection system or are instead related to the HVPS.
5.2. DOI-PPI + CE
Starting from stock solutions of KNO3, CaHPO4, and MgSO4, three concentration levels were prepared for each salt in a 2.3 M HAc BGE. For K+, these levels corresponded to concentrations of approximately 10, 20, and 30 mg L−1. Although the other ions were prepared at different concentration ranges (see Table S2), the samples were collectively categorized into groups designated as K10, K20 and K30.
DOI-PPI relies on sequential hydrodynamic injections from both ends of the capillary. Therefore, individual injections must be executed with high precision from either side. DOI experiments were performed at 0.4 psi, yielding a net injection time of 2 s at each capillary end after accounting for sequential displacement. This procedure introduced sample plugs into both ends of a fused-silica capillary (75 μm I.D., 363 μm O.D., 50 cm length).
Capillary zone electrophoresis (CZE) was carried out in a 2.3 M HAc at an applied voltage of 8000 V, maintaining a stable voltage and steady current throughout the experiments. Given the low pH of the BGE, the electro-osmotic flow (EOF) was negligible. Consequently, since both injections were performed on the same capillary, anions and cations migrated exclusively toward the anode and cathode, respectively; that is, in opposite directions along a single separation channel. The two C4D units act as fixed detection points along this channel, each located approximately 13 cm from the respective capillary tip, and the recording time was sufficient to ensure that each ionic group reached its closest detector.
Figure 16 illustrates the results of the electrophoretic runs across all tested concentration levels.
Figure 16.
Simultaneous separation of anions and cations. DOI-CE electropherograms for three solutions of KNO3, CaHPO4, and MgSO4 (in triplicate) monitored via C4D signals. a.u.: arbitrary units.
To improve visualization, replicates within each group were vertically stacked. Each electropherogram was baseline-corrected by subtracting the average of 100 points after the 20 s mark. This accounts for the initial 10 s voltage ramp up to −8 kV, which causes a visible signal increase in all C4D profiles before the baseline stabilizes. An arbitrary vertical offset was then introduced to clearly distinguish the three sample groups. No horizontal alignment or further data processing was applied. Rather than demonstrating an optimized analytical method, the obtained electropherograms serve as a functional stress test and operational validation of the hardware platform. In this context, intra-experimental run-to-run repeatability represents the primary figure of merit to assess the overall electromechanical, pneumatic, and fluidic stability of the assembled instrument. Notably, the reported values are in raw ADC counts from each C4D and converting them to true conductivity units requires an extra calibration step [42].
As can be observed, five of the six ions reached their closest detector fully resolved in less than 5 min. Since no peak alignment was performed, it is evident that migration time-shifts were minimal, rendering these times highly useful for analyte identification. Furthermore, despite ion-specific trends, it should be feasible to correlate the areas (below peaks or above valleys, respectively) with concentrations to construct methodological calibration curves that could enable quantification.
It is important to emphasize that quantifying all analytes within a sample in a single electrophoretic run is not always feasible, given the discrepancies in dynamic ranges and detection limits, among other factors [5]. To avoid detector saturation, measuring the most concentrated analytes requires appropriate dilutions or injection volumes, which inevitably prevents more dilute analytes from being detected in those specific runs. Conversely, detecting lower-concentration analytes comes at the expense of saturating the signal zones of the most concentrated ones. Thus, two or more runs are typically required, potentially incorporating technical variations such as specific BGEs. In the same vein, the C4D units will operate within their linear range for certain analytes at specific concentrations, while failing to do so for others. These trade-offs, however, pertain to dedicated analytical method development and are intentionally reserved for subsequent application-specific studies. Meanwhile, the consistent response observed across consecutive runs highlights the potential of the building blocks to achieve the precision required for reliable analytical instrumentation.
As mentioned, to shorten analysis times, the data for each ion are reported relative to the C4D unit closest to its respective inlet. In unreported runs, the analysis time was extended to allow detection at both C4D sites. Notably, as predicted by simulations, the HPO42− ion required more time to reach its first C4D than the other analytes to pass through both, underscoring the need to adapt methodology based on the analytes of interest. Furthermore, this demonstrates the potential of dual-point detection within the capillary, either to resolve at the second C4D detector those analytes that overlapped at the first, or to provide input data for different chemometric methods.
To validate these results more robustly, migration time analyses using PeakMaster, along with peak width and asymmetry measurements, are provided in the Supplementary Materials (Figures S5 and S6; Tables S3–S6).
5.3. Signal Acquisition at Different Excitation Frequencies
As is well known, the excitation frequency affects the detection cell impedance [51,52] and, therefore, C4D signal quality. Consequently, experiments similar to those in Section 5.2 were conducted (same BGE, CE voltage and pressure range), replacing CaHPO4 with CaCl2 (concentrations are listed in Table S7). A capillary of 50 cm length (50 μm I.D., 363 μm O.D.) was employed for all experiments.
Electrophoretic runs were carried out using the same standard solution across different excitation frequencies. To account for initial drift, each electropherogram was baseline-corrected by subtracting the average signal calculated from a 100-point window immediately following the 20 s mark. Subsequently, arbitrary vertical offsets were applied to the data to separate the profiles and allow a clearer comparative visualization, as shown in Figure 17.
Figure 17.
Effect of excitation frequency. DOI-CE profiles for a solution of KNO3, CaCl2, and MgSO4 monitored via C4D at different excitation frequencies. a.u.: arbitrary units.
Some trends can be observed in Figure 17. First, the net effect on each C4D channel is different. For cations, decreasing the frequency results in a reduction in valley heights. For anions, however, the peaks at 600 kHz exhibit smaller heights, whereas the heights at 800 kHz and 1000 kHz are quite similar. Regarding noise levels, an excitation frequency of 800 kHz appears to be the best choice in both cases.
To quantitatively complement these observations, a figure-of-merit analysis was performed. For each curve, the signal segment between 30 and 80 s, a region free of peaks and valleys, was selected to evaluate the background noise level. Within this window, the root mean square (RMS, σ) noise was defined as the standard deviation of baseline fluctuations around the mean. Peak and valley profiles were modeled using non-linear curve-fitting and deconvolution with local asymmetric Gaussian functions, allowing independent left and right standard deviations to account for peak fronting and tailing. This model successfully isolated the net projected area of overlapping peaks, such as Cl− and NO3−, while simultaneously accounting for local sloping baselines. Fitting windows and local linear baseline profiles were defined for each individual analyte zone, allowing peak and valley heights (H) to be determined directly from the fitted peak amplitudes relative to the local baseline drift. Finally, the signal-to-noise ratio (SNR) values for each signal were calculated using the expression SNR = H/RMS, following IUPAC recommendations regarding the use of the baseline standard deviation as a measure of noise [75]. While IUPAC guidelines define SNR strictly on the basis of peak (or valley) height relative to baseline noise, peak area can provide complementary analytical information, particularly given the pronounced peak asymmetries and noise observed in the acquired signals. However, adapting SNR to peak area requires alternative mathematical expressions that deviate from standard conventions.
Consequently, the conventional SNR expression was adopted, relying on the deconvolution model to retrieve net heights unaffected by local baseline slope or discrete noise fluctuations. The corresponding results are summarized in Table S8. The calculated height values confirm that the net effect of frequency variation is channel-dependent. For cations, decreasing the frequency leads to a reduction in valley heights. Regarding anions, however, peaks at 600 kHz exhibit smaller heights while those at 800 kHz and 1000 kHz remain comparable. The results also confirm that the noise was lower at 800 kHz in every case. Taking the SNR at 600 kHz as a reference, it can be summarized that for anions, the 1000 kHz frequency resulted in decreases ranging from 5% to 20%, while the 800 kHz frequency led to an improvement of around 250%. In contrast, for cations, 1000 kHz and 800 kHz represented SNR improvements of nearly 160% and 255%, respectively.
This behavior in the cation C4D channel aligns very well with classical conductometric cell theory. As the frequency decreases, the capacitive reactance increases, limiting the current passing into the solution. This reduces the absolute amplitude of the valley and consequently shrinks the area in a predictable manner. On the other hand, the behavior of the anion C4D channel might be partially governed by stray capacitance at 1000 kHz.
Certainly, discrepancies may arise from other factors such as differences in shielding, components, or electrode geometry caused by assemblies that are not perfectly identical, among others. Nonetheless, it is important to clarify that the objective of this work is not to deeply analyze the design and limitations of the utilized C4Ds, but rather to implement a straightforward and readily accessible open-source solution (with minor modifications to the excitation signal generator circuitry). By integrating existing and well-established hardware designs, we aim to provide a reliable instrument that can be rapidly replicated by researchers and the general public alike. We aim to foster citizen science initiatives through this approach. We adopt these ready-to-use designs as a starting point. Further analysis of their internal architecture remains a secondary task to be addressed after successful implementation. Ultimately, optimizing the excitation parameter is advisable for each specific technique or sample matrix.
5.4. Hydroponic Nutrient Profiling Using CE-Dual C4D
To demonstrate the practical applicability of the system, a sample of a commercial hydroponic nutrient concentrate was analyzed. Based on the manufacturer’s declared concentrations, the sample was diluted sequentially, first in ultrapure water and subsequently in 2.3 M HAc. This two-step dilution scheme was selected both to prevent detector saturation and to yield analyte concentrations representative of working hydroponic nutrient solutions, as detailed in Table S9.
Here, the analysis was limited to evaluating the commercial nutrient concentrate as a preliminary quality control tool and sample-profiling approach, rather than for rigorous analytical quantification. The latter would require calibration curves and technical optimizations that, while undoubtedly useful, are not strictly necessary to demonstrate the baseline capabilities of the instrument. Nevertheless, this same sample was analyzed using other reference techniques for selected analytes, the results of which can be consulted in Table S10.
CE analysis was performed in CZE mode using a 50 μm I.D. capillary with a length of 50 cm. Injections were carried out using the DOI-PPI configuration at 0.5 psi yielding a net injection time of 4 s at each capillary end after accounting for sequential displacement. Electrophoretic separation was performed at negative 8000 V in 2.3 M HAc. The excitation frequency for the C4D units was set to 800 kHz and, in this case, sufficient time was allowed for all ions to pass through both detectors. The results can be seen in Figure 18.
Figure 18.
Hydroponic nutrient profiling using CE-Dual C4D. a.u.: arbitrary units.
Three electropherograms can be observed in Figure 18. As before, each electropherogram was baseline-corrected by subtracting the average of 100 points after the 20 s mark.
Although baseline differences are present, the migration times of both peaks and valleys proved to be highly reproducible. This consistency is particularly well maintained during the initial detections of cations and anions at their respective closest detector units. Furthermore, migration time reproducibility remains highly acceptable during the second detections. This is noteworthy considering that these detections require two to three times longer than the previously shown separations, thereby increasing the susceptibility to band broadening from diffusion or other phenomena that could induce migration shifts.
In the anion group, the previously observed separation between NO3− and SO42− is evident. No Cl− is detected, which aligns with its absence on the manufacturer’s label and its general exclusion in hydroponic formulations. Additionally, it can be observed that at the second detector unit, the peaks exhibit greater separation and increased width, consistent with the extended time available for both electrophoretic separation and band broadening via diffusion.
Regarding the cations in their initial detection (lower plot), two main valleys are observed that could be associated with K+ and Mg2+ based on previous observations. Between these valleys, no Ca2+ is detected, consistent with the manufacturer’s specifications. As expected, in the second detection, the valleys that were previously separated by approximately 80 s became further apart, reaching a separation of approximately 200 s.
The valleys warrant further discussion. On the one hand, the valley associated with Mg2+ cannot be attributed solely to this ion, as simulations indicate that Na+ co-migrates with it under the BGE conditions used. Furthermore, reference technique analysis for Mg2+ yielded values close to those declared (7631.60 vs. 8000 mg·L−1), but a significant amount of undeclared Na+ was also detected (4563.60 mg·L−1). This should be acknowledged as a limitation of the current technique, although it remains resolvable through further optimization. Since sodium can be problematic in hydroponics, identifying its presence in significant amounts within salt concentrates can be highly useful.
Regarding the K+ valley, the close-up view in the lower plot reveals a shoulder on the curve. At the second detector, this feature resolves into two separate valleys. In previously discussed experiments with similar K+ concentrations (corresponding to 18.75 mg·L−1 after dilution based on declared values), no valley distortions were ever observed. Within the framework of an instrument designed for a sample-profiling approach, these observations are already useful for flagging potential sample anomalies.
Sample overloading can likely be ruled out. That should not be the case for a sample with nearly 20 mg·L−1 of K+ unless it contained more K+ than declared (recovery was close to 91.4% according to the quantitative analysis). Moreover, for a different set of experiments (not reported here), peak distortions for K+ at the nearest C4D were observed even after sample dilution, with single injections (non-DOI), and under EKI. Therefore, it is unlikely that the issue is related to injection conditions. Therefore, a comigrating ion alongside K+ could be considered. Under these pH conditions, the ammonium ion would be the primary candidate. However, its quantification yielded very low values, and its concentration in the diluted sample would likely make it undetectable. Furthermore, simulations indicate that K+ and NH4+ would not separate even at the second detector. Similarly, based on reference quantification, the presence of NO2− would also be negligible. Therefore, given that agricultural-grade salts were most likely used, it would be logical to assume that all declared nitrogen is present as NO3−. However, the difference between the declared amount converted to nitrate (approximately 132,000 mg·L−1) and the quantified nitrate (83,500 mg·L−1) represents a discrepancy of nearly 50,000 mg·L−1 in nitrate content. One possible explanation stems from the amount of nitrogen declared on the label and the quantification of nitrates by reference techniques.
Since the comigrating ion must possess an effective electrophoretic mobility similar to K+, and could potentially contain nitrogen, an amine compound such as ethylenediamine represents a plausible candidate. Its presence could originate from the water-purification method, specifically involving reverse osmosis membranes and potential leaching or release from them [76,77,78,79]. This should be strictly corroborated through a specific analysis for ethylenediamine, which falls outside the scope of this work. There is also the possibility that the label declares more nitrogen than is actually present, yet the potential comigrating species would still remain.
The results highlight the practical utility of dual detection, which, combined with longer migration times, provides a distinct qualitative advantage. This approach narrows the number of potential co-migrating species by recording data at two distinct times and capillary positions. By acquiring data across two distinct temporal and spatial points, the constraints on candidate species become considerably more stringent, as they must satisfy both conditions simultaneously. For individual univariate detections in the conductivity domain, this spatial and temporal duality enhances the ability to reliably link migration signals to specific chemical species.
6. Conclusions
In this study, a functional CE system with dual C4D detection was successfully developed using predominantly open-source hardware (Arduino, RAMPS, syringe pump, modified C4D units), hobby-grade sensors and actuators (pressure, temperature, Hall effect, and relays), medical and nursing consumables utilizing the Luer standard for pneumatic integrity (3WVs, needles, and syringes), and FDM 3D-printed components alongside standard 3D-printer hardware (nozzles and stepper motors). Notably, the incorporated open-source hardware units were utilized directly or with minimal modifications, demonstrating that these accessible modules are fully effective without requiring extensive prior redesign, even though further optimizations remain possible. Furthermore, standard FDM printing proved fully sufficient, eliminating the need for expensive resin-based 3D printers or specialized materials, while deliberately avoiding reliance on printed parts for airtightness in order to leverage the intrinsic sealing performance of Luer-standard components.
As detailed in the Bill of Materials, most required parts and supplies were procured domestically through standard e-commerce platforms. Although Argentina is not a primary manufacturer of electronics or mechanical hardware and relies heavily on imported goods, most of the components used here belong to the widely distributed hobbyist and maker ecosystems, making them readily available from local vendors and significantly reducing the need to rely on specialized international suppliers. With the exception of the commercial DC-DC converter, which accounts for approximately 60% of the total hardware cost, the complete assembly relies on highly accessible components. It is worth noting that custom-built [80] HVPSs are feasible alternatives to reduce the impact of the most expensive component in this study, potentially lowering overall expenses even further if designed with a fixed voltage for a specific application.
Overall, the system fulfills the expected analytical performance. Highly reproducible results were obtained during pressure-driven flow tests, maintaining precision over time spans well beyond those required for pneumatic sample injection, thereby confirming guaranteed connection tightness and reliable mechanical action required to achieve high injection reproducibility. Electrophoretic separations were successfully achieved for nanoliter volume samples, including both synthetic and commercial matrices, yielding highly reproducible migration-time profiles across replicated injections. Specifically, the ability to perform DOI and simultaneous CE for counter-migrating anions and cations demonstrated strong potential for the qualitative profiling of hydroponic nutrients, establishing the technical foundation, alongside targeted optimization, for relevant quantitative determinations. From a qualitative perspective, this performance is highly promising for tracking analyte dynamics. For precise quantitative determinations, further analytical work and separation method optimization would be required. Operating strictly with a simple 2.3 M acetic acid BGE, and without requiring surfactants or electroosmotic flow modifiers, the platform provides valuable analytical information within rapid run times of under 5 min for single-detector readings and approximately 12 min for dual-C4D monitoring. Furthermore, the operational workflow aligns with green chemistry principles by utilizing sub-microliter volumes, relying on simple electrolyte BGEs, even avoiding conditioning steps like sodium hydroxide washes, and requiring only water and acetic acid rinses. Furthermore, by integrating dedicated control circuitry for both positive and negative HVPS, the system provides a flexible architecture capable of supporting operational polarity adjustments as needed in future analytical applications.
Regarding future developments, physical improvements include active temperature control and additional motorization for workflow automation. Ongoing work also aims to replace the commercial vials and caps used here with low-cost, readily available alternative vials paired with custom caps 3D printed from thermoplastic polyurethane (TPU) or similar elastomers. On the analytical side, further work will focus on the second C4D unit. Indeed, in specific experimental scenarios, the second downstream C4D sensor physically resolved overlapping or co-migrating peak/valley profiles that appeared co-eluted at the first detection point, highlighting the tangible diagnostic utility of acquiring dual spatiotemporal registers along the capillary to identify sample anomalies or composite peaks. Additionally, although not strictly necessary for the current inorganic ions, integrating dynamic excitation-frequency modulation during electrophoretic runs represents a promising direction to enable multivariate calibration schemes.
Supplementary Materials
The following supporting information can be downloaded at: https://www.mdpi.com/article/10.3390/hardware4040022/s1.
| Name | Type | Description |
| Supplementary Material Document | Document (pdf) | Compilation of all supplementary tables and figures. For figures, it provides extended descriptions, complementing the standalone high-resolution files provided separately. |
| DesignFiles | Compressed file (zip) | Design Files |
| STLs | Compressed file (zip) | STL files for 3D printing |
| ValidationData | Compressed file (zip) | Data from experiments 5.1 to 5.4 |
| SupplementaryFigures | Compressed file (zip) | Supplementary Figures |
| SupplementaryTables | Compressed file (zip) | Supplementary Tables |
Author Contributions
Conceptualization, G.S., A.C. and P.A.K.; methodology, G.S. and P.A.K.; software, G.S. and A.C.; validation, G.S., A.C. and P.A.K.; formal analysis, G.S. and P.A.K.; investigation, G.S. and P.A.K.; resources, G.S. and L.G.; data curation, G.S. and A.C.; writing—original draft preparation, G.S.; writing—review and editing, G.S., A.C., L.G. and P.A.K.; visualization, G.S. and A.C.; supervision, G.S.; project administration, G.S. and A.C.; funding acquisition, G.S. All authors have read and agreed to the published version of the manuscript.
Funding
This work was supported by Secretaría de Ciencia, Tecnología e Innovación de Santa Fe (grants IO-2019-170 and CC-HT-013_25) and Agencia I+D+i (PICT-2019-03415). The authors are staff researchers and members of Consejo Nacional de Investigaciones Científicas y Técnicas (CO.NICET).
Institutional Review Board Statement
Not applicable.
Informed Consent Statement
Not applicable.
Data Availability Statement
The original contributions presented in this study are included in the article and Supplementary Materials. Further inquiries can be directed to the corresponding author.
Acknowledgments
The authors thank Luciana Vera Candioti for providing some of the materials used in the experiments and Juan Carrique for providing technical support during the early stages of this work. During the preparation of this manuscript, the authors used Gemini 3.8 Flash for language editing and formatting assistance. The authors reviewed and edited all generated text and take full responsibility for the content of this publication.
Conflicts of Interest
The authors declare no conflicts of interest. The funders had no role in the design of the study; in the collection, analyses, or interpretation of data; in the writing of the manuscript; or in the decision to publish the results.
Abbreviations
The following abbreviations are used in this manuscript:
| 3WV | Three-Way Valve (also known as Three-Way Stopcock) |
| ADC | Analog-to-Digital Converter |
| BGE | Background Electrolyte |
| C4D | Capacitively Coupled Contactless Conductivity Detector |
| CE | Capillary Electrophoresis |
| CV | Coefficient of Variation |
| DDS | Direct Digital Synthesis |
| EKI | Electro-Kinetic Injection |
| EOF | Electro-osmotic Flow |
| HAc | Acetic Acid |
| HEM | Hollow-Electrode Manifold |
| HV | High Voltage |
| HVPS | High-Voltage Power Supply |
| Imon | Electrophoretic Current Monitoring |
| M3WV | Motorized 3WV |
| NTC | Negative Temperature Coefficient |
| PCB | Printed Circuit Board |
| PETG | Polyethylene Terephthalate Glycol |
| PGA | Programmable Gain Amplifier |
| PLA | Polylactic Acid |
| PPI | Progressive Pressure Injection |
| PRM | Pneumatic Routing Manifold |
| PVC | Polyvinyl Chloride |
| SP | Syringe Pump |
| SPI | Serial Peripheral Interface |
| Vmon | Electrophoretic Voltage Monitoring |
References
- De Silva, M.; Dunn, R.C. Sample Plug Induced Peak Splitting in Capillary Electrophoresis Studied Using Dual Backscattered Interferometry and Fluorescence Detection. Electrophoresis 2023, 44, 549–557. [Google Scholar] [CrossRef] [Scilit]
- Mai, T.D.; Hauser, P.C. Simultaneous Separations of Cations and Anions by Capillary Electrophoresis with Contactless Conductivity Detection Employing a Sequential Injection Analysis Manifold for Flexible Manipulation of Sample Plugs. J. Chromatogr. A 2012, 1267, 266–272. [Google Scholar] [CrossRef] [Scilit] [PubMed]
- Kubáň, P.; Kubáň, P. Novel Developments in Capillary Electrophoresis Miniaturization, Sampling, Detection and Portability: An Overview of the Last Decade. TrAC Trends Anal. Chem. 2023, 159, 116941. [Google Scholar] [CrossRef] [Scilit]
- Růžička, M.; Kaljurand, M.; Gorbatšova, J.; Mazina-Šinkar, J. Autosampler for Portable Capillary Electrophoresis. J. Chromatogr. A 2022, 1685, 463619. [Google Scholar] [CrossRef] [Scilit]
- Mai, T.D.; Pham, T.T.T.; Pham, H.V.; Sáiz, J.; Ruiz, C.G.; Hauser, P.C. Portable Capillary Electrophoresis Instrument with Automated Injector and Contactless Conductivity Detection. Anal. Chem. 2013, 85, 2333–2339. [Google Scholar] [CrossRef] [Scilit] [PubMed]
- Hauser, P.C.; Kubáň, P. Contactless Conductivity Detection for Capillary Electrophoresis—Developments From 2020 to 2024. Electrophoresis 2025, 46, 829–862. [Google Scholar] [CrossRef] [Scilit] [PubMed]
- Kubáň, P.; Hauser, P.C. Capacitively Coupled Contactless Conductivity Detection for Microseparation Techniques—Recent Developments. Electrophoresis 2011, 32, 30–42. [Google Scholar] [CrossRef] [Scilit] [PubMed]
- Kubáň, P.; Hauser, P.C. Contactless Conductivity Detection for Analytical Techniques—Developments from 2012 to 2014. Electrophoresis 2015, 36, 195–211. [Google Scholar] [CrossRef] [Scilit] [PubMed]
- Kubáň, P.; Hauser, P.C. Contactless Conductivity Detection for Analytical Techniques: Developments from 2010 to 2012. Electrophoresis 2013, 34, 55–69. [Google Scholar] [CrossRef] [Scilit] [PubMed]
- Kubáň, P.; Hauser, P.C. Contactless Conductivity Detection for Analytical Techniques—Developments from 2014 to 2016. Electrophoresis 2017, 38, 95–114. [Google Scholar] [CrossRef] [Scilit] [PubMed]
- Kubáň, P.; Hauser, P.C. Contactless Conductivity Detection for Analytical Techniques: Developments from 2016 to 2018. Electrophoresis 2019, 40, 124–139. [Google Scholar] [CrossRef] [Scilit] [PubMed]
- Kubáň, P.; Hauser, P.C. 20th Anniversary of Axial Capacitively Coupled Contactless Conductivity Detection in Capillary Electrophoresis. TrAC Trends Anal. Chem. 2018, 102, 311–321. [Google Scholar] [CrossRef] [Scilit]
- Hauser, P.C.; Kubáň, P. Capacitively Coupled Contactless Conductivity Detection for Analytical Techniques—Developments from 2018 to 2020. J. Chromatogr. A 2020, 1632, 461616. [Google Scholar] [CrossRef] [Scilit] [PubMed]
- Li, L.; Song, Y.-P.; Ren, D.-D.; Li, T.-X.; Gao, M.-H.; Zhou, L.; Zeng, Z.-C.; Pu, Q. A Compact and High-Performance Setup of Capillary Electrophoresis with Capacitively Coupled Contactless Conductivity Detection (CE-C4D). Analyst 2024, 149, 3034–3040. [Google Scholar] [CrossRef] [Scilit]
- Hartung, S.; Minkner, R.; Olabi, M.; Wätzig, H. Performance of Capillary Electrophoresis Instruments—State of the Art and Outlook. TrAC Trends Anal. Chem. 2023, 163, 117056. [Google Scholar] [CrossRef] [Scilit]
- Kehl, F.; Drevinskas, T.; Creamer, J.S.; DeMartino, A.J.; Willis, P.A. Providing Enhanced Migration Time Reproducibility with a High-Voltage-Compatible Flow Sensor for Capillary Electrophoresis. Anal. Chem. 2022, 94, 5734–5740. [Google Scholar] [CrossRef] [Scilit] [PubMed]
- Pearce, J. Open-Source Lab: How to Build Your Own Hardware and Reduce Research Costs; Elsevier: Amsterdam, The Netherlands; Boston, MA, USA, 2014. [Google Scholar]
- Kubáň, P.; Foret, F.; Erny, G. Open Source Capillary Electrophoresis. Electrophoresis 2019, 40, 65–78. [Google Scholar] [CrossRef] [Scilit] [PubMed]
- Vorlet, O. OpenCE: Open Source Capillary Electrophoresis. Available online: https://zenodo.org/record/5613861 (accessed on 15 July 2026).
- Tobolkina, E.; Rudaz, S. Capillary Electrophoresis Instruments for Medical Applications and Falsified Drug Analysis/Quality Control in Developing Countries. Anal. Chem. 2021, 93, 8107–8115. [Google Scholar] [CrossRef] [Scilit] [PubMed]
- Padarauskas, A. Dual-Opposite Injection Capillary Electrophoresis for the Simultaneous Separation of Anionic and Cationic Compounds. Curr. Anal. Chem. 2005, 1, 149–156. [Google Scholar] [CrossRef] [Scilit]
- Durkin, D.; Foley, J.P. Dual-Opposite Injection Electrokinetic Chromatography for the Unbiased, Simultaneous Separation of Cationic and Anionic Compounds. Electrophoresis 2000, 21, 1997–2009. [Google Scholar] [CrossRef] [Scilit] [PubMed]
- Blackney, D.M.; Foley, J.P. Dual-Opposite Injection Capillary Electrophoresis: Principles and Misconceptions. Electrophoresis 2017, 38, 607–616. [Google Scholar] [CrossRef] [Scilit] [PubMed]
- Kubáň, P.; Karlberg, B.; Kubáň, P.; Kubáň, V. Application of a Contactless Conductometric Detector for the Simultaneous Determination of Small Anions and Cations by Capillary Electrophoresis with Dual-Opposite End Injection. J. Chromatogr. A 2002, 964, 227–241. [Google Scholar] [CrossRef] [Scilit] [PubMed]
- Padarauskas, A.; Olšauskait≐, V.; Schwedt, G. Simultaneous Separation of Inorganic Anions and Cations by Capillary Zone Electrophoresis. J. Chromatogr. A 1998, 800, 369–375. [Google Scholar] [CrossRef] [Scilit]
- Kuban, P.; Karlberg, B. Simultaneous Determination of Small Cations and Anions by Capillary Electrophoresis. Anal. Chem. 1998, 70, 360–365. [Google Scholar] [CrossRef] [Scilit]
- Bailey, B.J.; Haggett, B.G.D.; Hunter, A.; Albery, W.J.; Svanberg, L.R. Monitoring Nutrient Film Solutions Using Ion-Selective Electrodes. J. Agric. Eng. Res. 1988, 40, 129–142. [Google Scholar] [CrossRef] [Scilit]
- Hyun Jung, D.; Kim, H.-J.; Lee Choi, G.; Ahn, T.-I.; Son, J.-E.; Sudduth, K.A. Automated Lettuce Nutrient Solution Management Using an Array of Ion-Selective Electrodes. Trans. ASABE 2015, 58, 1309–1319. [Google Scholar] [CrossRef] [Scilit]
- Cho, W.-J.; Kim, H.-J.; Jung, D.-H.; Kim, D.-W.; Ahn, T.I.; Son, J.-E. On-Site Ion Monitoring System for Precision Hydroponic Nutrient Management. Comput. Electron. Agric. 2018, 146, 51–58. [Google Scholar] [CrossRef] [Scilit]
- Jung, D.-H.; Kim, H.-J.; Cho, W.-J.; Park, S.H.; Yang, S.-H. Validation Testing of an Ion-Specific Sensing and Control System for Precision Hydroponic Macronutrient Management. Comput. Electron. Agric. 2019, 156, 660–668. [Google Scholar] [CrossRef] [Scilit]
- Shin, Y.-H.; Kim, I.; Yang, M.; Jang, Y.-K.; Saludes, R.B.; Kim, H.-J.; Cho, W.-J. Development of a Circular Nutrient Solution Management System Using a Cost Function. Agronomy 2025, 15, 51. [Google Scholar] [CrossRef] [Scilit]
- Mattson, N.S.; Iersel, M.W. van Application of the “4R” Nutrient Stewardship Concept to Horticultural Crops: Applying Nutrients at the “Right Time”. HortTechnology 2011, 21, 667–673. [Google Scholar] [CrossRef] [Scilit]
- Home Page|CE Water Solutions|Automated Nutrient Measurement. Available online: https://www.ce-line-solutions.com (accessed on 3 September 2026).
- Son, J.E.; Kim, H.J.; Ahn, T.I. Chapter 17—Hydroponic Systems. In Plant Factory; Kozai, T., Niu, G., Takagaki, M., Eds.; Academic Press: San Diego, CA, USA, 2016; pp. 213–221. [Google Scholar]
- Regmi, A.; Rueda-Kunz, D.; Liu, H.; Trevino, J.; Kathi, S.; Simpson, C.; Regmi, A.; Rueda-Kunz, D.; Liu, H.; Trevino, J.; et al. Comparing Resource Use Efficiencies in Hydroponic and Aeroponic Production Systems. Technol. Hortic. 2024, 4, e005. [Google Scholar] [CrossRef] [Scilit]
- Rajaseger, G.; Chan, K.L.; Yee Tan, K.; Ramasamy, S.; Khin, M.C.; Amaladoss, A.; Kadamb Haribhai, P. Hydroponics: Current Trends in Sustainable Crop Production. Bioinformation 2023, 19, 925–938. [Google Scholar] [CrossRef] [Scilit] [PubMed]
- Pan, J.-Z.; Fang, P.; Fang, X.-X.; Hu, T.-T.; Fang, J.; Fang, Q. A Low-Cost Palmtop High-Speed Capillary Electrophoresis Bioanalyzer with Laser Induced Fluorescence Detection. Sci. Rep. 2018, 8, 1791. [Google Scholar] [CrossRef] [Scilit] [PubMed]
- Furter, J.S.; Boillat, M.-A.; Hauser, P.C. Low-Cost Automated Capillary Electrophoresis Instrument Assembled from Commercially Available Parts. Electrophoresis 2020, 41, 2075–2082. [Google Scholar] [CrossRef] [Scilit] [PubMed]
- Liénard--Mayor, T.; Furter, J.S.; Taverna, M.; Pham, H.V.; Hauser, P.C.; Mai, T.D. Modular Instrumentation for Capillary Electrophoresis with Laser Induced Fluorescence Detection Using Plug-and-Play Microfluidic, Electrophoretic and Optic Modules. Anal. Chim. Acta 2020, 1135, 47–54. [Google Scholar] [CrossRef] [Scilit] [PubMed]
- Hacking 3D Printers as Laboratory Robots. Digit. Discov. 2026, 5, 1460–1469. [Google Scholar] [CrossRef] [Scilit]
- Samokhin, A.S. Syringe Pump Created Using 3D Printing Technology and Arduino Platform. J. Anal. Chem. 2020, 75, 416–421. [Google Scholar] [CrossRef] [Scilit]
- Francisco, K.J.M.; do Lago, C.L. A Compact and High-Resolution Version of a Capacitively Coupled Contactless Conductivity Detector. Electrophoresis 2009, 30, 3458–3464. [Google Scholar] [CrossRef] [Scilit] [PubMed]
- do Lago, C. Claudimir-Lago/openC4D. Available online: https://github.com/claudimir-lago/openC4D (accessed on 19 February 2026).
- RAMPS 1.4—RepRap. Available online: https://reprap.org/wiki/RAMPS_1.4 (accessed on 3 March 2026).
- Arduino—Home. Available online: https://www.arduino.cc/ (accessed on 3 March 2026).
- ULTRAVOLT 10A AND 15A SERIES. Available online: https://www.advancedenergy.com/getmedia/75710edf-4673-4dce-95b3-f6296648bad8/en-hv-ultravolt-10a-15a-data-sheet-7-17-24.pdf (accessed on 14 September 2026).
- Krylov, S.N.; Starke, D.A.; Arriaga, E.A.; Zhang, Z.; Chan, N.W.C.; Palcic, M.M.; Dovichi, N.J. Instrumentation for Chemical Cytometry. Anal. Chem. 2000, 72, 872–877. [Google Scholar] [CrossRef] [Scilit] [PubMed]
- Huge, B.J.; Young, K.; Kerr, C.; Champion, M.M.; Dovichi, N.J. 3-D Printed Injection System for Capillary Electrophoresis. Anal. Methods 2022, 14, 1163–1168. [Google Scholar] [CrossRef] [Scilit] [PubMed]
- Chang, E.T.; Wanigasinghe, S.; Kerr, C.M.; Young, K.; Dovichi, N.J.; Champion, M.M.; Jaskowski Huge, B. 3-D Printed Aseptic Injection System for Capillary Electrophoresis. Talanta 2026, 300, 129153. [Google Scholar] [CrossRef] [Scilit] [PubMed]
- Itterheimová, P.; Kubáň, P. An Open Source 3D Printed Autosampler for Capillary Electrophoresis. Anal. Chim. Acta 2023, 1279, 341832. [Google Scholar] [CrossRef] [Scilit] [PubMed]
- Kubán, P.; Hauser, P.C. Fundamental Aspects of Contactless Conductivity Detection for Capillary Electrophoresis. Part I: Frequency Behavior and Cell Geometry. Electrophoresis 2004, 25, 3387–3397. [Google Scholar] [CrossRef] [Scilit] [PubMed]
- Kubáň, P.; Hauser, P.C. Fundamental Aspects of Contactless Conductivity Detection for Capillary Electrophoresis. Part II: Signal-to-Noise Ratio and Stray Capacitance. Electrophoresis 2004, 25, 3398–3405. [Google Scholar] [CrossRef] [Scilit] [PubMed]
- Drevinskas, T.; Maruška, A.; Ihara, H.; Takafuji, M.; Jonušauskas, L.; Armonavičius, D.; Stankevičius, M.; Bimbiraitė-Survilienė, K.; Skrzydlewska, E.; Ragažinskienė, O.; et al. A Spectroscopy Solution for Contactless Conductivity Detection in Capillary Electrophoresis. Micromachines 2024, 15, 1430. [Google Scholar] [CrossRef] [Scilit] [PubMed]
- Siano, G.G.; Vera Candioti, L.; Giovanini, L.L. Chemometric Handling of Spectral-Temporal Dependencies for Liquid Chromatography Data with Online Registering of Excitation-Emission Fluorescence Matrices. Chemom. Intell. Lab. Syst. 2020, 199, 103961. [Google Scholar] [CrossRef] [Scilit]
- Wijnen, B.; Hunt, E.J.; Anzalone, G.C.; Pearce, J.M. Open-Source Syringe Pump Library. PLoS ONE 2014, 9, e107216. [Google Scholar] [CrossRef] [Scilit] [PubMed]
- Booeshaghi, A.S.; Beltrame, E.d.V.; Bannon, D.; Gehring, J.; Pachter, L. Principles of Open Source Bioinstrumentation Applied to the Poseidon Syringe Pump System. Sci. Rep. 2019, 9, 12385. [Google Scholar] [CrossRef] [Scilit] [PubMed]
- The OpenSCAD Developers. OpenSCAD 2021.01: The Programmers Solid 3D CAD Modeller. Available online: https://openscad.org (accessed on 14 September 2026).
- Coufal, P.; Zuska, J.; van de Goor, T.; Smith, V.; Gaš, B. Separation of Twenty Underivatized Essential Amino Acids by Capillary Zone Electrophoresis with Contactless Conductivity Detection. Electrophoresis 2003, 24, 671–677. [Google Scholar] [CrossRef] [Scilit] [PubMed]
- Malý, M.; Dovhunová, M.; Dvořák, M.; Gerlero, G.S.; Kler, P.A.; Hruška, V.; Dubský, P. Generalized Model of the Linear Theory of Electromigration and Its Application to Electrokinetic Chromatography: Theory and Software PeakMaster 6—Next Generation. Electrophoresis 2019, 40, 683–692. [Google Scholar] [CrossRef] [Scilit] [PubMed]
- Márquez Damián, S.; Schaumburg, F.; Kler, P.A. Open-Source Toolbox for Electromigrative Separations. Comput. Phys. Commun. 2019, 237, 244–252. [Google Scholar] [CrossRef] [Scilit]
- Python Software Foundation. Python 3.12. Available online: https://www.python.org (accessed on 13 May 2026).
- Riverbank Computing Limited. PyQt5 5.15.11: Python Bindings for the Qt Cross Platform UI and Application Toolkit. Available online: https://www.riverbankcomputing.com/software/pyqt/ (accessed on 14 September 2026).
- PyQtGraph—Scientific Graphics and GUI Library for Python. Available online: https://www.pyqtgraph.org/ (accessed on 10 June 2026).
- Liechti, C. pySerial 3.5: Python Serial Port Extension. Available online: https://github.com/pyserial/pyserial (accessed on 14 September 2026).
- Harris, C.R.; Millman, K.J.; van der Walt, S.J.; Gommers, R.; Virtanen, P.; Cournapeau, D.; Wieser, E.; Taylor, J.; Berg, S.; Smith, N.J.; et al. Array Programming with NumPy. Nature 2020, 585, 357–362. [Google Scholar] [CrossRef] [Scilit] [PubMed]
- Thingiverse—Arduino Uno Mount by Sceadu_Design. Available online: https://www.thingiverse.com/thing:33327 (accessed on 18 March 2026).
- Thingiverse—Customizable Drawer Handle or Cabinet Handle by Lyl3. Available online: https://www.thingiverse.com/thing:3911914 (accessed on 18 March 2026).
- SketchUp for Web|Online 3D Modeling|Browser Based Design|Trimble. Available online: https://sketchup.trimble.com/en/products/sketchup-for-web (accessed on 28 August 2026).
- Parametric Cable Clip [OpenSCAD] by Evie7el—Thingiverse. Available online: https://www.thingiverse.com/thing:7145611 (accessed on 16 June 2026).
- NXP Semiconductors. MPX5010 Series: Integrated Silicon Pressure Sensor—On-Chip Signal Conditioned, Temperature Compensated and Calibrated (Datasheet). Available online: https://www.nxp.com/docs/en/data-sheet/MPX5010.pdf (accessed on 14 September 2026).
- Microchip Technology. MCP41100/MCP41010: Single/Dual Digital Potentiometer with SPI Interface (Datasheet). Available online: https://ww1.microchip.com/downloads/aemDocuments/documents/OTH/ProductDocuments/DataSheets/11195c.pdf (accessed on 14 September 2026).
- Yang, L.; Pan, G.; Zhang, P.; Liu, Q.; Liu, X.; Li, Y.; Liang, Y.; Zhang, M. 3D Printed Two-in-One on-Capillary Detector: Combining Contactless Conductometric and Photometric Detection for Capillary Electrophoresis. Anal. Chim. Acta 2021, 1159, 338427. [Google Scholar] [CrossRef] [Scilit] [PubMed]
- Varden, L.; Smith, B.; Bou-Abdallah, F. Detection and Quantification of Inorganic and Organic Anions in Natural, Potable, and Wastewaters in Northern New York Using Capillary Zone Electrophoresis and Indirect UV Detection. J. Chromatogr. Sep. Tech. 2017, 8, 361. [Google Scholar] [CrossRef] [PubMed]
- Agilent Technologies. Organic Acids Analysis Kit: Reference Guide; Agilent Technologies: Santa Clara, CA, USA, 2018. [Google Scholar]
- Currie, L.A. Nomenclature in Evaluation of Analytical Methods Including Detection and Quantification Capabilities (IUPAC Recommendations 1995). Anal. Chim. Acta 1999, 391, 105–126. [Google Scholar] [CrossRef] [Scilit]
- Ju, H.; Duan, J.; Lu, H.; Xu, W. Cross-Linking with Diamine Monomers to Prepare Graphene Oxide Composite Membranes with Varying D-Spacing for Enhanced Desalination Properties. Front. Chem. 2021, 9, 779304. [Google Scholar] [CrossRef] [Scilit] [PubMed]
- Pan, Z.; Geng, G.; Yu, S.; Lu, H.; Liu, M.; Wu, D.; Gao, C. Highly Selective and Chlorine-Resistant Polyamide Reverse Osmosis Membranes for Advanced Water Treatment via Fenton-Assisted Aromatic Amine Surface Engineering. Water Res. 2026, 289, 124828. [Google Scholar] [CrossRef] [Scilit] [PubMed]
- Liang, S.; Wu, Z.; Jin, Y.; Cai, Z.; Tao, J.; Xu, G. Cleaning Agent and Cleaning Method for Removing Residual Aromatic Amine Substances in Reverse Osmosis Membrane. Patent CN 102921305A, 13 February 2013. [Google Scholar] [PubMed]
- Tan, H.; Pan, Q.; Liu, W.; Chen, K.; Hong, Y.; Liu, T.; Yue, X. Method for Detecting Residual Amine Content in Polyamide Composite Film Pieces. Patent CN109632678A, 16 April 2019. [Google Scholar]
- Blanes, L.; Coltro, W.K.T.; Saito, R.M.; do Lago, C.L.; Roux, C.; Doble, P. Practical Considerations for the Design and Implementation of High-Voltage Power Supplies for Capillary and Microchip Capillary Electrophoresis. In Capillary Electrophoresis and Microchip Capillary Electrophoresis; John Wiley & Sons, Ltd.: Hoboken, NJ, USA, 2013; pp. 67–75. [Google Scholar]
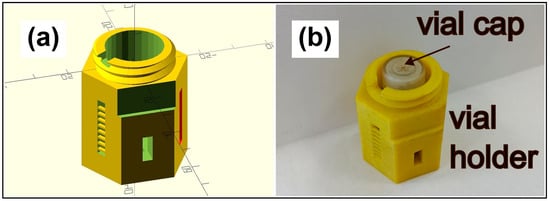
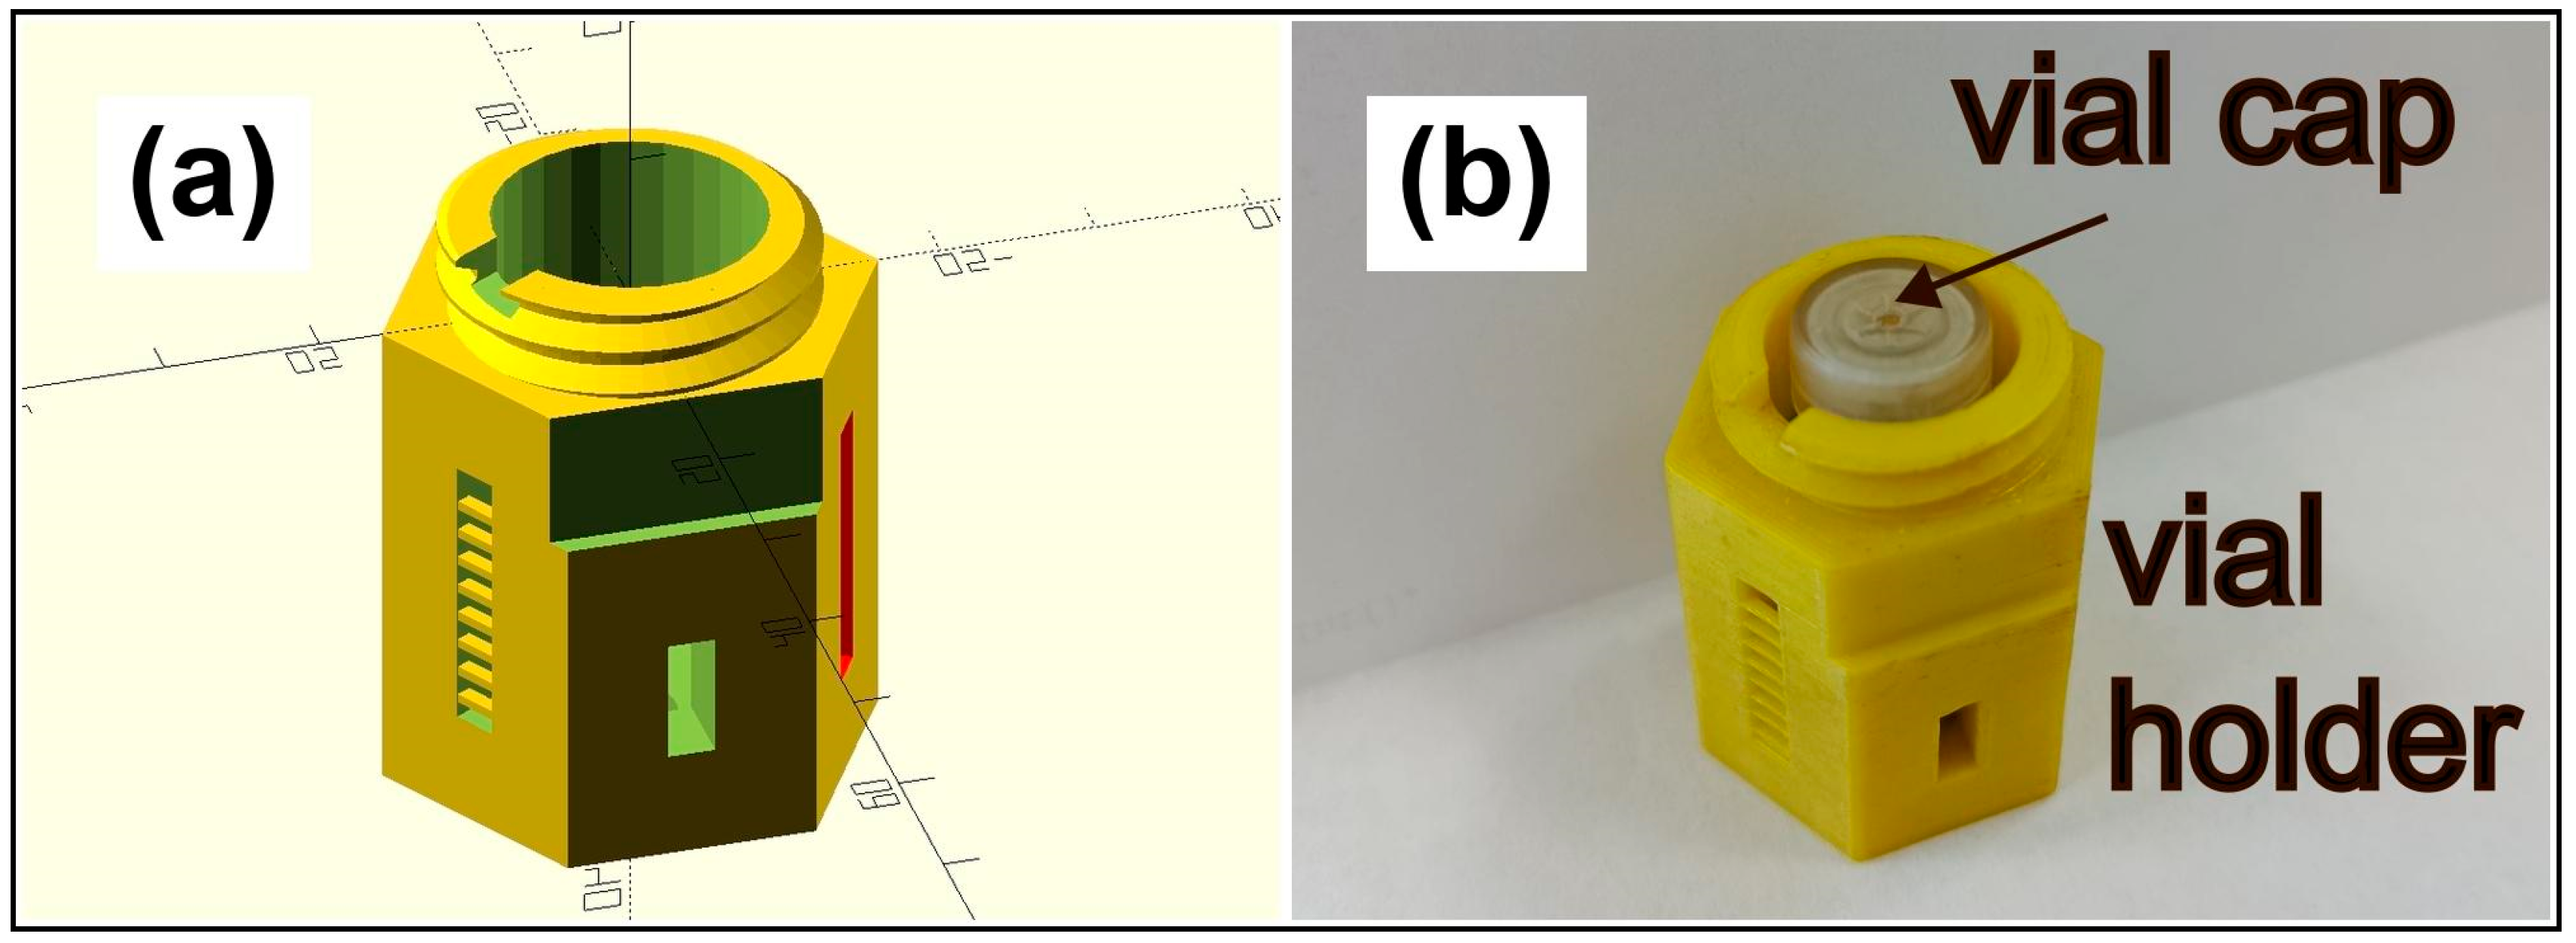
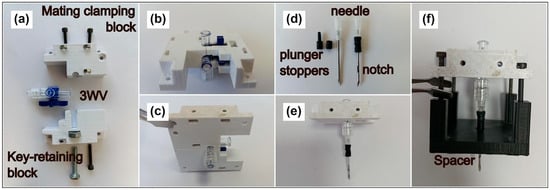
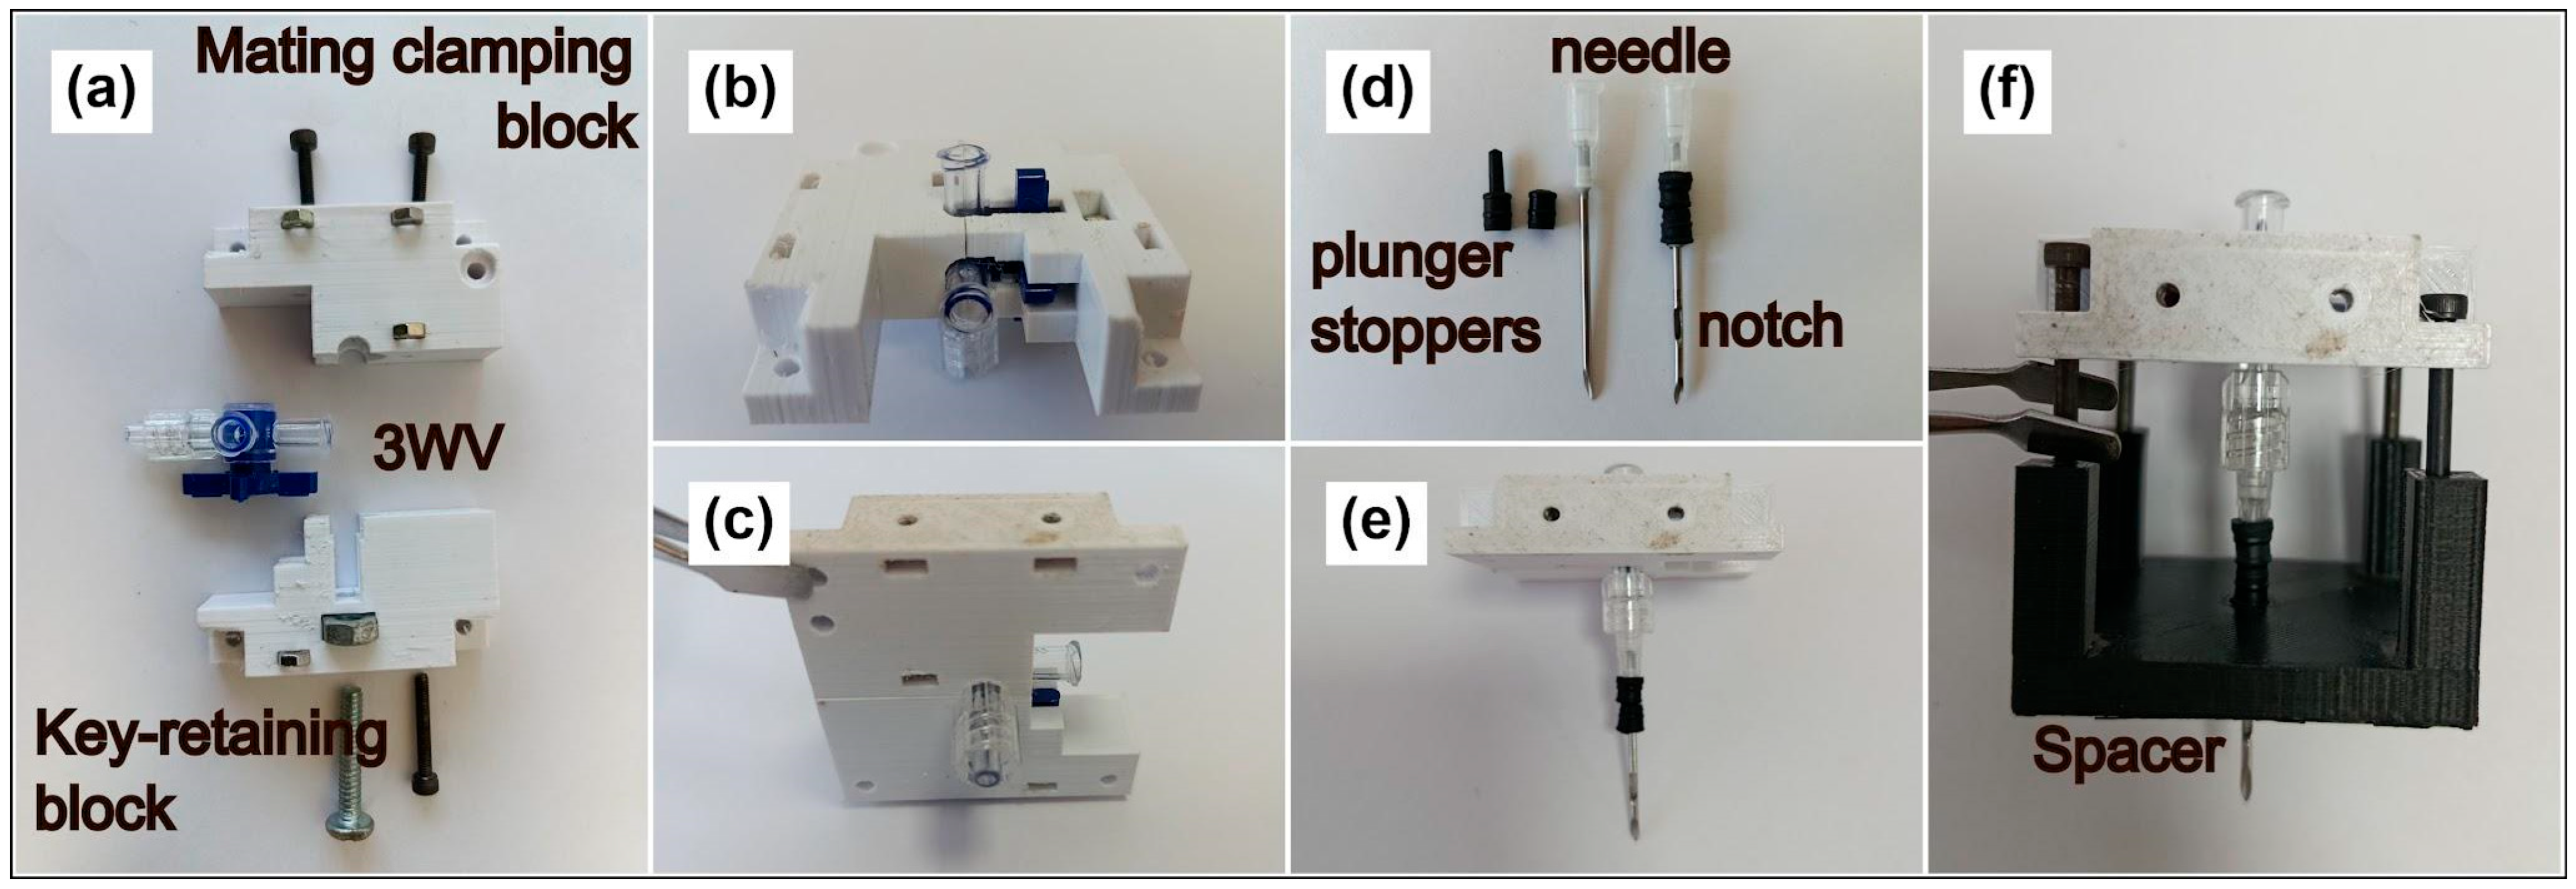
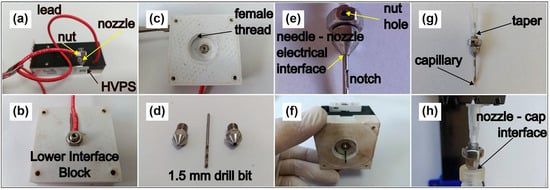
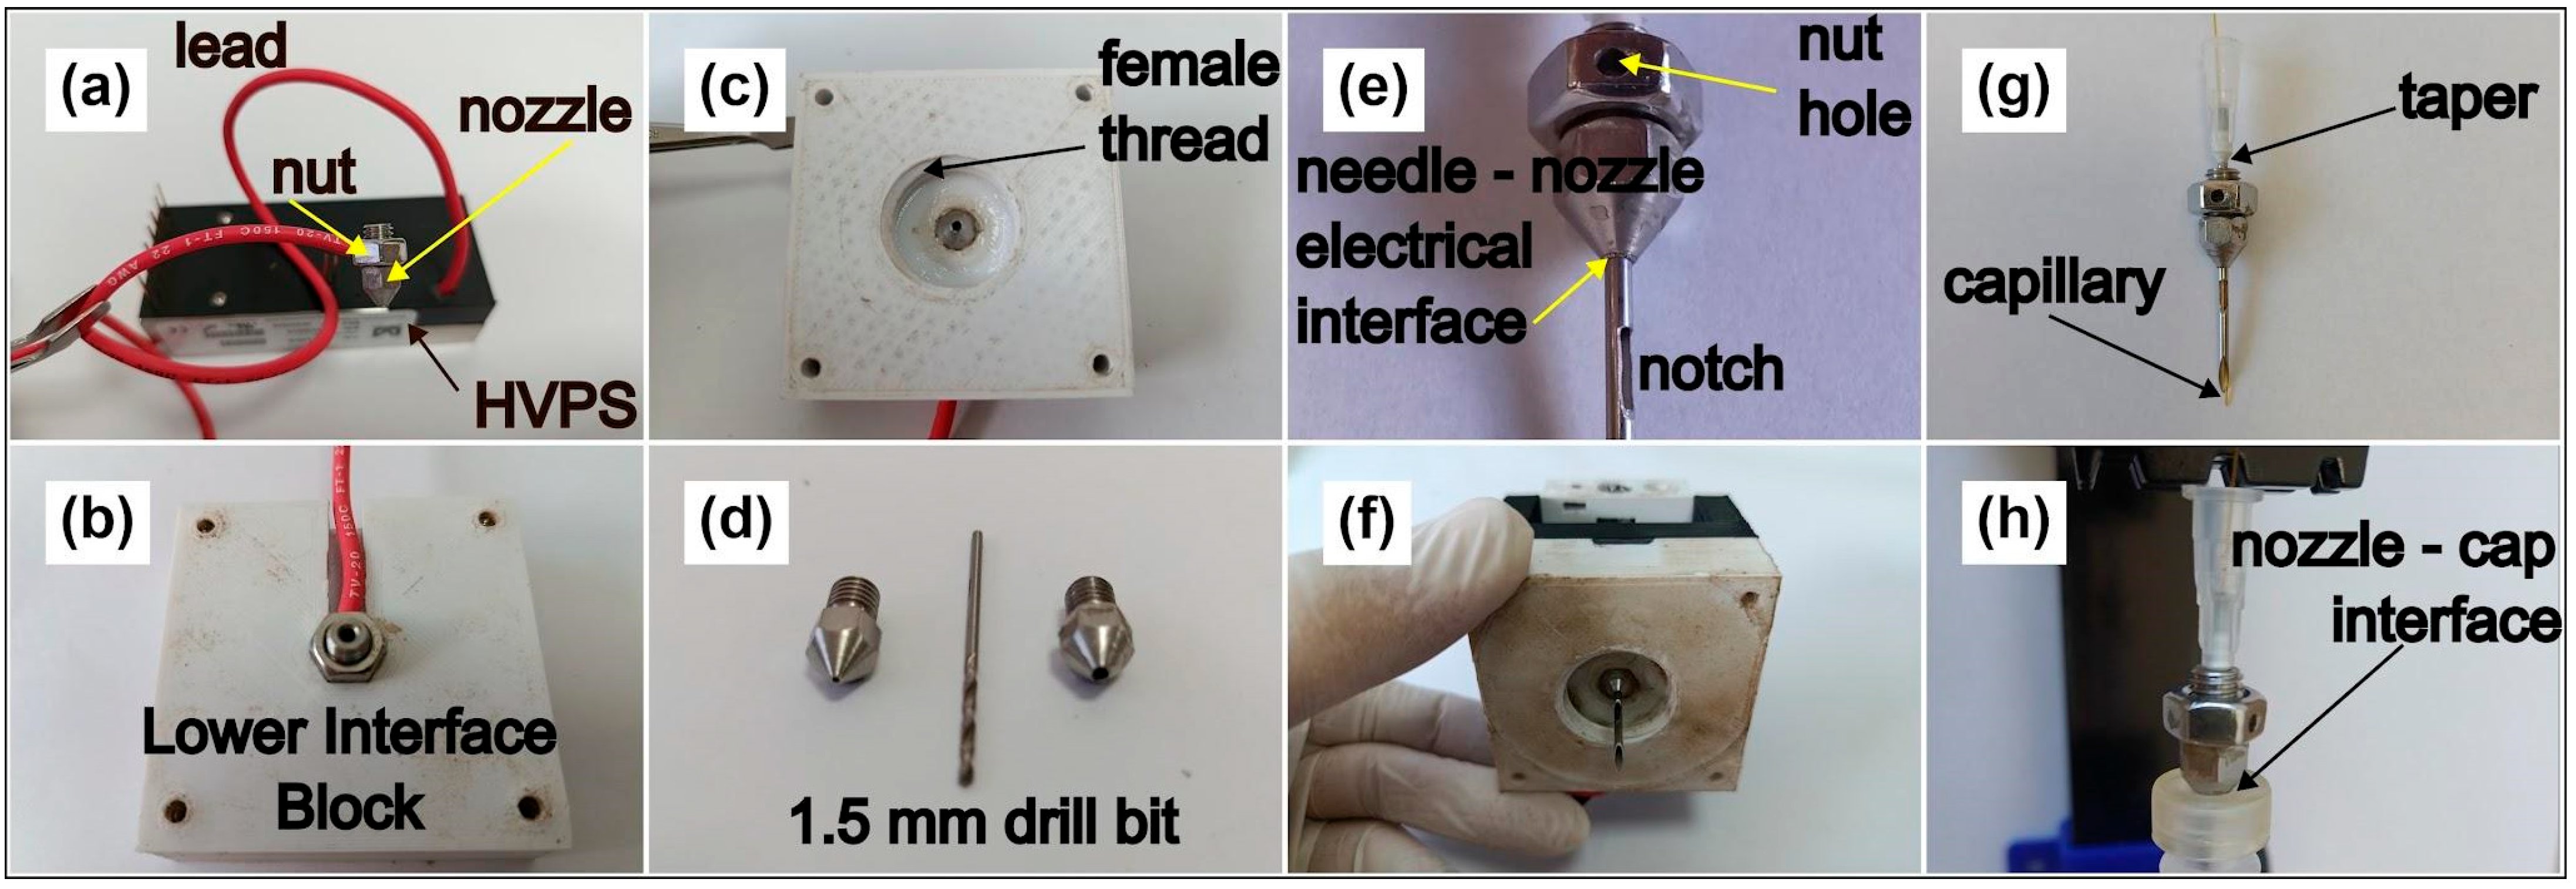
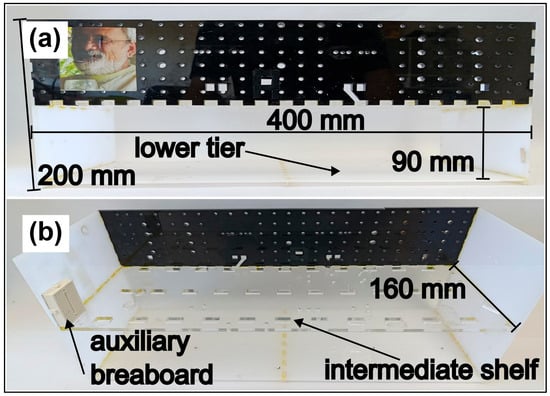
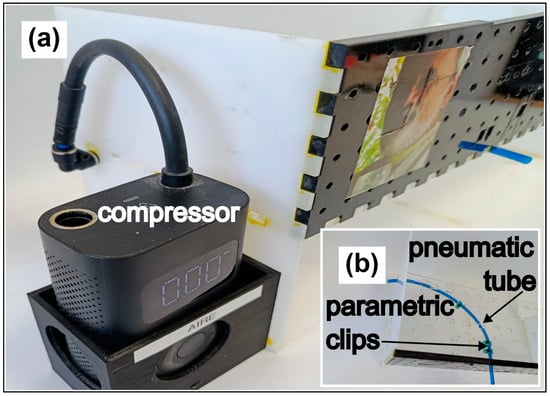
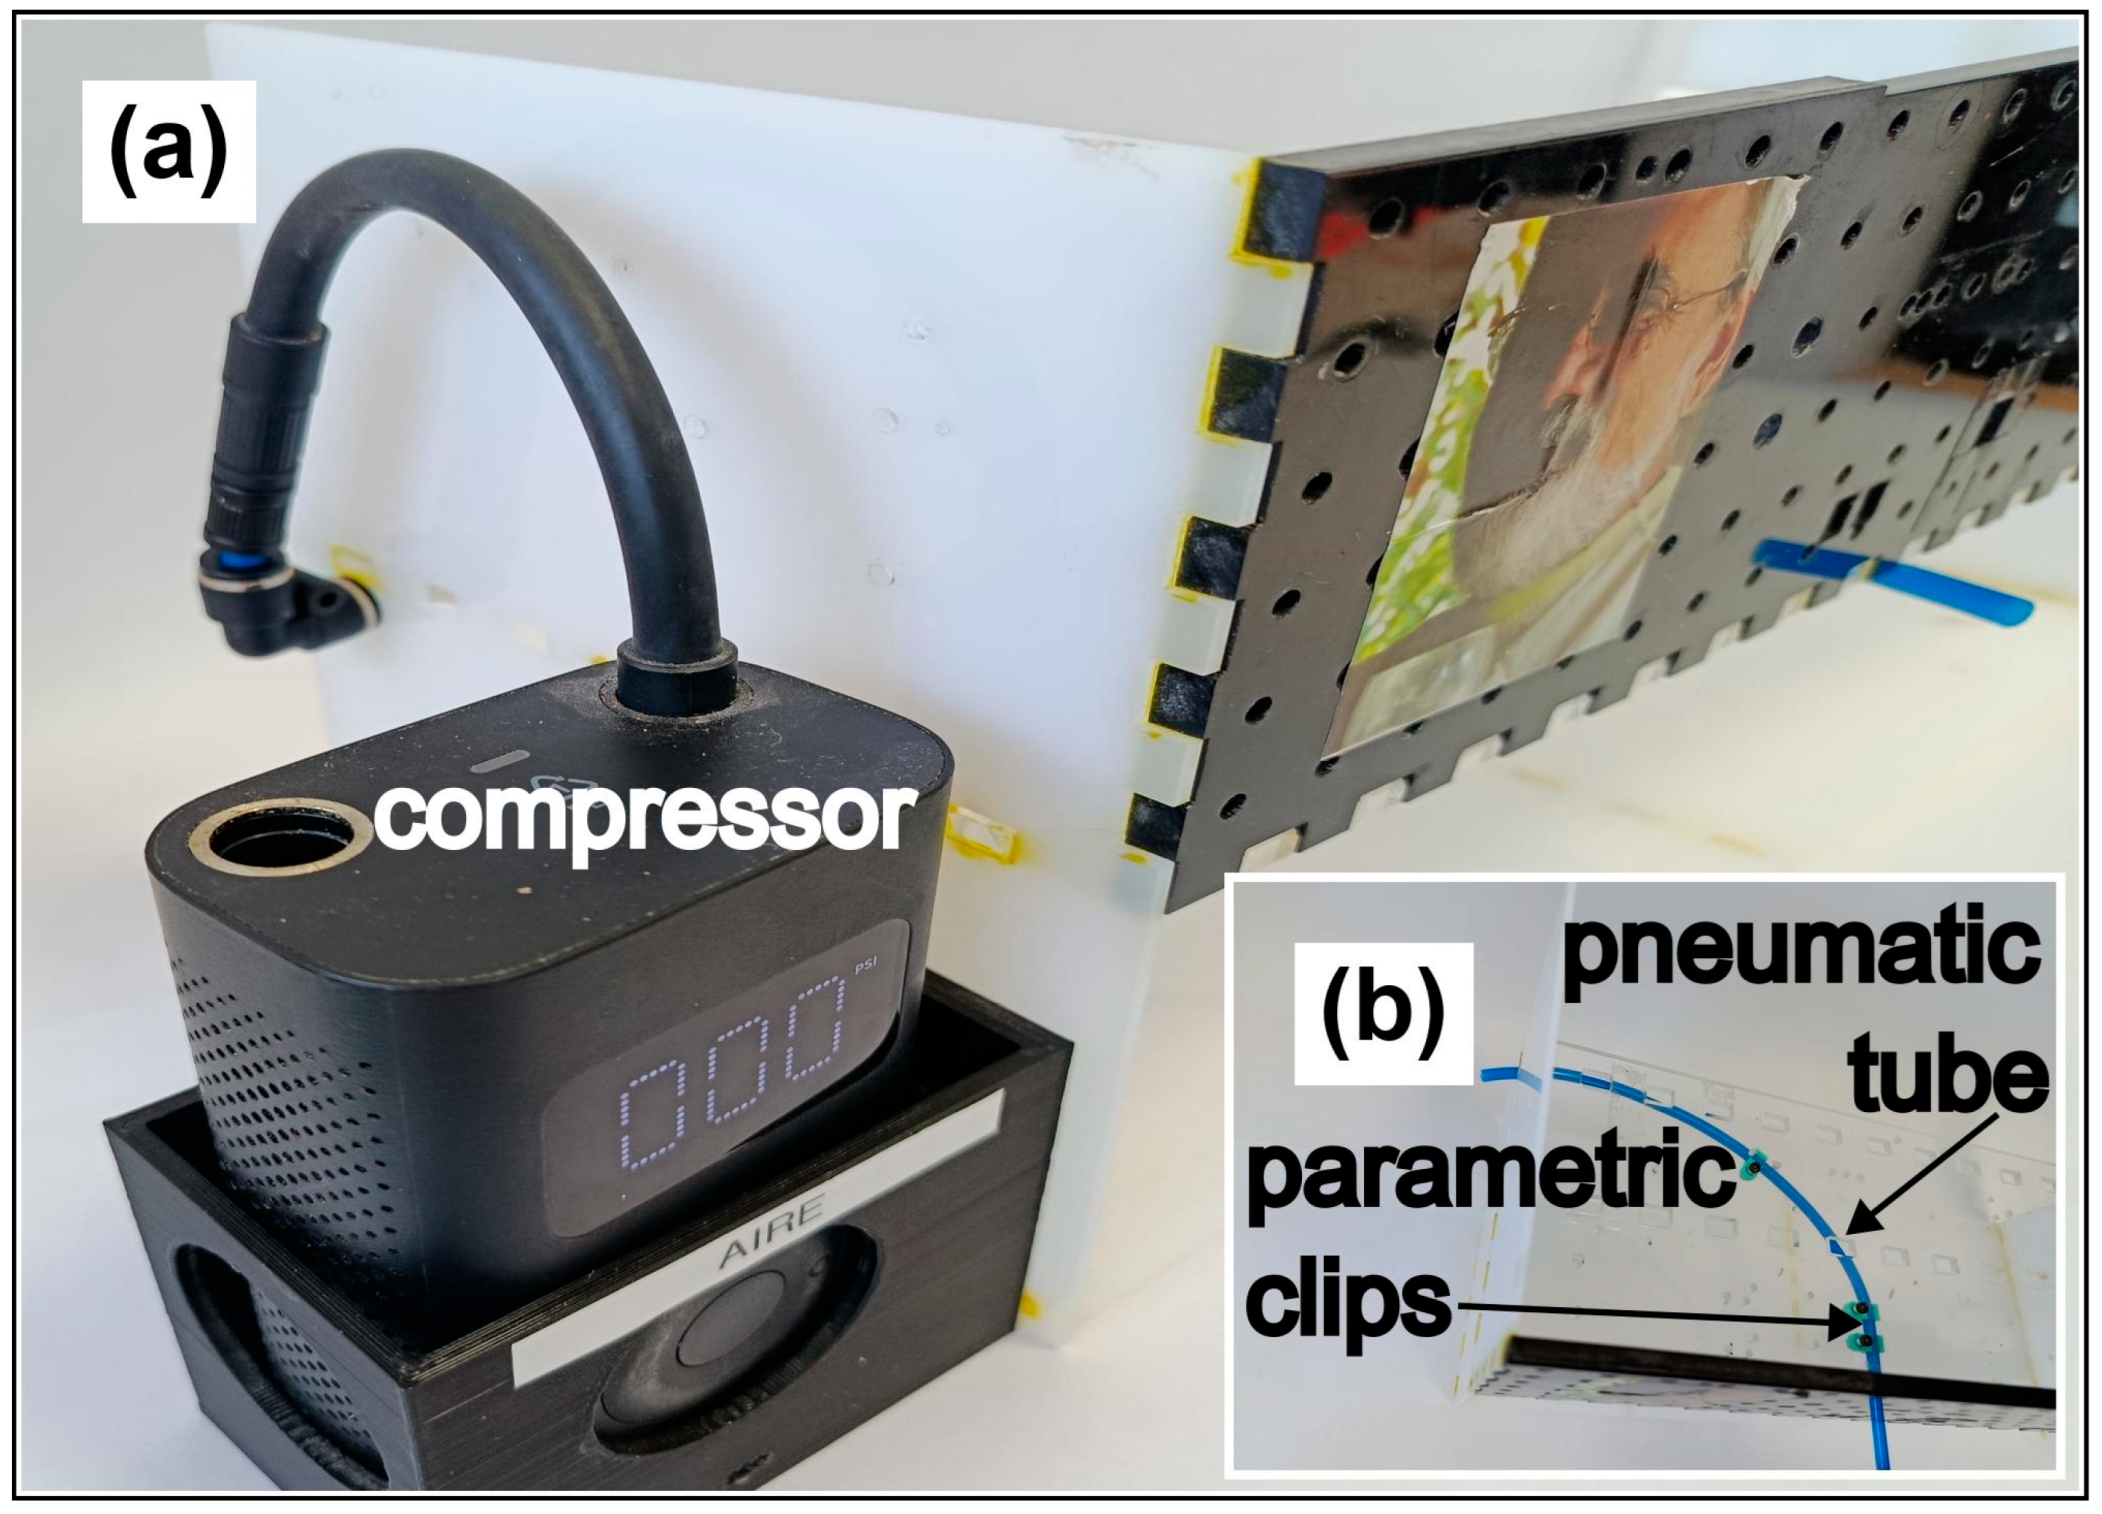
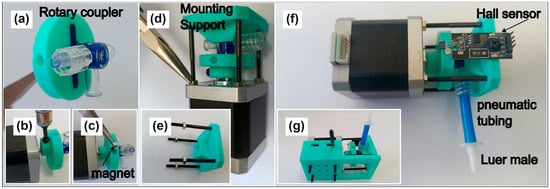
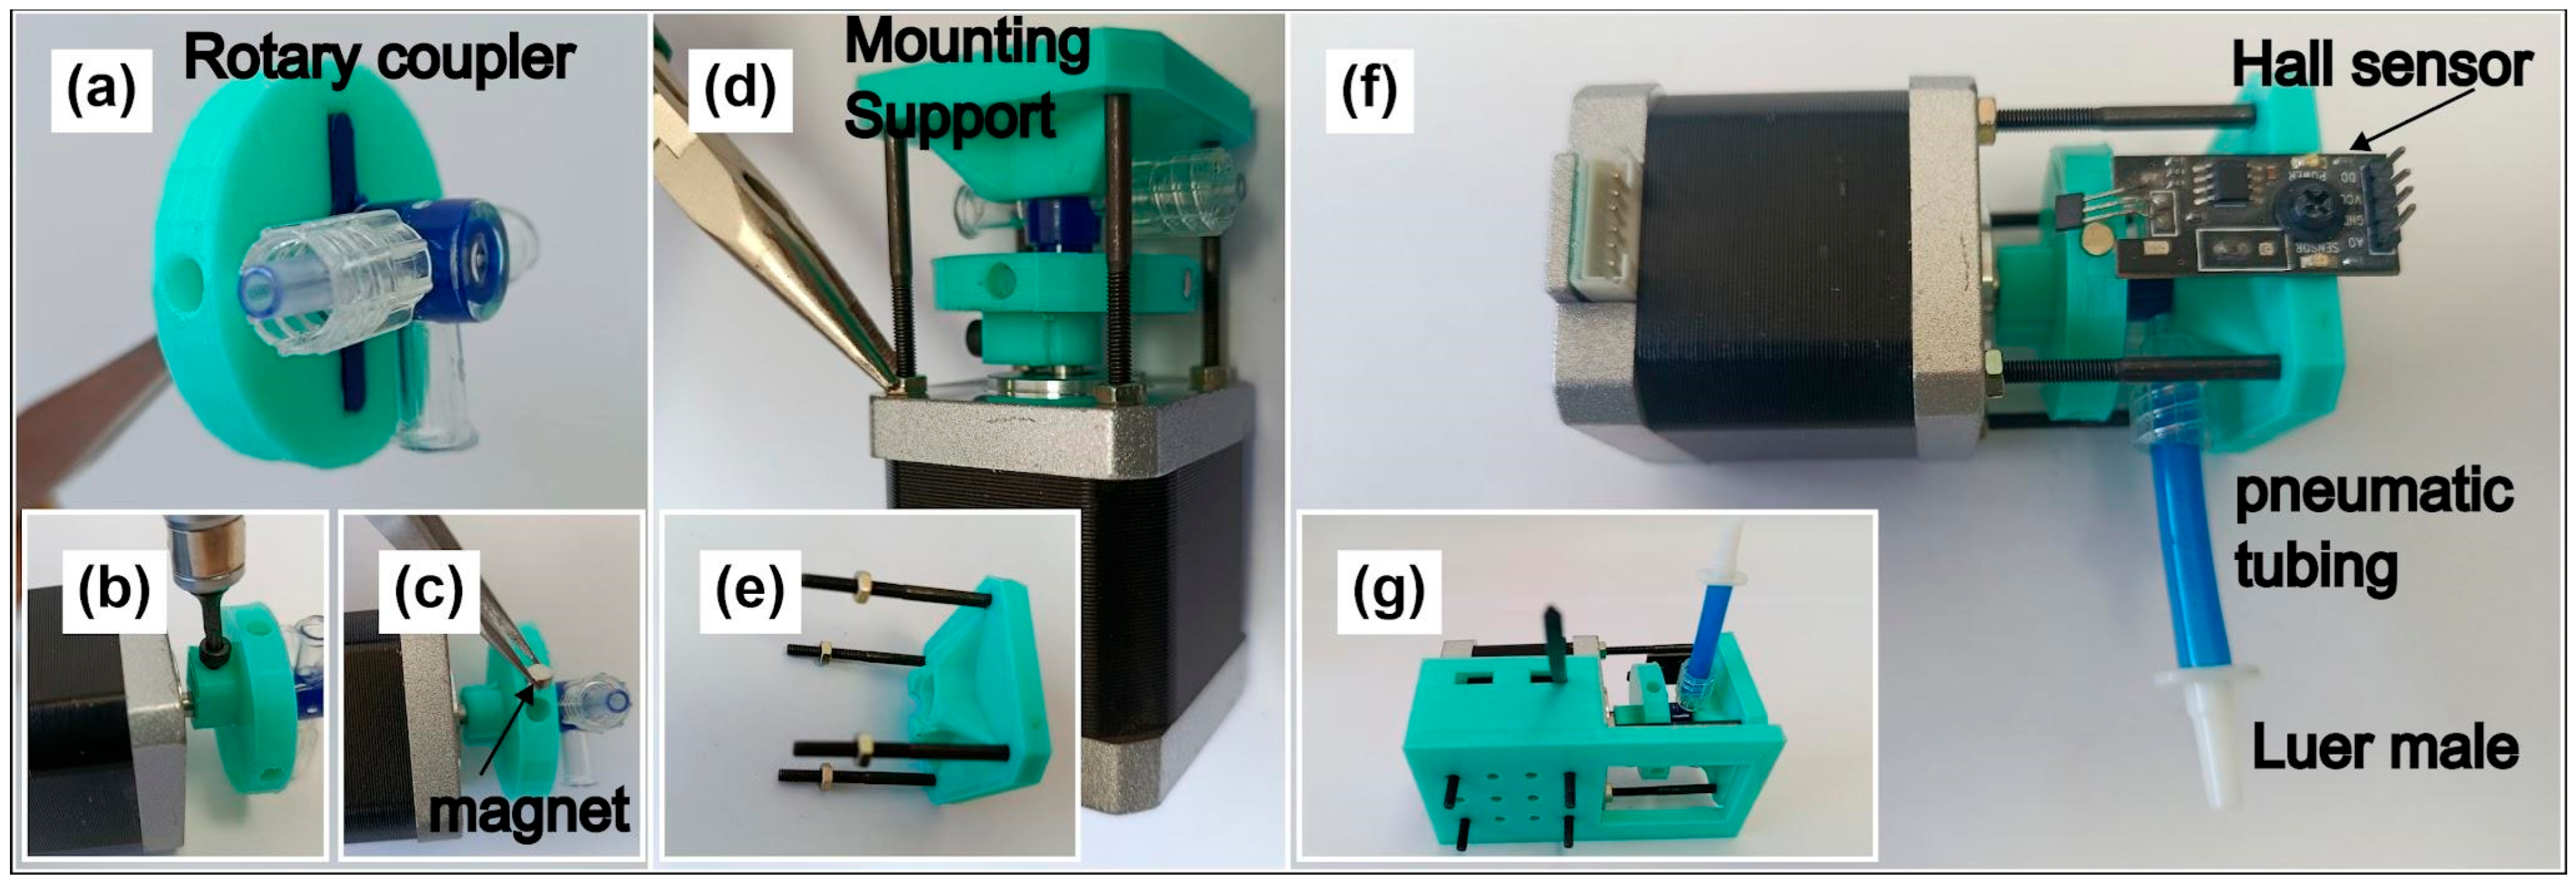
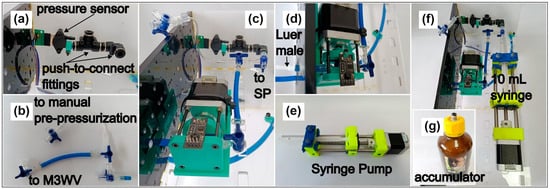
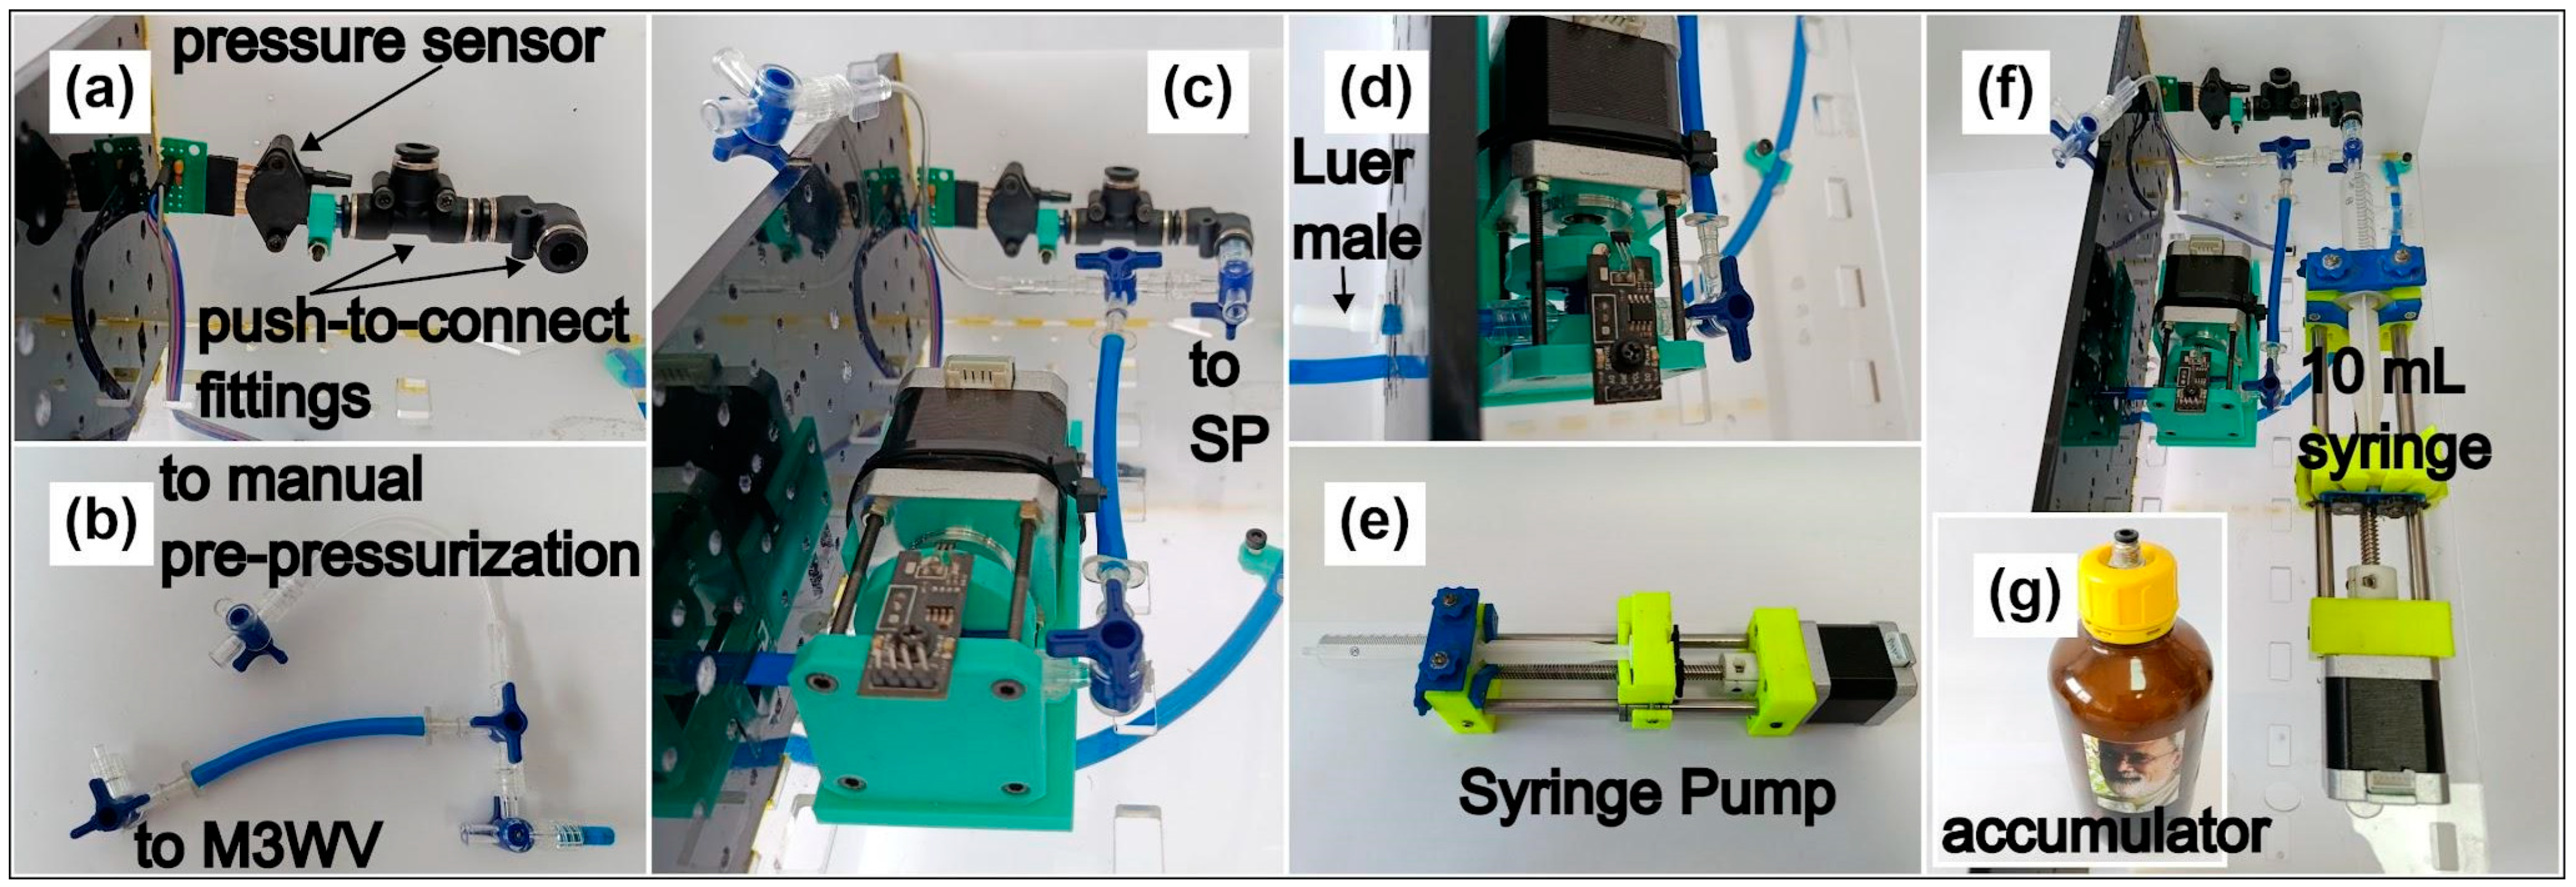
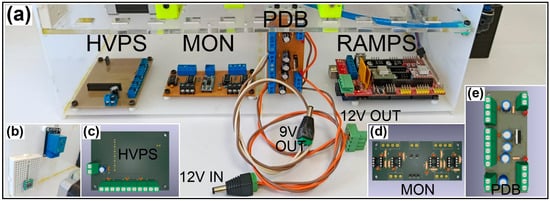
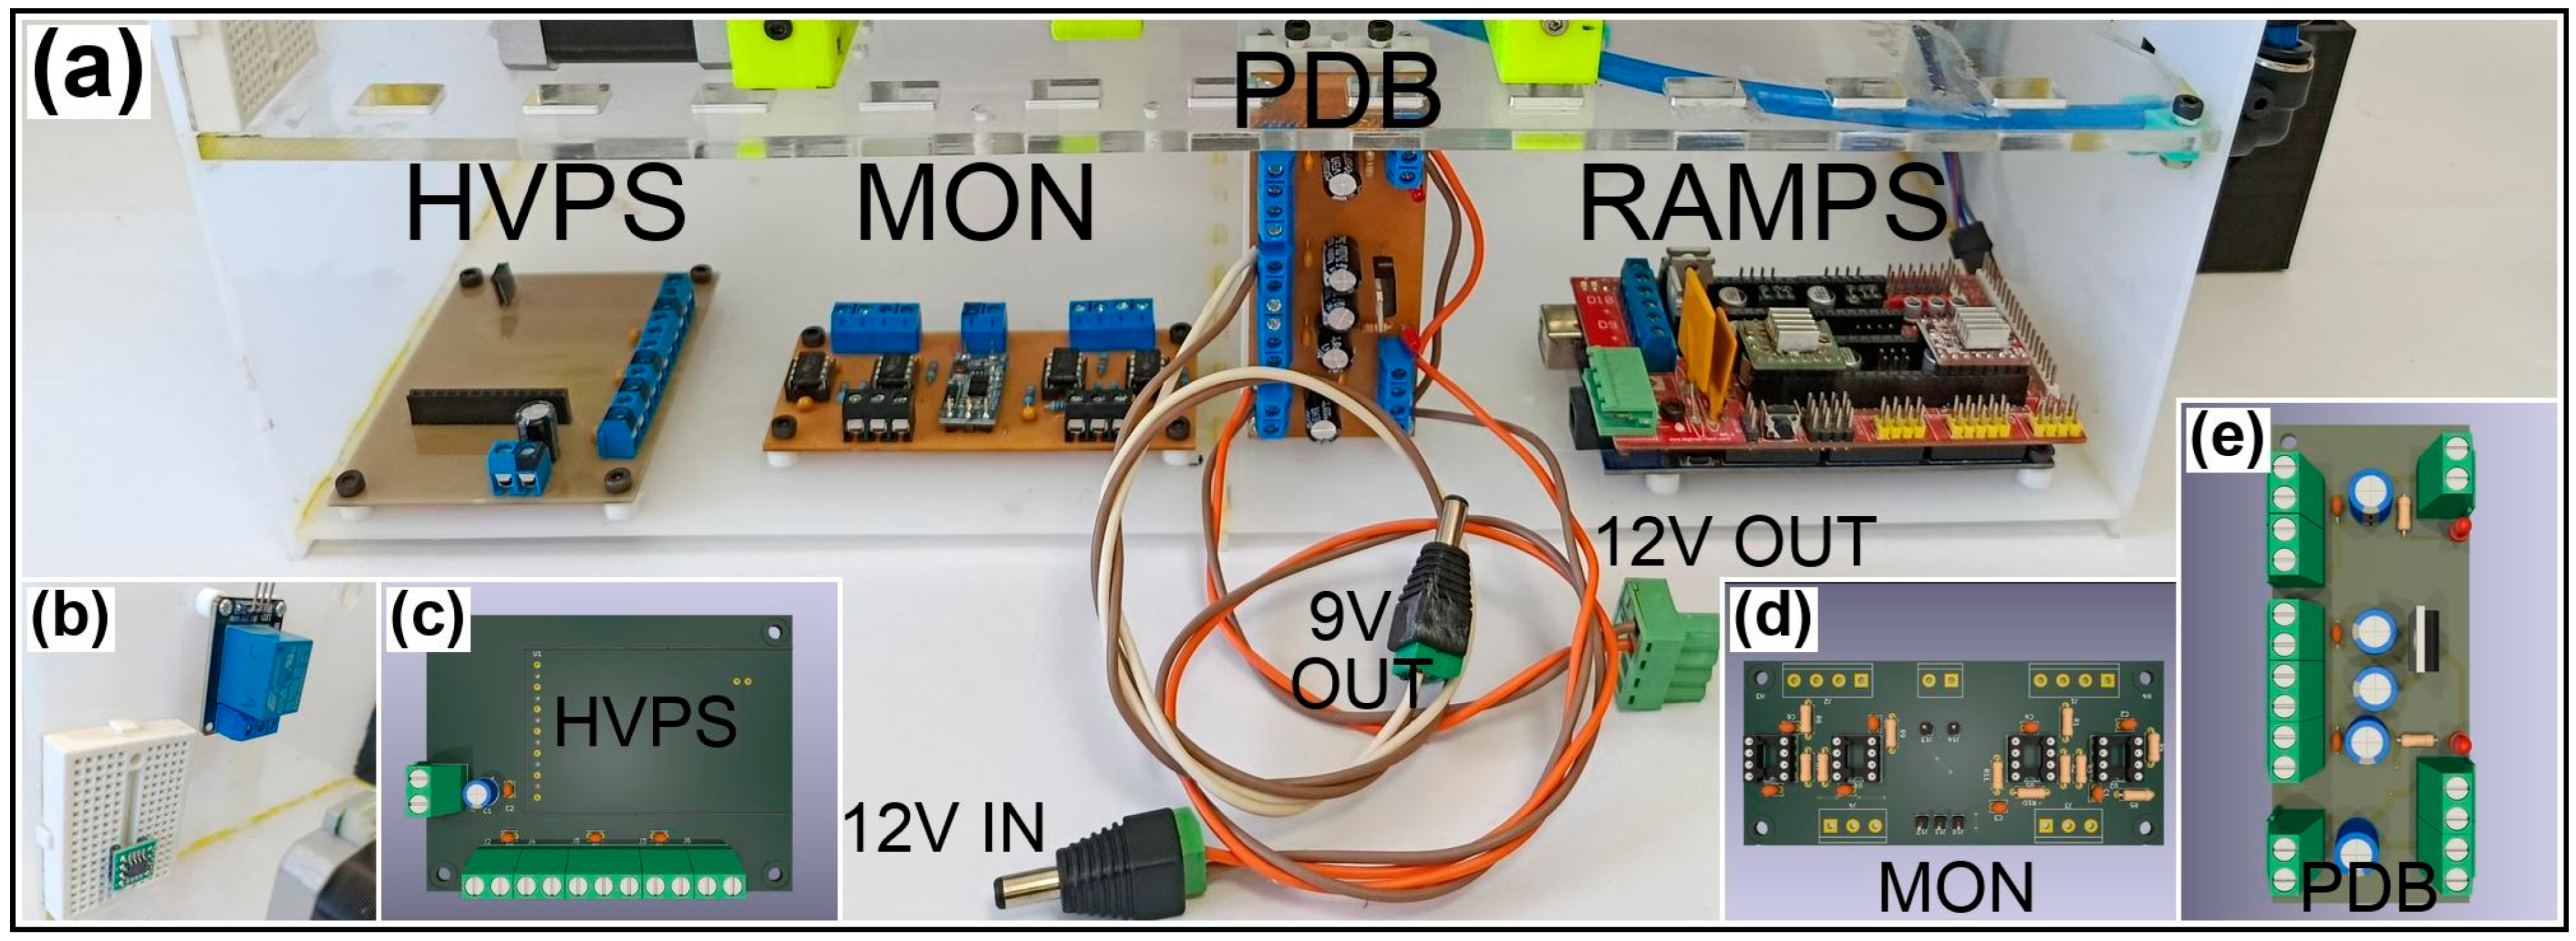
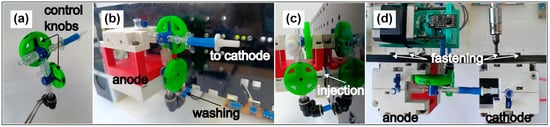
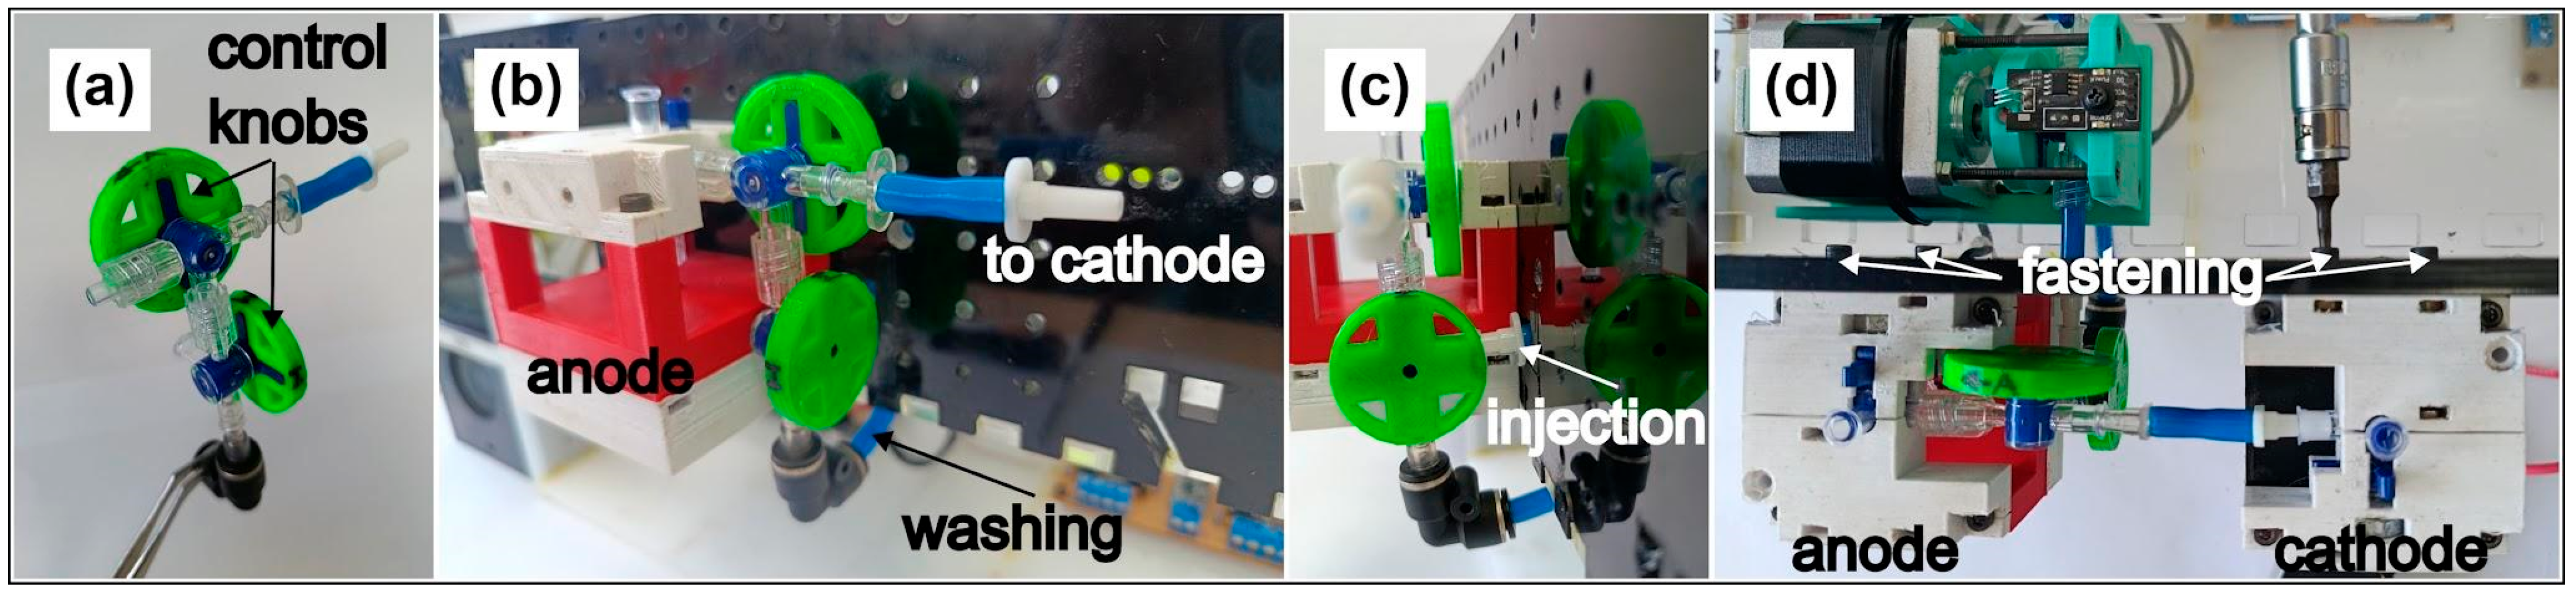
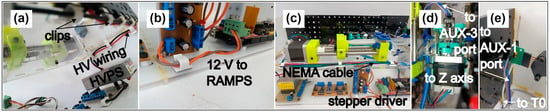
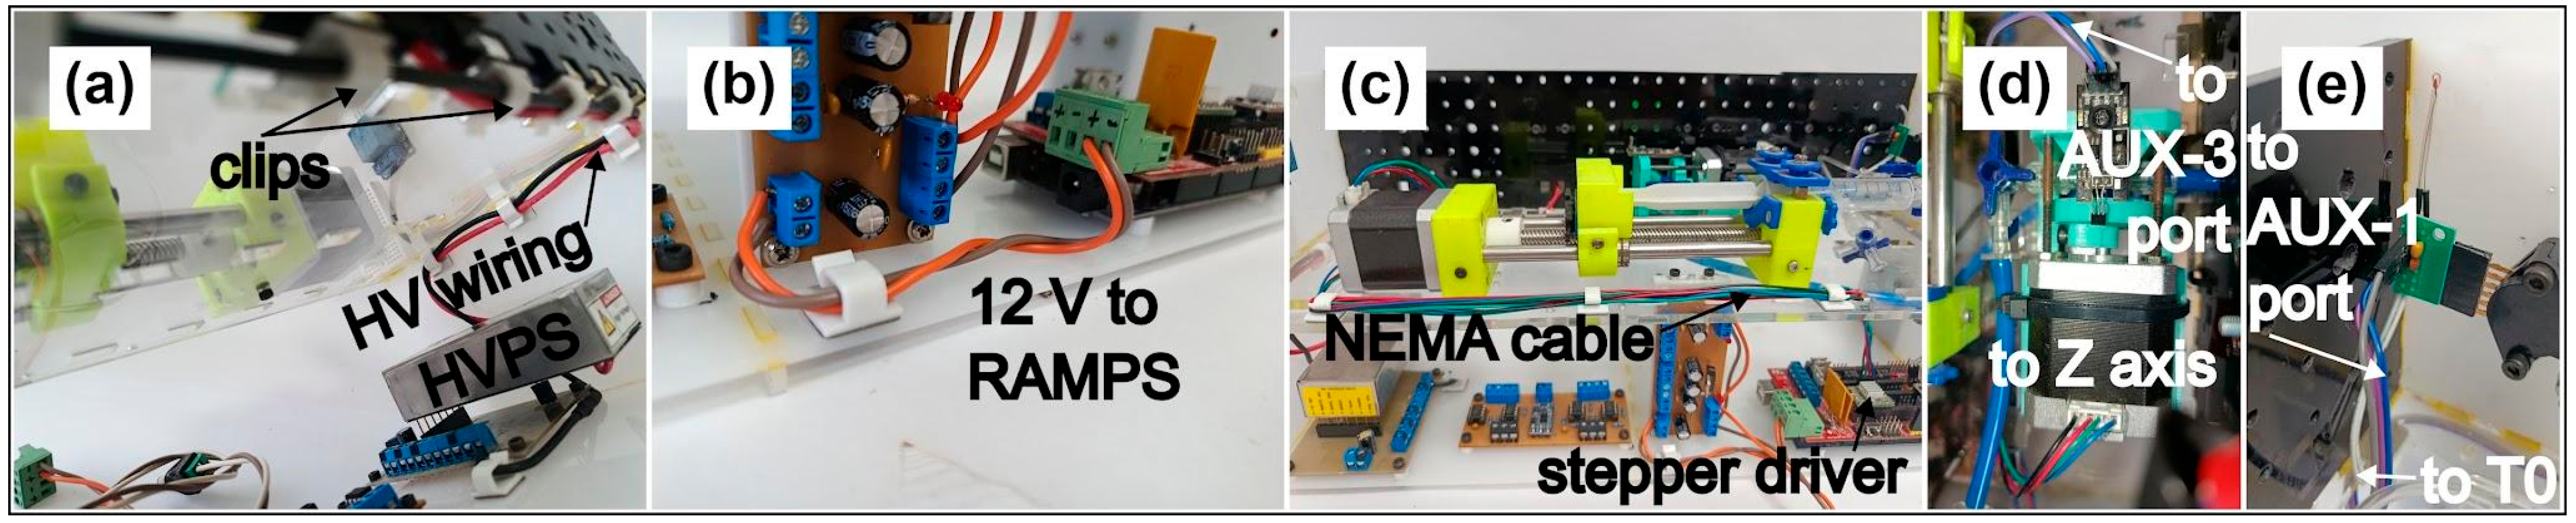
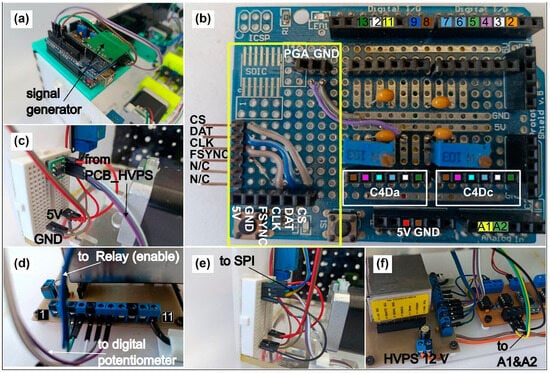
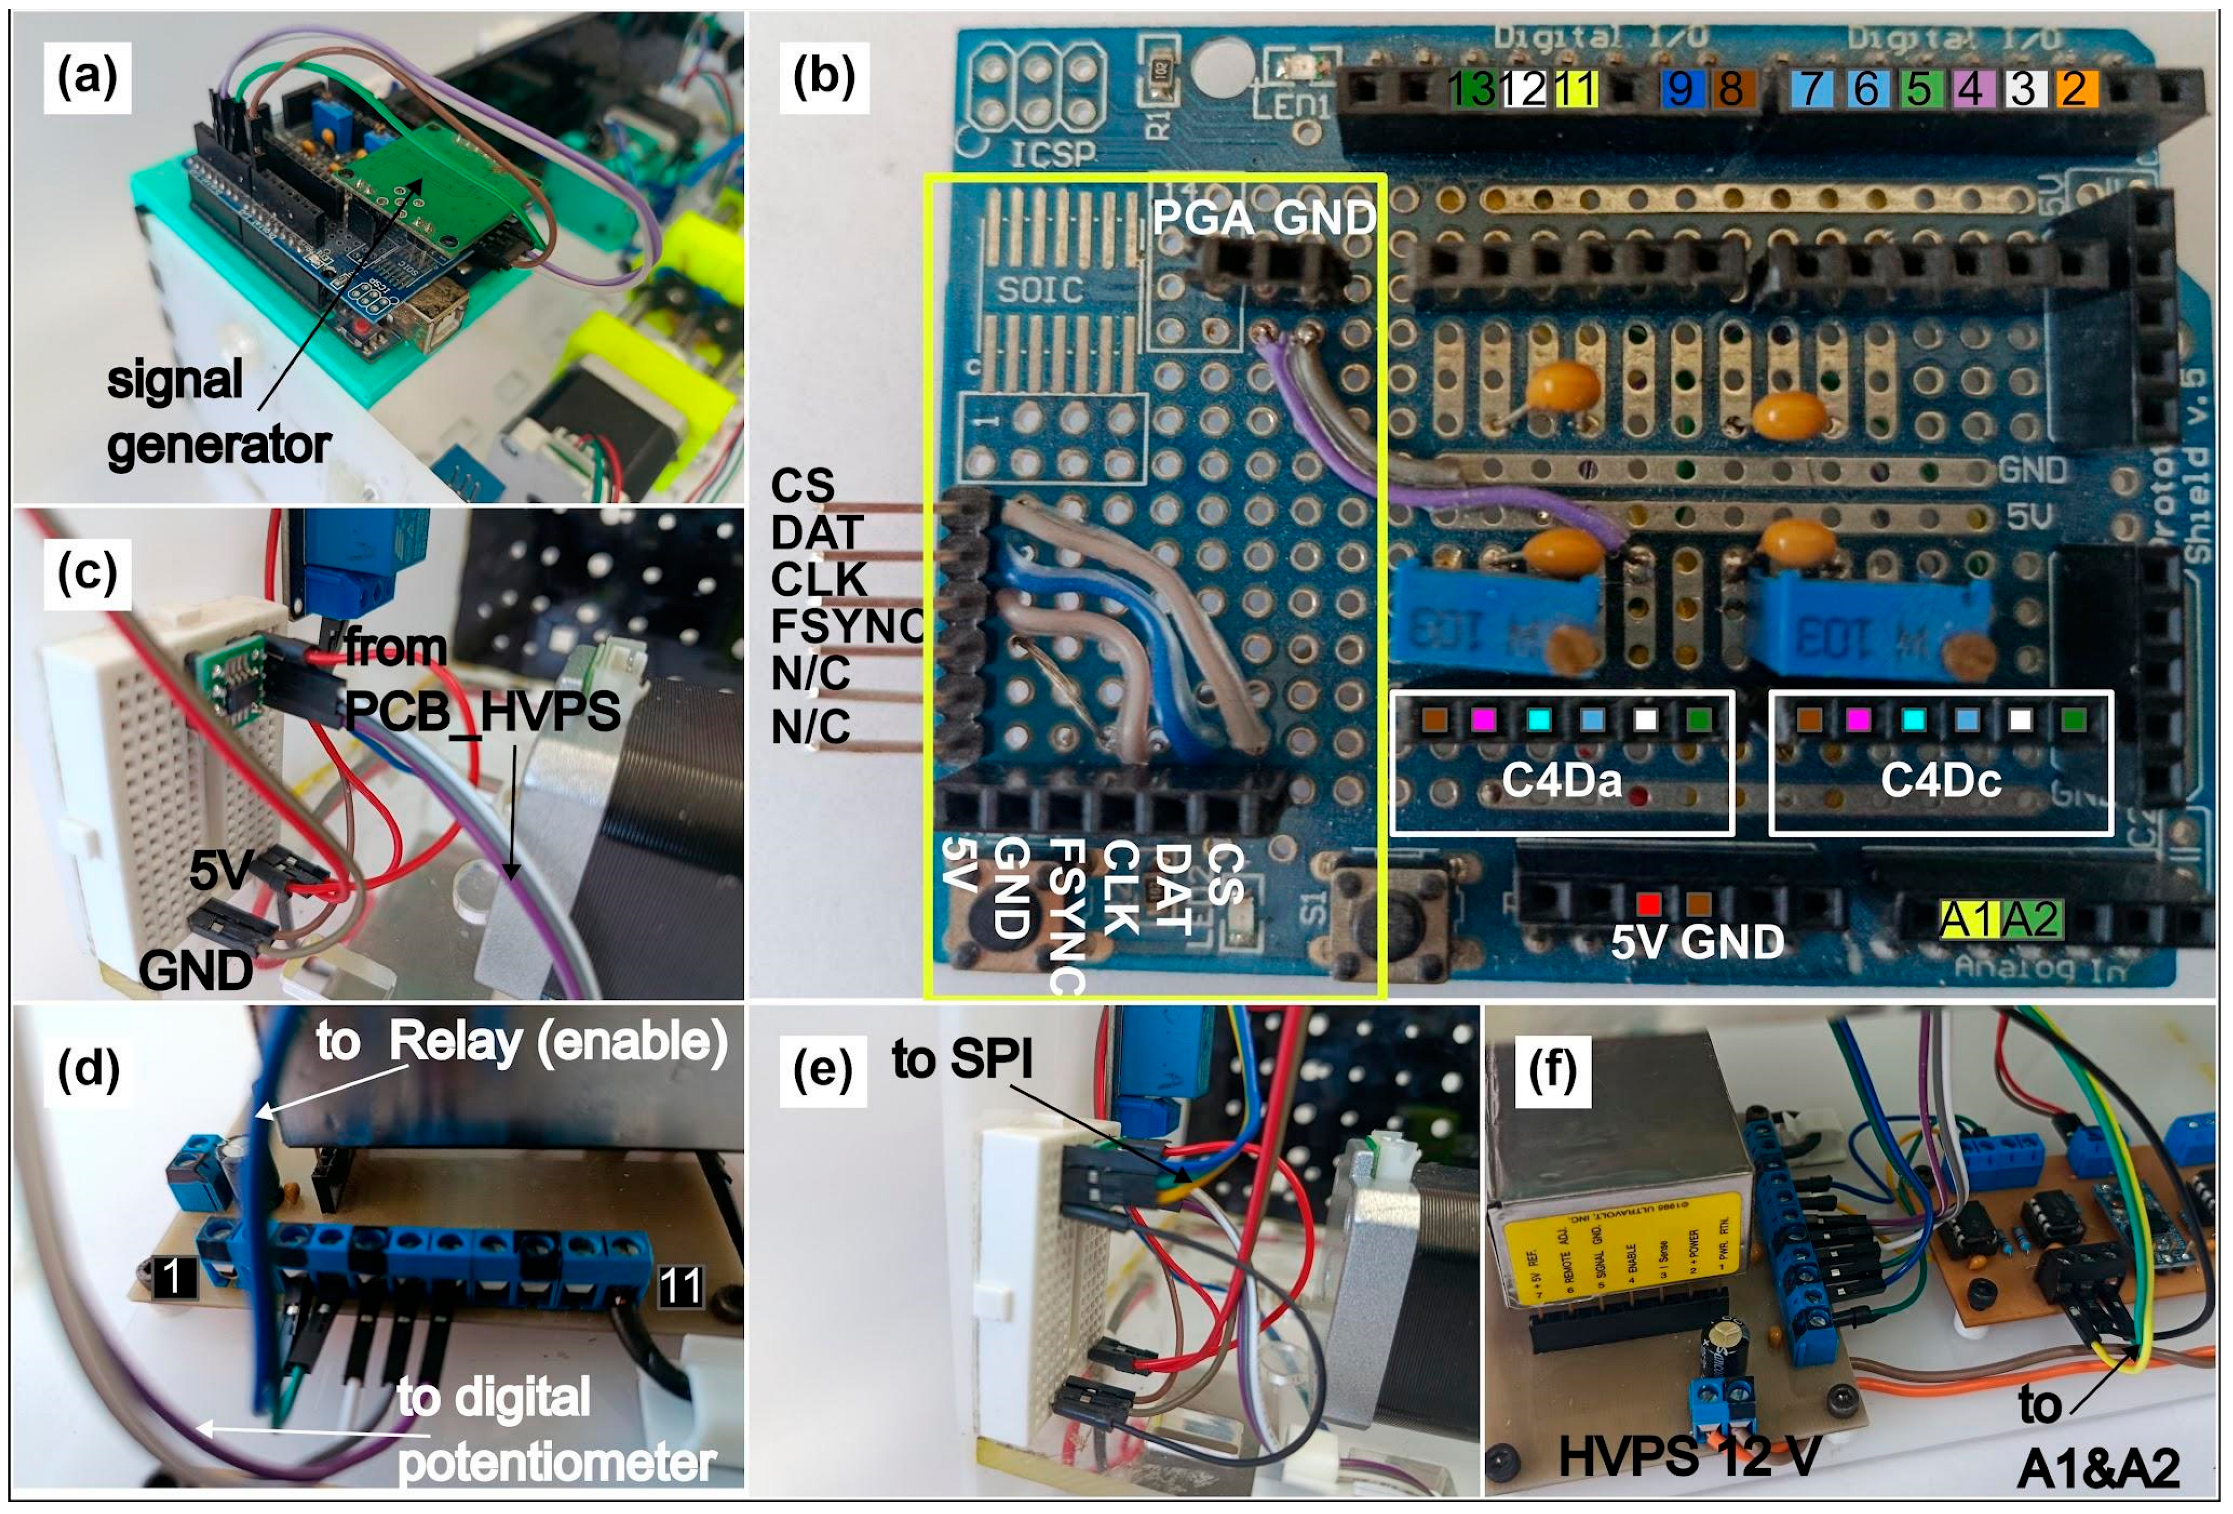
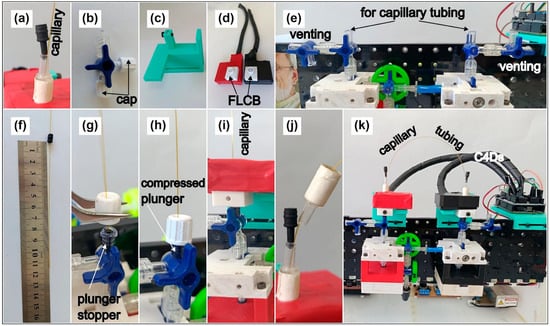
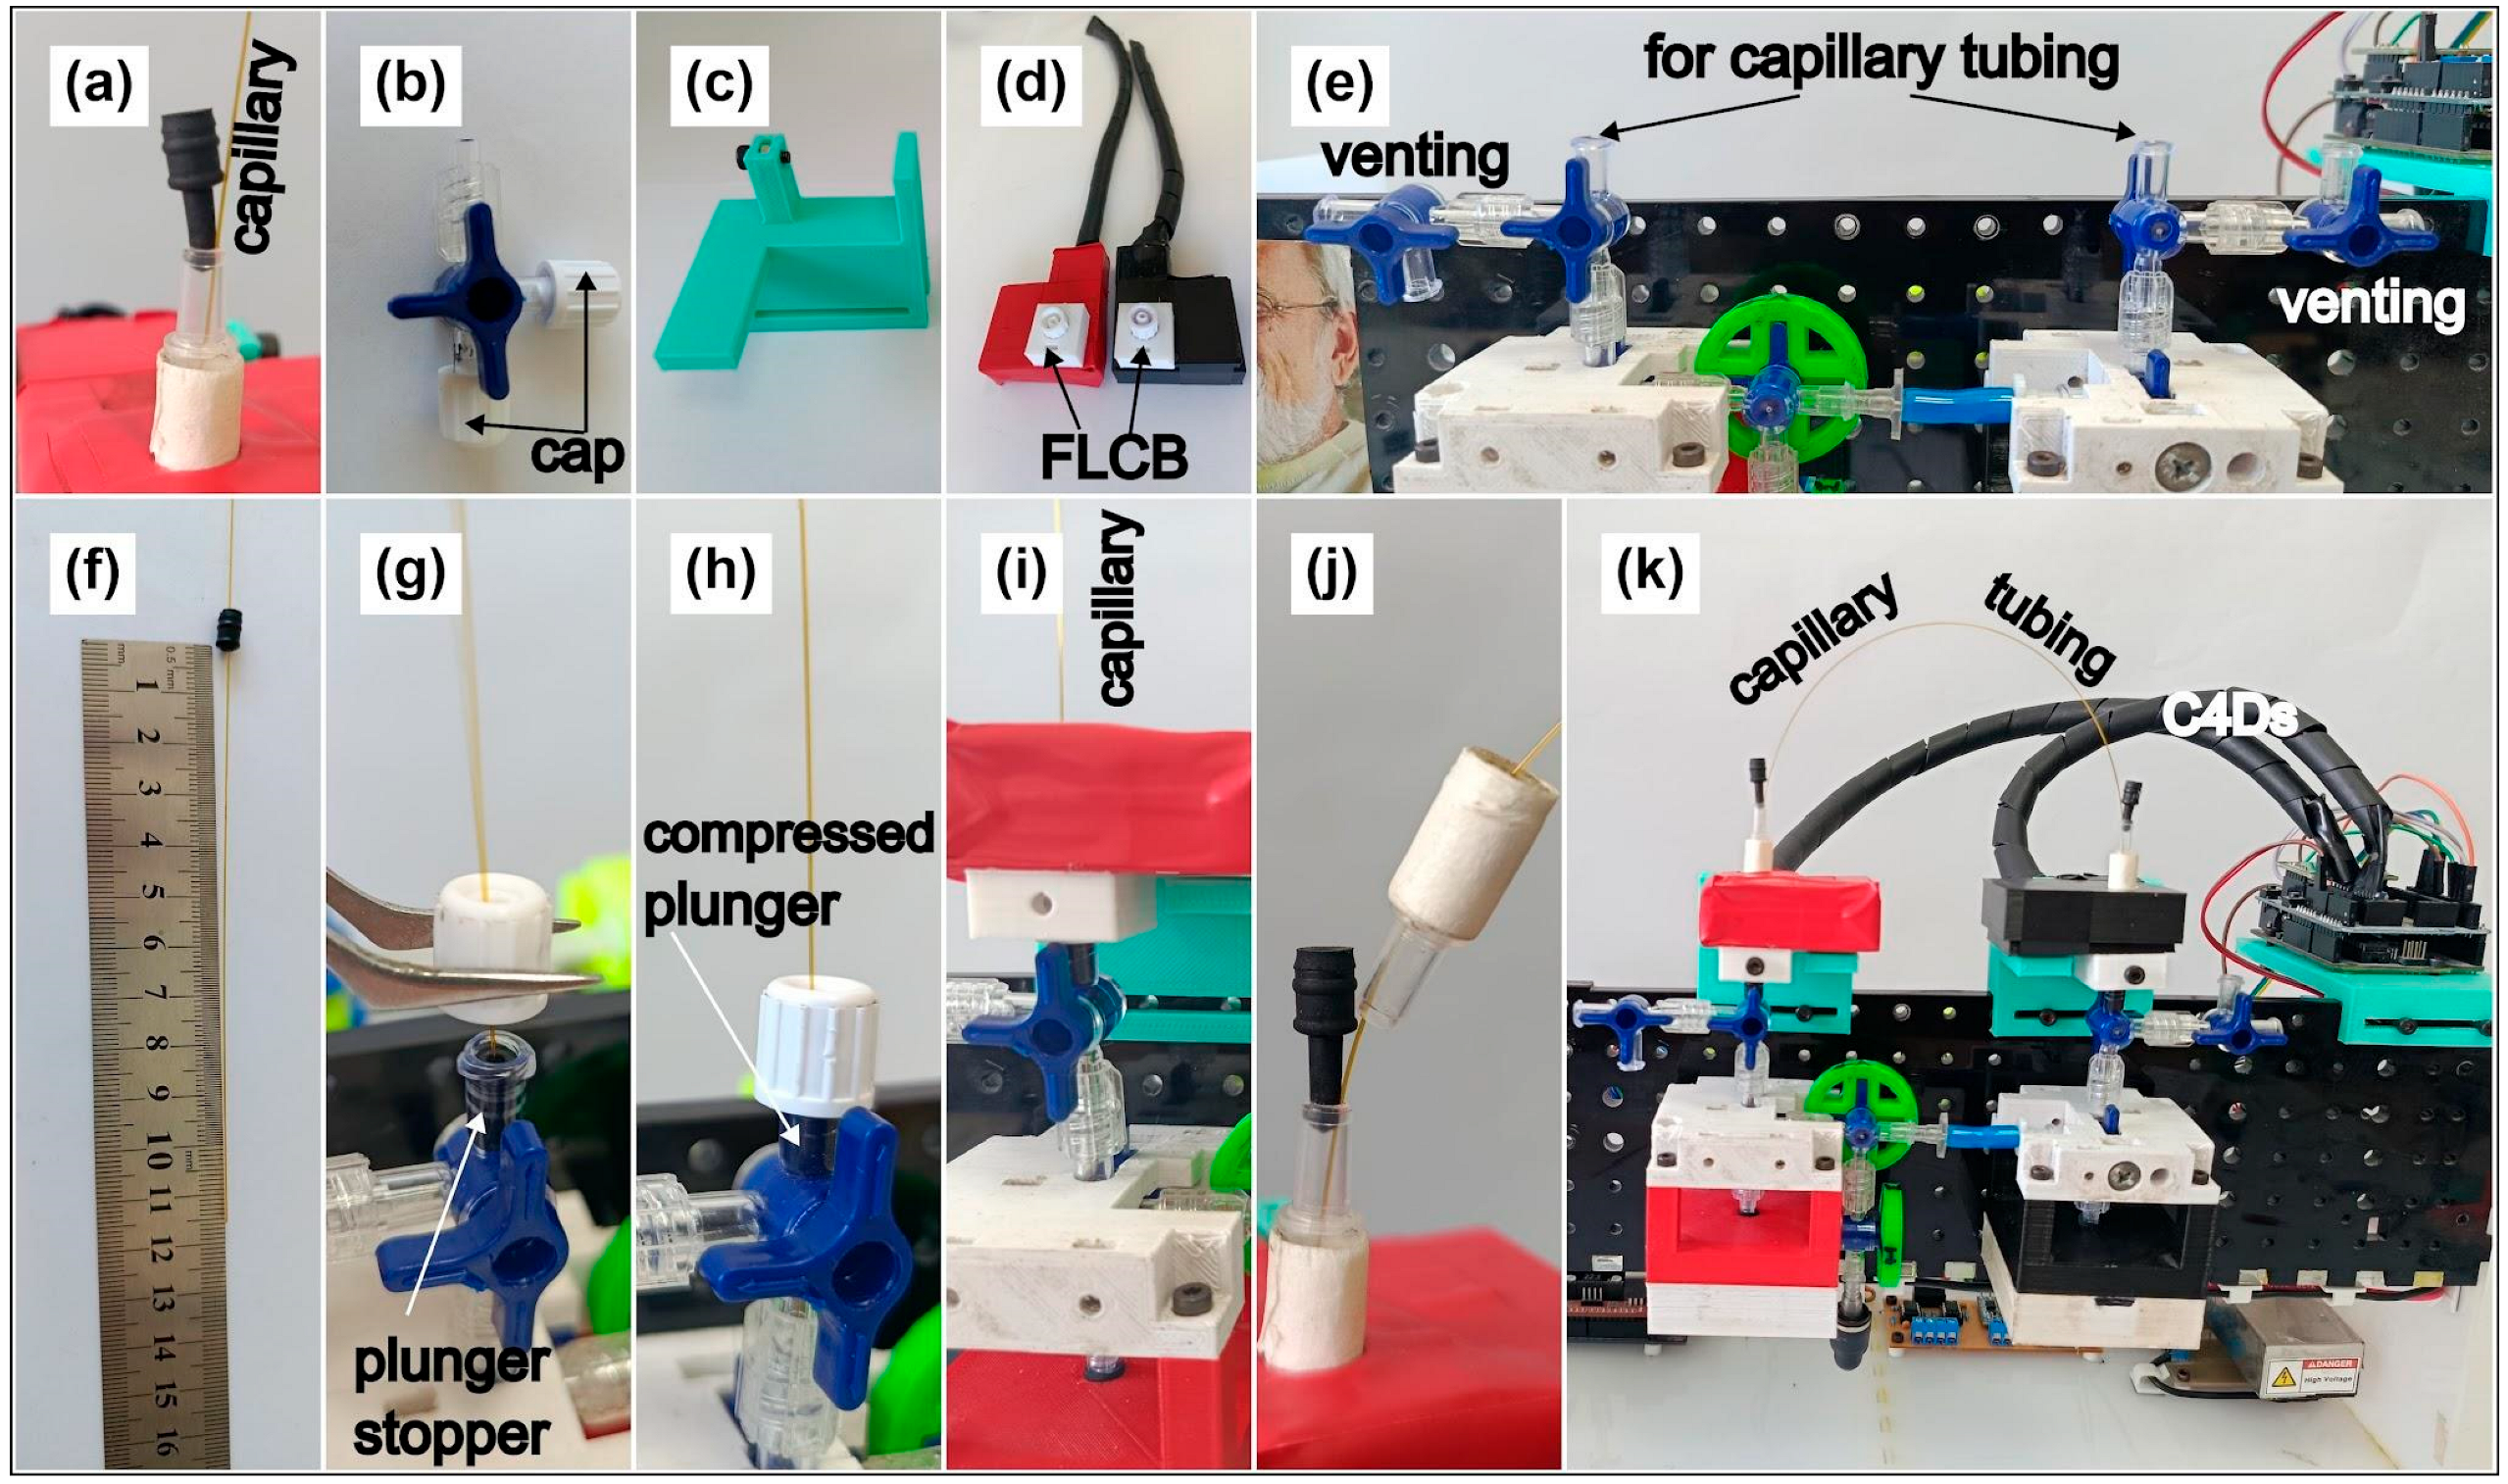
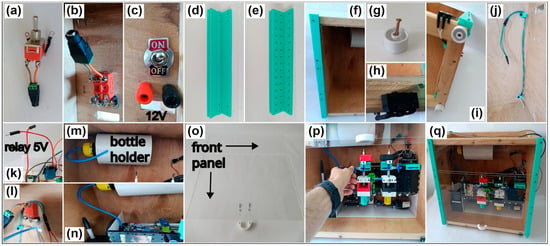
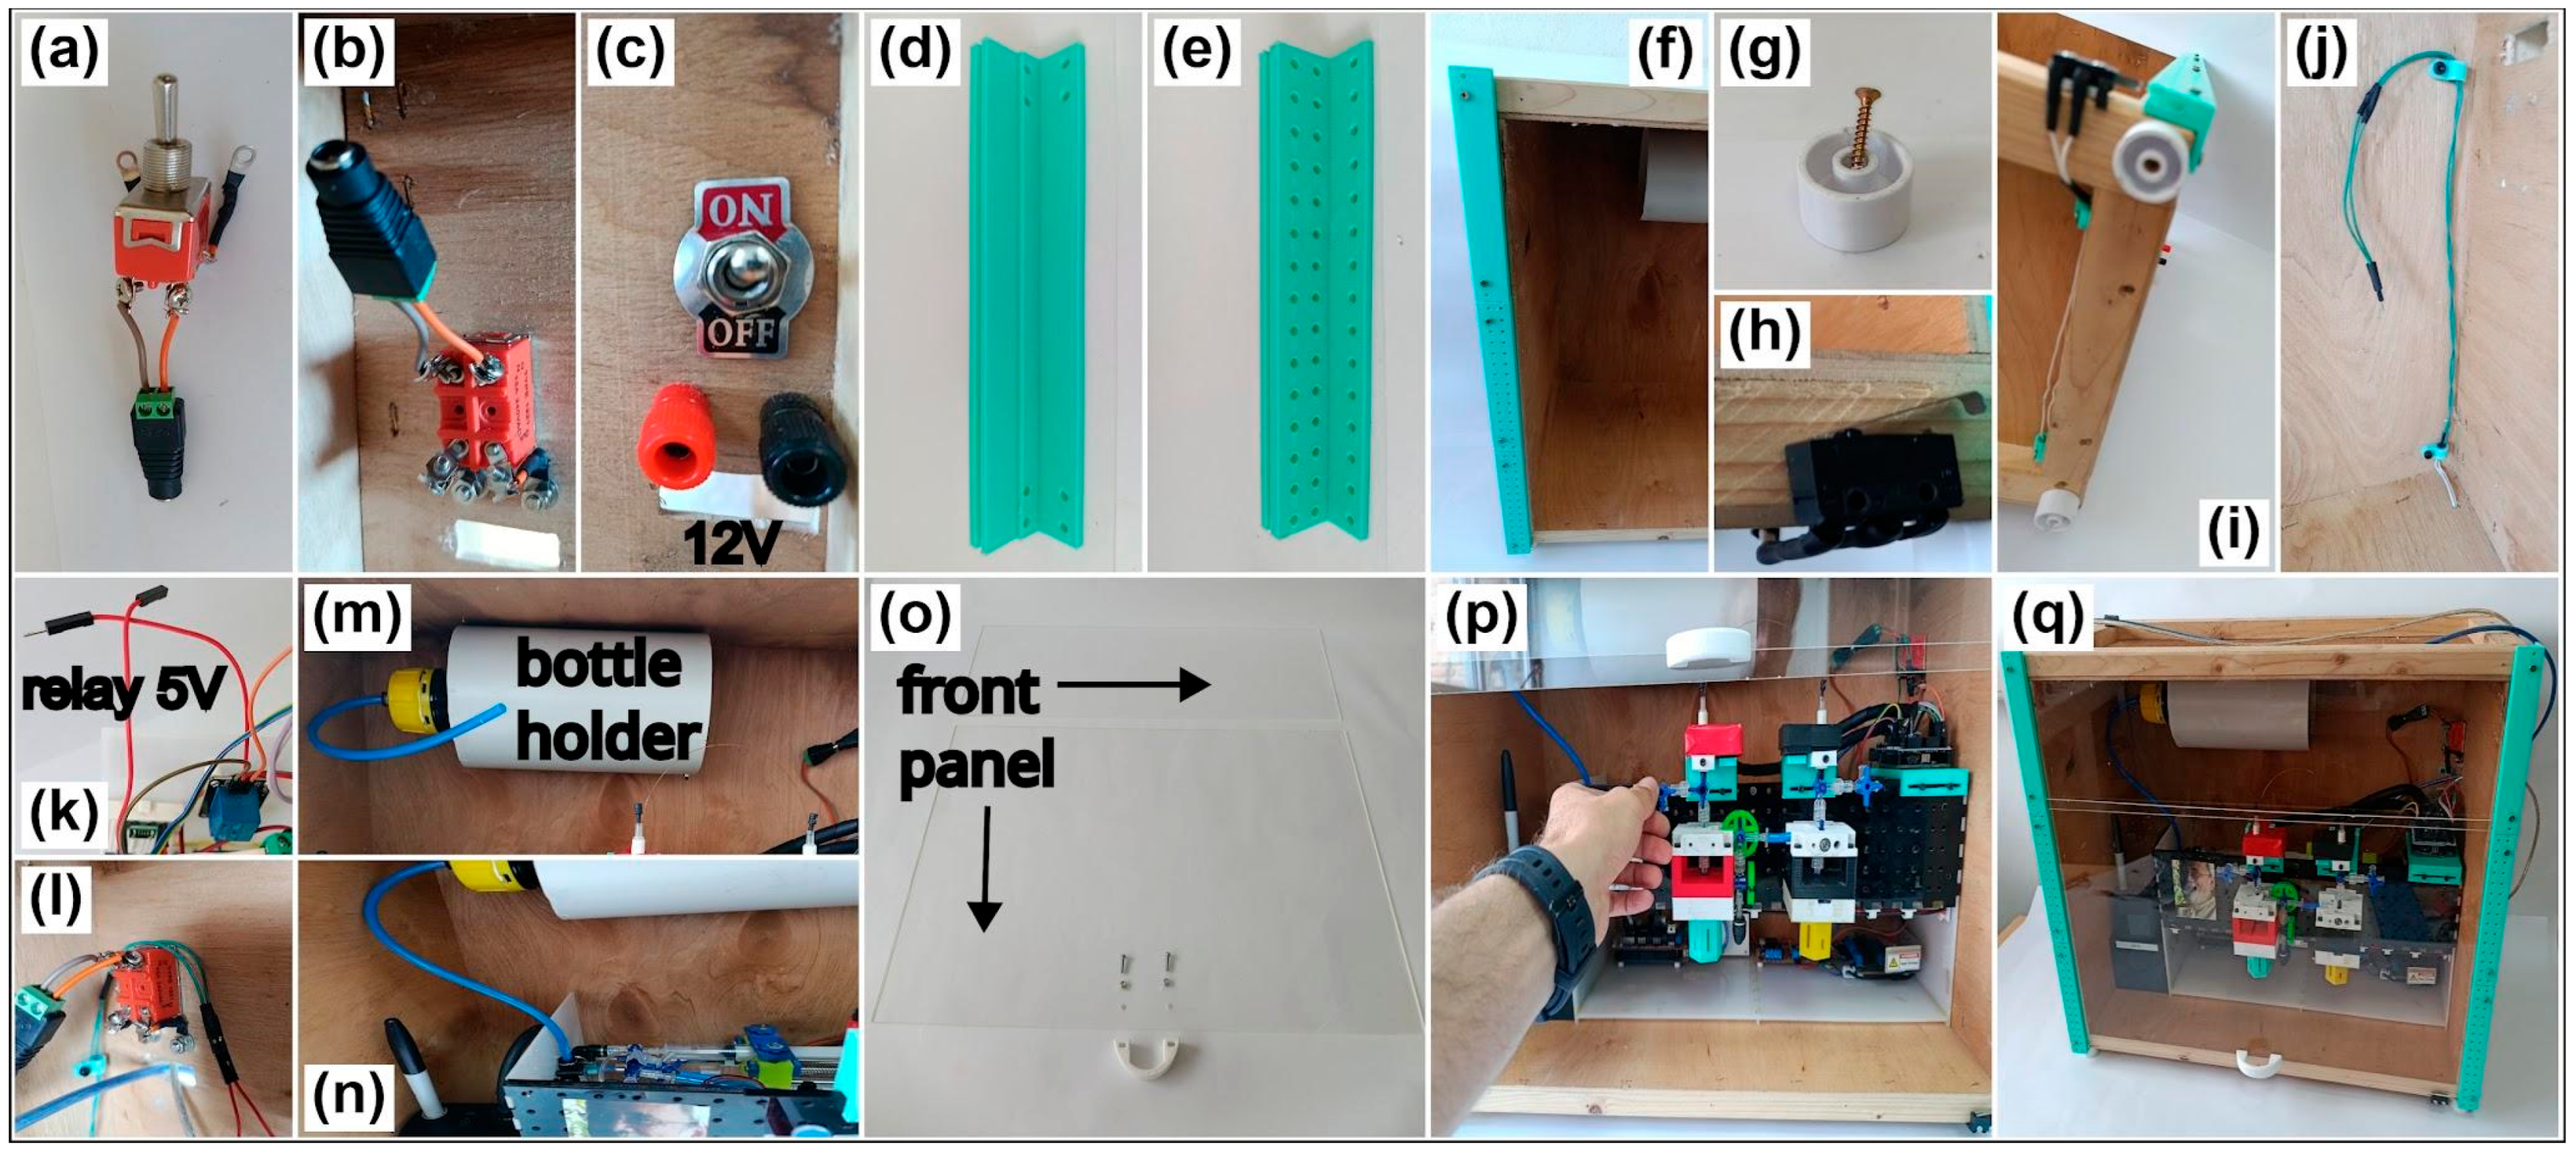
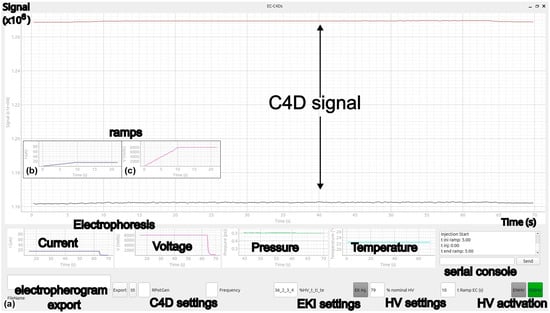
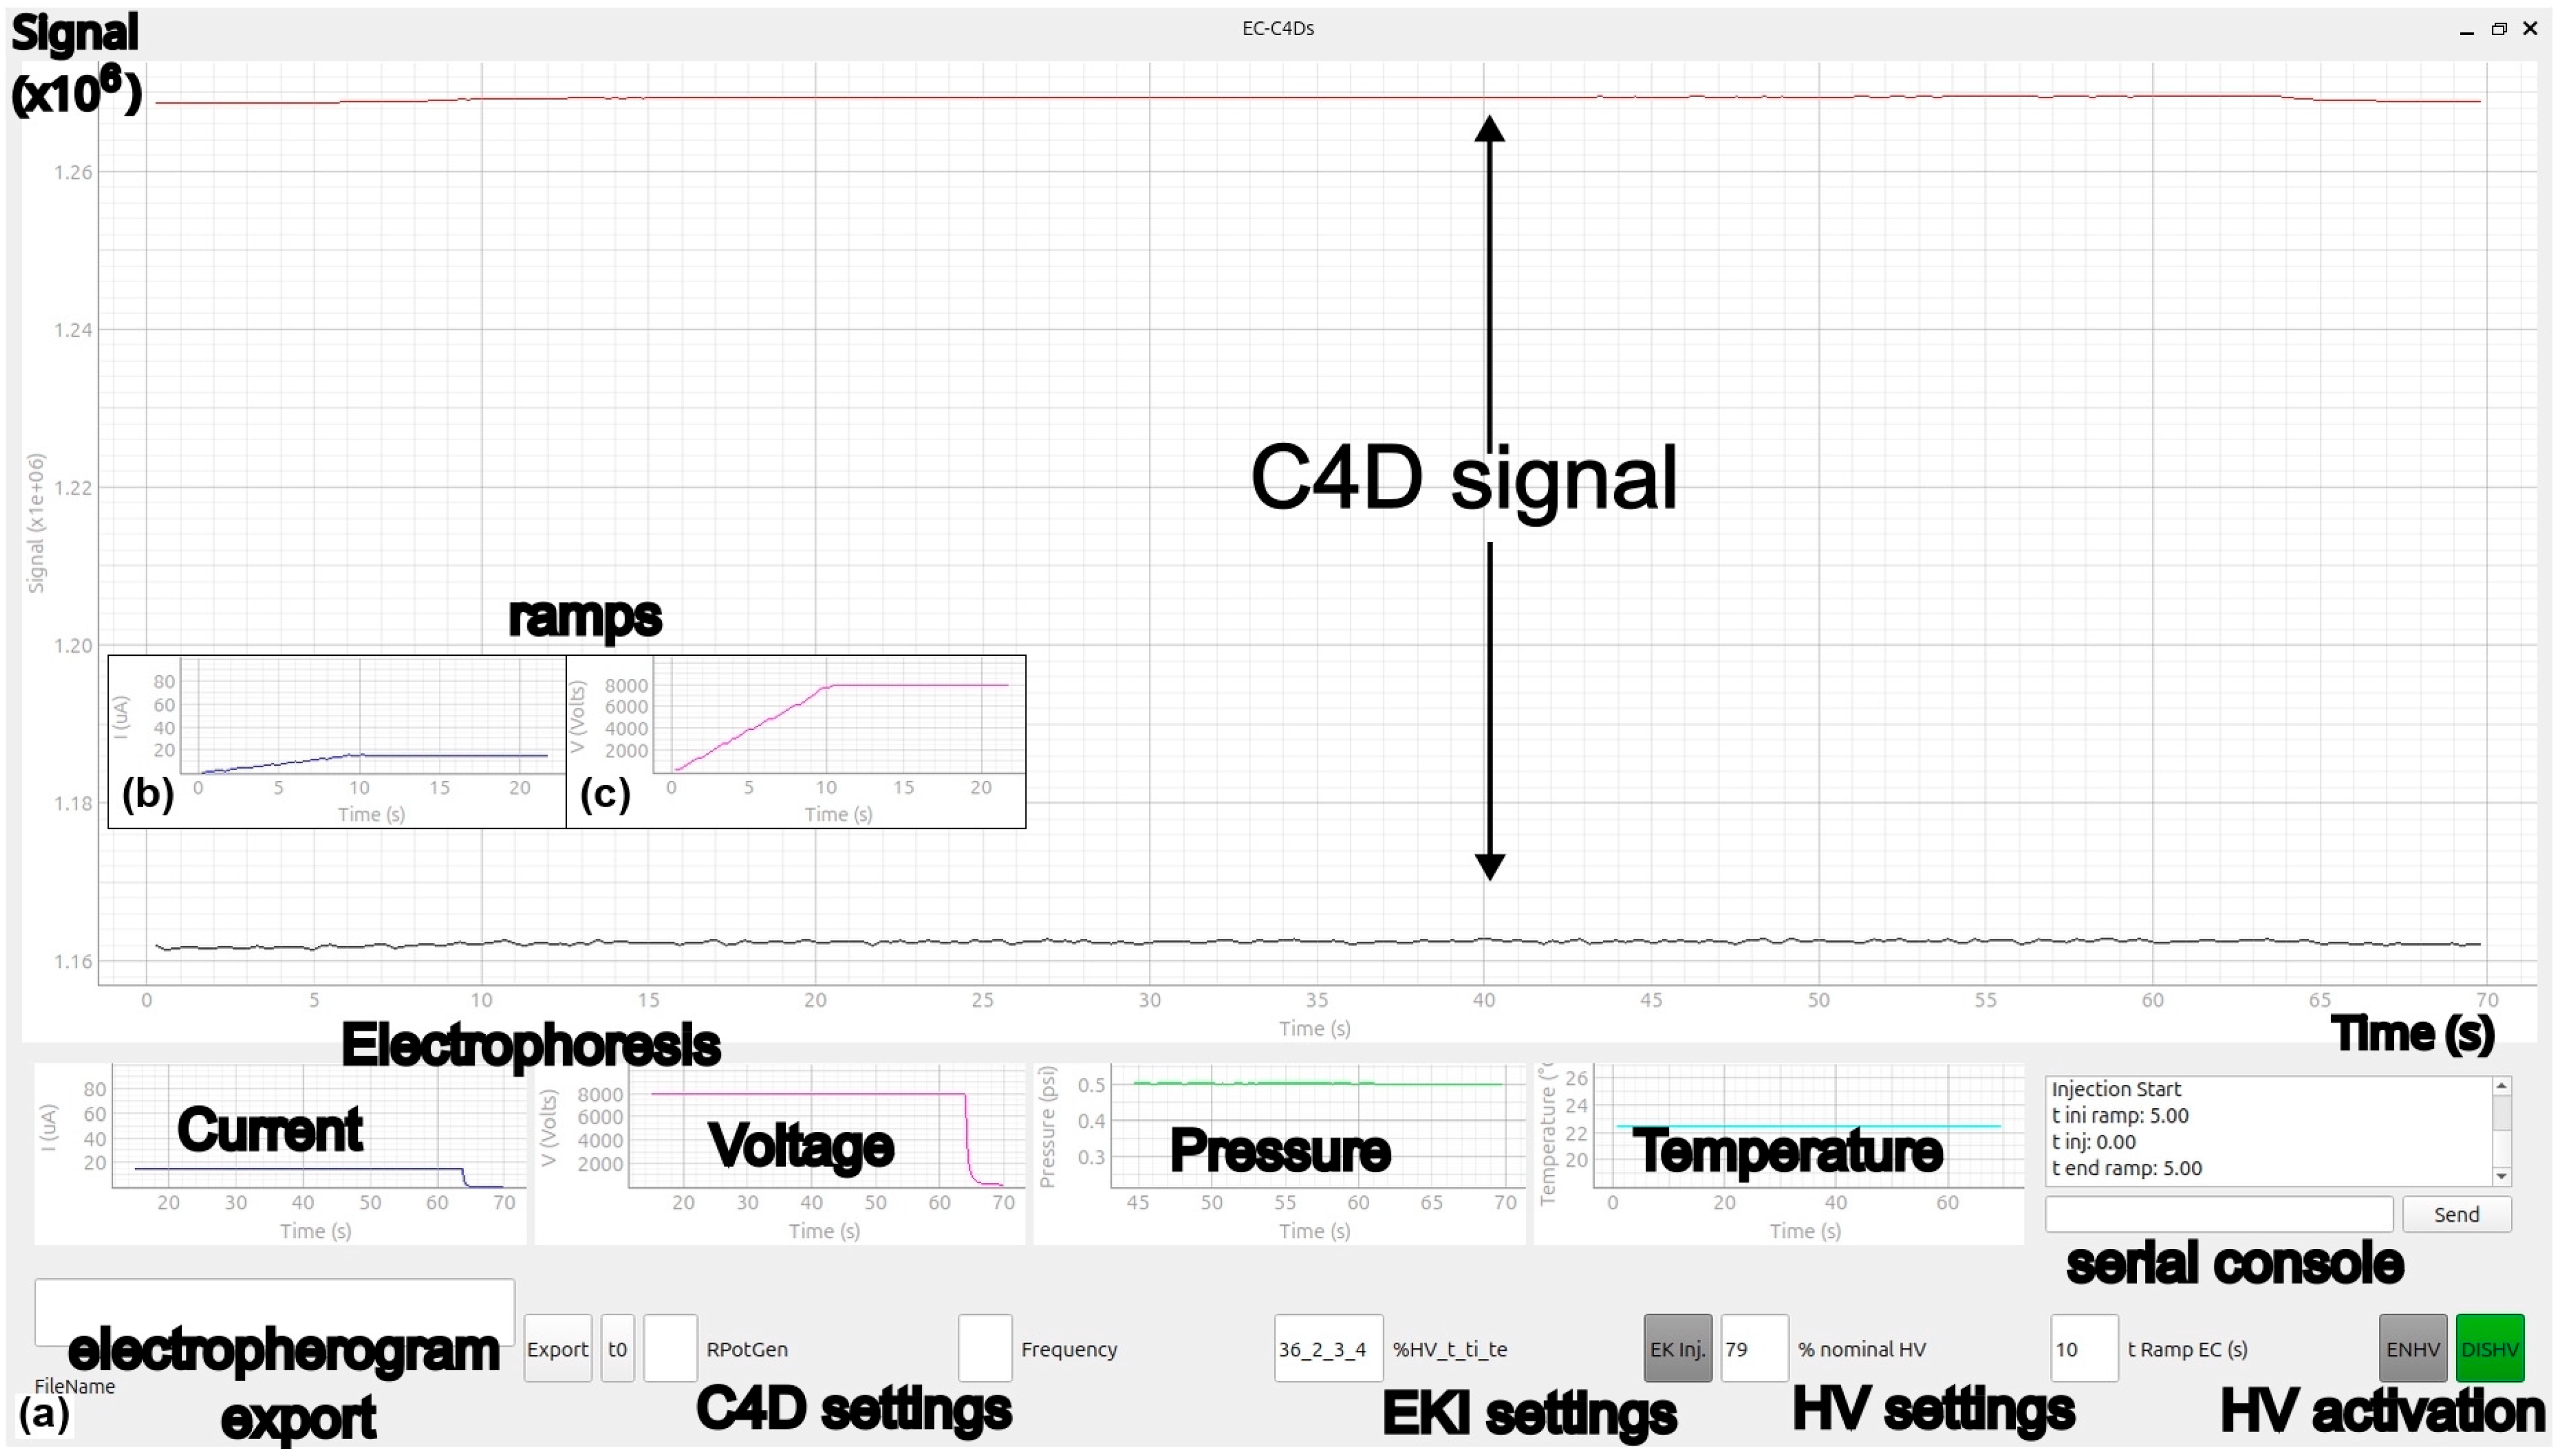
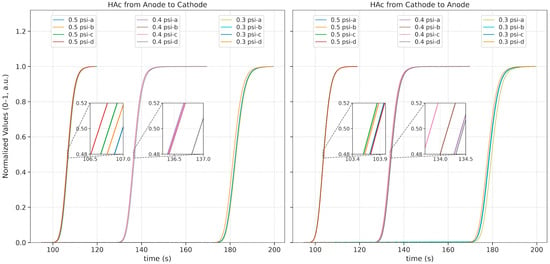
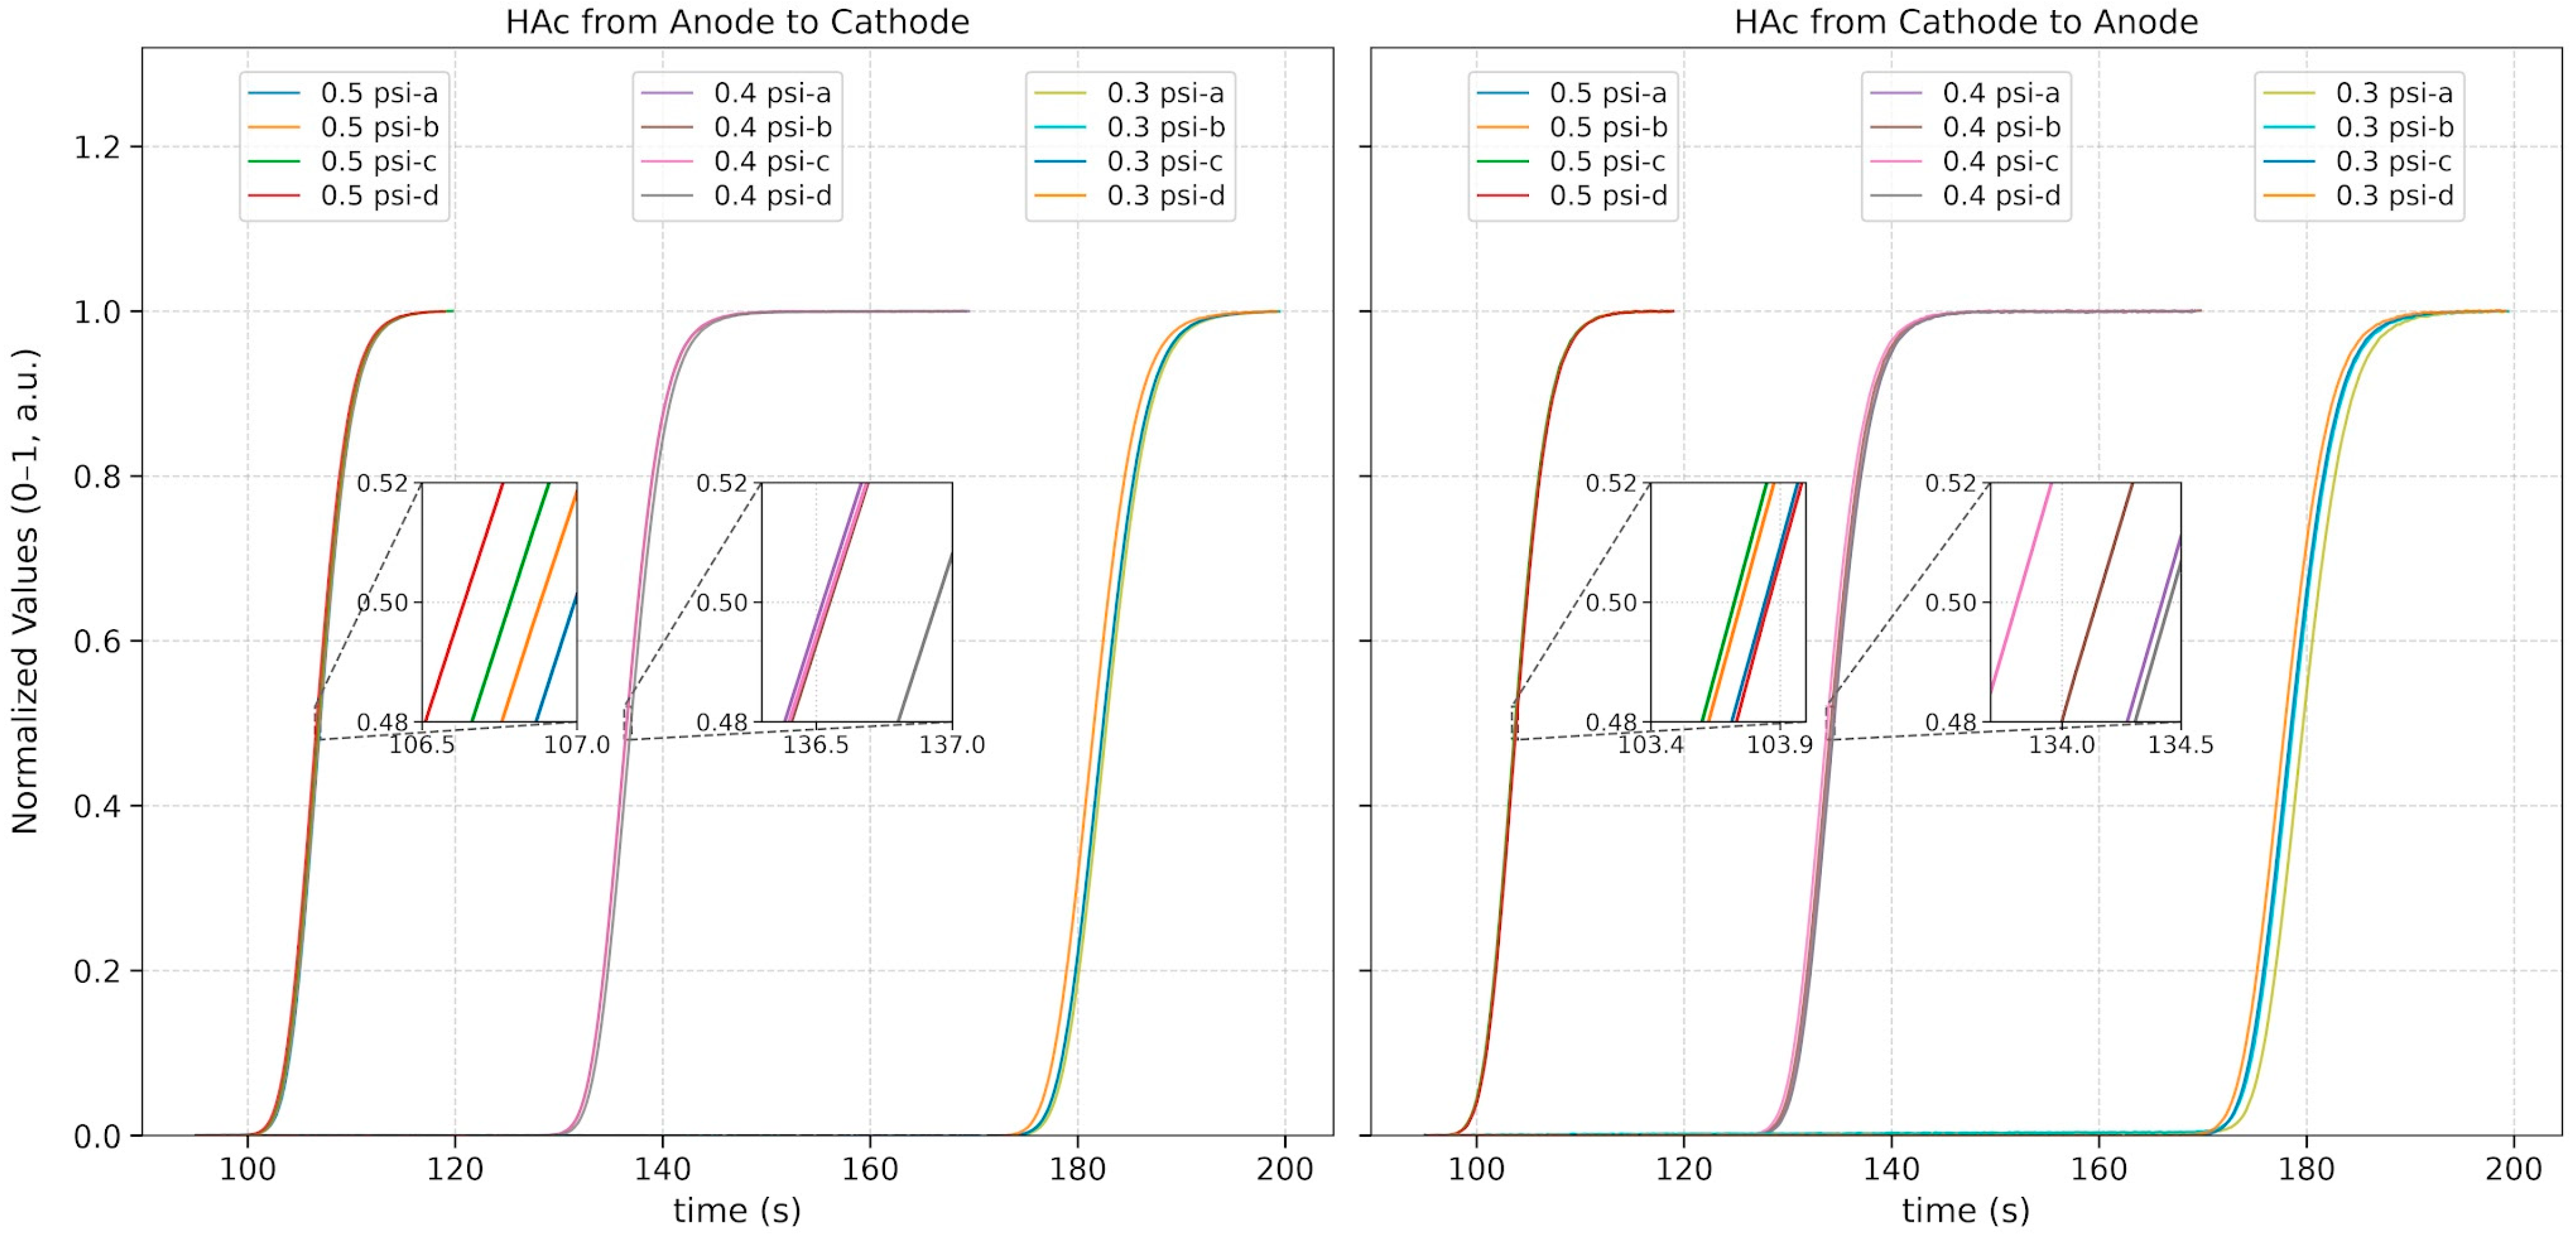
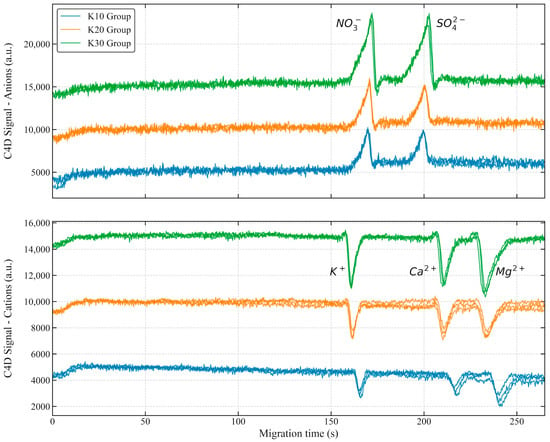
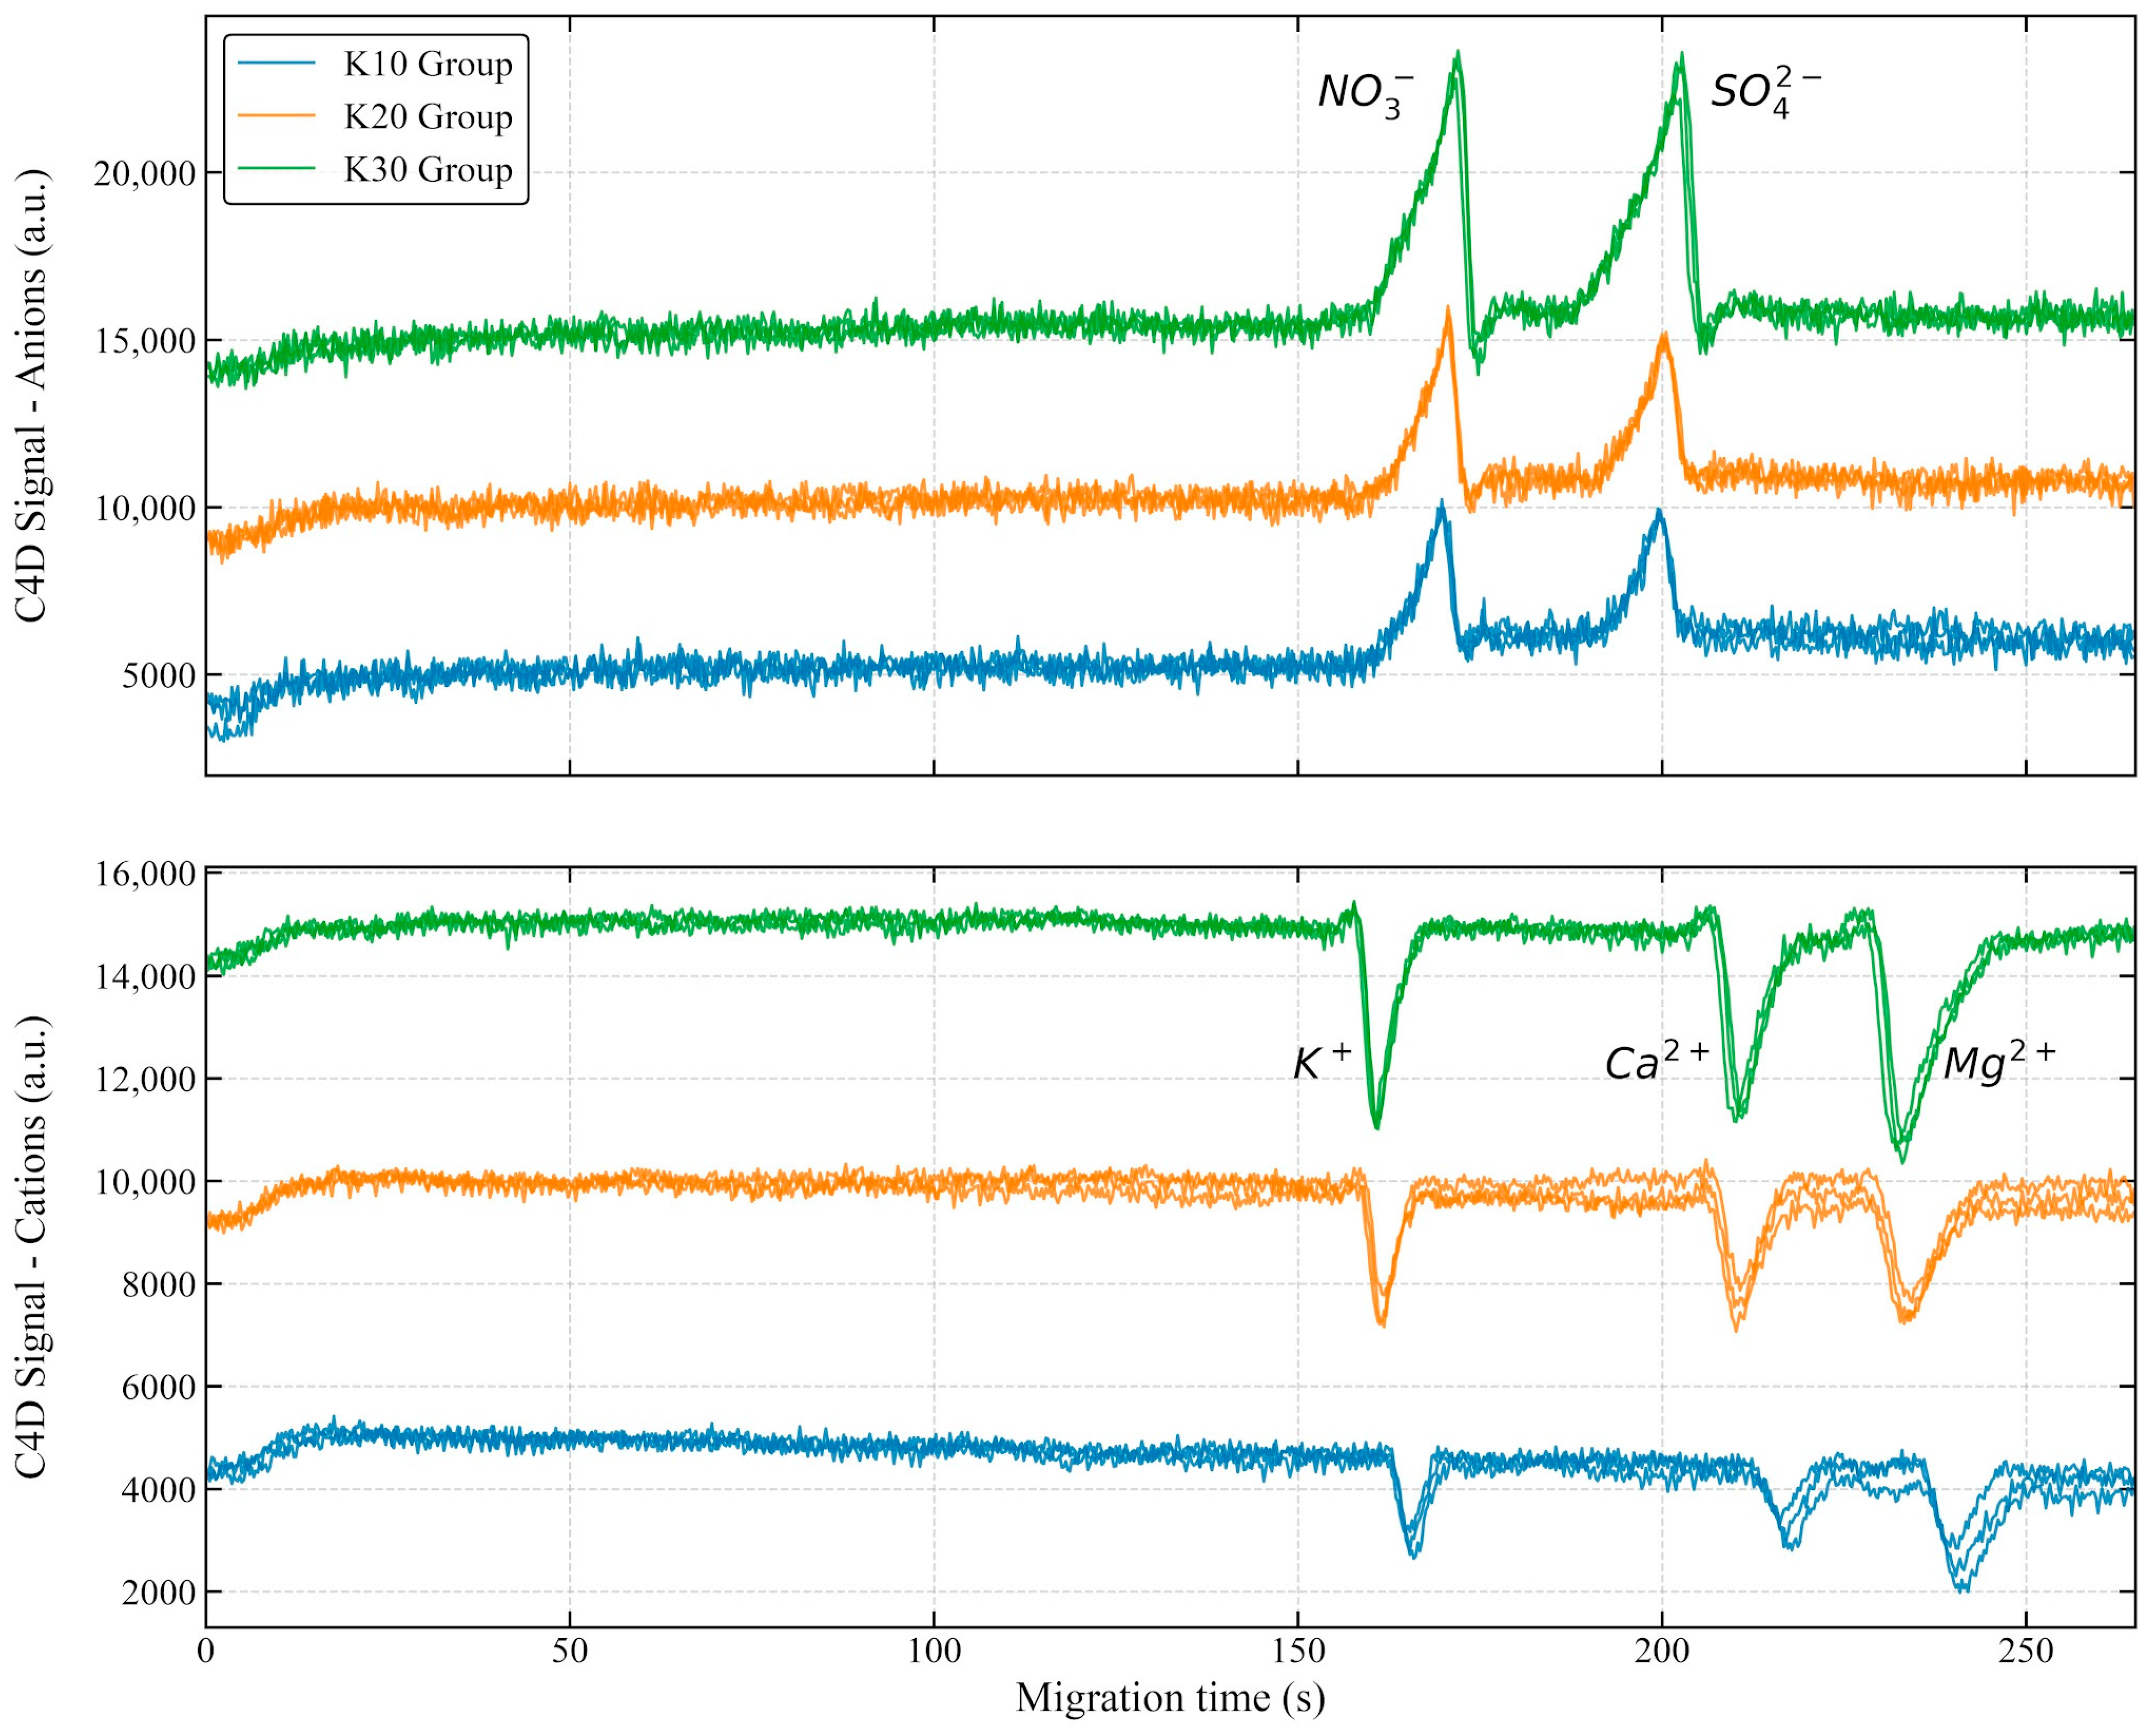
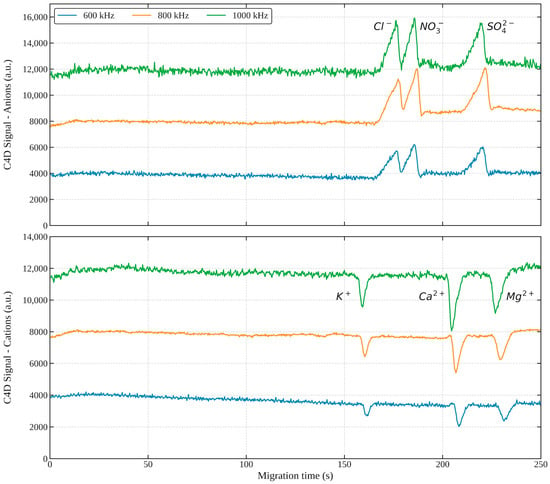
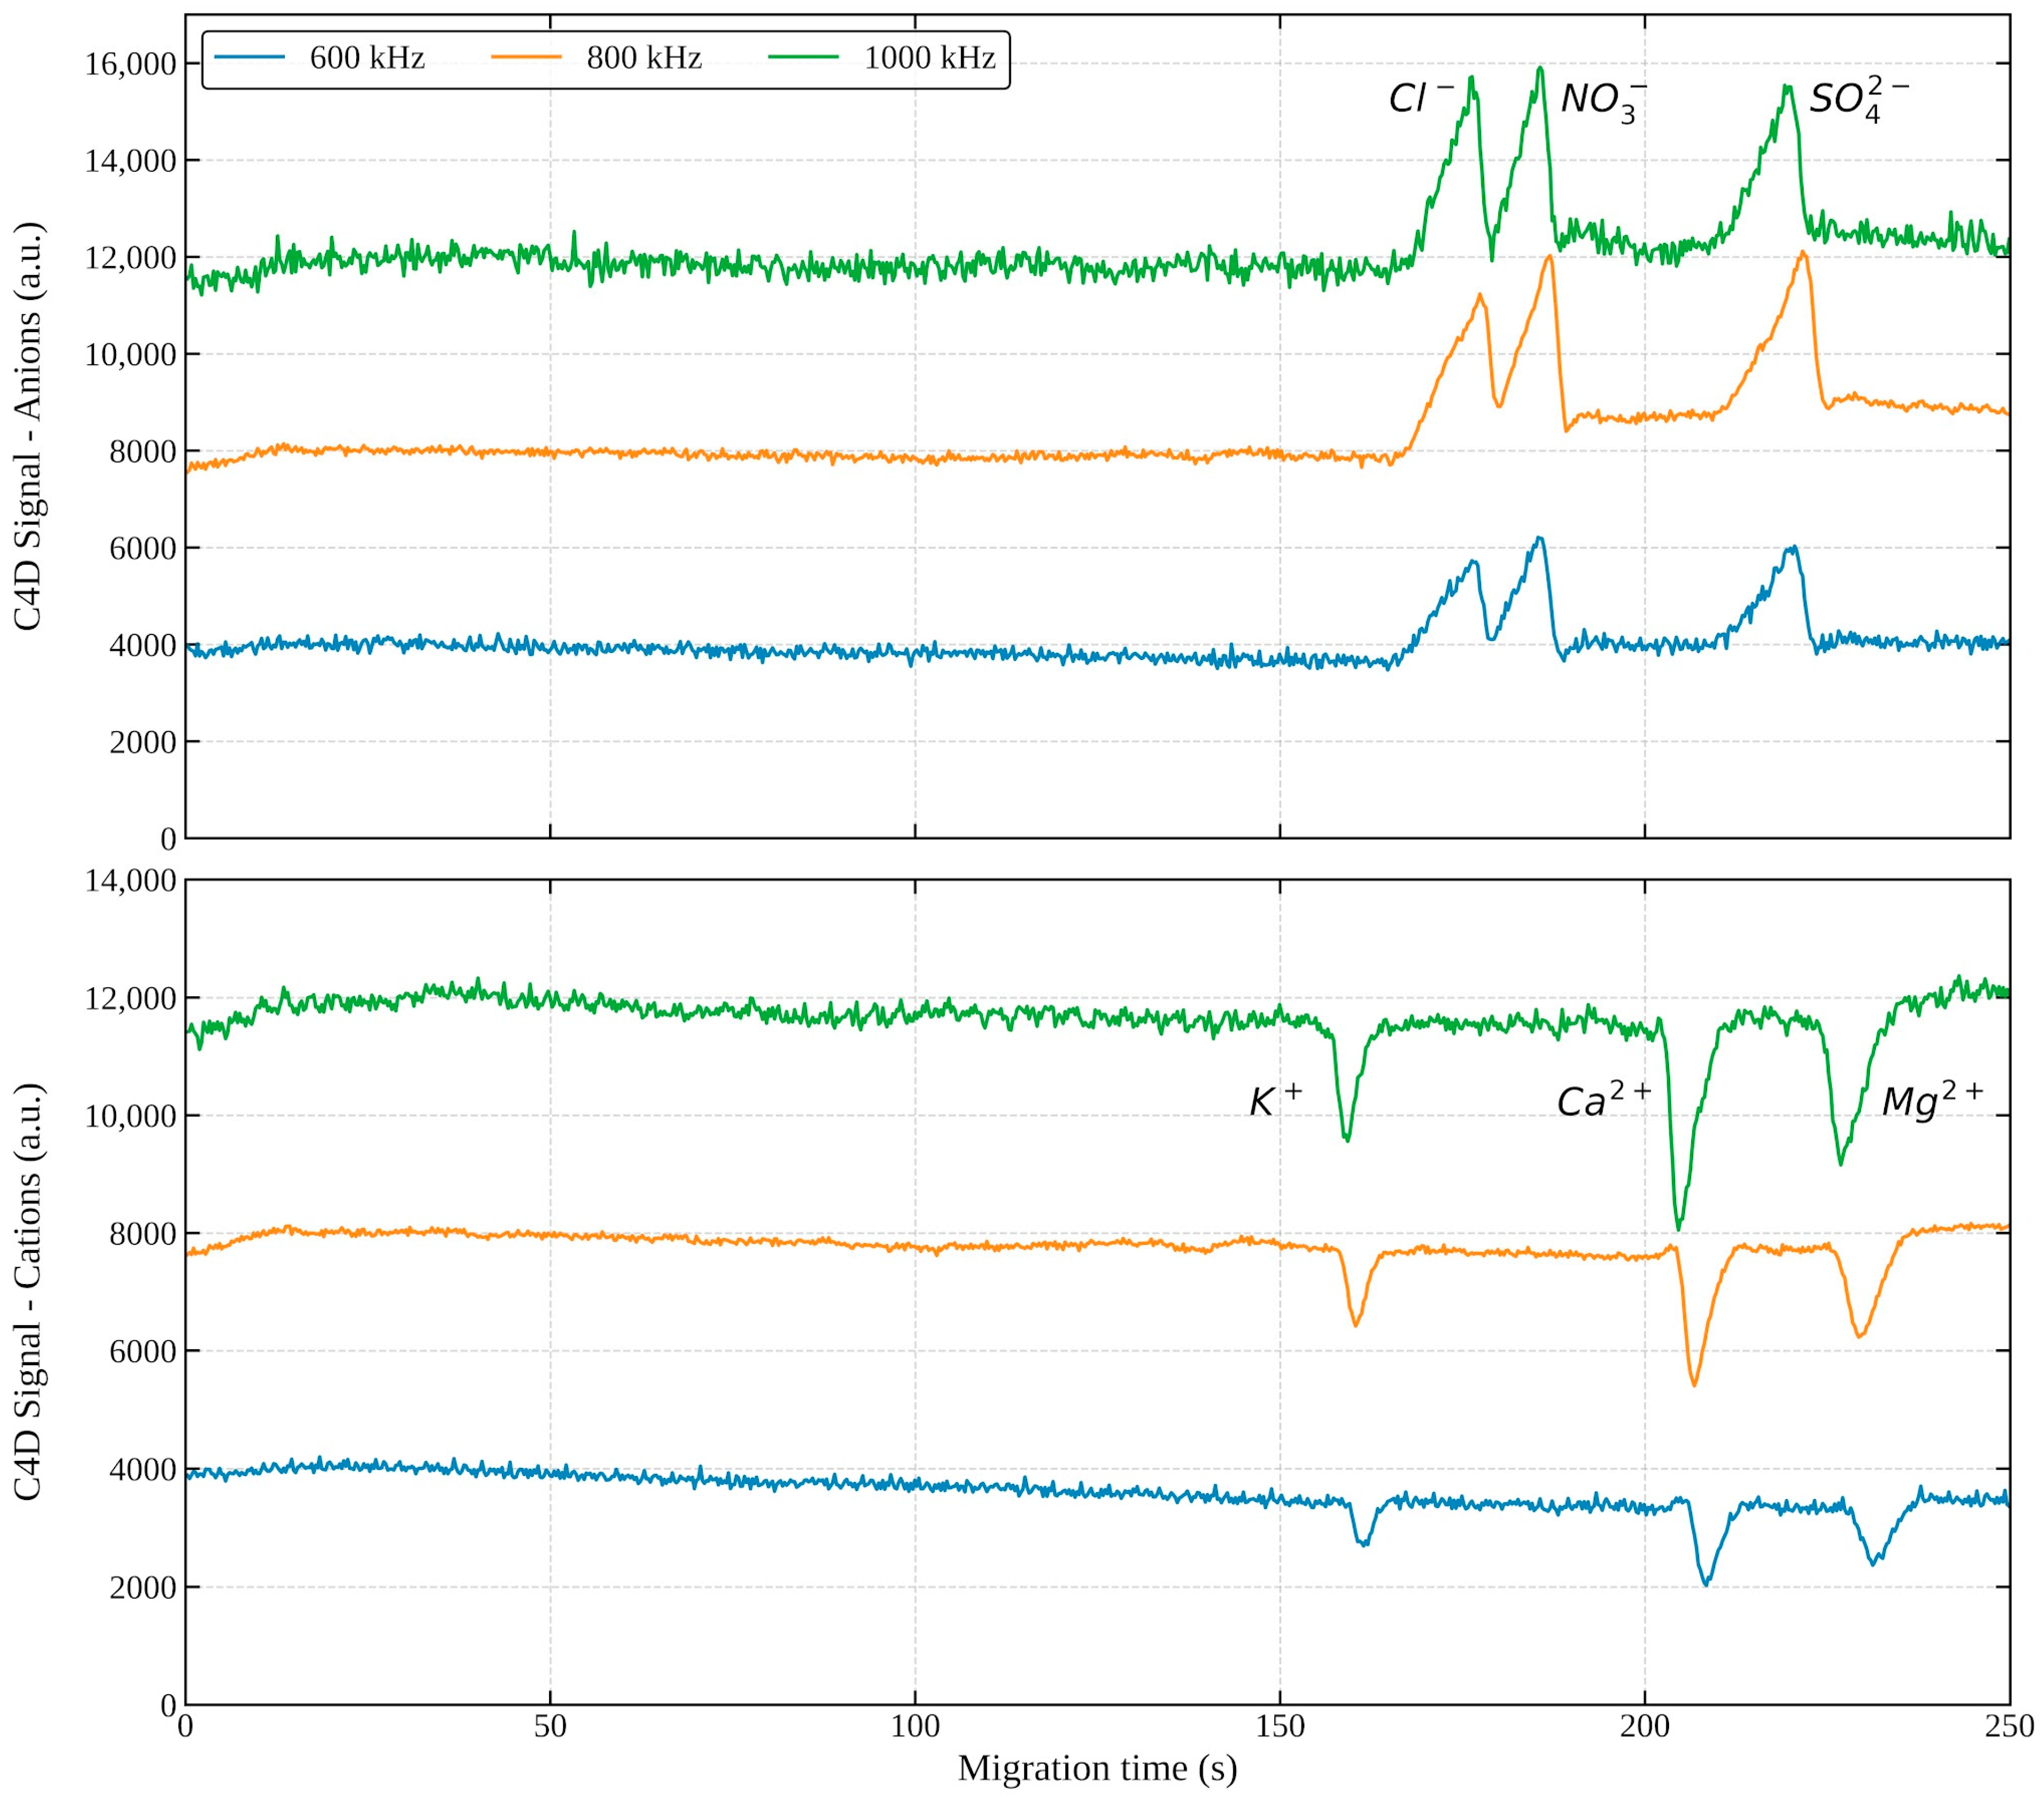
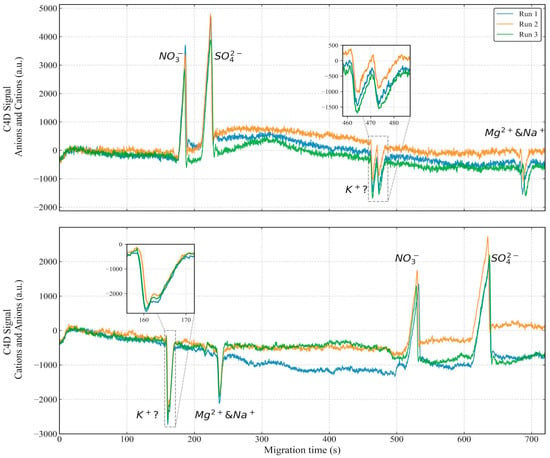
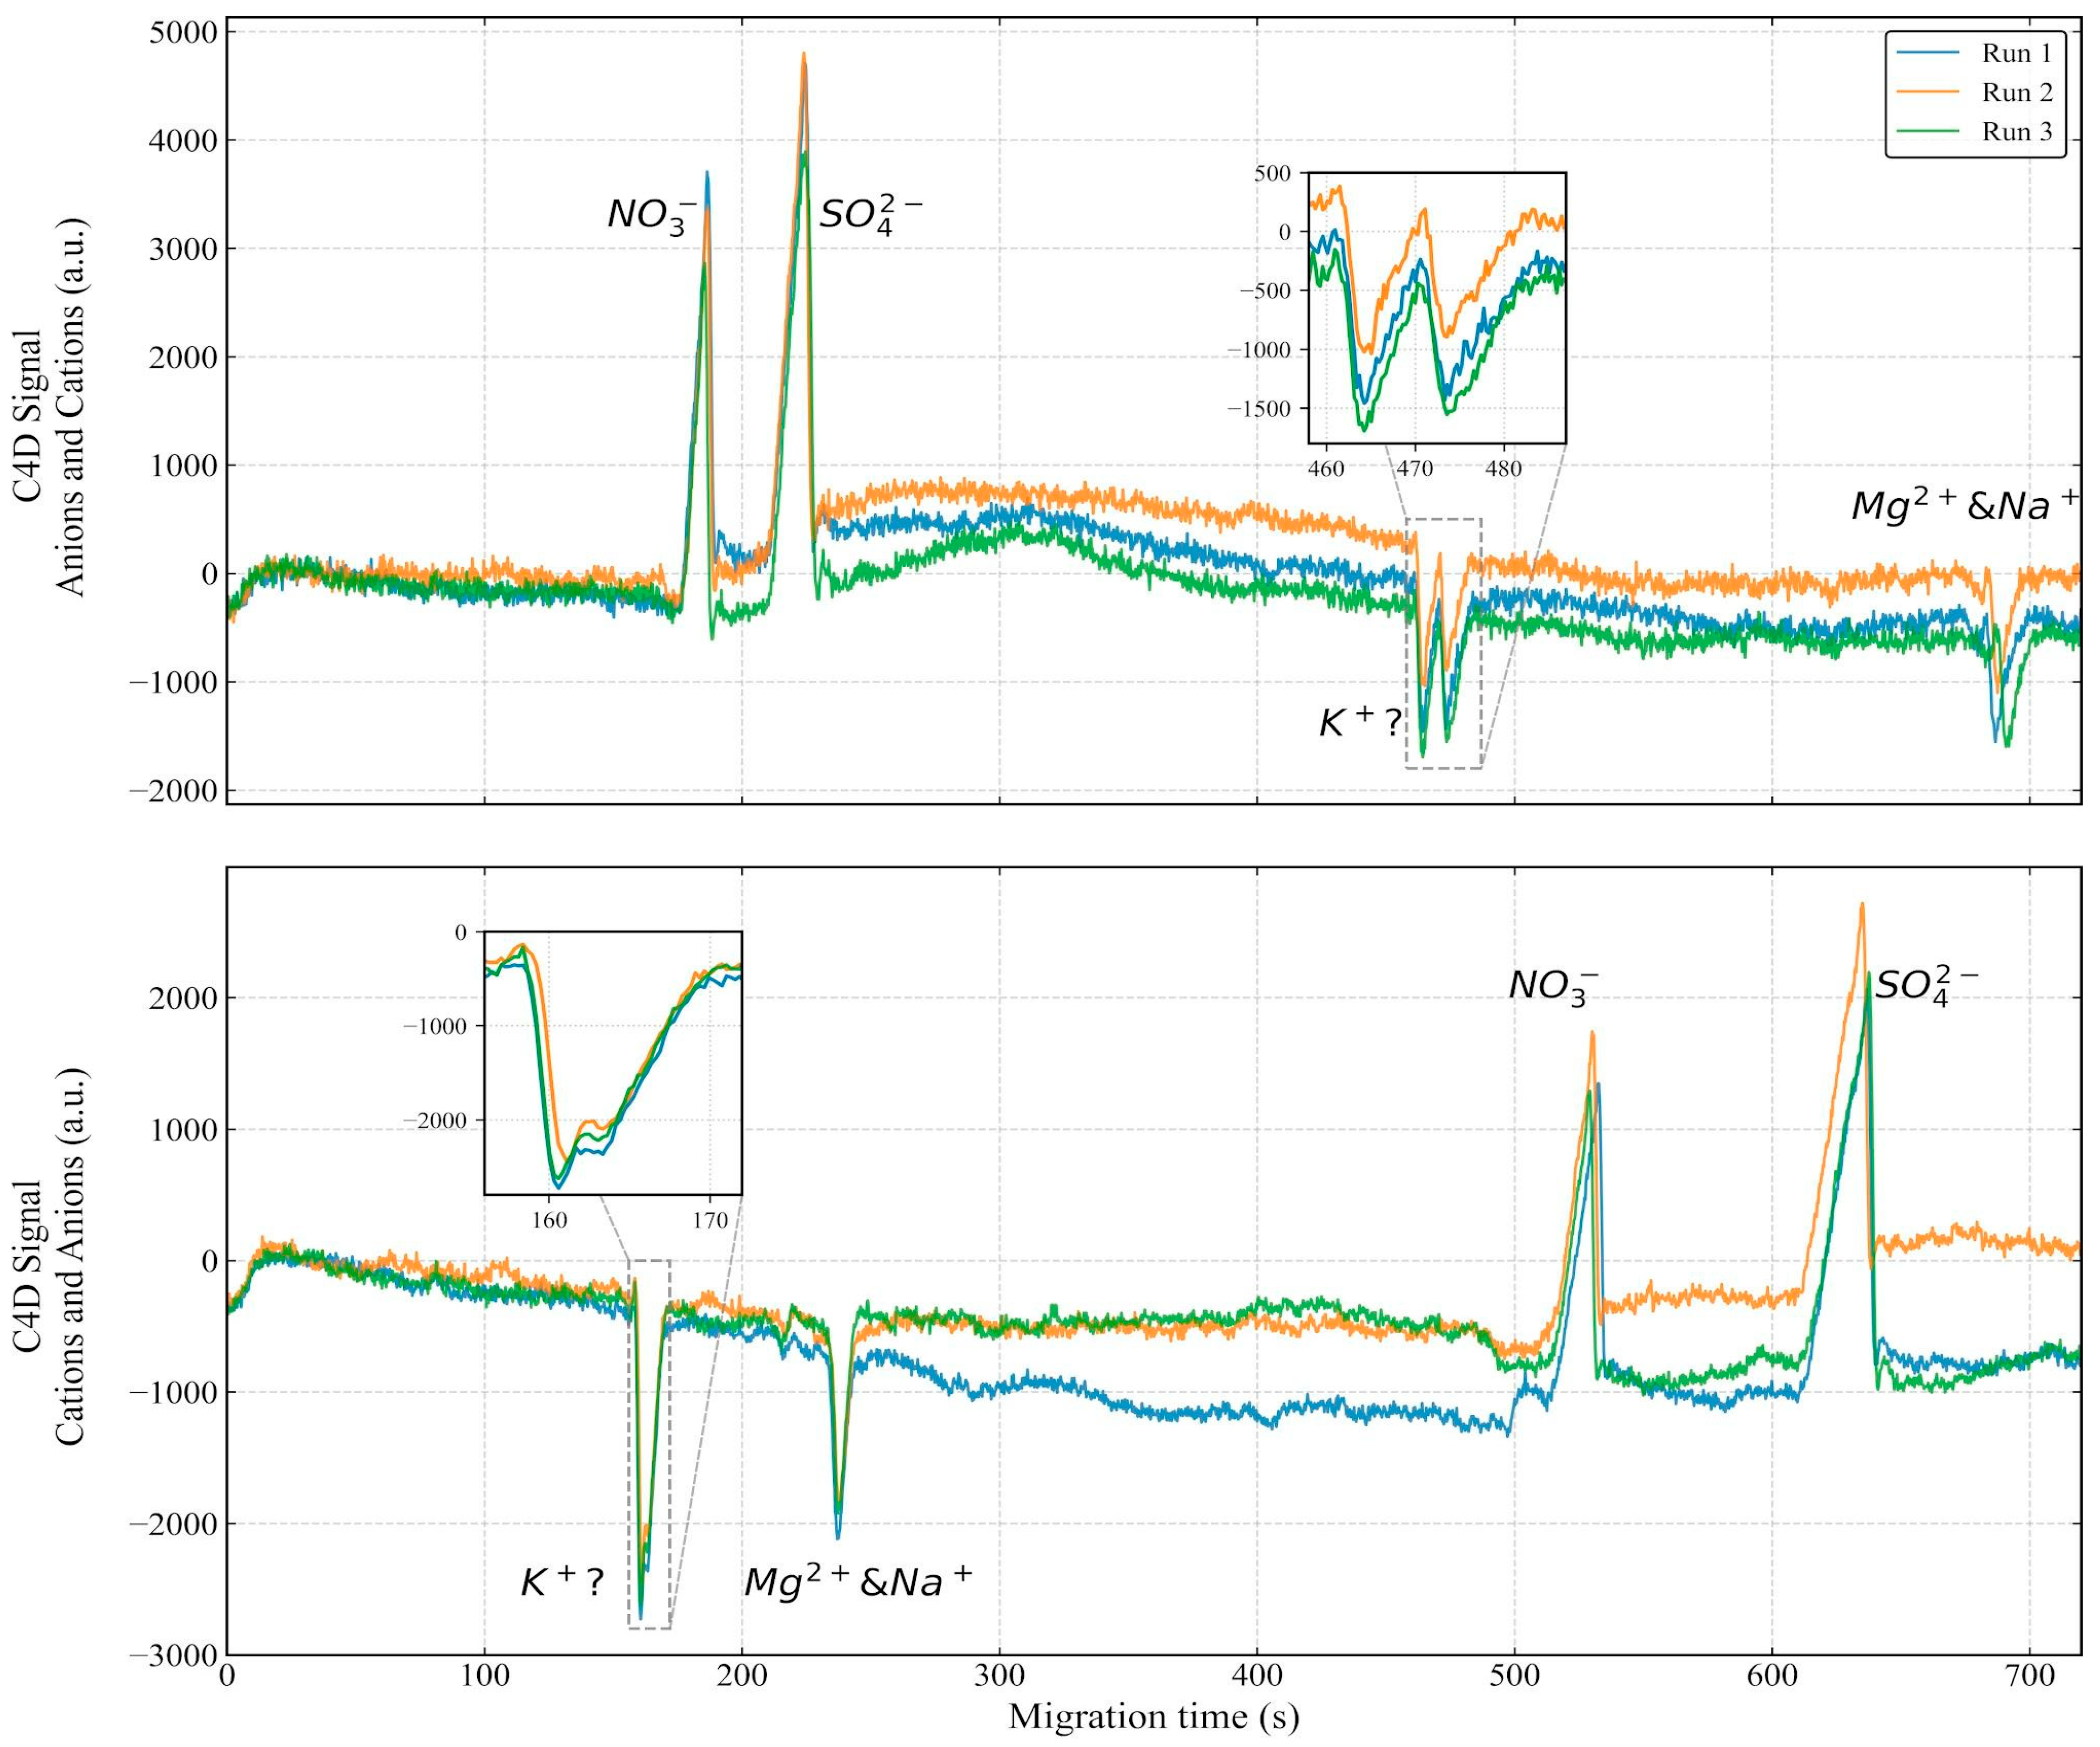

Disclaimer/Publisher’s Note: The statements, opinions and data contained in all publications are solely those of the individual author(s) and contributor(s) and not of MDPI and/or the editor(s). MDPI and/or the editor(s) disclaim responsibility for any injury to people or property resulting from any ideas, methods, instructions or products referred to in the content. |
© 2026 by the authors. Licensee MDPI, Basel, Switzerland. This article is an open access article distributed under the terms and conditions of the Creative Commons Attribution (CC BY) license.