


Abstract
Long-read sequencing technologies, particularly those developed by Oxford Nanopore Technologies (ONT), have transformed genome sequencing by enabling high-resolution analysis of complex microbial communities. Among ONT devices, the MinION remains affordable and scalable for low-resource settings. However, its limited onboard computing power constrains high-accuracy basecalling and limits its ability to address inherent sequencing errors effectively. To overcome these constraints, we assembled a streamlined in-house workflow that integrates at least five MinION devices with a GPU-powered workstation running Ubuntu 20 and MinKNOW. Rather than a new sequencing platform, this “home-made GridION” represents a practical integration of existing ONT devices with dedicated computing resources. At its core is a live basecalling pipeline capable of handling both FAST5 and POD5 file formats. The system supports high-throughput basecalling using Guppy on FAST5 files as well as Dorado on POD5 files, ensuring compatibility with both legacy and current ONT data standards. File monitoring is automated via inotifywait, enabling immediate detection of new files, real-time basecalling, and organized output of FASTQ batches. Beyond basecalling, we implemented an automated downstream pipeline for metagenomic analysis, enabling taxonomic profiling and detection of antimicrobial resistance genes (ARG). Tested on 10 hospital wastewater samples, the workflow generated at least 500,000 reads per sample within six hours, which were analysed for antimicrobial resistance gene abundance. This demonstrates its potential as an open, scalable hardware/software platform that extends the utility of MinION sequencing for microbial genomics in resource-limited environments. The setup can channel as many MinIONs as available USB ports, with a ratio of 1 MK1D for 1 TB of storage capacity on the associated computer.
1. Introduction
The rapid identification and characterization of microbial communities are essential for addressing public health challenges, including the growing threat of antimicrobial resistance (AMR) [1,2]. DNA sequencing is increasingly replacing conventional culture-dependent methods in clinical research, especially for detecting novel pathogens and unculturable microorganisms [3,4,5,6]. Among sequencing methodologies, ONT employs single-stranded DNA molecules passing through nanopores on a synthetic membrane, enabling the conversion of the raw electrical signals into digital data that reflects a nucleotide base in DNA [7,8,9]. While ONT long-read technologies offer unprecedented resolution for metagenomic studies, the widely used MinION device is inherently limited by its lack of onboard computational resources for efficient, high-accuracy basecalling [10,11]. In addition, the generated data requires comprehensive downstream analysis, which often demands advanced bioinformatics expertise [12]. These constraints hinder the MinION’s full potential in generating high-quality, actionable data for complex microbial samples, especially in resource-limited settings.
To overcome these barriers, we developed a streamlined workflow that maximizes the capabilities of multiple MinION devices (MK1B/MK1D, Oxford Nanopore Technology, Oxford, England). Our solution integrates two key components: a live basecalling system powered by GPU computing for real-time, high accuracy basecalling, and an automated downstream analysis pipeline that simplifies complex metagenomic data processing. This dual approach bridges the gap for users who may lack both the computational resources needed for high accuracy basecalling and the bioinformatics expertise required for detailed metagenomic analysis.
We validated this complete workflow using hospital wastewater samples, which are critical reservoirs of pathogenic bacteria and ARGs [13,14]. By applying our approach, we effectively monitored microbial dynamics and assessed the persistence of ARGs in a setting with significant public health implications. The setup has also been successfully used to sequence over 200 whole bacterial genomes, including Escherichia coli, Acinetobacter baumannii, and Aeromonas dhakensis, as reported in our previous publications [15,16,17].
By automating live basecalling with a GPU-powered computing system and integrating a comprehensive analysis pipeline, our workflow offers a high-accuracy, real-time sequencing solution that improves the capabilities of a standard MinION setup. This enhanced system enables rapid identification of critical microbial taxa and ARGs, paving the way for improved pathogen surveillance and environmental monitoring, especially in resource-limited settings where high-end sequencing platforms may not be accessible.
2. Design
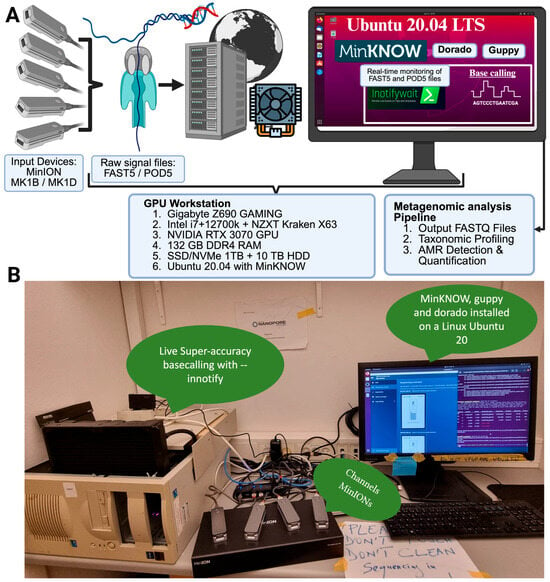
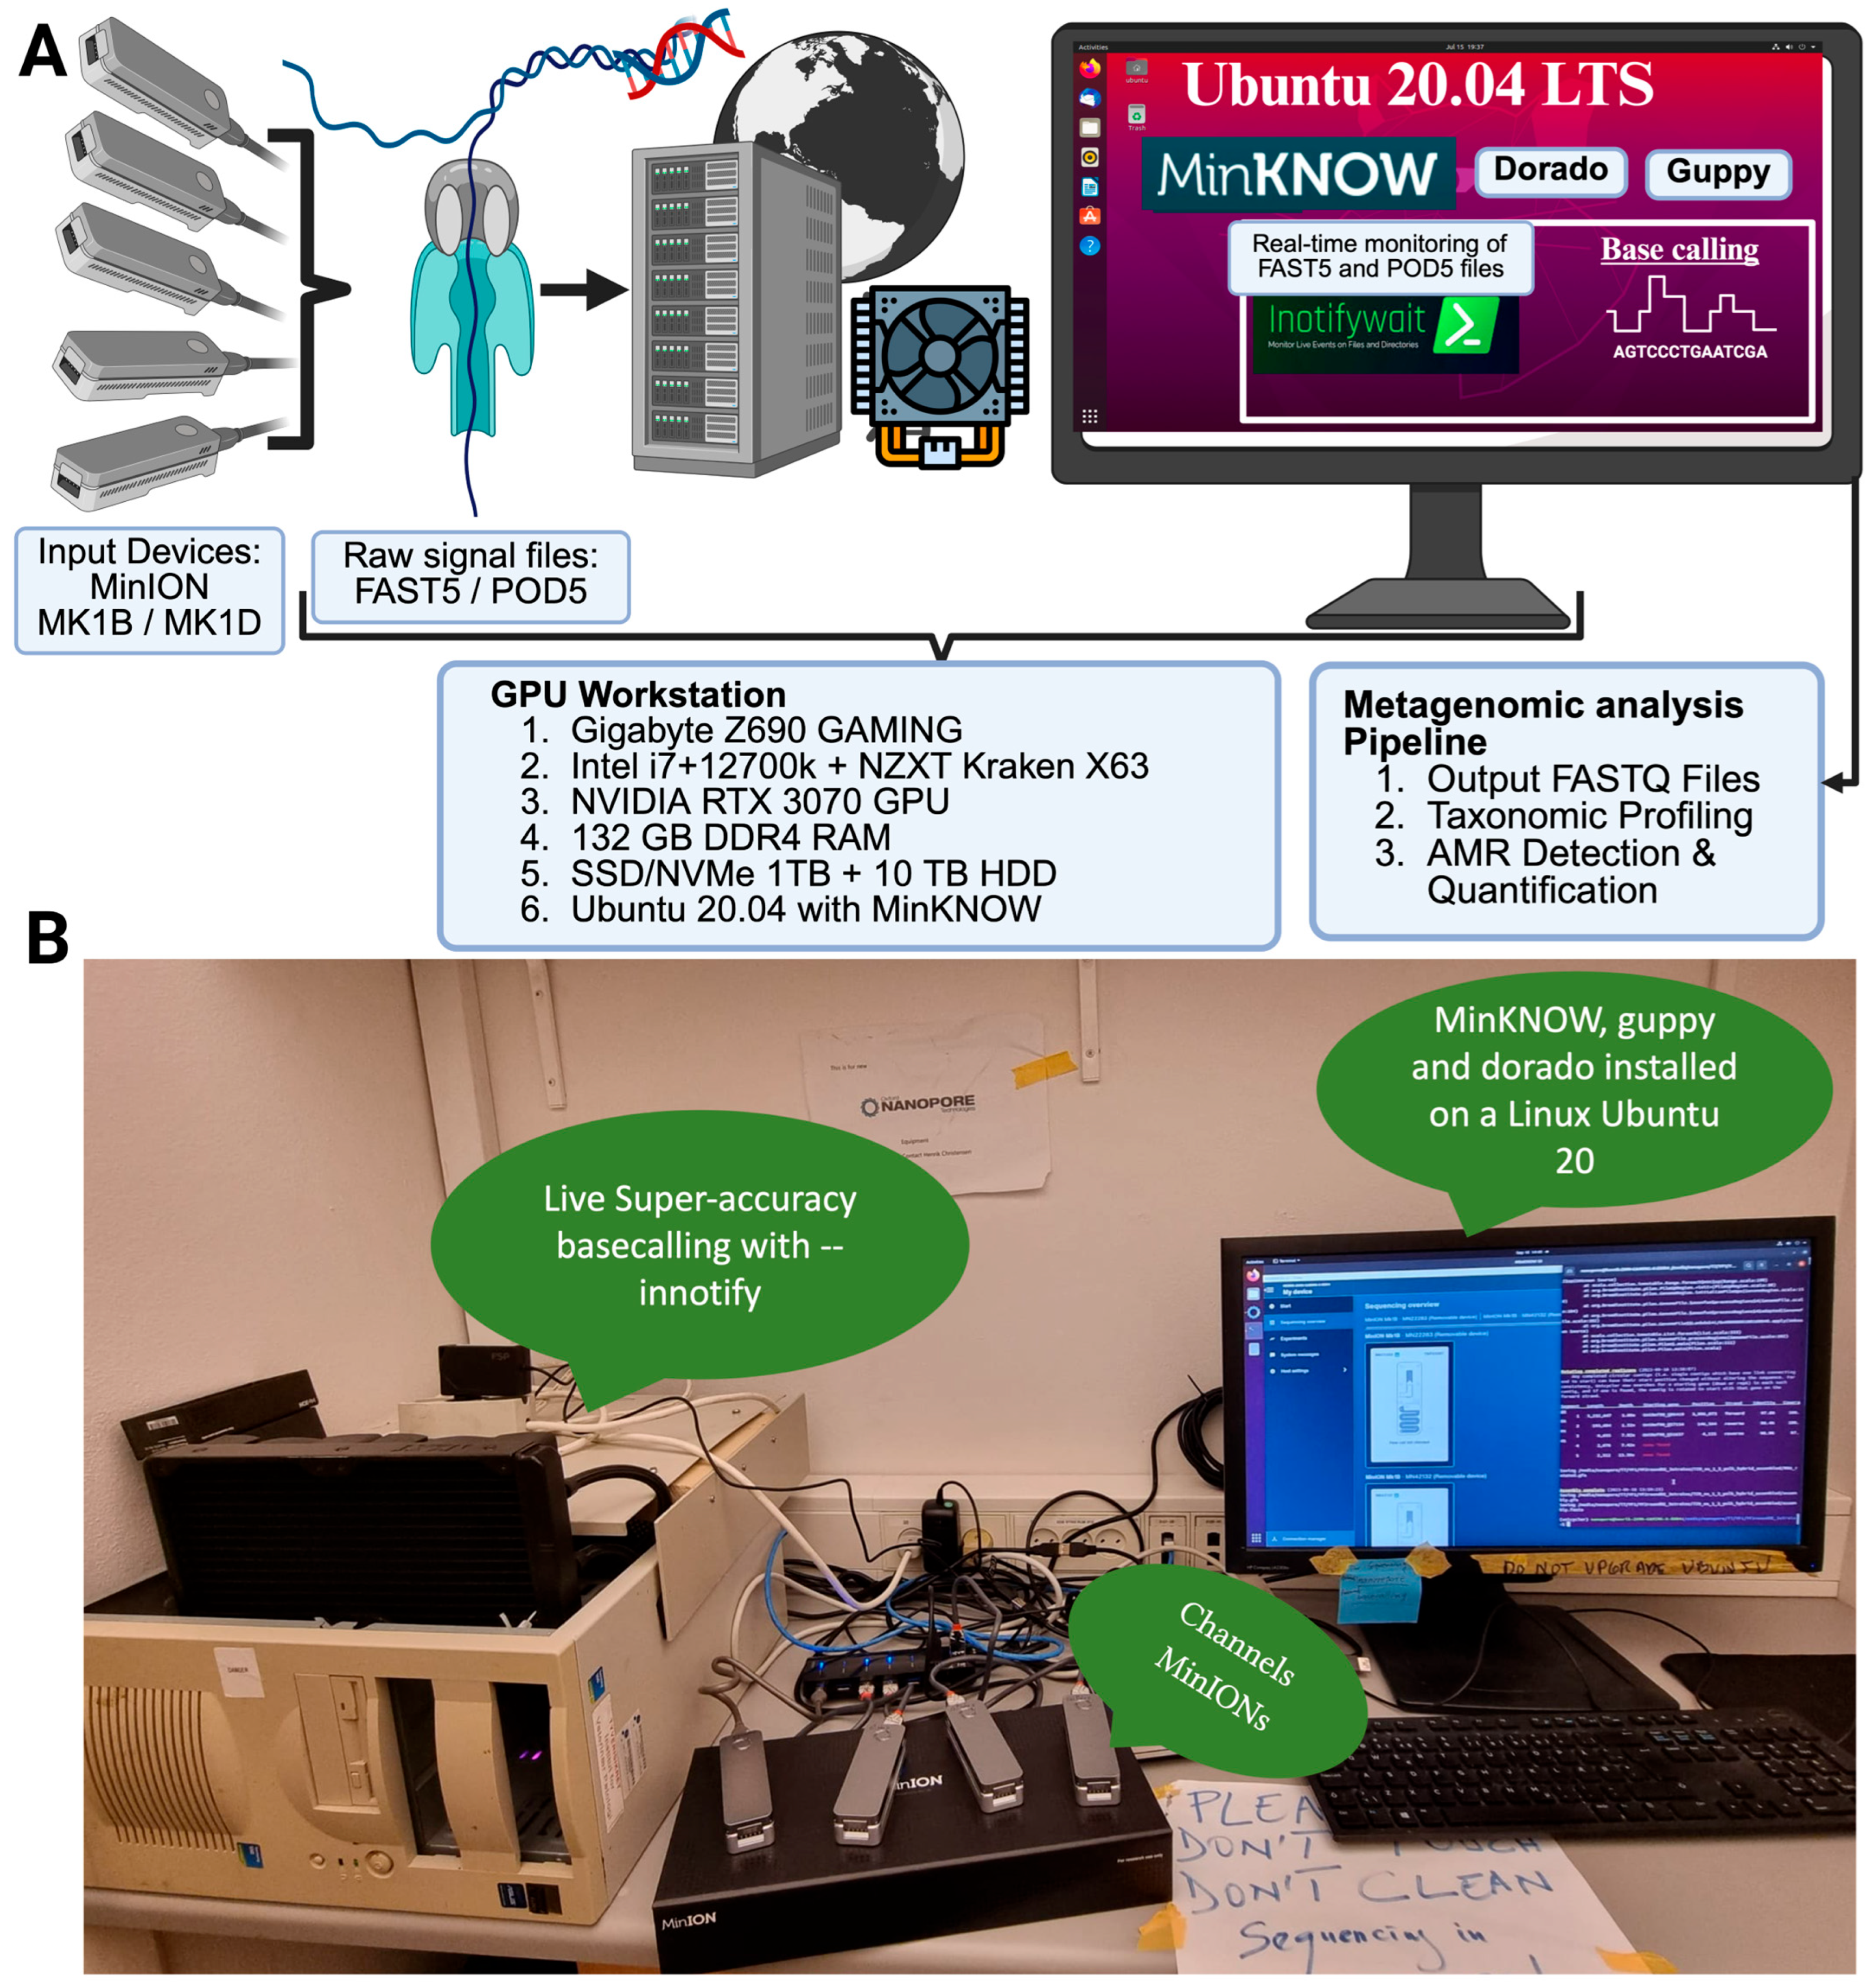
The custom GridION-like system consists of a GPU-powered workstation connected to up to five MinION devices, configured for rapid data processing and live basecalling. The workstation runs Ubuntu 20.04 LTS (Canonical Ltd., London, UK) and integrates MinKNOW (Oxford Nanopore Technologies Ltd., Oxford, UK) for device control with Guppy (FAST5) and Dorado (POD5) basecallers (Oxford Nanopore Technologies Ltd., Oxford, UK). Raw signal files generated by the MinIONs are streamed directly to the workstation, where real-time monitoring with inotifywait triggers automated basecalling (Figure 1). The resulting FASTQ outputs are then passed into a folder that is later used for downstream analysis.
Figure 1.
Overview of the customized GridION for live sequencing and basecalling setup. (A) Schematic representation of the hardware and software workflow. Raw electrical signal data from multiple MinION devices (Mk1B/Mk1D) are streamed as FAST5 or POD5 files to a GPU workstation. Real-time monitoring of incoming files is achieved with inotifywait, triggering live basecalling with Guppy (FAST5) or Dorado (POD5). Basecalled FASTQ files are subsequently used for taxonomic profiling and antimicrobial resistance (AMR) detection. (B) Photograph of the laboratory implementation corresponding to the schematic in panel (A), showing the workstation connected to multiple MinION devices via a USB hub.
During live sequencing, each MinION device writes raw signal files (FAST5 or POD5) to a device-specific input directory (one directory per flowcell). Automated basecalling scripts monitor these directories and generate basecalled FASTQ files into a centralized output structure organized by run ID and sample barcode. This standardized folder layout ensures traceability of raw data, basecalled reads, and downstream analysis outputs.
3. Build Instructions
The complete bill of materials is provided in Table 1, detailing all hardware and software components required for assembly. This workstation was built using standard PC assembly procedures to ensure compatibility and stability under continuous GPU load. A Gigabyte Z690 (GIGABYTE Technology Co., Ltd., New Taipei City, Taiwan). motherboard was mounted in a mid-tower ATX case, hosting an Intel Core i7-12700K processor with liquid cooling, 128 GB DDR4 RAM, and an ASUS Dual RTX 3070 GPU powered by a Corsair RM850e supply. High-speed data handling was achieved with three Kingston NVMe SSDs for temporary storage and a 10 TB Seagate HDD for long-term archiving.
Table 1.
Bill of Materials (Key Hardware Specifications of Custom-Built GridION-like workstation).
Peripheral components included a 27″ IPS monitor, keyboard and mouse, and a powered USB hub for connecting up to five MinION devices via certified USB 3.0 cables. After assembly, Ubuntu 20.04 LTS was installed, followed by MinKNOW for device control, Guppy for FAST5 basecalling, Dorado for POD5 basecalling, and inotify-tools for file monitoring. The system was validated under sustained sequencing runs to confirm stable GPU performance and throughput. The total workstation cost was approximately €2800–3000, excluding MinION devices.
This setup does not represent a new sequencing device but a practical integration of commercially available components that maximizes the performance of existing MinION systems, which lack onboard computing resources for high-accuracy basecalling.
4. Operating Instructions
To run the system, one or more (five in this context) MinION devices are connected via a powered USB hub and recognized through MinKNOW. Sequencing runs are initiated in MinKNOW using ONT flowcells and kits, generating raw FAST5 or POD5 files in real time. Automated basecalling is triggered by the custom live_basecaling-gil.sh script, which uses inotifywait to detect new files and route them to the appropriate engine: Guppy for FAST5 or Dorado for POD5. Basecalled reads are automatically compressed and saved into organized pass_fastq directories.
The workflow uses a fixed directory hierarchy (Table 2):
Table 2.
Directory Hierarchy.
This structure is automatically generated by the live basecalling and downstream scripts.
The resulting FASTQ files can be directly fed into the downstream analysis pipeline for demultiplexing, quality control, taxonomic profiling, and ARG detection. GPU utilization and system stability are monitored through nvidia-smi, while regular housekeeping (e.g., dust filter cleaning, cable management) ensures consistent long-term performance. This operating workflow transforms the standard MinION into a GridION-like configuration, providing real-time high-accuracy sequencing and analysis without specialized infrastructure.
5. Validation
5.1. Validation Methods
5.1.1. Sample Collection and DNA Extraction
We selected ten influent (6) and effluent (4) hospital wastewater samples initially collected from two tertiary hospitals in Vietnam as part of the I-CRECT project (https://www.jpiamr.eu/projects/i-crect/) (accessed on 30 September 2024) to test the performance of the system for metagenomic sequencing. Total genomic DNA was extracted using the A&A Biotechnology Kit (Gdańsk, Poland), following the manufacturer’s protocol to ensure less fragmented high-quality DNA suitable for sequencing.
5.1.2. Library Preparation and Sequencing
Extracted DNA was prepared for sequencing with the ONT’s rapid sequencing kit SQK-RBK114-24 (Oxford Nanopore Technologies Ltd., Oxford, UK), allowing for barcoding and multiplexing of samples. The library preparation lasted approximately 25 to 30 min, followed by loading onto four MinION devices with 2 to 3 samples per flowcell (R10.4.1) per device to allow for higher coverage of the whole community of metagenomes in a short time. The ONT’s standalone GUI software, MinKNOW v6.8.11, was used to monitor and control sequencing runs.
5.1.3. Real-Time Basecalling
For this validation, sequencing data were generated in the FAST5 format and processed with Guppy v6.3.8 in super-accuracy mode. A custom script based on inotifywait (https://linux.die.net/man/1/inotifywait) (accessed on 30 September 2024) automated live processing of incoming FAST5 files, taking advantage of GPU resources (CUDA) for faster throughput. Basecalled outputs were organized into batches and saved to designated directories for subsequent analysis, allowing each run to complete within 7 h (see Supplementary Materials). While the system also supports POD5 input and Dorado basecalling, these were not applied in the present experiments. Basecalling was performed using Guppy v6.3.8 in super-accuracy mode with GPU acceleration (--device cuda:all, --config dna_r10.4.1_e8.2_sup.cfg, --compress_fastq; default chunk and batch sizes). Incoming FAST5 files were detected through continuous directory monitoring using inotifywait.
5.1.4. Overview of the Analysis Pipeline
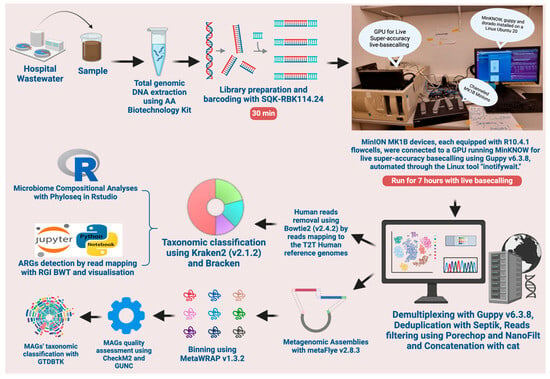
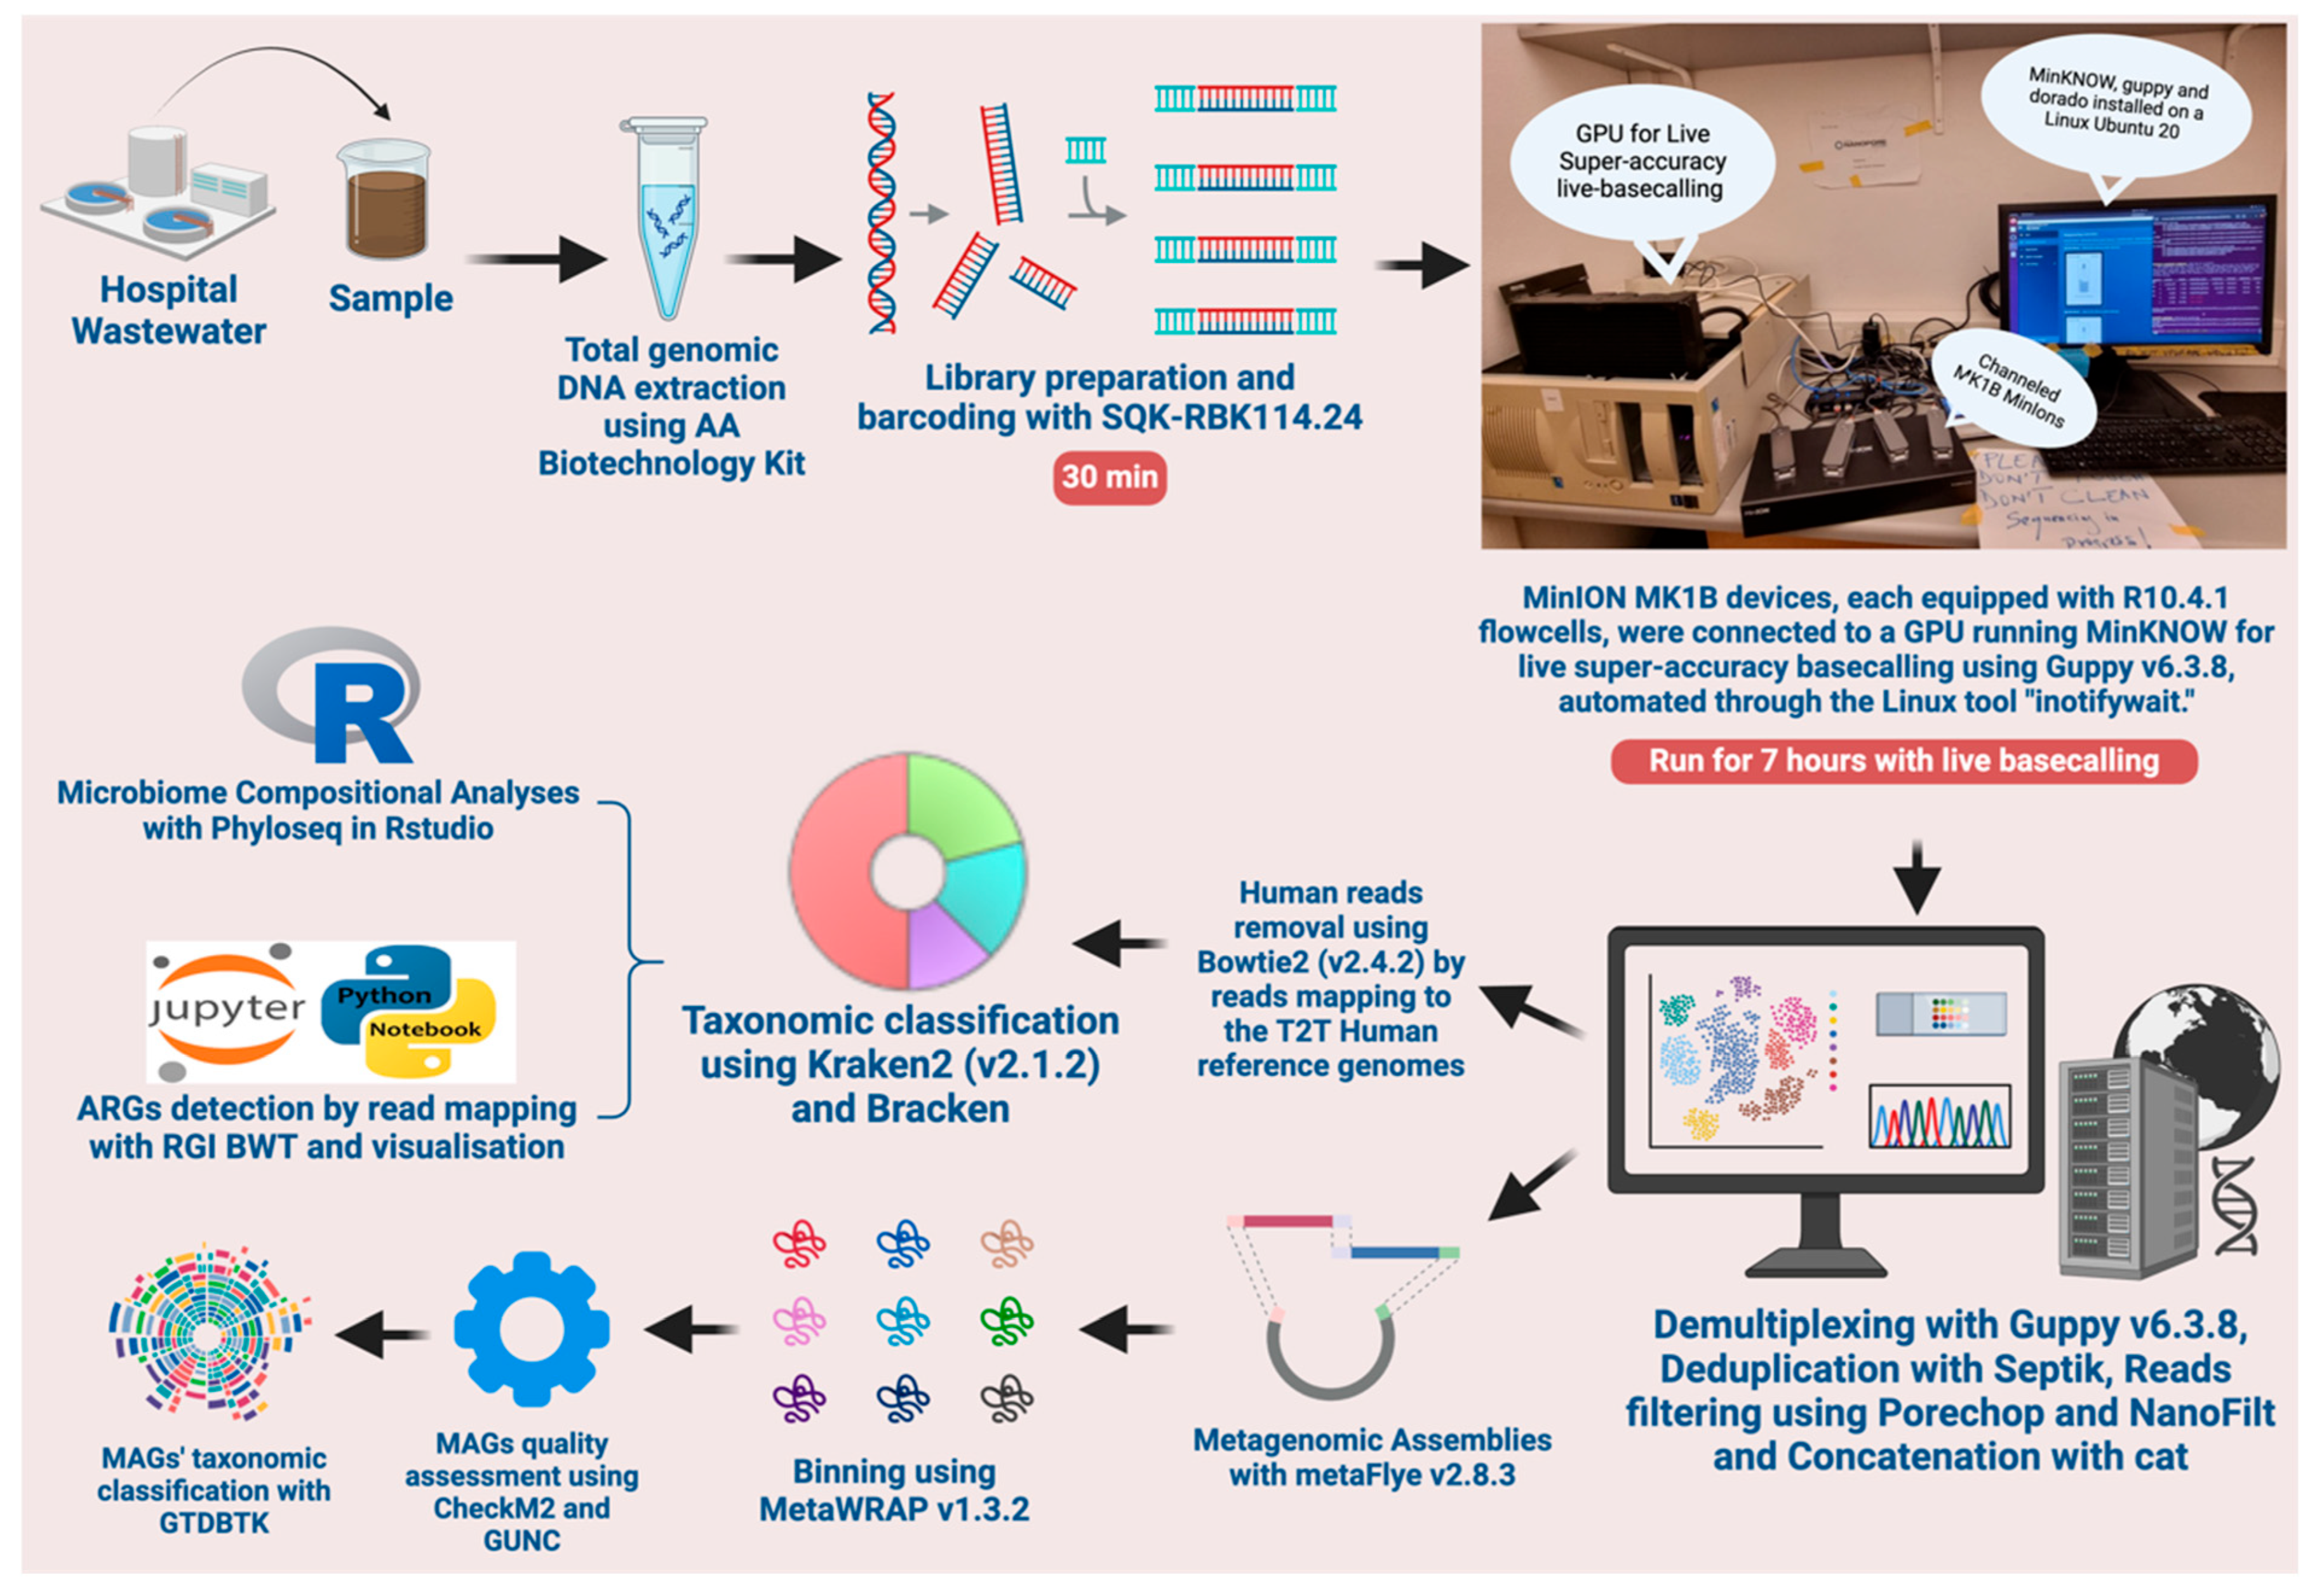
We provided the complete analysis in a pipeline that covers demultiplexing, quality control, host genome removal (like human or animal), taxonomic classification, abundance estimation, and antimicrobial resistance gene detection (Figure 2). The analysis is completed using both Rv4.3.1 and Jupyter v1.1.1 Notebook for comprehensive data visualization. The pipeline can either be run step by step as indicated in the repository or in one command using the master script provided.
Figure 2.
Overview of the workflow utilizing multi-channel MinIONs for rapid, high-resolution long read metagenomic sequencing.
5.1.5. Data Processing and Taxonomic Classification and ARG Mapping
Post-basecalling, data were demultiplexed using Guppy (v6.3.8) [18]. SeqKit (v.2.9.0) was used to deduplicate reads [19], and Porechop (v.0.2.4) [20] and NanoFilt [21] were applied to filter reads with a minimum mean quality score of Q ≥ 10. Taxonomic classification was performed with Kraken2 (v2.1.2) [22] and then converted to relative abundance at species level using Bracken to identify microbial taxa in the wastewater samples. This high-resolution classification enabled a comprehensive overview of the microbial community and facilitated the detection of key taxa. ARGs were identified using the read mapping tool RGI BWT of the CARD antimicrobial resistance gene database [23]. ARG required at least 10 mapped reads and ≥20% reference coverage to confirm gene presence.
5.1.6. Microbiome Composition and Functional Analysis
All downstream analysis and visualization were performed using R (v4.3.1) and python in Jupyter v1.1.1 Notebook. Microbial community composition and ARG profiles were analyzed using the Phyloseq package in RStudio v4.3.1. Custom filtering thresholds (a minimum of 10 mapped reads with at least 20% coverage to the reference length) were applied to ensure accuracy in characterizing resistome dynamics across wastewater samples from two hospital sites. All filtering thresholds, normalization steps, and visualization parameters are explicitly defined in the accompanying R scripts and Jupyter v1.1.1 notebooks provided as Supplementary Materials.
5.1.7. Alpha and Beta Diversity
Alpha diversity metrics, specifically the Shannon diversity index, were calculated for both raw and treated samples across sites (TBH and VNCH) to assess potential reductions in microbial diversity following treatment. Beta diversity was evaluated using Bray–Curtis dissimilarity and visualized through principal coordinate analysis (PCoA) to explore differences in microbial diversity between raw and treated samples and across hospitals, highlighting site-specific and treatment-related compositional shifts [24].
5.1.8. Taxonomic Composition and Relative Abundance
At the kingdom level, stacked bar charts and further analysis at the species level focused on key taxa within selected phyla, highlighting differences in species composition between raw and treated samples and across sites and faceted by hospitals.
5.1.9. Overall ARG Mapping
ARG profiles were initially characterized broadly, with a focus on total ARG abundance across samples. A threshold of 10 mapped reads and 20% reference coverage was applied to confirm ARG presence. Total mapped reads to drug classes in raw and treated samples were visualized for each hospital, highlighting differences in resistance gene distribution by site and sample type.
5.1.10. Differential Abundance and Gene Family Presence
Differential abundance analysis was performed using DESeq2 to identify taxa with significant shifts in abundance related to treatment processes or hospital-specific factors. Volcano plots were built to highlight these taxa, emphasizing enrichment or depletion in treated versus raw samples.
5.2. Results
5.2.1. Description of the Custom-Built System for Accurate Basecalling of MinION Data
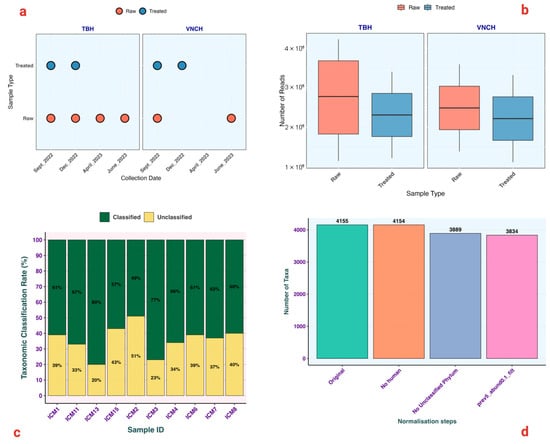
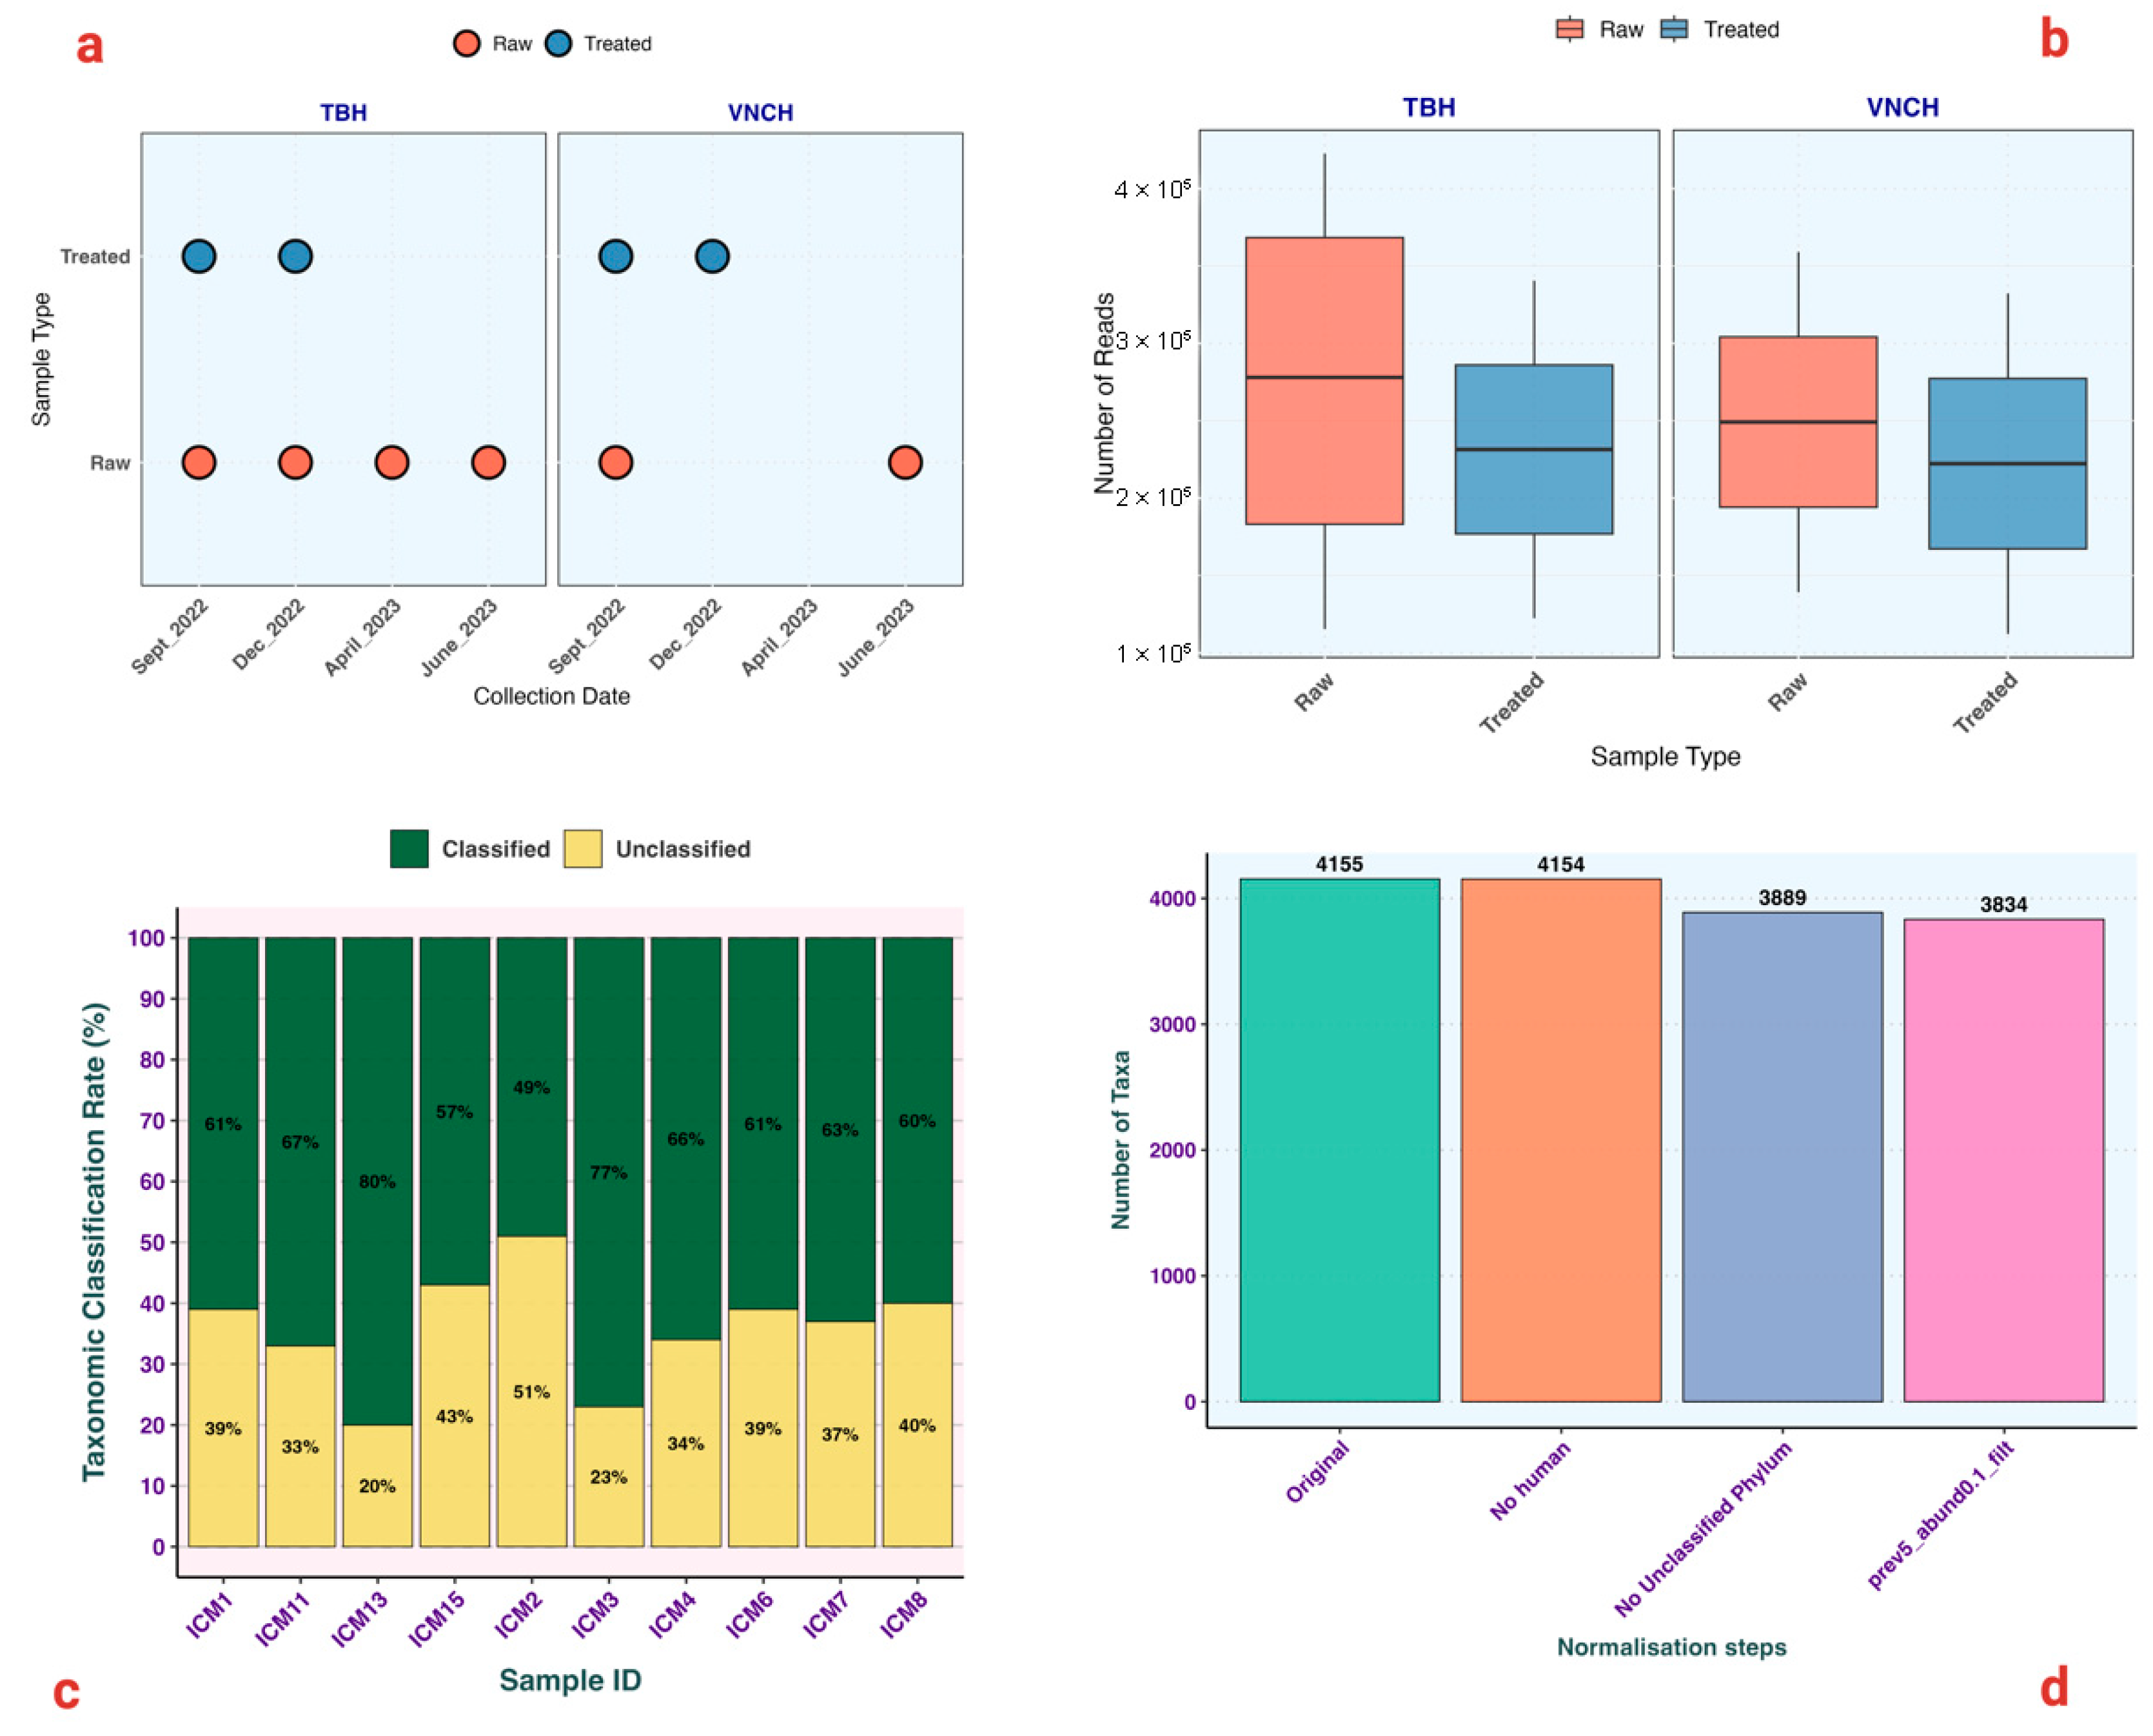
To validate the system, we applied it to shotgun metagenomic sequencing of ten hospital wastewater samples (six raw influents and four treated effluents), processed with FAST5 input and real-time Guppy basecalling (Figure 3a). Sequencing runs produced at least 500,000 reads per sample within seven hours, facilitated by GPU-accelerated Guppy basecalling in super-accuracy mode (Figure 3b). The data quality was robust, with high classification rates across samples (Figure 3c), underscoring the efficiency of the real-time super-accuracy basecalling system. The final phyloseq object used for downstream analysis contained 3834 taxa (Figure 3d), retained after sequential normalization and filtering steps requiring a minimum relative abundance of 0.1% and prevalence in at least 5% of samples.
Figure 3.
Overview of Sample Distribution, Read Counts, Taxonomic Classification, and Taxa normalization. (a): This panel shows the collection schedule and distribution of samples collected over time from two sites, TBH and VNCH. Red and blue circles represent raw and treated samples, respectively, across different collection dates, providing an overview of sampling balance across locations and treatments. (b): Box plots present the sequencing read counts for samples from TBH and VNCH, comparing treated (blue) and untreated (red) samples. The distribution highlights differences in sequencing depth between treatment types and across the two hospitals. (c): Stacked bar charts show the proportion of classified (green) versus unclassified (yellow) reads for each sample. (d): This panel depicts the total number of taxa remaining in the Phyloseq object after successive filtration steps. Ultimately the threshold of (0.1% abundance and 5% prevalence) was set as the last step of normalization for a taxon to be included in the final analysis.
5.2.2. Taxonomic Classification, Microbiome Composition, Alpha and Beta Diversity
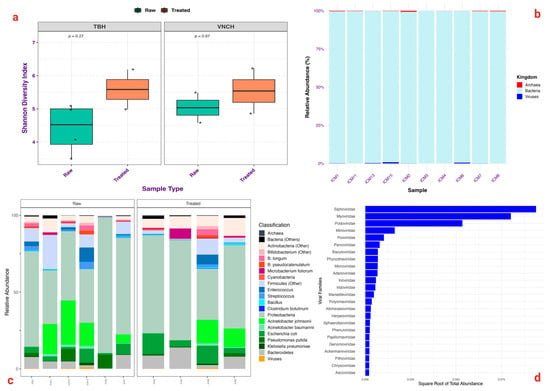
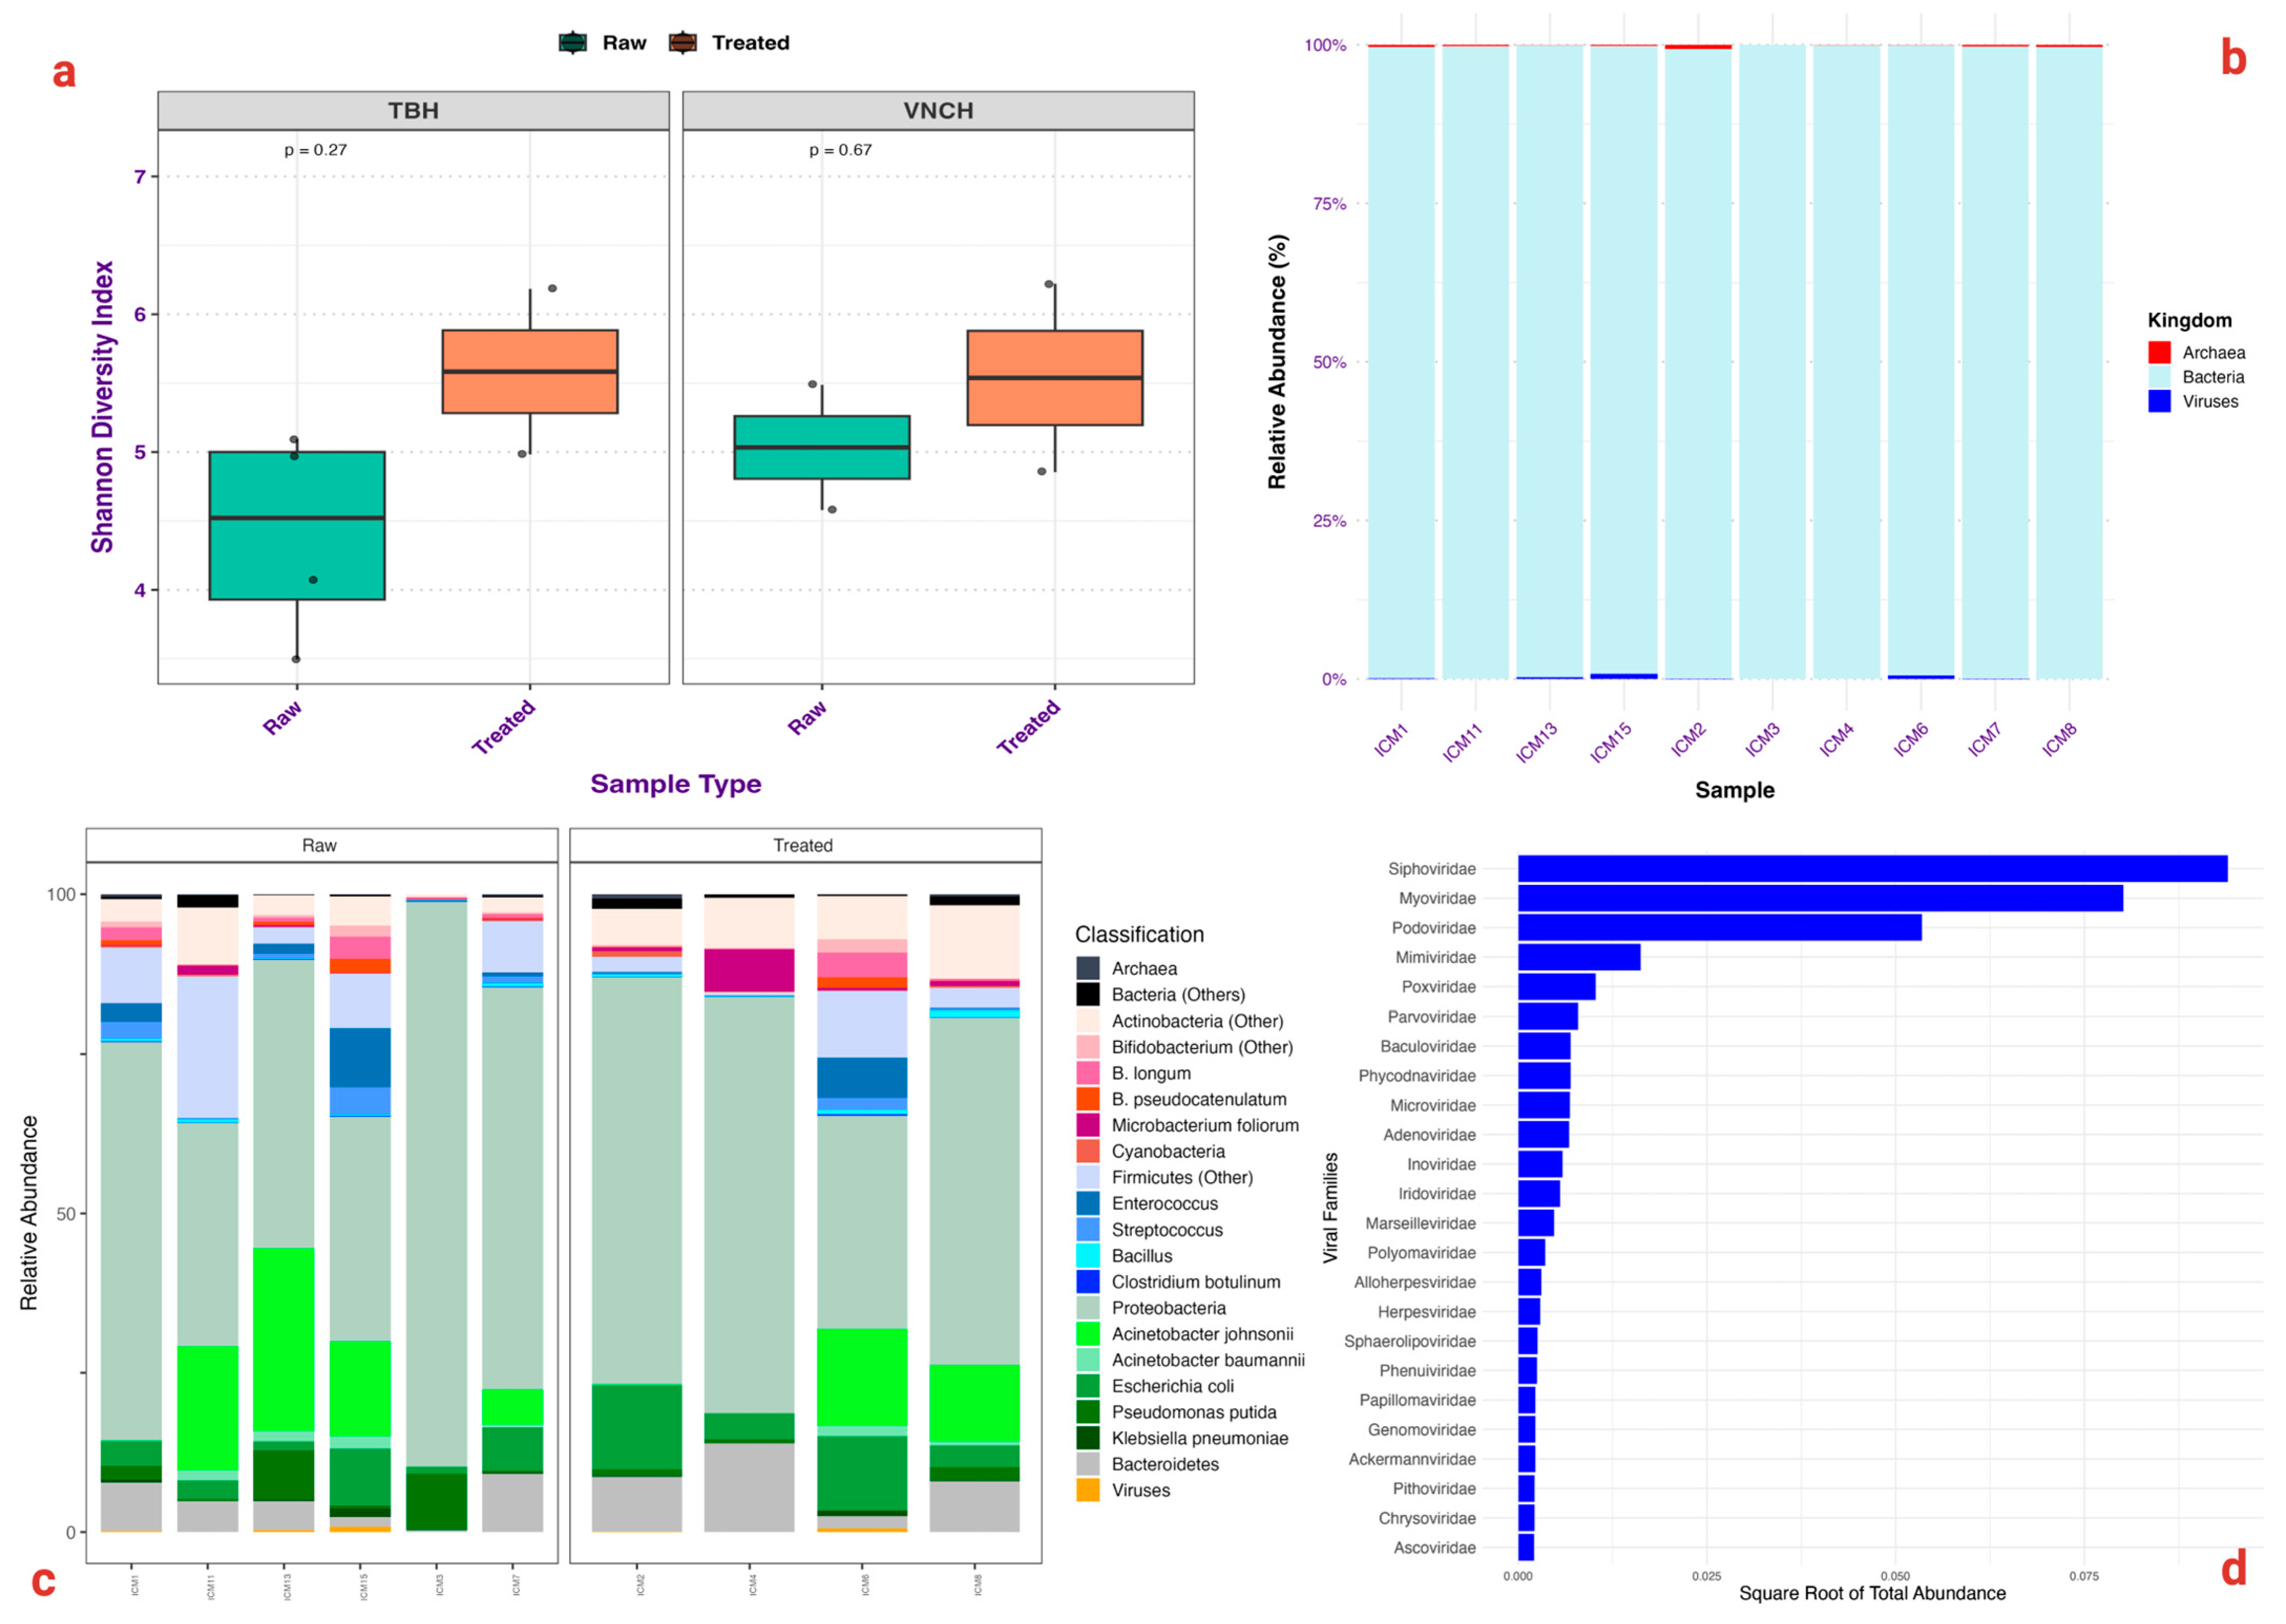
Taxonomic profiling revealed distinct compositional shifts between raw and treated samples, consistent with expected microbial load reductions following treatment (Figure 4a). Shannon diversity indices showed significantly higher diversity in treated samples, likely reflecting the proliferation of aerobic bacteria during treatment. Bacteria dominated across all samples, with minor contributions from archaea and viruses (Figure 4b). At the species level, pathogenic taxa such as Escherichia coli and Acinetobacter baumannii were markedly reduced in treated samples (Figure 4c). Viral abundance was generally low, but diverse DNA phages (Siphoviridae, Myoviridae, Podoviridae) and eukaryotic DNA viruses (e.g., Poxviridae, Adenoviridae, Herpesviridae, Papillomaviridae) were detected (Figure 4d), underscoring the broad detection potential of the workflow.
Figure 4.
Microbial Diversity and Composition at Kingdom and Species Levels in Wastewater Samples. (a): Box plots illustrating the Shannon diversity index for raw and treated samples from TBH and VNCH. (b): Stacked bar chart showing the relative abundance of major kingdoms (Bacteria, Archaea, and Virus) across all samples. No Fungi was detected. The plot provides an overview of microbial composition at the highest taxonomic level, with bacteria as the dominant group across both treated and untreated samples. (c): Stacked bar plots displaying the relative abundance of key microbial species within specific phyla of interest, organized by sample type (raw or treated). This visualization highlights the species composition and the shifts that occur due to treatment, with prominent species in each phylum color-coded for clarity. (d): Bar plot showing the distribution of key viral families detected (at low abundance) in the samples, dominated by phages (Siphoviridae, Myoviridae, and Podoviridae) and eukaryotic DNA viruses such as Mimiviridae, Poxviridae, Adenoviridae, Herpesviridae, and Papillomaviridae.
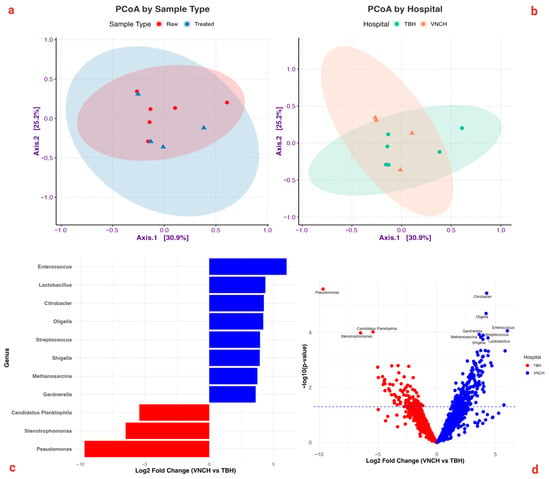
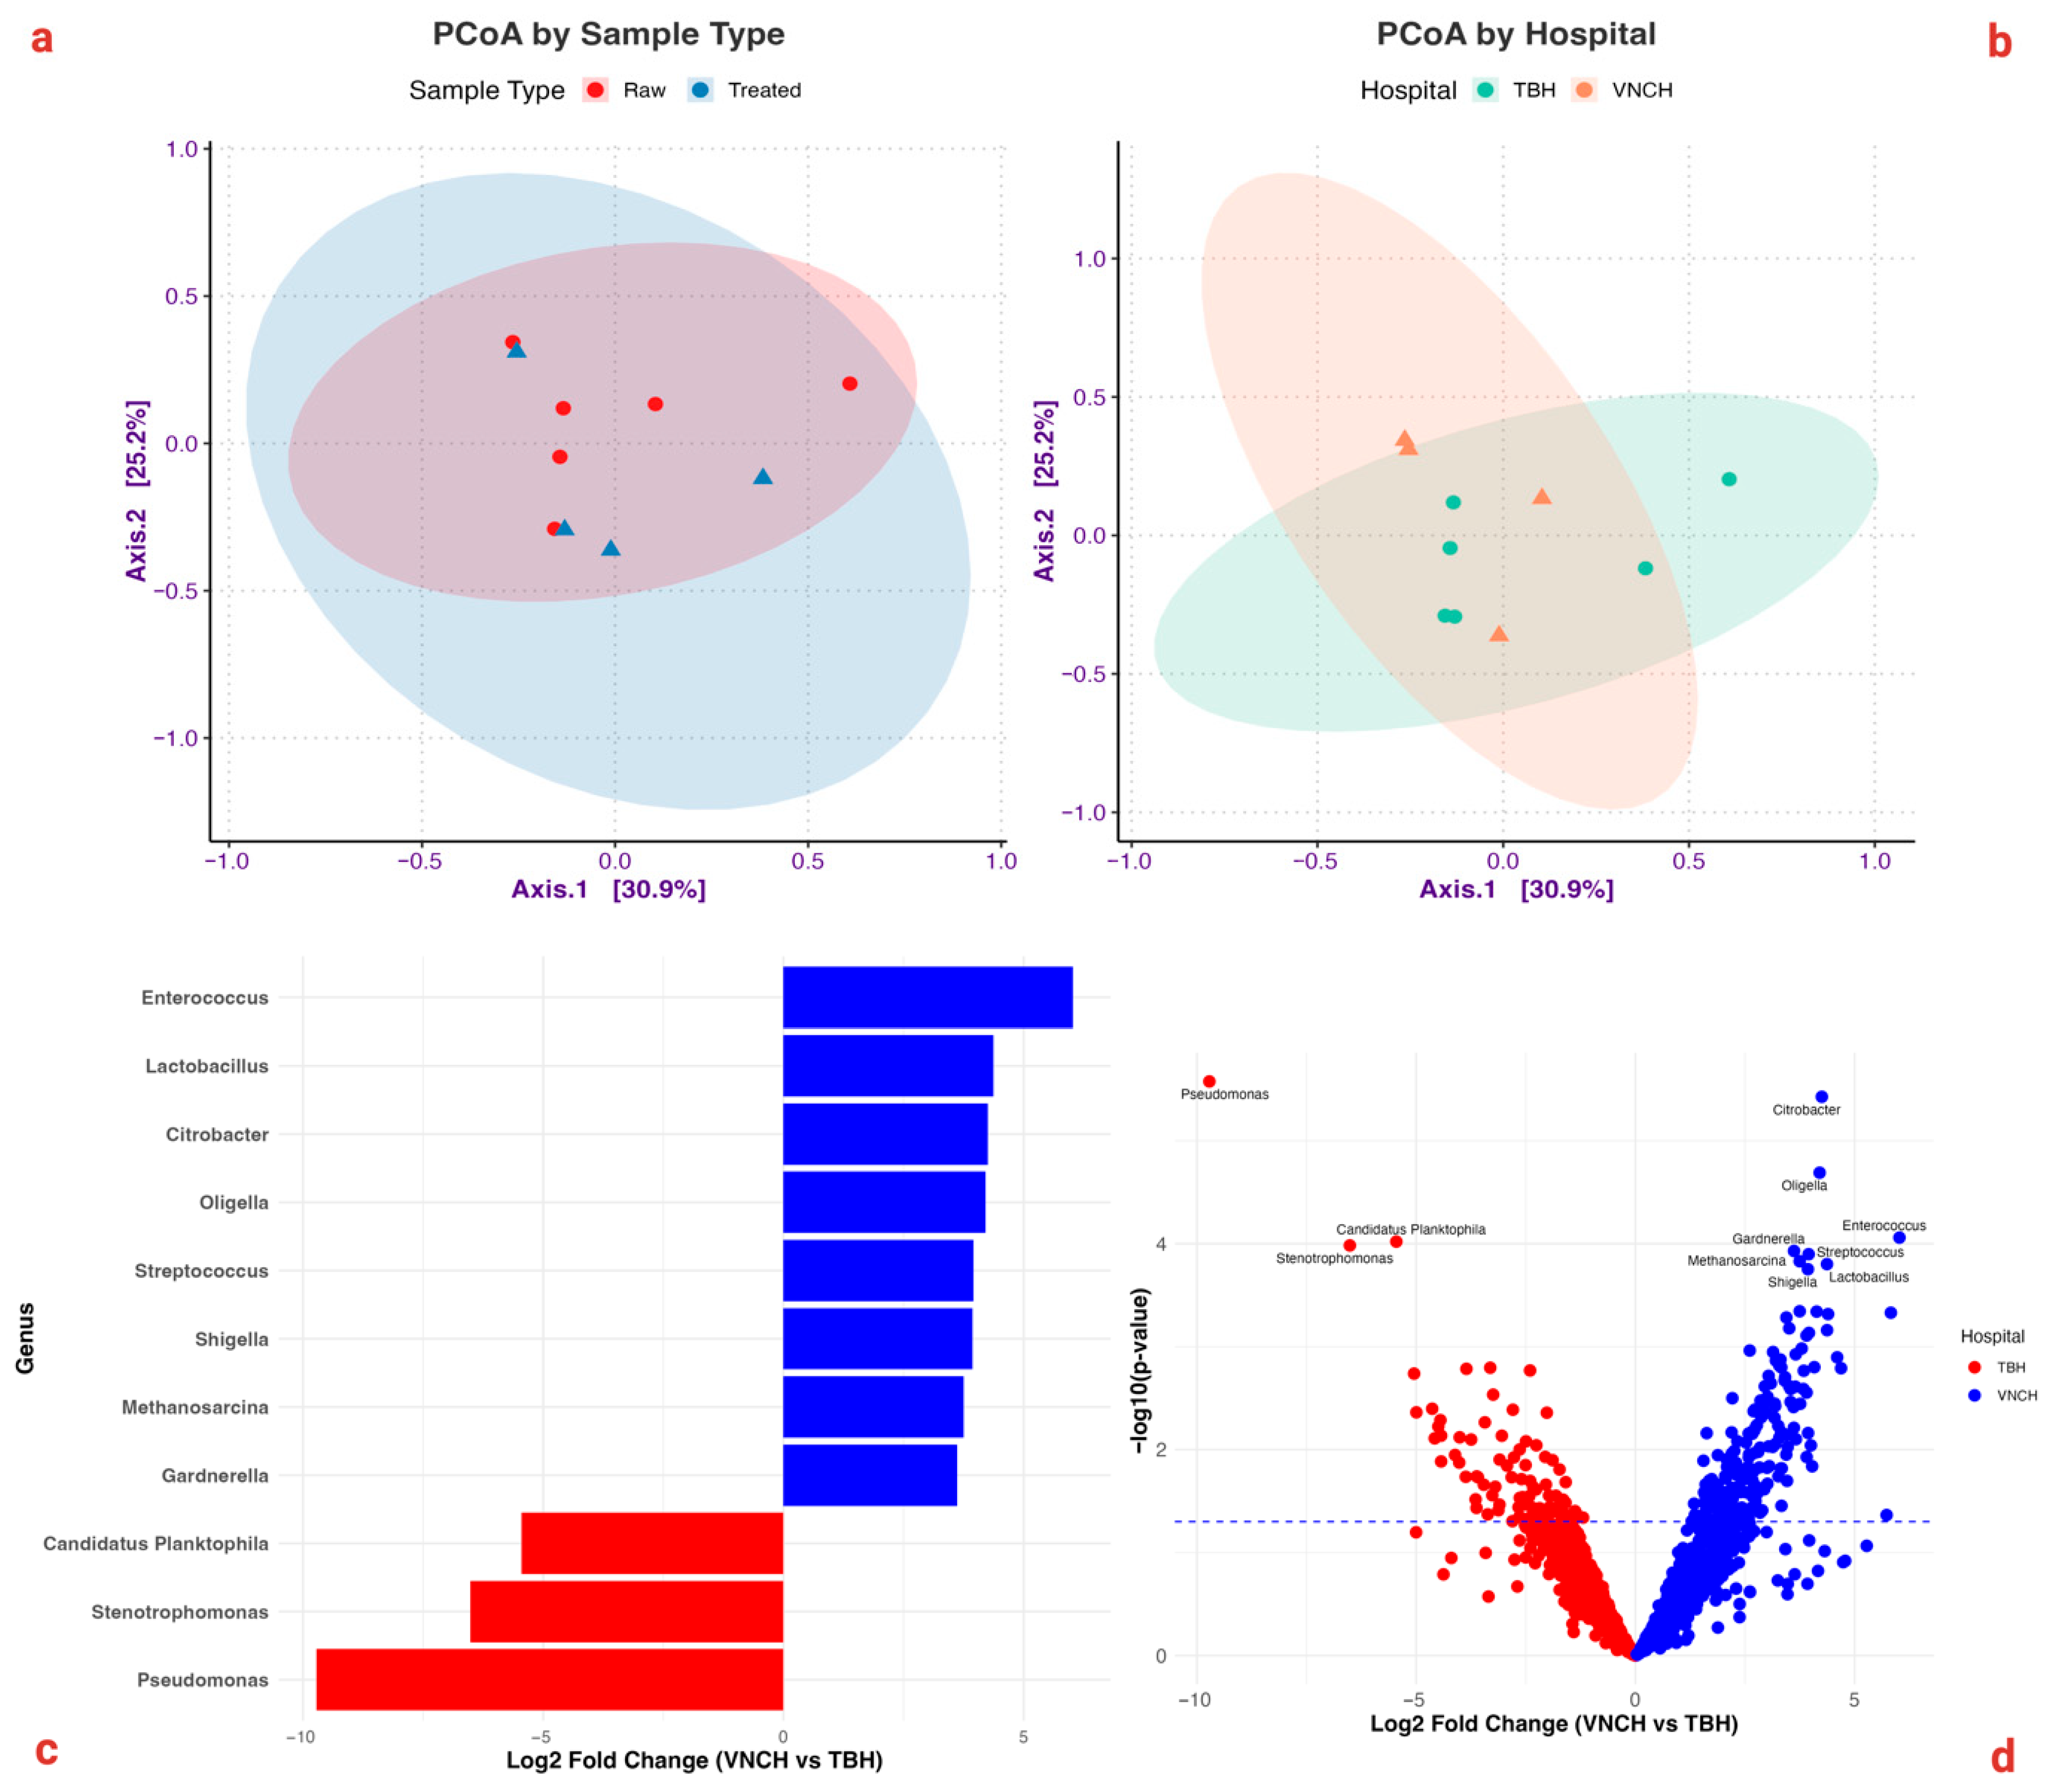
PCoA based on Bray–Curtis dissimilarity indicated overall similarity in microbial taxa across treatment processes (Figure 5a), but site-stratified analyses revealed distinct microbial signatures between TBH and VNCH (Figure 5b). Differential abundance testing with DESeq2 identified taxa with significant shifts between hospitals (Figure 5c), further highlighted by volcano plots of taxa showing marked enrichment or depletion across sites (Figure 5d).
Figure 5.
Ordination and Differential Abundance Analysis of Microbial Communities Across Sample Types and Hospitals. (a): Principal Coordinate Analysis (PCoA) plot based on Bray–Curtis dissimilarity, by sample type (raw = red circle vs. treated = blue triangle) showing the clustering of microbial communities. Each point represents an individual sample, and ellipses indicate each group. The percentages on the axes correspond to the proportion of variance explained by each axis. (b): PCoA by hospital (TBH and VNCH) by site-specific microbial profiles. The PCoA illustrating microbial distributions by hospital site (TBH vs. VNCH). Ellipses highlighting partial structuring of microbial diversity by hospital of origin. (c): Bar chart illustrating the log2 fold changes of genera significantly differentially abundant between VNCH and TBH, identified using DESeq2. Positive values indicate higher abundance in VNCH, while negative values indicate higher abundance in TBH. Blue bars indicate genera enriched in VNCH, whereas red bars represent genera enriched in TBH. (d): Volcano plot showing the log2 fold changes in abundance of microbial taxa between VNCH and TBH (adjusted p-value < 0.05). The x-axis represents the log2 fold change (VNCH vs. TBH) and the y-axis the −log10(p-value). Colored points highlight genera significantly enriched in each hospital, and the dashed horizontal line indicates the statistical significance threshold.
5.2.3. ARG Mapping
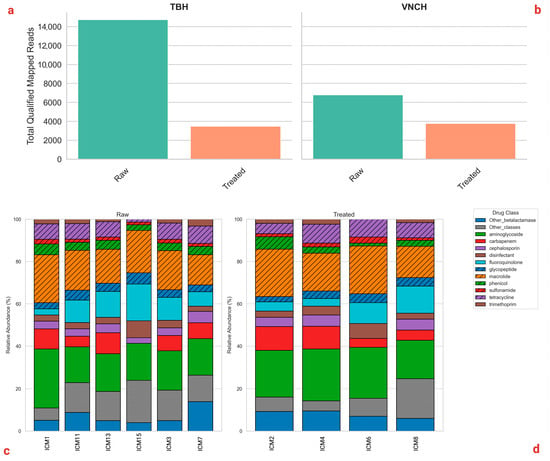
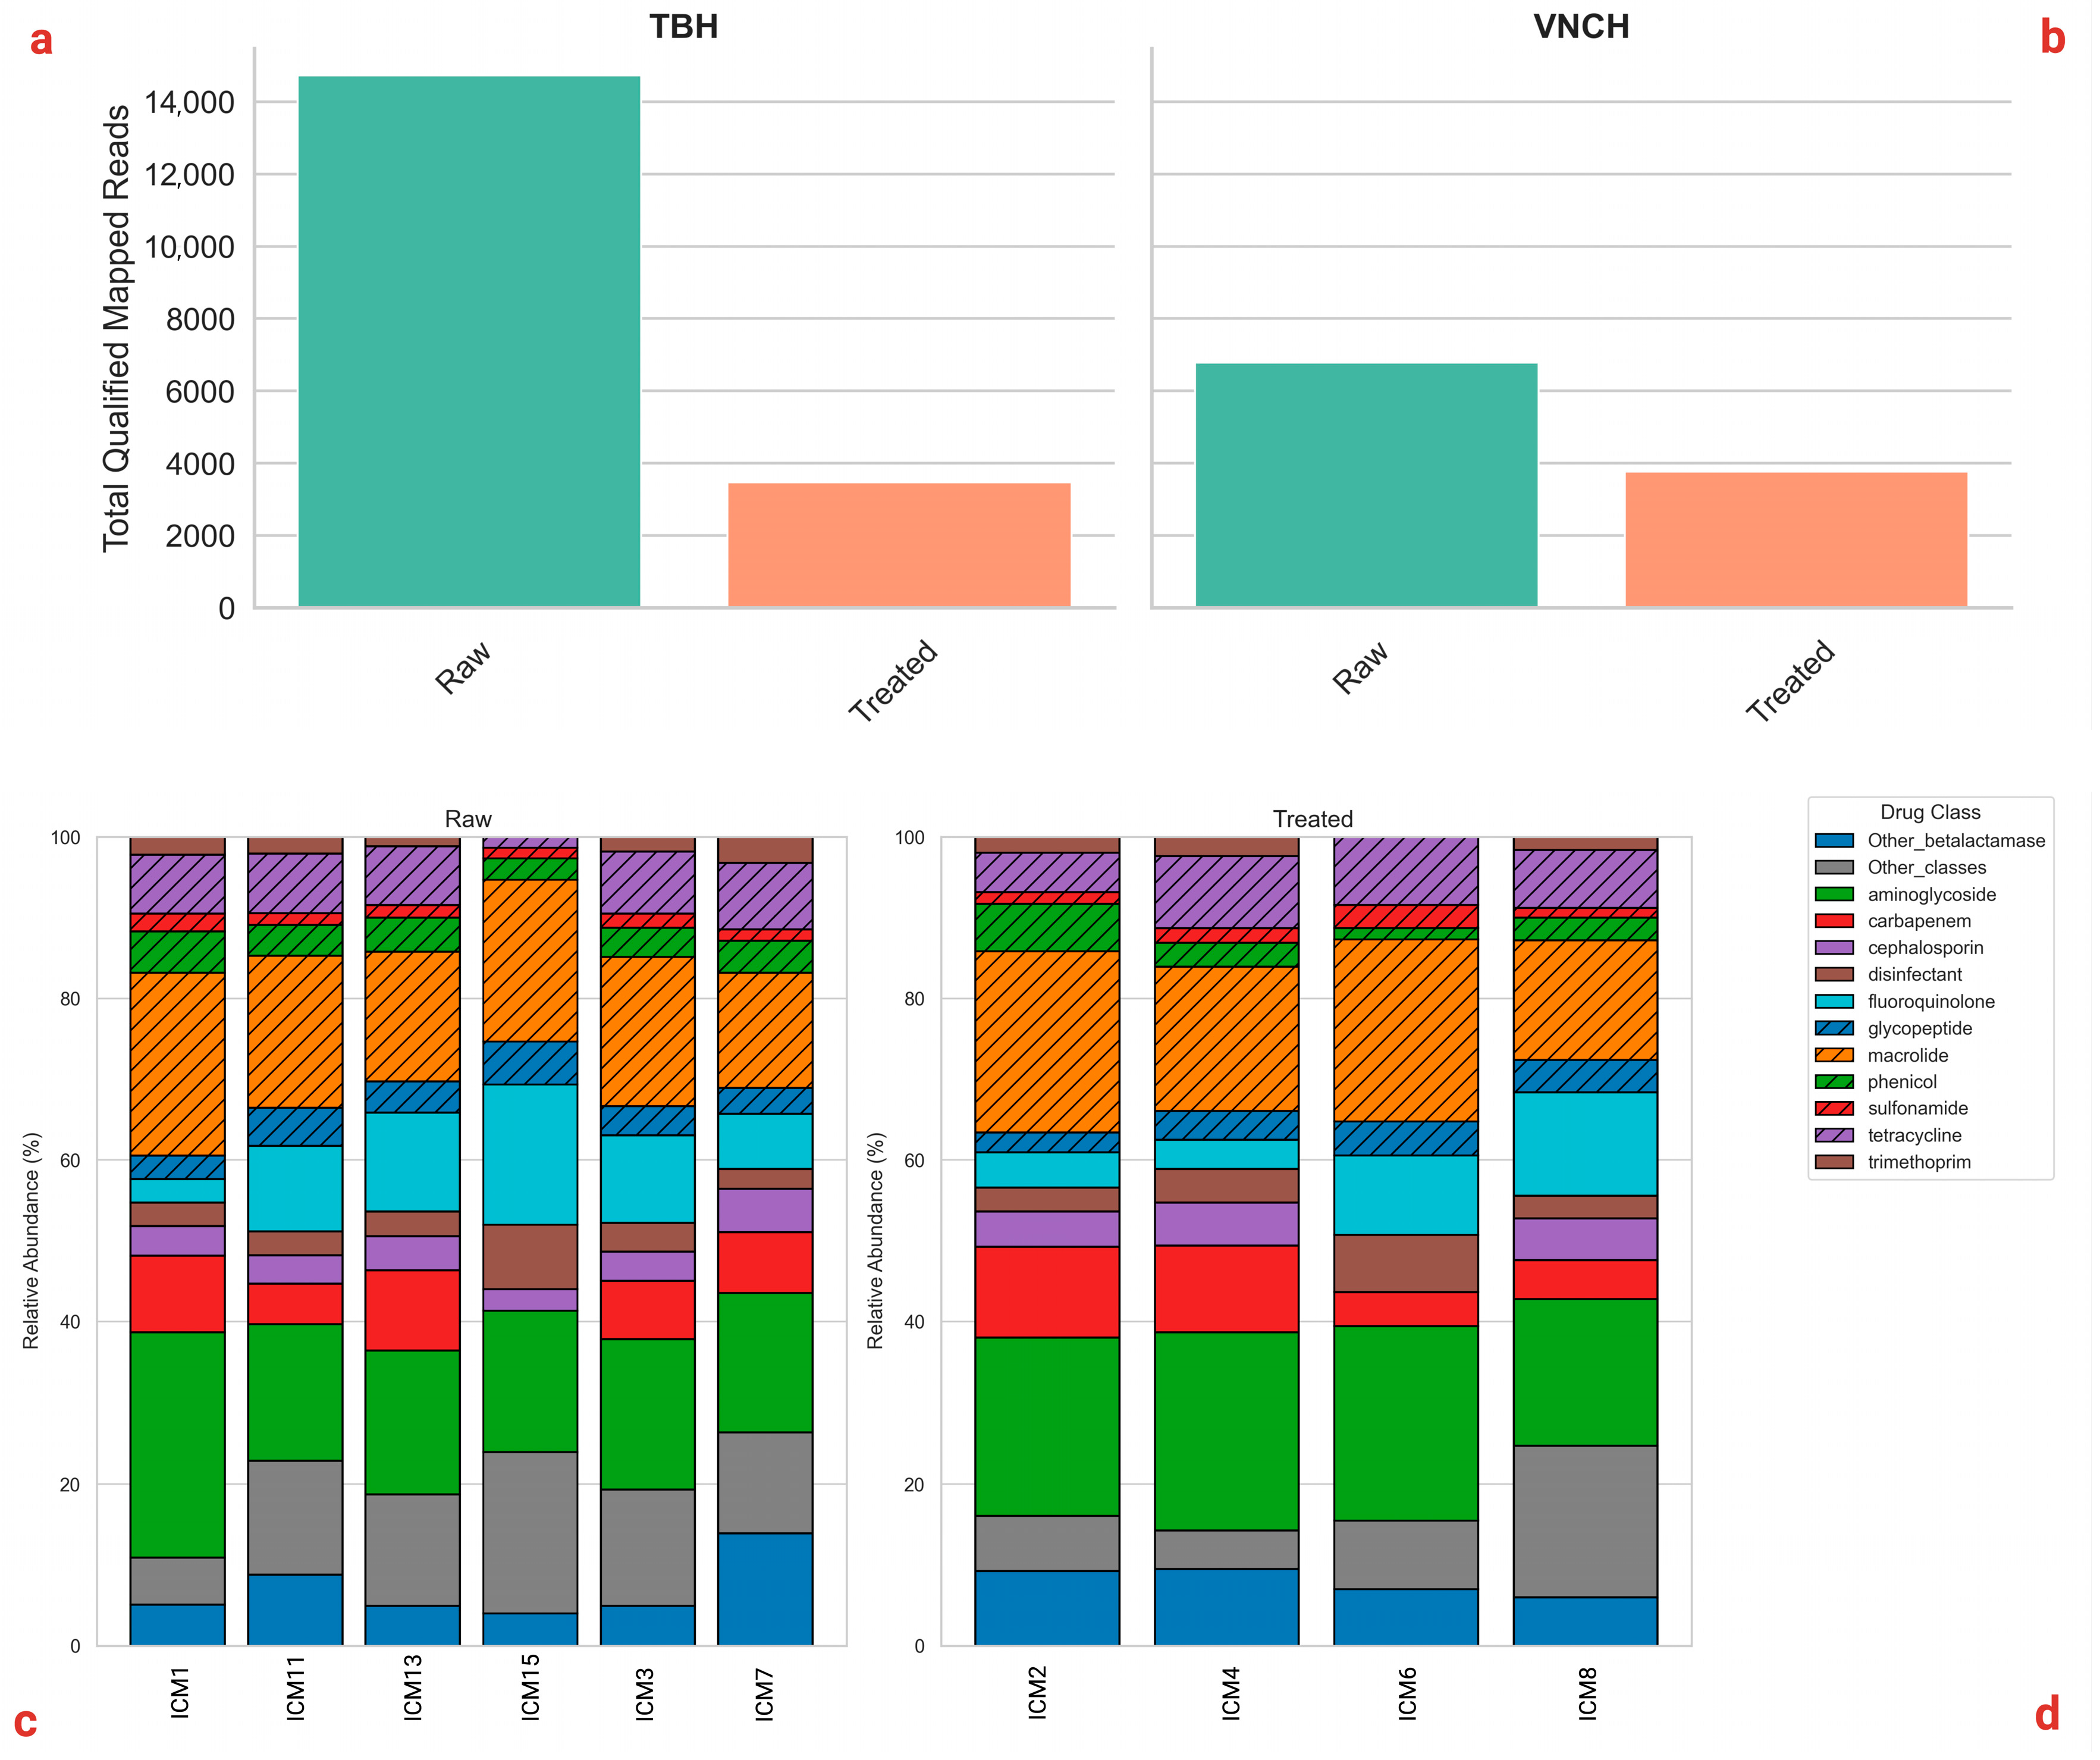
ARG profiling revealed clear differences between raw and treated samples. Raw wastewater harbored significantly higher ARG read counts, particularly beta-lactamase genes (Figure 6a,b). The emphasis on beta-lactamase resistance aligns with the I-CRECT project’s focus on carbapenem resistance. Although ARG prevalence was reduced in treated samples, residual genes persisted, underscoring the need for continued surveillance (Figure 6c,d). Relative abundance analyses confirmed beta-lactamases as the dominant ARG class across sites and sample types.
Figure 6.
Amount of ARG reads and Relative Abundance of ARGs by Drug Class Across Sample Types and Hospitals. (a,b): Bar chart showing the total number of reads mapped to ARGs in raw and treated samples at TBH vs. VNCH. Only ARGs with at least 10 mapped reads and a minimum 20% reference coverage are counted, indicating the presence of ARGs within specific drug classes for each sample type. (c,d): Stacked bar chart illustrating the relative abundance of ARGs by drug class in raw samples, with data faceted by sample type. Each color represents a different drug class, showing the composition and prevalence of ARGs across raw and treated samples.
6. Conclusions
This study demonstrates a streamlined workflow that integrates multiple MinION devices with a GPU-powered workstation to overcome the computational limitations of standalone MinIONs. The system delivers high-accuracy sequencing and basecalling that generates sufficient sequencing reads for comprehensive profiling of microbial communities in a cost-effective manner. Leveraging several MinIONs in parallel increases throughput and coverage while keeping costs substantially lower than high-end platforms such as the GridION.
Importantly, this setup does not represent a new sequencing device but a practical integration of existing ONT hardware with dedicated GPU resources. The complete workstation build cost approximately €2800–3000 (excluding MinION devices, which are typically obtained through ONT starter packages), making the system reproducible and affordable for laboratories with limited budgets. The system can accommodate more than 5 MinIONs depending on the number of ports available on the multi-channel USB adapter available. Based on our experience we advise one device per storage capacity of 1TB, so for a system made with 10 TB one can run up to 10 MinIONs with a USB adapter that has at least 10 ports.
Validation of the workflow with FAST5 data basecalled in real time using Guppy confirmed its robustness: sequencing runs generated >500,000 reads per sample within 7 h, with high classification rates and reliable downstream analysis. Application to hospital wastewater samples provided critical insights into microbial diversity and the distribution of antimicrobial resistance genes (ARGs), illustrating the potential of this system for surveillance in complex, resource-limited environments.
Beyond the metagenomics sequencing presented in this study, the setup has successfully been used to sequence over 200 whole genomes, including Escherichia coli, Acinetobacter baumannii, and Aeromonas dhakensis, as reported in our previous publications [15,16,17].
Overall, this GPU-integrated workflow provides a robust, scalable, and user-friendly solution that extends the capabilities of MinION sequencing. By lowering computational and analytical barriers, it makes high-resolution long-read metagenomics more accessible to researchers and public health laboratories, enabling faster and more accurate detection of pathogens and resistance determinants.
This workflow is designed for practical deployment rather than formal benchmarking against all existing ONT pipelines. Performance metrics such as runtime and throughput may vary depending on GPU model, storage speed, and sequencing chemistry. While the system is optimized for local analysis in resource-limited settings, laboratories with established HPC infrastructure may achieve similar or higher performance using centralized workflows. Finally, the study focuses on metagenomic and whole-genome sequencing applications; extension to other use cases (e.g., transcriptomics or adaptive sampling) may require additional optimization.
Supplementary Materials
The following supporting information can be downloaded at: https://www.mdpi.com/article/10.3390/hardware4010005/s1, File S1: notebooks; File S2: R_analysis; File S3: scripts; File S4: README; File S5: run_pipeline; File S6: live_basecaling-gil.
| Name | Type | Description |
| notebooks | Package (.zip) | Jupyter notebooks for data visualization, taxonomic profiling, and ARG analysis |
| R_analysis | Package (.zip) | R scripts and functions for microbial diversity analysis, plotting, and statistical testing (Phyloseq-based). |
| scripts | Package (.zip) | Shell and helper scripts to run individual steps of the metagenomic pipeline. |
| README | Documentation | Instructions and usage guidelines for installing dependencies and running the workflow. |
| run_pipeline | Bash script | Master script to execute the complete metagenomic analysis. |
| live_basecaling-gil | Bash script | Script for real-time monitoring and basecalling of FAST5 (Guppy) and POD5 (Dorado) files using inotifywait |
Author Contributions
Conceptualization, Y.M.G.H., X.F., H.C., A.D. and J.E.O.; methodology, Y.M.G.H., X.F. and H.C.; software, Y.M.G.H.; validation, Y.M.G.H., X.F., H.C., A.D. and J.E.O.; formal analysis, Y.M.G.H., K.R.E.A. and B.-G.J.H.; investigation, T.T.N. and Y.M.G.H.; resources, A.D. and J.E.O.; data curation, Y.M.G.H. and T.T.N.; writing—original draft preparation, Y.M.G.H., K.R.E.A. and B.-G.J.H.; writing—review and editing, all authors; visualization, Y.M.G.H., K.R.E.A. and B.-G.J.H.; supervision, Y.M.G.H., A.D. and J.E.O.; project administration, Y.M.G.H.; funding acquisition, Y.M.G.H., A.D. and J.E.O. All authors have read and agreed to the published version of the manuscript.
Funding
This paper was written within the framework of the I-CRECT project (Interventions to decrease CRE colonization and transmission between hospitals, households, communities and domesticated animals) which received funding from Innovation Fund Denmark (IFD), Swedish Research Council (VR), Federal Ministry of Education and Research, Germany (BMBF), The French National Research Agency (ANR), and International Centre for Antimicrobial Resistance Solutions—ICARS (https://icars-global.org/about-icars/, accessed on 30 September 2024) under the umbrella of the JPIAMR—Joint Programming Initiative on Antimicrobial Resistance. The study was further supported with funds from the Danish Ministry of Food and Agriculture through a contingency contract with the Department of Veterinary and Animals Sciences.
Institutional Review Board Statement
Not applicable.
Informed Consent Statement
Not applicable.
Data Availability Statement
The original contributions presented in this study are included in the Supplementary Materials. Further inquiries can be directed to the corresponding author.
Acknowledgments
We thank the I-CRECT consortium members (Intervention to decrease CRE Colonization and Transmission between hospitals, households, communities and domesticated animals) and the Joint Programming Initiative on Antimicrobial Resistance (JPIAMR). The project acknowledges and is thankful for the funding, mentioned in the Funding section, that has made the project possible.
Conflicts of Interest
The authors declare no conflicts of interest.
References
- Williams, A.N.; Stavrinides, J. A Microbial Sampling and Community Reconstruction Activity for Introducing Students to the Burgeoning Field of Metagenomics. J. Microbiol. Biol. Educ. 2020, 21. [Google Scholar] [CrossRef] [Scilit]
- Hu, L. Rapid Identification and Characterization of Microbial Pathogens by Molecular Biology Techniques. Open Microbiol. J. 2016, 10, 43–44. [Google Scholar] [CrossRef] [Scilit]
- Didelot, X.; Bowden, R.; Wilson, D.J.; Peto, T.E.A.; Crook, D.W. Transforming Clinical Microbiology with Bacterial Genome Sequencing. Nat. Rev. Genet. 2012, 13, 601–612. [Google Scholar] [CrossRef] [Scilit]
- Papamentzelopoulou, M.; Vrioni, G.; Pitiriga, V. Comparative Evaluation of Sequencing Technologies for Detecting Antimicrobial Resistance in Bloodstream Infections. Antibiotics 2025, 14, 1257. [Google Scholar] [CrossRef] [Scilit] [PubMed]
- Hilt, E.E.; Ferrieri, P. Next Generation and Other Sequencing Technologies in Diagnostic Microbiology and Infectious Diseases. Genes 2022, 13, 1566. [Google Scholar] [CrossRef] [Scilit] [PubMed]
- Goyal, P.A.; Bankar, N.J.; Mishra, V.H.; Borkar, S.K.; Makade, J.G.; Goyal, P.A.; Bankar, N.J.; Mishra, V.H.; Borkar, S.K.; Makade, J.G. Revolutionizing Medical Microbiology: How Molecular and Genomic Approaches Are Changing Diagnostic Techniques. Cureus 2023, 15, e47106. [Google Scholar] [CrossRef] [Scilit] [PubMed]
- Wanunu, M. Nanopores: A Journey towards DNA Sequencing. Phys. Life Rev. 2012, 9, 125–158. [Google Scholar] [CrossRef] [Scilit]
- Kim, C.; Pongpanich, M.; Porntaveetus, T. Unraveling Metagenomics through Long-Read Sequencing: A Comprehensive Review. J. Transl. Med. 2024, 22, 111. [Google Scholar] [CrossRef] [Scilit]
- Lin, B.; Hui, J.; Mao, H. Nanopore Technology and Its Applications in Gene Sequencing. Biosensors 2021, 11, 214. [Google Scholar] [CrossRef] [Scilit]
- Elliott, I.; Batty, E.M.; Ming, D.; Robinson, M.T.; Nawtaisong, P.; De Cesare, M.; Newton, P.N.; Bowden, R. Oxford Nanopore MinION Sequencing Enables Rapid Whole Genome Assembly of Rickettsia Typhi in a Resource-Limited Setting. Am. J. Trop. Med. Hyg. 2020, 102, 408–414. [Google Scholar] [CrossRef] [Scilit]
- Laver, T.; Harrison, J.; O’Neill, P.A.; Moore, K.; Farbos, A.; Paszkiewicz, K.; Studholme, D.J. Assessing the Performance of the Oxford Nanopore Technologies MinION. Biomol. Detect. Quantif. 2015, 3, 1–8. [Google Scholar] [CrossRef] [Scilit]
- Scheer, M. Improving MinION´s Effectiveness in Microbial DNA Extraction, Identification, and Antibiotic Resistance Profiling. Bachelor’s Thesis, University of Skövde, Skövde, Sweden, 2024. [Google Scholar]
- Adegoke, A.A.; Madu, C.E.; Aiyegoro, O.A.; Stenström, T.A.; Okoh, A.I. Antibiogram and Beta-Lactamase Genes among Cefotaxime Resistant E. Coli from Wastewater Treatment Plant. Antimicrob. Resist. Infect. Control 2020, 9, 46. [Google Scholar] [CrossRef] [Scilit] [PubMed]
- Praveenkumarreddy, Y.; Akiba, M.; Guruge, K.S.; Balakrishna, K.; Vandana, K.E.; Kumar, V. Occurrence of Antimicrobial-Resistant Escherichia Coli in Sewage Treatment Plants of South India. J. Water Sanit. Hyg. Dev. 2020, 10, 48–55. [Google Scholar] [CrossRef] [Scilit]
- Erickson, V.I.; Dung, T.T.; Khoi, L.M.; Hounmanou, Y.M.G.; Phu, T.M.; Dalsgaard, A. Genomic Insights into Edwardsiella ictaluri: Molecular Epidemiology and Antimicrobial Resistance in Striped Catfish (Pangasianodon hypophthalmus) Aquaculture in Vietnam. Microorganisms 2024, 12, 1182. [Google Scholar] [CrossRef] [Scilit]
- Hounmanou, Y.M.G.; Wanyana, A.; Alafi, S.; Wabwire-Mangen, F.; Christensen, H.; Olsen, J.E.; Byarugaba, D.K. Whole Strains vs MGEs in Short and Longterm Transmission of ESBL Genes between Healthcare and Community Settings in Uganda. Sci. Rep. 2023, 13, 10229. [Google Scholar] [CrossRef] [Scilit]
- Odih, E.E.; Oaikhena, A.O.; Underwood, A.; Hounmanou, Y.M.G.; Oduyebo, O.O.; Fadeyi, A.; Aboderin, A.O.; Ogunleye, V.O.; Argimón, S.; Akpunonu, V.N.; et al. High Genetic Diversity of Carbapenem-Resistant Acinetobacter Baumannii Isolates Recovered in Nigerian Hospitals in 2016 to 2020. mSphere 2023, 8, e0009823. [Google Scholar] [CrossRef] [Scilit]
- Wick, R.R.; Judd, L.M.; Holt, K.E. Performance of Neural Network Basecalling Tools for Oxford Nanopore Sequencing. Genome Biol. 2019, 20, 129. [Google Scholar] [CrossRef] [Scilit]
- Shen, W.; Le, S.; Li, Y.; Hu, F. SeqKit: A Cross-Platform and Ultrafast Toolkit for FASTA/Q File Manipulation. PLoS ONE 2016, 11, e0163962. [Google Scholar] [CrossRef] [Scilit]
- Bonenfant, Q.; Noé, L.; Touzet, H. Porechop_ABI: Discovering Unknown Adapters in Oxford Nanopore Technology Sequencing Reads for Downstream Trimming. Bioinform. Adv. 2023, 3, vbac085. [Google Scholar] [CrossRef] [Scilit]
- De Coster, W.; D’Hert, S.; Schultz, D.T.; Cruts, M.; Van Broeckhoven, C. NanoPack: Visualizing and Processing Long-Read Sequencing Data. Bioinformatics 2018, 34, 2666–2669. [Google Scholar] [CrossRef] [Scilit] [PubMed]
- Wood, D.E.; Salzberg, S.L. Kraken: Ultrafast Metagenomic Sequence Classification Using Exact Alignments. Genome Biol. 2014, 15, R46. [Google Scholar] [CrossRef] [Scilit] [PubMed]
- Alcock, B.P.; Huynh, W.; Chalil, R.; Smith, K.W.; Raphenya, A.R.; Wlodarski, M.A.; Edalatmand, A.; Petkau, A.; Syed, S.A.; Tsang, K.K.; et al. CARD 2023: Expanded Curation, Support for Machine Learning, and Resistome Prediction at the Comprehensive Antibiotic Resistance Database. Nucleic Acids. Res. 2023, 51, D690–D699. [Google Scholar] [CrossRef] [Scilit] [PubMed]
- Luo, X.; Hounmanou, Y.M.G.; Ndayisenga, F.; Yu, Z. Spontaneous Fermentation Mitigates the Frequency of Genes Encoding Antimicrobial Resistance Spreading from the Phyllosphere Reservoir to the Diet. Sci. Total Environ. 2024, 931, 172712. [Google Scholar] [CrossRef] [Scilit] [PubMed]

Disclaimer/Publisher’s Note: The statements, opinions and data contained in all publications are solely those of the individual author(s) and contributor(s) and not of MDPI and/or the editor(s). MDPI and/or the editor(s) disclaim responsibility for any injury to people or property resulting from any ideas, methods, instructions or products referred to in the content. |
© 2026 by the authors. Licensee MDPI, Basel, Switzerland. This article is an open access article distributed under the terms and conditions of the Creative Commons Attribution (CC BY) license.