


Abstract
We report on the non-contact characterization of various plate materials (including aluminum and steel) using a high-pressure, micrometer-scale air jet as a broadband ultrasound source and an optomechanical microphone as a receiver. Through-plate transmission spectra are dominated by zero-group-velocity (ZGV) Lamb modes. We attribute this to the ‘point-like’ nature of both the source and receiver, since ZGV modes are spatially localized and comprise a range of non-normal wave numbers. As is well known, the properties of the ZGV modes, including their frequency and amplitude, are sensitive to thickness variations or the presence of defects. The continuous nature and high acoustic power of the gas jet source enabled us to perform uninterrupted scanning of non-uniform steel plates. Given the ubiquitous and low-cost nature of compressed air systems, our approach might be of interest for the rapid inspection of industrial parts.
1. Introduction
Inspection of industrial parts using non-contact ultrasound (NCUS) techniques is a topic of long-standing interest [1,2,3], in particular for materials that are incompatible with water- or gel-based coupling of contact transducers. Even for compatible materials, contact transducers modify the boundary conditions of a test object and can thereby complicate the interpretation of results. NCUS avoids these complications and dispenses with the need for surface preparation, making it attractive for rapid, in-line inspection and quality control applications [1,4,5,6].
In air-coupled ultrasound (ACUS), signals are transmitted between a transducer and a part (or vice versa) via an intermediate air layer [1,2,3,4,5,6]. As Chimenti stated [3], “air is the perfect coupling medium from the standpoint of convenience”. However, the large acoustic impedance mismatch between air and any solid medium presents a major challenge. Reasonably efficient air-coupled transducers are available, either as narrowband piezoelectric devices [2,6] or wideband capacitive membrane devices [7,8,9], but the transmission of ultrasound energy between air and a solid test specimen is usually very low. For example, the energy loss due to reflection at a single air–aluminum interface is ~40 dB [7] and at a single air–steel interface is ~45 dB [7]. Since two interfaces are involved in any completely non-contact measurement, total energy loss can exceed 80 dB, even ignoring additional losses at the air–transducer interfaces. As a result, to date ACUS techniques have mostly been limited to the study of lower-impedance materials (e.g., wood, plastics, or composites) [4].
In spite of these practical challenges, resonant transmission or reflection measurements of aluminum [7,8,9] and steel [10,11,12] plates have occasionally been achieved by employing sophisticated, high-voltage transmit and receive electronics [4] along with phase-sensitive detection [9] or advanced signal processing [12]. These setups often employ narrowband transducers [13] specifically matched (i.e., in resonant frequency) to a transmission resonance of a given plate [1], and thus lack flexibility.
An alternative approach to enhancing transmission through a solid plate in air is to exploit the so-called ‘zero-group-velocity’ (ZGV) points in the Lamb mode dispersion relations [14,15,16,17,18,19,20,21,22]. ZGV resonances arise due to coupling (anti-crossing) of a pair of Lamb modes with shared symmetry and nearly coincident cutoff frequencies [15] and their existence and number are mainly dependent on the Poisson’s coefficient of the plate [15,16,18]. At ZGV points, the group velocity is zero or nearly zero for a range of wave numbers having a finite phase velocity. These resonances can locally ‘trap’ elastic energy at particular frequencies, via interference between ‘backward’ and ‘forward’ propagating wave components [16,18], and with the energy distributed over a finite range of wave numbers (i.e., a range of non-normal propagation angles within the plate [14]). In keeping with this, efficient coupling to these resonances requires the use of a divergent or focused source [14], or localized generation of ultrasound inside the plate [19,22]. Moreover, most ZGV studies employ NCUS/ACUS techniques because contact-based transducers disrupt the boundary conditions of the plate and degrade the quality of the ZGV resonances [21].
ZGV-based testing offers several compelling attributes, including:
- i.
- For appropriate excitation (i.e., by a focused or ‘point’ source of ultrasound), ZGV resonances are the dominant spectral features in both through-transmission [14] and single-sided [17,18,19,20] NCUS experiments.
- ii.
- ZGV resonances can be used to determine elastic constants [17], to precisely measure the local thickness [19], and to perform high-resolution c-scans to identify defects [14,20].
- iii.
- Given their localized nature, and since they are minimally impacted by plate curvature or remote boundary conditions, ZGV modes can be used for the study and inspection of any structure that locally resembles a plate, including shells [14] and pipe walls [17]. In fact, localized ZGV resonances exist even in non-homogeneous plates [23] and in rails [24].
ZGV-based studies have most often employed laser-generated ultrasound [16,17,18,19,20,23], combined with laser-interferometer-based detection. Other than requiring that the surface has sufficient specular reflectance, this approach has considerable advantages, including the fact that the source and receiver do not need to be close to the plate surface. Nevertheless, the cost and complexity of these systems have hindered their widespread adoption, especially for deployment in the field.
Gas jets impinging upon a surface have occasionally been used as a method to generate ultrasound inside a solid material [25,26,27], mainly for the purpose of calibrating contact-mode sensors [28]. Strangfeld et al. [29] recently described the use of a gas jet source for non-contact, impact-echo studies of delamination in concrete, primarily in the frequency range below ~50 kHz. Of related interest, we recently demonstrated [30] that micro-scale compressed-air jets produce broadband ultrasound peaking in the MHz range and spanning several MHz in bandwidth. Here, we show that these same air jets can be used to continuously excite ZGV modes in a variety of plates, including aluminum and steel. Furthermore, we show that an optomechanical microphone [31,32,33] can be used to extract the acoustic spectrum, enabling high-SNR reception of the ZGV spectral signatures.
2. Background Theory
2.1. Plane-Wave Excitation Resonances
As mentioned above, the large acoustic impedance mismatch between air and a solid medium is perhaps the main challenge for air-coupled ultrasound inspection. However, in the special case of a plane-parallel plate, resonant interference can greatly enhance the transmission of ultrasound energy at discrete frequencies. For a normally incident plane wave, the energy transmission can be expressed [9]:
Here, Za ~420 kg m−2 s−1 is the acoustic impedance of air, Zs is the acoustic impedance of the plate material (e.g., Zs ~1.7 × 10⁷ kg m−2 s−1 for aluminum), d is the thickness of the plate, and λ is the longitudinal sound wavelength inside the plate. For an ideal plane-wave excitation, and neglecting acoustic losses due to attenuation and scattering, Equation (1) predicts unity transmission at ‘resonant wavelengths’, which satisfy d = m·λ/2 with m being a non-zero integer. This is the acoustic analog of the well-known Fabry–Perot etalon from optics, for which unity transmission through a pair of highly reflecting mirrors arises due to resonant interference effects. In a plate, these resonances are associated with the cutoff conditions of high-order Lamb modes (i.e., guided elastic waves) [10,11,12]. At these cutoff points, the in-plane group velocity (Vg = dω/dk) is zero and the in-plane phase velocity (Vp = ω/k) is infinite.
In practice, it is not possible to achieve the unity transmission conditions predicted by Equation (1). In the first place, the incident acoustic wave always comprises a range of incident angles (i.e., it is not possible to generate an ideal plane wave), so that only a fraction of the incident energy satisfies the resonant condition. In fact, the exact treatment of energy coupling between an air-coupled transducer and a plate requires a consideration of the angular distribution of the acoustic field emitted into the air and how this couples to the full set of Lamb modes supported by the plate [10]. Secondly, attenuation of ultrasound signals scales rapidly in air, imparting significant losses at MHz frequencies for even mm-scale distances [13]. Thirdly, real plates deviate slightly from plane-parallel conditions, as well as introducing additional attenuation and scattering losses.
2.2. Plate Mode Dispersion Relations
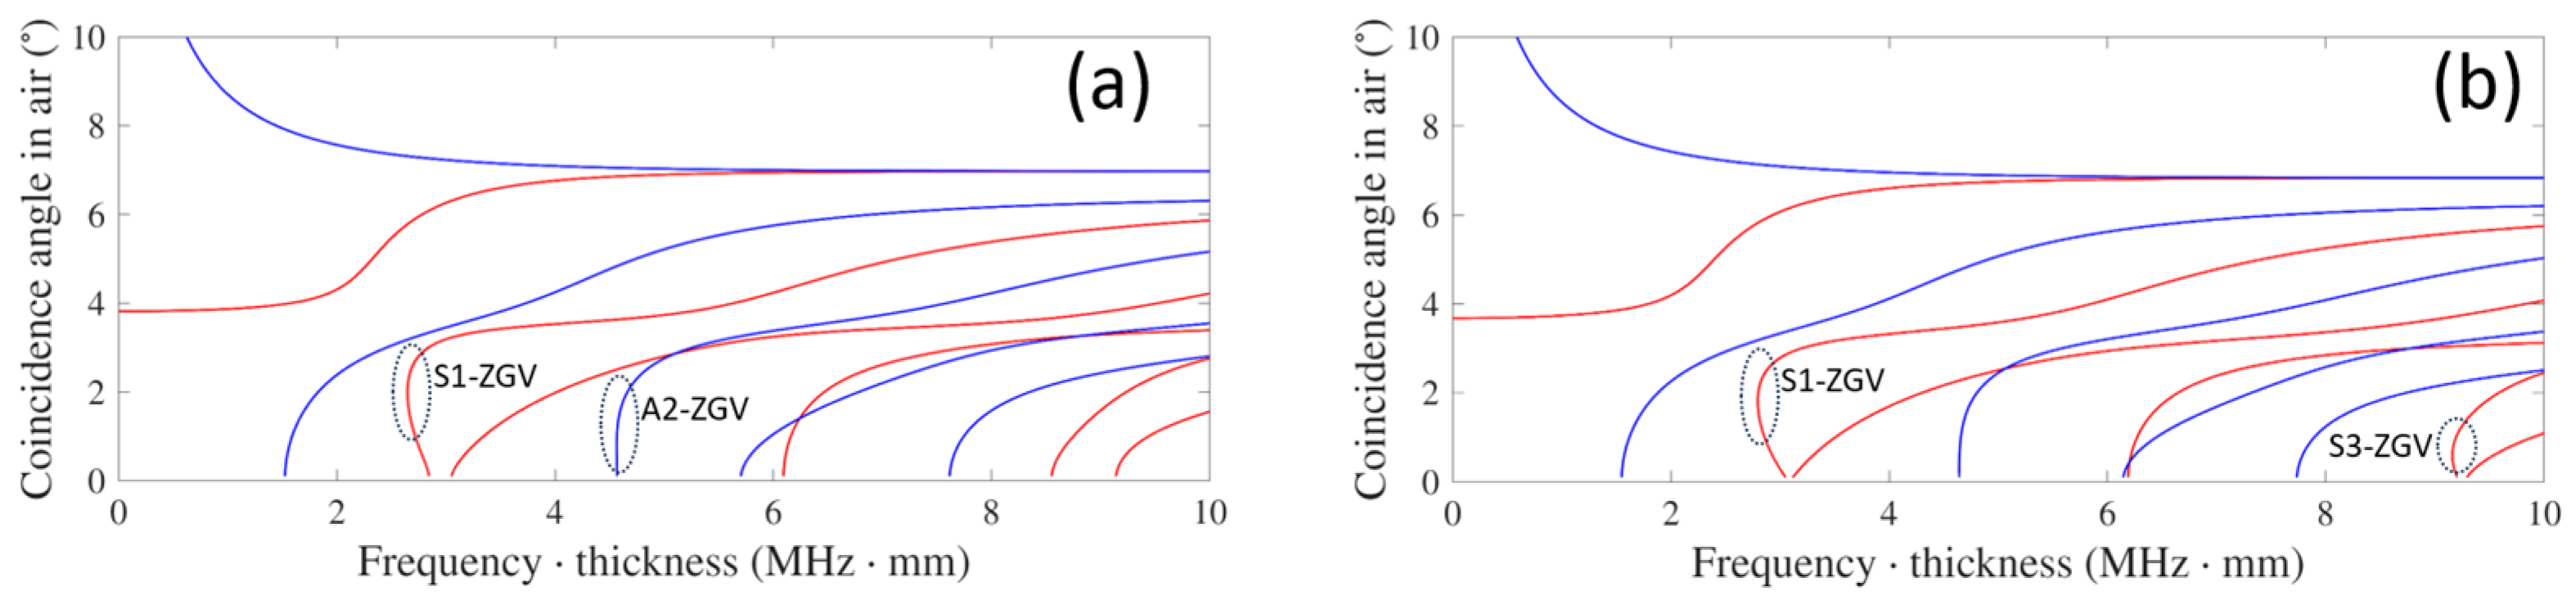
The waves guided by an isotropic plate, finite in thickness but idealized to have infinite extent in the in-plane directions, are solutions of the well-known Rayleigh–Lamb dispersion equations [34]. We used a freely available online solver [35] to plot the predicted dispersion relationships for a variety of (assumed) isotropic and homogeneous plates studied experimentally below. As an example, Figure 1 shows the predicted dispersion diagram for both a steel (304 alloy) and an aluminum (1100 alloy) plate plotted versus thickness-normalized frequency (i.e., f·d). On the vertical axis, we have chosen to plot the so-called ‘coincidence angle’, which is the angle of a plane wave in air needed to excite a given mode inside the plate. For the higher-order Lamb modes (i.e., neglecting the A0 and S0 flexural modes), coupling from air involves wave vectors within a narrow range of angles only (<~6 degrees from normal) [3]. Resonant coupling to a given plate mode typically requires a specific combination of angle (i.e., in-plane wave number) and frequency. The ZGV points, such as the distinct ‘S1-ZGV’ branches indicated in both plots, are unique in that a single resonant frequency is associated with a range of coincidence angles (e.g., ~1–3 degrees for the cases shown). For a point or focused source, such as the small, turbulent air jets described above, coupling to the ZGV modes is thus greatly enhanced [14]. As shown in Section 4 below, the transmission spectra in our experiments are dominated by narrow-linewidth resonance features aligned with the predicted frequencies for the ZGV modes of a given plate.
Figure 1.
Numerically predicted Lamb-mode dispersion relations for (a) a stainless-steel plate (304 alloy), and (b) an aluminum plate (1100 alloy). ZGV branches are indicated by the dashed ellipses and labeled according to the main Lamb mode involved in each case (see main text). Red and blue curves correspond to symmetric and asymmetric modes, respectively.
The number of ZGV resonances exhibited by a given plate depends on its Poisson’s ratio ν. For example, considering positive values of ν only, the S1-ZGV resonance (associated with coupling between the S1 and S2 modes) exists for ~0 < ν < 0.45 and the next lowest-order ‘A2-ZGV’ resonance (associated with coupling between the A2 and A3 modes) exists for ~0 < ν < 0.32 [18]. Both are visible in the dispersion plot for 304 alloy steel (ν = 0.3) shown in Figure 1a, although the A2-ZGV resonance is a relatively weak feature near ~4.65 MHz·mm. Moreover, this latter feature is predominately a shear-wave resonance (i.e., it lies near the cutoff frequency f·d = 3·vT/2 of the A3 mode [17,18]) and is not expected to couple efficiently to purely longitudinal sound waves in air. For the aluminum plate (ν = 0.33), as shown in Figure 1b, the A2-ZGV mode is not present and instead the next lowest-order ZGV resonance is the ‘S3-ZGV’ resonance associated with coupling between the S3 and S6 modes [18]. This resonance lies near the cutoff condition of the S3 mode, f·d = 3·vL/2, and, similar to S1-ZGV, has a predominately longitudinal wave character.
The ZGV resonance frequencies have often been expressed in terms of a ‘resonance parameter’ labeled as β [17]. For example, the frequency of the S1-ZGV resonance can be expressed as
where β1 depends on the Poisson’s ratio of the material and lies between ~0.8 < β1 < ~0.95 for typical materials [17,22]. Similarly, the A2-ZGV resonance frequency can be expressed as f2 = β3·(3·vT/d) where ~0.9 < β3 < 1 over the range of Poisson’s coefficients for which it is present [17].
It is also worthwhile to consider the wavelengths of the Lamb mode components that make up the S1-ZGV resonance. First, note that the components contributing to an experimental ZGV feature comprise a range of wave numbers distributed around the ZGV point in the dispersion curve. Backward and forward wave components lying in a small frequency range just above f1 mutually interfere inside the plate and produce an elastic standing wave pattern, with a central lobe which has a diameter on the order of half the wavelength [17]. Furthermore, the wavelength at the S1-ZGV resonance is typically λ1 ~4·d for common materials [18]. It follows that most of the S1-ZGV energy is confined to a region with diameter ~2·d, and this criterion has been employed to choose the optimal spot size in studies employing laser excitation [17,18,19,20,36,37,38,39]. Nevertheless, the energy of the ZGV standing wave pattern extends to distances at least an order of magnitude larger than the central spot [18,39]. Of related interest, detection of ZGV modes at locations removed from a laser excitation point has recently been reported for tapered plates [23]. This presumably involves energy coupling between propagating plate modes and ZGV resonances, but further studies are needed.
In our experiment, the ultrasound source is the turbulent region of a gas jet emerging from a micrometer-scale orifice. Since this jet diverges and is also within a few mm of the plate surface, it is a complicated problem to quantify the region of ultrasound generation at the plate surface. Nevertheless, our results consistently evince the dominance of the ZGV resonances, and we focus on those details below. A more complete study and optimization of the gas-jet excitation mechanism is left for future work.
3. Materials and Methods
3.1. Experimental Details
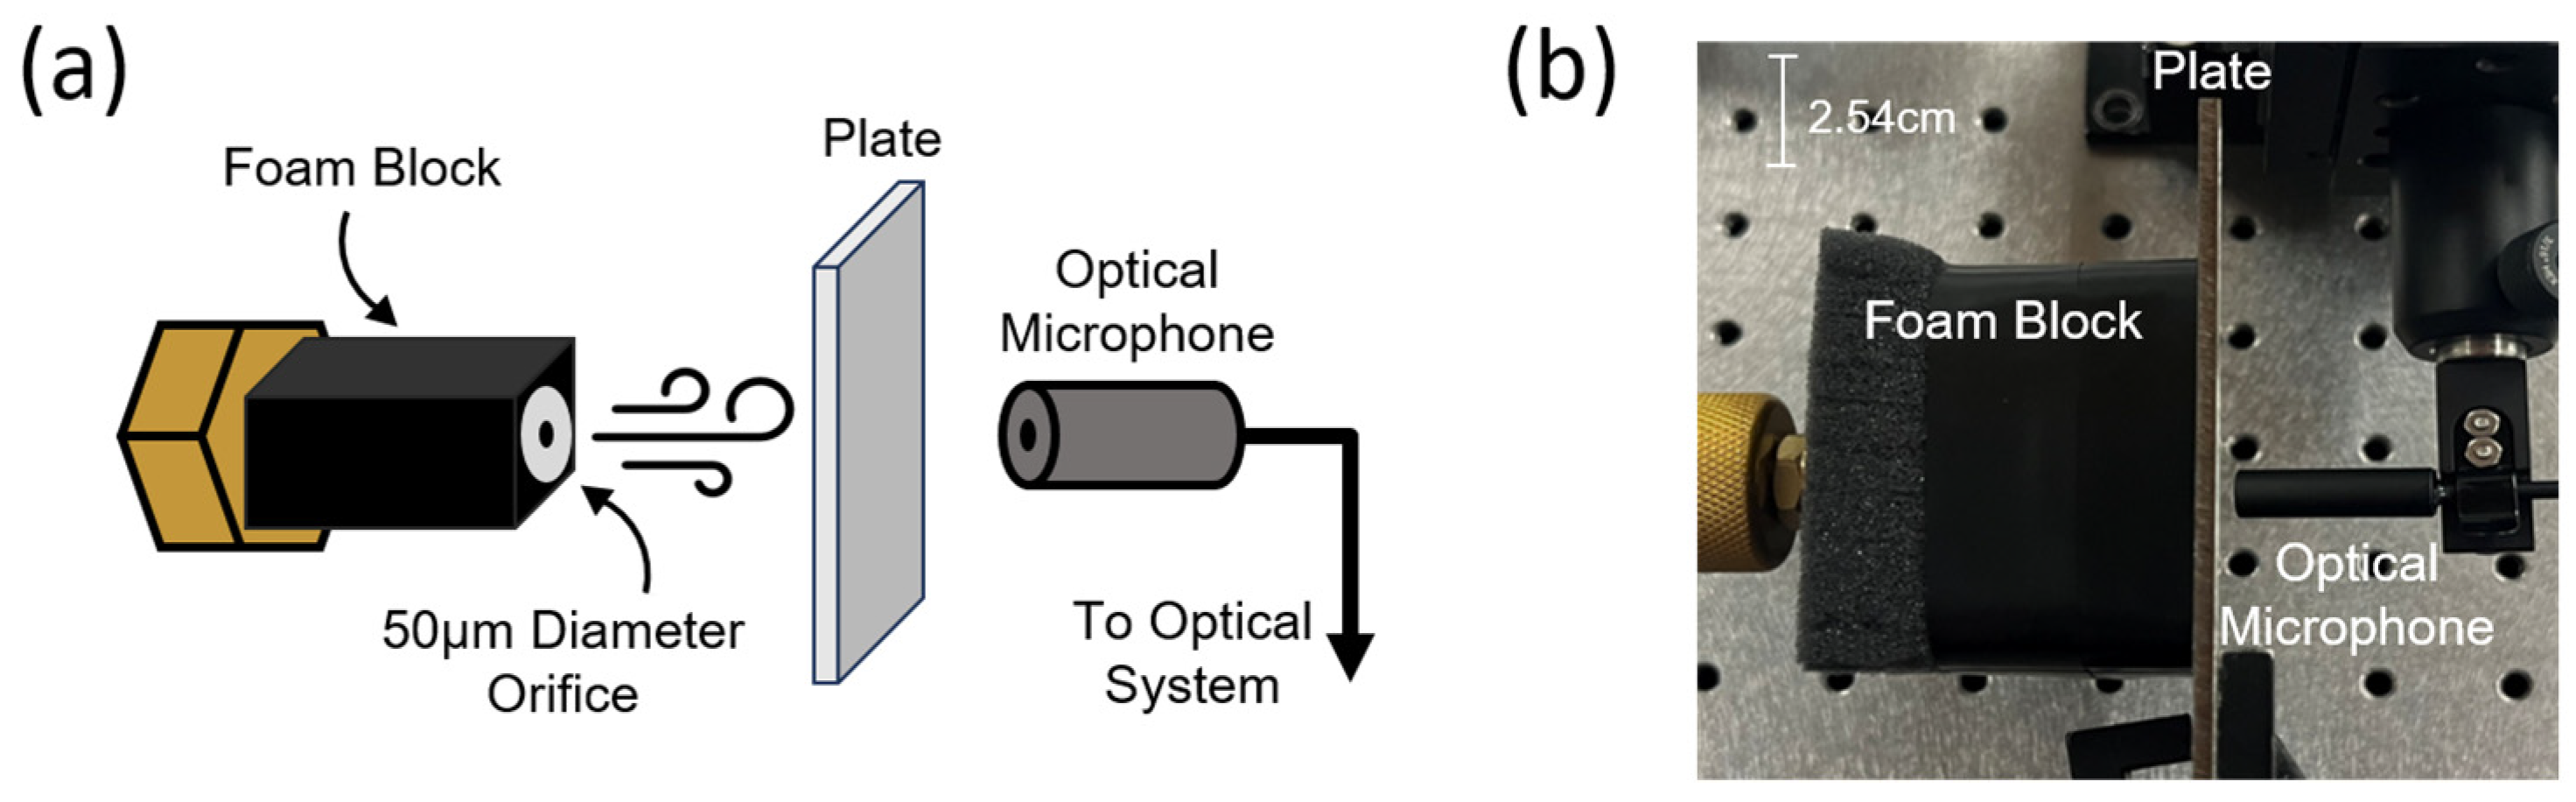
The experimental setup is shown schematically in Figure 2a. A portable PCP compressor (Vevor, Shanghai, China) was used to pressurize a small tank up to ~2000 psi. The tank was used to deliver pressurized air, through a variable regulator, to a short section (~1 m in length) of high-pressure tubing terminated by a ‘barb’-style fitting with a micron-scale, laser-machined hole (Lenox Laser Inc., Glen Arm, MD, USA, https://lenoxlaser.com/barbs/ (accessed 26 January 2026)). As mentioned, we recently showed [30] that an air jet emanating from such an orifice generates broadband ultrasound emissions extending to frequencies above several MHz, in keeping with theoretical expectations [40]. For the present study, we used a fitting with a hole ~50 μm in diameter, and the regulator pressure was set to ~1500 psi unless otherwise noted. This provided sufficient spectral bandwidth for the measurements, while also delivering greater ultrasound energy (for a given pressure) compared to smaller holes. Generally speaking, smaller orifices and higher pressures are expected to increase the spectral density at MHz frequencies [30], which might help to counteract the extreme air attenuation in that range. However, we found that the 50 μm diameter orifice gave optimal results given that we were limited to ~2000 psi by our available compressor and tank. Additional details are provided below and also in ref. [30].
Figure 2.
(a) Schematic depiction, and (b) photograph of the experimental setup. A pressurized gas jet emanating from a nominally 50 μm diameter orifice is positioned close to (typically within ~2 mm of) a plate surface, and an optomechanical ultrasound microphone is aligned directly opposite the jet and at similar distance from the plate. A foam block, wrapped with electrical tape, was used to encase the jet nozzle in order to reduce sound reaching the microphone via paths such as reflection off the optical table. In some cases, the microphone was similarly enclosed.
In a typical measurement, the end of the barb fitting was held ~1–3 mm from the plate surface. The fitting was encased in a foam block wrapped with electrical tape, and this block was pressed lightly against the plate in order to attenuate sound energy reaching the microphone by traveling around the plate (e.g., by bouncing off other surfaces such as the optical table). For transmission measurements, the optical microphone was on the opposite side of the plate and axially aligned to the air jet source. The microphone was typically held at ~2–3 mm from the plate surface, and slightly angled relative to the plate normal in order to suppress acoustic resonances in the air gap between the plate and the microphone. In some cases, we also placed an enclosure around the microphone in order to further suppress sound leakage paths. For same-side measurements, the microphone was taped to the edge of the foam block surrounding the barb fitting, and thus laterally offset from the air jet source by ~1–2 cm (foam blocks of various sizes were tried). Preliminary same-side measurement results are provided in the Supplementary File.
The optomechanical microphone used here is similar to those described in detail elsewhere [30,31,32,33]. It is based on a monolithically fabricated Fabry–Perot cavity with an upper flexible mirror which can move in response to incident pressure (i.e., sound) waves. The particular microphone used has a noise-equivalent pressure below 100 μPa Hz1/2 over a frequency range spanning from the kHz region up to ~5 MHz. Additional details on the microphone, the attached receiver, and the signal processing are provided in the Supplementary File.
3.2. Turbulent Jet Ultrasound Source
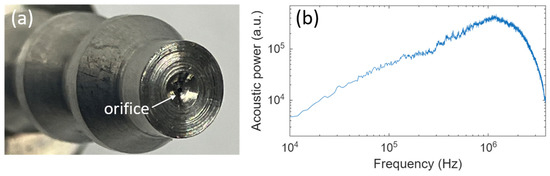
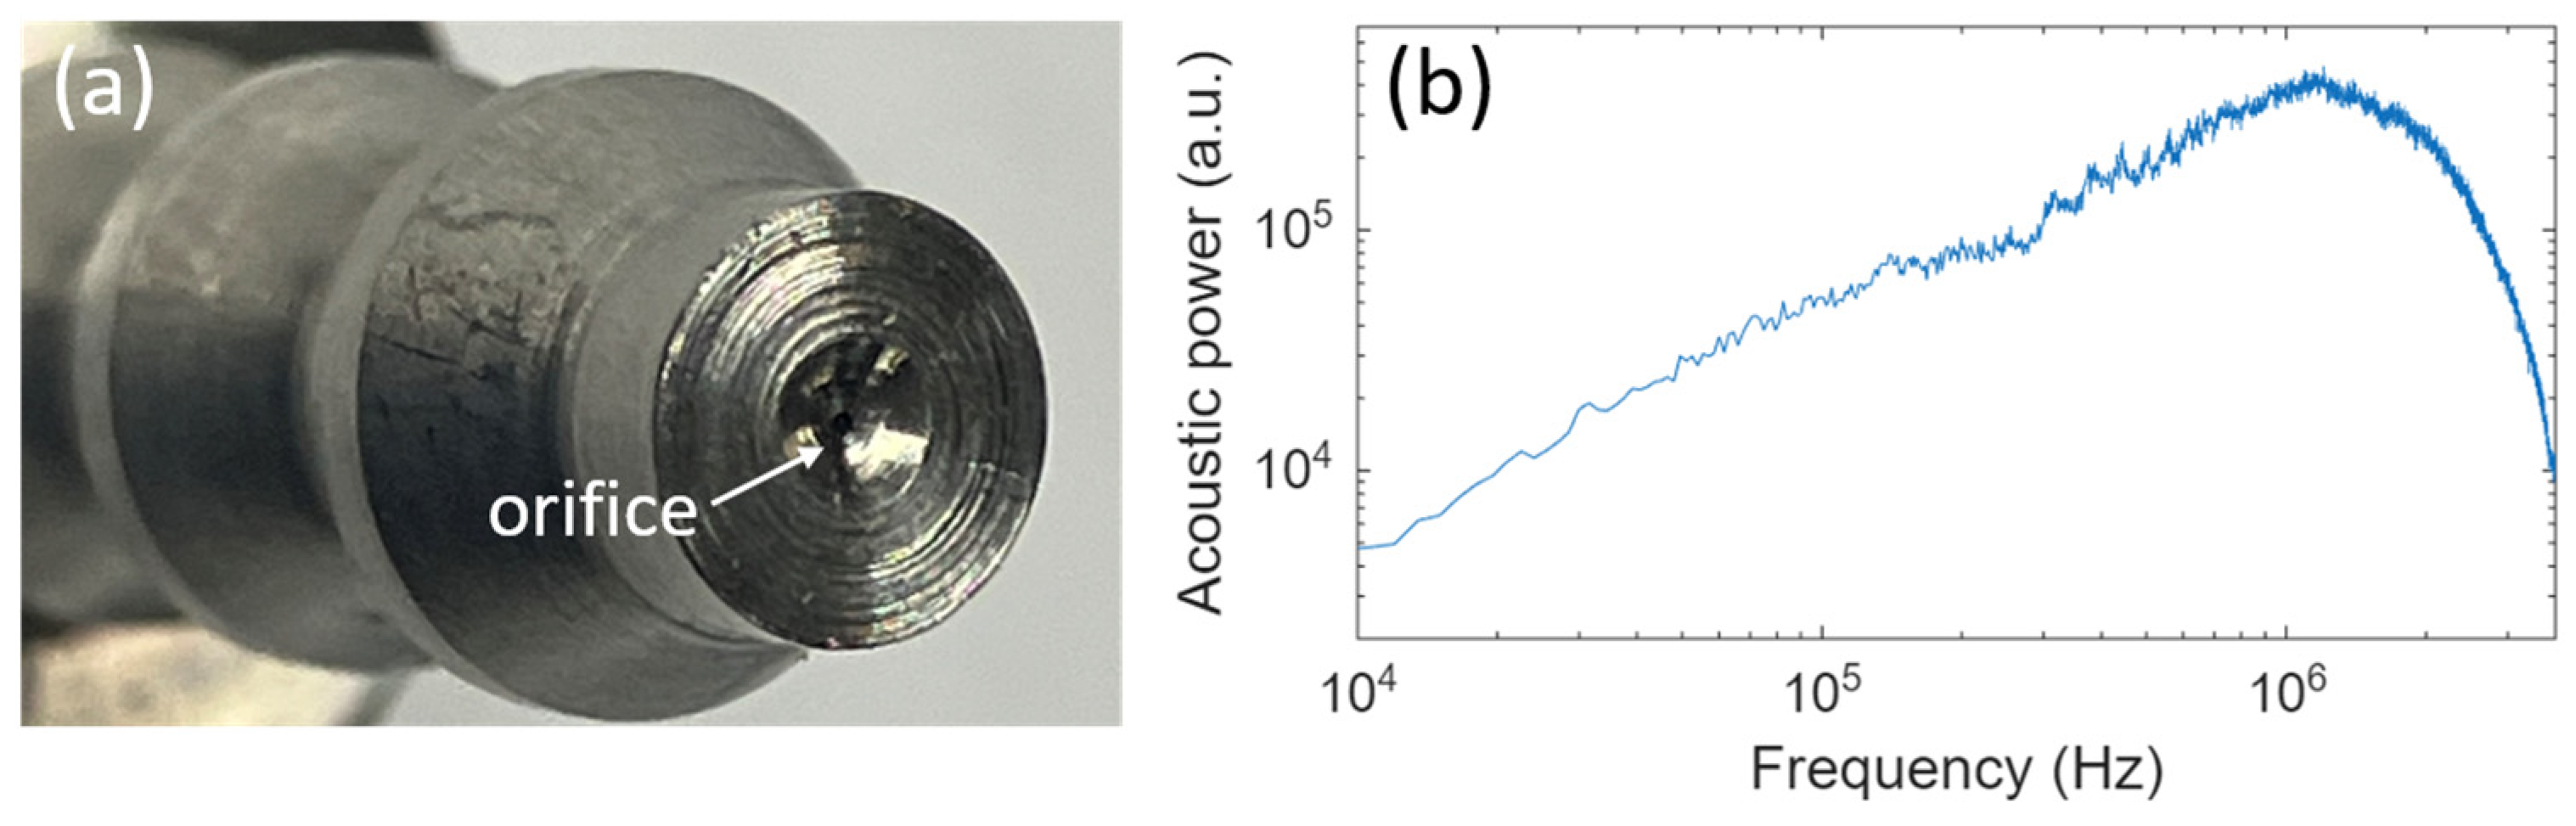
A photograph of the end of the barb-style fitting is shown in Figure 3a. The micromachined hole is located at the bottom of a larger crater, at a depth of ~1 mm from the flat end-face of the part. Given the typical barb-to-plate spacing mentioned above, it follows that the orifice (from which the gas jet emerges) was typically at least ~2–4 mm away from the plate in our experiments. It is well known that the turbulent noise produced by a jet is modified, and often increased in amplitude, if the jet is directed towards a solid boundary [29,41,42]. In principle, ‘impinging jet’ effects might be beneficial in terms of increasing the ultrasound energy coupled into a plate. However, ‘impingement tones’ can also be created by feedback between the turbulent regions and the plate surface. For NDT of plates, it is highly preferable that the source spectrum is as close as possible to being a broadband ‘white’ noise spectrum, devoid of distinct tonal features that could be misinterpreted as resonant features of the test object.
Figure 3.
(a) Photograph of a barb-style fitting with a laser-machined circular orifice located at the bottom of a larger crater, ~1 mm below the flat end face. (b) A typical acoustic power spectrum for the free air jet emanating from the nominally 50 μm diameter orifice used for the measurements below. The spectrum was captured with the microphone oriented perpendicular to and ~0.6 cm removed from the axis of the jet, and with the barb fitting pressurized at ~1000 psi.
In turbulent air jets, acoustic tones can arise for a variety of reasons. For example, supersonic jets are known to produce a high-amplitude and directional ‘screech’ tone [29,41,42]. However, the micromachined holes used here were not designed to produce supersonic flow, and we have not observed screech tones in our experiments spanning a variety of orifice sizes and pressures up to ~3000 psi. Rather, the observed aeroacoustic spectra have been shown to be consistent with sonic ‘choked’ flow conditions [40]. In the transonic regime, so-called ‘jet tones’ [43] are often observed, and their frequency varies with pressure and nozzle diameter. We occasionally observed these tones at low pressures (typically below ~400 psi) in the present setup, but since both their presence and frequency are pressure-dependent, they are easily discernible from plate resonances. Moreover, at sufficiently high pressure for a given orifice, these tones give way to a broadband turbulent noise spectrum [30,31,43].
An example spectrum is shown in Figure 3b, captured for the free jet emanating at ~1000 psi from the ~50 μm diameter orifice, and with the microphone perpendicular to, and at a distance of ~0.6 cm from, the jet axis. A few low-amplitude and broad peaks are visible in the region below 1 MHz, and these were found to vary with pressure and microphone position and the barb-to-plate spacing (see the Supplementary File for additional plots). We believe these might be attributable to interference and diffraction effects, since the acoustic wavelength at a few hundred kHz (i.e., ~1 mm in air) is similar to the diameter of the flat end-face of the barb fitting. In any case, these features do not pose a significant problem for identifying ZGV features of interest here, which lie mainly above 1 MHz and have much narrower linewidth.
It is also worth mentioning that the peak value of the curve in Figure 3b, at a frequency just above 1 MHz, corresponds to a pressure spectral density of ~10 Pa Hz1/2 [30]. The sharp drop above ~2 MHz is partly due to the rapid rise in ultrasound attenuation in air at those frequencies [13,30]. The jet noise could not be measured at lower jet-to-microphone spacing, due to dynamic range limits for the microphone used. Nevertheless, we expect that the sound level is higher near the jet, especially in the frequency range above 2 MHz. As supported by the results described below, this turbulent jet noise is in any case sufficiently energetic to excite Lamb waves in a variety of plates.
As mentioned, for a jet impinging on a plate so-called ‘impingement tones’ [41,42] can arise within a certain range of orifice-plate spacing [29] and might be mistaken for plate resonances if not taken into account. To assess this in our setup, we positioned our microphone at ~120 degrees from the down-stream jet axis and ~1 cm from the orifice and collected acoustic spectra for both the free jet (i.e., with no plate) and in the presence of an adjacent aluminum plate. Results are shown in the Supplementary File and confirm that there was very little change in the overall spectral shape, even with the barb fitting nearly in contact with the plate. Varying the barb-to-plate spacing typically resulted in discernible changes in the positions of the broad, low-amplitude peaks mentioned above. This furthermore supports the contention that these features arise due to diffraction and interference. Importantly, we did not typically observe discrete impingement tones for any spacing. Consistent with this, Strangfeld et al. [29] reported that impingement effects were not significant for nozzle–plate spacings exceeding ~10 nozzle (orifice) diameters. Notably, our experimental setup typically embodied an orifice–plate spacing of ~20–50 orifice diameters.
4. Results
The transmission setup described above was used to study a variety of plate materials, and several representative data sets are presented below. Additional examples, including proof-of-principle measurements with the gas jet source and microphone on the same side of a plate, are provided in the Supplementary File.
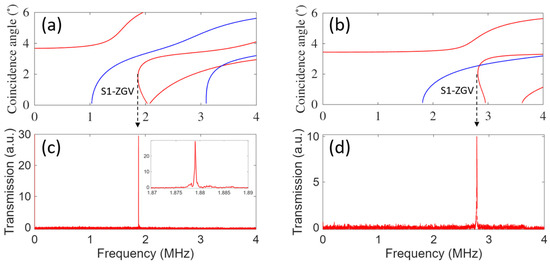
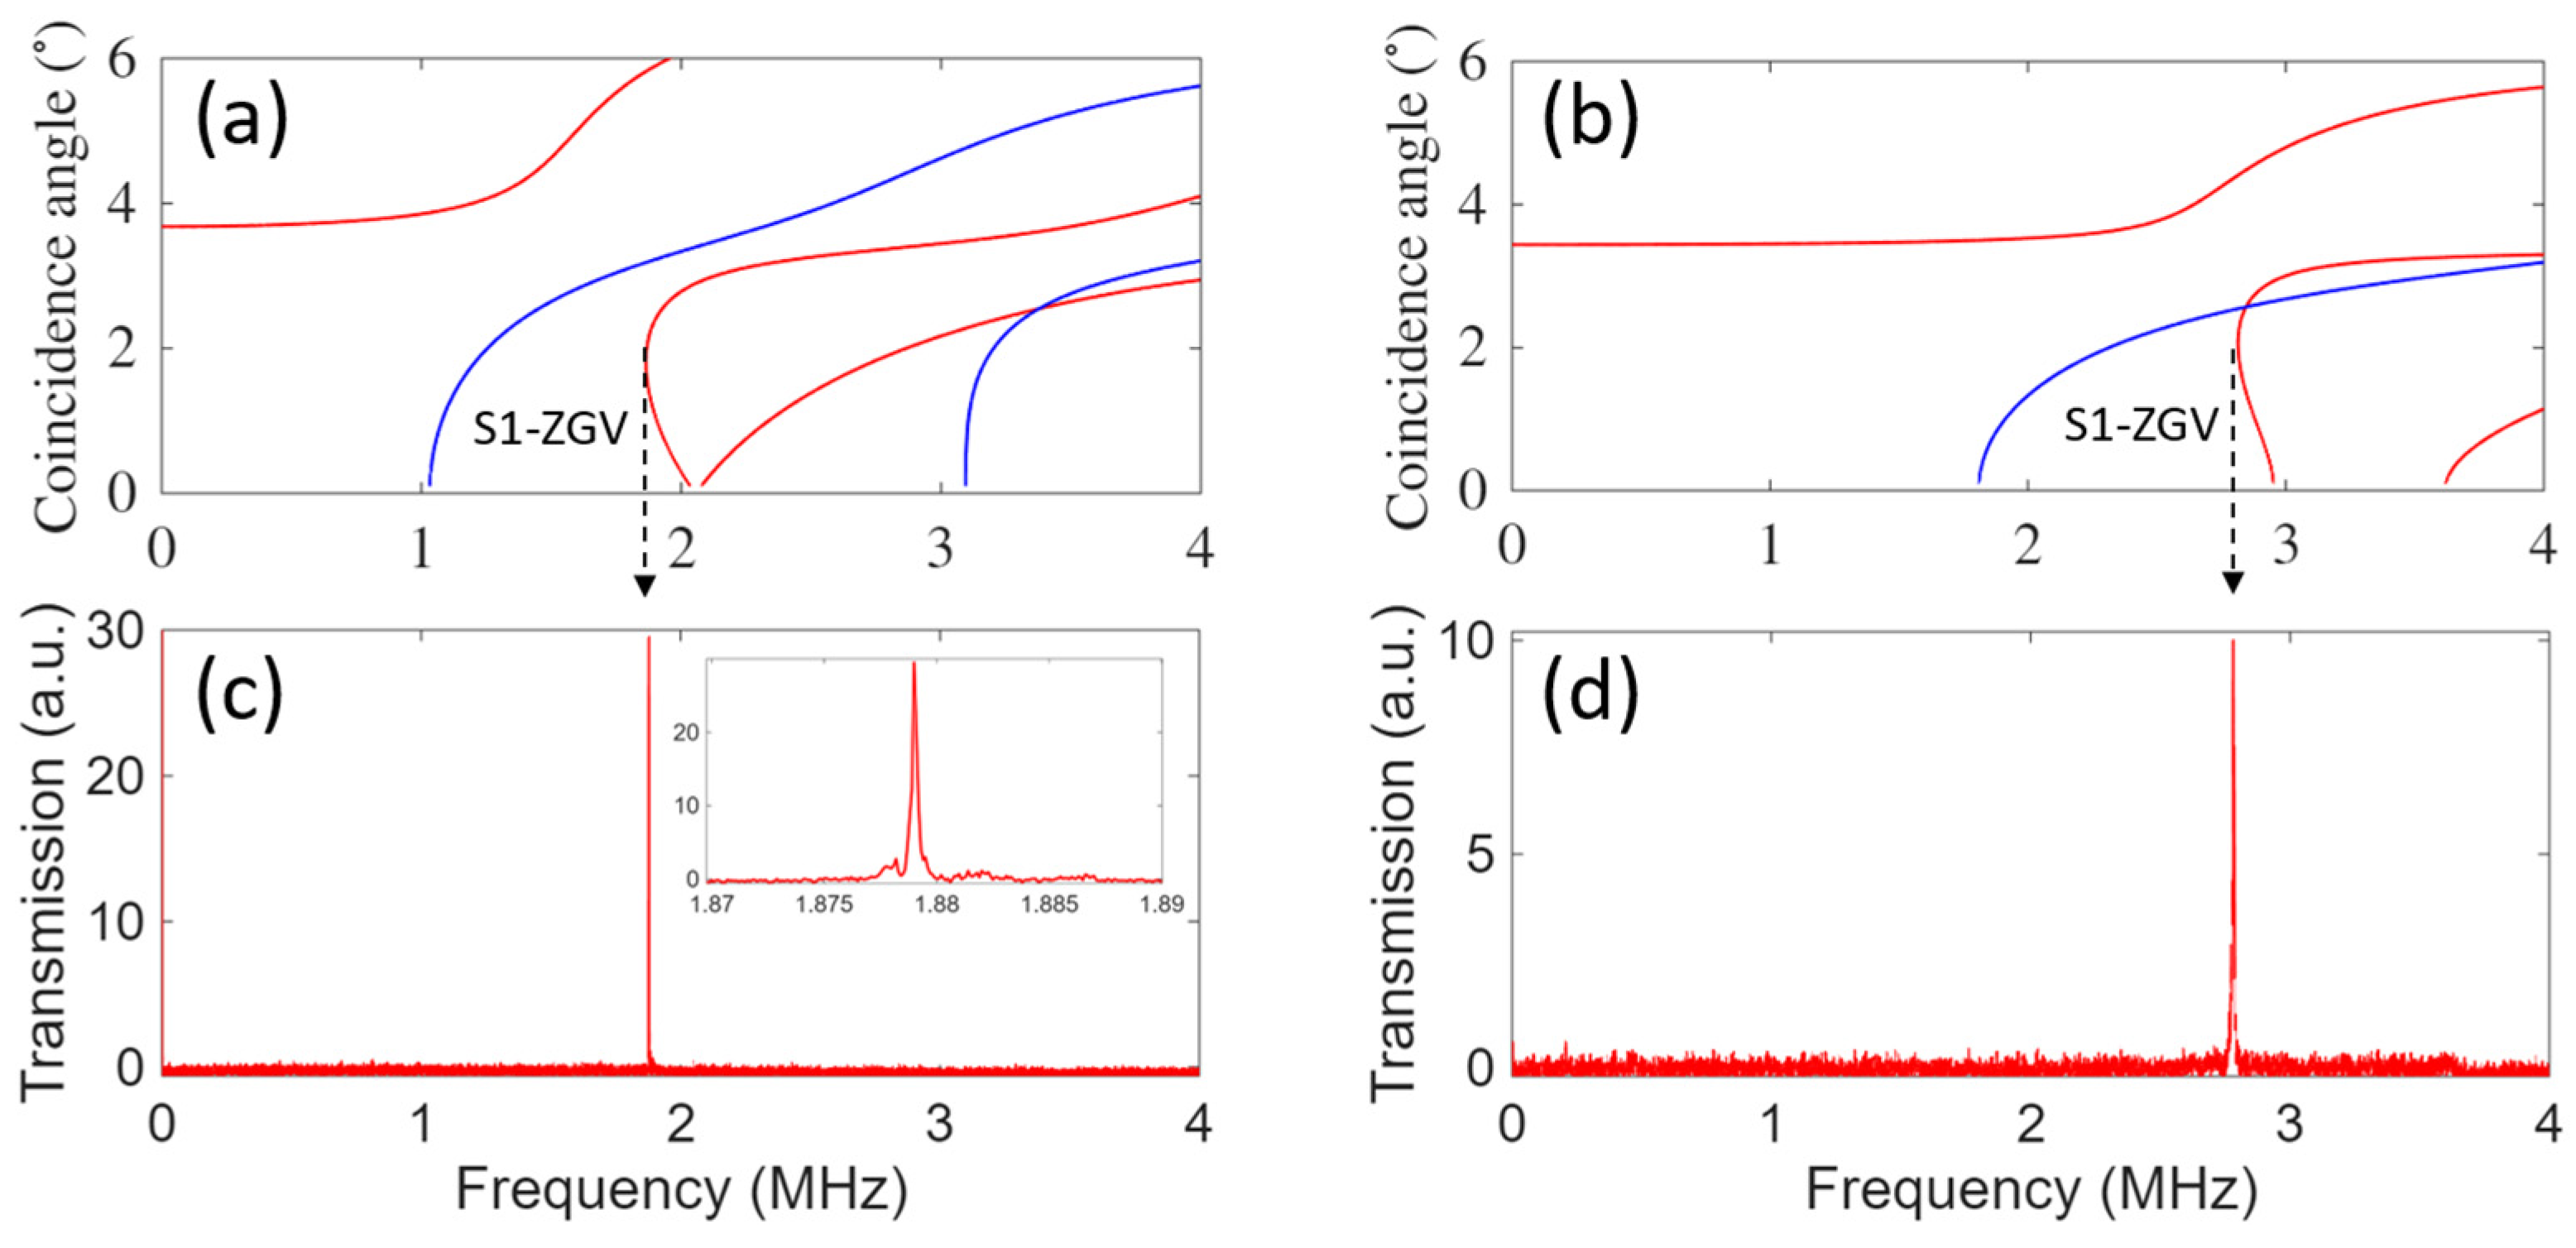
Figure 4 shows the numerically predicted dispersion relations and experimental transmission spectra for both a 1.5 mm thick aluminum plate and a 1 mm thick glass microscope slide. Notably, the lateral dimensions of the aluminum plate (~ 30 cm × 30 cm) are much larger than that of the glass slide (~4 cm × 5 cm). For simulation purposes, the materials were assumed to be aluminum alloy 1100 and borosilicate glass, respectively, from the materials library built into the numerical solver [39]. For each sample, a distinct and high-quality transmission resonance was observed and found to be in excellent agreement with the predicted S1-ZGV resonance frequency. For the aluminum sample, Figure 4a,c, the quality factor of the S1-ZGV transmission resonance is on the order of Q ~104, which is similar to values reported from laser-excitation-based studies [17,40]. The SNR for detection of the ZGV feature was estimated to be greater than 10 dB in both cases. The lower SNR for the glass case might be partly due to the small lateral dimensions of the slide, resulting in greater reception of ultrasound energy via ‘leakage’ paths around the plate. Moreover, its ZGV resonance lies at a higher frequency where the gas jet source has lower spectral content as discussed above. In any case, the SNR of both measurements compares favorably with previous ZGV studies in the literature, most of which employed high-energy pulsed lasers as discussed in Section 1.
Figure 4.
The predicted Lamb mode dispersion relations are shown for (a) 1.5 mm thick aluminum (alloy 1100), with S1-ZGV resonance at ~1.87 MHz, and (b) 1 mm thick borosilicate glass, with predicted S1-ZGV resonance at ~2.81 MHz. The corresponding ultrasound transmission measurements measured using the experimental setup described in the main text, for (c) nominally 1.5 mm thick aluminum sheet, and (d) nominally 1 mm thick glass slide (Fisher brand, Thermo Fisher Scientific, Waltham, MA, USA). Red and blue curves correspond to symmetric and asymmetric modes, respectively.
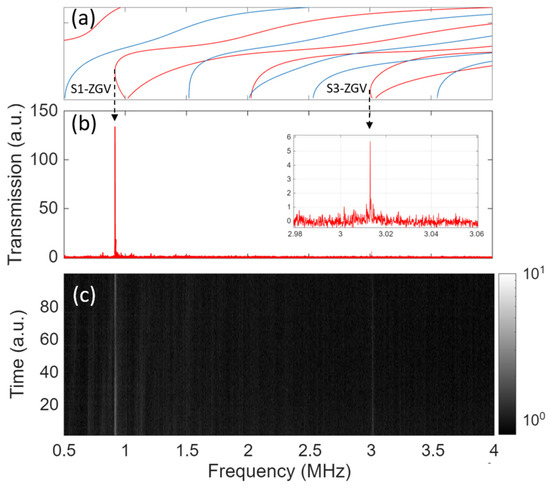
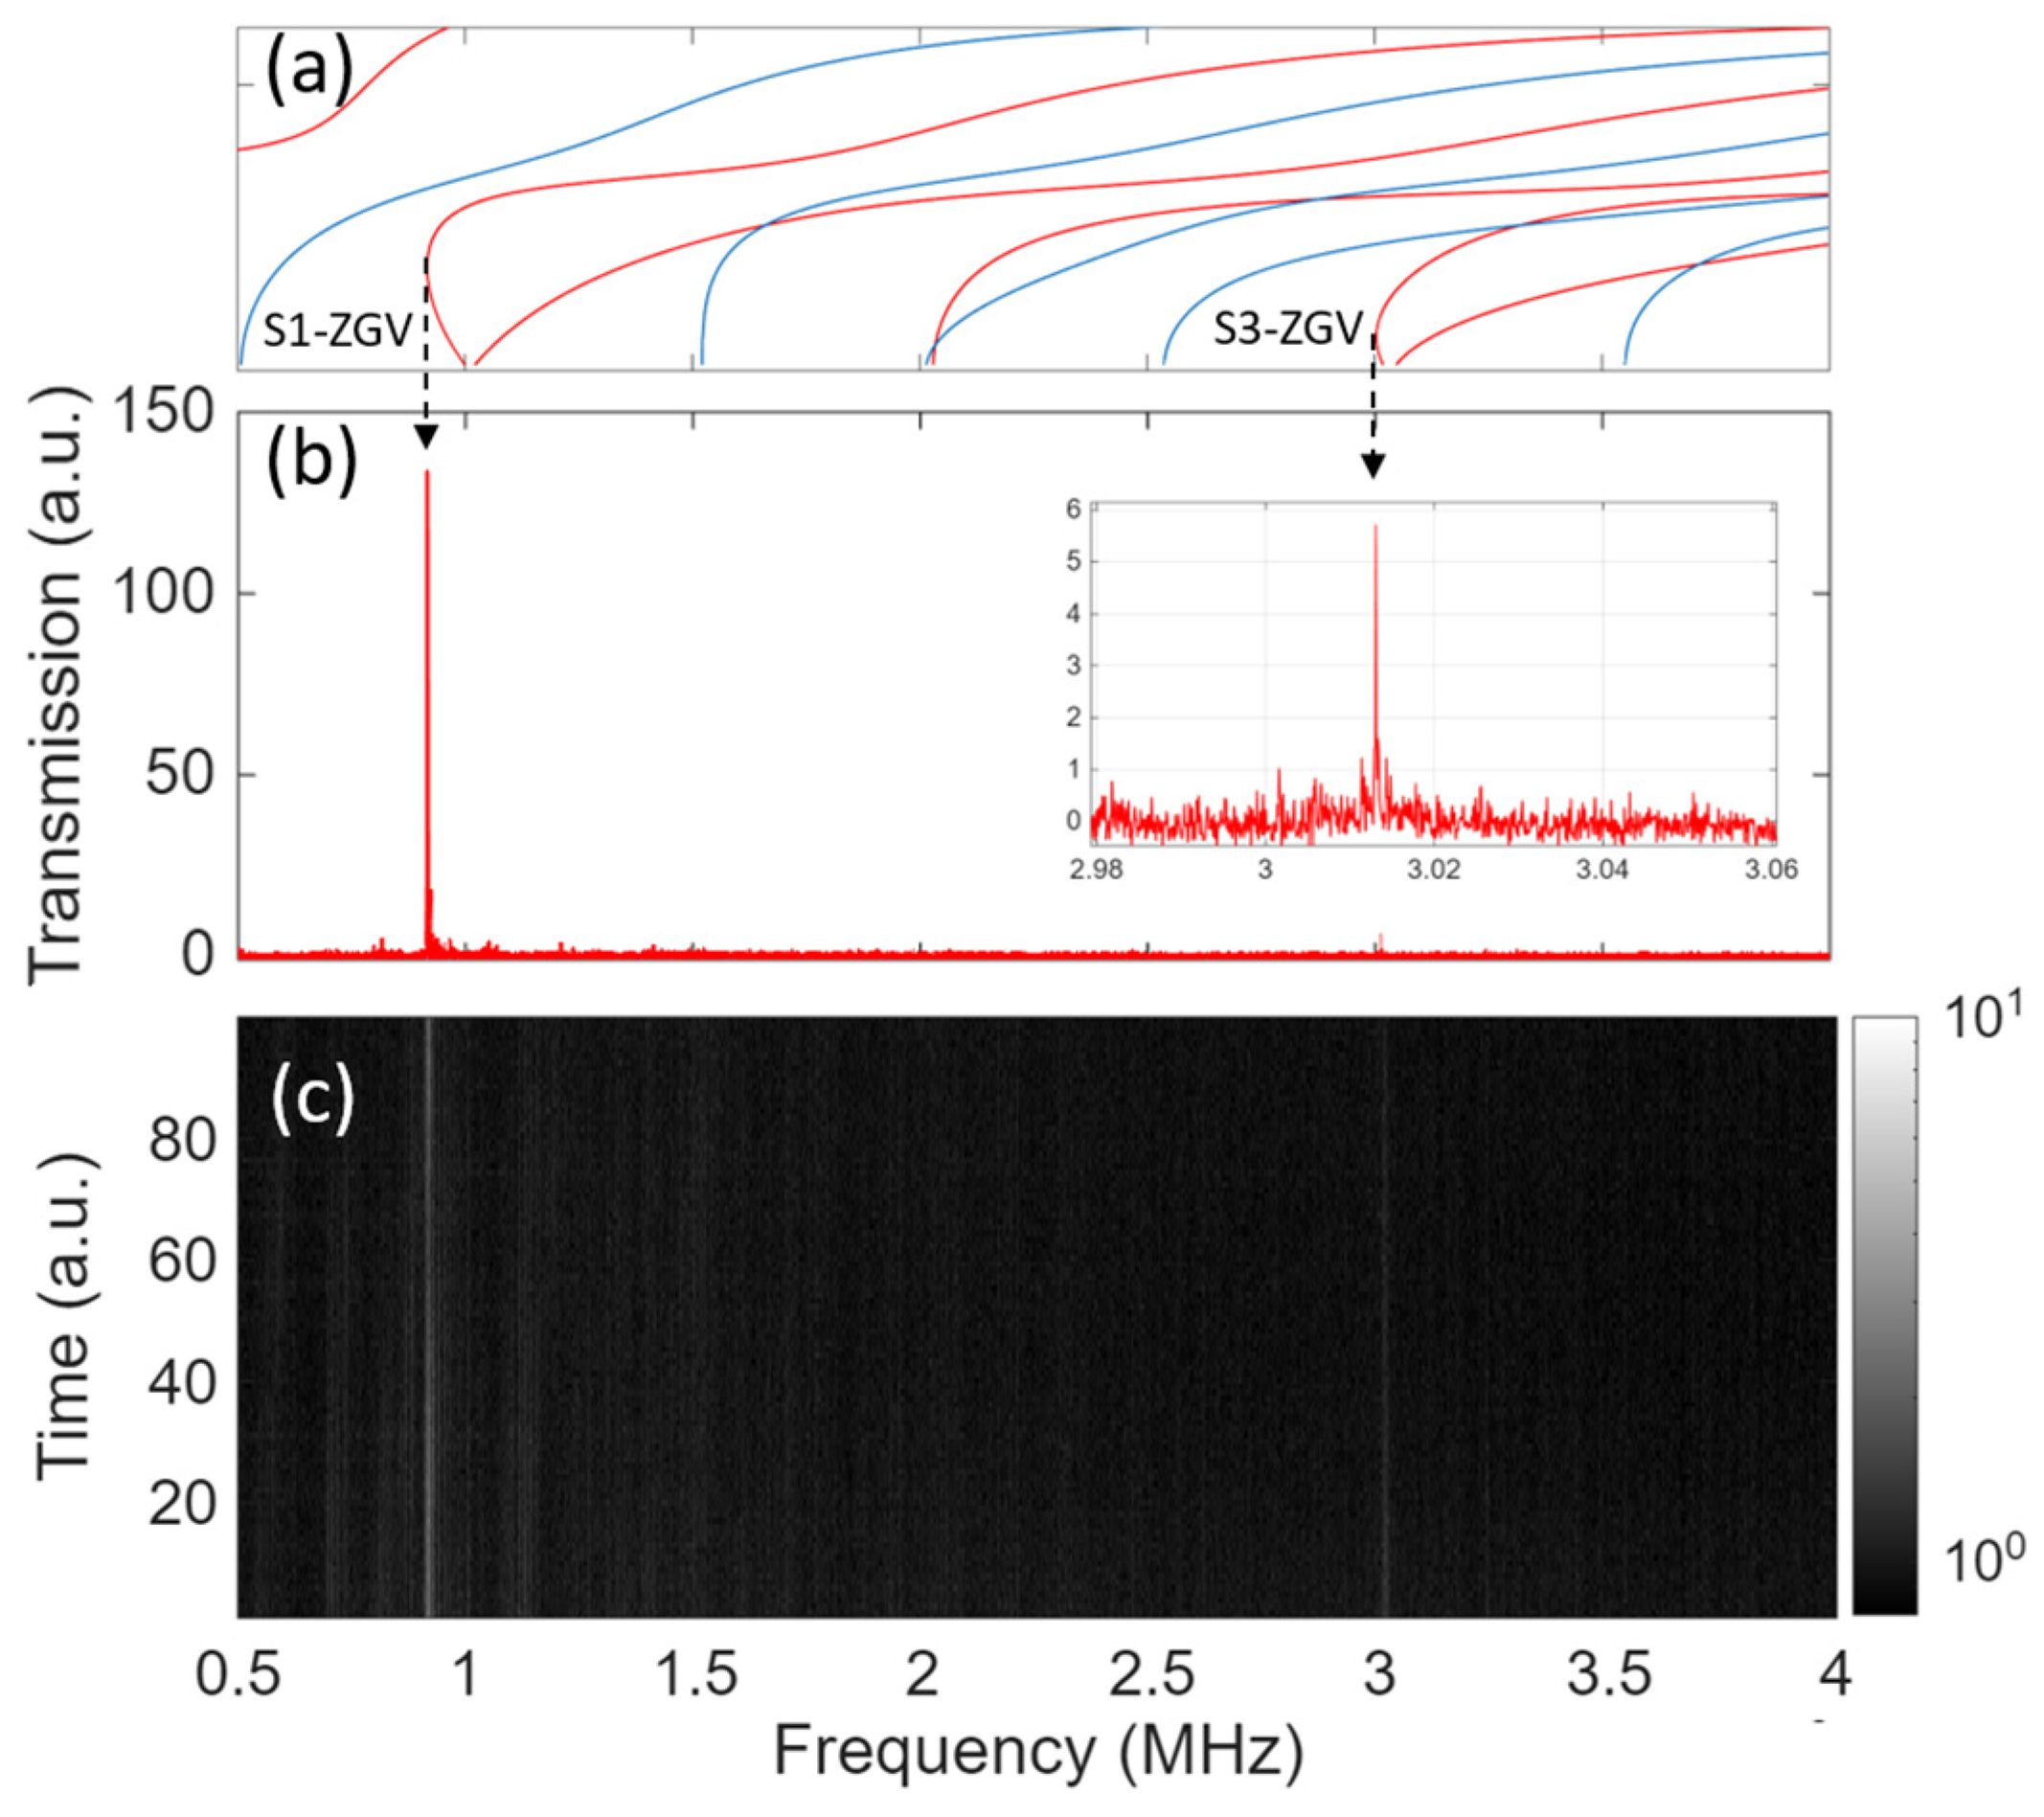
We next describe results for a slightly thicker (~3.05 mm) aluminum plate, with lateral dimensions ~10 cm × 10 cm. As discussed in Section 2, aluminum is expected to exhibit both S1-ZGV and S3-ZGV resonances, each having a predominately longitudinal sound-wave character and thus expected to couple with reasonable efficiency to sound waves in adjacent air. For the plate studied, these resonances are predicted to lie at f1 ~0.92 MHz and f3 ~3.01 MHz, as shown in Figure 5a. Both of these features were observed, as shown, for example, in the transmission spectrum plotted in Figure 5b. The S3-ZGV feature is relatively weak here, due to the inherent properties of the dispersion relations and also due to the lower source energy at this frequency (see Figure 3b). The preponderance of the S3-ZGV mode is better illustrated in the frequency–time color map shown in Figure 5c. Detection of multiple ZGV resonances in a single scan can be beneficial for extracting the elastic properties of a material [17,39].
Figure 5.
Results for an aluminum plate of thickness ~3.05 mm are shown. (a) The numerically calculated dispersion relationship for aluminum alloy 1100 plate of this thickness, with ZGV resonances predicted at ~0.92, and 3.01 MHz as indicated. (b) A transmission spectrum capture at one instant in time, with distinct features attributed to S1-ZGV and S3-ZGVresonances indicated. The inset figure shows a zoomed in view of the S3-ZGV resonance. (c) A color map showing transmission versus frequency with time on the vertical axis, to better illustrate the presence and preponderance of two distinct ZGV resonances. Red and blue curves correspond to symmetric and asymmetric modes, respectively.
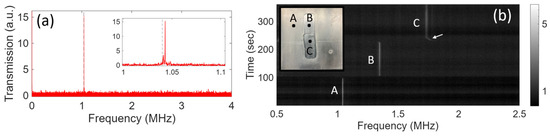
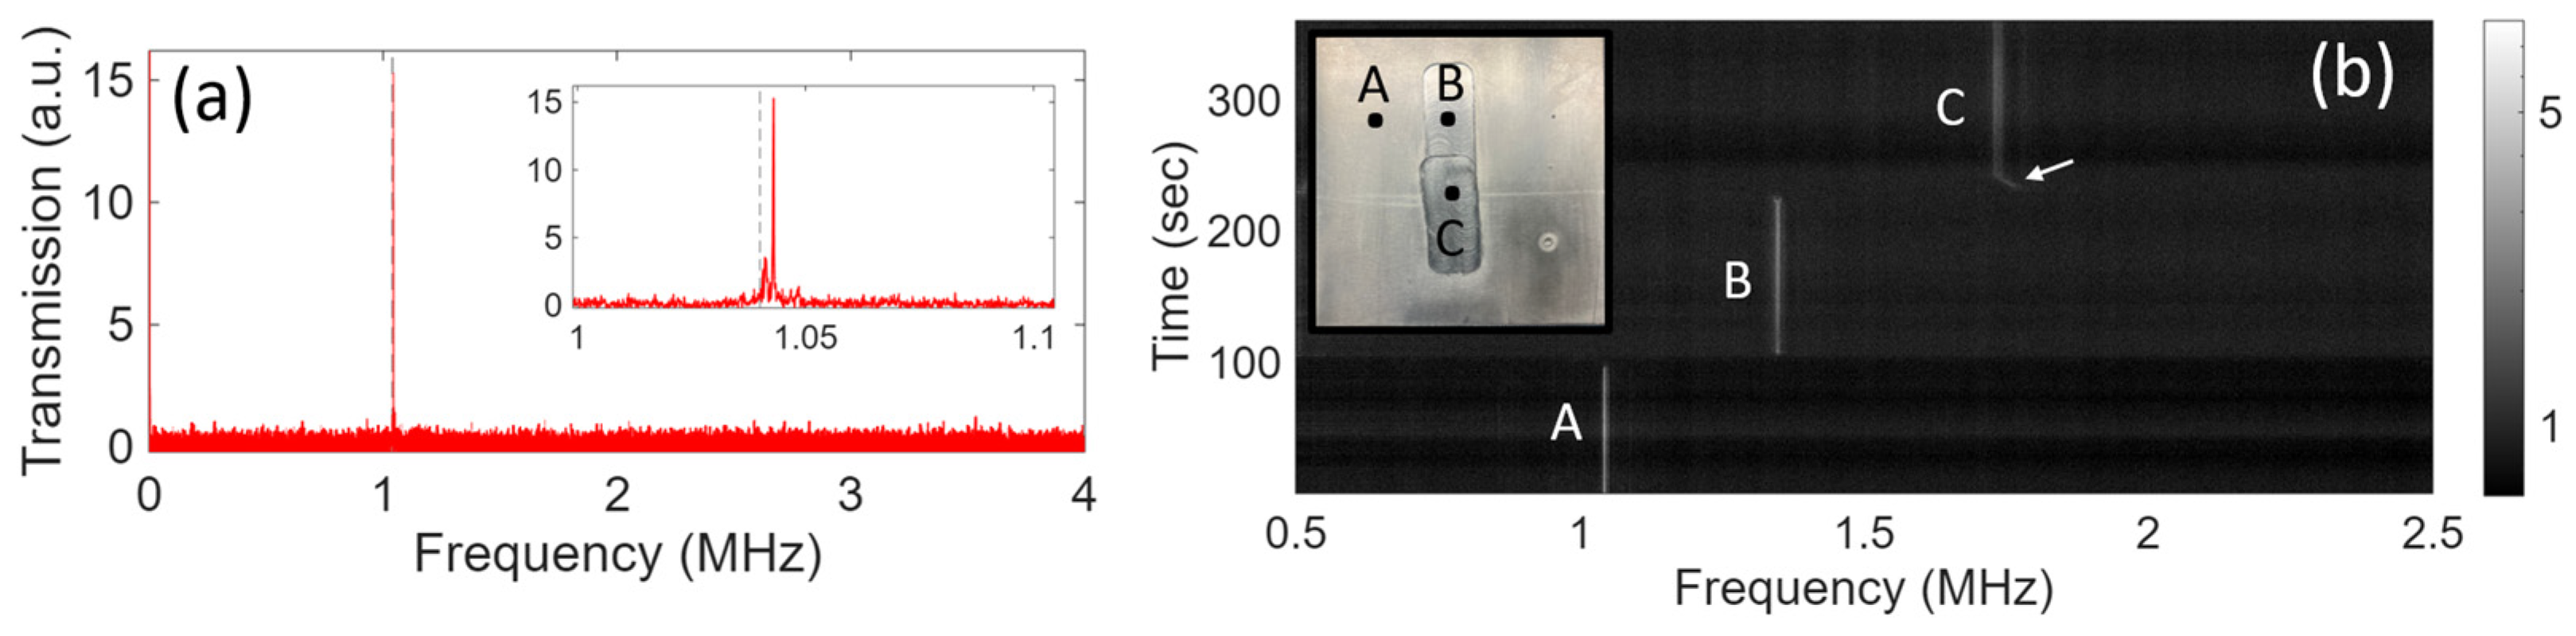
As a final example, we describe measurements on a stainless-steel plate, ~0.1″ (2.54 mm) thick and with lateral dimensions ~10 cm × 10 cm. As shown in Figure 6a, a high-SNR transmission feature was observed at ~1.04 MHz, in agreement with the predicted S1-ZGV frequency (see Figure 3a) indicated by the vertical gray line. The slight discrepancy can easily be attributed to tolerances in the thickness or the values of the model parameters used. It is worth pointing out that non-contact ultrasound measurements on steel plates have traditionally been very challenging [10,11,12] due to the high impedance mismatch at the air-steel interfaces. In our setup, high SNR transmission features were extracted in measurement times well below 1 s (see the Supplementary File for additional discussion). This is made possible by the continuous ultrasound energy supplied by the gas jet source combined with the extremely low noise floor of the optomechanical microphone [30,31,32,33].
Figure 6.
(a) Transmission spectrum for a nominally 0.1″ thick stainless-steel plate. A sharp transmission resonance (Q~104) is present near the predicted S1-ZGV frequency indicated by the vertical dashed gray line. (b) Results of a manual c-scan measurement performed near machined regions of the steel plate, shown in the inset. The thicknesses in the regions labeled A, B, and C are ~2.54, 2.0 and 1.5 mm, respectively. The correspondingly predicted S1-ZGV frequencies are f1~1.04, 1.33, and 1.76 MHz, respectively, in very good agreement with the high transmission bands visible in the color map. The color map shows ultrasound energy received in transmission versus frequency, and with time on the vertical axis. The air jet ultrasound source and the microphone were held in a fixed position on opposite sides while the plate was slowly translated along a path from points A to B to C. A ‘dead zone’ with no ZGV feature occurs at the boundary between each of the regions. The arrow indicates a region where the tool created a small trench at the boundary between B and C.
Subsequently, this plate was machined in two overlapping regions to produce sections with thicknesses ~2.0 mm (labeled region B) and ~1.5 mm (labeled region C), as shown in the inset of Figure 6b. To demonstrate a rudimentary ‘c-scan’ capability, the gas jet source and microphone were held in fixed positions on opposite sides of the plate while the plate was manually translated. The color map in Figure 6b shows the transmitted ultrasound frequency spectrum versus time, as the excitation point was slowly translated along a path from point A to B to C.
Note that a high-quality, high-SNR ZGV resonance feature was consistently observed in the non-machined regions (e.g., point A) of the plate. Note also that the ZGV feature shifted to higher frequency as the plate excitation point was moved from thicker towards thinner regions, and that the transmission resonance in each case is very well aligned with the predicted S1-ZGV resonance band. The quality of the resonance decreases in the machined parts of the plate, however, as can be discerned from inspection of the data in Figure 6b. This can be attributed to the increased roughness of the machined surface, apparent in the image from the inset of Figure 6b. This roughness results in a thickness variation across the transverse dimensions of the ZGV resonance, with central lobe diameter ~2·d ~ 5 mm for this plate (see Section 2.2). Moreover, higher scattering losses are expected for the thinner and rougher plate sections, which would further increase the linewidth of the ZGV transmission resonance [18]. The maximum roughness that can be tolerated will undoubtedly depend on details such as the plate material and thickness and the source energy but is left for future study. Finally, note that ‘dead zones’ are apparent in Figure 6b, whenever the excitation point was aligned near the edges of a region. This suggests that the ZGV resonance is disrupted at these relatively large thickness ‘steps’. Nevertheless, it is known that ZGV resonances can enable high-resolution c-scan mapping of small-scale surface relief created by thin film patterning [14,19,20] or corrosion processes [21]. We hope to refine our measurement setup to enable similar studies in future work.
5. Conclusions
In summary, we reported non-contact ultrasound measurement in the MHz frequency range on a variety of glass and metal plate materials using a micrometer-scale compressed-air jet source and an optomechanical microphone receiver. This setup enables high SNR extraction of well-known ZGV resonance features without the need for high-voltage transmit or receive electronics, or lengthy measurement times. We attribute this to the continuous, broadband ultrasound signal produced by the gas jet and also to the low noise of the microphone. Our results demonstrate, for the first time to our knowledge, that gas-jet sources [29] have good potential to facilitate ACUS measurements at frequencies well into the MHz range. Moreover, the ‘point source’ nature of the turbulent gas jet pairs well with the ‘point receiver’ nature of the optomechanical microphone, which is ~100 μm in diameter and provides omnidirectional response at MHz frequencies [30,31,32,33]. Together, they are naturally suited to ZGV-based measurements, since ZGV resonances comprise a continuous angular distribution of acoustic component waves [14]. The bandwidth of the current system (~0.1–4 MHz) implies an ability to measure plate thicknesses spanning ~1–10 mm, given typical values of elastic constants for solid materials of interest. This range is mainly limited by the ultrasound source spectrum for the current setup and could feasibly be increased by using smaller gas orifices and higher differential pressures. Of course, air attenuation above a few MHz is extreme and might always place an upper frequency limit (and associated lower limit on plate thickness), which a laser ultrasonic system does not have [19].
This setup was tested on a variety of plastic, glass, and metal plates, and additional example data sets are provided in the Supplementary File. It is worth reiterating that ACUS measurements on steel plates are typically the most challenging. To date, such measurements are rare in the literature [10,11,12] and have required high-voltage transmit and receive electronics combined with advanced signal processing in order to achieve reasonable SNR. By comparison, our setup yields equal or better SNR for ultrasound transmission measurements and does not involve high voltages or complex signal processing. This is in part attributable to the efficient coupling of the ultrasound produced by the sub-millimeter turbulent air jet source to localized ZGV modes of a plate, as well as to the continuous energy supplied by this source. Both of these aspects help to counter the extreme impedance mismatch at the air–solid boundaries. We believe our approach might find significant interest for applications requiring the real-time, in-line, and/or rapid inspection of parts in both factory and field settings.
Supplementary Materials
The following supporting information can be downloaded at: https://www.mdpi.com/article/10.3390/ndt4010007/s1, Figure S1: A more detailed schematic of the experimental setup from the main manuscript. Figure S2: Acoustic spectrum of a typical free air jet source used to excite ZGV plate modes, also displaying normalization methods. Figure S3: Photograph of setup used to assess the impact of plate proximity on the acoustic spectrum of the air jet source, and corresponding graphical results. Table S1: Table displaying the material properties assumed for numerical modeling of each of the plate types studied. Figure S4: A representative result for ZGV detection with the microphone positioned on the same side of an aluminum plate as the air jet source. Figure S5: Experimental transmission spectrum for the bottom portion of a pyrex beaker. Figure S6: Experimental c-scan image based on a ZGV transmission setup, for a glass slide with an adhered Scotch tape feature. References [30,31,32,33,35] are cited in the Supplementary Materials.
Author Contributions
Conceptualization, R.G.D.; methodology, R.G.D. and J.P.; software, N.S. and J.P.; validation, J.P., N.S. and R.G.D., formal analysis, R.G.D. and J.P.; investigation, J.P., R.G.D., K.G.S., N.S., E.F.D. and A.C.; resources, R.G.D.; data curation, J.P. and R.G.D.; writing—original draft preparation, R.G.D.; writing—review and editing, J.P., N.S., E.F.D., A.C. and K.G.S.; supervision, R.G.D.; project administration, R.G.D.; funding acquisition, R.G.D. All authors have read and agreed to the published version of the manuscript.
Funding
This research was funded by Natural Sciences and Engineering Research Council (NSERC) of Canada (Discovery Grants Program).
Data Availability Statement
The raw data supporting the conclusions of this article will be made available by the authors on request.
Conflicts of Interest
Authors Ayden Chen and Kyle G. Scheuer were employed by and are shareholders of the company Ultracoustics Technologies Ltd. Author Elizabeth DeCorby was employed by the company Ultracoustics Technologies Ltd. Author Ray G. DeCorby was a shareholder of the company Ultracoustics Technologies Ltd. The remaining authors declare that the research was conducted in the absence of any commercial or financial relationships that could be construed as a potential conflict of interest.
Abbreviations
The following abbreviations are used in this manuscript:
| ACUS | Air-coupled ultrasound |
| NCUS | Non-contact ultrasound |
| SNR | Signal-to-noise ratio |
| ZGV | Zero group velocity |
References
- Blomme, E.; Bulcaen, D.; Declercq, F. Air-coupled ultrasonic NDE: Experiments in the frequency range 750 kHz–2 MHz. NDT E Int. 2002, 35, 417–426. [Google Scholar] [CrossRef] [Scilit]
- Green, R.E. Non-contact ultrasonic techniques. Ultrasonics 2004, 42, 9–16. [Google Scholar] [CrossRef] [Scilit]
- Chimenti, D.E. Review of air-coupled ultrasonic materials characterization. Ultrasonics 2014, 54, 1804–1816. [Google Scholar] [CrossRef] [Scilit] [PubMed]
- Essig, W.; Bernhardt, Y.; Döring, D.; Solodov, I.; Gautzsch, T.; Gaal, M.; Hufschläger, D.; Sommerhuber, R.; Brauns, M.; Marhenke, T.; et al. Air-coupled ultrasound—Emerging NDT method. ZfP-Zeitung 2021, 173, 32–43. [Google Scholar]
- Datta, D.; di Scalea, F.L. High-speed inspection of rails by passive ultrasonic monitoring. ASME J. Nondestruct. Eval. 2022, 5, 041007. [Google Scholar] [CrossRef] [Scilit]
- Grandia, W.A.; Fortunko, C.M. NDE applications of air-coupled ultrasonic transducers. In Proceedings of the 1995 IEEE Ultrasonics Symposium, Seattle, WA, USA, 7–10 November 1995; Volume 1, pp. 697–709. [Google Scholar]
- Schindel, D.W. Air-coupled generation and detection of ultrasonic bulk waves in metals using micromachined capacitance transducers. Ultrasonics 1997, 35, 179–181. [Google Scholar] [CrossRef] [Scilit]
- Ladabaum, I.; Jin, X.; Soh, H.T.; Atalar, A.; Khuri-Yakub, B.T. Surface micromachined capacitive ultrasonic transducers. IEEE Trans. Ultrason. Ferroelectr. Freq. Control 1998, 45, 678–690. [Google Scholar] [CrossRef] [Scilit] [PubMed]
- Wright, W.M.D.; Hutchins, D.A. Air-coupled ultrasonic testing of metals using broadband pulses in through-transmission. Ultrasonics 1999, 37, 19–22. [Google Scholar] [CrossRef] [Scilit]
- Waag, G.; Hoff, L.; Norli, P. Air-coupled ultrasonic through transmission thickness measurements of steel plates. Ultrasonics 2015, 56, 332–339. [Google Scholar] [CrossRef] [Scilit]
- Alvarez-Arenas, T.G.; Camacho, J. Air-coupled and resonant pulse-echo ultrasonic techniques. Sensors 2019, 19, 2221. [Google Scholar] [CrossRef] [Scilit]
- Li, R.; Yang, L.; Zhang, J.; Lian, Z. Improved singular spectrum decomposition method for resonance recognition of air-coupled ultrasonic signals in through-transmission steel plate detection. Meas. Sci. Technol. 2025, 36, 0161a9. [Google Scholar] [CrossRef] [Scilit]
- Takahashi, S. Properties and characteristics of P(VDF/TrFE) transducers manufactured by a solution casting method for use in the MHz-range ultrasound in air. Ultrasonics 2012, 52, 422–426. [Google Scholar] [CrossRef] [Scilit]
- Holland, S.D.; Chimenti, D.E. Air-coupled acoustic imaging with zero-group-velocity Lamb modes. Appl. Phys. Lett. 2003, 83, 2704–2706. [Google Scholar] [CrossRef] [Scilit]
- Kausel, E. On the number and location of zero-group-velocity modes. J. Acoust. Soc. Am. 2012, 131, 3601–3610. [Google Scholar] [CrossRef] [Scilit]
- Stobbe, D.M.; Grunsteidl, C.M.; Murray, T.W. Propagation and scattering of Lamb waves at conical points in plates. Sci. Rep. 2019, 9, 15216. [Google Scholar] [CrossRef] [Scilit]
- Clorennec, D.; Prada, C.; Royer, D. Local and noncontact measurements of bulk acoustic wave velocities in thin isotropic plates and shells using zero group velocity Lamb modes. J. Appl. Phys. 2007, 101, 034908. [Google Scholar] [CrossRef] [Scilit]
- Prada, C.; Clorennec, D.; Royer, D. Local vibration of an elastic plate and zero-group velocity Lamb modes. J. Acoust. Soc. Am. 2008, 124, 203–212. [Google Scholar] [CrossRef] [Scilit]
- Clorennec, D.; Prada, C.; Royer, D. Laser ultrasonic inspection of plates using zero-group velocity Lamb modes. IEEE Trans. Ultrason. Ferroelectr. Freq. Control 2010, 57, 1125–1132. [Google Scholar] [CrossRef] [Scilit]
- Ces, M.; Clorennec, D.; Royer, D.; Prada, C. Thin layer thickness measurements by zero group velocity Lamb mode resonances. Rev. Sci. Instrum. 2011, 82, 114902. [Google Scholar] [CrossRef] [Scilit] [PubMed]
- Guo, S.; Yin, S.; Deng, M. Evaluation of surface corrosion damage in thin plates by zero-group velocity Lamb waves based on PVDF comb transducers. Thin-Walled Struct. 2024, 204, 112345. [Google Scholar] [CrossRef] [Scilit]
- Gibson, A.; Popovics, J.S. Lamb wave basis for impact-echo method analysis. J. Eng. Mech. 2005, 131, 438–443. [Google Scholar] [CrossRef] [Scilit]
- Charau, A.Y.; Laurent, J.; Valier-Brasier, T. Adiabatic Lamb modes in 3D tapered waveguides: Cut-off effects and ZGV resonances. Ultrasonics 2025, 155, 107733. [Google Scholar] [CrossRef] [Scilit] [PubMed]
- Wu, Y.; Cui, R.; Zhang, K.; Zhu, X.; Popovics, J.S. On the existence of zero-group velocity modes in free rails: Modeling and experiments. NDT E Int. 2022, 132, 102727. [Google Scholar] [CrossRef] [Scilit]
- McBride, S.L.; Hutchison, T.S. Helium gas jet spectral calibration of acoustic emission transducers and systems. Can. J. Phys. 1976, 54, 1824–1830. [Google Scholar] [CrossRef] [Scilit]
- Larose, E.; Roux, P.; Campillo, M. Reconstruction of Rayleigh-Lamb dispersion spectrum based on noise obtained from air-jet forcing. J. Acoust. Soc. Am. 2007, 122, 3437–3444. [Google Scholar] [CrossRef] [Scilit]
- Reed, N.; Corcoran, J. Passive wall thickness monitoring using acoustic emission excitation. NDT E Int. 2024, 148, 103241. [Google Scholar] [CrossRef] [Scilit]
- ASTM E976-15; Standard Guide for Determining the Reproducibility of Acoustic Emission Sensor Response. American Society for Testing and Materials: West Conshohocken, PA, USA, 2021.
- Strangfeld, C.; Groteluschen, B.; Buhling, B. Air-coupled broadband impact-echo actuation using supersonic jet flow. J. Nondestruct. Eval. 2024, 43, 45. [Google Scholar] [CrossRef] [Scilit]
- Scheuer, K.G.; Chen, A.; Teves, G.; DeCorby, R.G. Characterization of micro-scale gas leaks using an optomechanical ultrasound sensor. J. Acoust. Soc. Am. 2025, 158, 329–335. [Google Scholar] [CrossRef] [Scilit]
- Scheuer, K.G.; DeCorby, R.G. Air-coupled ultrasound using broadband shock waves from piezoelectric spark igniters. Appl. Phys. Lett. 2024, 125, 082202. [Google Scholar] [CrossRef] [Scilit]
- Scheuer, K.G.; DeCorby, R.G. Spectroscopy of substrate thermal vibrational modes using an optomechanical sensor. Opt. Mater. Express 2024, 14, 1793–1802. [Google Scholar] [CrossRef] [Scilit]
- Pretula, J.; Shaw, N.; Chen, A.; Scheuer, K.G.; DeCorby, R.G. Resonant ultrasound spectroscopy detection using a non-contact ultrasound microphone. Sensors 2025, 25, 6154. [Google Scholar] [CrossRef] [Scilit]
- Lamb, H. On waves in an elastic plate. Proc. R. Soc. Lond. Ser. A Contain. Pap. A Math. Phys. Character 1917, 93, 114–128. [Google Scholar]
- Available online: https://github.com/ArminHuber/Dispersion-Calculator (accessed on 1 November 2025).
- Clorennec, D.; Prada, C.; Royer, D. Laser impulse generation and interferometer detection of zero group velocity Lamb mode resonance. Appl. Phys. Lett. 2006, 89, 024101. [Google Scholar] [CrossRef] [Scilit]
- Balogun, O.; Murray, T.W.; Prada, C. Simulation and measurement of the optical excitation of the S1 zero goup velocity Lamb wave resonance in plates. J. Appl. Phys. 2007, 102, 064914. [Google Scholar] [CrossRef] [Scilit]
- Bruno, F.; Laurent, J.; Jehanno, P.; Royer, D.; Prada, C. Laser beam shaping for enhanced zero-group velocity Lamb modes generation. J. Acoust. Soc. Am. 2016, 140, 2829–2838. [Google Scholar] [CrossRef] [Scilit] [PubMed]
- Li, Y.; Guo, Z.; He, Y.; Wang, K.; Su, Z.; Guo, S. Simultaneous measurement of thickness and bulk wave velocities of thin plates using laser-excited local ultrasonic resonances. Mech. Syst. Signal Process. 2025, 228, 112442. [Google Scholar] [CrossRef] [Scilit]
- Lighthill, J. Some aspects of the aeroacoustics of high-speed jets. Theoret. Comput. Fluid Dyn. 1994, 6, 261–280. [Google Scholar] [CrossRef] [Scilit]
- Dhamanekar, A.; Srinivasan, K. Effect of impingement surface roughness on the noise of impinging jets. Phys. Fluids 2014, 26, 036101. [Google Scholar] [CrossRef] [Scilit]
- Edgington-Mitchell, D. Aeroacoustic resonance and self-excitation in screeching and impinging supersonic jets—A review. Int. J. Aeroacoustics 2019, 18, 118–188. [Google Scholar] [CrossRef] [Scilit]
- Scheuer, K.G.; DeCorby, R.G. All-optical, air-coupled ultrasonic detection of low-pressure gas leaks and observation of jet tones in the MHz range. Sensors 2023, 23, 5665. [Google Scholar] [CrossRef] [Scilit]
Disclaimer/Publisher’s Note: The statements, opinions and data contained in all publications are solely those of the individual author(s) and contributor(s) and not of MDPI and/or the editor(s). MDPI and/or the editor(s) disclaim responsibility for any injury to people or property resulting from any ideas, methods, instructions or products referred to in the content. |
© 2026 by the authors. Licensee MDPI, Basel, Switzerland. This article is an open access article distributed under the terms and conditions of the Creative Commons Attribution (CC BY) license.