


Abstract
With the rise in demand for electric vehicles (EV), hairpin welding is gaining popularity for its efficient manufacturing of critical EV motor components. Due to its high electrical and thermal conductivity and relative affordability, copper is commonly used. The tip of the hairpin can be joined by laser welding, micro TIG, and resistance brazing. Of these techniques, infrared (IR) laser welding is commonly used for its high dimensional accuracy and non-contact joining. However, copper is highly reflective to IR wavelengths, limiting the speed of this technique in joining copper hairpin couples. Considering the high manufacturing volume of the EV motor industry combined with copper hairpins being a high-volume component in each EV motor, copper’s high reflectivity to IR wavelengths presents a significant challenge to EV manufacturing efficiency. To accommodate this challenge, many researchers have examined the feasibility of using blue diode lasers to produce copper hairpin welds to leverage copper’s higher absorptivity to blue light wavelengths. Alternatively, this paper investigates a hybrid approach in which both IR and blue diode lasers (BDL) are used simultaneously to benefit from the advantages of both IR and blue wavelengths. To investigate this technique, hairpins were laser spot welded using IR, and hybrid technology was also analyzed and presented. Successful welds were produced in 0.6 s with both IR-only and hybrid techniques. Using IR-only and a power of 1000 W, a shallow weld joint with a fusion zone depth ranging from 0.2 to 2.8 mm was produced. A satisfactory weld joint (weld bead) was achieved when the IR power was increased to 1300 W exhibiting a fusion zone depth of 3.0 to 3.1 mm. When the hybrid method (1000 W IR with 750 W BDL) was employed, a satisfactory weld joint was also achieved with a fusion zone depth of 2.9 to 3.0 mm. Electrical resistivity measurements of the 1300 W IR-only and hybrid methods were on the same order of magnitude as the unwelded copper reference of 1.9 × 10⁻⁴ Ω.cm. Hairpins welded with 1000 W IR resulted in higher electrical resistivities ranging from 1.2 × 10⁻³ to 6.2 × 10⁻³ Ω.cm. Peel force tests demonstrated the highest max peel force of 770 ± 15 N under the 1300 W IR condition, whereas the 1000 W IR and hybrid methods resulted in max peel forces of 410 ± 15 and 720 ± 20 N, respectively. Regarding peel test elongation at failure, the hybrid method was highest at 13 ± 3%, followed by IR with 1300 W at 12 ± 3% and IR with 1000 W at 11 ± 2%. The results of this paper demonstrate comparable microstructural, electrical, and mechanical properties under hybrid welding to higher power IR welding, simultaneously showing hybrid laser welding as a suitable alternative in copper hairpin joining for EV motor application.
1. Introduction
Electric vehicle (EV) motors contain two essential components that convert electric energy into mechanical motion: the rotor and the stator [1,2]. The stator is a stationary part with copper coils that create a magnetic field to spin the rotor and generate torque in an output shaft. To increase vehicle efficiency, many manufacturers have turned to square or rectangular wire in the stator coil assembly, allowing more copper (and thus more electric current) to fit within the same geometric constraints as round wire. Contrarily, square wire is much more difficult to shape than traditional round wire, presenting a unique manufacturing challenge. One solution is the use of copper hairpins—the name given to this component attributed to their identical shape to the hairpin—that are inserted into the stator assembly and then spot welded together to make each turn of the coil [3,4]. It is imperative that the hairpin welds are both mechanically strong and exhibit minimal electrical resistance, as EV motors experience significant vibrations during operation and must be electrically efficient to justify their use over alternative wire designs. For EV motor application, many authors evaluate weld quality using ISO-standardized peel testing procedures, with high-quality welds exhibiting peak peel forces exceeding 600 N and electrical resistance values approaching that of bulk copper [5,6,7]. However, it is important to note that, in practice, fatigue failure is most likely to occur, and one must take this into consideration when evaluating the physical properties reported in the literature and in this report. Several methods are commonly used to weld the hairpin, including laser welding, micro TIG welding, and resistance brazing [4,8]. The weld must be of high quality (with sufficient weld penetration and a joint area free of defects), as it provides both mechanical and electrical contact. It should be strong, stable, and last for a long time.
Laser welding is most commonly used to create copper hairpin welds for its high geometric precision, comparatively fast welding speed, and automation. Most often, infrared (IR) laser welding technology is used for copper hairpin welding for its industrial accessibility and extensive coverage in the literature. Glaessel et al. demonstrated IR laser welding of copper hairpins using an IR disk laser with powers ranging from 2.5 to 7 kW, using a sample size of 3.15 × 1.6 mm and a cross-sectional area of 5.04 mm2 [9]. The authors achieved a max weld depth of 4.1 mm in 0.11 s. The electrical resistance of the welds was measured to be approximately 90 µΩ for samples with a weld depth of 4.1 mm, and approximately 110 µΩ for those with a depth of 1.3 mm. Their results showed that deeper weld depth is associated with lower electrical resistance [9]. Later work by Glaessel et al. investigated the effect of insulation contamination on weld properties and achieved even lower electrical resistances of approximately 33 to 48 µΩ on 2.5 × 4.2 mm samples (10.5 mm2) with the same laser system and as their prior work and power ranging from 4 to 8 kW [10]. Given that the electrical resistance of the unwelded base material in the study was 50.5 µΩ, the results by Glaessel et al. effectively demonstrate IR laser welding as a suitable candidate for copper hairpin welding. Elsewhere, Dimatteo et al. employed a continuous-wave (CW) nLight Alta 3.0 kW Yb: fiber laser with a near-infrared wavelength of 1070 nm and using 1.5 to 2.5 kW of power [11]. The pure copper samples used had a length of about 100 mm with a cross-sectional area of 7 mm2. The welded samples were subjected to resistance (R) measurements and peel testing, resulting in electrical resistances of 95 and 113 µΩ (the resistance value for the unwelded (base metal) was approximately 114 µΩ), and peel test shear forces ranging from 190 to 490 [11]. Similar results were achieved by D’Arcangelo et al. using an IR disk laser with a power of 4 kW operating at two different wavelengths (1070 nm and 1030 nm) and two different spot sizes (215 µm and 150 µm, respectively), achieving peel test peak shear forces ranging from 200 to 500 N with an average of approximately 320 N with a weld time of 135 ms (0.135 s) [12].
While promising in electrical resistivity, marginal peel testing results and desire for faster welding speeds have driven other authors to experiment with alternative laser welding techniques. Ning and Zhang investigated the influence of ultrasonic assistance on copper hairpins welded with IR laser using a sample size of 1 mm × 4 mm (4 mm2) and laser power ranging from 1.2 to 1.5 k [6]. While high peel test shear forces of up to 716 N were achieved by Ning and Zhang, these welds required relatively long weld times ranging from 2 to 6 s. Given copper’s low absorptivity to IR wavelengths (approximately 10%), many authors have experimented with green and blue wavelength lasers to leverage copper’s higher absorptivity to green and blue light of 40 and 60%, respectively (according to measurements by Pasang et al. [13]). Demir et al. experimented with near-IR (1030 to 1070 nm), mid-green (515 nm), and mid blue (455 nm) lasers on pure Cu samples with dimensions of 3.87 × 2.66 mm (10.29 mm2) with power ranging from 2.1 to 6 kW [14]. From the peel tests, it was found that the highest force was produced by near-IR radiation at 6 kW, resulting in a force of around 400 N, whereas the mid-green and mid-blue equipped with 3 kW power resulted in similar peak peel forces of approximately 250 N each. The authors concluded that near-IR light was most successful due to the formation of a stable keyhole and had significantly higher irradiance compared to the mid-green and mid-blue conditions [14]. Examining strictly blue laser welding, Feve et al. successfully welded 1 × 1 mm copper pins using a 500 W continuous-wave blue laser system, achieving a weld depth of 1 mm and claiming that the weldments were mechanically strong and that no spatter was observed during welding [15]. Many other authors have also found success in welding copper using blue diode laser (BDL) systems [13,16,17,18,19,20,21,22,23,24], prompting it as an alternative method to weld copper hairpins. Takenaka et al. demonstrated that BDL welding of copper can improve melt pool stability and Ono et al. found that reduced spatter was associated with lower-power densities of BDL welding [22,24]. Tang et al. employed a blue laser with a power of 1950 W to weld rectangular copper wires measuring 4 × 2 mm (8 mm2) [7]. Welding times ranged from 0.3 to 1.1 s. Additionally, several offset distances were tested, but the offset of 0.5 mm and welding time of 0.7 s were found to be the most ideal, resulting in an optimal near-spherical weld bead with a width of 5.4 mm and a depth of around 4 mm. Regarding electrical resistance, a longer weld time was associated with lower resistance [7].
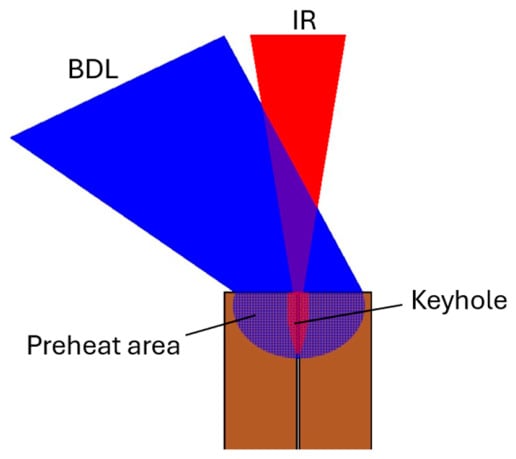
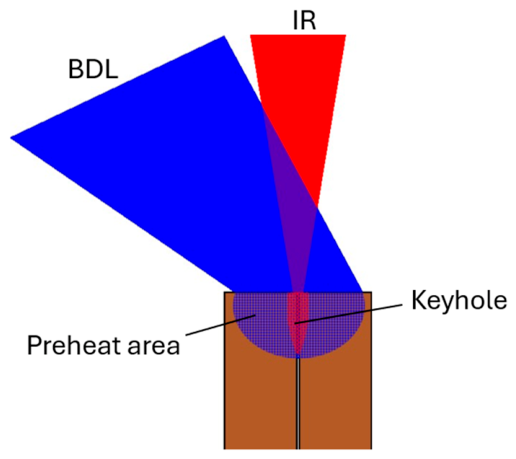
More recently, hybrid methods combining IR laser with green or blue laser simultaneously have shown potential to improve welding efficiency by increasing the absorption of green/blue laser by copper [23,25,26]. Hess et al. combined infrared and green lasers with respective wavelengths of 1030 nm and 515 nm, finding that individually, both the IR and green lasers achieved weld depths of less than 100 µm [26]. However, under the hybrid method, a weld depth of 300 µm was achieved. Fujio et al. compared a single-mode fiber laser (IR) vs. a hybrid laser combining a BDL and an IR fiber laser, finding that the addition of the blue diode laser accelerates copper melting [23]. A theoretical explanation for this phenomenon is that the shorter-wavelength laser effectively preheats the surface and initiates melting to form a stable melt pool, while the smaller spot size from an IR laser forms a stable keyhole for deep penetration between the hairpin couple, as shown schematically in Figure 1.
Figure 1.
Schematic demonstrating surface preheating and keyhole formation during hybrid welding of Cu hairpins. The red beam represents the infrared (IR) laser, while the blue beam represents the blue diode laser (BDL), simultaneously irradiating the weld region of the copper hairpin couple, represented by the brown rectangles.
Additionally, absorptivity experiments of copper in both liquid and solid state performed by Kohl et al. suggest that copper absorption IR radiation increases approximately 5% once in the liquid state [27]. Thus, by heating the surface of the copper hairpins to the liquid state, the efficiency of the IR laser input theoretically increases.
According to the literature review, many studies have assessed the weldability of copper hairpins using various laser sources, combinations of laser sources, and laser process parameters. However, few studies have demonstrated the ability to achieve short weld times while maintaining low electrical resistivity and high mechanical strength. Furthermore, studies directly comparing hybrid methods to traditional IR-only methods remain limited despite the potential demonstrated by hybrid welding techniques. The novelty of the present work lies in demonstrating 0.6 s hairpin welds that maintained electrical resistivity values comparable to those of the base material and peel forces exceeding 600 N, using both IR-only and hybrid techniques. Additionally, a direct comparison between IR-only and hybrid hairpin welding is presented to determine the relative performance of the two approaches under an identical weld time. While most previously published welded samples used scanning patterns, in this paper, all welds were performed as spot welds, with weld times held at 0.6 s. Hairpin weld quality was assessed through metallographic, electrical (resistivity), and mechanical (tensile peel force and microhardness) characterization. Using these analyses, weld penetration, shape, and structure were correlated to the resulting mechanical and electrical properties for each processing condition.
2. Materials and Methods
2.1. Material
The material used in these experiments was oxygen-free copper (>99.96%) shaped into rectangular strips measuring 2.5 × 3 × 100 mm (thickness × width × length), resulting in a cross-sectional area of 7.5 mm2. The original strips were covered with an insulating material. Approximately 10 mm of the insulation was removed from one end of each strip, where the weld joint was formed.
2.2. Welding Experiments
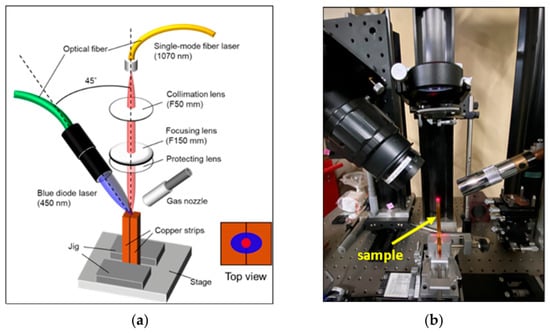
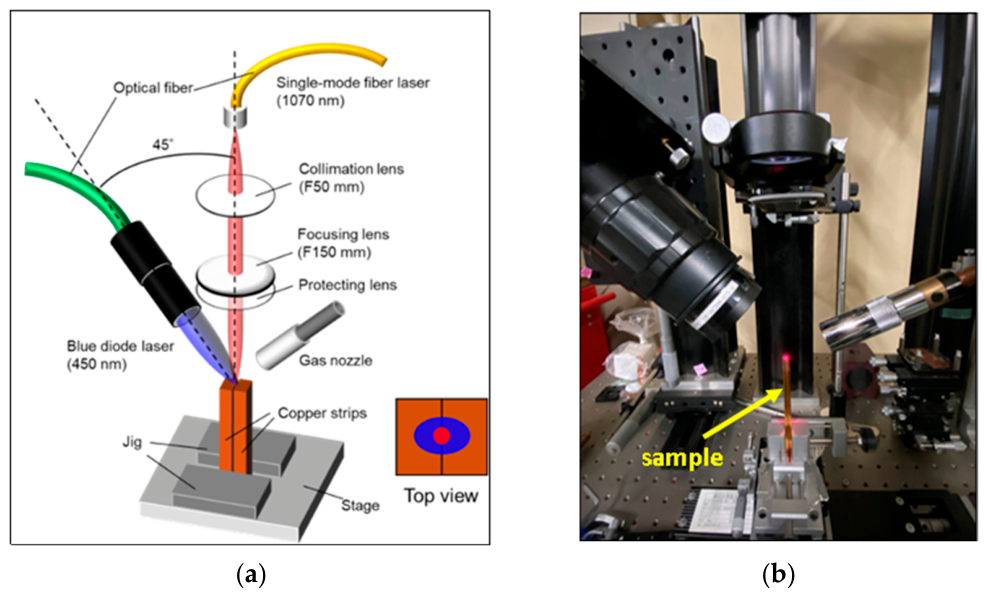
The hairpin samples were welded for 0.6 s using two IR-only based methods, one with 1000 W IR laser power (IR #1) and one with 1300 W IR laser power (IR #2), and one hybrid method combining 1000 W IR laser power with 750 W BDL power (hybrid). A weld time of 0.6 s was selected based on preliminary welding trials. This weld time produced a weld geometry representative of production hairpin welds, with sufficient melting to form a rounded weld bead while avoiding excessive melting that resulted in an oversized weld. Consequently, 0.6 s was used as a fixed processing parameter throughout the present study. Each hairpin couple was in contact and clamped to ensure stability during welding. All experiments were conducted as spot welds. Five pairs of samples were welded for each welding condition. A 1070 nm wavelength was used for the IR laser, and a 450 nm wavelength was used for the BDL. Further details about the welding parameters used for each method are presented in Table 1. Argon gas at a flow rate of 15 L/min was used as a shielding gas to protect the samples from the surrounding atmosphere. A schematic diagram of the welding experiments is shown in Figure 2.
Table 1.
Welding parameters employed in the current investigation.
Figure 2.
Schematic diagram of the hairpin welding setup (a) and a photograph of the experimental hairpin welding setup used in the investigation (b). The inset in (a) shows the top view and the size/position of both IR and BDL on the rectangular Cu strip samples (see also Figure 1).
2.3. Electrical Resistivity Measurements
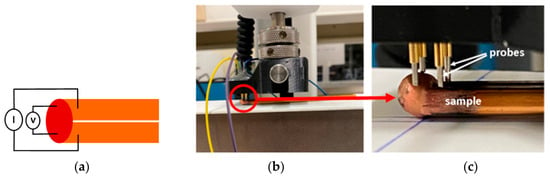
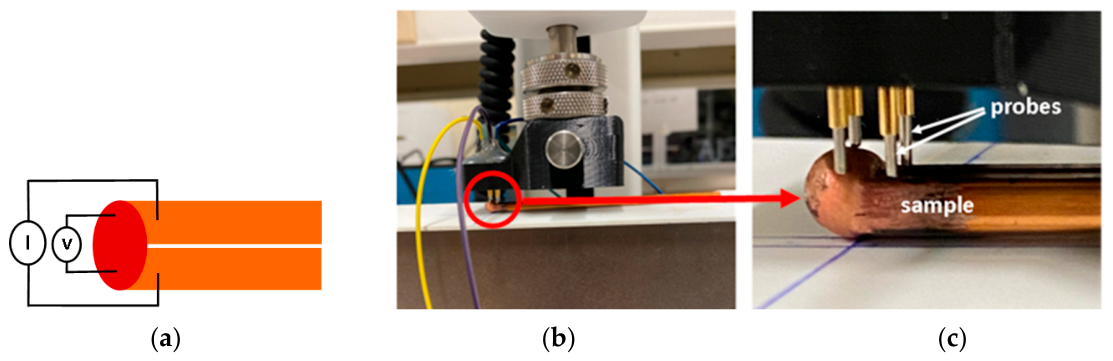
Electrical resistivity, ρ, was measured using the four-point probe method due to the low resistivity of the copper strips. The Keithley 2400 source measurement unit (Tektronix Inc., Solon, OH, USA) was configured to supply a current of 100 mA and a compliance of 2.1 V, providing an accuracy of 3 mΩ. A custom-made four-point measurement housing was designed for the dimensions of the copper strip and contained spring-actuated probes. The housing was attached to Mark-10’s ESM301 Force Gauge (Mark-10 Corporation, Copiague, NY, USA) to apply the same probe pressure to each sample. Each measurement was performed for about 45 s to obtain reliable data. For comparison and validation of the measurements, the resistivity of unwelded copper material was also measured to be 1.9 × 10⁻⁴ Ω.cm. The experimental setup for the electrical resistivity measurements is illustrated in Figure 3.
Figure 3.
Four-point probe measurement technique showing (a) schematic diagram, (b) set-up of the resistivity measurement, and (c) close-up view of (b) as designated by the red circle and arrow.
2.4. Microstructure and Hardness
2.4.1. Metallography
Stereo microscopy was used for metallographic analysis to observe the relatively large weld region and base metal, while maintaining sufficient resolution to resolve the grain structure in each region. Preparation was carried out by first sectioning the welded hairpins transversely to the weld bead. Following sample sectioning, each sample was mounted in Bakelite resin and ground sequentially using SiC papers from 100 to 2400 grit. After grinding, samples were sequentially polished using a Buehler AutoMet250 automatic polisher (Buehler, an Illinois Tool Works company, Lake Bluff, IL, USA) operating in concentric mode with 6, 3, and 1 µm diamond polishing media. Samples were then etched to reveal the weld microstructure using a solution of 50 mL of nitric acid and 50 mL of distilled water. Samples were then submerged for 4 s and immediately cleansed with water and ethanol. Upon drying, micrographs of the samples were recorded using a SZX10 Stereo Microscope (Evident Scientific, formerly an Olympus Corporation subsidiary, Waltham, MA, USA). Microstructural features (porosity, grain size, weld penetration, etc.) were analyzed and measured using ImageJ (version 1.54f).
2.4.2. Microhardness
Vickers microhardness tests were performed using a Leco LM248 series microindenter machine (LECO Corporation, St. Joseph, MI, USA) with a load of 300 g (HV0.3). The hardness indentations were placed at a constant distance, i.e., around 200 µm, between each indentation from the base metal to the fusion zone to produce a hardness profile.
The hardness of the fractured samples, following the peel tests, was also examined to assess the mechanical properties of the local area around the weldments.
2.5. Mechanical Testing
2.5.1. Bending
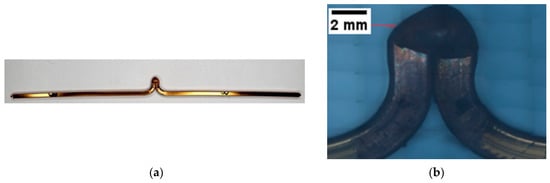
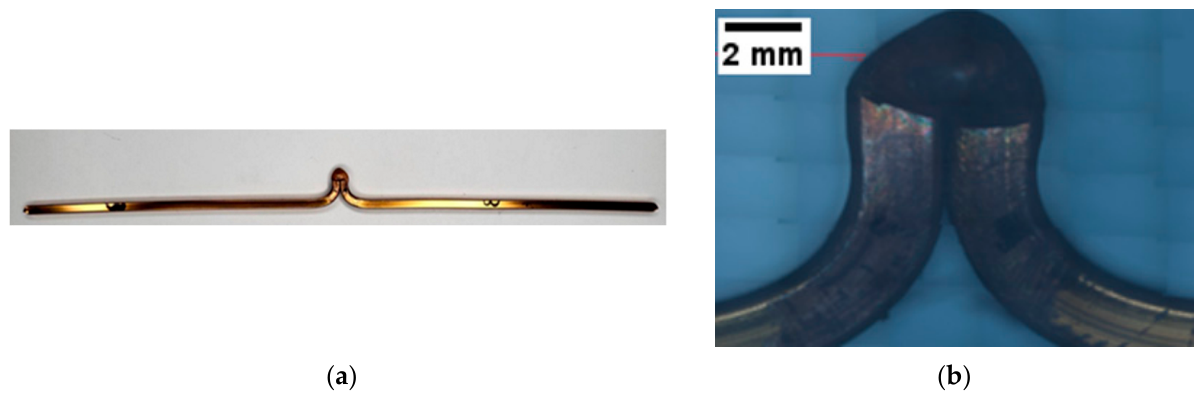
Bending of the samples was conducted after welding using a special fixture prepared according to ISO 14270 to ensure that bending did not affect the quality of the weldments [5]. Figure 4 displays an image of the bent welded specimen.
Figure 4.
(a) Photograph of a bent sample, and (b) close-up view of a weldment after bending.
2.5.2. Peel Testing
Tensile/peel testing was performed on the bent samples in accordance with ISO 14270:2016(E) [5] using a Shimadzu AG-IS machine (Shimadzu Corporation, Kyoto, Japan) equipped with a 10 kN load cell. Three pairs of welded samples were tested for each welding condition. The crosshead speed used in this investigation was 4.2 mm/min.
2.6. Scanning Electron Microscopy (SEM)
To understand the fracture mechanism, scanning electron microscopy (SEM) analysis was performed using secondary electron imaging on a JEOL JSM-IT200 (JEOL Ltd., Tokyo, Japan) on the fracture surfaces following the peel tests. All fracture surfaces were soaked in ethanol and cleaned with an ultrasonic cleaner prior to SEM examinations.
3. Results and Discussion
3.1. Weldments
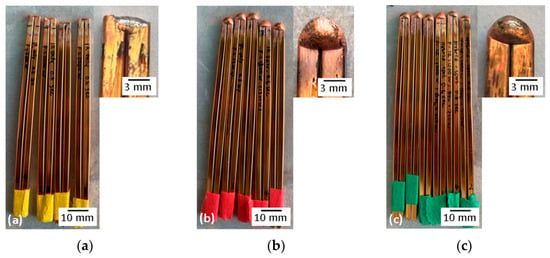
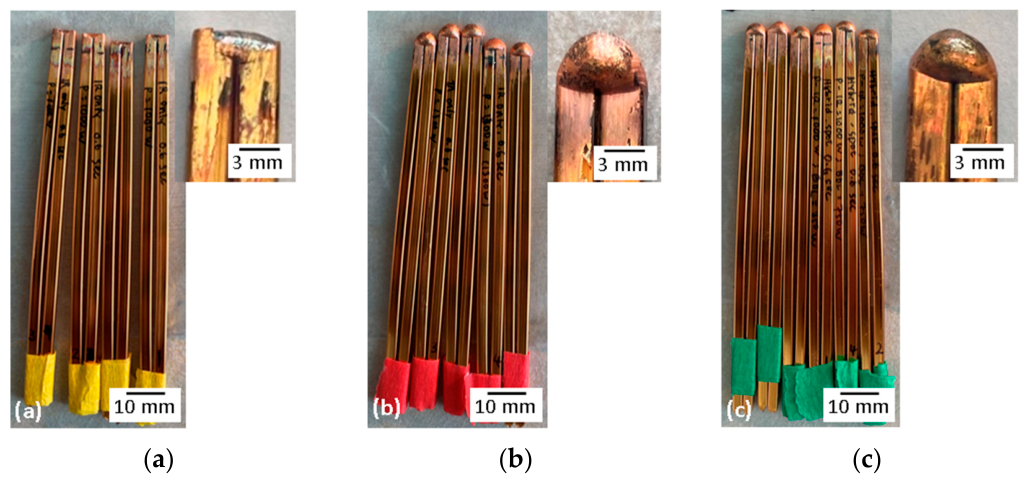
The resulting hairpin welds are presented in Figure 5. The IR #1 weldments demonstrate little weld bead, indicating poor penetration or shallow fusion due to insufficient heat input (Figure 5a). Figure 5b (IR #2) and Figure 5c (hybrid) exhibited larger weld beads characteristic of quality welds. All these experiments were conducted for 0.6 s, and for each batch, all samples showed consistent results with identical weld profiles, penetration depths, and weld bead sizes. During welding, minimal spatter (if any) was observed with each method.
Figure 5.
Hairpin samples welded for 0.6 s using methods (a) IR #1 (1000 W IR), (b) IR #2 (1300 W IR), and (c) hybrid (1000 W IR with 750 W BDL). Insets show higher magnification images of the weld joints.
3.2. Weld Microstructures
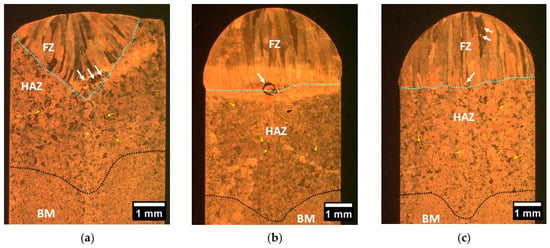
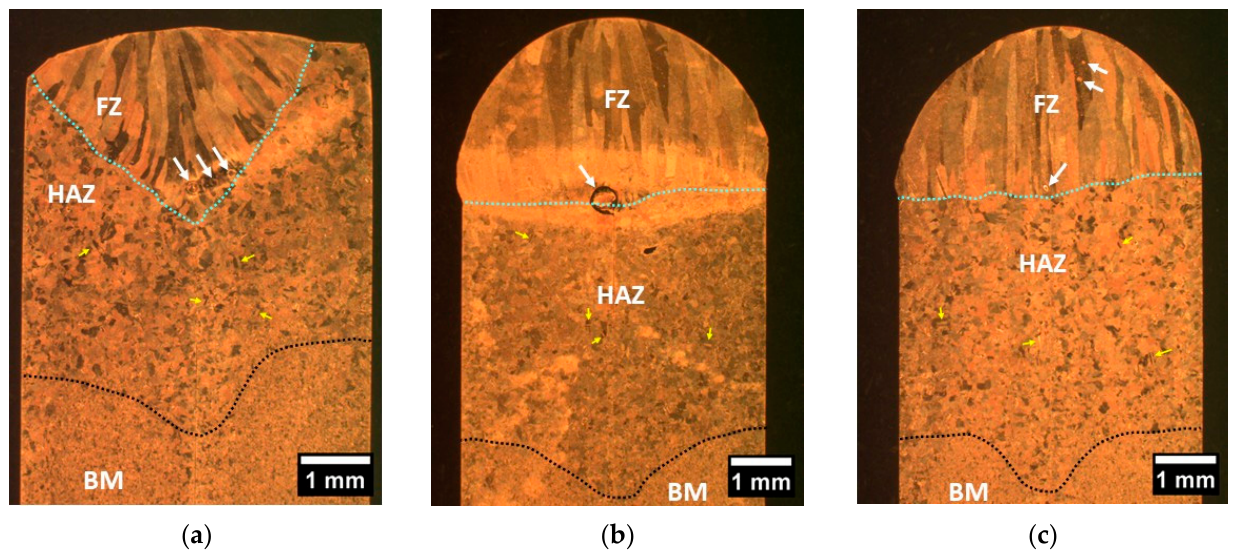
Figure 6 shows the cross-sectional views of the welded hairpin samples following metallographic examination. The sample welded using the IR #1 method had a weld depth ranging from 0.2 to 2.8 mm (Figure 6a). The fusion zone had a triangle-shaped appearance, indicating insufficient melting on both hairpin strips and suggesting that the heat input from the laser was insufficient. It can also be observed from Figure 6a that the grain solidification occurred at an angle pointing to the center of the IR laser irradiation point, which is indicative of non-uniform cooling due to a large thermal gradient from the center of the weld to the specimen surface under IR #1 conditions. Three small pores were observed near the weld root, totaling to a two-dimensional porosity area fraction of 0.88% of the FZ. The diameters of the pores were approximately 165, 188, and 127 µm. These pores may form by gas entrapment, keyhole instability, or insufficient shielding [28,29].
Figure 6.
Optical macrographs showing the cross-sections of the welded hairpin samples using methods (a) IR #1 (1000 W IR), (b) IR #2 (1300 W IR), and (c) hybrid (1000 W IR with 750 W BDL). Dashed blue lines indicate the approximate fusion lines. The dotted black lines are the estimated boundary between HAZ and BM. Pores are indicated with white arrows, and representative annealing twins are indicated by yellow arrows.
The samples welded with the IR #2 and hybrid methods exhibited completely different grain structures. Fusion zone grains were much more uniformly aligned along the IR-laser axis with some grains spanning the entire fusion zone. The direction of these columnar grains indicates uniform cooling/solidification towards the heat source, as they do not converge toward the center, unlike the fusion zone microstructure under IR #1 conditions. The sample welded under IR #2 exhibited a weld depth of 3.0 to 3.1 mm. The weld shape resembles a mushroom (Figure 6b), confirming that sufficient melting occurred. Small pores similar to those observed in the IR #1 method were not observed in the IR #2 cross section. Instead, one significantly sized pore (approximately 420 µm in diameter) was observed at the bottom of the fusion zone, resulting in a two-dimensional porosity area fraction of 1.19% of the FZ. The sample welded using the hybrid method (Figure 6c) exhibited a weld depth between 2.9 and 3.0 mm. Three small pores were observed, including one at the bottom of the FZ (approximately 110 µm in diameter) and two toward the top of the FZ (approximately 75 and 78 µm in diameter), corresponding to a two-dimensional porosity area of 0.19% of the FZ. Regarding the heat-affected zone (HAZ)—the area between the fusion zone (FZ) and base metal (BM)—the HAZ width was approximately 3.1 mm, 4.8 mm, and 5.0 mm for respective methods IR #1, IR #2, and hybrid, measuring between the lowermost points of the FZ and HAZ. Difference in HAZ width is attributed to differences in heat input among the welding methods, in which HAZ width increases with increasing heat input during laser welding [30]. Consistent with this statement, respective heat inputs for methods IR #1, IR #2, and hybrid according to Table 1 are 600, 780, and 1050 J.
The grain size of the base metal was less than 10 µm. The grain size at the HAZ for all welding methods was between 20 and 30 µm, equiaxed in shape, and exhibited many annealing twins randomly dispersed in the HAZ grain structure. Contrarily, a columnar grain structure was observed in the fusion zone for all three welding methods with some grains spanning the full length of the fusion zone, for example, 3 mm under hybrid welding. Similar grain structures have also been reported by others for hairpin welds [7,11].
3.3. Microhardness Testing
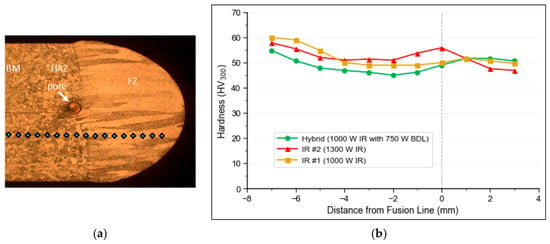
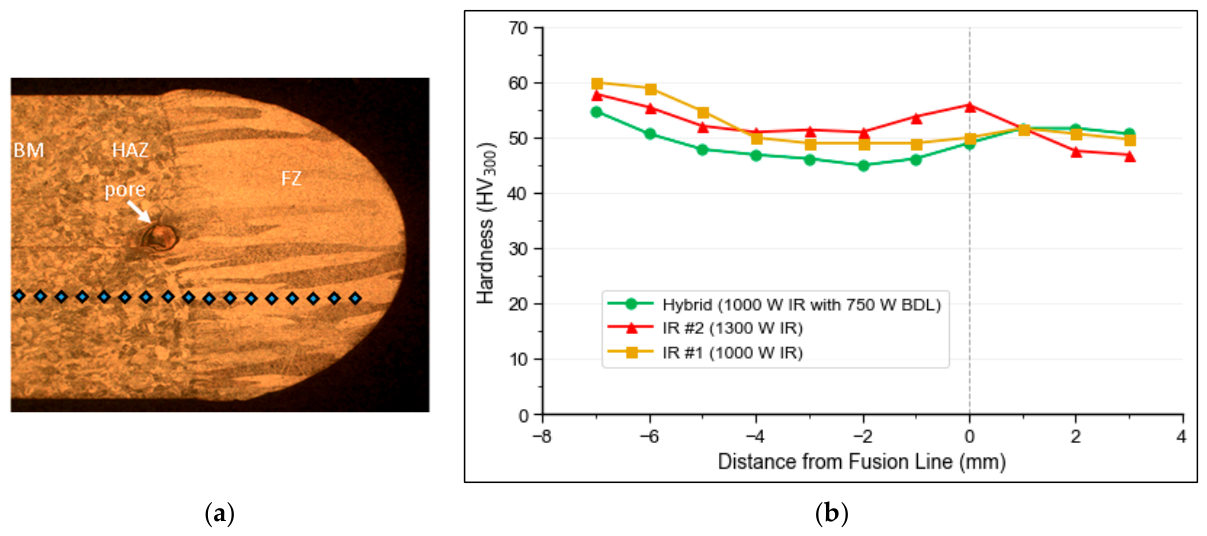
The resulting hardness profiles for each welding method are shown in Figure 7. All three welding methods exhibited a modest decrease in hardness from the base metal to both the HAZ and FZ. From the base metal to the HAZ, hardness decreased 10, 9, and 7 HV300 for the IR #1, IR #2, and hybrid methods, respectively. Similarly, the hardness of the FZ decreased by 10, 11, and 3.5 HV300 relative to the base metal. Overall, the hardness profiles were similar among the three welding methods, suggesting that the different welding methods had very little influence on the hardness of the HAZ and FZ. The slight reduction in hardness is consistent with the coarser grain structure observed in the HAZ and FZ compared with the base metal (described in Section 3.2) and the Hall–Petch relationship between grain size and hardness [31]. Results by Dimatteo et al. have shown that localized softening at the HAZ–FZ interface of copper hairpins leads to fracture propagation along this path, and thus such a decrease must be considered when assessing failure under mechanical loading [11]. These results are further correlated in the fracture analysis of Section 3.5.
Figure 7.
(a) A schematic diagram showing hardness measurement locations (denoted by blue squares), and (b) hardness profiles of all samples measured from the base metal to the HAZ and FZ.
3.4. Peel Tests
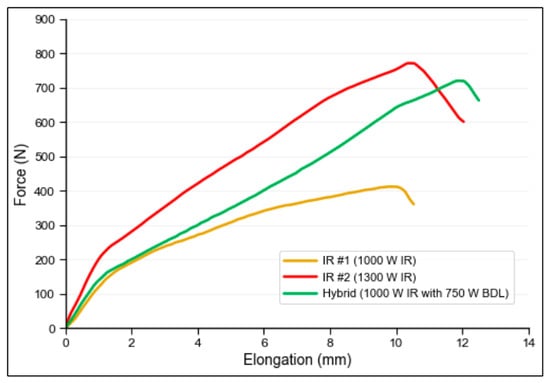
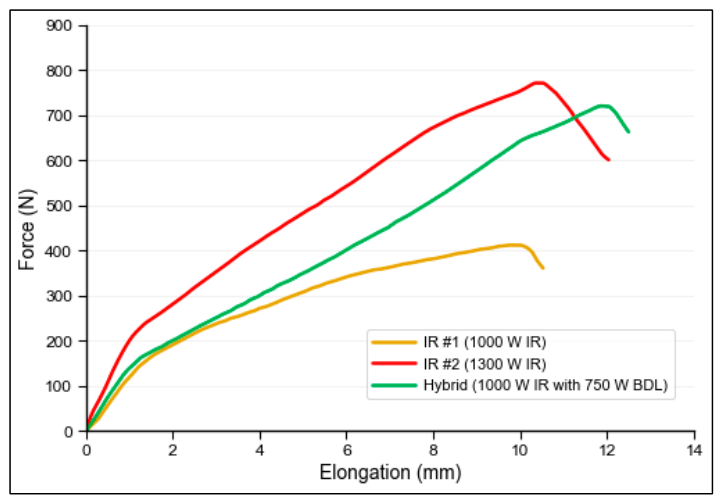
The resulting max peel force and elongation measurements from the peel testing for each method are presented in Table 2, while a plot showing a characteristic peel force versus elongation curve for each welding method is presented in Figure 8. Sample elongations ranged from 9 to 16%. Comparatively, Ning and Zhang [6] reported elongations of 8–22%, depending on the welding method used. Although elongation is an important measure of weld ductility, peel strength is generally considered to be the more critical performance metric for Cu hairpin welds as the joints must withstand manufacturing and service loads during EV motor applications. The force required to break the samples ranged from 400 to 785 N across all methods investigated. Given the larger weld bead size coupled with greater penetration compared with the IR #1 and hybrid methods, the highest peel force was recorded for the IR #2 samples, 755–785 N, compared with 395 to 425 N and 700 to 740 N for IR #1 and hybrid, respectively. Although no standardized minimum peel force requirement currently exists for laser-welded copper hairpins used in EV motors, the present results compare favorably with previously published studies. All welding methods exceed max peel forces achieved by Glaessel et al. of approximately 320 N [32]. The IR #2 method achieved peel forces of 755–785 N, exceeding the maximum loads achieved by Dimatteo et al. (approximately 490–500 N) and Ning and Zhang (717 N), while the hybrid method (700–740 N) produced comparable results despite requiring a substantially shorter weld time (0.6 s in this study versus 5 s in Ning and Zhang’s study) [6,11]. The studies by Glaessel et al., Dimatteo et al., and Ning and Zhang all utilized an IR laser or an ultrasonic-assisted IR laser system [6,11,32]. Comparatively, in the benchmarking study performed by D’Arcangelo et al. [12], a green laser with wavelength 515 nm reported a peak peel force of approximately 300 N, which is lower than the peak peel forces achieved using each of the welding methods investigated in the present study. Ortolani et al. reported a peak peel force of approximately 300 N using a high-power 3 kW BDL (450 nm wavelength) [33], which is likewise lower than that achieved by each of the welding methods in the present study. Based on their substantially higher peel forces compared to the IR #1 method and their favorable comparison with previously published studies, the welding parameters of the IR #2 and hybrid methods demonstrated the best mechanical performance among the processing conditions investigated and therefore appear to be the most suitable for EV motor applications. Notably, the peel forces of this study were achieved using a welding time of only 0.6 s, substantially shorter than the 5 s weld time reported by Ning and Zhang [6], whose study reported the highest peel force among comparable laser-welded Cu hairpins available in the literature.
Table 2.
Peel test results for the hairpin-welded samples.
Figure 8.
Force-elongation curves from three batches of evaluated samples.
Based on the present results, increasing IR laser power appears to be a more effective means of increasing peel strength than the hybrid laser configuration investigated in this study. One possible explanation for such results is that the IR laser primarily operated in keyhole mode, whereas the lower-power BD laser used in the hybrid system is expected to have primarily contributed through conduction-mode heating. Since keyhole-mode welding provides greater energy deposition into the workpiece than conduction-mode welding, increasing IR laser power may promote greater weld penetration, and thereby, higher peel strength [34]. Nevertheless, the present results demonstrate a clear benefit of the hybrid approach when compared with an IR-only process operating at the same IR laser power. Since the IR power used for the IR #1 and hybrid methods was identical, the addition of the BD laser increased the peak peel force by 75.6% and elongation at failure from 11% to 13%. Additionally, based on the two-dimensional porosity measurements presented in Section 3.2 (Figure 6), an 84.0% decrease in FZ porosity was observed in the hybrid method compared to the IR #2 approach. In support of these results, D’Arcangelo found that reduction in keyhole melting correlated to a decrease in porosity of the hairpin weld [12]. Hence, the hybrid approach may be preferred when improved weld strength and reduced porosity relative to a lower-power IR process are desired, particularly in applications where the available IR laser power is fixed or limited.
3.5. Resistivity Measurements
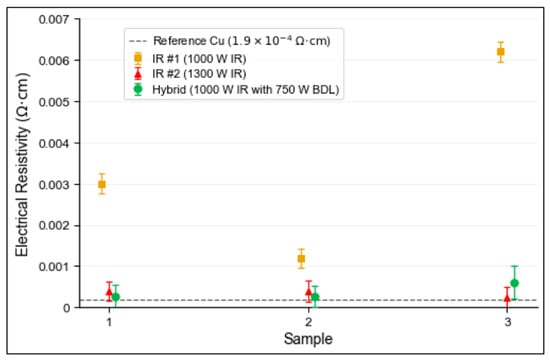
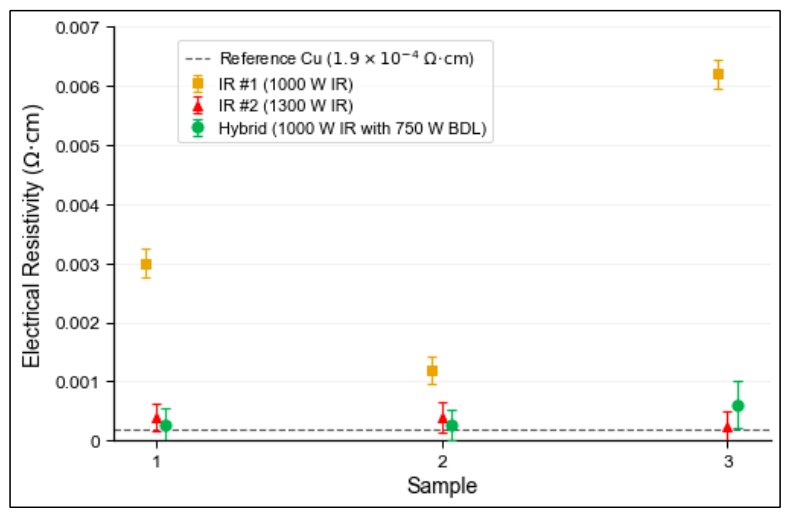
The results from resistivity measurements are shown in Figure 9. The resistivity of the unwelded copper strip (reference sample) was approximately 1.9 × 10⁻⁴ Ω.cm. The welded copper strips had electrical resistivities of 1.2 × 10⁻³ to 6.2 × 10⁻³ Ω.cm, 2.3 × 10⁻⁴ to 4 × 10⁻⁴ Ω.cm and 2.6 × 10⁻⁴ to 6.1 × 10⁻⁴ Ω.cm for IR #1, IR #2, and hybrid, respectively.
Figure 9.
Electrical resistivity measurements for the three samples tested for each welding method. The dashed line indicates the resistivity of unwelded/reference samples (1.9 × 10⁻⁴ Ω.cm).
IR #1 samples exhibited both the highest electrical resistivity and greatest variability among the three welding methods. The greater variability of the IR #1 method’s electrical resistivity measurements likely arises from inconsistent weld formation associated with the lower heat input, and thereby small joint area, of the IR #1 method compared with the IR #2 and hybrid methods. Additionally, the electrical resistivity of IR #1 samples was five to 31 times greater than that of the unwelded sample, making this welding method unsuitable for EV motor applications. Both IR #2 and hybrid samples exhibited significantly lower electrical resistivity compared with those of IR #1 and were only up to three times higher than that of the unwelded samples. One factor contributing to the high electrical resistivity of the IR #1 weldments may be related to the smaller cross-sectional area of the FZs that were only 20–30% of the sample cross section. The reduced weld penetration of the IR #1 method indicates incomplete joining of the hairpin strips, limiting the welded area available for current conduction across the joint. These results are consistent with what was reported by Dimatteo et al. [11] and Ning and Zhang [6], where greater weld penetration (and thereby stronger joints) is associated with low resistivity. Although porosity was observed in all three welding methods, the measured two-dimensional porosity area fraction did not directly correlate with the measured electrical resistivity, suggesting that weld penetration and fusion zone geometry had a greater influence on electrical resistivity than the limited porosity observed in the representative cross-sections. Another factor contributing to the higher electrical resistivity of the IR #1 weldments is the grain structure. As shown in Figure 6 and discussed in Section 3.2, the fusion zone produced by the IR #1 method consists of relatively finer columnar grains that are oriented toward the IR laser irradiation point. Consequently, the angle between the major axis of the grains and the IR laser axis increases from the center of the weld bead toward its peripheral edge. In contrast, the grains produced by the IR #2 and hybrid methods are relatively longer, as evidenced by their longer fusion zones, and are uniformly aligned with the IR laser axis across the weld bead. The finer grain structure of the IR #1 weld corresponds to a higher density of grain boundaries compared to the IR #2 and hybrid welds. Because grain boundaries act as scattering sites for conduction electrons in polycrystalline metals [35], the higher grain boundary density may have further contributed to the higher electrical resistivity of the IR #1 weldments. Given that the IR #2 and hybrid methods have electrical resistivities on the same order of magnitude as unwelded copper, they are the most suitable methods for EV motor application.
3.6. Fracture Analysis
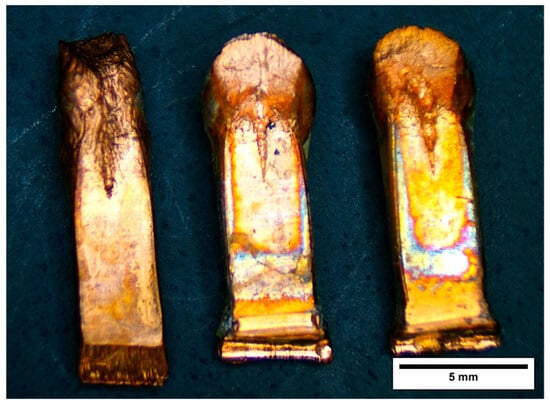
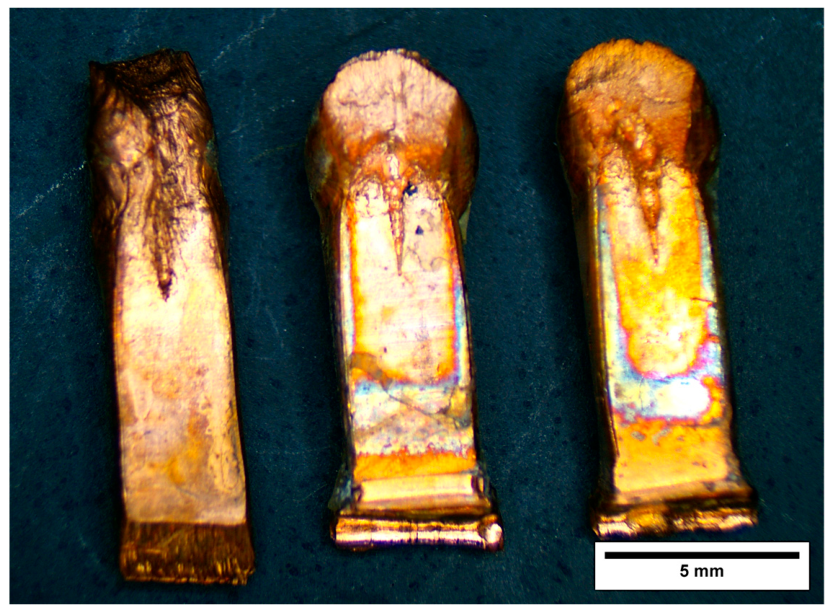
Macroscopic images of the fractured specimens shown in Figure 10 exhibit representative failure along the fusion line for all methods investigated in this study.
Figure 10.
Macroscopic image of the fractured specimens corresponding to methods IR #1 (left), IR #2 (center), and hybrid (right). Note the color change on the IR #2 and hybrid method samples is due to the higher heat input compared with IR #1, resulting in increased oxide formation on the surface of the samples.
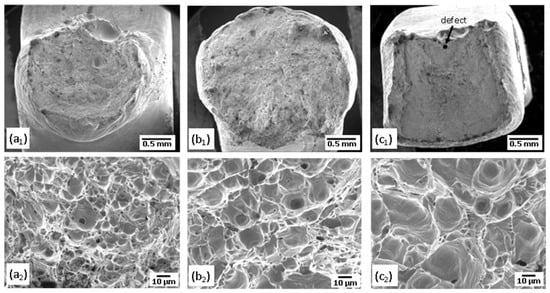
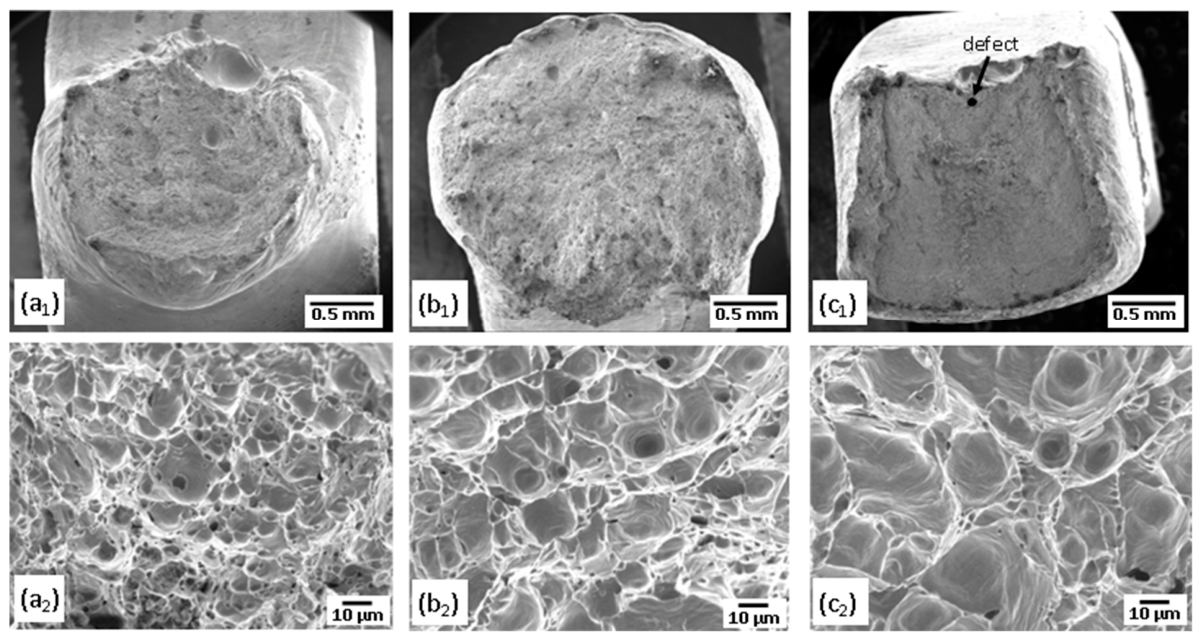
SEM images of the fracture surfaces (Figure 11) indicate a relatively small fracture surface area on the IR #1 sample. In contrast, both IR #2 and Hybrid samples exhibited large fracture surfaces, indicating a large joint area. All samples fractured along the fusion line with a ductile mechanism, exhibiting equiaxed dimples characteristic of microvoid coalescence. Ductile fracture correlates well with elongation measurements exceeding 10% for all peel test samples (as evidenced in Table 2 and Figure 8).
Figure 11.
Secondary electron images showing fracture surfaces of samples related to (a1,a2) IR #1 (a1,a2), IR #2 (b1,b2), and hybrid (c1,c2).
Further, combining the results of Figure 10 and Figure 11 indicates that fracture preferentially followed regions of reduced hardness within the stressed area, consistent with the microhardness profiles shown in Figure 7. From Figure 10 and the low magnification images of Figure 11, it is evident that the fusion zone of IR #1 is comparatively narrow, whereas both IR #2 and Hybrid exhibit much larger fusion zones (larger fracture surface areas). It is worth noting that, even though the cross-sectional area of the samples in this investigation (based on the size of the sample) was around 7.5 mm2, the cross-sectional area of the fractured weld area varied from approximately 2.7 mm2, 4.7 mm2 and 4.4 mm2 for the IR #1, IR #2 and hybrid, respectively. IR #1 samples had the smallest area followed by the hybrid samples and IR #2 samples. The larger fractured weld area explains why IR #2 samples required the highest force to break during peel testing compared to samples from the IR #1 and hybrid batches. Additionally, some pores shown in Figure 6 and described in Section 3.2 are observed in the fracture surfaces of Figure 11. Based on these SEM images, the pores were gas pores located at the weld root. This is consistent with the observation by D’Arcangelo et al. where larger pores were reported at the bottom of the weld and the number and size of pores increased towards the upper part of the weld [12]. These pores were caused by the entrapment of gases such as nitrogen and oxygen in the molten metal during welding [25]. Furthermore, according to Heider et al., large pores were associated with keyhole instabilities while small pores on the upper part of the welds are caused by gas entrapment from rapid solidification [28]. Contrarily, welds conducted by the scanning method result in small pores splitting from large pores during multiple scans have also been reported [12]. In this investigation, the weld was performed by spot welding; therefore, the latter phenomenon is irrelevant to this study.
4. Summary and Conclusions
Joints with high strength (high peel force) are required to resist road-induced forces during application, which may lead to premature failure, particularly if porosity is present or the joint area is small. Given the higher strength and shorter welding time observed in this investigation, both high-power IR and hybrid methods offer a promising new and sound approach for welding copper hairpins for EV motor applications.
In this study, copper hairpins for EV motor applications were welded using both IR-only and hybrid techniques and examined for their microstructural, mechanical, and electrical properties. Hairpin samples from three welding methods, IR #1 (1000 W IR), IR #2 (1300 W IR), and hybrid (1000 W IR with 750 W BDL) were evaluated using light optical microscopy, microhardness testing, tensile peel testing, electrical resistivity testing, and fractographic analysis. The investigation concluded that both IR-only and hybrid (IR + BDL) methods can be employed to produce a reliable hairpin weld joint. Both the IR #2 and hybrid methods produced mechanically and electrically sound welds using a welding time of only 0.6 s. Peel testing demonstrated average max peel forces of 770 ± 15 and 720 ± 20 N for welds made using the IR #2 and hybrid methods, respectively. For the same welding methods, electrical resistivity measurements were on the same magnitude of order of unwelded copper for both the IR #2 and hybrid methods with respective electrical resistivities of 4.0 × 10⁻⁴ and 6 × 10⁻⁴ Ω.cm. While the IR #2 condition produced the highest peel strength, the hybrid method significantly improved the performance of the lower-power IR condition and reduced FZ porosity, demonstrating its potential as an alternative approach for improving lower-power IR welding processes. Further experiments are needed to optimize the welding parameters to reduce weld defects, further improve weld strength/decrease electrical resistivity, and further reduce welding times for both IR-only and hybrid laser welding methods.
Author Contributions
Conceptualization, T.P. and Y.S.; methodology, T.P., A.H., J.X., W.Z.M., P.P. and Y.S.; software, R.J.R., S.F. and J.N.; validation, R.J.R., T.P. and W.Z.M.; formal analysis, R.J.R., T.P., S.F., P.-C.L., Z.-D.W., A.H., J.X., J.N. and P.P.; investigation, R.J.R., T.P., S.F., P.-C.L., Z.-D.W. and J.N.; resources, W.Z.M. and Y.S.; data curation, T.P.; writing—original draft preparation, T.P.; writing—review and editing, R.J.R., T.P. and W.Z.M.; visualization, R.J.R. and T.P.; supervision, W.Z.M., Y.S. and M.T.; project administration, W.Z.M., Y.S. and M.T.; funding acquisition, W.Z.M. and M.T. All authors have read and agreed to the published version of the manuscript.
Funding
This research was funded by the OU Master Plan Implementation Project, The University of Osaka, and the Loewy Institute at Lehigh University.
Data Availability Statement
The original contributions presented in this study are included in the article. Further inquiries can be directed to the corresponding author.
Acknowledgments
We would like to thank Denso Corporation for providing the pure copper strip samples.
Conflicts of Interest
The authors declare no conflicts of interest.
Abbreviations
The following abbreviations are used in this manuscript:
| EV | Electric Vehicle |
| IR | Infrared |
| BDL | Blue Diode Laser |
| BD | Blue Diode |
| TIG | Tungsten Inert Gas |
| FZ | Fusion Zone |
| BM | Base Metal |
| HAZ | Heat Affected Zone |
| SEM | Scanning Electron Microscope |
| ISO | International Organization for Standardization |
References
- Rahman, K.; Jurkovic, S.; Hawkins, S.; Tarnowsky, S.A.; Savagian, P. Propulsion system design of a battery electric vehicle. IEEE Electrif. Mag. 2014, 2, 14–24. [Google Scholar] [CrossRef] [Scilit]
- Melançon, S. What is a Hairpin Motor-Benefits & Assembly Process. Available online: https://www.laserax.com/blog/hairpin-motor (accessed on 1 June 2026).
- Riedel, A.; Masuch, M.; Weigelt, M.; Glaessel, T.; Kuehl, A.; Reinstein, S.; Franke, J. Challenges of the hairpin technology for production techniques. In Proceedings of the 2018 21st International Conference on Electrical Machines and Systems (ICEMS), Jeju, Republic of Korea, 7–10 October 2018; pp. 2471–2476. [Google Scholar]
- Kuntz, B. Electric Motor Hairpin Welding: Comparing 3 Joining Technologies. Available online: https://amadaweldtech.com/blog/electric-motor-hairpin-welding-comparing-3-joining-technologies/ (accessed on 1 June 2026).
- ISO 14270:2016; Resistance Welding—Destructive Testing of Welds—Specimen Dimensions and Procedure for Mechanized Peel Testing Resistance Spot, Seam and Embossed Projection Welds. International Organization for Standardization: Geneva, Switzerland, 2016.
- Ning, J.; Zhang, L. Non-contact ultrasonic-assisted laser welding of copper hairpins. J. Mater. Res. Technol. 2024, 31, 3536–3550. [Google Scholar] [CrossRef] [Scilit]
- Tang, Z.J.; Wan, L.; Zhang, X.L.; Zhu, C.L.; Yang, H.H.; Hao, Y.B.; Zhao, K.; Chiumenti, M.; Wu, Y.; Wang, H.W.; et al. Blue laser conduction spot welding of pure copper hairpins. Weld. J. 2024, 103, 349–361. [Google Scholar] [CrossRef] [Scilit]
- Improving Hairpin Welding. Available online: https://www.coherent.com/news/blog/improving-hairpin-welding (accessed on 1 June 2026).
- Glaessel, T.; Seefried, J.; Franke, J. Challenges in the manufacturing of hairpin windings and application opportunities of infrared lasers for the contacting process. In Proceedings of the IEEE 7th International Electric Drives Production Conference (E|DPC), Würzburg, Germany, 5–6 December 2017; pp. 1–7. [Google Scholar]
- Glaessel, T.; Baat, F.; Schwinghammer, D.; Seefried, J.; Kuehl, A.; Franke, J. Infrared laser based contacting of bar-wound windings in the field of electric drives production. Procedia CIRP 2018, 74, 17–22. [Google Scholar] [CrossRef] [Scilit]
- Dimatteo, V.; Ascari, A.; Faverzani, P.; Poggio, L.; Fortunato, A. The effect of process parameters on the morphology, mechanical strength and electrical resistance of CW laser-welded pure copper hairpins. J. Manuf. Process. 2021, 62, 450–457. [Google Scholar] [CrossRef] [Scilit]
- D’Arcangelo, S.; Caprio, L.; Chesi, D.; Nocciolini, D.; Corbinelli, R.; Previtali, B.; Demir, A.G. Comprehensive benchmarking of laser welding technologies including novel beam shapes and wavelengths for e-drive copper hairpins. Opt. Laser Technol. 2024, 169, 109964. [Google Scholar] [CrossRef] [Scilit]
- Pasang, T.; Fujio, S.; Lin, P.C.; Tao, Y.; Sudo, M.; Kuendig, T.; Sato, Y.; Tsukamoto, M. Weldability and mechanical properties of pure copper foils welded by blue diode laser. Materials 2024, 17, 2140. [Google Scholar] [CrossRef] [Scilit] [PubMed]
- Demir, A.G.; D’Arcangelo, S.; Caprio, L.; Borzoni, G.; Nocciolini, D.; Previtali, B. Long-term benchmarking of laser technologies and process improvement for Cu hairpin welding in electric drive manufacturing. Procedia CIRP 2024, 124, 24–29. [Google Scholar] [CrossRef] [Scilit]
- Feve, J.P.; Silva Sa, M.; Finuf, M.; Fritz, R.; Pelaprat, J.M.; Zediker, M. 500 watt blue laser system for welding applications. In Proceedings of the High-Power Diode Laser Technology XVII, San Francisco, CA, USA, 4 March 2019; Volume 10900, p. 1090004. [Google Scholar]
- Pelaprat, J.M.; Finuf, M.J.; Fritz, R.D.; Zediker, M.S. Blue Light Laser Enables Advanced Manufacturing. Available online: https://www.novuslight.com/blue-light-laser-enables-advanced-manufacturing_N9552.html (accessed on 5 April 2024).
- Hummel, M.; Schöler, C.; Häusler, A.; Gillner, A.; Poprawe, R. New approaches on laser micro welding of copper by using a laser beam source with a wavelength of 450 nm. J. Adv. Join. Process. 2020, 1, 100012. [Google Scholar] [CrossRef] [Scilit]
- Zediker, M.S.; Fritz, R.D.; Finuf, M.J.; Pelaprat, J.M. Laser welding components for electric vehicles with a high-power blue laser system. J. Laser Appl. 2020, 32, 022038. [Google Scholar] [CrossRef] [Scilit]
- Zediker, M.S.; Fritz, R.D.; Finuf, M.J.; Pelaprat, J.M. Stable keyhole welding of 1 mm thick copper with a 600 W blue laser system. J. Laser Appl. 2019, 31, 022404. [Google Scholar] [CrossRef] [Scilit]
- Silva, S.M.; Finuf, M.; Fritz, R.; Tucker, J.; Pelaprat, J.M.; Zediker, M.S. Blue laser diode (450 nm) systems for welding copper. In High-Power Diode Laser Technology XVI; Zediker, M.S., Ed.; SPIE: Bellingham, WA, USA, 2018; Volume 10514, p. 1051407. [Google Scholar]
- Heine, L.; Schlett, M.; Britten, S.; Arndt, A.; Spurk, C.; Hummel, M.; Beckmann, F.; Moosmann, J. Blue diode lasers—Understanding and influencing melt pool dynamics in copper. In Proceedings of the IOP Conference Series: Materials Science and Engineering, Turku, Finland, 22–24 August 2023; Volume 1296, p. 012038. [Google Scholar]
- Takenaka, K.; Sato, Y.; Fujio, S.; Nishida, K.; Ito, R.; Hori, E.; Kato, S.; Suwa, M.; Uno, S.; Tojo, K.; et al. Bead-on-plate welding of pure copper with a 1.5-kW high-power blue diode laser. Weld. World 2022, 67, 99–107. [Google Scholar] [CrossRef] [Scilit]
- Fujio, S.; Takenaka, K.; Sato, Y.; Ito, R.; Hori, E.; Tsukamoto, M. Effect of blue diode laser intensity on welding of pure copper wire using blue-IR hybrid laser. J. Laser Appl. 2022, 34, 042020. [Google Scholar] [CrossRef] [Scilit]
- Ono, K.; Sato, Y.; Takazawa, Y.; Morimoto, Y.; Takenaka, K.; Yamashita, Y.; Funada, Y.; Abe, N.; Tsukamoto, M. Development of high intensity multibeam laser metal deposition system with blue diode lasers for additively manufacturing of copper rod. J. Laser Appl. 2021, 33, 042014. [Google Scholar] [CrossRef] [Scilit]
- Rütering, M. Hybrid solution moves boundaries of copper welding. Photonics Views 2019, 16, 46–50. [Google Scholar] [CrossRef] [Scilit]
- Hess, A.; Schuster, R.; Heider, A.; Weber, R.; Graf, T. Continuous wave laser welding of copper with combined beams at wavelengths of 1030 nm and of 515 nm. Phys. Procedia 2011, 12, 88–94. [Google Scholar] [CrossRef] [Scilit]
- Kohl, S.; Kaufmann, F.; Schmidt, M. Why color matters—Proposing a quantitative stability criterion for laser beam processing of metals based on their fundamental optical properties. Metals 2022, 12, 1118. [Google Scholar] [CrossRef] [Scilit]
- Heider, A.; Alter, L. Evaluation of pore formation during welding of copper using different laser sources. Procedia CIRP 2024, 124, 383–387. [Google Scholar] [CrossRef] [Scilit]
- Reinheimer, E.N.; Haas, M.; Zaiß, F.; Omlor, M.; Spurk, C.; Olowinsky, A.; Beckmann, F.; Moosmann, J.; Hagenlocher, C.; Weber, R.; et al. Avoiding the formation of pores during laser welding of copper hairpins by dynamic beam shaping. Int. J. Adv. Manuf. Technol. 2025, 137, 2257–2266. [Google Scholar] [CrossRef] [Scilit]
- Kaufmann, F.; Roth, S.; Schmidt, M. Tailored laser beam shapes for welding of copper using green laser radiation. Int. J. Adv. Manuf. Technol. 2025, 136, 3843–3862. [Google Scholar] [CrossRef] [Scilit]
- Callister, W.D., Jr.; Rethwisch, D.G. Strengthening by Grain Size Reduction (Hall–Petch Relationship). In Materials Science and Engineering: An Introduction, 9th ed.; John Wiley & Sons, Inc.: Hoboken, NJ, USA, 2014; pp. 229–231. [Google Scholar]
- Glaessel, T.; Seefried, J.; Masuch, M.; Riedel, A.; Mayr, A.; Kuehl, A.; Franke, J. Process reliable laser welding of hairpin windings for automotive traction drives. In Proceedings of the 2019 International Conference on Engineering, Science, and Industrial Applications (ICESI), Tokyo, Japan, 22–24 August 2019; pp. 1–6. [Google Scholar]
- Ortolani, M.; Borzoni, G.; Nocciolini, D.; Previtali, B.; Demir, A.G. Conduction mode welding of Cu hairpins with a 3 kW blue laser with external features correlated to quality attributes. Int. J. Adv. Manuf. Technol. 2025, 137, 1959–1974. [Google Scholar] [CrossRef] [Scilit]
- Florian, T.; Schricker, K.; Zenz, C.; Otto, A.; Schmidt, L.; Diegel, C.; Friedmann, H.; Seibold, M.; Hellwig, P.; Fröhlich, F.; et al. Combining in situ synchrotron X-ray imaging and multiphysics simulation to reveal pore formation dynamics in laser welding of copper. Int. J. Mach. Tools Manuf. 2025, 204, 104224. [Google Scholar] [CrossRef] [Scilit]
- Bishara, H.; Lee, S.; Brink, T.; Ghidelli, M.; Dehm, G. Understanding Grain Boundary Electrical Resistivity in Cu: The Effect of Boundary Structure. ACS Nano 2021, 15, 16607–16615. [Google Scholar] [CrossRef] [Scilit] [PubMed]

Disclaimer/Publisher’s Note: The statements, opinions and data contained in all publications are solely those of the individual author(s) and contributor(s) and not of MDPI and/or the editor(s). MDPI and/or the editor(s) disclaim responsibility for any injury to people or property resulting from any ideas, methods, instructions or products referred to in the content. |
© 2026 by the authors. Licensee MDPI, Basel, Switzerland. This article is an open access article distributed under the terms and conditions of the Creative Commons Attribution (CC BY) license.