


Abstract
Plantar morphology analysis is essential for understanding foot biomechanics and detecting alterations that may affect the musculoskeletal system. This study proposes a method based on infrared thermography and artificial intelligence for the detection of normal and cavus foot types. The proposed approach integrates an automatic segmentation stage to identify the plantar region in thermographic images, followed by a classification stage based on machine learning algorithms and morphological features extracted from the segmented region. For the segmentation stage, a convolutional neural network-based method was developed, achieving an Intersection over Union (IoU) of 83.07% during testing, indicating high agreement between the predicted segmentations and the reference masks. In the classification stage, three machine learning models were evaluated: logistic regression, support vector machine, and k-nearest neighbours. Among them, the k-nearest neighbours model achieved the best performance, reaching an accuracy of 75%, a precision of 80%, an F1-score of 72.2%, and a recall of 66.6%. Overall, the results highlight the potential of combining infrared thermography with machine learning techniques to identify relevant patterns associated with plantar morphology, enabling the automatic detection of normal and cavus foot types.
1. Introduction
The morphology of the plantar arch plays a fundamental role in lower-limb biomechanics. The human foot is not merely the distal part of the body but rather a complex structure responsible for both support and locomotion, directly influencing overall physical well-being. It enables humans to walk efficiently, maintain an upright posture, support body weight, and perform daily movements [1]. However, alterations in plantar arch morphology may affect the structural integrity of the foot, potentially leading to physical impairment and reduced quality of life. It is estimated that nearly one-third of the population presents some form of plantar arch alteration, which can result in chronic pain and musculoskeletal disorders affecting different parts of the body [2]. Among the various morphological alterations of the plantar arch, flatfoot—characterized by the collapse of the medial longitudinal arch—and cavus foot—defined by an abnormally high plantar arch—are among the most common conditions with significant negative impacts on the population [3]. The timely identification of plantar arch morphology during the initial or preventive assessment can contribute to the design of more appropriate ergonomic interventions and, particularly in the footwear industry, to the design and adjustment of footwear that enhances comfort and well-being [4]. Therefore, plantar arch morphology is a key factor in human health. Given its high prevalence and functional impact, the accurate identification of foot type is essential for both injury prevention and clinical or orthopedic decision-making. Nevertheless, traditional assessment methods still rely largely on subjective clinical evaluations or instrumented procedures that are not always widely accessible, highlighting the need for more objective, reproducible, and scalable alternatives.
Currently, several instrumented approaches have been developed to analyse plantar arch morphology and load distribution. Pressure platforms and instrumented insoles allow the acquisition of detailed foot–ground contact maps and have been widely used to study plantar loading patterns and foot function. For instance, Alexander et al. [5] analysed the evolution of techniques for measuring contact force and plantar pressure distribution in order to study pressure patterns during gait and their relationship with plantar arch morphology, particularly in the context of ulcer prevention. Similarly, Abdul et al. [6] investigated the hardware systems and sensor architectures required for plantar pressure analysis, focusing on the technical requirements needed to develop functional diagnostic systems for pathologies such as flatfoot. In addition, Price et al. [7] evaluated the reliability of plantar pressure measurement systems and demonstrated that factors such as device calibration can significantly influence measurement accuracy. Motion capture systems and three-dimensional gait analysis have also been employed to investigate the relationship between arch height and gait mechanics. In this regard, Buldt et al. [3] evaluated differences in plantar pressure, foot function, and range of motion among runners presenting five different foot posture types. Despite these advances, several studies have highlighted important limitations. For example, Chockalingam et al. [8] reported a lack of standardization across plantar measurement devices, which complicates the comparison of results between studies. Likewise, Patacky [9] noted that the spatial resolution of certain pressure systems may affect the accuracy of morphological feature identification in the plantar arch. These limitations, together with sensitivity to calibration conditions [7] and the high implementation costs associated with specialized platforms [6], restrict their applicability in routine clinical environments or large-scale early screening scenarios. Consequently, alternative approaches based on digital imaging and automated processing techniques are being increasingly explored.
In recent years, several automatic foot-type classification methods have been proposed using plantar images and deep learning techniques. For example, Zhao et al. [10] employed plantar pressure maps converted into images to train convolutional neural networks capable of classifying normal, flat, and cavus feet with high accuracy. Similarly, Ramírez-Rios et al. [11] explored the use of Vision Transformer-based architectures applied to RGB images of plantar footprints, demonstrating that attention mechanisms can improve discrimination between different plantar arch types. Additionally, Chae et al. [12] proposed an approach aimed at improving cross-device generalization by incorporating heterogeneous datasets obtained from different pressure sensors, thereby reducing the variability introduced by different acquisition platforms. Complementarily, Han et al. [13] developed a strategy based on conditional generative adversarial networks (cGANs) to generate synthetic plantar footprint samples and address the problem of limited labelled data during model training. Finally, Wang et al. [14] proposed an efficient method combining texture descriptors such as Local Binary Patterns with lightweight convolutional neural networks, reducing computational cost while maintaining competitive classification performance. These studies demonstrate the potential of artificial intelligence in plantar classification. However, most approaches rely on a single type of data, either pressure measurements or RGB images. Such approaches depend on controlled acquisition environments [11,15] and are subject to challenges relating to sensor variability and configuration differences [8,12]. Furthermore, the systematic use of thermal information as a complementary source of morphological data has been only scarcely explored within automatic classification frameworks.
For this reason, the present work proposes an automatic classification methodology for human foot type—specifically normal and cavus feet—based on plantar morphology extracted from thermographic images and analysed using a convolutional neural network (CNN). The proposed approach aims to leverage both the thermal distribution patterns associated with plantar load and the visible morphological characteristics of the arch. The methodological framework integrates complementary imaging modalities within an automated scheme designed to improve the robustness and generalization capability of the classification system. By combining these sources of information, the proposed approach seeks to overcome limitations related to hardware dependency [8,12], sensitivity to imaging conditions such as illumination [11], and the lack of standardization in data acquisition procedures [5,7]. Ultimately, this work contributes toward the development of an objective, reproducible, and potentially scalable tool suitable for real clinical environments.
2. Materials and Methods
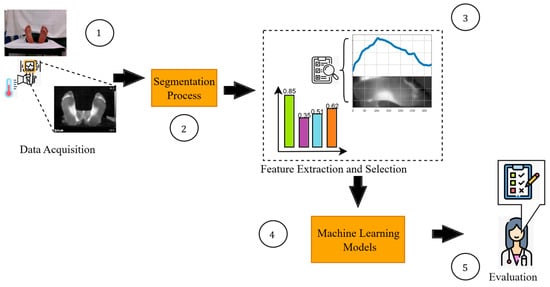
This study proposes a methodology for the detection of cavus foot based on thermographic images and intelligent models. Figure 1 illustrates the overall framework and workflow of the proposed methodology, which is structured into five main stages: thermal image acquisition and labelling, automatic segmentation, feature extraction and selection, intelligent model construction, and performance evaluation.
Figure 1.
General methodology.
In the first stage, thermographic images were collected from 34 participants, 24 of whom were labelled according to the Hernández-Corvo index. In the second stage, the images were automatically segmented using intelligent algorithms to isolate the plantar region and analyse its thermal behaviour. The thermal patterns obtained from each participant were then analysed to identify and select the most relevant indicators.
In the fourth stage, automatic classification models were developed using three machine learning algorithms: logistic regression, support vector machines, and k-nearest neighbours. Model training and validation were performed using a leave-one-subject-out (LOSO) cross-validation strategy in order to evaluate generalization capability across subjects. Finally, in the evaluation stage, the performance of the models was assessed by comparing their predictions with the reference labels defined by specialists.
2.1. Data Acquisition
2.1.1. Study Design and Participants
A total of 34 volunteers took part in the data acquisition stage. However, only 24 of these volunteers (5 males and 19 females) were included in the classification study. The remaining 10 participants were excluded either because they had foot conditions that did not fall within the two categories considered in this study, or because their data was not labelled. This exploratory, observational, cross-sectional study aimed to evaluate the feasibility of using plantar thermography and artificial intelligence techniques to detect cavus foot.
Participants were divided into two groups according to foot morphology: a cavus foot group of 12 subjects (11 females and 1 male), and a normal foot group of 12 subjects (eight females and four males). Anthropometric variables, including age, weight, height and BMI, were collected for all participants. The demographic characteristics of the normal and cavus foot groups are summarised in Table 1. No additional clinical variables were considered, as the primary objective of the study was to investigate whether thermal foot patterns discriminate between cavus and normal foot morphology.
Table 1.
Anthropometric variables.
2.1.2. Thermal Images
Thermograms were acquired using an FLIR E8 PRO thermal camera (FLIR Systems, Wilsonville, OR, USA) with thermal sensitivity of 40 mK at 30 °C (86 °F) and a resolution of 320 × 240 pixels. However, the images exported and used throughout this study were at a resolution of 640 × 480 pixels, which is the display resolution generated by the camera. All subsequent pre-processing, segmentation and feature extraction procedures were performed using these images.
The standardised thermographic imaging protocol was as follows: Upon arrival in the test room, which was kept at a temperature of 20 ± 2 °C with a relative humidity between 40% and 60%, participants rested for 15 min to allow their skin surface temperature to stabilise. After this period, they stood on a glass surface for three minutes. They were then asked to lie in the supine position with their feet facing forwards. It has been demonstrated that releasing plantar pressure does not result in an immediate recovery of surface temperature. In fact, the thermal response is a gradual process mainly determined by the restoration of local microcirculation [16]. Based on this physiological response, a plantar thermogram can be acquired immediately after standing, capturing a thermal pattern that reflects the previous plantar pressure distribution before substantial temperature recovery occurs. For that reason, a thermographic image was then captured from 1 m between the camera and the sole of the foot. To ensure consistency of distance and avoid variations in the image, a mark was placed on the floor to indicate where the camera should be positioned.
2.1.3. Data Labelling
The Hernández-Corvo index has been widely recognized as one of the reference gold standard methods for the classification of plantar footprints [17]. This method is performed manually by obtaining a plantar footprint while the subject is in a bipedal standing position. To acquire the footprint, ink is applied to the plantar surface of the feet, and the subject is instructed to perform a static bipodal stance on a sheet of paper, allowing the complete plantar imprint to be recorded.
The analysis involves drawing specific lines at 90° angles across the footprint, which enables the calculation of a geometric relationship between the width of the forefoot and the width of the midfoot. Based on this relationship, the index value is obtained and used to classify the plantar arch morphology into different categories ranging from flat foot to extreme cavus foot [18]. Due to its simplicity and ease of application, this index remains one of the most commonly used methods for the manual assessment of plantar morphology.
2.2. Segmentation Process
To ensure that the identification of the plantar region is robust to variations in position, orientation, and image noise, an automatic segmentation methodology based on convolutional neural networks (CNNs) is proposed. The purpose of this approach is to isolate the plantar region of the foot while removing background information, thereby improving the quality of the dataset used in the subsequent stages of feature extraction and analysis.
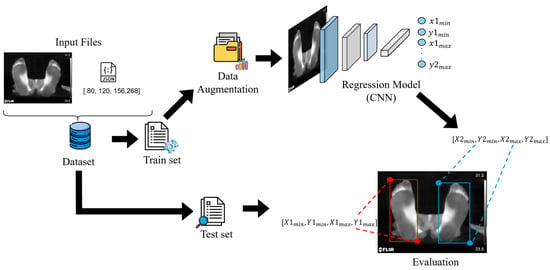
Figure 2 illustrates the overall workflow of the proposed methodology, which includes the stages of image preprocessing, data splitting and augmentation, model construction, and performance evaluation.
Figure 2.
General methodology for estimating regions of interest.
2.2.1. Data Processing and Splitting
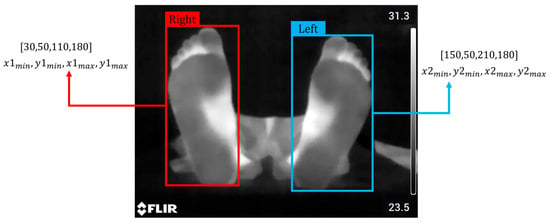
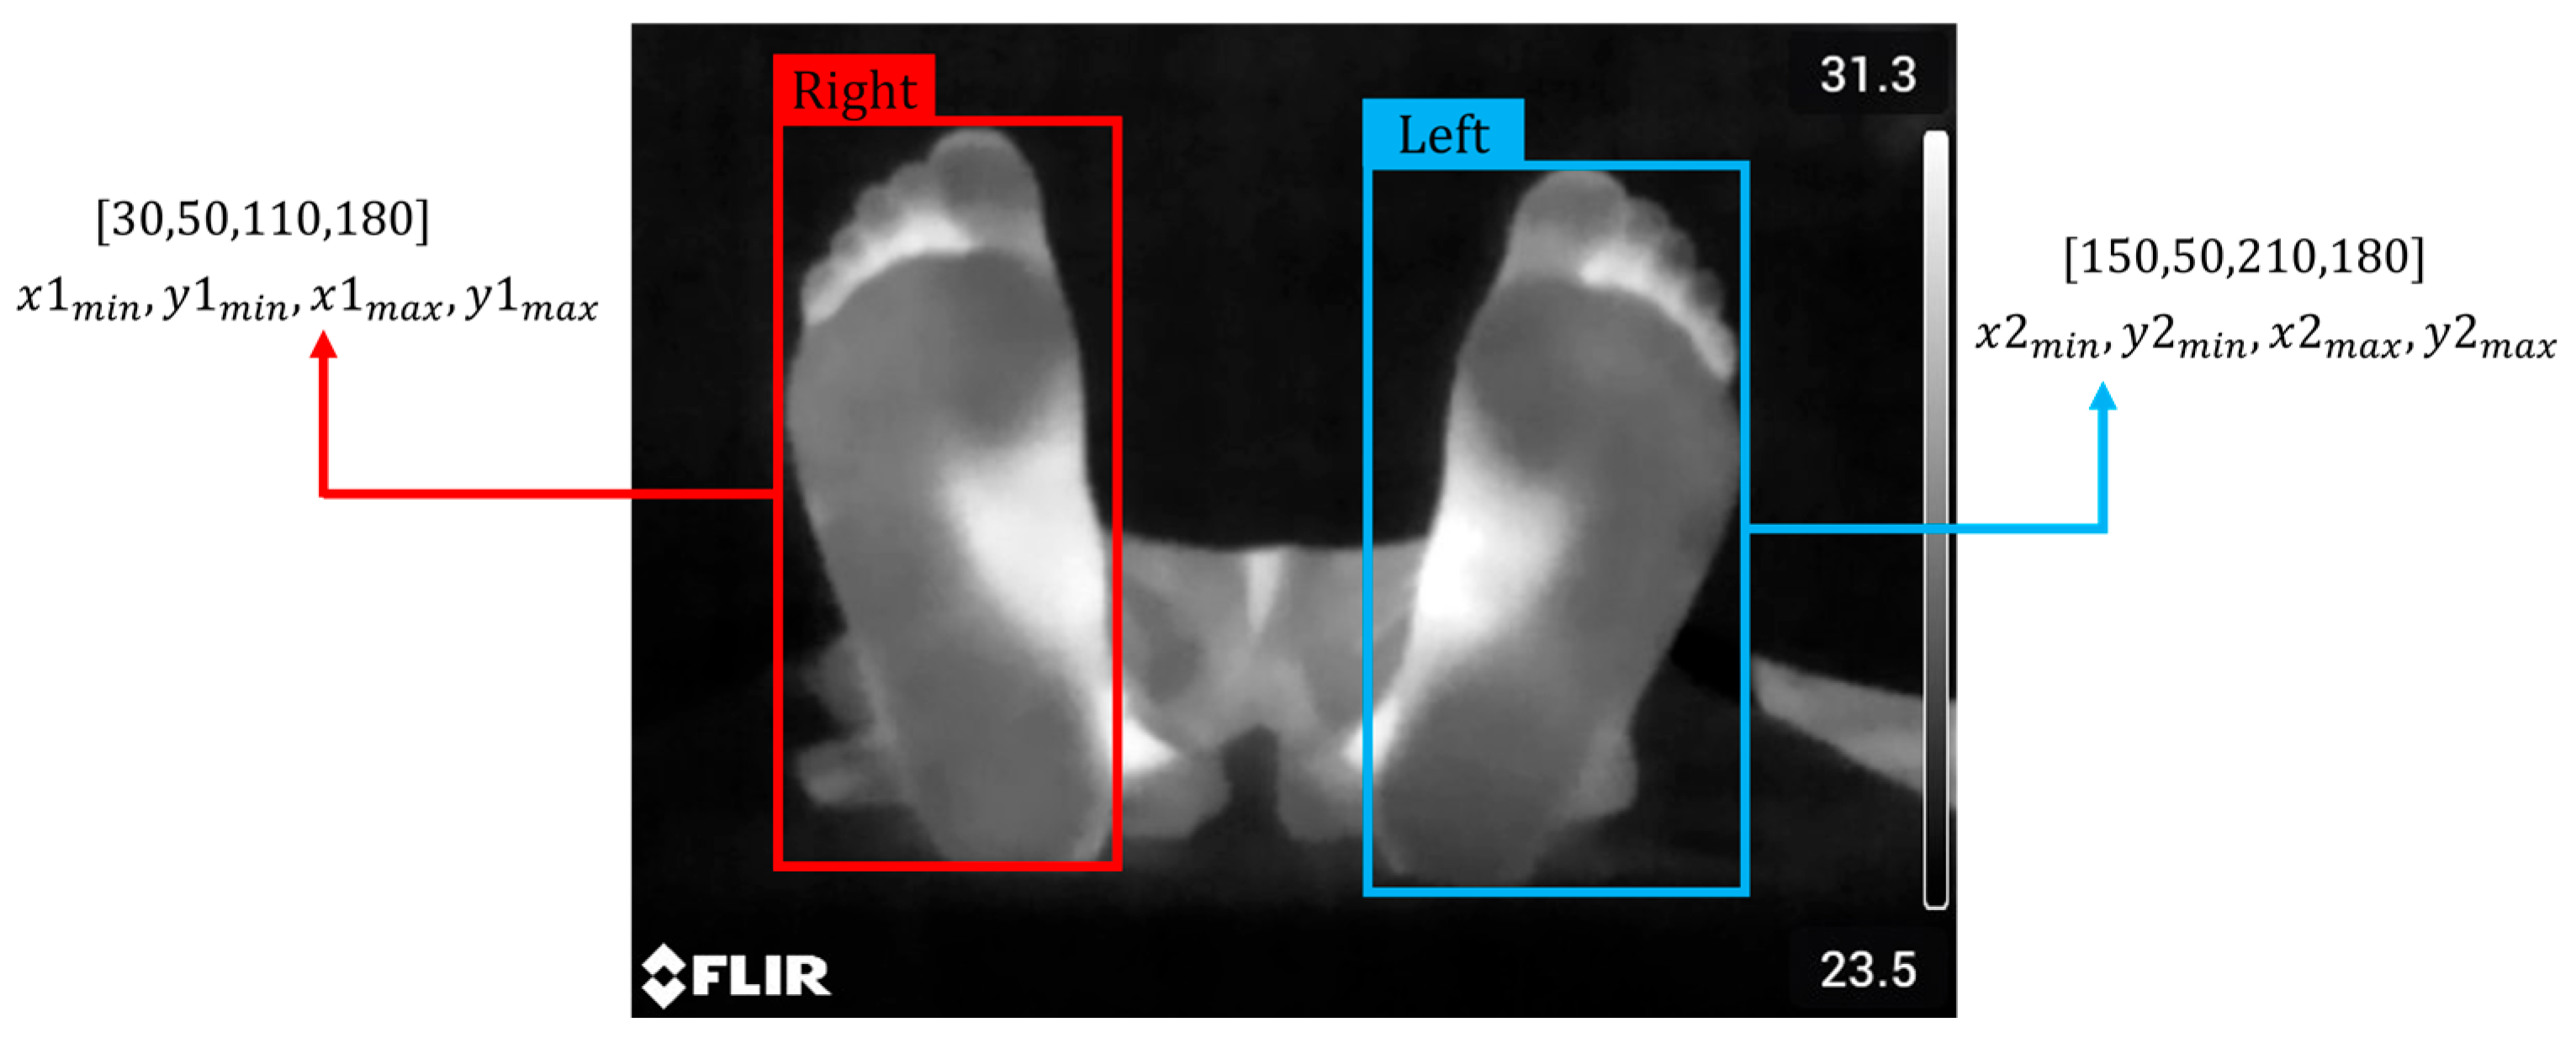
The dataset consists of 74 thermal images of the plantar region, along with 74 annotation files in JSON format containing the coordinates of the regions of interest associated with each image. Each region of interest is defined by a bounding box annotation following the Pascal VOC format, which specifies the object location using the coordinates of the top-left and bottom-right corners of the bounding box (Figure 3).
Figure 3.
Bounding box format.
For model development, the dataset was divided into three subsets: training (70%), validation (10%), and testing (20%). The training set was used to fit the model parameters, the validation set was employed to monitor the learning process and optimize hyperparameters, and the test set was used to evaluate the final performance of the model.
2.2.2. Data Augmentation
In deep learning, data augmentation is a widely used technique for improving model performance by artificially generating new samples from the original dataset [19]. This strategy is particularly useful when the available dataset is limited, as complex models such as convolutional neural networks (CNNs) may suffer from overfitting or memorization when trained with a small number of samples [20].
In this study, due to the limited number of available images, a data augmentation strategy was implemented to enhance the model’s ability to generalize to unseen patients and variations in acquisition conditions. Data augmentation was applied exclusively to the training set, generating artificial samples through transformations that simulate potential variations during thermogram acquisition. The applied transformations included rotations and horizontal flips associated with variations in camera positioning, brightness adjustments related to differences in sensor response or acquisition conditions, and the addition of Gaussian noise to simulate possible disturbances during image capture.
Considering that geometric transformations may alter the position of the regions of interest (ROIs), the corresponding bounding box coordinates must be updated accordingly. Therefore, the data augmentation process was implemented using the Albumentations library [21], which enables the application of geometric and photometric transformations while maintaining consistency between the modified images and their associated annotations. From each image in the training set, 30 augmented versions were generated, increasing the total number of images from 51 to 1530.
2.2.3. Model Construction
The proposed model aims to automatically estimate the coordinates of the bounding boxes that delimit the regions corresponding to the plantar areas of the feet. Unlike pixel-level segmentation approaches, this method is based on a direct regression model using convolutional neural networks (CNNs).
The architecture was designed to receive the pre-processed thermal images and extract relevant spatial features through a series of three convolutional layers followed by pooling layers. The extracted features are then processed by a fully connected layer, which produces an output vector of eight values corresponding to the normalized coordinates of the bounding boxes: (). The normalized values were obtained using a sigmoid activation function in the output layer.
The loss function used was the Mean Squared Error (MSE), defined in Equation (1):
where represents the total number of samples, denotes the ground-truth value (true bounding box coordinates), and represents the value predicted by the CNN. MSE penalizes large errors more strongly, allowing the model to learn more precise coordinate estimations [22].
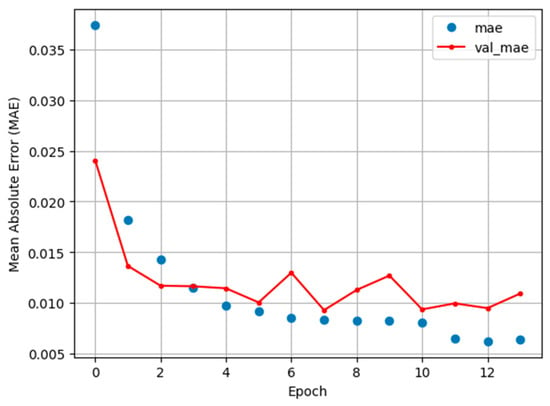
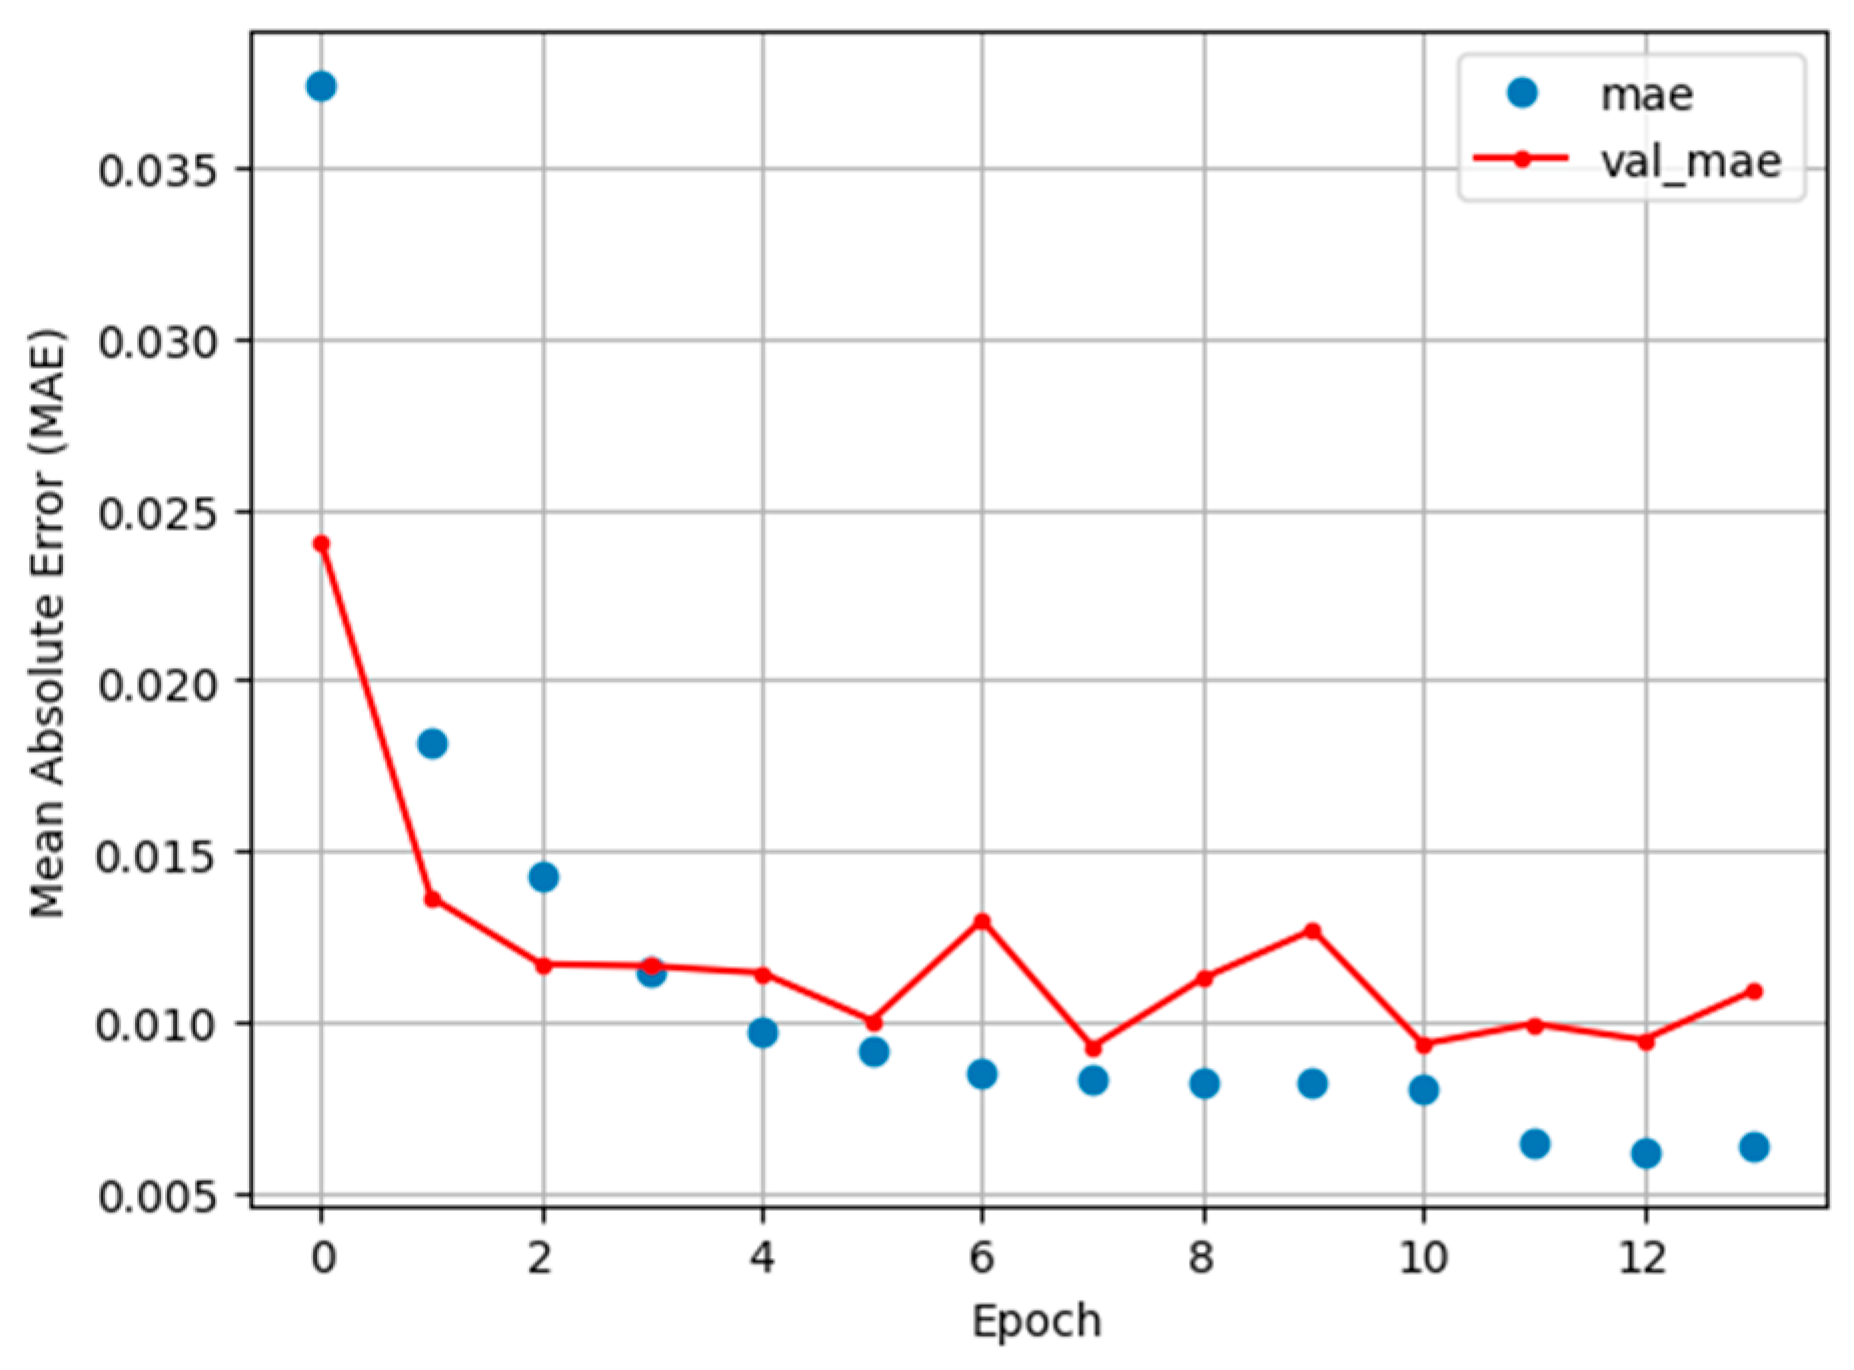
The model was optimized using the Adam optimizer, which provides stable convergence even when working with limited datasets [23]. During training, a batch size of 16 images and a maximum of 50 epochs were used. Additionally, the early stopping and reduce learning rate on plateau techniques were applied to stop the training process or reduce the learning rate by half when no improvement in the validation loss was observed for 6 and 3 consecutive epochs, respectively. The training and validation behaviour of the model is illustrated in Figure 4.
Figure 4.
Validation loss.
As shown in Figure 4, the training process stopped after 13 epochs due to the absence of improvement in the validation loss. Although a slight level of overfitting can be observed, it does not significantly compromise the model’s ability to generalize to new data.
2.2.4. Thermal Preserving and Homogenization
Each plantar surface delimited by the estimated bounding boxes was cropped from the original thermal image. In order to remove background noise and preserve only the thermal information corresponding to the plantar region, a thresholding operation was applied, as defined in Equation (2):
where represents the plantar surface image, corresponds to the threshold value defined in this study, and denotes the resulting thresholded image. No significant isolated pixels or fragmented regions were visible in the resulting images after thresholding, so no additional smoothing or morphological post-processing was necessary.
Since the deformity analysis was performed using only one foot per participant, which could correspond to either the left or right foot depending on the subject, images corresponding to the left foot were horizontally flipped to maintain a consistent anatomical orientation across all samples in the dataset.
Finally, all images were resized to a fixed spatial resolution of 170 × 330 pixels in order to ensure a homogeneous representation of the plantar surface prior to the subsequent stages of analysis and feature extraction.
2.3. Feature Extraction and Selection
2.3.1. Intensity Profile
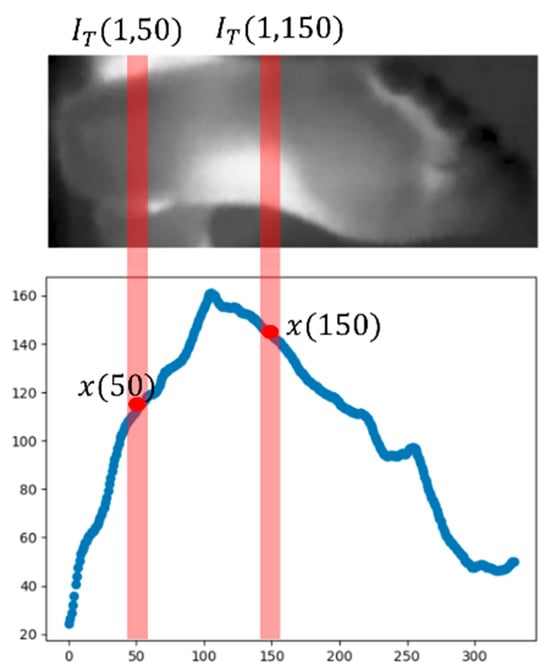
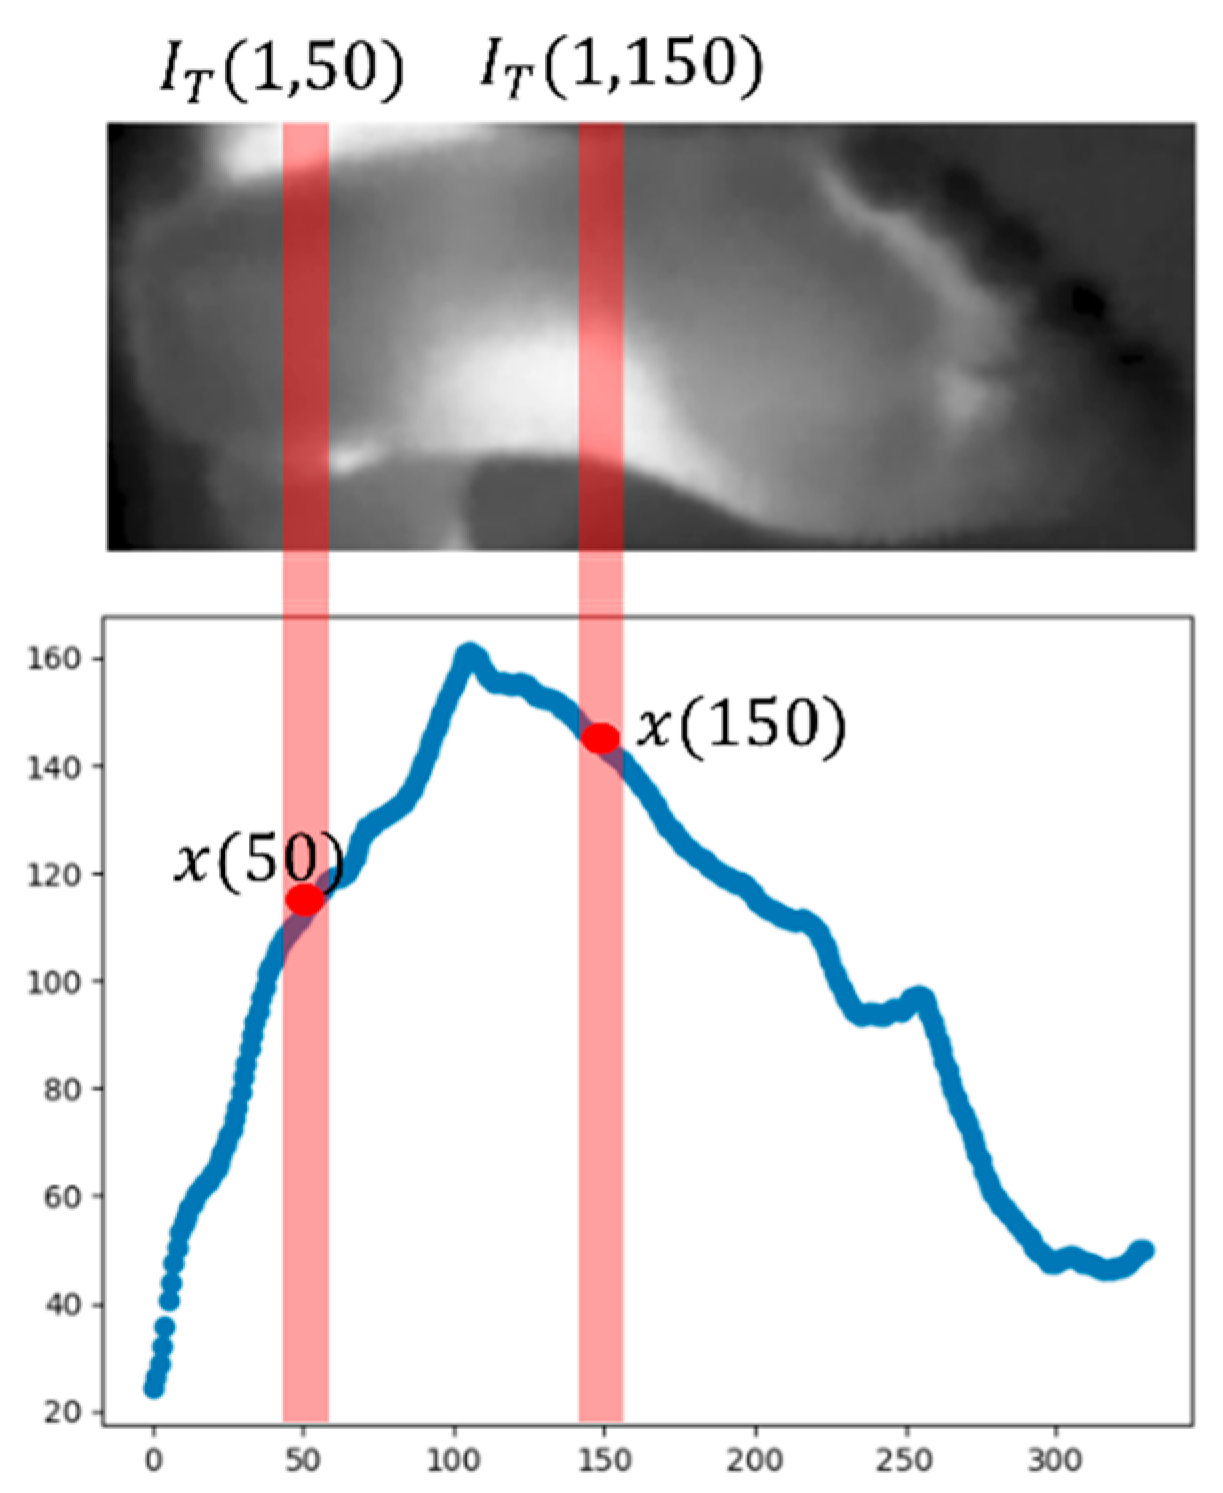
The intensity profile is a one-dimensional representation commonly used in image analysis to describe the spatial variation in pixel intensity along a specific axis of an image [24]. In this study, the information contained in a two-dimensional image is projected into a one-dimensional vector by averaging the pixel intensities along one of its dimensions.
Let be a thermal image representing the plantar surface of the foot, where and denote the number of rows and columns, respectively, and represents the intensity value at position . The intensity profile is computed by averaging the intensity values across each column, as defined in Equation (3):
where denotes the average intensity of column The resulting vector describes the longitudinal thermal distribution of the plantar surface of the foot. The representation of the intensity at the foot is illustrated in Figure 5.
Figure 5.
Representation of the intensity profile.
2.3.2. Statistical Features
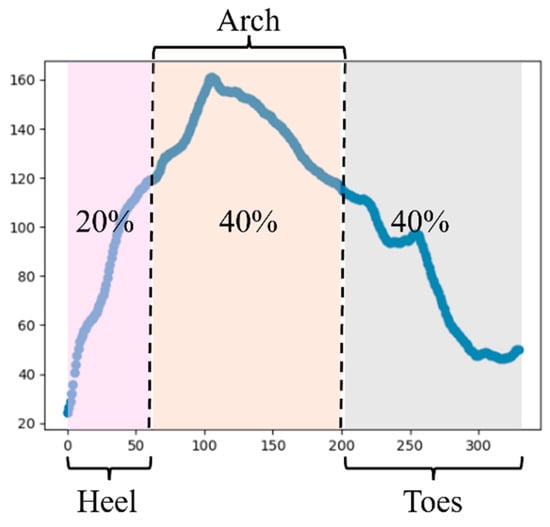
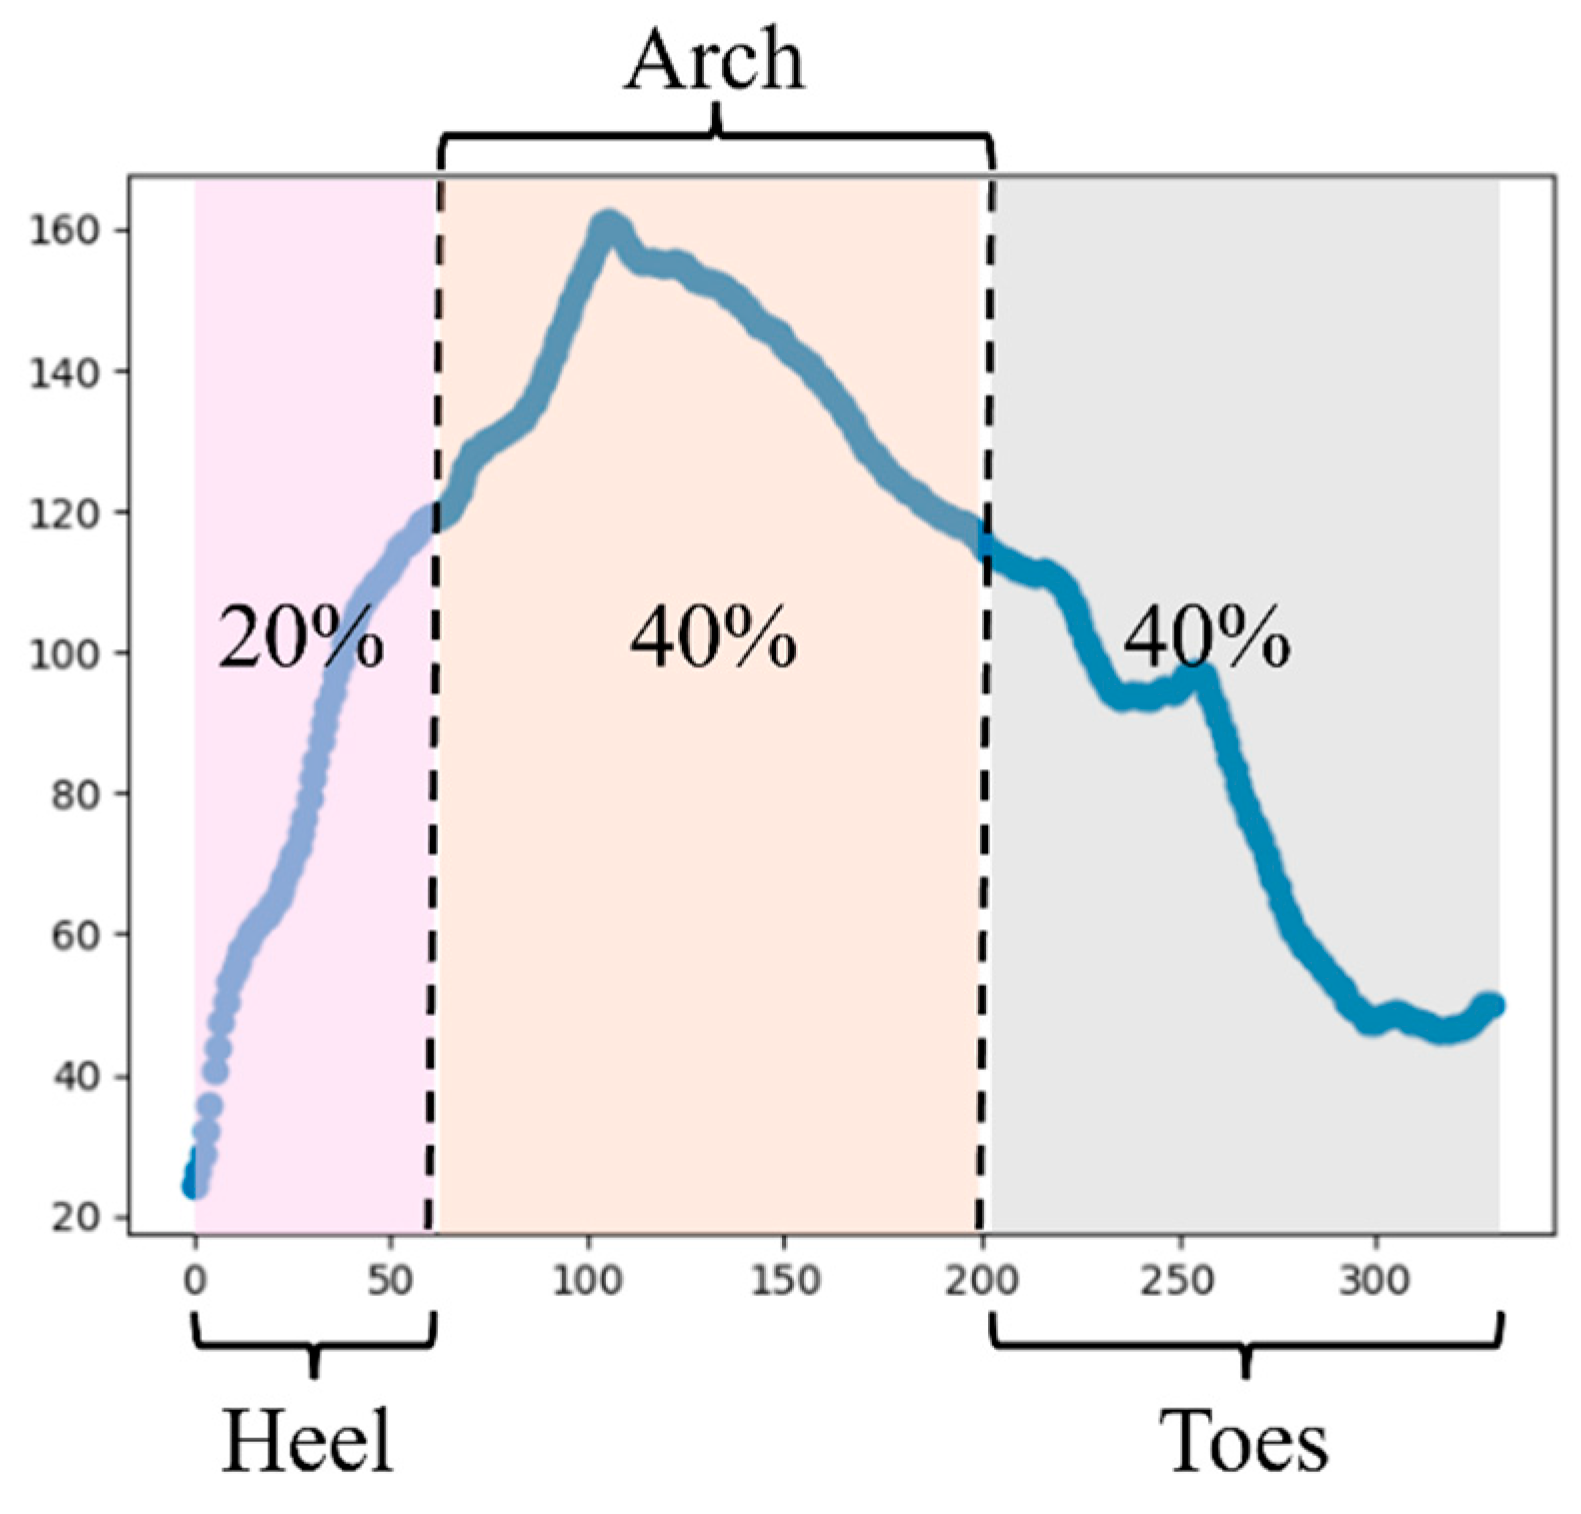
Considering that each intensity profile preserves the spatial thermal distribution along the longitudinal axis of the foot, each vector was divided into three main anatomical regions: heel, arch, and forefoot. The vector segmentation was performed assuming that the first 20% of the total vector length corresponds to the heel region, the interval between 20% and 60% corresponds to the plantar arch, and the remaining 40% corresponds to the forefoot region (Figure 6).
Figure 6.
Proposed plantar regions.
This division was defined to capture the thermal behaviour of anatomically and biomechanically distinct plantar regions, since temperature distribution may be influenced by factors such as blood flow, plantar pressure, and other physiological variables.
From each section of the intensity profile, the statistical features presented in Table 2 were extracted. These features describe different aspects of the thermal behaviour, including absolute temperature levels, thermal variability, regional temperature differences, and local thermal gradients.
Table 2.
Foot Thermal Features.
2.3.3. Cohen’s D Feature Selection
Cohen’s D is a statistical measure used to evaluate how separable two distributions are by quantifying the magnitude of the difference between the means of two groups in units of standard deviation [25]. Cohen’s D is defined in Equation (4) as
where and represent the mean of group 1 and group 2, respectively, and corresponds to the pooled standard deviation, defined in Equation (5) as
where and denote the variances of each group, and and represent the number of samples in each group. According to the interpretation proposed by Jacob Cohen, the typical values of can be categorized according to their magnitude, as shown in Table 3 [25].
Table 3.
Cohen’s D interpretation.
From the perspective of a classification problem, such as the one addressed in this study, Cohen’s D is computed for each feature by comparing the two groups (normal foot and cavus foot). Features with larger Cohen’s D values indicate a greater difference between groups and therefore a higher discriminative capability. Accordingly, the features were ranked based on the absolute value of , and the top features with the highest magnitude were selected.
2.4. Model Implementation
Considering the distinction between normal foot and cavus foot based on the thermal behaviour of the plantar surface as a binary classification problem, three machine learning models were evaluated: logistic regression (LR), support vector machines (SVMs), and k-nearest neighbours (KNNs) [26].
Logistic regression is a probabilistic linear model commonly used for binary classification problems, which estimates the probability of class membership using a logistic function. Support vector machines (SVMs), on the other hand, aim to find the optimal hyperplane that maximizes the separation between classes in the feature space. In contrast, the KNN algorithm performs classification by assigning the most frequent label among the k nearest samples in the feature space.
Due to the limited number of samples available in this study, the models were evaluated using a Leave-One-Subject-Out (LOSO) cross-validation strategy. In this approach, the features corresponding to a single participant are used as the test set, while the samples from the remaining participants are used for training. This process is iteratively repeated for each subject in the dataset, ensuring that each participant is used once as the test sample. The final performance of each model is obtained by aggregating the results across all iterations. This methodology allows evaluating the generalization capability of the models to unseen patients, while simultaneously reducing the risk of overfitting associated with small datasets.
Finally, the performance of each model was evaluated using the accuracy, precision, recall, and F1-score metrics.
2.5. Evaluation Metrics
2.5.1. Regression Metrics
Since the regression model is based on the estimation of bounding boxes, the Mean Absolute Error (MAE) and the Intersection over Union (IoU) metrics were used to evaluate its performance. The MAE measures the average numerical difference between the predicted and ground-truth values (Equation (6)):
IoU, on the other hand, quantifies the degree of overlap between the bounding box predicted by the model and the ground-truth bounding box [27], as defined in Equation (7):
where the intersection area represents the overlapping region between the predicted and ground-truth bounding boxes, whereas the union area corresponds to the total area covered by both regions [27].
2.5.2. Classification Metrics
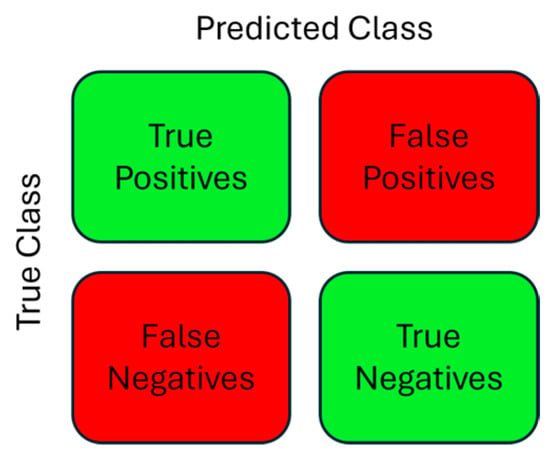
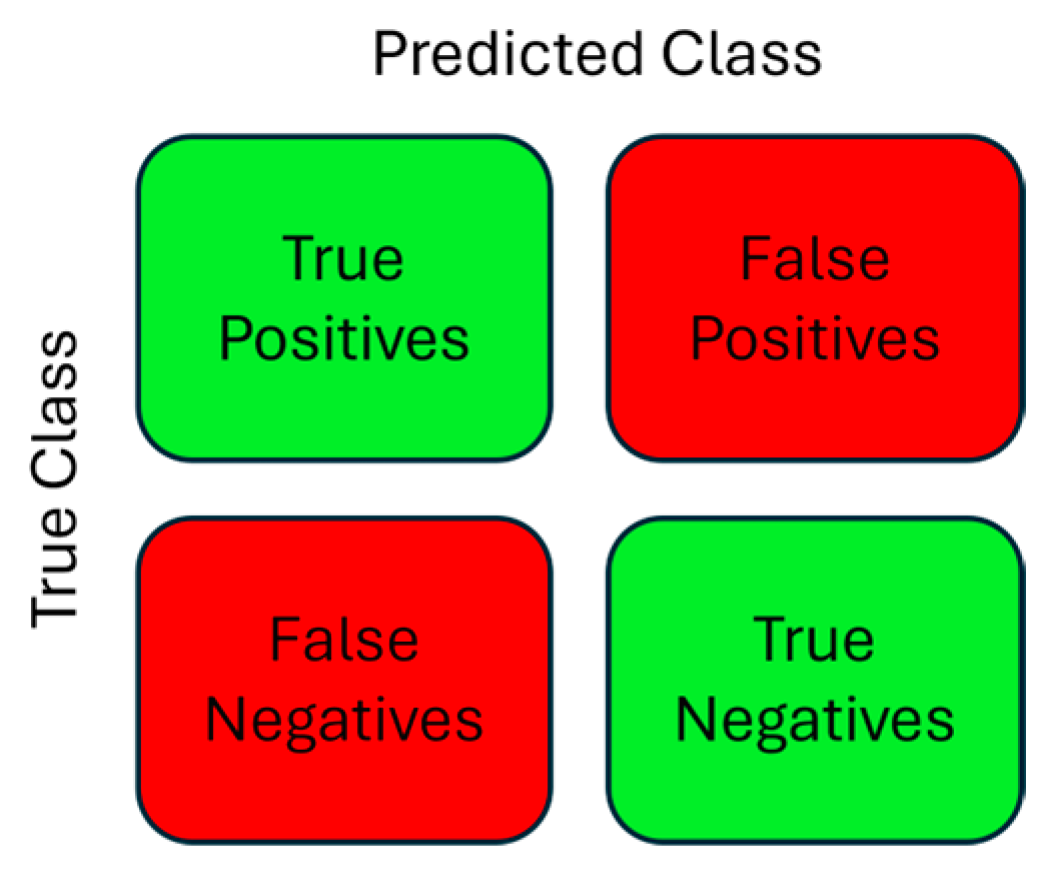
The confusion matrix is an square matrix that shows the performance of a classification algorithm, where each column reports the results of the predicted class, each row represents the actual results of each class, and indicates the number of classes. For the specific case of a binary problem, such as normal and cavus foot, Figure 7 shows the confusion matrix.
Figure 7.
Confusion matrix for a binary classification case.
3. Results
3.1. ROIS Segmentation Model
Based on the learning curves presented in Figure 4, the segmentation performances achieved by the proposed CNN were evaluated on the training, validation, and testing datasets. The corresponding results are summarized in Table 4.
Table 4.
Evaluation metrics Segmentation model performance.
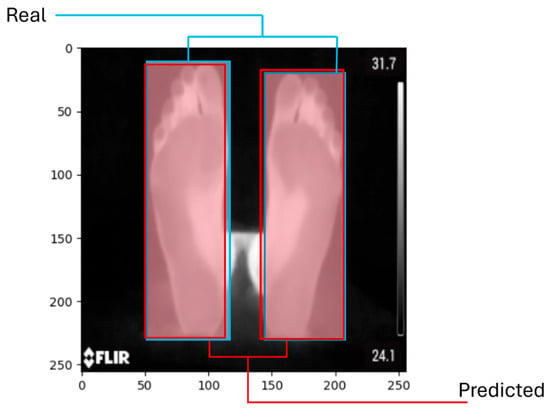
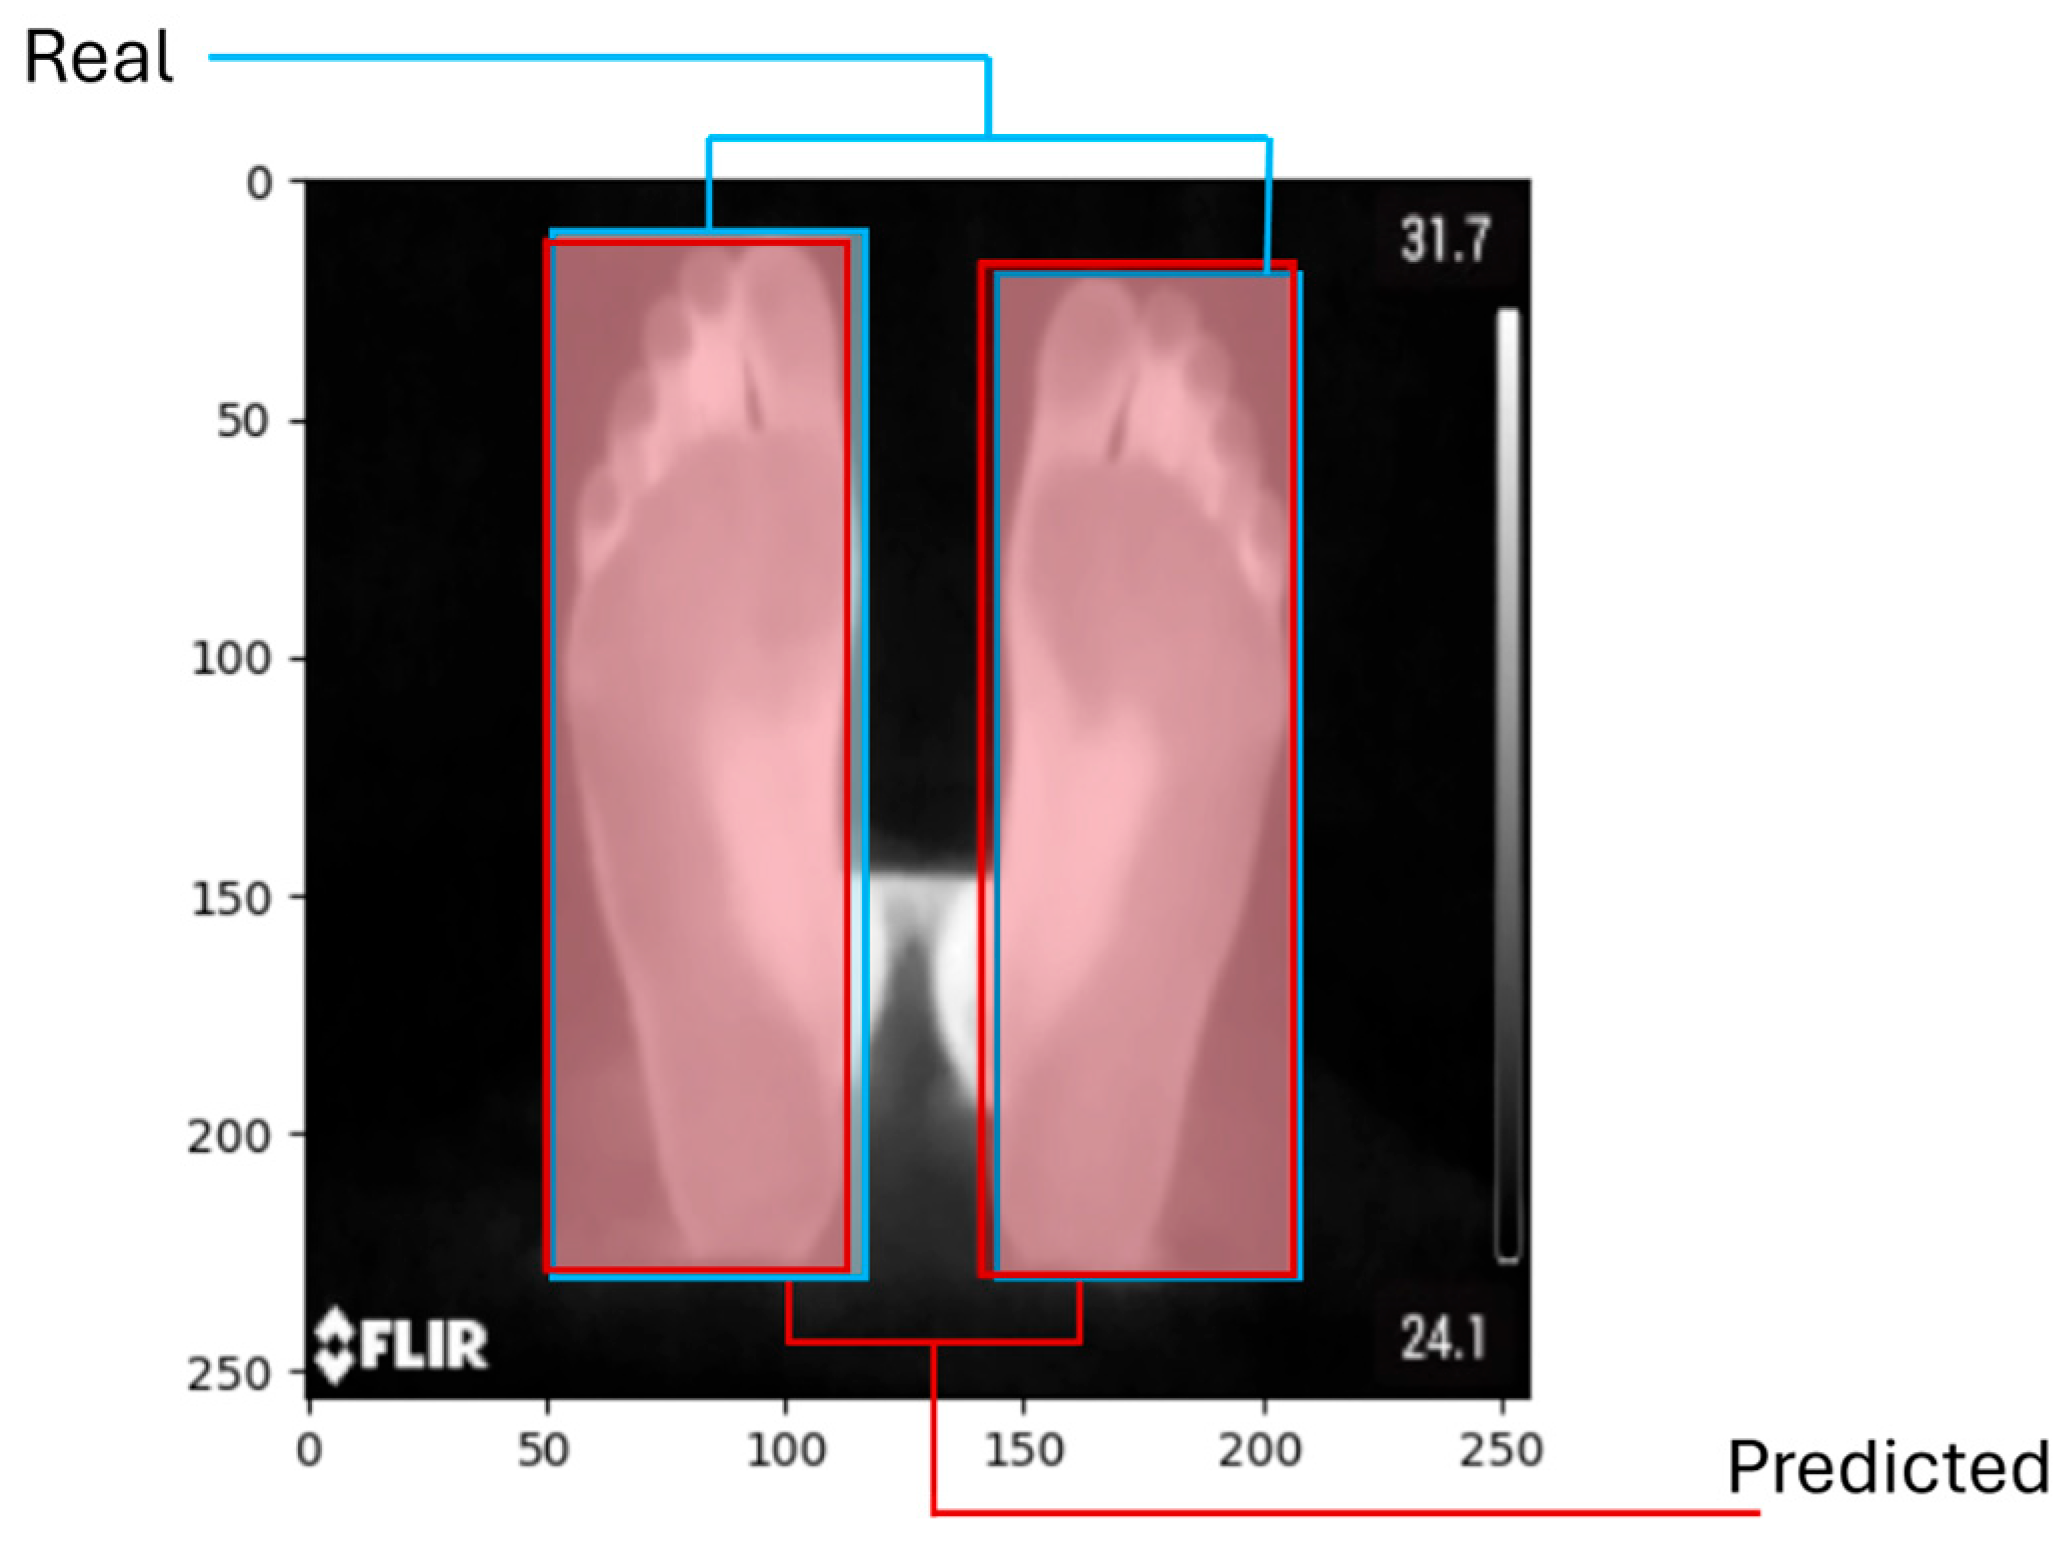
Although the model does not achieve IoU values above 90%, the predicted bounding boxes adequately cover the regions of interest corresponding to the plantar surface, which allowed the subsequent processing stages to be performed without significantly compromising the thermal analysis. Figure 8 shows the bounding box produced by the model.
Figure 8.
Regression model inference, comparison between obtained bounding box and real bounding box.
It is important to note that the IoU metric penalizes even small spatial displacements between the predicted and ground-truth bounding boxes. In this context, variations in the order of ±5 pixels may noticeably reduce the numerical value of the IoU while still maintaining an adequate practical localization of the regions of interest for the subsequent analysis.
3.2. Feature Extraction and Cohen’s D Feature Selection
Considering that both groups consisted of 12 samples per class, the computation of the features described in Table 3 resulted in a feature matrix of dimension (12 × 16) for each group, where 12 corresponds to the number of patients per class and 16 represents the total number of extracted thermal features.
Table 5 presents six of the features that showed the highest statistical separation between groups, according to the Cohen’s D coefficient.
Table 5.
Cohen’s D results.
Based on these results, four features with the highest discriminative power were selected: variance in the heel region, variance in the forefoot region, the minimum value in the forefoot region, and the thermal difference between the heel and the forefoot. This selection allowed reducing the dimensionality of the dataset while preserving the most discriminative thermal characteristics between both conditions.
3.3. Classification Model Performance
Considering the Leave-One-Subject-Out (LOSO) cross-validation strategy applied to the classification models, the average performance across all iterations was computed for each evaluation metric. Table 6 presents a comparison of the model performance using both the full set of extracted features and the four best features selected using Cohen’s D coefficient.
Table 6.
Model Performance.
From the results shown in Table 5, a general improvement in model performance can be observed when using only the four selected features. This behaviour suggests that the proposed thermal indicators provide greater discriminative capability between normal foot and cavus foot conditions, while simultaneously reducing the dimensionality of the feature space.
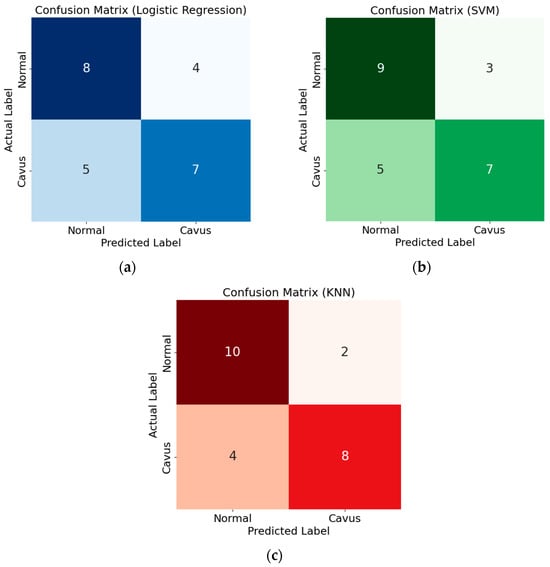
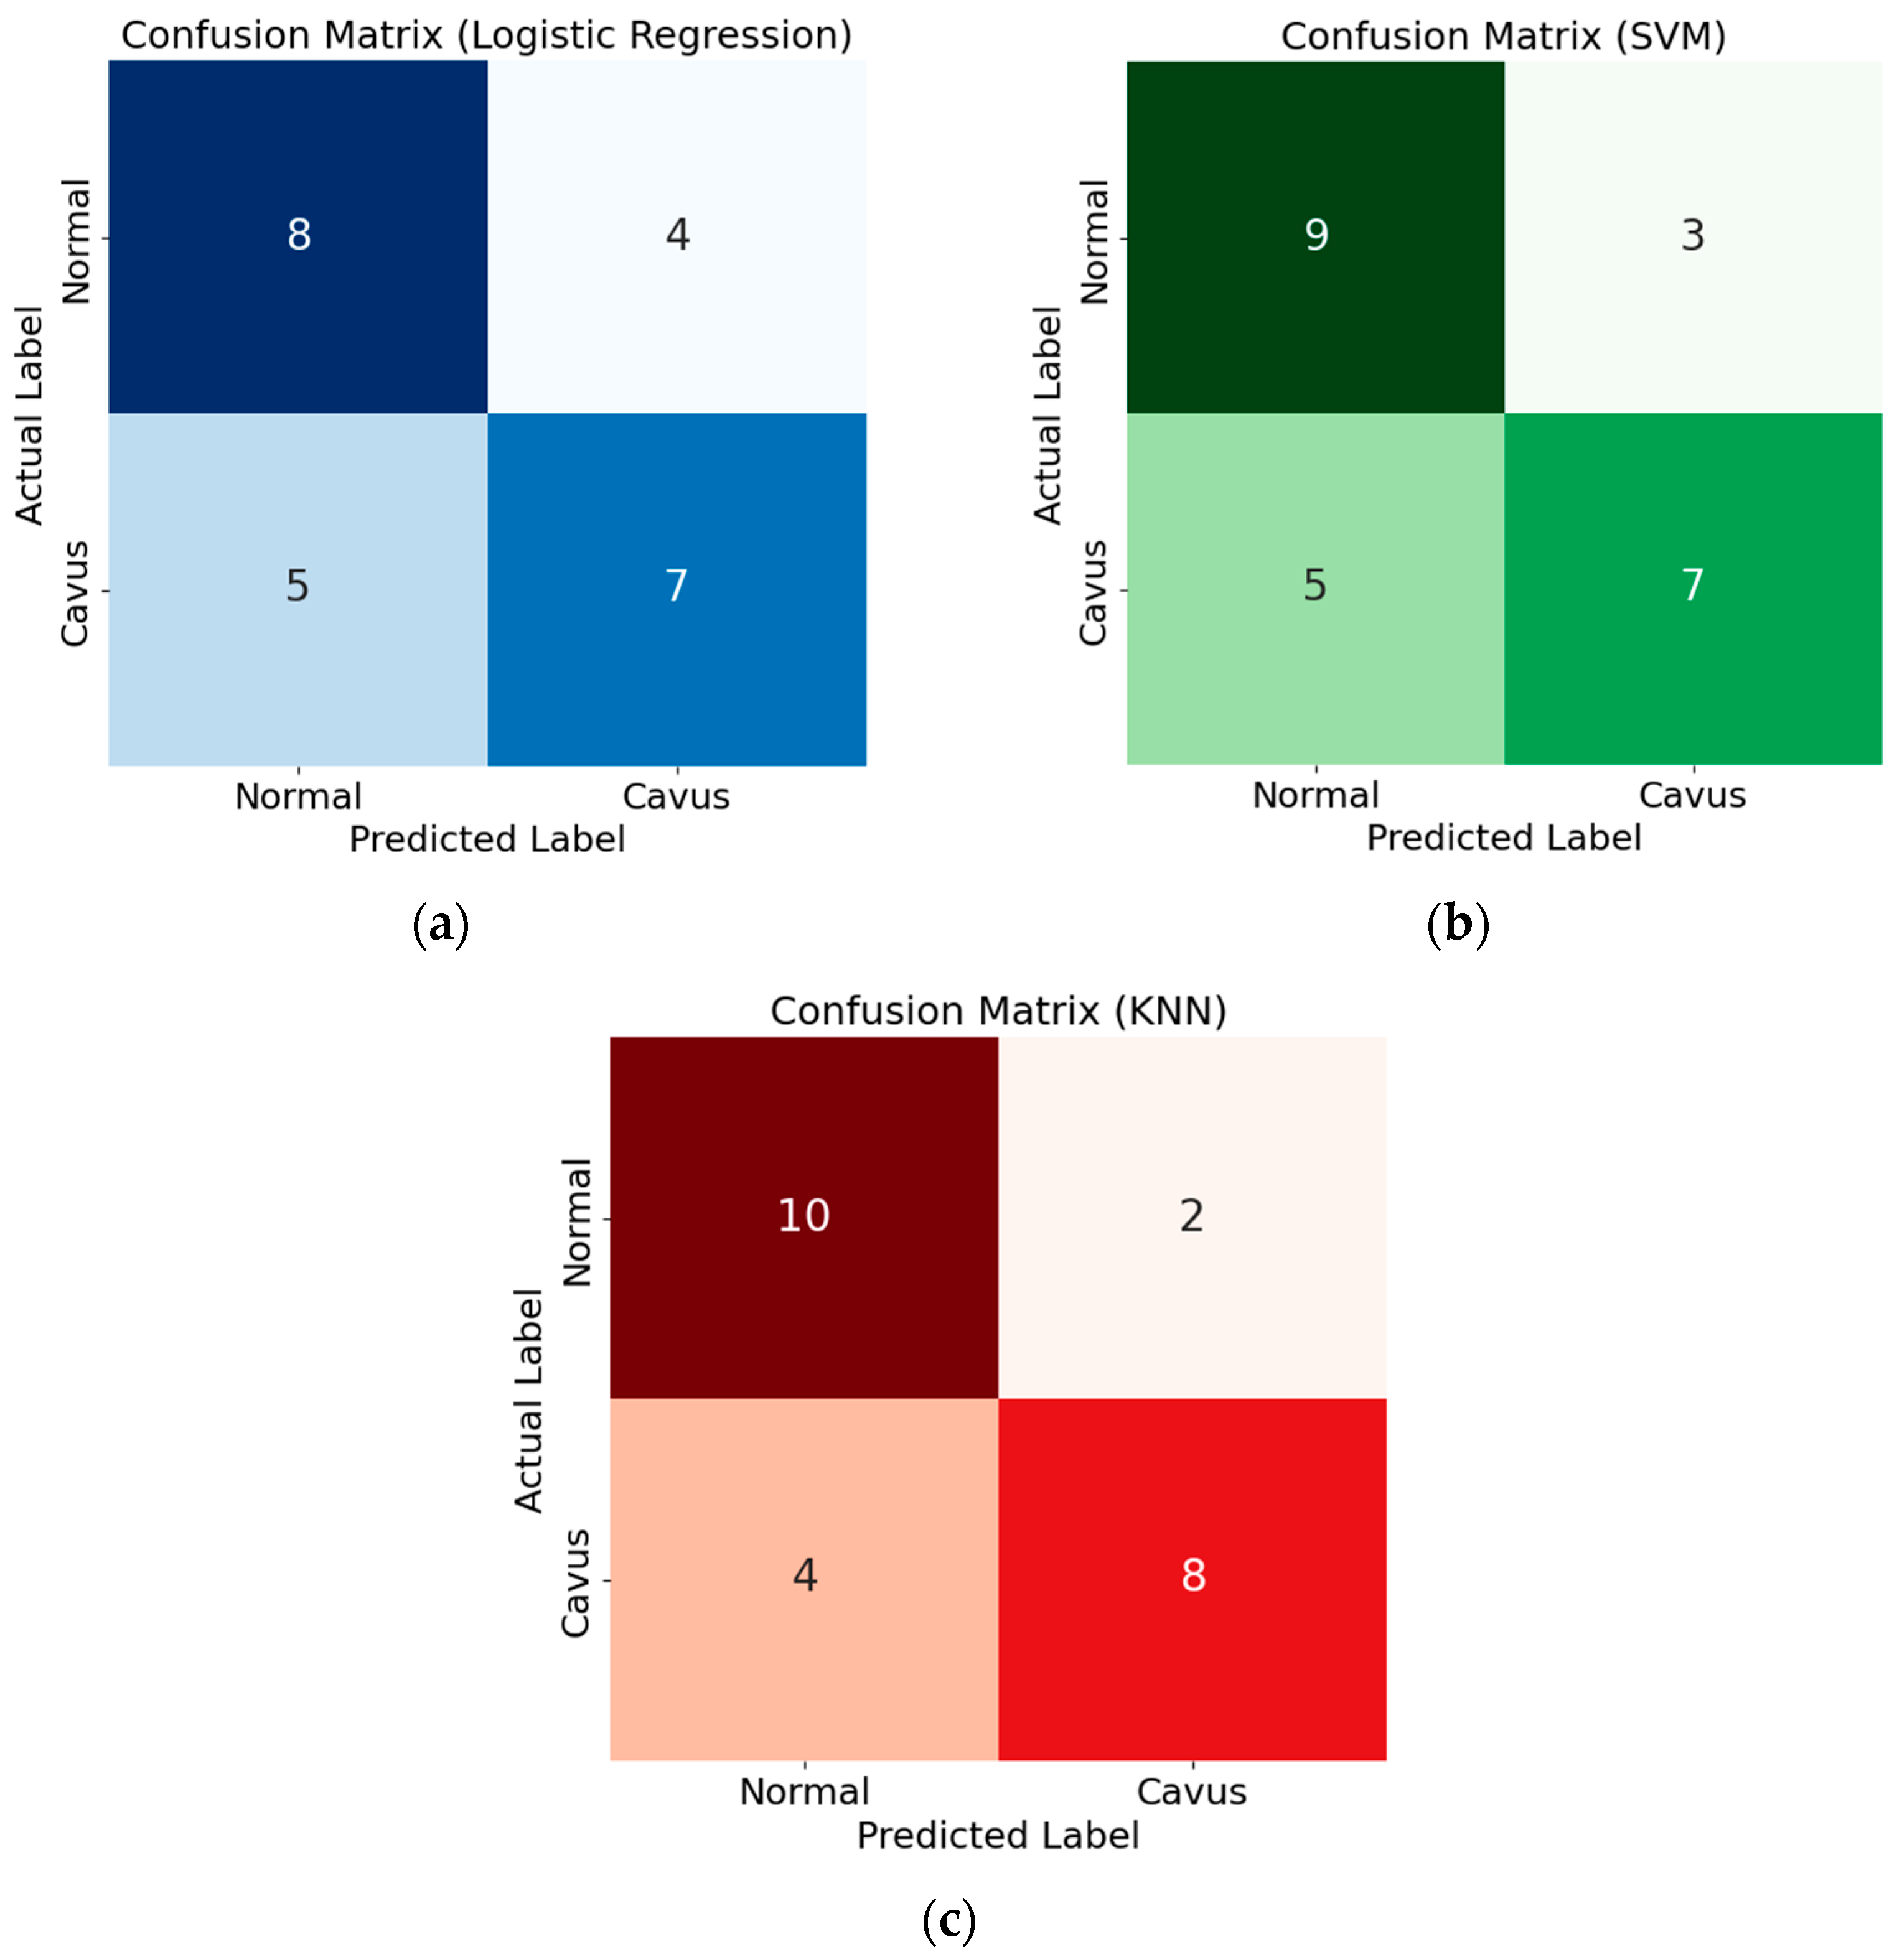
Figure 9 shows the confusion matrices of the models using the features obtained through the Cohen selector, providing a more detailed visualization of performance. As can be seen from the figure, all models struggle to correctly identify patients with cavus foot. This behaviour suggests that thermal features associated with cavus foot present greater inter-subject variability or overlap more with features of a normal foot. This limitation highlights the need for a larger sample size to improve detection of the cavus foot condition.
Figure 9.
Confusion Matrix: (a) Logistic Regression, (b) SMV, and (c) KNN.
Among the evaluated models, the KNN classifier achieved the best performance, using k = 5 neighbours, reaching the highest precision and F1-score values. This result suggests that the separation between classes in the feature space does not follow a strictly linear boundary, which favours the performance of local neighbourhood-based methods such as KNN. It is important to note that the model is intended as a tool to assist with the initial screening of plantar arch abnormalities. From this perspective, it is more important to minimise false negatives associated with the cavus foot class than false positives. A false negative could prevent an individual with a potential biomechanical abnormality requiring specialised evaluation from being identified, whereas a false positive would merely lead to an additional clinical assessment.
Using this approach, the results show that the KNN classifier produced four false negatives for the cavus foot class and correctly identified eight of the twelve available cases (66.7% sensitivity). While the number of false positives is low (two cases), the number of false negatives is still clinically significant as it implies that approximately one-third of individuals with cavus feet would not be detected by the system. These results suggest that, while the model can differentiate between the two conditions, the number of clinical cases must be increased, and strategies to improve classification sensitivity must be explored, to enable a more robust distinction between normal and cavus feet.
4. Discussion
The aim of this study was to detect cavus and normal foot types using infrared thermography and machine learning techniques. The obtained results show that the classification model based on geometric features derived from foot segmentation achieved an accuracy of 75% using the kNN algorithm. The present study was conducted using a dataset composed of 74 thermal images used for the segmentation of both feet, from which 24 labelled thermal samples correspond to individuals with cavus foot deformity and a control group.
Table 7 presents an overview of previously reported methods for foot type classification based on image analysis and machine learning, including the proposed thermographic approach. Previous image-based approaches using plantar footprints or pressure maps have reported classification accuracy exceeding 90% [12,28,29,30]. In contrast, the proposed thermographic method achieved a lower performance (75%), which may be related to differences in the type of information analysed and the methodological approach employed. While previous studies relied on structural or biomechanical features directly derived from footprint images or plantar pressure maps, frequently combined with more complex machine learning models and larger datasets, the proposed thermographic approach is based on physiological information associated with thermal distribution patterns rather than purely morphological characteristics. Although this may limit the ability to capture subtle discriminative patterns related to foot structure, infrared thermography offers several advantages, including non-contact image acquisition, lower computational complexity, methodological simplicity, and improved interpretability. Furthermore, this work represents an exploratory and novel approach for automatic foot type classification using thermal images. In this sense, the present study aims to establish the foundations for the use of infrared thermography in foot type classification, while opening opportunities for future improvements through larger datasets, standardized acquisition protocols, and the implementation of more advanced machine learning or deep learning models.
Table 7.
Image-based and machine learning methods for foot type classification.
5. Limitations
Despite the encouraging results obtained, this study presents several limitations that should be considered in future work. First, the size of the dataset was relatively small, which may have affected the ability of the models to generalize patterns across different foot types. Second, the proposed approach was mainly based on geometric features derived from segmentation, which reduces model complexity but may overlook more complex thermal information that could potentially improve classification performance. Thirdly, the study only included patients with normal or cavus feet, as an assessment revealed that only one participant had flat feet. Finally, the lack of previous studies specifically focused on foot type classification using thermography limits the possibility of direct comparisons with established methodologies, although it also highlights the original and exploratory nature of this work. Based on these limitations, several future research directions can be proposed. Firstly, it is important to expand the dataset by including a larger number of subjects in each group. Furthermore, the flat-footed group should be included. This could improve the generalization capability of the models and potentially allow the exploration of deep learning approaches. Additionally, incorporating thermal features directly derived from the images could help evaluate whether artificial intelligence models can detect subtle thermal patterns associated with different foot morphologies. In this way, future work would not only aim to improve the performance metrics of the models but also open a novel research direction involving infrared thermography for the evaluation of foot morphology.
6. Conclusions
This work proposed a method based on infrared thermography and artificial intelligence for foot type detection, integrating an automatic segmentation of the plantar region and a classification stage based on morphological features extracted from that region. In the segmentation stage, Intersection over Union (IoU) values of 86.77% for training, 84.91% for validation, and 83.07% for testing were obtained, demonstrating a high level of agreement between the predicted segmentations and the reference masks. In the classification stage, the best performance was achieved by the k-Nearest Neighbour (kNN) algorithm, reaching 75% accuracy, 80% precision, 72.2% F1-score, and 66.6% recall. The main practical contribution is demonstrating the feasibility of using thermographic images alongside artificial intelligence techniques to automatically and objectively identify foot types rapidly and non-invasively. Furthermore, this methodology can be used as a basis for the assessment of other foot conditions.
Author Contributions
Conceptualization, I.A.C.-A. and S.C.-U.; methodology, I.A.C.-A. and S.C.-U.; software, C.E.G.-R., I.A.C.-A. and S.C.-U.; validation, I.A.C.-A., S.C.-U. and M.P.G.-H.; formal analysis, C.E.G.-R. and S.C.-U.; investigation, all authors; resources, I.A.C.-A., L.A.M.-H. and M.P.G.-H.; data curation, M.P.G.-H.; writing—original draft preparation, all authors; writing—review and editing, all authors; visualization, I.A.C.-A. and M.P.G.-H.; supervision, I.A.C.-A., L.A.M.-H. and E.R.-O.; project administration, I.A.C.-A., L.A.M.-H. and M.P.G.-H. All authors have read and agreed to the published version of the manuscript.
Funding
This research received no external funding.
Institutional Review Board Statement
The study was conducted in accordance with the Declaration of Helsinki and approved by the Ethics Committee of the Engineering Faculty of the Autonomous University of Queretaro (protocol code CEAIFI-081-2024-TP).
Informed Consent Statement
Informed consent was obtained from all subjects involved in the study.
Data Availability Statement
To access the database, please contact the authors of the manuscript and the corresponding author at irving.cruz@uaq.mx.
Acknowledgments
The first and second authors would like to thank the Secretary of Science, Humanities, Technology and Innovation (SECIHTI) for the scholarship awarded.
Conflicts of Interest
The authors declare no conflicts of interest.
Abbreviations
The following abbreviations are used in this manuscript:
| cGAN | Conditional Generative Adversarial Networks |
| CNN | Convolutional Neural Network |
| IoU | Intersection over Union |
| JSON | JavaScript Object Notation |
| KNNs | K-Nearest Neighbors |
| LOSO | Leave-One-Subject-Out |
| LR | Logistic Regression |
| MAE | Mean Absolute Error |
| MSE | Mean Squared Error |
| RGB | Red–Green–Blue |
| ROIs | Regions of Interest |
| VOCs | Visual Object Classes |
References
- Franco, A.H. Pes Cavus and Pes Planus: Analyses and Treatment. Phys. Ther. 1987, 67, 688–694. [Google Scholar] [CrossRef] [Scilit] [PubMed]
- Kim, D.; Lewis, C.L.; Gill, S.V. Effects of obesity and foot arch height on gait mechanics: A cross-sectional study. PLoS ONE 2021, 16, e0260398. [Google Scholar] [CrossRef] [Scilit] [PubMed]
- Keivanfar, N.; Shadmehr, A.; Otadi, K.; Mir, S.M.; Salehi, S. Comparison of the Plantar Pressure and Foot Function and Range of Motion in Distance Runners with the Normal, Pronated, and Supinated Feet During Static Standing. J. Mod. Rehabil. 2020, 15, 15–24. [Google Scholar] [CrossRef] [Scilit]
- Arachchige, S.N.K.; Chander, H.; Knight, A. Flatfeet: Biomechanical implications, assessment and management. Foot 2019, 38, 81–85. [Google Scholar] [CrossRef] [Scilit] [PubMed]
- Alexander, I.J.; Chao, E.Y.; Johnson, K.A. The Assessment of Dynamic Foot-to-Ground Contact Forces and Plantar Pressure Distribution: A Review of the Evolution of Current Techniques and Clinical Applications. Foot Ankle 1990, 11, 152–167. [Google Scholar] [CrossRef] [Scilit] [PubMed]
- Abdul Razak, A.H.; Zayegh, A.; Begg, R.K.; Wahab, Y. Foot Plantar Pressure Measurement System: A Review. Sensors 2012, 12, 9884–9912. [Google Scholar] [CrossRef] [Scilit] [PubMed]
- Price, C.; Parker, D.; Nester, C. Validity and repeatability of three in-shoe pressure measurement systems. Gait Posture 2016, 46, 69–74. [Google Scholar] [CrossRef] [Scilit] [PubMed]
- Chockalingam, N.; Giacomozzi, C.; Healy, A.; Sacco, I.C. Discrepancies between plantar pressure devices: Evaluating cross-system reliability for biomechanics, clinical use and predictive modelling. Foot 2025, 64, 102190. [Google Scholar] [CrossRef] [Scilit] [PubMed]
- Pataky, T.C. Spatial resolution in plantar pressure measurement revisited. J. Biomech. 2012, 45, 2116–2124. [Google Scholar] [CrossRef] [Scilit] [PubMed]
- Zhao, Y.; Zhou, J.; Qiu, F.; Liao, X.; Jiang, J.; Chen, H.; Lin, X.; Hu, Y.; He, J.; Chen, J. A deep learning method for foot-type classification using plantar pressure images. Front. Bioeng. Biotechnol. 2023, 11, 1239246. [Google Scholar] [CrossRef] [Scilit] [PubMed]
- Ramírez-Rios, L.Y.; Olguín-Tiznado, J.E.; Ramos-Acosta, E.R.; Inzunza-Gonzalez, E.; Cano-Gutiérrez, J.C.; García-Guerrero, E.E.; Camargo-Wilson, C. Toward Smarter Orthopedic Care: Classifying Plantar Footprints from RGB Images Using Vision Transformers and CNNs. J. Imaging 2025, 11, 414. [Google Scholar] [CrossRef] [Scilit] [PubMed]
- Chae, J.; Kang, Y.-J.; Noh, Y. A Deep-Learning Approach for Foot-Type Classification Using Heterogeneous Pressure Data. Sensors 2020, 20, 4481. [Google Scholar] [CrossRef] [Scilit] [PubMed]
- Han, J.; Wang, D.; Li, Z.; Dey, N.; Crespo, R.G.; Shi, F. Plantar pressure image classification employing residual-network model-based conditional generative adversarial networks: A comparison of normal, planus, and talipes equinovarus feet. Soft Comput. 2023, 27, 1763–1782. [Google Scholar] [CrossRef] [Scilit]
- Wang, C.; Li, D.; Li, Z.; Wang, D.; Dey, N.; Biswas, A.; Moraru, L.; Sherratt, R.; Shi, F. An efficient local binary pattern based plantar pressure optical sensor image classification using convolutional neural networks. Optik 2019, 185, 543–557. [Google Scholar] [CrossRef] [Scilit]
- Eksen, K.; Serif, S.; Serif, T. Remote Pre-Diagnosis of Pes Planus and Pes Cavus Using Arch Index. Eur. J. Sci. Technol. 2021, 28, 1321–1329. [Google Scholar] [CrossRef] [Scilit]
- Niemann, U.; Spiliopoulou, M.; Malanowski, J.; Kellersmann, J.; Szczepanski, T.; Klose, S.; Dedonaki, E.; Walter, I.; Ming, A.; Mertens, P.R. Plantar Temperatures in Stance Position: A comparative Study with Healthy Volunteers and Diabetes Patients Diagnosed with Sensoric Neuropathy. EBioMedicine 2020, 54, 102712. [Google Scholar] [CrossRef] [Scilit] [PubMed]
- Gutiérrez-Vilahú, L.; Massó-Ortigosa, N.; Rey-Abella, F.; Costa-Tutusaus, L.; Guerra-Balic, M. Estudio comparativo de las huellas plantares en jóvenes con síndrome de Down. Rev. Méd. Int. Síndr. Down 2015, 19, 36–42. [Google Scholar] [CrossRef] [Scilit]
- Ramírez, C.S. Análisis de dos métodos de evaluación de la huella plantar: índice de Hernández Corvo vs. Arch Index de Cavanagh y Rodgers. Fisioterapia 2017, 39, 209–215. [Google Scholar] [CrossRef] [Scilit]
- Alomar, K.; Aysel, H.I.; Cai, X. Data augmentation in classification and segmentation: A survey and new strategies. J. Imaging 2023, 9, 46. [Google Scholar] [CrossRef] [Scilit] [PubMed]
- Zoph, B.; Cubuk, E.D.; Ghiasi, G.; Lin, T.-Y.; Shlens, J.; Le, Q.V. Learning data augmentation strategies for object detection. In European Conference on Computer Vision; Springer: Cham, Switzerland, 2020; pp. 566–583. [Google Scholar] [CrossRef] [Scilit]
- Buslaev, A.; Iglovikov, V.I.; Khvedchenya, E.; Parinov, A.; Druzhinin, M.; Kalinin, A.A. Albumentations: Fast and flexible image augmentations. Information 2020, 11, 125. [Google Scholar] [CrossRef] [Scilit]
- Botchkarev, A. Performance metrics (error measures) in machine learning regression, forecasting and prognostics: Properties and typology. arXiv 2018, arXiv:1809.03006. [Google Scholar]
- Géron, A. Hands-on Machine Learning with Scikit-Learn, Keras, and TensorFlow; O’Reilly Media, Inc.: Newton, MA, USA, 2022. [Google Scholar]
- Milford, M.J.; Wyeth, G.F. Single Camera Vision-only SLAM on a Suburban Road Network. In Proceedings of the 2008 International Conference on Robotics and Automation, Pasadena, CA, USA, 19–23 May 2008; pp. 3684–3689. [Google Scholar]
- Masino, N.; Quintero-Rincón, A. Effect sizes as a statistical feature-selector-based learning to detect breast cancer. In Proceedings of the 2024 IEEE Biennial Congress of Argentina (ARGENCON), San Nicolas de los Arroyos, Argentina, 18–20 September 2024; pp. 1–7. [Google Scholar] [CrossRef] [Scilit]
- Raschka, S.; Liu, Y.H.; Mirjalili, V. Machine Learning with PyTorch and Scikit-Learn: Develop Machine Learning and Deep Learning Models with Python; Packt Publishing Ltd.: Birmingham, UK, 2022. [Google Scholar]
- Ayyadevara, V.K.; Reddy, Y. Modern Computer Vision with PyTorch: A Practical Roadmap from Deep Learning Fundamentals to Advanced Applications and Generative AI; Packt Publishing Ltd.: Birmingham, UK, 2024. [Google Scholar]
- Aruntammanak, W.; Aunhathaweesup, Y.; Wongseree, W.; Leelasantitham, A.; Kiattisin, S. Diagnose flat foot from foot print image based on neural network. In Proceedings of the 6th 2013 Biomedical Engineering International Conference, Amphur Muang, Thailand, 23–25 October 2013; pp. 1–5. [Google Scholar] [CrossRef] [Scilit]
- Iwakami, Y.; Anzai, E.; Nakajima, K.; Imaizumi, K.; Yamashita, K.; Okabe, M.; Onai, R. Proposal and Verification of a Foot Arch Classification Technique using Foot Pressure Distribution Images. IEEJ Trans. Electron. Inf. Syst. 2015, 135, 505–512. [Google Scholar] [CrossRef] [Scilit]
- Sawangphol, W.; Panphattarasap, P.; Praiwattana, P.; Kraisangka, J.; Noraset, T.; Prommin, D. Foot Arch Classification via ML-based Image Classification. Comput. Aided Des. Appl. 2022, 20, 600–613. [Google Scholar] [CrossRef] [Scilit]

Disclaimer/Publisher’s Note: The statements, opinions and data contained in all publications are solely those of the individual author(s) and contributor(s) and not of MDPI and/or the editor(s). MDPI and/or the editor(s) disclaim responsibility for any injury to people or property resulting from any ideas, methods, instructions or products referred to in the content. |
© 2026 by the authors. Licensee MDPI, Basel, Switzerland. This article is an open access article distributed under the terms and conditions of the Creative Commons Attribution (CC BY) license.