


Abstract
Complex thinking is increasingly relevant in international postgraduate education, yet limited evidence exists on how its components are internally articulated within multicultural graduate cohorts. This study examined the relational organization of complex thinking among 491 international master’s students enrolled at a graduate institution in Japan. A quantitative, cross-sectional design was implemented using the 25-item eComplexity instrument. An item-level regularized psychometric network was estimated to identify central and bridge nodes, node predictability, empirical communities, and exploratory structural differences across groups with sufficient sample sizes. The resulting network was predominantly positive, with prominent associations involving systemic and scientific items. Bootstrap difference tests did not support a clear ranking among the nodes with the highest strength values. Case-dropping bootstrap showed greater stability for bridge strength (CS = 0.50) than for node strength (CS = 0.30), although the relative ranking of individual nodes should be interpreted cautiously. Innovative thinking was distributed across the network rather than functioning as an autonomous component, suggesting that it was relationally linked to systemic, scientific, and critical processes. Exploratory comparisons showed no significant network differences by sex. For China and Nepal, statistical significance depended on the structural difference statistic, and no individual edge difference remained significant after correction for multiple comparisons. Differential item functioning and limited subgroup stability further restricted the interpretation of this comparison. Overall, the study extends previous factorial validation and score-based analyses by showing how psychometric network analysis can identify the components that structure and connect a multidimensional competency. These findings provide complementary evidence for competency assessment, curriculum design, and postgraduate research training in multicultural higher education contexts.
1. Introduction
Complex thinking has become increasingly relevant in higher education because universities are expected to prepare students to address problems marked by interdependence, uncertainty and multiple interacting factors. Morin [1] associated this form of thinking with the need to move beyond fragmented interpretations and to integrate diversity, context and reflection within the same cognitive process. In postgraduate education, this demand becomes especially important. Advanced training requires more than disciplinary expertise. It also involves the capacity to connect perspectives, structure problems, evaluate evidence and respond to loosely structured situations through informed judgment [2].
Recent empirical work has strengthened the study of complex thinking in higher education. The eComplexity instrument provided a structured basis for measuring the perceived achievement of the construct through four sub-competencies, namely systemic, scientific, critical and innovative thinking. Its validation showed adequate structural validity and internal consistency [3]. Later studies found that perceived complex thinking varies across educational and national contexts, suggesting that the construct is sensitive to the environments in which students are trained [4,5]. These advances are relevant, but they have mainly focused on factorial structure, aggregated scores or mean-level comparisons between groups.
Previous research has examined the relationships among the four eComplexity sub-competencies through latent-variable modeling [5]. More recently, a psychometric validation involving the same postgraduate cohort in Japan examined the factorial and hierarchical structure of the instrument and included network estimation [6]. The present study builds on that work by focusing specifically on the item-level relational organization of complex thinking, including node predictability, bridge functions, empirical community structure, and exploratory network comparisons. Although both studies use the same responses and share some analytical elements, they address different research questions. The contribution of the present analysis is therefore complementary rather than evidence derived from an independent sample.
The question addressed here is how the 25 eComplexity items relate to one another within this postgraduate cohort, beyond their contribution to overall or subscale scores. This requires examining which associations are most pronounced, which items connect the theoretical sub-competencies, and how closely the empirical communities resemble the instrument’s predefined dimensions. Network analysis offers a way to describe these conditional relationships without treating them as evidence of causal interactions [7].
This issue is particularly relevant in internationalized postgraduate education. Students in multicultural graduate cohorts share an institutional environment while bringing different educational trajectories, academic conventions, language backgrounds and cultural frames of interpretation. Research with international postgraduate students also indicates that language and culture shape academic adjustment, research training, and engagement with disciplinary practices [8]. From a measurement perspective, these differences require attention to construct, method, and item bias when interpreting results across cultural groups [9].
Differences in educational and linguistic background may affect how students interpret items involving evidence, judgment, integration, and problem solving [10,11]. The graduate institution in Japan examined in this study therefore provides a bounded context for analyzing the relational organization of complex thinking without assuming that the observed pattern represents Japanese postgraduate education as a whole.
For this reason, it is useful to shift the question from how much complex thinking a cohort reports to how that perceived competency is organized. This shift does not replace previous structural validation work. Rather, it allows the construct to be examined as a relational system in which components may play different structural roles. In the case of complex thinking, this approach is analytically appropriate because the construct is defined by the articulation among sub-competencies, not by the isolated presence of each domain. Examining the network structure of the instrument can therefore show which items are central, which items connect dimensions and whether the relational architecture varies across groups within a multicultural postgraduate setting.
Accordingly, this study examines complex thinking as a relational system in an international postgraduate cohort through an item-level network analysis of the eComplexity instrument. The analysis identifies central and bridge components, estimates node predictability, explores empirical communities and assesses exploratory structural variation across groups with sufficient sample size. In doing so, the paper contributes to applied research in higher education by showing how network analysis can complement factorial validation and mean-level comparison when examining multidimensional competencies in postgraduate education [3,12].
1.1. Complex Thinking as a Multidimensional Competency
Complex thinking has been described as a competency that integrates the cognitive operations needed to address open, uncertain and interconnected problems. It is not a single skill. It involves systemic understanding, scientific reasoning, critical judgment and the capacity to generate innovative responses. This multidimensional view has been especially useful in higher education because it connects knowledge, method, evaluation and creativity within the same learning process [2]. Silva and Iturra [13] also emphasize that complex thinking involves cognitive processes that allow individuals to interpret problems through relations, contexts and multiple levels of analysis.
The eComplexity instrument translated this conceptual proposal into an empirical structure composed of four sub-competencies, namely Systemic Thinking, Scientific Thinking, Critical Thinking and Innovative Thinking. Its original validation showed that the construct could be measured through a coherent factorial structure. Later studies extended this evidence by showing that perceived complex thinking varies across countries and educational settings, which suggests that the competency is sensitive to the contexts in which students learn and develop [4].
1.2. Measuring Complex Thinking Beyond Factorial Structure
The eComplexity instrument has previously shown adequate factorial structure, but this evidence does not fully describe how its individual indicators are associated within a particular cohort. This distinction is especially relevant in international postgraduate education, where students share an institutional environment while bringing different academic experiences and linguistic backgrounds. An item-level network analysis can therefore provide a complementary perspective on the relationships among indicators without replacing the existing validation evidence.
Psychometric network analysis offers a complementary way of studying item structure by estimating conditional associations among observed indicators. Epskamp and Fried [14] explain how regularized partial-correlation networks can be used to examine these relationships while accounting for the remaining variables in the model. However, estimation decisions require particular attention when working with ordinal responses. Isvoranu and Epskamp [15] show that the performance of network estimators depends on the characteristics of the data and the research questions being addressed. In the present study, this approach allows us to examine the local organization of the 25 eComplexity items without assuming that the observed associations represent causal interactions among cognitive processes.
Network and factor models should not be treated as competing explanations of item structure. Christensen and Golino [16] show that network and factor loadings can convey related information, although they support different interpretations. Community detection provides an additional perspective on the organization of indicators, but the resulting partitions may vary across samples. Christensen and Golino [17] demonstrate how bootstrap procedures can help evaluate the stability of dimensions identified through exploratory graph analysis. This consideration is particularly relevant when interpreting empirical communities that do not fully reproduce the theoretical structure of an instrument.
A relational approach can therefore complement previous structural validation. It can show which items are more influential, which items connect sub-competencies and whether the empirical organization of the instrument closely follows or only partially follows its theoretical structure. Wongvorachan et al. [18] make a similar point in their use of network psychometrics for educational survey validation, showing that this approach can reveal patterns that remain less visible in global model-fit indices alone.
In internationalized postgraduate education, this perspective is particularly useful because students share the same institutional setting while differing in prior training, language background, academic conventions and cultural response patterns. Chambon et al. [19] note that empirical network studies require careful attention to sample characteristics and study design because network structures are interpreted within specific contexts. For multicultural postgraduate cohorts, this means that the internal architecture of a competency may be as educationally informative as its overall score.
The present study addresses this issue by examining whether complex thinking in a multicultural postgraduate cohort in Japan is organized around the relations proposed by the eComplexity framework and by identifying the components that occupy the most relevant structural roles. This framing connects psychometric evidence with an applied concern in higher education, namely how multidimensional competencies are organized within diverse postgraduate cohorts and how their structurally relevant components may inform assessment, curriculum design and research training.
2. Materials and Methods
2.1. Design
The study followed a quantitative, non-experimental and cross-sectional design. Its analytical logic was relational rather than purely variable-centered. The purpose was not to estimate prevalence or to describe the cohort as a population, but to examine how a multidimensional educational construct was internally organized through the direct associations among its indicators. This approach was appropriate because the study focused on the structure of perceived complex thinking within an internationalized postgraduate learning environment.
2.2. Participants and Context
The sample included 491 international master’s students enrolled full-time at a graduate institution in Japan. The cohort represented several nationalities and academic specializations within the master’s program. The most common specializations were Enterprise Resource Planning (n = 122), IT Manga and Anime (n = 87), Artificial Intelligence (n = 84), Global Entrepreneurship (n = 51), and IT Tourism (n = 45). The remaining students were enrolled in Web Systems Development (n = 39), Data Science (n = 37), Network Administration (n = 17), IT Entrepreneurship (n = 5), and Game Development (n = 4). Most participants were in their second semester (n = 465, 94.7%), while 16 (3.3%) were in their first semester and five each (1.0%) were in their third or fourth semesters.
Of the participants, 352 were men and 139 were women. The largest national groups were China, with 285 students, and Nepal, with 89 students. The analysis focused on this cohort because it provided a shared postgraduate environment with sufficient internal heterogeneity to examine the relational organization of complex thinking in a multicultural setting.
Data were collected during the fall 2025 academic term. Approximately 640 enrolled students were invited to participate through their instructors, using institutional enrollment records. Of these, 536 began the questionnaire. Sixteen incomplete questionnaires and 29 additional records were excluded during data screening, resulting in 491 valid responses and an approximate usable-response rate of 76.7%. Age was not systematically recorded in the original dataset. The present study is a secondary analysis of the same 491 responses previously examined in the psychometric validation of eComplexity in international postgraduate education [6]. No additional participants were recruited, and no new data were collected for the present analysis.
2.3. Instrument
Data were collected using eComplexity, an instrument designed to assess perceived complex thinking in higher education. The scale contains 25 items distributed across four sub-competencies. Systemic Thinking includes p1 to p6, Scientific Thinking includes p7 to p13, Critical Thinking includes p14 to p19 and Innovative Thinking includes p20 to p25. Responses were recorded on a five-point Likert-type scale ranging from 1, “strongly disagree”, to 5, “strongly agree”. The original validation reported adequate model fit and internal consistency, which made the instrument suitable for a complementary relational analysis [3]. The questionnaire was administered in three language versions without modifying its internal structure. Participants from Japan (n = 8) completed the Japanese version, those from China (n = 285) completed the Chinese version, and participants from all other countries (n = 198), including Nepal (n = 89), completed the English version. According to the study documentation, linguistic verification procedures were used to preserve conceptual equivalence in the multicultural cohort.
Internal consistency was examined in the present sample using Cronbach’s alpha and McDonald’s omega. Omega total was estimated from a single-factor congeneric model fitted to the Pearson item correlation matrix of each sub-competency. The results showed adequate internal consistency for Systemic Thinking (α = 0.848, ω = 0.854), Scientific Thinking (α = 0.881, ω = 0.882), Critical Thinking (α = 0.801, ω = 0.801), and Innovative Thinking (α = 0.850, ω = 0.851). These estimates provide sample-specific reliability evidence beyond the original validation of the instrument.
2.4. Data Analysis Strategy
The analysis focused on an item-level psychometric network estimated from the 25 items p1 to p25. The total complex thinking score was not included because it is a linear aggregate of the same items and would have introduced part–whole redundancy. For the bridge analyses, the original theoretical partition of the instrument was maintained following Vázquez-Parra et al. [3]. This partition included Systemic Thinking, Scientific Thinking, Critical Thinking and Innovative Thinking.
The analytic dataset was examined for missing responses, values outside the expected response range, and invariant response patterns across the 25 items. All 491 retained participants had complete item responses within the expected range, so no imputation was required. In total, 100 participants (20.4%) selected the same response category across all items. Since the available dataset did not include response times or independent attention-check indicators, these patterns were not considered sufficient evidence of careless responding and were retained in the primary analysis. To examine their potential influence, the network was re-estimated after temporarily excluding these records as a sensitivity analysis.
Because bridge centrality depends on the definition of communities, we also calculated bridge strength using the empirical community partition as a sensitivity analysis. Communities were identified through weighted Louvain modularity optimization applied to the positive edges of the estimated network, with a resolution parameter of 1. The algorithm was run with 200 random initializations, retaining the solution with the highest modularity. Community stability was subsequently examined through 400 nonparametric bootstrap resamples. For each resample, the network was re-estimated using the original regularization parameter, and community detection was repeated with 20 random initializations. Stability was evaluated through the number of communities recovered and the adjusted Rand index, comparing each bootstrap partition with the original empirical solution.
Because the items were ordinal and the observed distributions were non-normal, a nonparanormal transformation was applied before network estimation. For each observation x_ij on item j, the average rank r_ij was calculated and the transformed score was obtained as
where Φ(−1) is the inverse cumulative normal function and nis the sample size. This procedure preserves rank order while stabilizing marginal distributions for partial-correlation network estimation. Because estimator performance may vary according to the treatment of ordinal data, this decision was also examined through the polychoric sensitivity analysis described below [15].
z_ij = Φ (−1) (r_ij/(n + 1))
Given the five response categories and the presence of tied values, we also examined whether the results were sensitive to the treatment of ordinal responses. For this purpose, we compared the original estimation with an alternative based on polychoric correlations. This allowed us to assess whether the main relational patterns were maintained under a different representation of the associations among items.
The network was estimated using a regularized Gaussian Graphical Model with Graphical Lasso. Because edge estimates and centrality measures may be affected by sampling variation, their accuracy and stability should be examined through bootstrap procedures [20].
The regularization parameter was selected through five-fold cross-validation. As a sensitivity check, the network was re-estimated using graphical lasso with the Extended Bayesian Information Criterion (EBIC), setting γ = 0.5. The regularization parameter was selected from a sequence of 100 candidate values. We also estimated an alternative network using a polychoric correlation matrix derived from the original ordinal responses, with EBIC-based selection over 65 candidate values. Both analyses were conducted with the same 491 participants and 25 items. Their results were compared with the primary network in terms of retained edges, node strength, bridge strength, and the strongest item-level associations. The optimization problem was expressed as
where S is the covariance matrix of the transformed data, Θ is the precision matrix and λ is the regularization parameter. The resulting edge weights were expressed as regularized partial correlations
Each edge represented the direct association between two items after adjusting for all remaining items in the network. This specification follows the regularized partial-correlation network framework described by Epskamp and Fried [14]. The complete regularized partial-correlation matrix is provided in Supplementary Table S1, while the correlation matrix used as input for network estimation is presented in Supplementary Table S2.
To study the internal organization of the network, strength and expected influence were estimated for each node. Strength for node i was defined as
where w_ij is the edge weight between nodes i and j. Bridge strength was also calculated across the four theoretical communities
where Cc (i) denotes the set of nodes outside the theoretical community of node i. Bridge centrality was used to distinguish nodes that connect predefined communities from nodes that are merely central within the complete network [21]. This index made it possible to identify items that connected different sub-competencies rather than only clustering within their own domain. Adu and Medvedev [22] describe this as one of the main advantages of network analysis for assessment, while Wu et al. [23] show its value for comparing how constructs are organized across groups.
Node predictability was estimated through the coefficient of determination
This coefficient represents the proportion of variance in each node explained by the rest of the network. Predictability provides an absolute node-level estimate of how much variance is accounted for by neighboring nodes, thereby complementing relative centrality indices [24]. Precision was assessed through nonparametric bootstraps with 500 resamples. Centrality stability was examined using case-drop bootstrap with 200 resamples, and correlation stability coefficients were reported. This level of methodological specification is consistent with current recommendations for transparent reporting of cross-sectional network analyses [25].
To assess whether the observed differences in node centrality were distinguishable from sampling variation, we conducted nonparametric bootstrap difference tests using 1000 resamples. The nonparanormal transformation and network estimation were repeated for each resample, keeping the regularization parameter fixed at the value selected for the original network (λ = 0.0448). Pairwise differences in strength and bridge strength were examined among the ten nodes with the highest observed values for each measure. Differences were evaluated using 95% percentile bootstrap confidence intervals, with intervals including zero interpreted as insufficient evidence of a distinguishable difference.
These procedures follow recent guidance on the design and reporting of empirical network studies [7,19]. A second network was estimated at the dimension level using the mean score of each sub-competency per student. This network was descriptive and summarized how the four dimensions were conditionally related.
Given the use of different language versions, an exploratory differential item functioning (DIF) analysis was conducted before interpreting the China–Nepal network comparison. Ordinal logistic regression models were estimated for 25 items, using the standardized sum of the remaining items within each theoretical sub-competency as the matching variable. Uniform DIF was assessed through the group indicator, while nonuniform DIF was examined through its interaction with the matching score. Likelihood-ratio tests were used to compare the models, including an omnibus test of both effects. The Benjamini–Hochberg procedure was applied to control the false discovery rate across the 25 items within each family of tests. This analysis was intended as an exploratory assessment of item comparability rather than a comprehensive test of measurement invariance.
An exploratory network comparison was conducted for selected subgroups, with network stability evaluated separately for the smaller Nepalese subgroup. Two pairwise contrasts were examined, men versus women and students from China versus Nepal. Networks were not estimated by semester because the distribution across academic stages was highly unbalanced, which would have made subgroup-specific networks unstable and difficult to interpret.
The group comparisons were re-estimated using a custom permutation procedure rather than the standard Network Comparison Test implementation. The regularization parameter selected for the full-sample network (λ = 0.0448) was held constant across both subgroup networks and all permutation samples. This common value was used to maintain a consistent estimation specification when comparing groups with unequal sample sizes. The nonparanormal transformation was recalculated within each group before estimating its network.
For each pair of groups, global strength and structural differences were computed. The global strength of a network G was defined as the sum of the absolute values of all unique edge weights
where w_ij denotes the weight of the edge connecting nodes i and j. The difference in global strength between two networks, G1 and G2, was calculated as
ΔGS = ∣GS(G1) − GS(G2)∣
Structural differences were first assessed through a permutation-based statistic that summarizes the squared differences across all unique edges. For networks with adjacency matrices W1 and W2, the statistic was calculated as the square root of the sum of squared edge-weight differences over the upper triangle of the matrices. This differs from the maximum edge-difference statistic used in the conventional Network Comparison Test [26]. To examine the sensitivity of the comparison to the choice of statistics, we additionally calculated the largest absolute edge-weight difference between the two networks. Statistical significance was evaluated using 1000 permutations of group membership, with the networks re-estimated after each permutation. Individual edge differences were also assessed against their permutation distributions, and the Benjamini–Hochberg procedure was applied across the 300 possible edges to control the false discovery rate [26].
Given the smaller sample available for Nepal, we also assessed the stability of its estimated network. A case-dropping bootstrap procedure was conducted using 300 resamples at each proportion of cases removed, ranging from 10% to 70%. The correlation between the original and re-estimated node strength and bridge strength values was examined, using 0.70 as the reference correlation and a 95% stability criterion. We additionally performed 500 nonparametric bootstrap resamples to examine variability in edge estimation. The original regularization parameter was held constant throughout these procedures.
This procedure made it possible to examine whether groups differed not only in overall network connectivity, but also in the configuration of relations among items. In terms of overall model specification, the final network retained 185 of the 300 possible edges, with a density of 61.7% and a selected regularization parameter of λ = 0.0448, as summarized in Table 1.
Table 1.
Estimation and robustness specifications of the network.
The psychometric analyses and sensitivity checks were conducted in Python 3.13.5 using NumPy 2.3.5, SciPy 1.17.0, scikit-learn 1.8.0, statsmodels 0.14.6, and Network X 3.6.1.
3. Results
Descriptive statistics for the 25 eComplexity items are presented in Table 2. Item means ranged from 3.615 to 4.061, with standard deviations between 0.629 and 0.816. All items showed negative skewness, consistent with the predominance of responses in the upper categories of the scale. The observed distributions provide additional context for interpreting the self-reported competency scores and the ordinal nature of the data.
Table 2.
Item-level descriptive statistics.
3.1. Global Structure of the Item Network
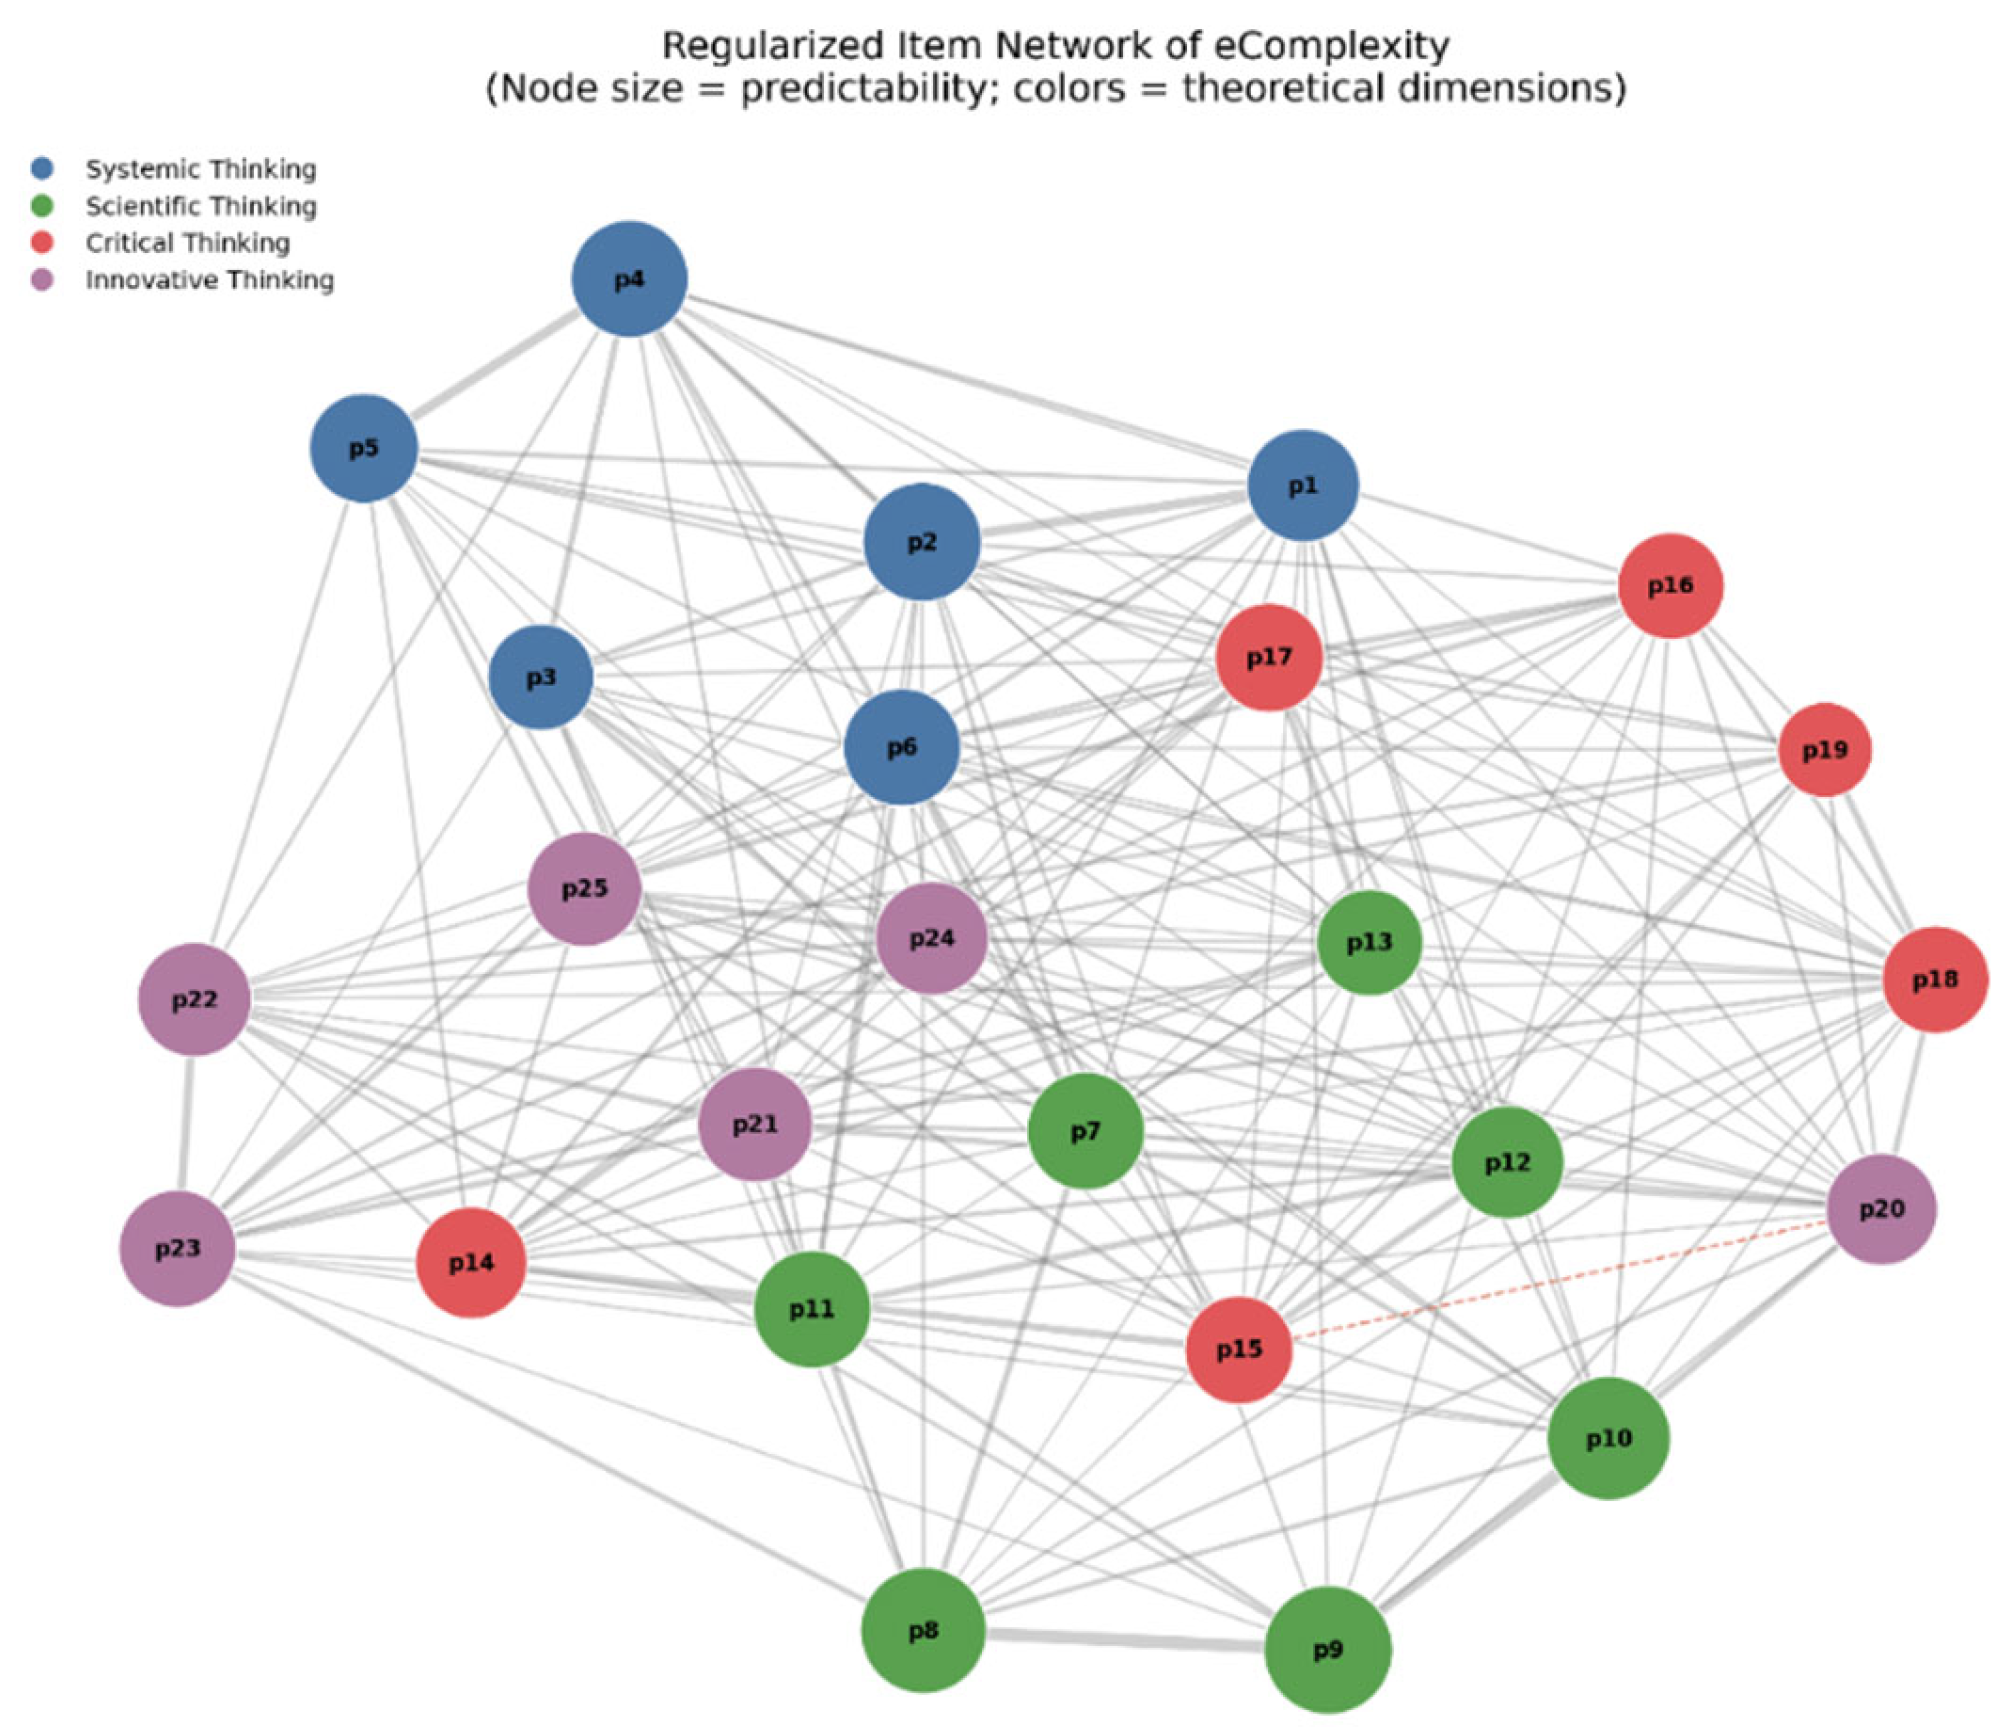
The regularized network retained 185 of the 300 possible edges, corresponding to a density of 61.7%. The regularization parameter selected by cross-validation was λ = 0.0448. Of the 185 estimated edges, 184 were positive and only one was negative with negligible magnitude (p15–p20 = −0.0029). This indicates that the estimated network was characterized almost entirely by positive conditional associations, although this pattern does not establish that the items operate as mutually reinforcing processes or exclude the influence of a common underlying factor (Figure 1).
Figure 1.
Regularized item-level network of eComplexity. Node colors represent the four theoretical sub-competencies, while node size reflects predictability (R2). Edge width represents the absolute magnitude of regularized partial correlations. Positive associations are shown in gray, and the single negative association of negligible magnitude is represented by a dashed red line.
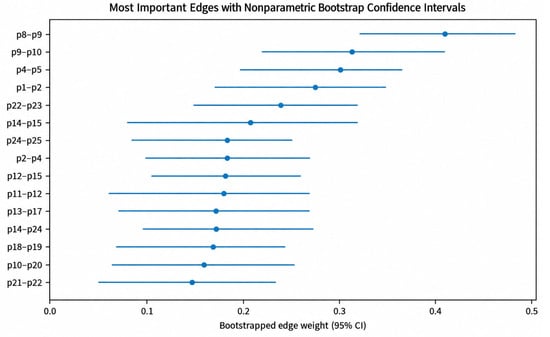
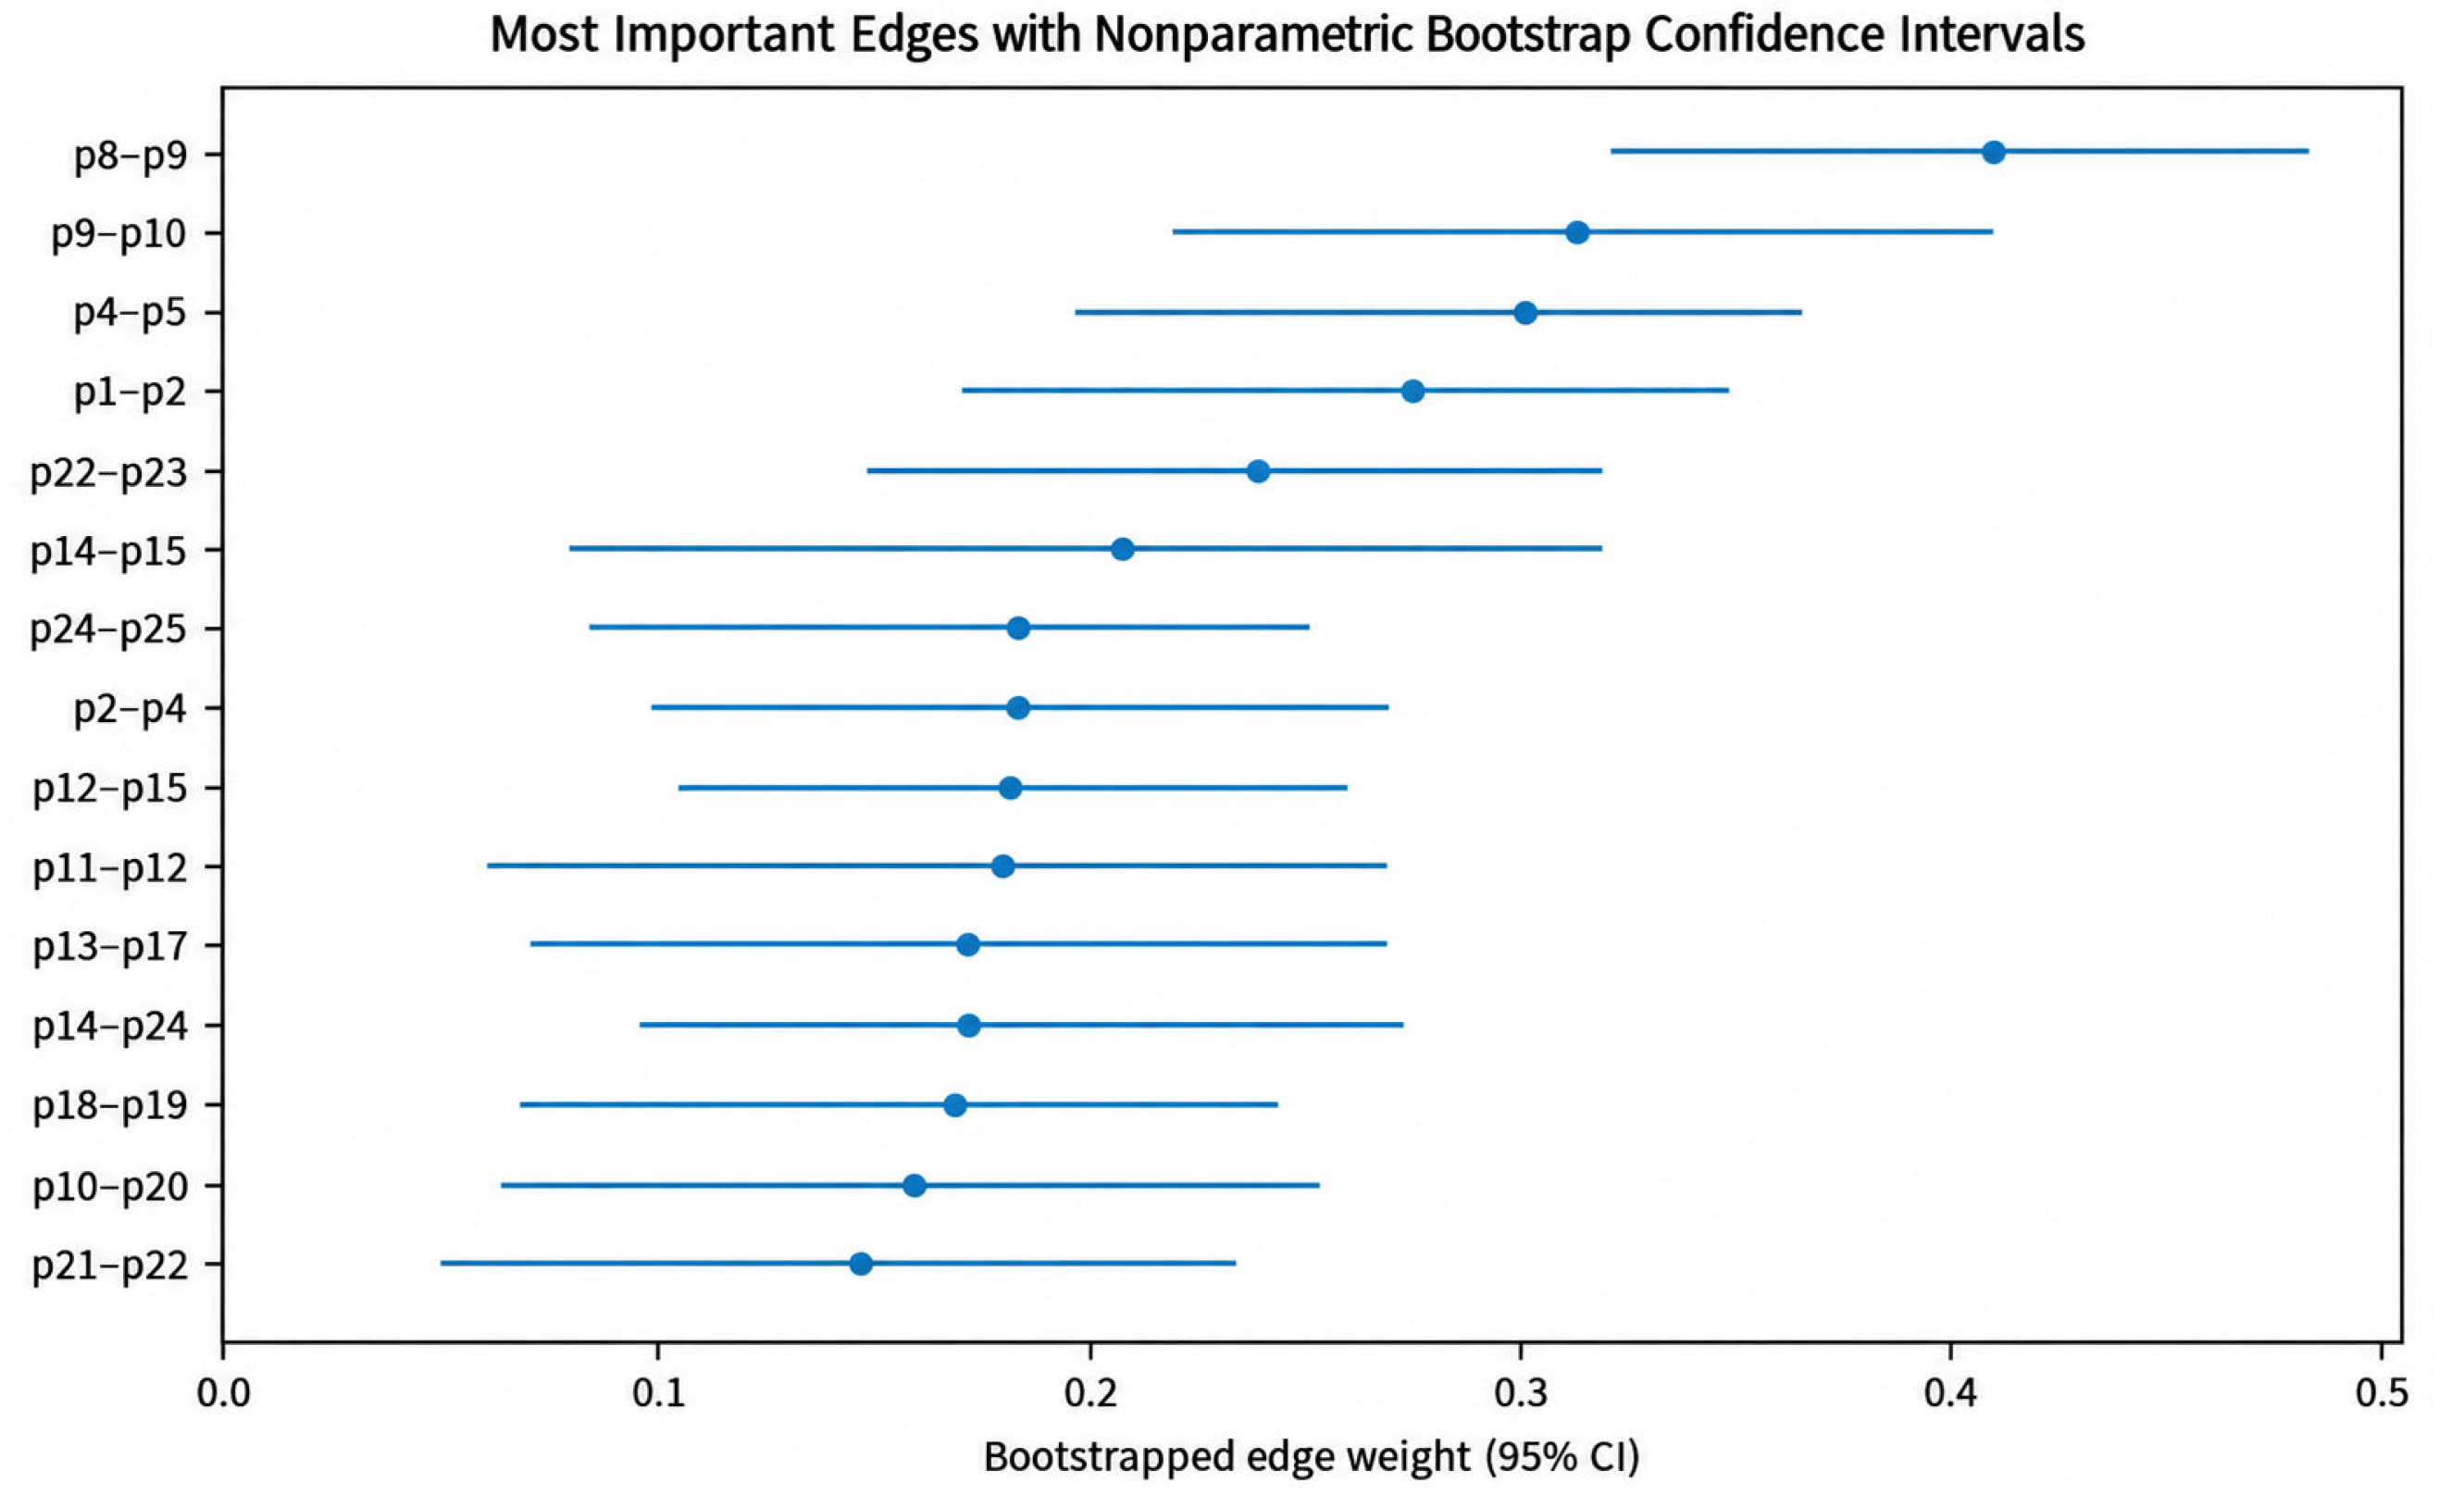
The strongest edges were concentrated within the same sub-competencies. The five largest associations were p8–p9 (w = 0.4138, 95% CI [0.3178, 0.4868]), p9–p10 (w = 0.3108, 95% CI [0.2119, 0.4094]), p4–p5 (w = 0.3002, 95% CI [0.1848, 0.3672]), p1–p2 (w = 0.2717, 95% CI [0.1613, 0.3472]), and p22–p23 (w = 0.2326, 95% CI [0.1429, 0.3158]). All of these edges showed a bootstrap non-zero rate of 1.00 and sign consistency of 1.00, indicating high robustness (Table 3).
Table 3.
Strongest edges in the regularized network.
These associations were concentrated around items related to research structure, article organization and question formulation. In this cohort, the densest local part of the network therefore involved the organization of academic work through methodological and systemic criteria. This pattern should be interpreted as a characteristic of the observed sample rather than as evidence of a general feature of Japanese postgraduate education. Within this cohort, several of the strongest observed item-level associations concerned research structuring and evidence-related operations. However, these patterns do not establish that these components were statistically more central than innovative thinking.
3.2. Central Nodes and Predictability
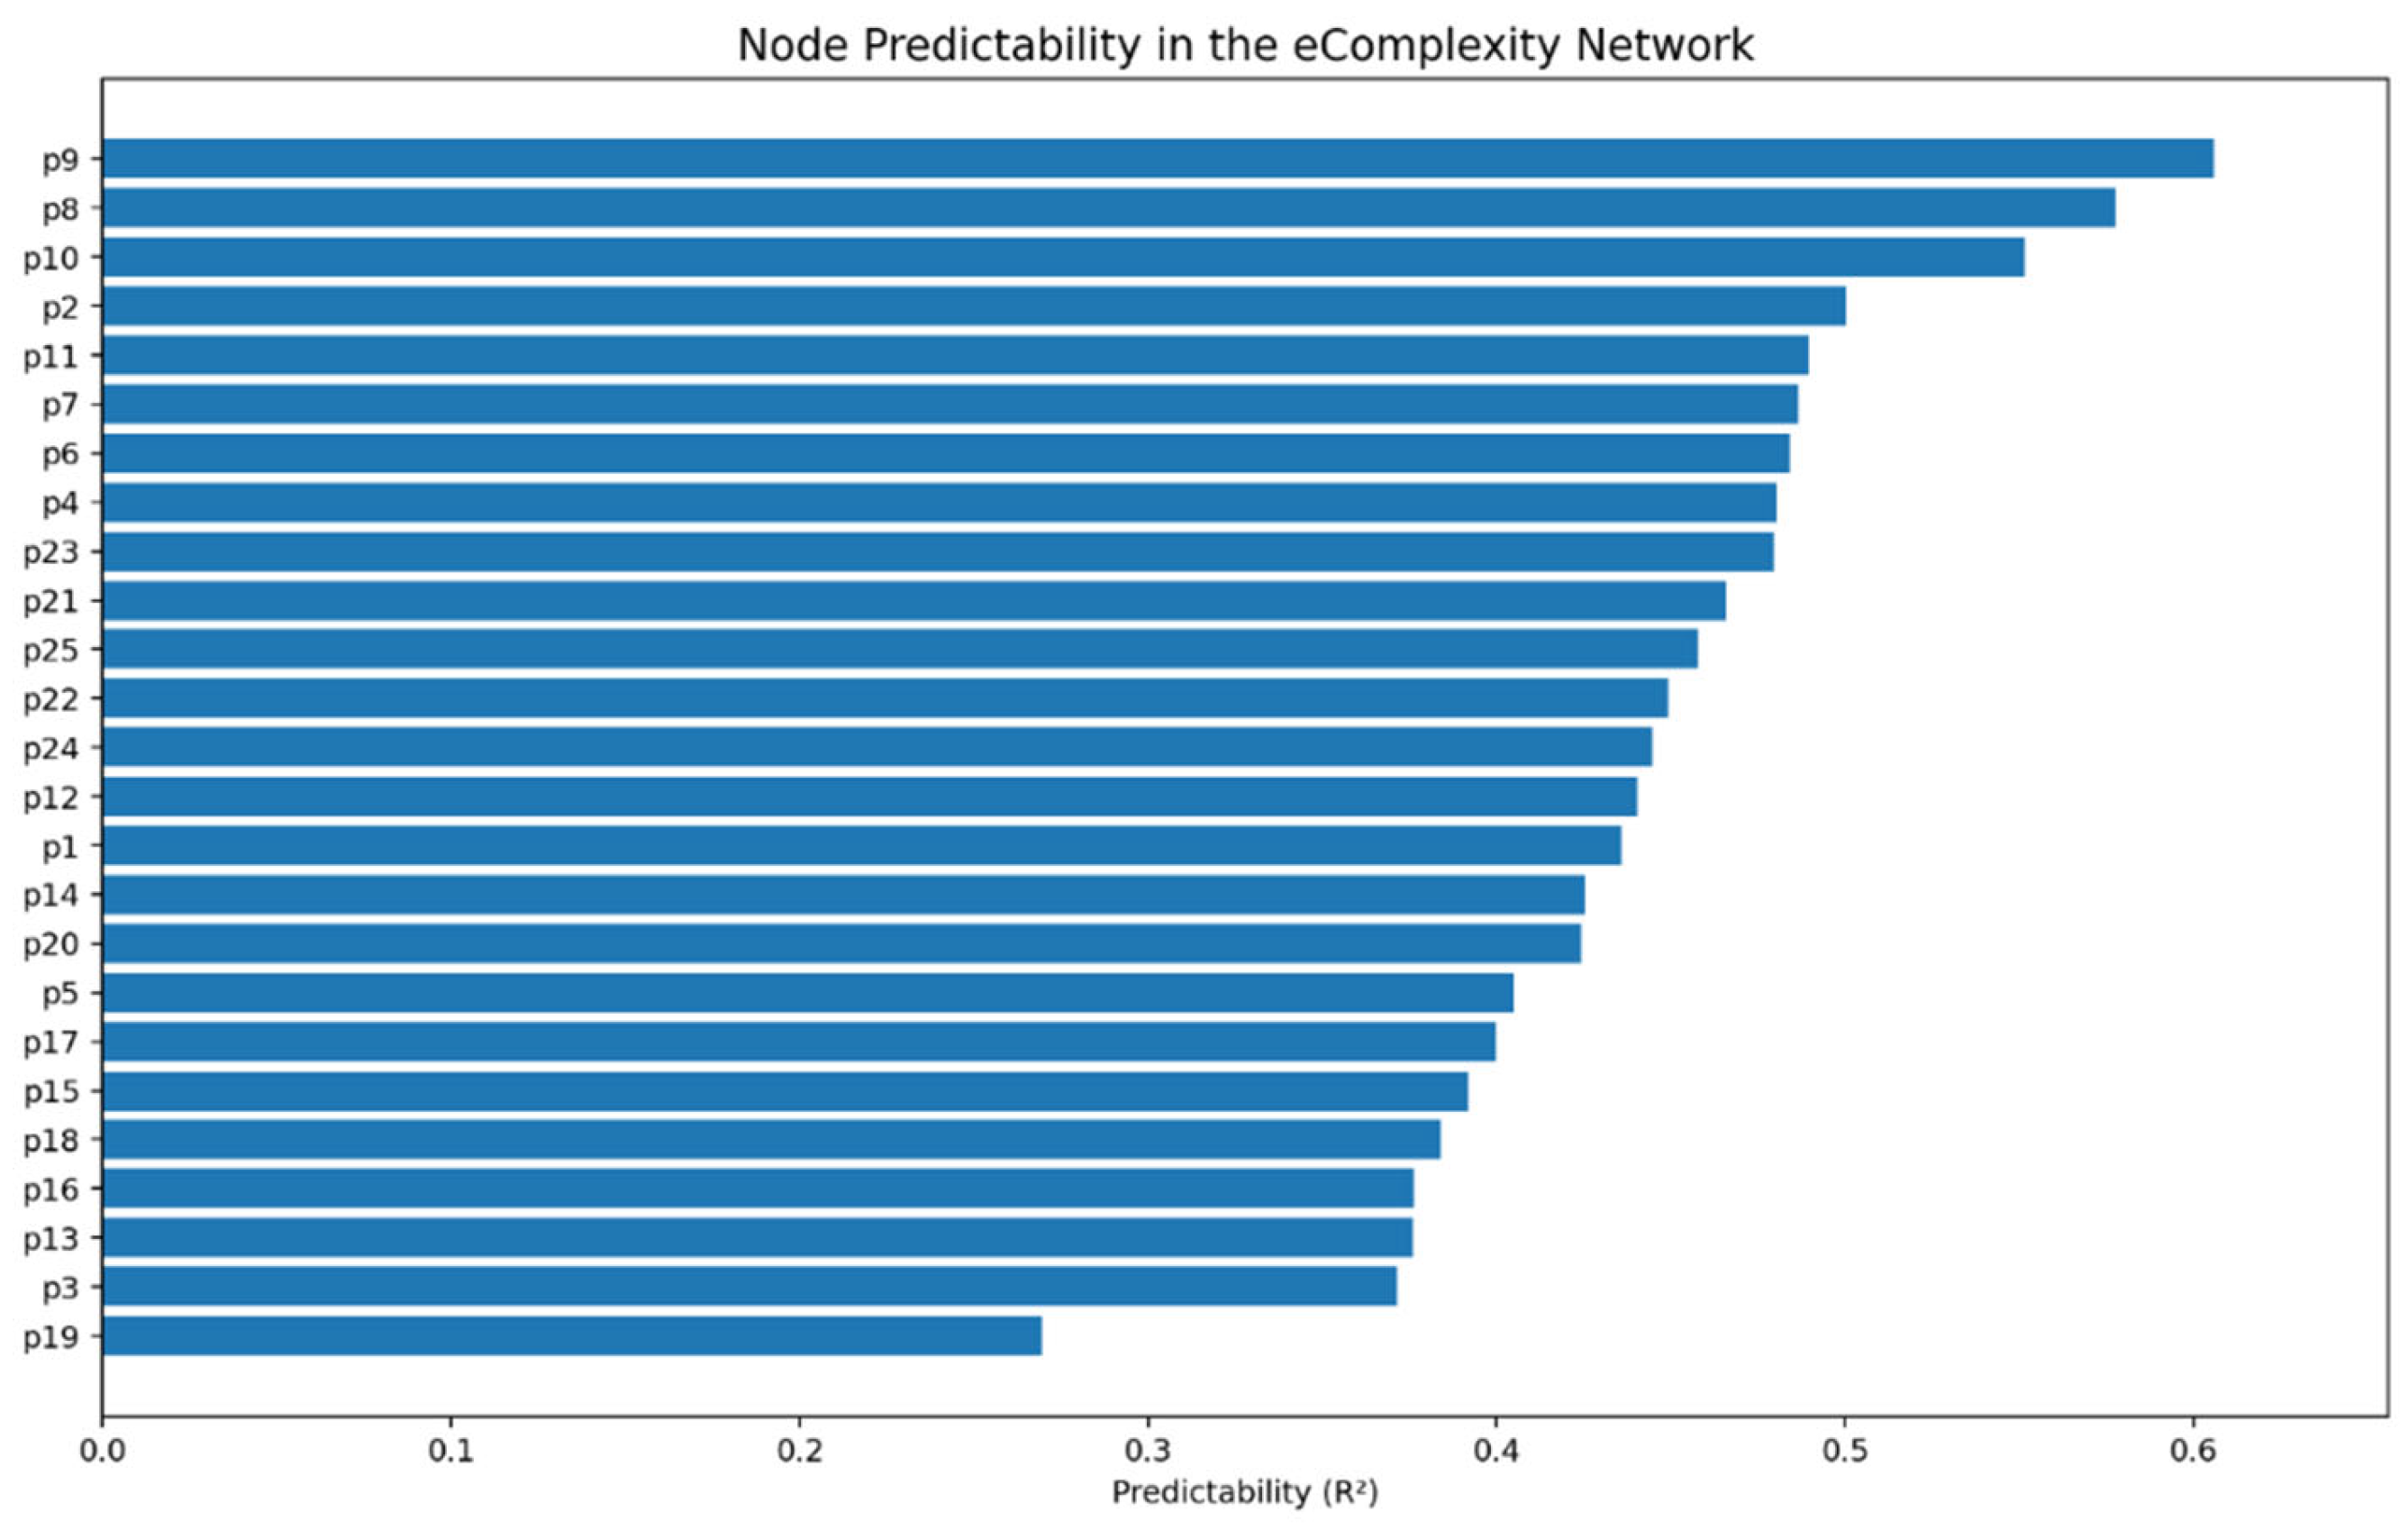
The nodes with highest strength were p9 (1.0538), p2 (1.0517), p10 (1.0501), p6 (1.0478), p8 (1.0128), p25 (1.0095), p7 (1.0074), p4 (1.0073), p21 (1.0071), and p12 (0.9873). The average predictability of the network was R2 = 0.4469. The highest predictability values were found for p9 (0.6058), p8 (0.5774), p10 (0.5515), p2 (0.5004), and p11 (0.4895) (Figure 2 and Table 4).
Figure 2.
Node predictability (R2).
Table 4.
Nodes with highest strength, bridge strength, and predictability.
The nodes with the largest observed strength values included indicators from Scientific Thinking, Systemic Thinking, and Innovative Thinking. However, these values were relatively close, and their descriptive ordering should not be interpreted as evidence that particular nodes or dimensions occupied statistically dominant positions within the network. The average predictability of 44.69% can be interpreted as moderate and informative: a substantial proportion of item variance was explained by neighboring nodes, but not to the point of suggesting redundancy among indicators [22].
3.3. Bridge Nodes Between Sub-Competencies
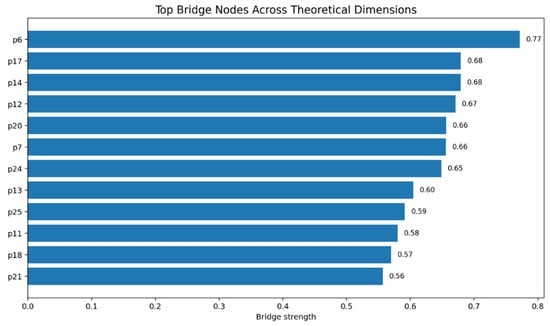
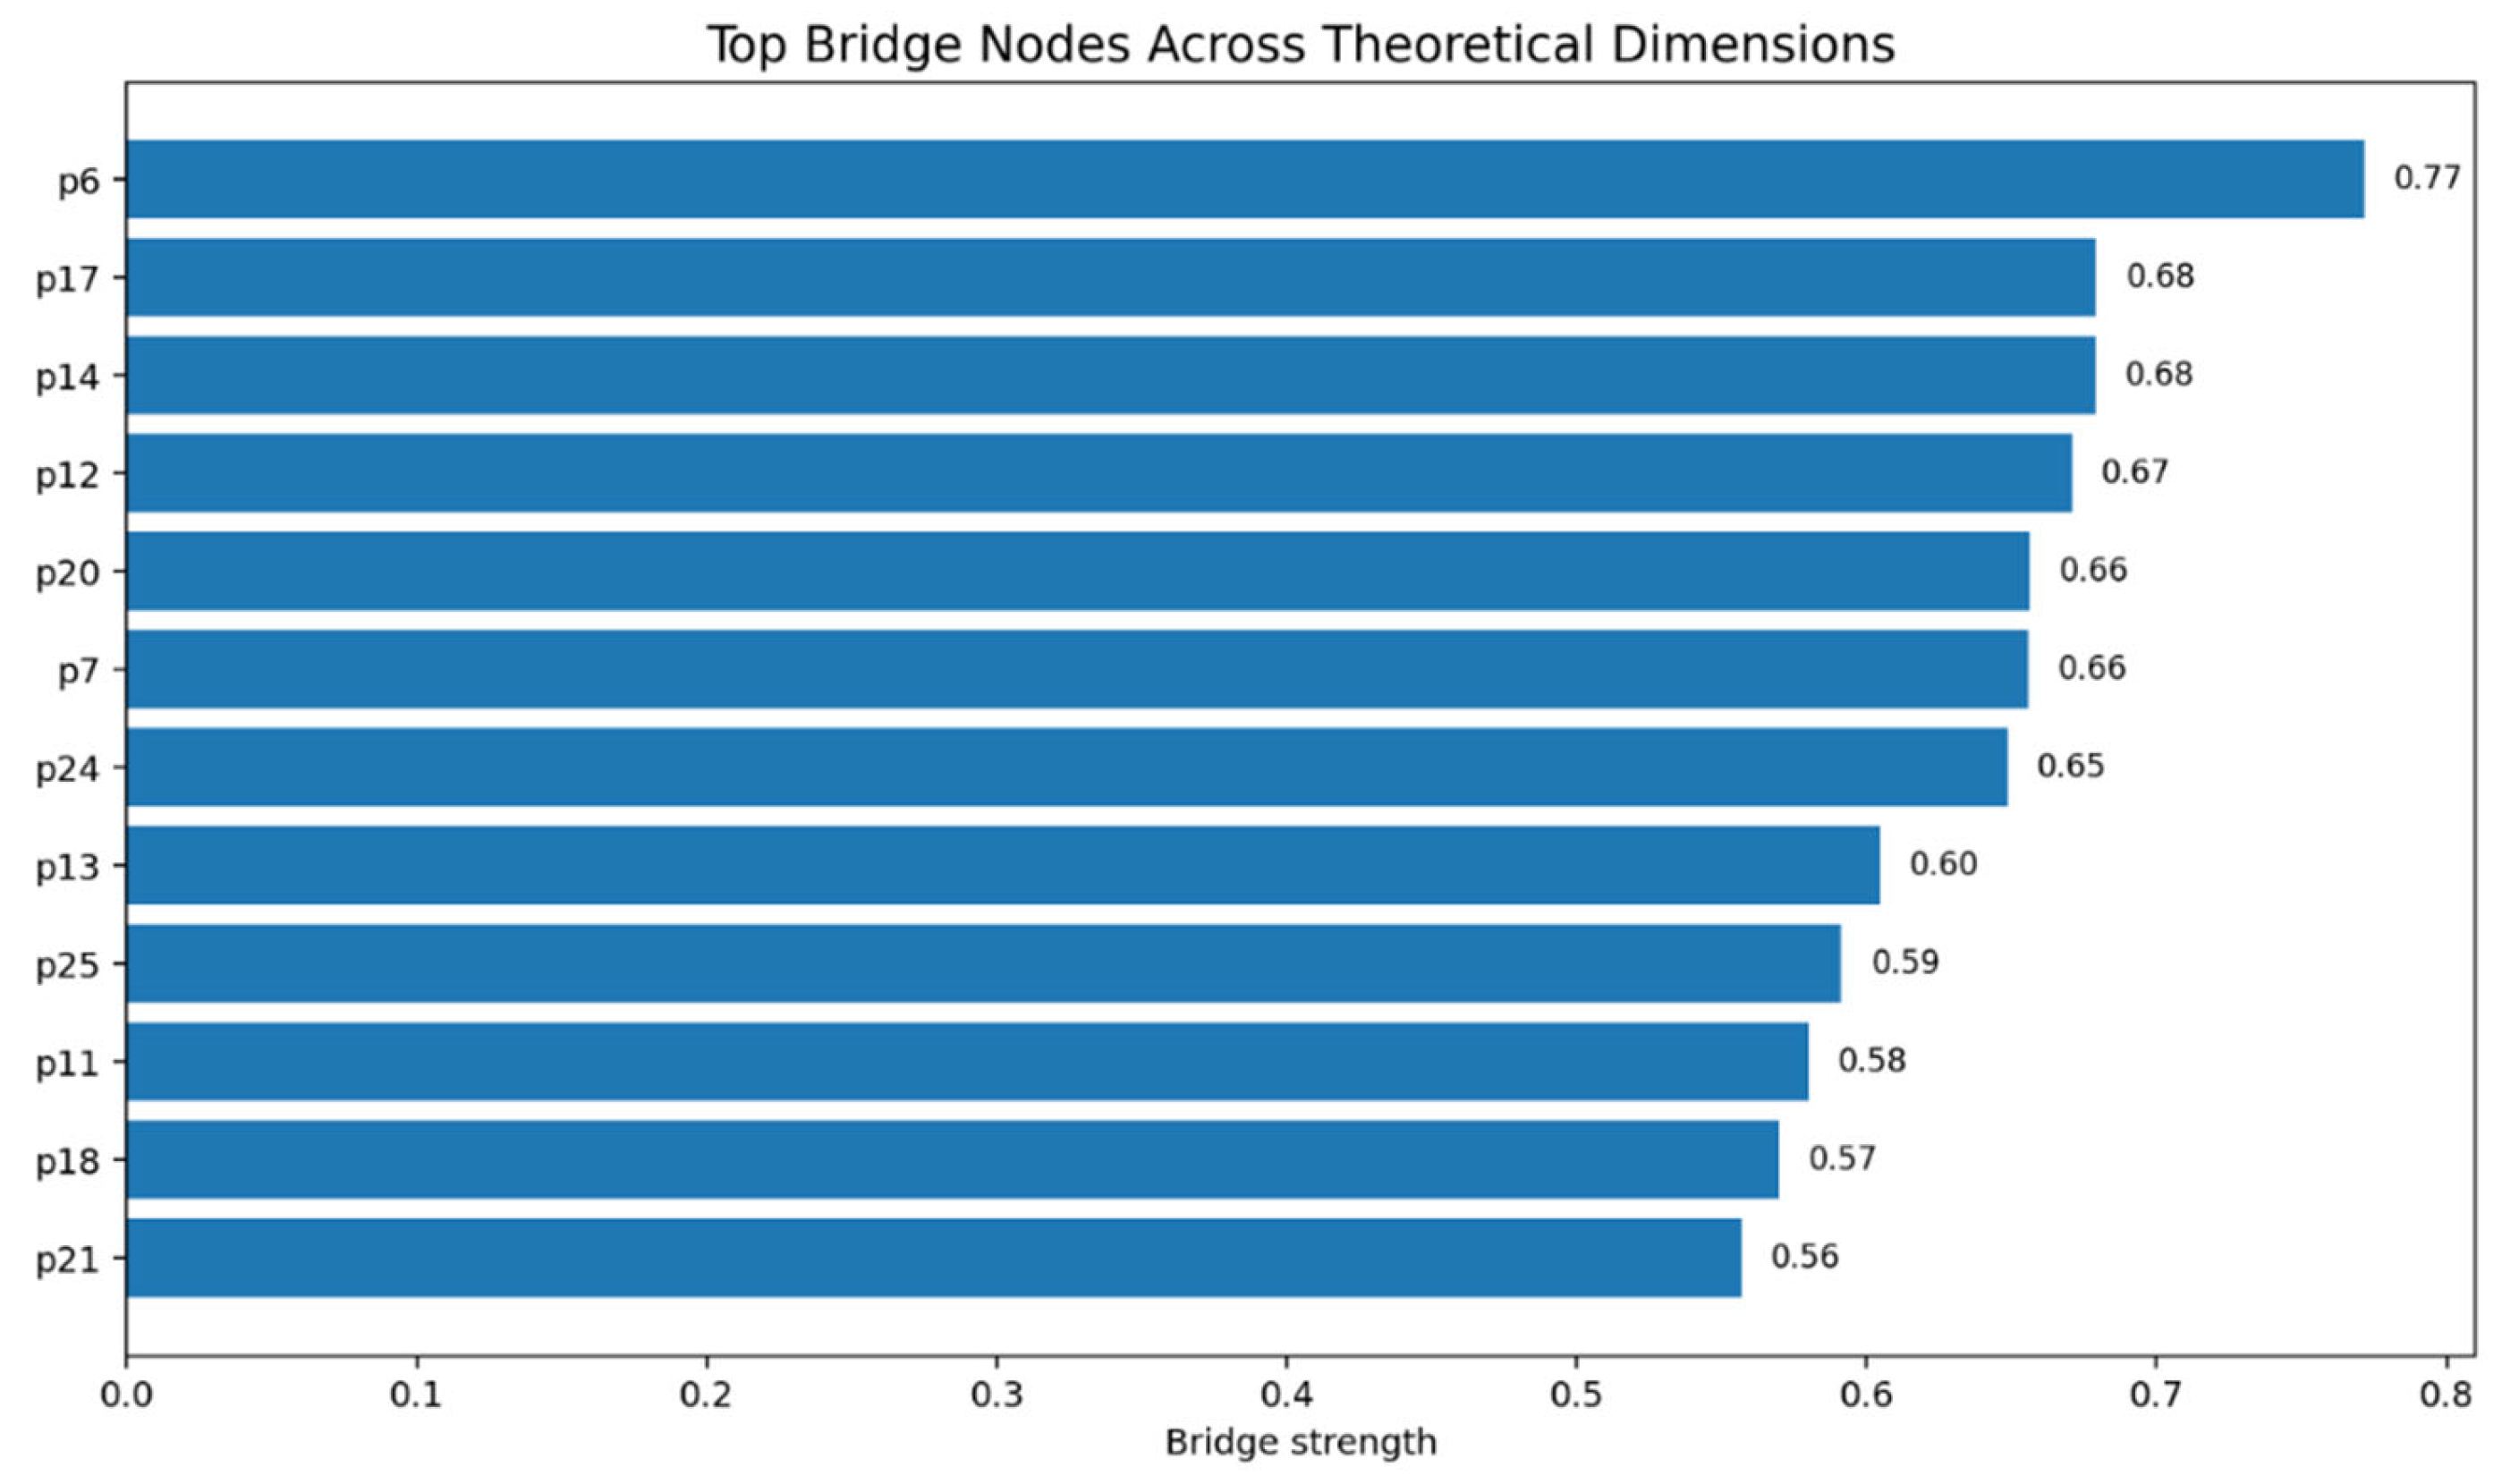
The nodes with highest bridge strength were p6 (0.7715), p17 (0.6792), p14 (0.6791), p12 (0.6708), p20 (0.6563), p7 (0.6558), p24 (0.6484), p13 (0.6047), p25 (0.5913), and p11 (0.5800) (Figure 3 and Table 5).
Figure 3.
Bridge centrality by theoretical dimension.
Table 5.
Nodes with highest bridge strength.
The main point here is that bridge nodes were not simply the most connected nodes. They were the indicators that linked different sub-competencies. In this sample, items related to problem definition, evidence assessment, and solution formulation showed connections beyond their assigned sub-competencies. These cross-domain associations describe how responses were linked in the estimated network, but they do not establish that particular items act as mechanisms integrating cognitive processes [22,23].
The sensitivity analysis showed that bridge-strength estimates depended considerably on the community partition. When the empirical communities were used, five of the ten leading bridge nodes were also among the ten identified using the theoretical sub-competencies. The correlation between both sets of bridge-strength values was 0.379. Some items, including p6 and p20, retained relatively prominent bridging roles, whereas others changed substantially in their relative positions. These findings indicate that bridge centrality should be interpreted in relation to the community definition rather than as an intrinsic property of individual items.
3.4. Edge Precision and Centrality Stability
The strongest edges retained positive and relatively narrow bootstrap confidence intervals. This was especially clear for p8–p9, p9–p10, p4–p5, p1–p2, and p22–p23, which remained stable across bootstrap resamples (Figure 4).
Figure 4.
Bootstrap confidence intervals for the strongest edges.
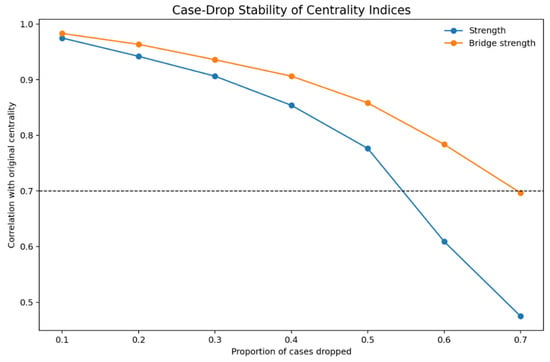
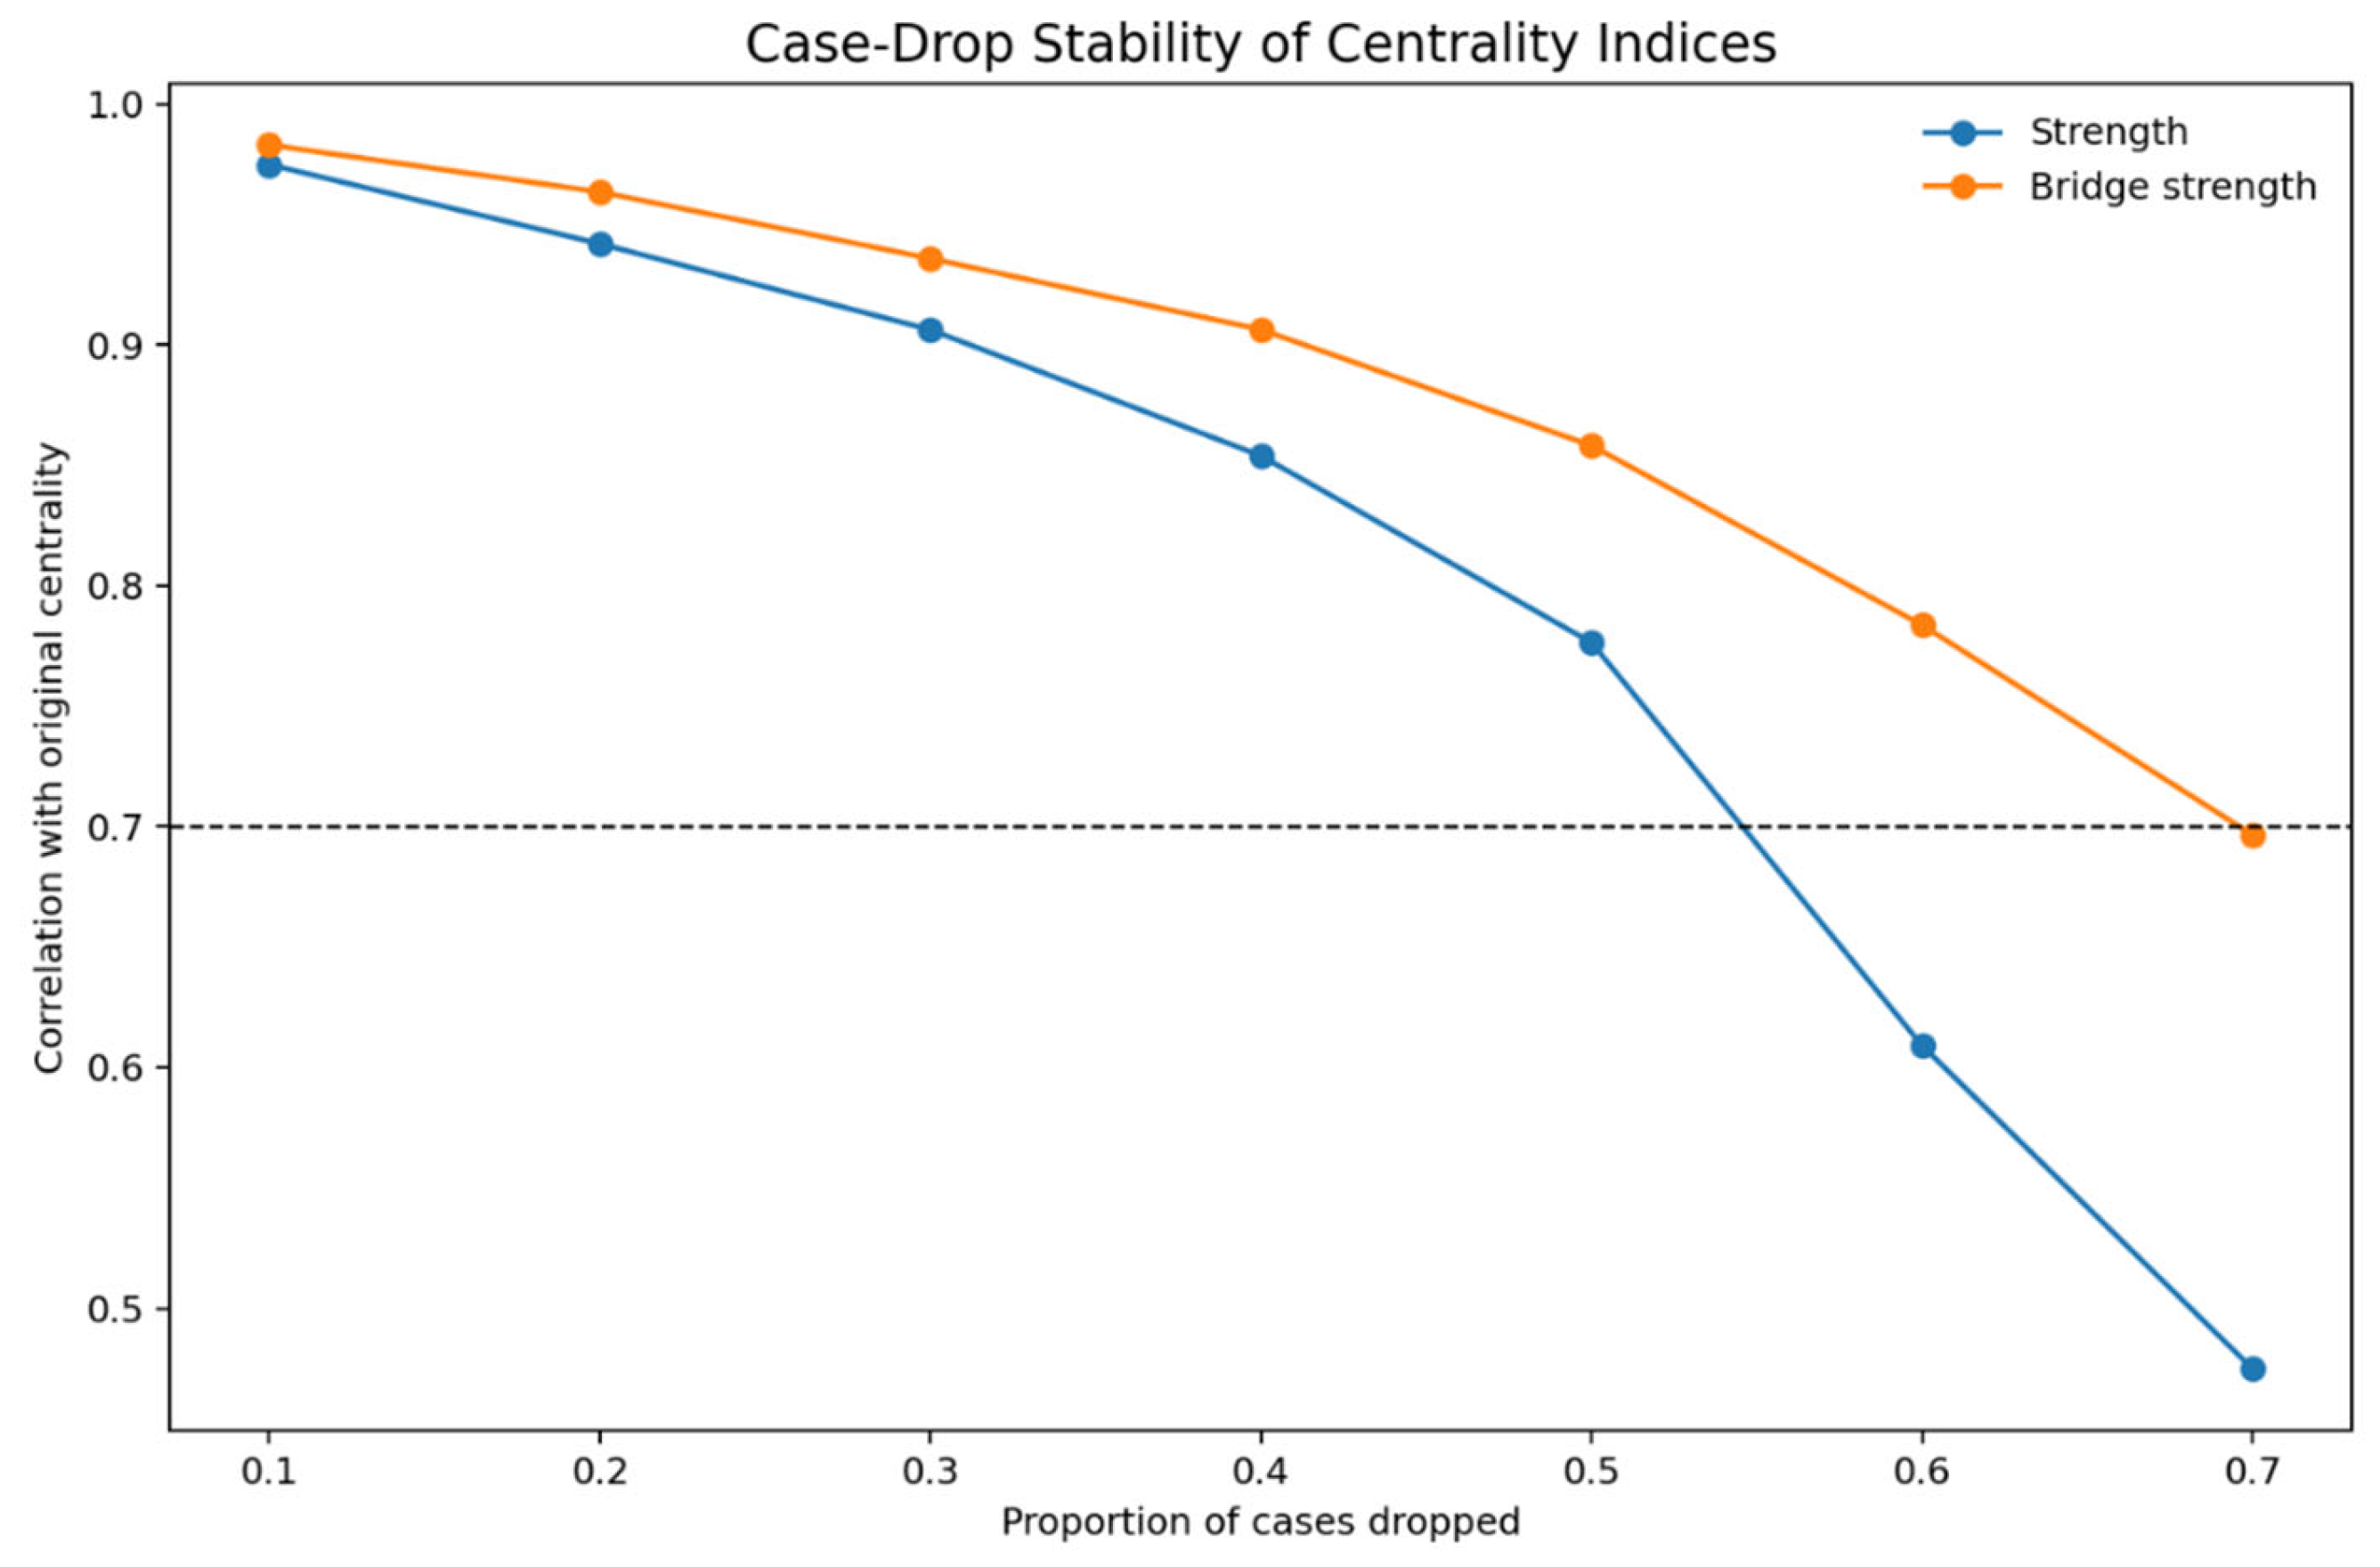
The correlation stability coefficient was 0.30 for strength and 0.50 for bridge strength. Although the former exceeds the minimum recommended threshold of 0.25, it remains below the preferable value of 0.50, limiting confidence in fine-grained rankings of node strength. Bridge strength showed greater stability, providing a firmer basis for examining connections across theoretical sub-competencies. Nevertheless, this difference in stability does not establish that individual bridge nodes are necessarily distinguishable from one another (Figure 5).
Figure 5.
Case-drop stability for strength and bridge strength. Note: The horizontal dashed line indicates the correlation threshold of 0.70, used as a reference for assessing the stability of centrality indices relative to the original sample.
The bootstrap difference tests reinforced this distinction. None of the 45 pairwise comparisons among the ten nodes with the highest observed strength values had a 95% confidence interval excluding zero. The same was found for the 45 comparisons among the ten leading bridge-strength nodes. Thus, while the overall bridge-strength measure was more stable than strength, the precise ordering of the leading nodes was not statistically distinguishable. These results support interpreting centrality patterns at a broader relational level rather than emphasizing small differences between individual nodes.
This distinction matters for interpretation. In the present study, the substantive contribution depends more on identifying which nodes connect the sub-competencies than on ranking all nodes by minor differences in global centrality. Recent methodological work recommends exactly this type of caution when interpreting centrality metrics in empirical network studies [7,19].
The sensitivity analyses provided further information about the consistency of the estimated network. The EBIC-based model with γ = 0.5 retained 185 edges (61.7%), matching the density of the primary model. A comparison with the independently re-estimated cross-validated network showed 184 shared edges, and the same ten nodes appeared among those with the highest strength and bridge strength, although their ordering varied. The alternative model based on polychoric correlations retained fewer edges (n = 152, 50.7%). Nevertheless, 148 edges were shared with the re-estimated primary network, and nine of the ten leading nodes for strength and bridge strength were common to both specifications. The five strongest item-level associations also remained prominent. These findings suggest that the main relational pattern, particularly the relevance of systemic and scientific thinking and the role of bridge nodes, was broadly consistent across estimation approaches. At the same time, the differences in network density indicate that individual weaker connections should be interpreted cautiously.
An additional sensitivity analysis examined the influence of invariant response patterns. When the 100 participants who selected the same response category across all 25 items were excluded, the re-estimated network retained 183 edges, compared with 185 in the full sample. The two networks shared 177 edges, and their edge weights were highly correlated (r = 0.996). The five strongest item-level associations remained the same, while nine of the ten leading strength nodes and all ten leading bridge-strength nodes were shared across both specifications. Although the average inter-item correlation decreased from 0.433 to 0.323, the main relational patterns remained broadly consistent. This analysis provides some reassurance regarding the network findings, without establishing whether invariant response patterns reflected careless responding.
3.5. Dimension-Level Network
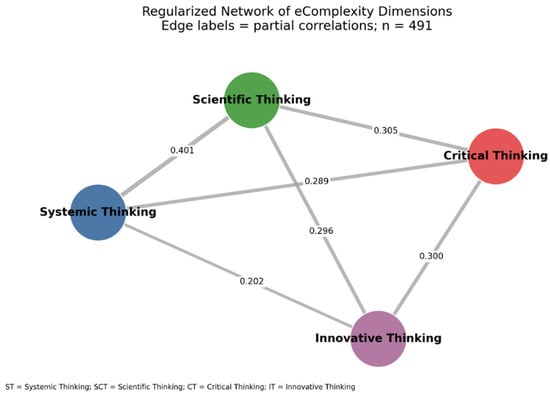
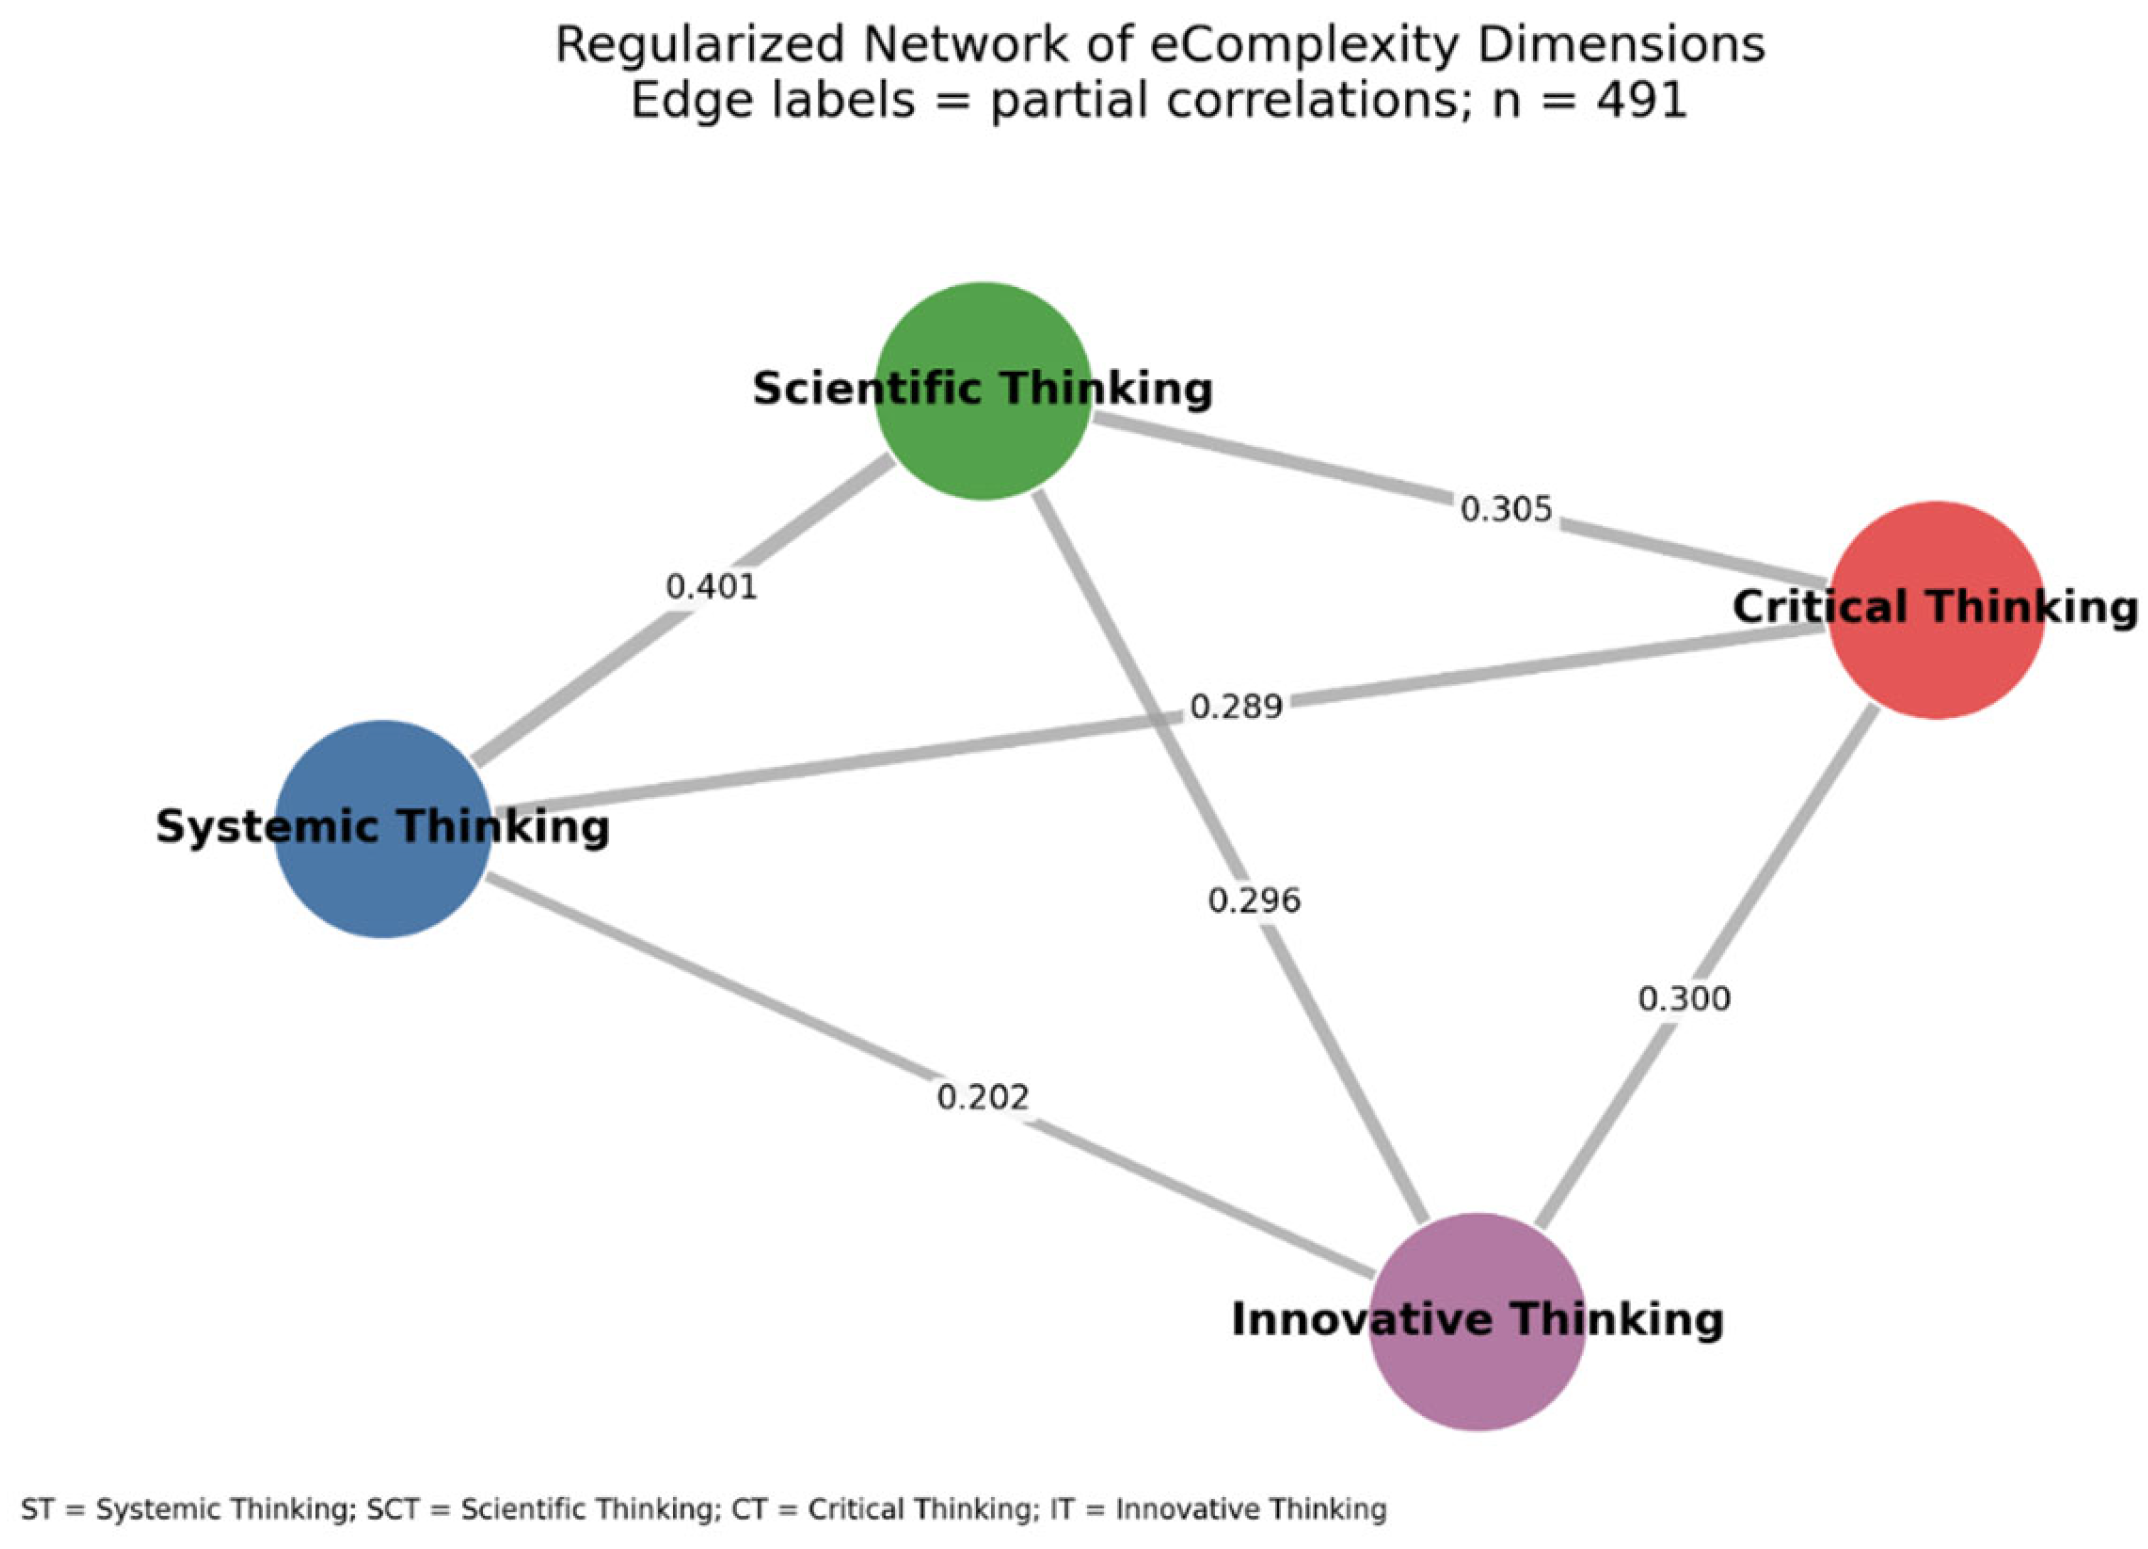
At the dimension level, the strongest partial correlation was between Systemic Thinking and Scientific Thinking (w = 0.4014). It was followed by Scientific Thinking–Critical Thinking (w = 0.3055), Critical Thinking–Innovative Thinking (w = 0.2996), Scientific Thinking–Innovative Thinking (w = 0.2964), and Systemic Thinking–Critical Thinking (w = 0.2887). The weakest association was between Systemic Thinking and Innovative Thinking (w = 0.2024) (Figure 6 and Table 6).
Figure 6.
Dimension-level partial correlation network.
Table 6.
Partial correlations between sub-competencies.
At the dimension level, the strongest observed partial correlation was between Systemic Thinking and Scientific Thinking. This finding describes an important association between these sub-competencies, although it does not establish their statistical dominance within the overall network. The association between Systemic Thinking and Innovative Thinking was numerically smaller (w = 0.2024) than those between Scientific Thinking and Innovative Thinking (w = 0.2964) and between Critical Thinking and Innovative Thinking (w = 0.2996). However, these differences were not formally tested, so their relative magnitudes should be interpreted descriptively rather than as evidence of statistically distinguishable relationships.
3.6. Empirical Communities
The community analysis identified four empirical communities with a weighted modularity of Q = 0.277. The structure did not reproduce the theoretical partition exactly, although it kept partial correspondence. Systemic items remained relatively compact. In contrast, the scientific component was divided into more than one local cluster, and the innovative component was distributed across communities that also included scientific and critical items (Table 7).
Table 7.
Empirical communities detected.
The empirical solution was further examined through bootstrap resampling. Across 400 resamples, four communities were identified in 58.8% of the solutions, while five communities appeared in 35.3%, three in 5.3%, and six in 0.8%. Agreement with the original partition showed a median adjusted Rand index of 0.502, with an interquartile range of 0.389 to 0.649. These results suggest that the empirical community structure was only moderately reproducible, with some variation in the number and composition of communities across samples.
The differences between the empirical and theoretical communities do not necessarily indicate a problem with the instrument. Rather, they show that the observed associations among items do not reproduce the predefined dimensions exactly. Innovative Thinking items were distributed across communities containing indicators from other sub-competencies. Nevertheless, the modest modularity and variability observed across bootstrap samples suggest that this partition should be interpreted as an exploratory representation of the network rather than a definitive alternative to the theoretical structure [12,18].
3.7. Exploratory Network Comparison Between Groups
The exploratory DIF analysis identified six items with significant omnibus effects after Benjamini–Hochberg adjustment (p8, p9, p12, p21, p23, and p24). Significant uniform DIF was observed for p8, p9, p12, and p23, while p24 showed significant nonuniform DIF. Item p21 reached significance in the omnibus test, although neither its uniform nor nonuniform component remained individually significant after the corresponding adjustments. These findings indicate that item functioning was not fully comparable across the China and Nepal groups and further support a cautious interpretation of the network comparison. The comparison between men (n = 352) and women (n = 139) showed no statistically significant differences in global strength (ΔGS = 1.471, p = 0.545), aggregate structural differences (D = 1.132, p = 0.810), or maximum edge difference (M = 0.207, p = 0.954) (Table 8).
Table 8.
Exploratory network comparisons.
For China (n = 285) and Nepal (n = 89), the aggregate edge-difference statistic was significant (D = 1.668, p = 0.001), whereas neither global strength (ΔGS = 4.156, p = 0.106) nor the maximum edge difference (M = 0.301, p = 0.520) reached statistical significance. The largest observed edge differences are presented in Table 9. Although 25 individual comparisons yielded unadjusted p-values below 0.05, none remained significant after controlling for multiple testing across the 300 possible edges. These findings indicate that the evidence for structural differences depends on the statistic considered and does not support identifying particular connections as significantly different between groups (Table 8 and Table 9).
Table 9.
Largest absolute edge differences between China and Nepal.
Although the structural comparison identified a statistically significant difference between the estimated networks, this finding cannot be attributed specifically to nationality. Students from China and Nepal completed different language versions of the questionnaire, and the DIF analysis identified differences in item functioning. The observed network difference may therefore reflect substantive variation, measurement-related effects, or a combination of both. The comparison is retained as an exploratory finding, without drawing conclusions about national differences in the organization of complex thinking [22,23].
The stability assessment of the Nepal network provided an additional reason for caution. Case-dropping bootstrap analyses yielded approximate correlation stability coefficients of 0.10 for both node strength and bridge strength. These values fall below the commonly recommended minimum of 0.25, indicating limited stability of the subgroup network. Consequently, the results do not provide a sufficiently reliable basis for interpreting the relative importance of individual nodes within this smaller sample.
4. Discussion
The findings revealed a predominantly positive pattern of associations among the eComplexity items in this international master’s cohort in Japan. Although this pattern provides information about the relational organization of the instrument, it is also compatible with variance shared across items through a general underlying factor. This pattern is consistent with Silva and Iturra’s [13] view of complex thinking as an interdependent set of cognitive processes rather than a collection of isolated abilities. The present study adds to this view by showing that such integration can be observed empirically through the internal organization of the construct.
These findings should be considered alongside the psychometric validation previously conducted with the same Japanese postgraduate cohort [6]. That study examined the factorial and hierarchical properties of eComplexity and also included network estimation. The present analysis provides a more detailed examination of individual item associations, cross-domain bridges, empirical communities, and the stability of the observed patterns. Both studies therefore offer complementary interpretations of the same dataset rather than independent evidence of replication.
One notable pattern was the presence of strong associations involving Scientific Thinking and Systemic Thinking. In this cohort, several of these connections were related to problem structuring, the organization of academic work, and the use of evidence. However, the bootstrap difference tests showed that the leading nodes could not be reliably distinguished in terms of strength. The relatively limited stability of this measure also discourages interpreting small differences as evidence of a dominant group of indicators. The findings are therefore better understood as showing prominent relational patterns rather than a hierarchical organization of the four sub-competencies. This distinction is particularly important because the study concerns a single international postgraduate cohort, and the observed configuration should not be generalized to other educational contexts without further evidence [27].
The analysis of bridge nodes provides further insight into how the components of complex thinking are connected, although its interpretation requires attention to the community partition used. Ramírez-Montoya et al. [2] emphasize the importance of integrating different cognitive operations within complex thinking. In the present study, several items contributed to connections between the predefined sub-competencies, but their relative bridge strength changed when empirical communities were considered. This suggests that the identification of specific bridging indicators depends partly on how the network is divided. The moderate stability of the empirical community solution reinforces the importance of interpreting these findings cautiously. Rather than establishing a fixed set of components responsible for integrating complex thinking, the results offer complementary perspectives on the relationships among its dimensions.
The dimension-level network and the empirical communities support the same interpretation. The strongest association appeared between Systemic Thinking and Scientific Thinking, while Innovative Thinking occupied a more distributed position in the network. In the observed empirical community solution, innovative thinking items were distributed across clusters containing indicators from other sub-competencies. This pattern describes their relational organization within the sample but does not establish that innovative thinking is more strongly associated with particular dimensions or that it develops from them. Briganti et al. [7] emphasize that network analysis is useful for understanding how components operate within a system, and this study shows that value in the context of postgraduate competency development. The result is also consistent with Qian et al. [12], who argue that network psychometrics can reveal patterns that are not directly visible through global model fit alone.
An alternative interpretation of these findings also deserves consideration. The predominance of positive associations and the average node predictability of 44.69% are compatible with the presence of a general factor underlying the eComplexity responses. Acquiescent responding may also contribute to shared variance in a self-report instrument, although this possibility was not directly examined in the present study. As Christensen and Golino [17] have shown, network and factor models can capture closely related aspects of item structure. The contribution of the present analysis should therefore not be understood as evidence against a general factor. Rather, it provides a more detailed description of the conditional associations within this particular cohort. For example, the strongest connections involved p8–p9, p9–p10, p4–p5, p1–p2, and p22–p23, while the empirical communities only partially reproduced the theoretical dimensions. The bridge analyses also illustrated how the interpretation of cross-domain connections changed depending on the community partition. These findings add information about the observed organization of the responses that is not directly conveyed by overall scores or global factorial fit indices. Nevertheless, they do not establish that the network model offers a better explanation than a general-factor model, nor do they demonstrate causal interactions among the items.
The exploratory comparison between China and Nepal also raises an important measurement consideration. Previous research has documented differences in perceived complex thinking across educational contexts [5], but the present findings require a more cautious interpretation. Although the aggregate structural difference statistics were significant, the maximum edge-difference test was not, and no individual edge difference remained significant after adjustment for multiple comparisons. Moreover, nationality and questionnaire language were completely aligned in this comparison. It is therefore not possible to establish whether the observed structural difference reflects variations in the competency itself, differences associated with language administration, or other characteristics of the groups. Rather than providing evidence of national differences in complex thinking, this result highlights the importance of examining measurement comparability when applying network analysis in multicultural educational settings.
The interpretation is further constrained by the fact that statistical significance depended on the structural difference statistic used, while no individual edge difference remained significant after adjustment for multiple comparisons. The limited stability of the Nepal network also reduces confidence in interpreting detailed differences between the two groups.
Taken together, these findings support the main contribution of the paper. The study does not argue that network analysis should replace latent-variable approaches, nor does it present the cohort only as a population to be profiled. The analysis therefore complements previous validation work by describing item-level conditional associations within this particular postgraduate cohort. Chambon et al. [19] also stress that empirical networks should be interpreted in relation to their sample and study design. In that sense, the present study shifts the discussion from the identification of dimensions to their observed item-level associations, connectivity patterns, and cross-dimensional links within a multicultural postgraduate cohort in Japan.
Implications
At the theoretical level, the findings refine the understanding of complex thinking by showing that its multidimensionality is not exhausted by identifying distinguishable sub-competencies. The findings also describe patterns of association among items within and across sub-competencies, although the available evidence does not support a statistically established hierarchy among dimensions [28]. The observed associations involving systemic and scientific thinking, together with the more stable evidence concerning bridge functions, suggest that understanding complex thinking requires attention to the connections among its sub-competencies rather than treating their relative centrality as a fixed hierarchy. This provides a more precise basis for discussing complex thinking as a system rather than only as a set of concurrent dimensions.
At the practical level, the findings suggest that postgraduate programs may benefit from addressing the connections among sub-competencies rather than treating systemic, scientific, critical and innovative thinking as isolated instructional targets. Learning activities can be designed to connect problem structuring, evidence use, analytical judgment and contextualized solution building. Research seminars, capstone projects and problem-based assignments may, for example, require students to move explicitly from defining a complex problem to evaluating evidence, justifying decisions and formulating context-sensitive responses. The identified bridge nodes may also inform formative assessment by indicating where connections among sub-competencies should be examined. These implications remain provisional because network centrality does not demonstrate that intervening on a particular item will produce changes elsewhere in the system.
5. Conclusions
This study examined complex thinking as a relational system in an international postgraduate cohort through an item-level network analysis of the eComplexity instrument. The results revealed a predominantly positive relational structure, with prominent associations involving systemic and scientific thinking and several bridge nodes connecting different sub-competencies. Although the observed strength values suggested differences in centrality, bootstrap comparisons did not support a clear ranking among the leading nodes. Bridge strength provided more stable evidence of cross-domain connections, suggesting that the integration of complex thinking may be better understood through the relationships among its components than through a hierarchy of individual indicators.
However, the relative importance of individual bridge nodes depended on whether theoretical or empirical communities were considered, limiting conclusions about their specific structural roles.
The results add an item-level perspective to the previously published validation of this postgraduate cohort [6]. Several prominent associations involved systemic and scientific thinking, while the empirical communities only partially reproduced the four predefined sub-competencies. The sensitivity of bridge centrality to community definition also illustrates why these findings should be interpreted as exploratory characteristics of this sample rather than stable properties of complex thinking across educational contexts.
These conclusions should be interpreted with caution. The cross-sectional design does not allow the examination of developmental change in the relational architecture of complex thinking over the course of postgraduate training, nor does it support causal interpretation. The study also relied on self-perception, so responses may reflect cultural response styles, desirability bias or differences in item interpretation. The predominance of positive associations may also reflect a common latent factor or response-style effects that were not examined directly. Consequently, the present analysis cannot distinguish these explanations from the relational interpretation of the observed network.
A further limitation concerns the China–Nepal comparison, in which nationality was completely confounded with the language version of the instrument. The exploratory DIF analysis identified differences in item functioning, preventing the observed network differences from being attributed confidently to national or educational backgrounds.
The relatively small Nepal subgroup also showed limited network stability, making detailed between-group comparisons particularly sensitive to sampling variability. This further restricts the interpretation of the exploratory network comparison.
Although the overall sample size was adequate for estimating the global network, imbalance across some subgroups limited the scope of the exploratory comparisons. The relatively high density of the estimated network also warrants caution, particularly when interpreting weaker associations. Although the main relational patterns were broadly consistent across the sensitivity analyses, the presence and magnitude of individual edges may still depend on the estimation approach. Community detection also showed moderate stability across bootstrap samples, and bridge-strength estimates varied according to the partition used. These findings limit the interpretation of specific empirical communities and individual bridge nodes as stable structural features of the construct. Network analysis provides a useful way to examine the internal organization of the construct, but its results remain dependent on modeling decisions and should therefore be understood as complementary to other psychometric approaches.
Future research can extend this line of work through longitudinal designs that examine whether the relational architecture of complex thinking changes as postgraduate experience advances. More balanced samples across nationalities, academic trajectories and stages of study would also improve the interpretability of subgroup comparisons. It would be useful to combine self-perception with performance-based measures to contrast the observed relational structure with more direct manifestations of competency. Finally, replicating this approach in other internationalized higher education contexts would help determine whether the prominent associations involving systemic and scientific thinking, together with the observed bridging patterns, are reproduced or vary depending on the training environment. These directions would help refine the study of complex thinking and strengthen network analysis as a useful strategy for examining multidimensional educational competencies in diverse postgraduate settings.
Supplementary Materials
The following supporting information can be downloaded at: https://www.mdpi.com/article/10.3390/higheredu5040121/s1, Table S1: Regularized partial-correlation matrix of the 25 eComplexity items; Table S2: Correlation matrix of the nonparanormal transformed items used for network estimation.
Author Contributions
Conceptualization, J.P.L.-G. and J.C.V.-P.; methodology, J.P.L.-G. and J.C.V.-P.; software, J.P.L.-G.; validation, J.P.L.-G., J.C.V.-P., C.B., A.L.R.-H. and S.P.-G.; formal analysis, J.P.L.-G.; investigation, C.B., A.L.R.-H. and S.P.-G.; resources, C.B., A.L.R.-H. and S.P.-G.; data curation, J.P.L.-G. and S.P.-G.; writing—original draft preparation, J.P.L.-G. and J.C.V.-P.; writing—review and editing, J.P.L.-G., J.C.V.-P., C.B., A.L.R.-H. and S.P.-G.; visualization, J.P.L.-G.; supervision, J.C.V.-P. and C.B.; project administration, J.C.V.-P., C.B. and A.L.R.-H. All authors have read and agreed to the published version of the manuscript.
Funding
This research received no external funding.
Institutional Review Board Statement
The study was conducted in accordance with the Declaration of Helsinki and approved by the Ethics Committee of Tecnológico de Monterrey (protocol code P-IFE-202506-002; 7 August 2025). The present study involved a secondary analysis of previously collected data and remained within the scope and purposes authorized by the Ethics Committee and communicated to participants. No additional contact with participants or collection of new information was conducted.
Informed Consent Statement
Informed consent was obtained from all subjects involved in the study.
Data Availability Statement
The data supporting the findings of this study are available from the corresponding author upon reasonable request. The dataset is not publicly available because of participant confidentiality, privacy considerations, and the ethical conditions under which the information was collected. Any request for access will be evaluated in accordance with the approved research protocol and applicable institutional requirements.
Acknowledgments
The authors thank the participating students and the institutional staff who supported the original data collection. During the preparation of this manuscript, the authors used ChatGPT (OpenAI) for English translation, language editing, and improving the clarity and organization of the text. The authors reviewed and edited the output and take full responsibility for the content of this publication.
Conflicts of Interest
The authors declare no conflicts of interest.
References
- Morin, E. Introduction À La Pensée Complexe; ESF: Paris, France, 1990. [Google Scholar]
- Ramírez-Montoya, M.S.; Castillo-Martínez, I.M.; Sanabria, J.; Miranda, J. Complex thinking in the framework of Education 4.0 and open innovation: A systematic literature review. J. Open Innov. Technol. Mark. Complex. 2022, 8, 4. [Google Scholar] [CrossRef] [Scilit]
- Vázquez-Parra, J.C.; Henao-Rodríguez, L.C.; Lis-Gutiérrez, J.P.; Castillo-Martínez, I.M.; Suárez-Brito, P. EComplexity: Validation of a complex thinking instrument from a structural equation model. Front. Educ. 2024, 9, 1334834. [Google Scholar] [CrossRef] [Scilit]
- Vázquez-Parra, J.C.; Lis-Gutiérrez, J.P.; Henao-Rodríguez, L.C.; George-Reyes, C.E.; Tramon-Pregnan, C.L.; del Río-Urenda, S.; Chio, M.E.B.; Tariq, R. Comparison of perceived achievement of complex thinking competency among American, European, and Asian university students. Soc. Sci. 2025, 14, 42. [Google Scholar] [CrossRef] [Scilit]
- Vázquez-Parra, J.C.; Henao-Rodríguez, L.C.; Lis-Gutiérrez, J.P.; Medina-Vidal, A. Dynamics of thinking: Exploring the interactions of cognitive sub-competencies and their effect on complex thinking in university students. J. Appl. Res. High. Educ. 2025. advance online publication. [Google Scholar] [CrossRef] [Scilit]
- Vázquez-Parra, J.C.; Henao-Rodríguez, L.C.; Blakely, C.; Palomino-Gámez, S.; Ramos Huerta, A.L. Psychometric validation of the eComplexity instrument in international postgraduate education: Evidence from a multicultural Japanese context. J. Appl. Res. High. Educ. 2026. advance online publication. [Google Scholar] [CrossRef] [Scilit]
- Briganti, G.; Scutari, M.; Epskamp, S.; Borsboom, D.; Hoekstra, R.H.A.; Golino, H.F.; Christensen, A.P.; Morvan, Y.; Ebrahimi, O.V.; Costantini, G.; et al. Network analysis: An overview for mental health research. Int. J. Methods Psychiatr. Res. 2024, 33, e2034. [Google Scholar] [CrossRef] [Scilit]
- Nachatar Singh, J.K.; Jack, G. The role of language and culture in postgraduate international students’ academic adjustment and academic success: Qualitative insights from Malaysia. J. Int. Stud. 2022, 12, 444–466. [Google Scholar] [CrossRef] [Scilit]
- van de Vijver, F.J.R.; Tanzer, N.K. Bias and equivalence in cross-cultural assessment: An overview. Eur. Rev. Appl. Psychol. 2004, 54, 119–135. [Google Scholar] [CrossRef] [Scilit]
- Buchtel, E.E.; Norenzayan, A. Thinking across cultures: Implications for dual processes. In Two Minds: Dual Processes and Beyond; Evans, J., Frankish, K., Eds.; Oxford University Press: Oxford, UK, 2009; pp. 217–238. [Google Scholar]
- Nomura, K. Exploring the emic understanding of critical thinking in Japanese education: A case study in a Japanese college. Educ. Philos. Theory 2023, 55, 1501–1512. [Google Scholar] [CrossRef] [Scilit]
- Qian, M.; Wang, X.; Dai, S. Psychometric network analysis and dimensionality assessment: A software review. Educ. Sci. 2025, 15, 555. [Google Scholar] [CrossRef] [Scilit]
- Silva, C.; Iturra, C. A conceptual proposal and operational definitions of the cognitive processes of complex thinking. Think. Ski. Creat. 2021, 39, 100794. [Google Scholar] [CrossRef] [Scilit]
- Epskamp, S.; Fried, E.I. A tutorial on regularized partial correlation networks. Psychol. Methods 2018, 23, 617–634. [Google Scholar] [CrossRef] [Scilit]
- Isvoranu, A.-M.; Epskamp, S. Which estimation method to choose in network psychometrics? Deriving guidelines for applied researchers. Psychol. Methods 2023, 28, 925–946. [Google Scholar] [CrossRef] [Scilit]
- Christensen, A.P.; Golino, H. On the equivalency of factor and network loadings. Behav. Res. Methods 2021, 53, 1563–1580. [Google Scholar] [CrossRef] [Scilit]
- Christensen, A.P.; Golino, H. Estimating the stability of psychological dimensions via bootstrap exploratory graph analysis: A Monte Carlo simulation and tutorial. Psych 2021, 3, 479–500. [Google Scholar] [CrossRef] [Scilit]
- Wongvorachan, T.; Bulut, O.; Gorgun, G.; Daniels, L. Evaluating the validity of the Student Perspectives of Teaching Survey: A network psychometrics approach. Trends High. Educ. 2025, 4, 74. [Google Scholar] [CrossRef] [Scilit]
- Chambon, M.; Dalege, J.; Elberse, J.E.; van Harreveld, F. Network psychometrics in practice: A practical framework for designing empirical studies that utilize a psychological network approach. Behav. Res. Methods 2026. advance online publication. [Google Scholar] [CrossRef] [Scilit]
- Epskamp, S.; Borsboom, D.; Fried, E.I. Estimating psychological networks and their accuracy: A tutorial paper. Behav. Res. Methods 2018, 50, 195–212. [Google Scholar] [CrossRef] [Scilit]
- Jones, P.J.; Ma, R.; McNally, R.J. Bridge centrality: A network approach to understanding comorbidity. Multivar. Behav. Res. 2021, 56, 353–367. [Google Scholar] [CrossRef] [Scilit]
- Adu, P.; Medvedev, O.N. Network analysis for assessment in international contexts. In International Handbook of Behavioral Health Assessment; Krägeloh, C.U., Alyami, M.M., Medvedev, O.N., Eds.; Springer: Cham, Switzerland, 2026; pp. 1–23. [Google Scholar] [CrossRef] [Scilit]
- Wu, M.; Wang, H.; Li, M.; Gao, Z.; Lei, Q.; Yan, Y.; Drolma, D.; Yang, J.; Lan, Z.; Liang, L. Network analysis of suicidal tendency and mental health symptoms in college students: A gender-differences comparison. BMC Psychol. 2026, 14, 195. [Google Scholar] [CrossRef] [Scilit]
- Haslbeck, J.M.B.; Fried, E.I. How predictable are symptoms in psychopathological networks? A reanalysis of 18 published datasets. Psychol. Med. 2017, 47, 2767–2776. [Google Scholar] [CrossRef] [Scilit]
- Burger, J.; Isvoranu, A.-M.; Lunansky, G.; Haslbeck, J.M.B.; Epskamp, S.; Hoekstra, R.H.A.; Fried, E.I.; Borsboom, D.; Blanken, T.F. Reporting standards for psychological network analyses in cross-sectional data. Psychol. Methods 2023, 28, 806–824. [Google Scholar] [CrossRef] [Scilit]
- van Borkulo, C.D.; van Bork, R.; Boschloo, L.; Kossakowski, J.J.; Tio, P.; Schoevers, R.A.; Borsboom, D.; Waldorp, L.J. Comparing network structures on three aspects: A permutation test. Psychol. Methods 2023, 28, 1273–1285. [Google Scholar] [CrossRef] [Scilit]
- Vázquez-Parra, J.C.; Gonzalez-Gonzalez, C.S.; Amézquita-Zamora, J.A.; Cotino Arbelo, A.E.; Palomino-Gámez, S.; Cruz-Sandoval, M. Complex thinking and adopting artificial intelligence tools: A study of university students. Front. Educ. 2024, 9, 1377553. [Google Scholar] [CrossRef] [Scilit]
- Arredondo-Trapero, F.G.; Villa-Castaño, L.E.; Vázquez-Parra, J.C.; De la Garza García, J. Differences on self-perception of organizational pride and loyalty in millennial & generation X, considering gender and seniority variables. Bus. Econ. Horiz. 2017, 13, 270–286. [Google Scholar] [CrossRef] [Scilit][Green Version]

Disclaimer/Publisher’s Note: The statements, opinions and data contained in all publications are solely those of the individual author(s) and contributor(s) and not of MDPI and/or the editor(s). MDPI and/or the editor(s) disclaim responsibility for any injury to people or property resulting from any ideas, methods, instructions or products referred to in the content. |
© 2026 by the authors. Licensee MDPI, Basel, Switzerland. This article is an open access article distributed under the terms and conditions of the Creative Commons Attribution (CC BY) license.