Article

Digital Expectations, Capacity Pressures and Student Well-Being: How Generation Z Perceives Access to Higher Education in the Czech Republic

by
Jitka Matějková
Department of Law and Social Sciences, Faculty of Business and Economics, Mendel University in Brno, Zemědělská 1, 613 00 Brno, Czech Republic
Platforms 2026, 4(3), 13; https://doi.org/10.3390/platforms4030013
Submission received: 20 March 2026 / Revised: 12 June 2026 / Accepted: 6 July 2026 / Published: 8 July 2026

Abstract

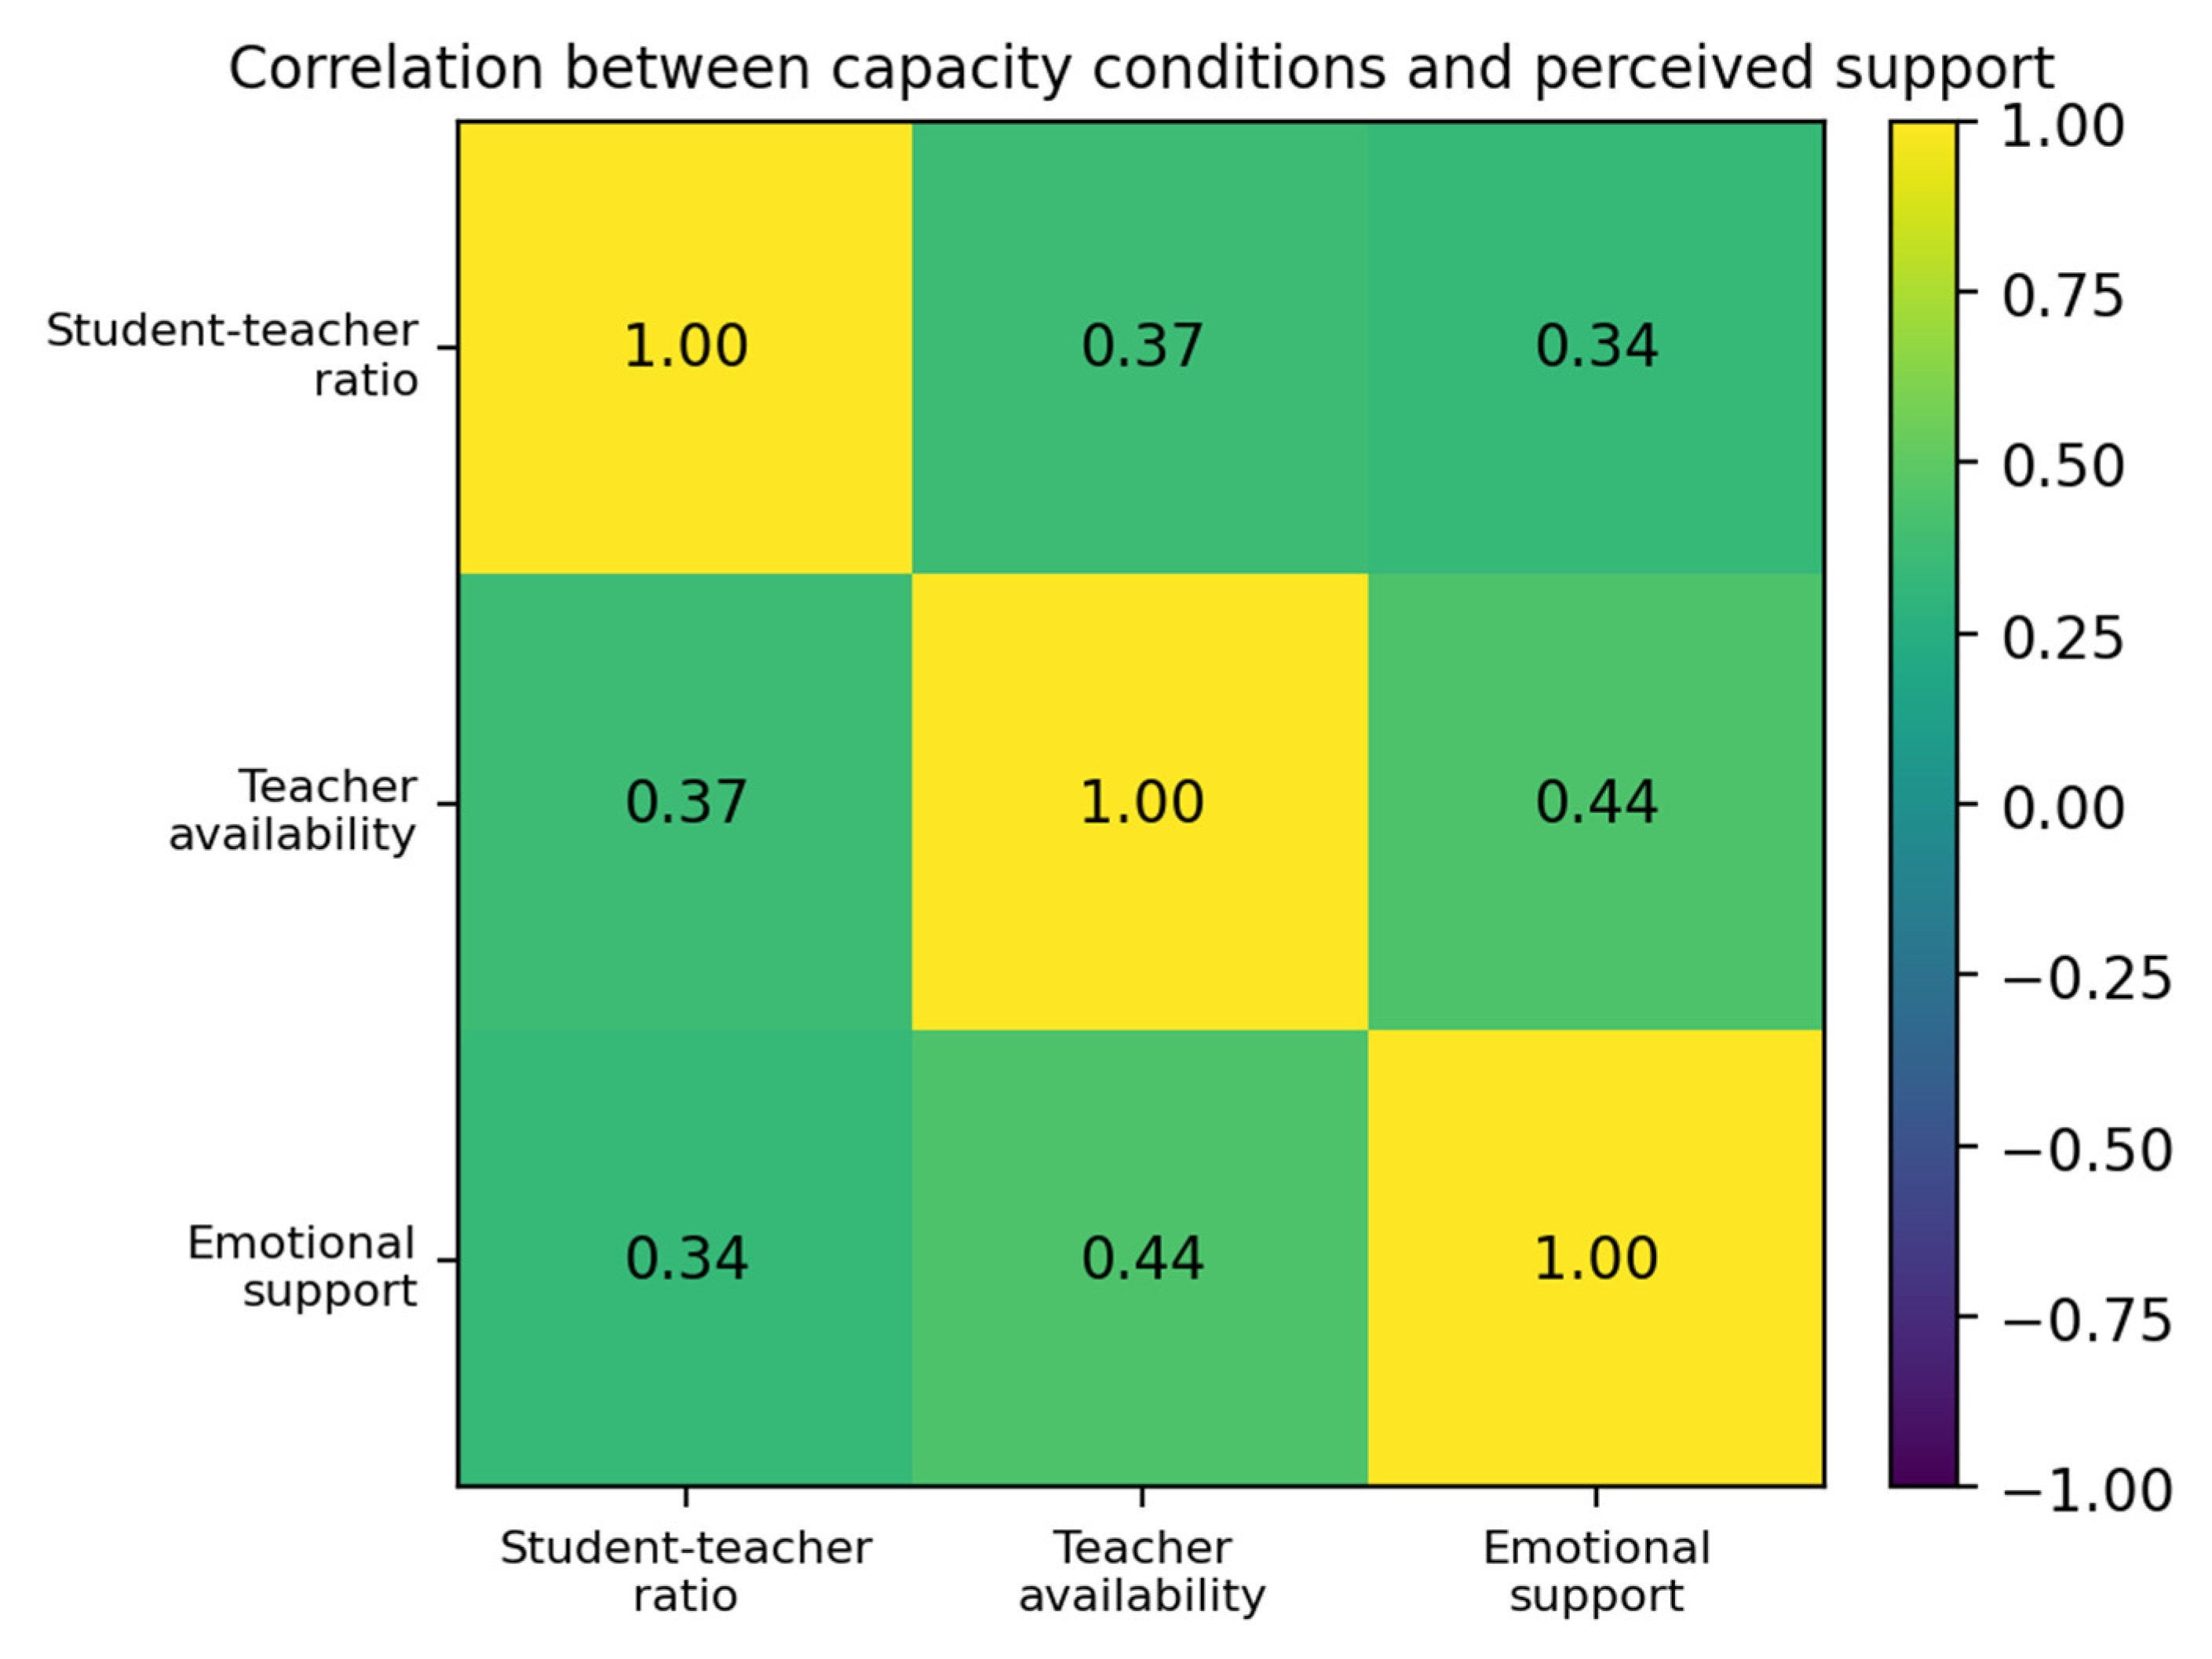
Objective: This paper investigates how Generation Z students perceive the quality, accessibility, and capacity of higher education in the Czech Republic, with relevance for the wider Visegrád (V4) region and for the design of educational platforms. Methodology: The study draws on a questionnaire survey of 819 students and analyses 38 Likert-type statements aggregated into five domains: digitalisation and technology, innovation in teaching, practical orientation and mobility, support and well-being, and capacity constraints and infrastructure. The analysis combines descriptive statistics, reliability and dimensionality checks, Pearson correlation analysis with normality and robustness diagnostics, and subgroup comparisons by gender, level of study, field of study, institution type, and age group. Results: Students report the strongest agreement with digitalisation and technology (M = 3.90) and practical orientation and mobility (M = 3.89), while support and well-being (M = 3.40) and capacity constraints and infrastructure (M = 3.36) remain weaker. Perceived adequacy of the student–teacher ratio is positively associated with perceived teacher availability (r = 0.37) and emotional support (r = 0.34), while teacher availability is positively associated with emotional support (r = 0.44). Subgroup tests indicate limited but meaningful differences, particularly by institution type, field of study, and age group. Conclusion: The findings suggest that Generation Z students value digitally enabled, practice-oriented and innovative educational platforms, but sustainable quality improvement also requires investment in human capacity, teacher availability, and student-facing support systems.

1. Introduction

Higher education systems across Central Europe increasingly operate under a dual pressure that is simultaneously pedagogical, organisational, and fiscal. On the one hand, students demand learning environments that are digitally supported, flexible, and personalised, and that credibly develop labour-market relevant competences, both discipline-specific skills and transversal capabilities (e.g., digital skills, communication, teamwork, and problem solving). On the other hand, universities face structural capacity constraints, reflected in staffing limitations, administrative workload, and constrained investment in infrastructure and student support services [1]. These pressures are reinforced by wider societal and economic transitions—including digital transformation, demographic change, and recurrent shocks that affect public funding and institutional resilience [2]. In the Visegrád (V4) region, this tension is especially salient because long-term resource constraints intersect with accelerating technological change and rising expectations regarding educational quality and student services [3].
Universities therefore have a strategic mission in the professional development of human capital for a digitalised environment. This mission is no longer limited to transmitting disciplinary knowledge; it also involves developing digital competence, AI literacy, adaptability, critical judgement, and the capacity to use educational technologies responsibly in professional and civic contexts. This is consistent with European skills policy and labour-market evidence showing that digitalisation, AI, and technological transformation are reshaping the competence profiles expected from graduates [3,4,5]. The DigComp 2.2 framework further underlines that digital competence includes not only technical operation of tools but also information literacy, communication, content creation, safety, and problem solving, all of which are central to employability and lifelong learning in a digital economy [6].
At the European level, digitalisation is not framed as an optional modernisation measure but as a strategic condition for competitiveness, inclusion, and resilience of education systems [5]. The European Commission’s Digital Education Action Plan (2021–2027) articulates a policy agenda aimed at strengthening digital capacity, improving digital competences, and supporting high-quality and inclusive digital education [7]. In parallel, the European Strategy for Universities highlights universities’ role in responding to major societal challenges and emphasises the need to strengthen institutional capacity, including human resources and governance conditions that enable innovation in teaching, learning, and research [1]. Importantly, these policy orientations imply that digital transformation and the design of educational platforms should be evaluated not only through technology adoption but also through the professional formation of digital human capital, organisational readiness, staff capacity, and the ability to sustain student-centred services at scale, dimensions where many universities experience bottlenecks [1,2,7].
Generation Z is commonly defined in the international literature as the cohort born approximately between 1997 and 2012 [8]. In the context of higher education, the label is used here primarily as a shorthand for the current mainstream student cohort, which is largely composed of individuals born from the late 1990s onwards. Given that the survey targets students enrolled in Czech higher education programmes and that the typical age of university students falls within the early part of this cohort, the term “Generation Z” is analytically appropriate for describing the dominant respondent group. At the same time, cohort labels should not be treated deterministically; they are used in this paper as a contextual framing device rather than as a claim that generational membership alone explains individual attitudes or outcomes.
Generation Z, currently the dominant cohort in European universities, is frequently characterised by strong expectations regarding flexibility, interactivity, immediate feedback, and a learning climate that supports psychological safety and well-being [9]. While cohort labels should not be treated deterministically, recent research indicates that teaching strategies better aligned with metacognitive support, active learning, and well-structured feedback loops can be particularly relevant for this group, especially in digitally rich environments [10]. These expectations also shape students’ perceptions of institutional quality: digital tools and hybrid modalities are often valued when they increase accessibility and engagement, yet they can be perceived negatively when they are implemented without pedagogical coherence, adequate academic support, or reliable infrastructure. In short, from the student perspective, “digital” becomes meaningful primarily when it improves learning processes and relationships rather than merely increasing the quantity of online content [2].
In addition, the rapid diffusion of generative artificial intelligence (GenAI) makes Generation Z especially relevant for the present study. This cohort is entering higher education at a time when AI-enabled search, writing support, adaptive feedback, and automated tutoring are becoming embedded in everyday learning environments. UNESCO’s AI competency frameworks for students and teachers emphasise that AI-related education should cultivate a human-centred mindset, ethical judgement, technical understanding, and responsible co-creation with AI systems [11,12]. UNESCO’s guidance on GenAI in education and research likewise stresses the importance of human-centred implementation, capacity building, and governance safeguards, including academic integrity, data protection, and equitable access [13]. For universities, GenAI creates an immediate practical challenge: students may expect AI-enabled learning support and faster feedback, while teachers and institutions must develop rules, competences, and assessment practices that preserve learning outcomes and academic standards [9,11,12,13]. This amplifies the relevance of staff time, pedagogical training, and institutional support structures.
A second axis of pressure concerns student well-being. European comparative evidence shows that well-being and mental health have become prominent concerns in higher education, with measurable variation across systems and student groups. Even before the pandemic, campus well-being was increasingly discussed as a systemic issue; subsequent disruptions highlighted how strongly mental health outcomes depend on institutional support, availability of staff, and access to counselling and guidance services. In this context, students’ perceptions of “access to education” extend beyond admission and formal participation; they include lived access to support, consultation, feedback, and a learning environment perceived as fair, responsive, and emotionally safe [9].
These developments make the concept of the educational platform particularly relevant for the present study. In this paper, an educational platform is understood not merely as a software application or learning-management system, but as a socio-technical environment through which universities organise access to learning content, interaction with teachers, feedback, assessment, mobility-related information, and student support. The quality of such platforms therefore depends on both technological functionality and the human capacity that makes digitally mediated learning meaningful.
To strengthen the academic grounding of the study, the analysis is also informed by three complementary theoretical perspectives. First, student involvement and engagement theory conceptualises educational quality through the behavioural, cognitive and emotional energy that students invest in learning, as well as through the institutional conditions that enable such engagement [14,15]. Second, higher-education access and retention perspectives emphasise that meaningful access is not limited to admission or formal participation, but also depends on integration into academic communities, supportive institutional environments and opportunities to participate effectively in learning [16]. Third, student well-being frameworks conceptualise well-being both as positive functioning and as a balance between personal resources and contextual challenges [17,18]. Together, these perspectives justify the paper’s focus on digitalisation, interaction with teachers, support, institutional capacity and platform-mediated access as mutually connected dimensions of student experience.
Against this background, the aim of this paper is to provide an empirically grounded profile of Generation Z perceptions of access to higher education in the Czech Republic, with implications for the wider V4 region and for the design of student-centred educational platforms. Although the dataset is national, the analysed dimensions—digitalisation, innovation in teaching, practical orientation and mobility, support and well-being, and capacity constraints—map directly onto challenges and policy priorities shared across Central European higher education systems. In methodological terms, the paper operationalises these dimensions through a structured survey instrument and reports domain-level patterns of perceived agreement. Substantively, the paper contributes by (i) quantifying the relative strength of key domains of perceived quality from the student perspective; (ii) examining whether perceived capacity conditions (notably staffing-related constraints) are associated with perceived access to teachers and perceived emotional support, thereby linking organisational capacity to the student experience of educational platforms in a way that is directly relevant for governance and policy design.


2. Problem Formulation and Methodology

The central research problem concerns a potential misalignment between the expectations of Generation Z and the structural conditions under which higher education institutions operate. While universities have intensified investments in digital learning tools and increasingly experiment with innovative pedagogical formats, students may still experience limited access to practice-oriented learning, constrained staff availability, and insufficient support for well-being. Importantly, these perceived shortcomings may not be independent; rather, they can be amplified by capacity pressure (e.g., student–teacher ratios, workload and time scarcity), which directly affects interaction, feedback, and the availability of supportive services.

2.1. Data and Instrument

The empirical basis of the study is a structured questionnaire survey administered to students enrolled in Czech universities (N = 819). Data collection took place from 15 September 2025 to 30 November 2025. The instrument consisted of 38 attitudinal statements measured on a five-point Likert response format (1 = strongly disagree; 5 = strongly agree). Likert-type items are widely used to measure attitudes and perceptions; however, their measurement level and the appropriate analytical treatment remain debated. A common and defensible approach is to treat single Likert-type items primarily as ordinal, while recognising that composite scores formed by aggregating multiple items intended to measure a broader latent dimension can be analysed using means and standard deviations as approximately interval, particularly in larger samples and when the composite exhibits acceptable psychometric properties [19,20,21].
The study used a non-probability convenience sampling strategy. Respondents were recruited through open online distribution and university- or study-related communication channels accessible to students in Czech higher education. Participation was voluntary and anonymous. Because the questionnaire was distributed through open recruitment channels rather than through a closed sampling frame with a known number of invited students, a precise response rate could not be calculated. This limits claims of statistical representativeness; accordingly, the findings are interpreted as an empirically grounded profile of student perceptions rather than as population estimates for all Czech university students.
The content validity of the instrument was addressed at the stage of questionnaire construction. Items were derived from the study’s conceptual framework and from the literature on digitalisation in higher education, teaching innovation, practical orientation and mobility, student support and well-being, and capacity constraints. Each item was mapped ex ante to one of the five thematic domains, and the wording was reviewed for conceptual relevance, clarity, non-duplication, and suitability for the Czech higher-education context. In line with established guidance on content validity and scale development, this procedure is treated as qualitative content validation supporting the coverage and interpretability of the instrument; it does not replace subsequent empirical checks of reliability and dimensionality [22,23].

2.2. Domain Structure and Aggregation Strategy

For interpretation and reporting, the 38 statements were organised into five thematic domains: (i) Digitalisation and technology; (ii) Innovation in teaching; (iii) Practical orientation and mobility; (iv) Support and well-being; and (v) Capacity constraints and infrastructure. This domain structure follows the conceptual design of the instrument and enables a compact synthesis at a level that is meaningful for governance and policy discussion. From a measurement perspective, the approach is consistent with standard guidance on scale development and the construction of multi-item measures, where conceptually related items are combined to represent a broader construct [23].
For each respondent, a domain score was computed as the arithmetic mean of all items belonging to the given domain. Table 1 reports descriptive statistics for the five domain scores, including the number of observations, mean, median, standard deviation, minimum, maximum, skewness, and excess kurtosis. This descriptive strategy follows recommendations that distinguish between the analysis of individual Likert-type items (often best described via distributions) and the analysis of aggregated Likert scales (where means and dispersion can be informative and comparable across domains) [24].
The full domain structure of the questionnaire, including the item mapping across the five thematic domains, is provided in Appendix A (Table A1). The exact wording of the focal items used in the subsequent association analysis and the respondent profile of the analytical sample are reported in Appendix A (Table A2 and Table A3, respectively).

2.3. Aggregation, Reliability and Dimensionality Checks

Because the analysis relies on domain-level composite scores, aggregation was supported by basic reliability and dimensionality checks. Cronbach’s alpha was calculated for each of the five thematic domains as an indicator of internal consistency. The coefficients ranged from 0.55 to 0.72, with the strongest internal coherence observed for capacity constraints and infrastructure (α = 0.72), innovation in teaching (α = 0.70), and digitalisation and technology (α = 0.69). Support and well-being produced a value of α = 0.66, which is interpretable considering the small number of items (k = 3), while practical orientation and mobility produced a lower coefficient (α = 0.55), reflecting the broader and more heterogeneous content of this domain. These results are reported in Appendix A (Table A4).
In addition, an exploratory factor analysis was conducted on the 38 Likert-type items to examine whether the empirical structure broadly corresponded to the theoretically defined domains. The data were suitable for this procedure: the Kaiser–Meyer–Olkin measure was 0.91, and Bartlett’s test of sphericity was significant, χ2(703) = 10,106.60, p < 0.001. The first five components accounted for approximately 46.0% of the total variance. A five-factor varimax solution showed interpretable clustering around innovation/support, capacity-related constraints, digitalisation, and practice/mobility-related content. The pattern therefore supports the use of the domains as substantively meaningful descriptive composites, although it also indicates some conceptual overlap between digitalisation, innovation, and support-related items, which is expected in digitally enhanced higher education.
The domain scores are therefore retained as descriptive indicators rather than as strict psychometric scales in a confirmatory measurement model. Interpretation remains anchored in substantive coherence of the item groupings, transparent reporting of the underlying items, and cautious use of reliability and factor-analytic evidence as supportive rather than definitive validation.

2.4. Correlation Analysis and Interpretation

To examine whether perceived capacity conditions are related to perceived support, Pearson correlation coefficients were calculated for three items capturing (a) perceived adequacy of the student–teacher ratio, (b) perceived teacher availability outside of class, and (c) perceived emotional support. Prior to interpreting Pearson correlations, normality diagnostics were conducted for the three focal variables. Shapiro–Wilk tests indicated statistically significant deviations from normality, as is common with five-point Likert-type data in large samples (student–teacher ratio: W = 0.893, p < 0.001; teacher availability: W = 0.877, p < 0.001; emotional support: W = 0.862, p < 0.001). However, skewness and excess kurtosis values were modest (skewness from −0.33 to −0.18; excess kurtosis from −0.14 to 0.50), and the large sample size supports the robustness of Pearson correlation for summarising linear associations. As a robustness check, Spearman rank correlations were also calculated and produced the same substantive pattern. Interpretation therefore focuses on effect size and substantive meaning rather than on statistical significance alone [25].

2.5. Analytical Strategy and Policy Orientation

Overall, the analytical approach combines domain-level descriptive statistics, qualitative content validation, reliability and dimensionality checks, normality diagnostics for the correlation analysis, targeted Pearson correlations with Spearman robustness checks, subgroup comparisons using parametric tests, and interpretative synthesis. For subgroup analysis, Welch t-tests were used for two-category comparisons (gender, level of study, and institution type), while one-way ANOVA was used for field-of-study and age-group comparisons. This design supports the paper’s applied objective: to translate student perceptions into actionable implications for higher-education governance and student-centred policy, particularly in settings where capacity constraints, educational-platform design, and digital transformation interact.

3. Results and Discussion

Table 1 summarises the descriptive statistics for the five domains derived from the 38 Likert-type statements (N = 819). Overall, students express the strongest agreement with items reflecting digitalisation and technology and practical orientation and mobility, while support and well-being and capacity-related conditions receive comparatively lower evaluations. This pattern is consistent with the broader European context in which institutions have accelerated digitally enhanced learning and teaching, yet report persistent constraints in staffing capacity, workload, and the sustainability of student support services [2,26]. The results therefore point to a core governance challenge: students visibly appreciate modernisation efforts that enhance the learning environment, but they also perceive bottlenecks in the “human layer” of higher education—time, attention, accessibility of staff, and psychosocial support.

3.1. Digitalisation and Innovation as Strengths

Digitalisation-related statements receive high agreement (mean domain score 3.90; median = 3.88). For Generation Z students, this value indicates that digital access is not perceived as a peripheral enhancement but as a core component of educational quality. Respondents broadly perceive modern technologies and digital tools as improving the quality of learning and express support for continued investment in digital infrastructure. This is aligned with European policy priorities that treat digital education capacity as a strategic condition for quality, inclusion, and resilience [1,6]. It is also compatible with institutional-level evidence suggesting that digitally enhanced learning and teaching has become structurally embedded across Europe following the pandemic-era acceleration, even though implementation quality varies and depends strongly on staff readiness and governance arrangements [2,27].
Teaching innovation is evaluated positively as well (mean domain score 3.67; median = 3.67), indicating that students perceive tangible progress in innovative approaches and competence-oriented learning. For Generation Z students, this score suggests that innovation is valued when it creates more active, interactive, feedback-rich, and competence-oriented educational experiences. From a learning-and-teaching perspective, this is important: innovation is valued by students primarily when it increases engagement and supports deeper learning, rather than merely changing the delivery format. Recent empirical research shows that faculty–student rapport and meaningful classroom engagement are strongly associated with deeper learning approaches, which helps to interpret why students can evaluate “innovation” favourably when it is experienced as pedagogically relevant and relationally supportive [28].
At the same time, the findings should not be read as a blanket endorsement of “more technology” irrespective of pedagogy. European analyses emphasise that digitally enhanced teaching requires continuous investment not only in platforms and infrastructure but also in the teaching profession: training, time allocation, assessment redesign, and support for staff as innovators [2,26]. Consequently, the high agreement on digitalisation and innovation should be interpreted as support for quality-enhancing educational platforms, rather than as a signal that technological adoption alone resolves broader structural constraints.

3.2. Practical Orientation and Mobility: High Expectations, Uneven Experience

The practical orientation and mobility domain reaches a high mean score (3.89; median = 3.86), indicating that students strongly value the integration of theory and practice, cooperation with employers, internships, and access to international mobility. For Generation Z students, this value can be interpreted as a clear expectation that higher education should support employability, applied competence development, and professional readiness in a digitally transformed labour market. This aligns with European policy priorities that emphasise skills development, employability, and the need to keep higher education responsive to rapidly evolving labour-market demands [3,4,5]. It is also consistent with the sustained policy salience of cross-border mobility as a mechanism for competence development, internationalisation, and personal growth within the European Higher Education Area [1,6].
At the same time, a domain-level average should be interpreted with caution, as it may conceal variation in students’ access to opportunities. The results are compatible with the interpretation that experiences differ across institutions and fields of study, particularly with respect to the availability of internships and the perceived accessibility of mobility pathways. This reading corresponds with comparative European evidence suggesting that mobility participation can be shaped by structural barriers—such as information gaps, financial constraints, and administrative complexity—thereby producing unequal access even where relevant programmes exist [29]. Accordingly, the high mean can be understood primarily as a strong normative expectation: students view practice-based learning and mobility as core elements of high-quality higher education, while the underlying variation points to implementation and access challenges at the institutional level.
From a governance perspective, these findings support a targeted implication: strengthening practical learning and mobility is not merely a matter of programme design, but also of institutional capacity to build and coordinate partnerships, ensure adequate supervision of placements, and lower administrative burdens for students. In this sense, the practical orientation and mobility results anticipate the capacity-related patterns discussed in the subsequent section.

3.3. Support and Well-Being: The Weakest Evaluated Domain

Support and well-being emerge as a comparatively weaker domain (mean domain score 3.40; median = 3.33). For Generation Z students, this value indicates that the educational platform is not experienced only through digital tools and course delivery, but also through the availability of teachers, guidance, mental-health support, and emotionally supportive academic relationships. Students report lower perceived adequacy of mental-health support and emotional understanding from staff, and they indicate constraints on teachers’ time for consultation. This finding resonates with European comparative reporting, which documents substantial concerns regarding student well-being and mental health and highlights systematic variation in the prevalence of reported difficulties [9].
Importantly, the present results suggest that students perceive well-being support as insufficient not only in terms of specialised services (e.g., counselling) but also in day-to-day educational relationships—availability, responsiveness, and emotional support in academic interactions. This interpretation is consistent with evidence that academic support and well-being are closely intertwined; supportive academic environments and accessible guidance can contribute to students’ perceived well-being and coping capacity [30]. Consequently, from a student-centred governance perspective, improving well-being is likely to require both (i) strengthening professional support services and (ii) expanding the time and capacity for formative interaction between students and teaching staff.

3.4. Capacity Pressures as a Structural Driver of Perceived Support

The capacity constraints and infrastructure domain record a comparatively low mean score (3.36; median = 3.36). For Generation Z students, this result means that access to higher education is perceived not only as formal enrolment or digital access, but also as practical access to sufficient staff time, infrastructure, individual attention, and personalised learning opportunities. Students perceive that staffing constraints and teacher overload reduce the individual attention available to students and make personalisation of learning more difficult. This is consistent with European system-level analyses that identify capacity to enhance learning and teaching—including support for staff and institutional capability—as a critical policy issue [26]. It is also compatible with classic higher-education productivity arguments that when student–faculty ratios rise, institutions typically face pressure toward larger classes and increased teaching loads, which can reduce the space for individualised interaction and feedback [31].
The correlation evidence reinforces a structural interpretation. Figure 1 visualises the positive associations between perceived adequacy of the student–teacher ratio, perceived teacher availability, and perceived emotional support. Perceived adequacy of the student–teacher ratio correlates positively with perceived teacher availability (r = 0.37; Spearman’s ρ = 0.37), and teacher availability correlates with perceived emotional support (r = 0.44; Spearman’s ρ = 0.42). The student–teacher ratio is also positively associated with emotional support (r = 0.34; Spearman’s ρ = 0.32). In applied terms, these associations suggest that capacity conditions are not merely administrative variables; they shape core elements of the student experience—especially access to teachers, consultation time, and the perceived quality of relational support. This interpretive claim is consistent with empirical literature linking faculty–student interaction and rapport to student engagement and learning quality [28]. It also aligns with evidence that students’ use of consultation opportunities (e.g., office hours) can be associated with academic performance, which makes staff availability a plausible mechanism through which capacity affects outcomes [32].
Methodologically, the correlations are interpreted as associations rather than causal effects. In line with established guidance, the discussion emphasises magnitude and plausible mechanisms while avoiding causal over-claims [25]. Nevertheless, the pattern is substantively meaningful: within students’ perceptions, the capacity environment appears linked to the availability of academic interaction, which in turn links to perceived emotional support. From a governance standpoint, the results therefore argue for capacity-sensitive reforms, particularly those that combine digital transformation with staffing, workload, and support-system strengthening, rather than reforms that rely predominantly on technological solutions [2,26].

3.5. Subgroup Patterns by Respondent Characteristics

To add analytical nuance, supplementary subgroup comparisons were conducted by gender, level of study, field of study, institution type, and age group. Welch t-tests were used for two-category comparisons and one-way ANOVA for multi-category comparisons. These tests should not be interpreted as causal evidence, but they help identify whether the main domain-level pattern is broadly stable across respondent categories. Subgroup means are reported in Appendix A (Table A5), and the parametric test summary is reported in Appendix A (Table A6).
Gender and level-of-study comparisons did not produce statistically significant differences across the five domains, suggesting that the main pattern is not driven by these respondent characteristics. More visible differences appear by institution type, field of study, and age group. Students at private universities reported higher mean scores for innovation in teaching (M = 3.77) than students at public universities (M = 3.57; Welch t = 6.87, p < 0.001), and they also reported higher support and well-being scores (M = 3.48 versus M = 3.31; Welch t = 3.74, p < 0.001). For Generation Z students, this suggests that the perceived quality of educational platforms may depend not only on digital infrastructure but also on institutional organisation, teacher availability, and student-facing support capacity.
Field-of-study comparisons also show statistically significant differences in digitalisation and technology (F = 5.03, p < 0.001), innovation in teaching (F = 4.45, p < 0.001), and capacity constraints and infrastructure (F = 2.63, p = 0.023). These differences are substantively modest, but they indicate that students’ perceptions of digital readiness, pedagogical innovation, and capacity pressures may vary across disciplinary environments. Age-group comparisons further refine the Generation Z interpretation. The youngest respondents (≤20 years) show particularly strong agreement with practical orientation and mobility (M = 3.93), while the 21–24 group reports the lowest mean for support and well-being (M = 3.28). Older respondents report somewhat higher support and well-being scores, but they also show lower scores in the capacity constraints and infrastructure domain, especially in the ≥30 group (M = 3.16).
Overall, the subgroup analysis reinforces rather than changes the main finding: across respondent categories, students evaluate digitalisation, innovation, and practical orientation more favourably than the human-support and capacity-related dimensions of higher education. The statistically significant subgroup differences are modest in size, but they add interpretative nuance by showing where institutional, disciplinary, and age-related experiences may shape the perceived quality of educational platforms.

4. Conclusions

The survey evidence indicates that Generation Z students in the Czech Republic evaluate digitalisation and innovative learning environments positively and express strong orientation toward practice-based learning and mobility. At the same time, the comparatively weaker evaluation of support and well-being, together with the lower ratings in the capacity constraints domain, signals a governance tension: institutions may be able to modernise tools and delivery formats faster than they can strengthen the human and organisational conditions required for sustained, individualised academic support. This interpretation is consistent with European-level observations that digitally enhanced learning has expanded rapidly, while staffing capacity, workload pressures, and the sustainability of student support services remain persistent constraints [2,26].
A key contribution of the study is the demonstrated link between perceived capacity conditions and perceived support. The observed correlations suggest that perceived adequacy of staffing conditions is meaningfully associated with students’ perceived access to teachers and perceived emotional support. While these associations do not establish causality, they strengthen a structurally plausible account in which capacity pressure influences the relational and supportive dimensions of higher education, features that are central to student experience and well-being [9,25]. In policy terms, this implies that digital transformation strategies should be pursued in parallel with capacity-responsive measures; otherwise, technology risks being perceived as a substitute for rather than an enabler of high-quality interaction and support [1,2].
The Generation Z framing should therefore be understood as contextual and interpretative rather than deterministically causal. The study does not include a direct comparison with earlier student cohorts; consequently, it cannot prove that the observed perceptions are unique to Generation Z. Nevertheless, the pattern is consistent with prior research describing contemporary Generation Z students as expecting flexible, interactive, technology-supported, and feedback-rich learning environments [8,9,10]. In the context of GenAI, these expectations are likely to intensify students increasingly encounter AI-supported search, writing, feedback, and tutoring tools, while universities must ensure that such technologies are integrated ethically, pedagogically, and with sufficient human support [11,12,13]. The results add that these expectations are not purely technological: students also attach considerable importance to teacher availability, emotional support, practical learning opportunities, and platform designs that strengthen rather than replace human academic interaction.

4.1. Policy and Managerial Implications

For higher-education policy makers and institutional leaders in the V4 region, the results point to a coherent package of capacity-responsive measures. First, institutions should prioritise investment in academic staff and student-facing support roles, such as counselling, study advising, tutoring, and learning design, alongside digital infrastructure, because capacity is not merely a budgetary constraint but a determinant of teacher availability and the perceived quality of support [2,26]. Second, workload and administrative burden should be reduced through streamlined processes, more transparent workload allocation, and practical support for teaching innovation (e.g., instructional design assistance), to protect time for consultation, feedback, and high-impact teaching practices that students experience as meaningful [2]. Third, mental-health and well-being provision should be expanded in a way that is visible, accessible, and integrated with academic guidance, as European comparative evidence indicates that student well-being has become a systemic higher-education issue requiring coordinated institutional responses rather than ad hoc services [9]. Fourth, universities should institutionalise cooperation frameworks with employers to scale internships, applied projects, and practice-based modules, supported by clear quality standards, adequate supervision capacity, and equitable access mechanisms across fields of study [5]. Finally, mobility opportunities should be scaled while reducing barriers—financial, informational, and administrative—so that mobility policies explicitly address access inequalities through targeted support and simplified procedures [29].

4.2. Limitations

Several limitations should be acknowledged. First, the study relies on self-reported perceptions, which may be influenced by respondents’ current experiences, expectations and response styles. Second, the research design is cross-sectional; therefore, associations and subgroup differences should not be interpreted as causal relationships, and temporal ordering cannot be verified [25]. Third, the study used a non-probability convenience sampling strategy, and a precise response rate could not be calculated because the questionnaire was circulated through open recruitment channels rather than a closed sampling frame. As a result, the findings should not be interpreted as statistically representative population estimates for all Czech university students. Fourth, although the sample size is substantial (N = 819), generalisability beyond the Czech context may be bounded by national institutional characteristics and the composition of the respondent pool, including field of study, institution type and age structure. Fifth, the reliability, content-validation, normality and exploratory factor checks strengthen the methodological grounding of the domain-level interpretation, but they do not replace confirmatory validation in independent samples or direct cross-generational comparison. The Shapiro–Wilk tests indicated deviations from normality, which is expected for Likert-type variables; therefore, the Pearson correlations were interpreted cautiously and checked against Spearman rank correlations. Finally, the practical orientation and mobility domain should be interpreted with caution because its internal consistency is lower, reflecting its deliberately broad substantive coverage.

4.3. Future Research Agenda

Future research can strengthen explanatory power and policy usefulness in three directions. First, it would be valuable to test mediation models that reflect the structural interpretation suggested by the present correlations—for example, capacity conditions → teacher availability → perceived emotional support/well-being—using structural equation modelling or path analysis on validated multi-item constructs [23]. Second, comparative designs across the V4 region (or across institution types) could identify whether the same capacity–support mechanisms hold under different funding regimes, governance structures, and student compositions [2,26]. Third, longitudinal or repeated cross-sectional data would allow researchers to examine whether digital transformation initiatives and staffing policies measurably shift student perceptions over time, and whether improvements are distributed equitably across student groups [9].
In sum, the findings indicate that Czech Generation Z students appreciate digitalisation and teaching innovation yet experience notable constraints in support and capacity-related conditions. The policy implication is straightforward: sustainable quality improvements require a balanced strategy that pairs educational-platform modernisation with investment in human capacity, workload-sensitive governance, robust student support, and inclusive access to practice-based learning and mobility.

Funding

This research received no external funding.

Institutional Review Board Statement

Ethical review and approval were not required for this study because the research consisted of an anonymous, non-interventional questionnaire survey, did not collect identifiable or sensitive personal data, and involved no experimental manipulation or foreseeable risk beyond ordinary participation in an educational survey. The relevant institutional body at Mendel University in Brno is the Human Research Ethics Committee. This statement is based on the institutional guidance of Mendel University in Brno, including the webpage “Ethics Committees—Human Research Ethics Committee”, Institute for Scientific Information, Mendel University in Brno, available at https://uvis.mendelu.cz/en/ethics-committee (accessed on 22 May 2026), and “Rector’s Directive No. 01/2024—Statutes and Rules of Procedure of the Human Subject Research Ethics Committee”, available at https://mendelu.cz/en/employee/documents/rectors-directive/ (accessed on 22 May 2026). The institutional guidance states that the informed-consent template is not necessary in the case of anonymous questionnaires. The study was conducted in accordance with the Declaration of Helsinki. Participants were informed about the purpose of the research, anonymity, voluntary participation, data use, and the absence of foreseeable risks before completing the questionnaire.

Informed Consent Statement

Informed consent for participation was obtained electronically from all subjects involved in the study prior to their participation in the questionnaire survey. Participants confirmed that they had read the study information and voluntarily agreed to participate before submitting their responses.

Data Availability Statement

The anonymised data supporting the reported results are available from the corresponding author upon reasonable request. The data are not publicly available because the questionnaire responses were collected under consent and confidentiality conditions that did not include public archiving of the raw dataset.

Acknowledgments

During the preparation of this manuscript, the author used ChatGPT, OpenAI, GPT-5.5 Thinking, for language proofreading, stylistic editing, and assistance with editorial revisions. The tool was not used for study design, data collection, statistical analysis, or interpretation of the results. The author has reviewed and edited the output and takes full responsibility for the content of this publication.

Conflicts of Interest

The author declares no conflicts of interest.

Appendix A. Instrument Structure, Focal Correlation Items, Respondent Profile, Reliability, Descriptive Validation, and Subgroup Results

Table A1. Domain structure of the questionnaire (38 Likert-type statements; 1 = strongly disagree, 5 = strongly agree).
Domain (Index)Thematic Focus (Brief)No. of Items (k)
Digitalisation and technologyDigital tools, infrastructure, perceived contribution of technology to learning quality8
Innovation in teachingInnovative pedagogies, competence-oriented learning, engagement-enhancing formats9
Practical orientation and mobilityWork-related learning, employer cooperation, internships, international mobility7
Support and well-beingAcademic guidance, psychosocial support, perceived adequacy of well-being services3
Capacity constraints and infrastructureStaffing capacity, workload/time scarcity, perceived limitations in student-facing provision11
Note: Domain scores were computed as the arithmetic mean of items within each domain. All 38 items were complete in the analytical sample; therefore, no missing-data thresholding or imputation was applied.
Item mapping (questionnaire order, items 1–38): Digitalisation and technology (items 2, 5–7, 12, 15, 24–25); Innovation in teaching (items 1, 3, 8–10, 13–14, 16–17); Practical orientation and mobility (items 4, 11, 21–23, 26, 35); Support and well-being (items 18, 36, 38); Capacity constraints and infrastructure (items 19–20, 27–34, 37).
Table A2. Focal items used in the association analysis (Pearson r).
CodeConstructShort LabelItem Wording (Exact Questionnaire Wording; Czech)
STRCapacity adequacyStudent–teacher ratio„Počet studentů připadajících na vyučujícího v mých kurzech je přiměřený pro získání dostatečné pozornosti a podpory.”
AVAILAcademic accessTeacher availability„Cítím, že moji vyučující mají dost času na zodpovězení otázek studentů a poskytnutí podpory mimo hodiny.”
EMORelational supportEmotional support„Cítím se emocionálně podporován a chápaný personálem a fakultou mé univerzity.”
Note: Correlations were interpreted as associations, not causal effects. Pearson r is reported as the primary summary measure. Coefficients are based on the analytical sample (N = 819) with two-tailed p-values (α = 0.05).
Table A3. Respondent profile (analytical sample N = 819).
CharacteristicCategoriesn%
GenderFemale54566.5
Male26131.9
Prefer not to say121.5
Other/unclear entry10.1
Level of studyBachelor’s74891.3
Master’s516.2
Other/unclear entry202.4
Field of study (collapsed categories)Economics & business43352.9
Humanities & social sciences19423.7
Security/criminology809.8
Natural sciences506.1
Engineering & technology212.6
Other fields415.0
Institution typePrivate university42251.5
Public university39748.5
Age (years; grouped)≤2044754.6
21–2422127.0
25–29425.1
≥3010813.2
Missing/invalid10.1
Notes: Percentages may not sum to 100 due to rounding. “Other fields” aggregates small categories (education, health/medical, agriculture/forestry, hospitality/tourism, and miscellaneous entries). One age entry was missing/invalid; one birth-year entry was recoded into the corresponding age group for subgroup analysis.
Table A4. Internal consistency of the five thematic domains.
DomainNo. of Items (k)Cronbach’s AlphaInterpretation
Digitalisation and technology80.69Acceptable for descriptive aggregation
Innovation in teaching90.70Acceptable for descriptive aggregation
Practical orientation and mobility70.55Lower; interpreted cautiously due to heterogeneous content
Support and well-being30.66Acceptable given the short three-item domain
Capacity constraints and infrastructure110.72Acceptable; strongest domain-level coherence
Note: Cronbach’s alpha was calculated using the analytical sample of 819 respondents. The coefficients are interpreted as supportive evidence for descriptive aggregation, not as confirmatory proof of latent construct validity.
Table A5. Domain means by respondent subgroup.
Grouping VariableCategorynDigitalisationInnovationPractice/MobilitySupport/Well-BeingCapacity/Infrastructure
GenderFemale5453.893.683.913.403.37
GenderMale2613.923.653.863.403.32
Level of studyBachelor’s7483.893.673.893.413.35
Level of studyMaster’s513.993.643.923.313.31
Field of studyEconomics/business4333.953.643.893.343.40
Field of studyHumanities/social sci.1943.913.763.883.503.30
Field of studySecurity/criminology803.893.773.953.433.23
Field of studyNatural sciences503.643.493.863.473.41
Field of studyEngineering/technology213.803.633.953.513.32
Field of studyOther fields413.753.653.813.403.35
Institution typePrivate4223.933.773.903.483.33
Institution typePublic3973.883.573.883.313.38
Age group≤204473.873.643.933.383.40
Age group21–242213.913.633.843.283.38
Age group25–29423.943.803.883.613.29
Age group≥301083.973.843.843.643.16
Note: Values represent mean domain scores on a five-point scale. Categories with very small or unclear responses were excluded from inferential subgroup comparisons where appropriate. Age-group comparisons exclude one missing/invalid age entry; one birth-year entry was recoded as age 23 for grouping purposes.
Table A6. Parametric subgroup test summary for domain scores.
Capacity/Infrastructure pSupport/Well-Being pPractice/Mobility pInnovation pDigitalisation pTestGrouping Variable
0.1820.9740.1030.2750.417Welch t-testGender
0.5290.3630.6440.6550.274Welch t-testLevel of study
0.0230.0680.592<0.001<0.001one-way ANOVAField of study
0.133<0.0010.524<0.0010.135Welch t-testInstitution type
<0.001<0.0010.043<0.0010.271one-way ANOVAAge group
Note: p-values refer to Welch t-tests for two-group comparisons and one-way ANOVA for multi-group comparisons. Significant differences at p < 0.05 were observed mainly for field of study, institution type, and age group. Effect sizes were small to moderate and are therefore interpreted cautiously.

References

  1. European Commission. European Strategy for Universities; COM (2022) 16 Final; European Commission: Brussels, Belgium, 2022; Available online: https://eur-lex.europa.eu/legal-content/EN/TXT/?uri=CELEX%3A52022DC0016 (accessed on 22 May 2026).
  2. European University Association. Trends 2024: European Higher Education Institutions in Times of Transition; European University Association: Brussels, Belgium, 2024; Available online: https://www.eua.eu/images/publications/Publication_PDFs/Trends_2024.pdf (accessed on 22 May 2026).
  3. European Commission. European Skills Agenda for Sustainable Competitiveness, Social Fairness and Resilience; COM (2020) 274 Final; European Commission: Brussels, Belgium, 2020; Available online: https://eur-lex.europa.eu/legal-content/EN/TXT/?uri=CELEX%3A52020DC0274 (accessed on 22 May 2026).
  4. World Economic Forum. The Future of Jobs Report 2025; World Economic Forum: Geneva, Switzerland, 2025; Available online: https://www.weforum.org/reports/the-future-of-jobs-report-2025/ (accessed on 22 May 2026).
  5. OECD. Education at a Glance 2024: OECD Indicators; OECD Publishing: Paris, France, 2024; Available online: https://www.oecd.org/en/publications/education-at-a-glance-2024_c00cad36-en.html (accessed on 22 May 2026).
  6. Vuorikari, R.; Kluzer, S.; Punie, Y. DigComp 2.2: The Digital Competence Framework for Citizens; Publications Office of the European Union: Luxembourg, 2022. [Google Scholar] [CrossRef] [PubMed]
  7. European Commission. Digital Education Action Plan 2021–2027. Available online: https://education.ec.europa.eu/focus-topics/digital-education/actions (accessed on 22 May 2026).
  8. Twenge, J.M. iGen: Why Today’s Super-Connected Kids Are Growing Up Less Rebellious, More Tolerant, Less Happy—And Completely Unprepared for Adulthood; Atria Books: New York, NY, USA, 2017. [Google Scholar]
  9. Cuppen, J.; Muja, A.; Geurts, R. Well-Being and Mental Health Among Students in European Higher Education. In EUROSTUDENT 8 Topical Module Report; EUROSTUDENT: Hanover, Germany, 2024; Available online: https://www.eurostudent.eu/download_files/documents/TM_wellbeing_mentalhealth.pdf (accessed on 22 May 2026).
  10. Chardonnens, S. Adapting educational practices for Generation Z: Integrating metacognitive strategies and artificial intelligence. Front. Educ. 2025, 10, 1504726. [Google Scholar] [CrossRef] [Scilit]
  11. Miao, F.; Shiohira, K.; Lao, N. AI Competency Framework for Students; UNESCO: Paris, France, 2024; Available online: https://www.unesco.org/en/articles/ai-competency-framework-students (accessed on 22 May 2026).
  12. Miao, F.; Cukurova, M. AI Competency Framework for Teachers; UNESCO: Paris, France, 2024; Available online: https://www.unesco.org/en/uuid/node/ab2e2aae-3d01-4472-bccc-a2266c9212e2 (accessed on 22 May 2026).
  13. UNESCO. Guidance for Generative AI in Education and Research; UNESCO: Paris, France, 2023; Available online: https://unesdoc.unesco.org/search?query=Guidance%20for%20generative%20AI%20in%20education%20and%20research (accessed on 22 May 2026).
  14. Astin, A.W. Student involvement: A developmental theory for higher education. J. Coll. Stud. Pers. 1984, 25, 297–308. [Google Scholar]
  15. Kahu, E.R. Framing student engagement in higher education. Stud. High. Educ. 2013, 38, 758–773. [Google Scholar] [CrossRef] [Scilit]
  16. Tinto, V. Leaving College: Rethinking the Causes and Cures of Student Attrition, 2nd ed.; University of Chicago Press: Chicago, IL, USA, 1993. [Google Scholar]
  17. Keyes, C.L.M. The mental health continuum: From languishing to flourishing in life. J. Health Soc. Behav. 2002, 43, 207–222. [Google Scholar] [CrossRef] [Scilit]
  18. Dodge, R.; Daly, A.P.; Huyton, J.; Sanders, L.D. The challenge of defining wellbeing. Int. J. Wellbeing 2012, 2, 222–235. [Google Scholar] [CrossRef] [Scilit]
  19. Jamieson, S. Likert scales: How to (ab)use them. Med. Educ. 2004, 38, 1217–1218. [Google Scholar] [CrossRef] [Scilit] [PubMed]
  20. Norman, G. Likert scales, levels of measurement and the “laws” of statistics. Adv. Health Sci. Educ. Theory Pract. 2010, 15, 625–632. [Google Scholar] [CrossRef] [Scilit] [PubMed]
  21. Carifio, J.; Perla, R. Resolving the 50-year debate around using and misusing Likert scales. Med. Educ. 2008, 42, 1150–1152. [Google Scholar] [CrossRef] [Scilit] [PubMed]
  22. Haynes, S.N.; Richard, D.C.S.; Kubany, E.S. Content validity in psychological assessment: A functional approach to concepts and methods. Psychol. Assess. 1995, 7, 238–247. [Google Scholar] [CrossRef]
  23. DeVellis, R.F. Scale Development: Theory and Applications, 4th ed.; SAGE Publications: Thousand Oaks, CA, USA, 2017. [Google Scholar]
  24. Boone, H.N., Jr.; Boone, D.A. Analyzing Likert data. J. Ext. 2012, 50, 48. [Google Scholar] [CrossRef] [Scilit]
  25. Schober, P.; Boer, C.; Schwarte, L.A. Correlation coefficients: Appropriate use and interpretation. Anesth. Analg. 2018, 126, 1763–1768. [Google Scholar] [CrossRef] [Scilit] [PubMed]
  26. European Commission/EACEA/Eurydice. The European Higher Education Area in 2024: Bologna Process Implementation Report—Learning and Teaching; Publications Office of the European Union: Luxembourg, 2024; Available online: https://eurydice.eacea.ec.europa.eu/publications/european-higher-education-area-2024-bologna-process-implementation-report-learning-and-teaching (accessed on 22 May 2026).
  27. European University Association. Digitally Enhanced Learning and Teaching in European Higher Education Institutions; European University Association: Brussels, Belgium, 2021; Available online: https://www.eua.eu/publications/reports/digitally-enhanced-learning-and-teaching-in-european-higher-education-institutions.html (accessed on 22 May 2026).
  28. Mattanah, J.; Holt, L.; Feinn, R.; Bowley, O.; Marszalek, K.; Albert, E.; Abduljalil, M.; Daramola, D.; Gim, J.; Visalli, T.; et al. Faculty-student rapport, student engagement, and approaches to learning. Curr. Psychol. 2024, 43, 23505–23516. [Google Scholar] [CrossRef] [Scilit]
  29. European Commission/EACEA/Eurydice. Mobility Scoreboard: Higher Education Background Report 2022/2023; Publications Office of the European Union: Luxembourg, 2023; Available online: https://eurydice.eacea.ec.europa.eu/publications/mobility-scoreboard-higher-education-background-report-2022-2023 (accessed on 22 May 2026).
  30. Wilson Fadiji, A. Student wellbeing and academic support in higher education. Front. Educ. 2024, 9, 1119110. [Google Scholar] [CrossRef] [Scilit]
  31. Massy, W.F. Life on the Wired Campus: How Information Technology Is Transforming Higher Education; Jossey-Bass: San Francisco, CA, USA, 2002. [Google Scholar]
  32. Hsu, J.L.; Rowland-Goldsmith, M.; Schwartz, E.B. Student motivations and barriers toward online and in-person office hours in STEM courses. CBE—Life Sci. Educ. 2022, 21, ar68. [Google Scholar] [CrossRef] [Scilit] [PubMed]
Figure 1. Correlation between capacity conditions and perceived support. Source: Author’s calculations.
Platforms 04 00013 g001
Table 1. Descriptive statistics of thematic domain scores.
DimensionnMMdnSDRangeSkew.Kurt.
Digitalisation/technology8193.903.880.481.88–5.00−0.380.34
Innovation/teaching8193.673.670.452.00–5.000.020.40
Practice/mobility8193.893.860.422.71–5.000.01−0.08
Support/well-being8193.403.330.651.00–5.00−0.230.88
Capacity/infrastructure8193.363.360.471.73–4.910.220.53
Source: Author’s calculations based on survey of 819 respondents. Skew. = skewness; Kurt. = excess kurtosis.
Disclaimer/Publisher’s Note: The statements, opinions and data contained in all publications are solely those of the individual author(s) and contributor(s) and not of MDPI and/or the editor(s). MDPI and/or the editor(s) disclaim responsibility for any injury to people or property resulting from any ideas, methods, instructions or products referred to in the content.