Article

A Decision Support Framework for Industry 5.0 Based on Sovereign Data Sharing and Human-Centric Approaches


by
Alexandros Nizamis
1,2,*,
Thanasis Kotsiopoulos
1,
Thanasis Vafeiadis
1,
Dimosthenis Ioannidis
1,
Panagiotis Gkonis
2 and
Panagiotis Trakadas
3
1
Information Technologies Institute, Centre for Research and Technology Hellas, 6th Km Charilaou-Thermi Road, 57001 Thessaloniki, Greece
2
Department of Digital Industry Technologies, National and Kapodistrian University of Athens, 34400 Psachna Euboea, Greece
3
Department of Port Management and Shipping, National and Kapodistrian University of Athens, 34400 Psachna Euboea, Greece
*
Author to whom correspondence should be addressed.
Platforms 2026, 4(3), 14; https://doi.org/10.3390/platforms4030014
Submission received: 10 April 2026 / Revised: 18 June 2026 / Accepted: 6 July 2026 / Published: 20 July 2026

Abstract

In the complex landscape of Industry 5.0, traditional management systems for smart manufacturing struggle to harmonize high-speed production with the rapid integration of AI and digital technologies. Crucially, these legacy frameworks often fail to capture tacit human knowledge or ensure trustworthy AI and trusted sharing of sensitive industrial data. This paper proposes a novel Decision Support Framework (DSF) that addresses these challenges through a multi-layered approach. At its core, the framework utilizes Data Spaces to enable secure, sovereign data sharing, ensuring that organizations maintain control over their assets. To handle the inherent ambiguity of industrial data, the system employs fuzzy logic and DAG-based root-cause-oriented investigation to provide robust recommendations, helping users distinguish descriptive correlations from plausible structural dependencies that require expert validation. Furthermore, the framework integrates eXplainable AI (XAI) services and AI-driven visual analytics, transforming complex algorithmic outputs into transparent, intuitive insights. By synthesizing data sovereignty with interpretable machine intelligence, this framework empowers trusted data sharing and human-centric decision-making, providing an advanced platform for achieving operational excellence within the Industry 5.0 vision. The proposed DSF is validated in three different pilot cases with end-users to be a milk industry, an automotive supplier and a machine manufacturer.

1. Introduction

The transition from Industry 4.0 to Industry 5.0 [1] represents a shift from full automation to a more human-centric, sustainable and environmentally friendly approach of digitized industrial processes and smart manufacturing applications [2]. Industry 4.0 mainly integrated Internet of Things (IoT) and big data to optimize production and support decision making, but it often relegated the human worker to a peripheral role, merely notifying them of decisions to be taken. Industry 5.0 seeks to rectify this by positioning humans, sustainability, and resilience at the core of the industrial process. Therefore, the challenges are no longer just digitization and automation but how AI-enabled industrial platforms can work collaboratively with human experts and how they can handle industrial data shared among companies and systems across value chains to enable resilient and sustainable manufacturing solutions.
Key components (or even integrated platforms) to support the transition to Industry 5.0 are considered the modern Decision Support Systems (DSSs) [3]. A DSS is able to provide monitoring services, AI-enabled analytics, alerts, and suggestions to its users regarding various factory processes [4] aiming to support its users in decision making. However, the efficacy of a DSS in the modern, multi-stakeholder manufacturing processes (including supply chain) is frequently limited by data silos where valuable information remains trapped within individual organizations due to a lack of trust and digital sovereignty. In addition, the ICT companies that develop platforms like DSSs have to handle the different connectivity and data access mechanisms from their customers (like factories) and deploy new instances of specific data connectors customized to their customers’ requirements. While previous approaches [5] supported enterprise data exchange and recent Industry 4.0 initiatives [6] leveraged the Asset Administration Shell (AAS) [7] to enhance data interoperability, these solutions have not been widely adopted in the DSS platforms. Moreover, the emergence of concepts to enable sovereign data sharing such as data spaces [8] offers a transformative solution to the aforementioned limitations for the manufacturing domain. By utilizing standardized protocols, data spaces ensure that participants retain full control and governance over their data, enabling secure, cross-organizational sharing that was previously impossible. However, as highlighted by recent studies [9], data spaces were mainly used to support scenarios for collaborator discovery or to enable the delivery of analytics and/or monitoring solutions between a data provider, like a factory, and a company which provides that service. Therefore, data spaces’ potential for the delivery of DSS that can handle industrial data in a common, interoperable and sovereign way is not fully unlocked.
Yet, providing a DSS which supports sovereign data sharing, is only one dimension of the multi-faceted challenge for industrial transition. For a system like the DSS to be truly human-centric [10], its outputs must be interpretable and its logic must be open to refinement. Ethical and human-centric AI [11], explainable AI (XAI) [12] and human-knowledge injection [13] are considered among the cornerstones to enable the delivery of human-centric industrial systems. The XAI approaches convert complex algorithmic black boxes into transparent insights for humans to promote ethical and trustworthy AI. Simultaneously, the inclusion of human feedback in a DSS allows the system to learn from the nuanced, intuitive expertise of the workers, ensuring that it evolves in alignment with human values and practical site constraints.
This research proposes an integrated Decision Support Framework designed for the Industry 5.0 era as part of EC funded project named knowlEdge [14,15]. It describes a fully operational decision support platform that offers key DSS functionalities such as recommendations, analytics and visualizations and addresses two specific gaps in current DSS approaches for manufacturing: (i) the delivery of a DSS that can take advantage of data spaces concept to ensure the data sovereignty of its user/customers and (ii) the integration of XAI services and human-feedback injection to DSS. Therefore, by bridging the gap between data sovereignty and human-centric AI, the proposed Decision Support Framework (DSF) provides a robust and highly efficient framework for industrial decision-making. The current work presents the various services provided by the proposed DSF which is a complete platform that includes data connectors, visualizations and user interfaces, AI models for data analysis, recommendations and alerts, human feedback capturing mechanisms and XAI services. The introduced DSF was tested and validated in three industrial pilots.
The remainder of this paper is organized as follows: Section 2 reviews related work, while Section 3 details the core building blocks of the DSF framework. Section 4 documents the application of DSF within industrial pilot cases and presents preliminary validation results from end-users. Finally, Section 5 concludes the paper and outlines future directions.

2. Related Work

DSSs [4] within the frameworks of Industries 4.0 and 5.0 have become one of the most popular ICT applications mainly based on AI and IoT to provide decision support. Rather than presenting an exhaustive Systematic Literature Review (SLR), the scope of this section is targeted and two-fold: first, it briefly describes the current state of the art in AI-driven Decision Support Systems within manufacturing; second, it establishes a foundational baseline to explicitly position the architectural and functional contributions of our proposed Decision Support Framework. Therefore this section briefly reviews some key examples of DSSs related to manufacturing environments (coming from the last decade’s bibliography, so after 2016) focusing on analytics integration and reasoning, data management, interpretability and explainability aspects as they are the common characteristics with our introduced platform. Although this section is not an SLR, we followed a multi-phase methodology following key phases from the PRISMA methodology [16] to review the literature. Starting from the collection of published articles, we considered both journals and conference proceedings. The search area was restricted to the Scopus and Google Scholar databases, as they are comprehensive and cover a wide range of disciplines. Various search terms were used such as ‘DSS in manufacturing’, ‘DSS in Industry 4.0/5.0’, ‘Decision Support System in Manufacturing or Industry’. Then we screened the papers to remove any duplications and then we filtered them by quickly examining the abstract and key parts of the papers to exclude the ones that are not focused on the manufacturing/industrial domain. Finally, the selected works were studied and short descriptions for each work were extracted to be used in this section along with their mapping with specific characteristics (see Table 1). In [17], a data-driven and simulation-based DSS is introduced for resource allocation in manufacturing systems. The proposed framework combines real production data with discrete-event simulation and multi-objective optimization in order to assess alternative allocation policies under multiple performance criteria. Similarly, refs. [18,19] develop decision support approaches that structure and evaluate alternative operational strategies through analytical modeling and multi-criteria assessment. More specifically, in [18] a decision tree-based DSS is proposed for predictive maintenance, integrating technical condition indicators with economic cost–benefit parameters. In parallel, [19] presents a hybrid DSS for zero defect manufacturing that combines rule-based reasoning with optimization techniques, evaluating production and repair alternatives across multiple KPIs such as cost and resource utilization. From a design-oriented and cognitive analytics perspective, the machine learning-based DSS in [20] supports engineering design by predicting performance implications of alternative configurations and emphasizing interpretability through feature importance analysis and explanatory mechanisms.
The work presented in [21] combines IoT-enabled shop-floor monitoring, Andon-based visual management and simulation modeling to evaluate alternative production configurations using lean metrics such as Overall Equipment Effectiveness (OEE). Refs. [22,23] embed machine learning models with eXplainable AI techniques (e.g., [24], LIME [25]) to support defect prediction and quality improvement, providing root-cause analysis and prescriptive parameter adjustment guidance within modular and interoperable architectures. Moreover, ref. [26] introduces an ontology-enabled Case-Based Reasoning framework that formalizes domain knowledge for manufacturing process selection through semantic representation and similarity-based retrieval, promoting knowledge reuse and decision consistency. Finally, the FAS-XAI methodology presented in [27] proposes a unified analytical pipeline combining fuzzy clustering, supervised prediction and multi-level explainability, ensuring transparency across both segmentation and forecasting stages.
The contributions presented in [28,29,30,31,32] approach Industry 4.0 decision support from technological and organizational perspectives, covering workforce monitoring, predictive maintenance, decentralized architectures, real-time scheduling and supply chain coordination. In [28], Radio Frequency Identification (RFID)-enabled data capture combined with cloud services is utilized to supervise technician activities in a dental production line, where decision-tree analysis provides structured PASS/No Grade (PASS/NG) evaluations to improve operational transparency. The work presented in [29] structures predictive maintenance into distinct development phases supported by layered data infrastructures, facilitating scalable and transferable analytics across factories. Ref. [30] emphasizes decentralized decision-making by aligning strategic, tactical, operational and real-time decisions with horizontal and vertical integration principles. Operational optimization is addressed in [31] through a real-time scheduling DSS that merges ERP data, smart sensing and robotic process automation with a hybrid multibroker–genetic algorithm to manage high-mix low-volume production under dynamic conditions. Finally, ref. [32] targets uncertainty in closed-loop supply chains by integrating fuzzy logic and interpretable decision-tree models to dynamically adjust production plans and maintain inventory balance.
Several recent studies propose DSSs for Industry 4.0 environments with varying methodological approaches. In [33], an IoT- and machine learning-based DSS for predictive maintenance is developed, integrating real-time monitoring and interpretable predictive models. Study [34] presents an energy-aware DSS for flexible shop scheduling using hierarchical optimization to minimize both temporal and energy-related criteria. Ref. [35] introduced a big data-driven Smart Maintenance DSS for cost-optimized asset lifecycle management, while [36] proposes a multi-criteria DSS combining fuzzy Best–Worst Method (BWM) and Multi-Objective Optimization on the basis of Ratio Analysis (MULTIMOORA) for logistics provider selection under uncertainty. Finally, in [37] a collaborative manufacturing DSS within Industry 4.0 ecosystems is designed, integrating big data analytics, simulation and deep learning to support cross-factory optimization and decision-making.
Refs. [38,39] focus on strengthening planning and information-driven decision processes within manufacturing environments through structured data management and analytical forecasting. Specifically, ref. [38] develops a Document Management System (DMS) aligned with Industry 4.0 principles, digitalizing documentation flows via business process management concepts to improve traceability, transparency, and cross-departmental information accessibility, leading to measurable efficiency gains and cost reductions. Complementarily, ref. [39] proposes a demand planning DSS based on open-source forecasting tools, integrating ETS (Error, Trend, Seasonality) and ARIMA (Autoregressive Integrated Moving Average) models to automatically evaluate and select the most accurate prediction method. The system effectively links statistical forecasting outputs with production planning decisions.
In [40], an IoT-enabled DSS is presented that combines lean manufacturing principles with real-time data streams and discrete-event simulation to improve bottleneck identification and production flow optimization under interoperable Industry 4.0 architectures. Similarly, ref. [41] introduces an intelligent information management framework that integrates IoT sensors, probabilistic fault models, and optimization algorithms to support predictive maintenance and shop-floor logistics, delivering actionable recommendations through advanced visualization tools.
Table 1 presents the main features identified in the reviewed studies. It should be noted that the usage of AI/ML was not included in the table as all the DSSs that were studied adopted some type of intelligence to provide optimization, data analysis, recommendations, etc. As it was expected, most of the papers/DSS (83%) provide recommendationsfor actions and consider KPIs showing that performance measurement is an important element in decision support. Visual analytics appear in over than half of the studies (57%) and it is considered a valuable asset towards decision support. However, the use of eXplainable AI (XAI) is limited to 26% of the studies. This shows that explainability and interoperability are still not fully adopted in many existing DSS solutions and more effort is needed towards trustworthy AI that is more human-centric. While the majority of the reviewed studies consider data sharing mechanisms related to IoT, factory systems, etc., no study was detected that considers the adoption of sovereign data sharing based on data spaces concepts and components.

Novelty and Positioning

While existing manufacturing DSSs optimize individual dimensions such as predictive accuracy, real-time scheduling, etc., they fundamentally operate under a specific assumptions. They assume uninhibited, static access to data streams and treat the human worker/operator either as a passive recipient of alerts or a manual data labeler. The proposed DSF breaks away from these legacy boundaries by introducing an architectural paradigm shift across three tightly coupled pillars:
  • Dynamic Data Sovereignty vs. Static Connectivity: Traditional DSS configurations rely on custom, static API endpoints or localized data silos. The DSF replaces this with a Data Space architecture. Novelty arises from embedding strict usage policies—such as autonomous temporal data wiping obligations—directly into the contract negotiation lifecycle of the data ingestion stream.
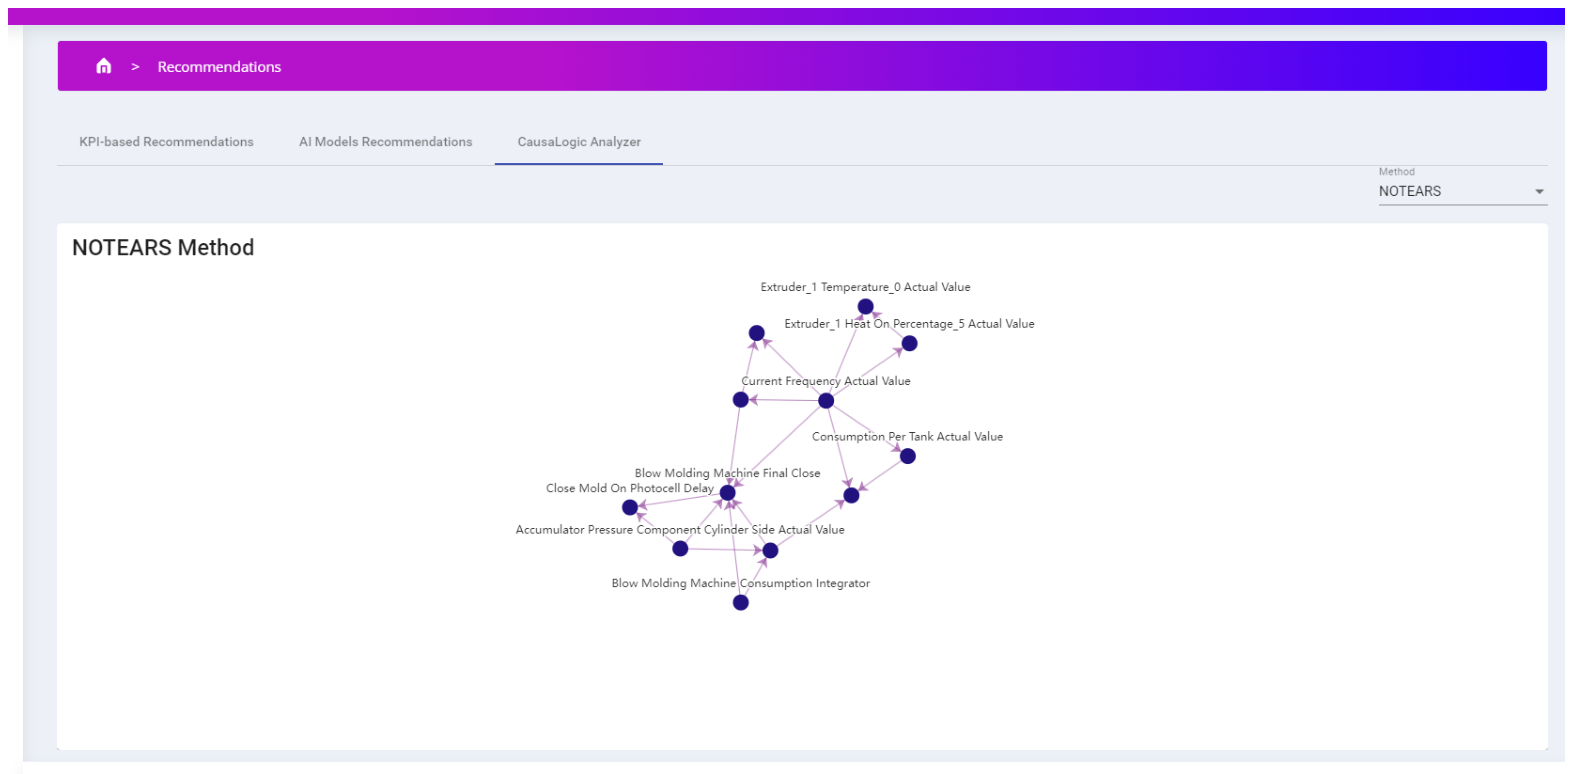
  • Enhanced Explainability through DAG-based Root-cause Hypothesis Support: Current explainable DSS frameworks predominantly apply post hoc interpretability methods, such as SHAP or LIME, to predictive pipelines in order to highlight feature contributions and model behavior. In addition to these methods, the proposed DSF couples fuzzy logic with a DAG-based explanatory layer using Directed Acyclic Graphs and the NOTEARS method. This enables the system to represent candidate structural dependencies among operational variables and to support root-cause-oriented investigation during industrial events. The learned graph is not interpreted as definitive causal proof; rather, it is treated as an explanatory decision-support artefact whose interpretation remains subject to expert validation.
  • Explainability-guided Retraining: Instead of standard human-in-the-loop validation that simply logs user overrides, our human-centric service acts as a closed loop. When concept drift occurs, XAI libraries analyses are dynamically leveraged to prune non-influential variables, driving autonomous, targeted model refinement.
To sum up, our introduced platform for decision support aims to contribute further to current state of the art by integrating the core aspects of modern DSSs such as the adoption of AI, the provision of recommendations and visual analytics. In addition, our approach aims to move a step forward by considering data spaces components for sovereign and trusted data sharing and human-centric functionalities based on provision of human feedback and XAI mechanisms.

3. Decision Support Framework Building Blocks

3.1. Overview

The introduced Decision Support Framework is organized in five interconnected architectural building blocks (see Figure 1) that ensure the realization of a holistic platform for Industry 5.0 decision-making:
1.
Sovereign and Trusted Data Sharingblock provides a series of components that enable the secure and sovereign sharing of industrial data among different industries and the DSF. It is based on Data Spaces concepts and components.
2.
AI Models Repository hosts a series of AI/ML models that are deployed and executed in different case studies where DSF is deployed. AI model outputs supports both recommendation and visualizations by DSF.
3.
Recommendation Engine is the key block to provide decision support through the DSF. It uses AI/ML model outcomes along with specific KPIs by end-users to provide recommendations.
4.
Human-centric Services enable the human-AI collaboration to promote trustworthy AI delivery through the DSF and enhanced AI models that consider the human feedback. In addition, to further promote trustworthiness, XAI mechanisms are incorporated as well.
5.
Visualization Framework is located at the top of all the abovementioned building blocks that are the back-end part of the DSF. The Visulaization Framework is the front-end part of the DSF and the main interfaces for interaction with users. It supports a series of visualization services to further support the users’ decision making.

End-to-End Operational Workflow of the DSF

Although the DSF consists of multiple architectural building blocks, its operation follows a sequential and iterative workflow that connects data acquisition, analytics, recommendation generation, human interpretation, and feedback-driven improvement.
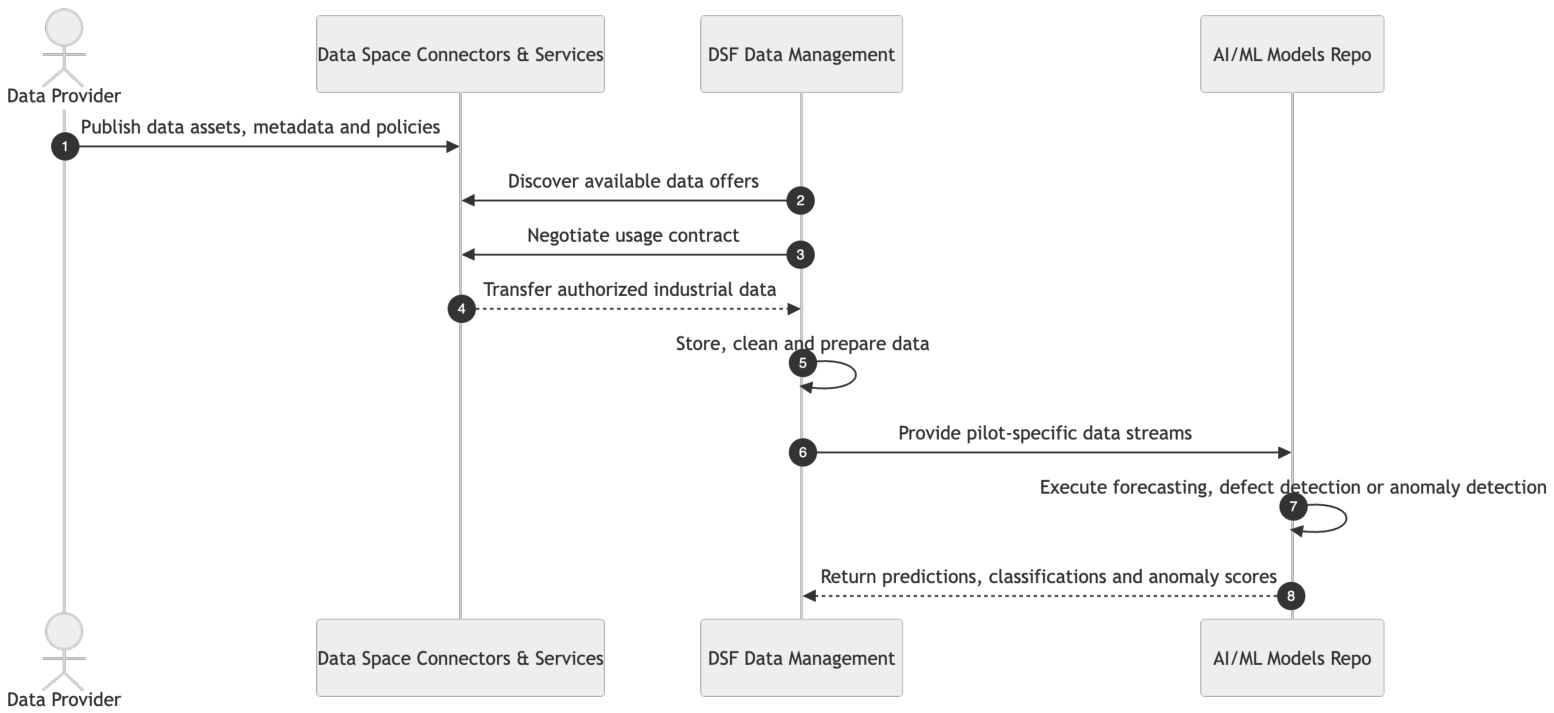
First, industrial end users act as data providers and make operational data available through their data-space connectors, either by publishing selected datasets or by integrating their production sites, machines, and sensors to continuously stream live measurements to the DSF. During this step, each data asset is accompanied by metadata, access conditions, usage policies, and contractual constraints, ensuring that the data provider retains sovereignty and governance over the shared data.
Second, the DSF, also acting as a data consumer, uses data space connectors to discover the available data offers through the data-space catalogue, negotiate the corresponding contract, and initiate the data transfer only when the defined access and usage policies are satisfied. The acquired data are then stored in the DSF data management layer and prepared for downstream analytics according to the requirements of each pilot case.
Third, the AI/ML Models Repository processes the available data streams according to their modality and operational objective. Time-series data are used for production planning and demand forecasting, image data are processed for defect recognition and localization, and multivariate process measurements are analyzed for anomaly detection. The outputs of these models include forecasts, classifications, anomaly scores, defect localizations, and other decision-relevant indicators.
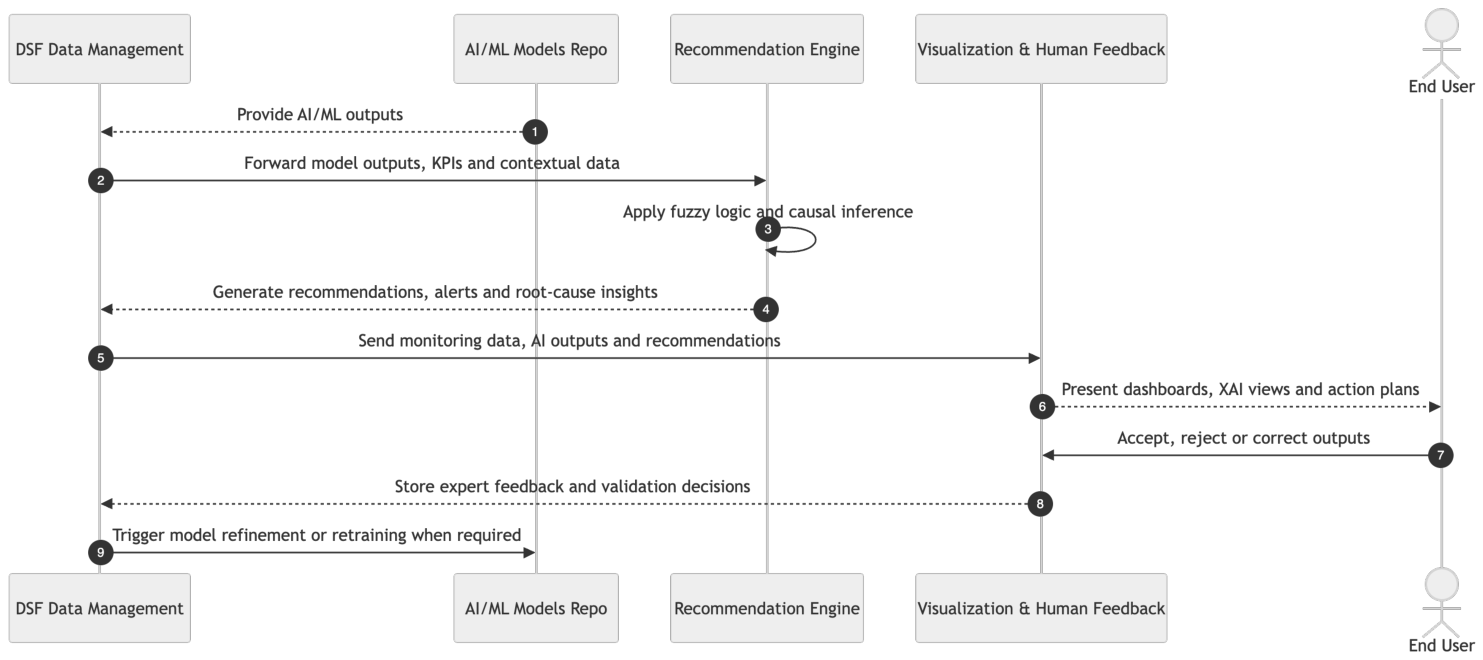
Fourth, these analytical outputs, together with pilot-specific KPIs and user-defined thresholds, are passed to the Recommendation Engine. The engine combines fuzzy logic with a DAG-based explanatory analysis layer in order to transform uncertain or noisy operational evidence into actionable recommendations. Fuzzy logic supports interpretable rule-based reasoning, while the DAG-based layer contributes to the identification of candidate directed dependencies and plausible root-cause hypotheses behind abnormal or suboptimal system behavior, subject to expert validation.
Fifth, the Human-centric Services layer enriches the recommendation process with explainability and expert feedback. XAI mechanisms help users understand why a model produced a specific output, while feedback interfaces allow domain experts to accept, reject, or correct AI-generated results. This feedback is stored and can be used to support model refinement and retraining.
Finally, the Visualization Framework acts as the main interaction layer between the DSF and the end users (the end users are the same actors that act as data providers in Figure 2). It presents live and historical monitoring dashboards, AI analytics, KPI views, XAI explanations, alerts, and recommendations in a unified environment. In this way, the DSF does not operate as a collection of isolated modules, but as an integrated Decision-Support workflow in which sovereign data sharing enables analytics, analytics feed recommendations, recommendations are interpreted and validated by humans, and human feedback supports continuous system improvement.
Figure 2 and Figure 3 illustrate the end-to-end operational sequence of the proposed DSF. The diagrams summarize how industrial data are shared through the data-space layer, consumed and prepared by the DSF, processed by AI/ML analytics, transformed into recommendations, and finally presented to end users through visualization and human-feedback interfaces. Of course, we provide a high-level version of the key interactions among the major DSF components.
The framework was implemented following a microservices-oriented architecture, where the main functional components were packaged as Dockerized services. This design choice facilitated deployment across heterogeneous pilot environments, since each service could be configured, deployed, updated, and maintained independently. It also reduced dependency conflicts between components, improved reproducibility across installations, and enabled a clearer separation between data-space connectors, AI inference services, XAI modules, recommendation services, databases, and visualization components.

3.2. Sovereign and Trusted Data Sharing

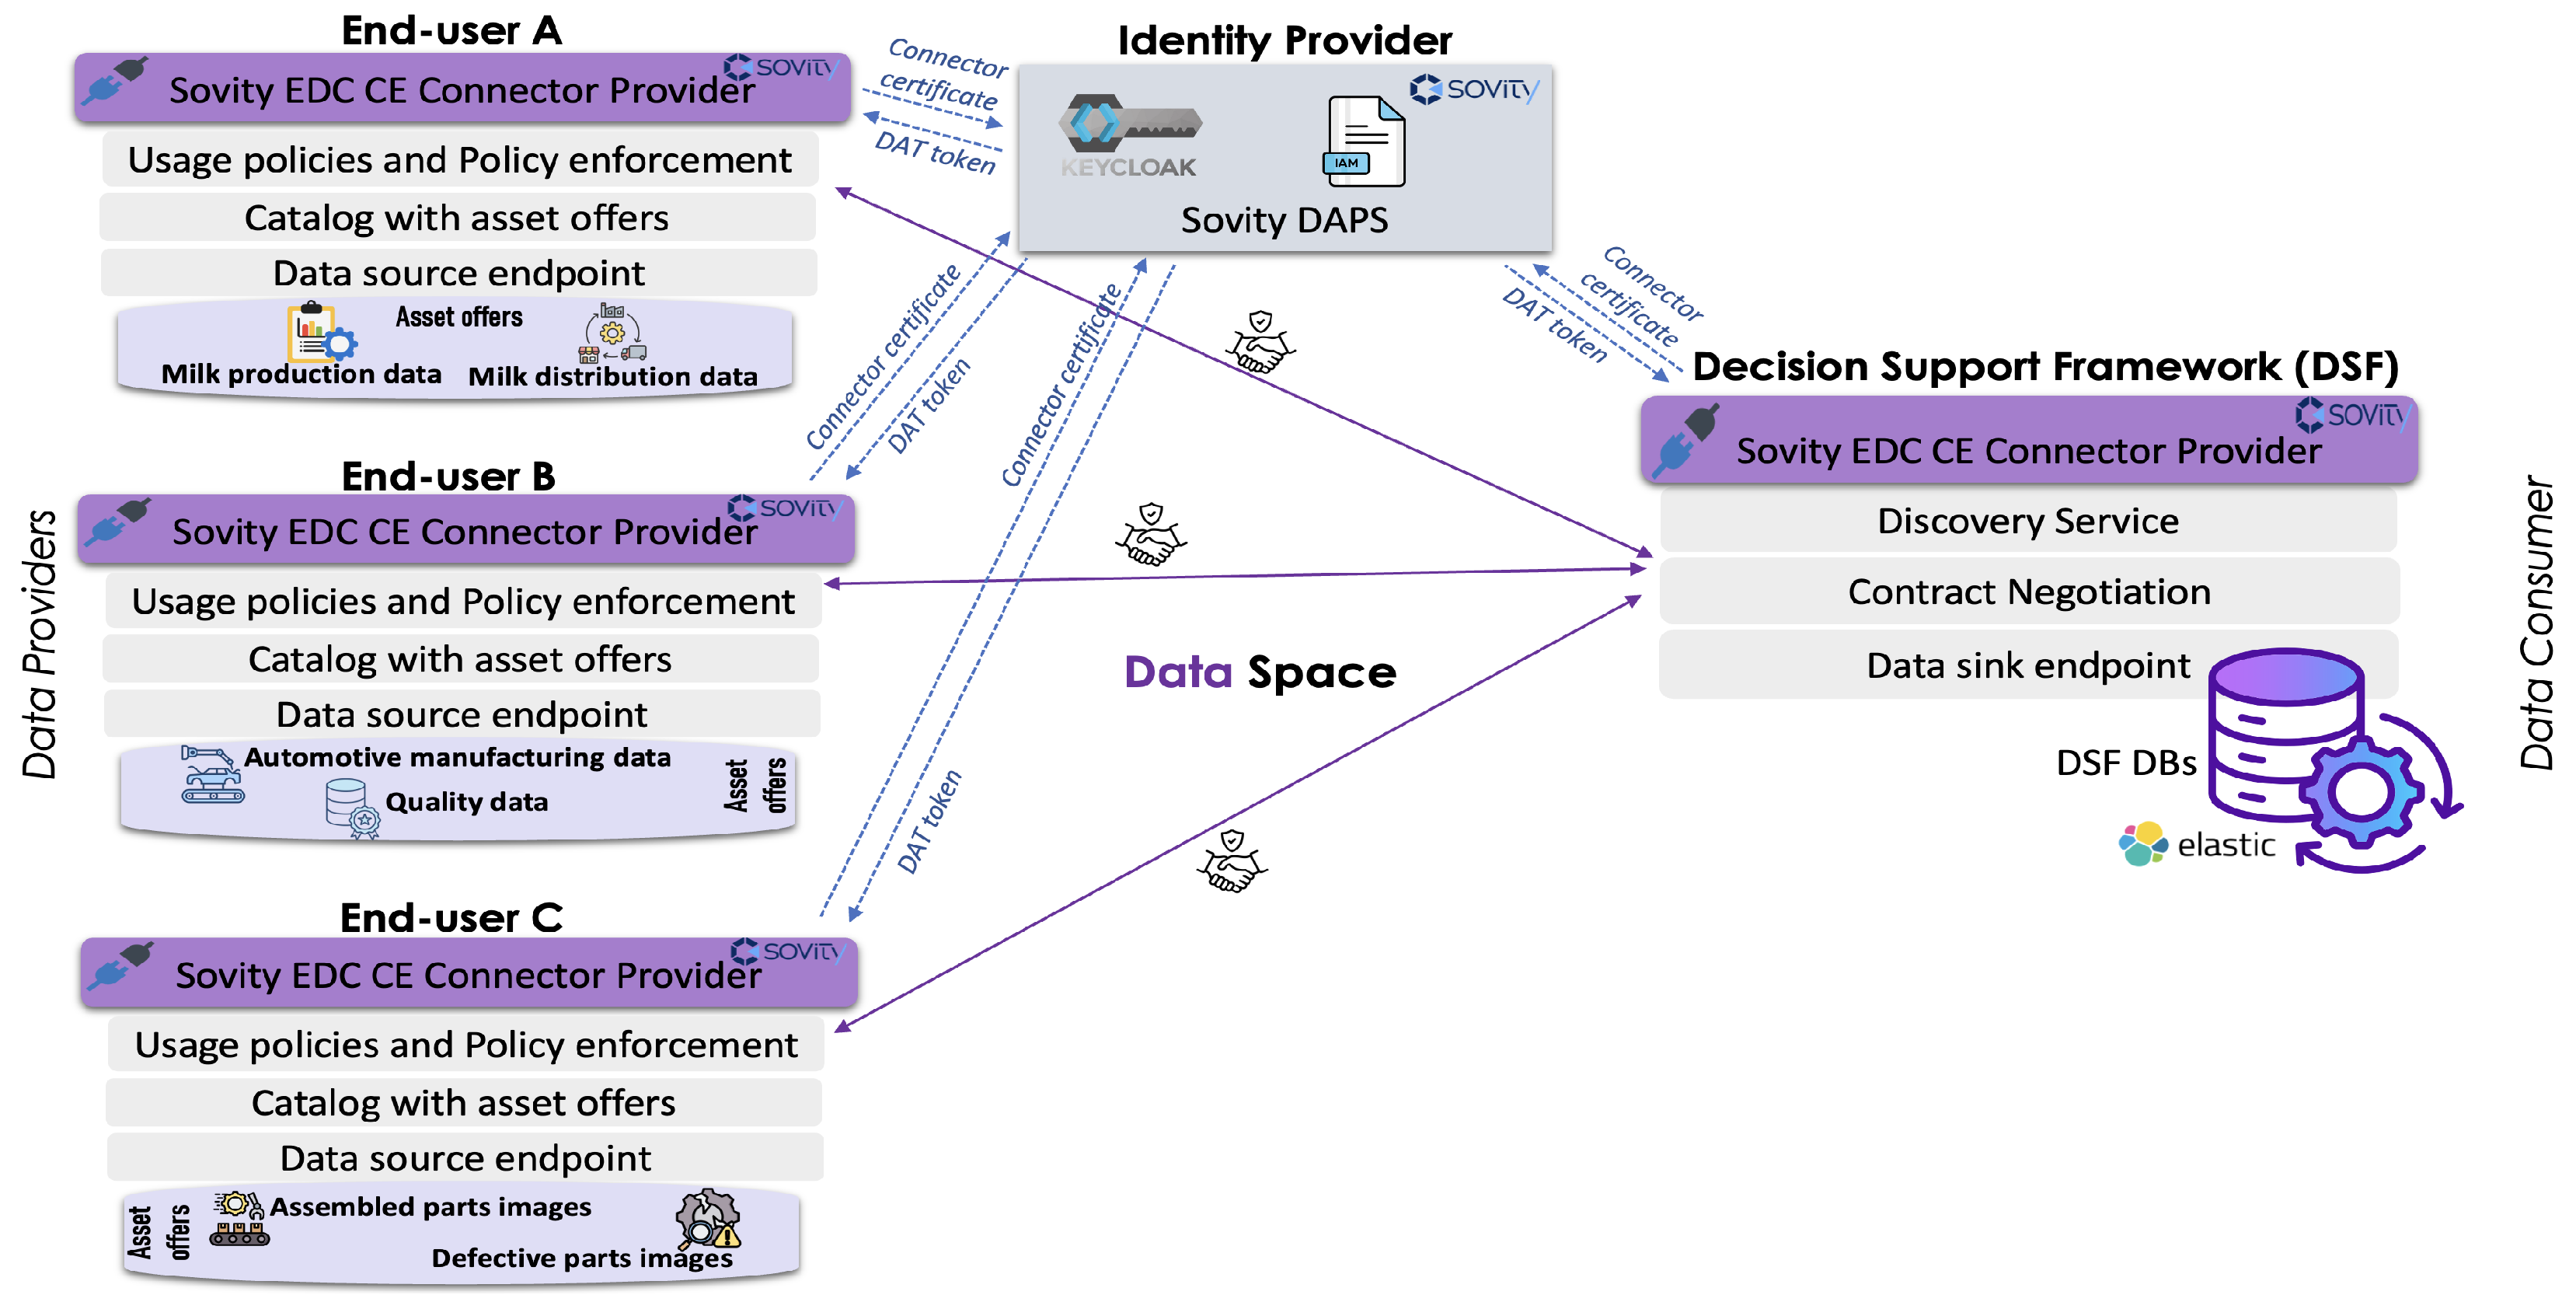
The core data management layer of the proposed DSF is based on data spaces concepts (see Figure 4). It follows data spaces key aspects and roles. Regarding the roles, the DSF is considered as the Data Consumer in the data ecosystem that was created and the end-users of the DSF who share their data are the Data Providers following the Data Space Support Center (DSSC) glossary’s definition [42]. Each data space participant uses a Data Space Connector, more precisely the Sovity version of EDC connector [43]. In general, a connector is a technical component that is run by (or on behalf of) a participant and that provides participant agent services, with similar components run by other data space participants based on DSSC definition.
Regarding the end-users of the DSF who provide the data, they have to use the Sovity connector’s interfaces to create the data assets they want to share. In particular, there are three main steps they have to follow:
  • They have to define a new data asset, including its metadata (name, description, etc.) and the actual source, i.e., endpoint from which the connector can retrieve the data.
  • Then, they have to define specific access and usage policies under which the assets can be consumed and used. For example, an asset can be assessed by a specific ID (connector) and for research purposes only.
  • As the last action, the end-users have to define the contract for the offered data source by binding the asset created in first step with the policies from the second step. Then the data asset is published to the data space as part of the catalog with asset offers by a Data Provider.
By following the abovementioned steps, the end-users were able to publish their data for DSF usage by keeping control and governance over them as they attached to data sources specific data access and usage policies. For the purposes of the current research, the data access and usage policies listed in Table 2 were considered. A similar approach was followed by the three companies as they permitted access only to the DSF data space connector and only for the research purposes (part of EC-funded research project), with no prohibition to any other data connector. In addition, the companies created an obligation for the Consumer (DSF) to delete the local data copy in 30 or 60 days accordingly. Regarding the Data Consumer (DSF) side, to acquire the data shared by end-users/providers, it has to use the same type of data space connector and to execute the following steps:
  • The eligible consumer can discover the available data offers by querying the catalog browser, which lists all offers visible under specific access policies (permissions).
  • After discovering the data offer, the consumer negotiates the offer, declaring that consents to the defined usage conditions and obligations.
  • Following the successful negotiations, the consumer initiates the transfer of the actual data. Upon initiating the transfer, it is automatically verified that a valid contract exists and the corresponding policies are satisfied.
Regarding the Data Storage needs of DSF, Elastic Search database instances were used to store and manage the data sources gathered through the data space connectors. The data were deleted from the local DSF data stores after the specific periods that each end-user had defined in the usage rules through the connectors.
In addition to the connectors and data storages, the Data Space Management Services for the DSF enable the identity and access management of the rest of the components, i.e., the connectors. The services implementation is based on the Sovity DAPS [44], which is premised upon the Keycloak Identity and Access Management service [45], extending it with custom protocol mappers that generate Dynamic Attribute Tokens (DATs). In particular, OAuth 2.0 tokens that authenticate participants and authorize them to access and share data in the data space are issued by Sovity DAPS that serve as the main identity provider. Regarding the DSF implementation, a dedicated DAPS realm created and both end-users (Data Providers) and the DSF (Data Consumer) connectors were registered. Then the connectors acquire DATs to use them to automatically authenticate themselves in the data space. In addition, Gaia-X Digital Digital Clearing House (GXDCH) [46] is used as part of the management services to provide Cryptographically signed Verifiable Credentials based on Self-Descriptions. The DSS as Data Consumer must provide a verification of the deletion action to the GXDCH. Therefore, exactly 30 days after data access, the DSS connector deletes the data and proves it by generating corresponding verifiable credentials and logging them. Then, the Data Providers (the three end-users) can use their data space connectors to pull the evidence credential from the GXDCH. Moreover, regarding the data which is available through the connectors, their metadata is tagged with localized Gaia-X data attribute constraints. The framework’s storage layer uses these tags to map incoming files into temporary, isolated Elasticsearch partitions that are structurally omitted from system-wide snapshot or automated backup policies to further ensure that no copies of the data will be available.
It should be noted that while the underlying primitives of the data space components such as connectors, identity provider, and token registries rely on open-source available software distributions, the architectural innovation of this study resides in the systemic orchestration of these tools as a unified data ingestion backbone for a DSS platform. Rather than utilizing different data connectors, APIs, etc., for isolated, 1-to-1 data exchanges among DSS and a company as seen in current state-of-the-art solutions for DSSs, this setting successfully channels policy-enforced and interoperable industrial streams directly into interconnected AI modeling repositories, fuzzy logic recommenders, and human-centric explanation services. In general, the adoption of Data Spaces enables the DSF customers to keep governance over their data which is really important for sensitive manufacturing data. The rules outlined in Table 2 are deliberately selected to establish a controlled baseline, demonstrating that ODRL policy parameters can be systematically mapped to enforce absolute, automated erasure across the back-end application storage layers. However, further rules could unlock the full potential of a DSS based on data spaces concepts and involve AI models as well. For example, in the case that the end users can add rules that allow AI/ML models which were trained in their data to be used in other cases, then the DSF would be able to apply techniques for knowledge transfer such as Transfer Learning, Federated Learning, etc., and produce better models for various users.

3.3. AI/ML Models Repository

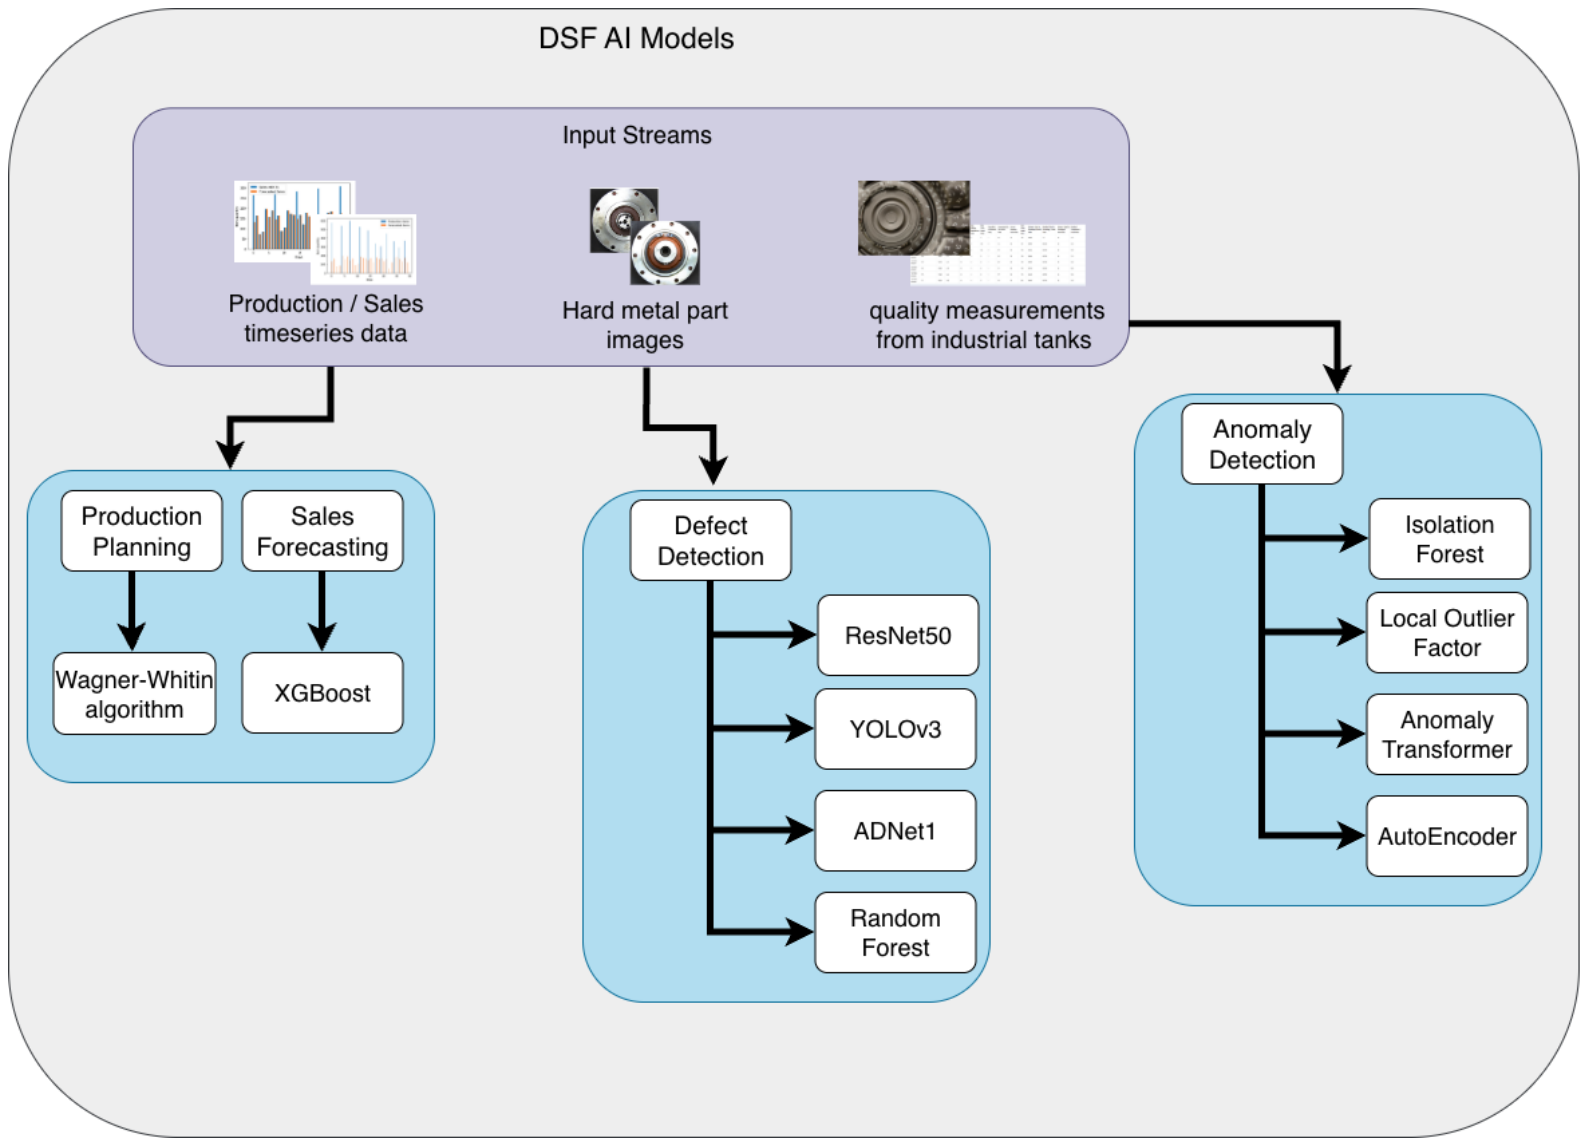
This section presents the AI modeling framework adopted in the DSF. As shown in Figure 5, the framework is structured according to input modality and operational objective, thereby associating each data stream with the analytical or artificial intelligence methods most appropriate for the corresponding industrial task. All the models are represented in ONNX format and are stored in a common models repository based on a Hadoop file system following knowlEdge project specifications [47].
Concretely, Figure 5 summarizes the DSF AI modeling framework as a multimodal decision-support approach that integrates heterogeneous industrial data streams within a unified analytical pipeline. More specifically, the figure distinguishes among three principal input categories (as they come from the data space of the previous section), namely production and sales time-series data, hard-metal part images, and quality measurements acquired from industrial tanks, and maps each of them to a corresponding operational function. Time-series data are linked to production planning and sales forecasting, implemented through the Wagner–Whitin algorithm and XGBoost, respectively, whereas image data are associated with the defect-detection task, for which both DL and conventional ML models are considered, including ResNet50, YOLOv3, ADNet1, and Random Forest. In parallel, process-quality measurements are directed to the anomaly-detection branch, where Isolation Forest, Local Outlier Factor, Anomaly Transformer, and AutoEncoder are employed. In this respect, the figure does not merely enumerate candidate models, rather, it conveys the central design principle of the DSF, namely the allocation of distinct model families to specific data modalities and decision-making requirements.
In the defect-detection branch, different model families are included because they address complementary aspects of visual quality inspection. ResNet50 is used as a deep convolutional feature extractor/classifier for image-level defect recognition, while YOLOv3 is used for object-detection-oriented defect localization, where the objective is not only to classify an image but also to identify the region in which the defect appears. ADNet1 denotes the pilot-specific defect-detection neural architecture considered in the DSF for this use case and is included as an additional deep-learning alternative for visual inspection. In contrast, Random Forest is included as a conventional machine-learning baseline that can operate on engineered visual features or features extracted from images. Its inclusion allows the DSF to compare deep-learning models with a lighter and more interpretable non-deep-learning approach, which can be useful in industrial settings with limited labeled data, lower computational resources, or requirements for simpler model interpretation.
From an analytical standpoint, the architecture depicted in Figure 5 reflects a contemporary industrial-AI perspective in which predictive performance, interpretability, and operational usability must be jointly considered. The use of multiple anomaly-detection approaches highlights the importance of combining supervised and unsupervised learning perspectives with explainability considerations, so that model selection is informed not only by accuracy but also by transparency and practical applicability.
Consequently, the DSF AI model repository may be interpreted as representing an integrated and modular ecosystem in which forecasting, visual quality inspection, and process anomaly monitoring operate in a coordinated manner to enhance production efficiency, product quality, and system resilience.

3.4. Recommendation Engine

This subsection presents the recommendation engine adopted in the DSF, which combines fuzzy logic with a DAG-based explanatory layer for root-cause-oriented investigation. In the proposed framework, this engine is designed to support decision-making under uncertainty by exploiting both rule-based reasoning over imprecise or noisy inputs and graph-based analysis of dependencies among operational variables. More specifically, fuzzy logic contributes a flexible inference mechanism capable of translating expert knowledge and KPI-related inputs into interpretable recommendations, while the DAG-based explanatory layer complements this process by identifying candidate directed dependencies among variables and supporting the formulation of plausible root-cause hypotheses for anomalies or demand fluctuations. In this way, the recommendation engine extends beyond descriptive monitoring and provides a structured and explainable basis for actionable recommendations within the DSF, without treating the learned graph as definitive causal proof.

3.4.1. Fuzzy Logic System

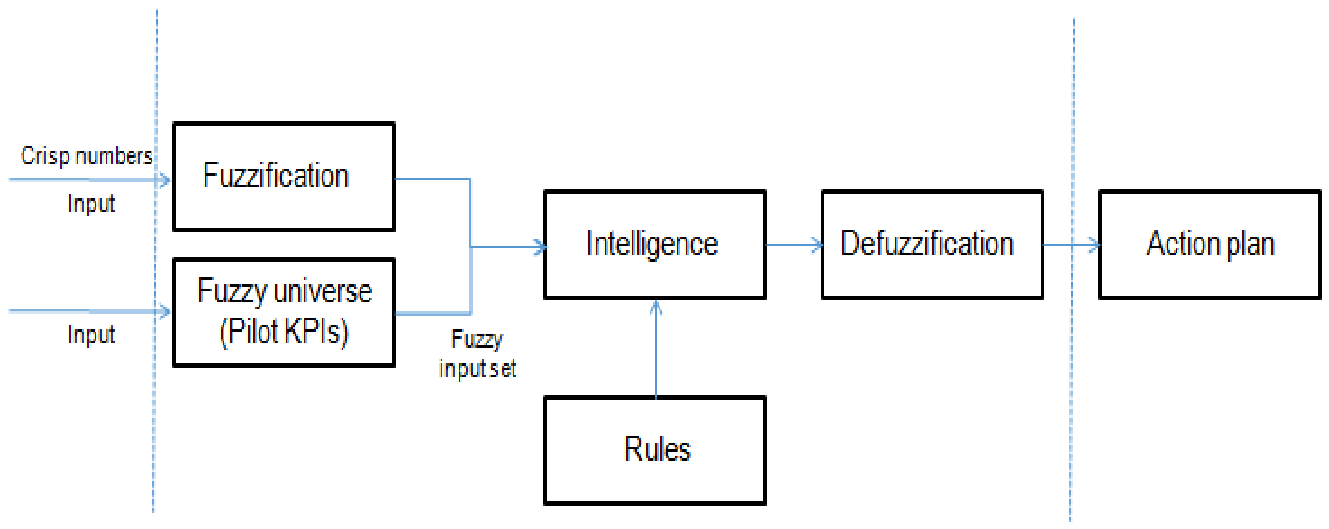
The fuzzy logic component of the recommendation engine is introduced as a mechanism for reasoning under uncertainty and handling imprecise, vague, or noisy information, which is frequently encountered in industrial environments. In the DSF, fuzzy logic is particularly relevant because it enables the incorporation of expert knowledge into the recommendation process through linguistic rules and IF–THEN statements, thereby supporting interpretable decision making. The architecture of the fuzzy logic system comprises four main elements—rule base, fuzzification, inference engine, and defuzzification—which together transform crisp operational inputs into actionable recommendations. This makes fuzzy logic especially suitable for KPI-driven decision support, where exact thresholds are not always available and recommendations must often reflect gradual transitions rather than binary decisions.
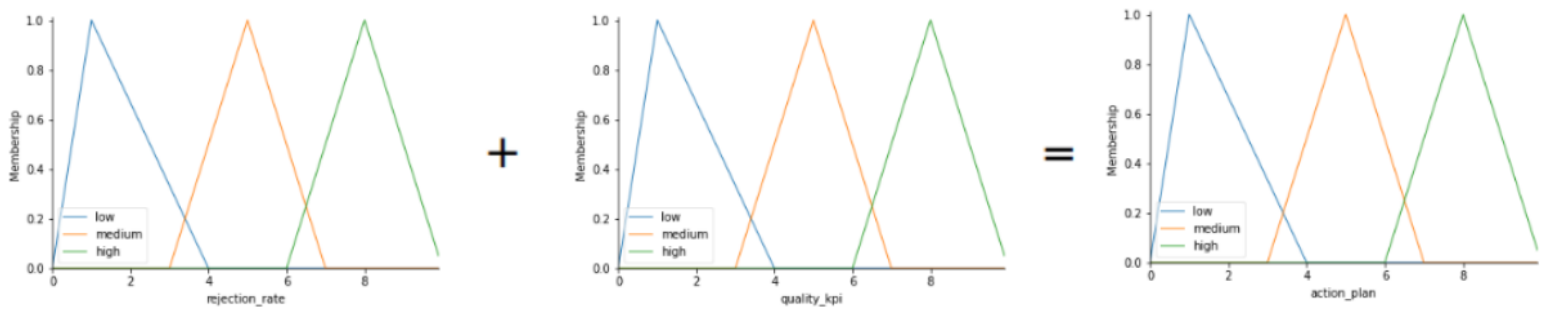
Figure 6 depicts the proposed fuzzy logic system architecture. The pilot KPIs are obtained by the fuzzy logic system, which then suggests action plans based on how well the measured KPIs are measured. The fuzzy logic recommender uses the KPI values as an analytical input and generates action plans based on the fuzzy logic system’s conclusion. For example, a low rejection rate and a high product-quality KPI contribute to a high value of the aggregated Quality variable. Conversely, a high rejection rate contributes to a low value of Quality. Therefore, the raw pilot-specific KPIs are first normalized and fuzzified into the generic Quality variable before being used by the rule base. Figure 7 depicts an example of the fuzzy universes.
  • If rejection_rate is low and quality_kpi is high, then Quality is high.
  • If Quality is high and Models is high, then Action Plan is low.
To clarify the relationship between pilot-specific KPIs and the generic fuzzy variables used in the rule base, the recommender follows a two-level representation. At the first level, raw KPIs are normalized and mapped to generic fuzzy input variables. In particular, Quality summarizes technical and process-quality indicators, while Models summarizes the reliability of the AI/ML models. Therefore, pilot-specific indicators such as rejection_rate and quality_kpi are not used as separate final inputs of the rule base; instead, they contribute to the aggregated Quality variable. Since rejection_rate is a negative KPI, it is inversely mapped to Quality, whereas positive quality indicators are mapped directly. Similarly, model-performance indicators, such as accuracy, recall, F1-score, precision, mAP, confidence, or concept-drift metrics, are mapped to the Models variable (see Table 3).
The Mamdani inference system therefore receives two generic fuzzy inputs, Quality and Models, and produces the fuzzy output Action Plan. Rule activation is performed on the fuzzified input values, the activated consequents are aggregated, and the final output is defuzzified into a crisp action-plan score. For reporting and visualization purposes, this crisp score is then associated with the linguistic action-plan level with the highest membership degree, namely low, medium, or high. The reconstructed rule base in Table 4 covers all nine combinations of the two ternary input variables and avoids duplicated or contradictory antecedents.
Table 4 depicts the fuzzy logic rules for all use cases. The total rules of the inference system are nine. Table 5 presents the operational interpretation of the generated action plans.
For the development of the dedicated fuzzy logic system, the SciKit—Fuzzy package was used [48]. It is a Python computing language library that is a collection of fuzzy logic algorithms used in the SciPy Stack (version 1.17.1). SciPy is a Python-based eco-system of open-source software for mathematics, science, and engineering. This stack can be used to extend the capabilities of ArcGIS (version 3.4) and let anyone interested do scientific computing in Python (version 3.10).

3.4.2. Root-Cause-Oriented Investigation System

The recommendation engine is further enriched with a DAG-based explanatory layer, which supports the exploration of structural dependencies among selected process variables. The objective of this layer is to provide users with an interpretable graph-based representation of how operational variables may influence one another, thereby assisting root-cause-oriented investigation when anomalies, quality deviations, or abnormal KPI values are detected.
In the implemented DSF, the dependency graph is generated using the NOTEARS algorithm during the pilot-specific configuration of the system [49]. NOTEARS formulates the learning of a directed acyclic graph as a continuous optimization problem, estimating a weighted adjacency matrix while enforcing acyclicity. The resulting graph is integrated into the visualization framework, where it is used to present candidate directed dependencies among process variables in a form that can be inspected by domain experts.
This graph-based layer complements the fuzzy recommender by adding structural context to the generated action plans. While fuzzy logic translates KPI and model-performance conditions into interpretable intervention levels, the DAG-based layer helps users investigate which process variables may be associated with the observed behavior. In this way, the DSF combines rule-based recommendation with graph-based explanation, supporting both actionable decision-making and human-centered interpretation.
The interpretation of the learned graph is subject to the standard assumptions and limitations of structure learning from observational industrial data. These include causal sufficiency, the possible presence of unobserved confounders, faithfulness, appropriate temporal ordering, identifiability, sensitivity to preprocessing, variable selection, regularization, thresholding, and measurement noise. Therefore, the DAG is not treated as definitive causal proof but as an explanatory decision-support artefact that highlights plausible structural dependencies and supports expert-driven root-cause hypothesis generation.
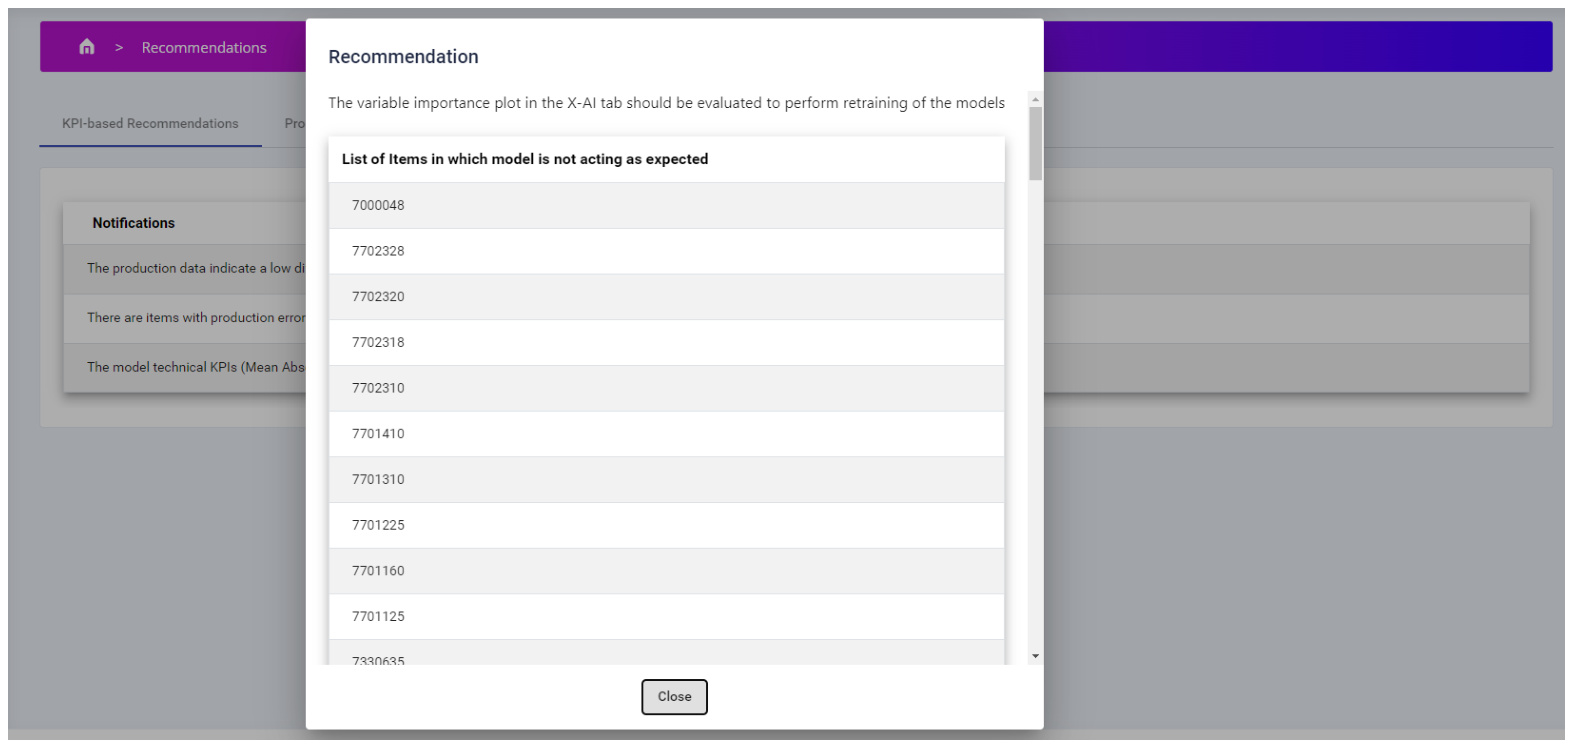
Indicative figures of the DSF’s recommender are presented in Figure 8, Figure 9 and Figure 10.

3.5. Human-Centric Services

The human-centric services of the DSF are designed to place the end user at the center of the decision-making process by combining analytical outputs with interpretable visual support, operational feedback mechanisms, and actionable recommendations. Rather than functioning as a purely automated layer, the framework delivers visualizations, KPI-oriented information, notifications, and suggestions that enable domain experts to assess system behavior in a transparent and context-aware manner based on the funtionalities of the Visualization Framework of the DSF that is presented in the next section. In addition, the outcomes from the AI/ML Models Repository and the Recommendation Engine are incorporated to feed the visulizations that support the end-user. Moreover, dedicated modules in the user interfaces enable end-users to provide feedback on AI results and recommendation and see visual explanations related to AI models’ outcomes. In this respect, the DSF supports a human-centered mode of operation in which process specialists, quality engineers, and other industrial actors are not passive recipients of model outputs, but active participants in the interpretation of AI-driven results.
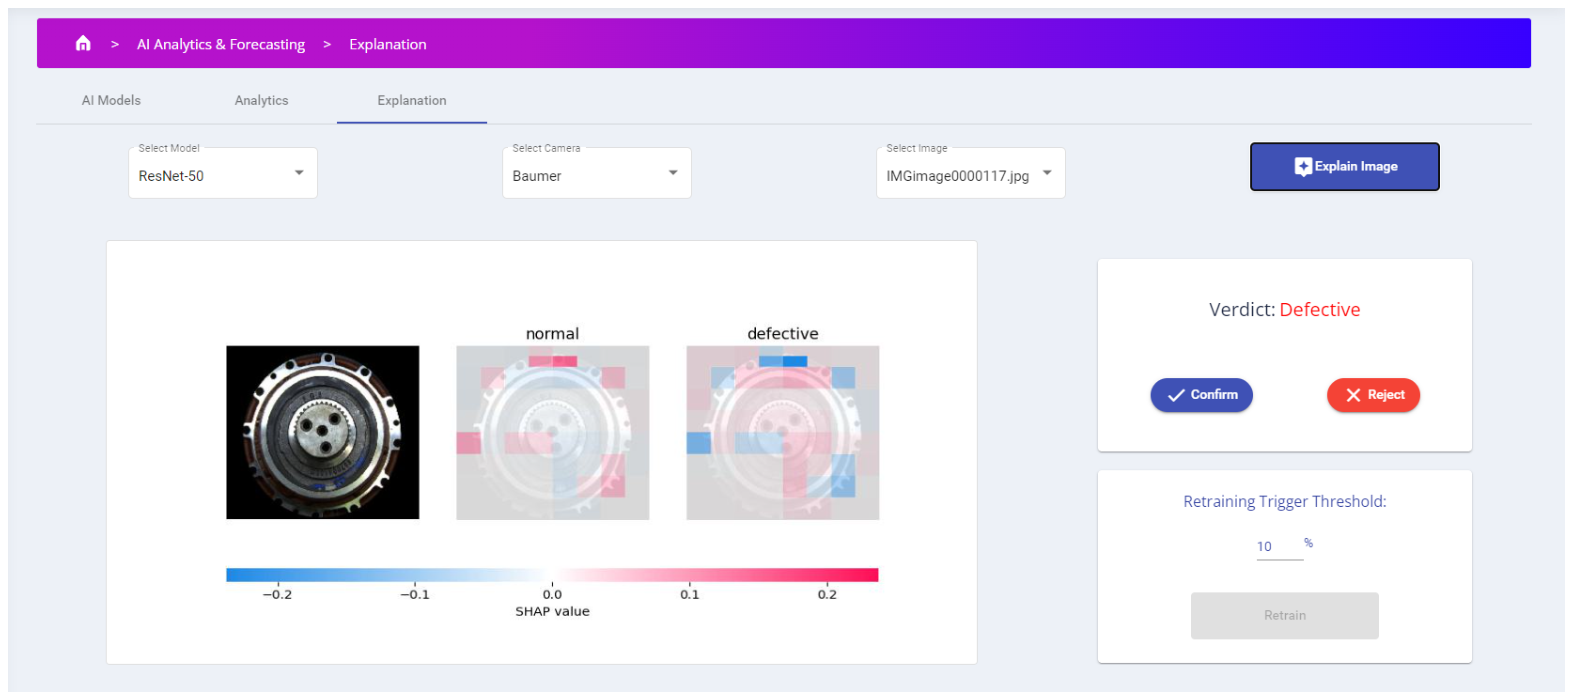
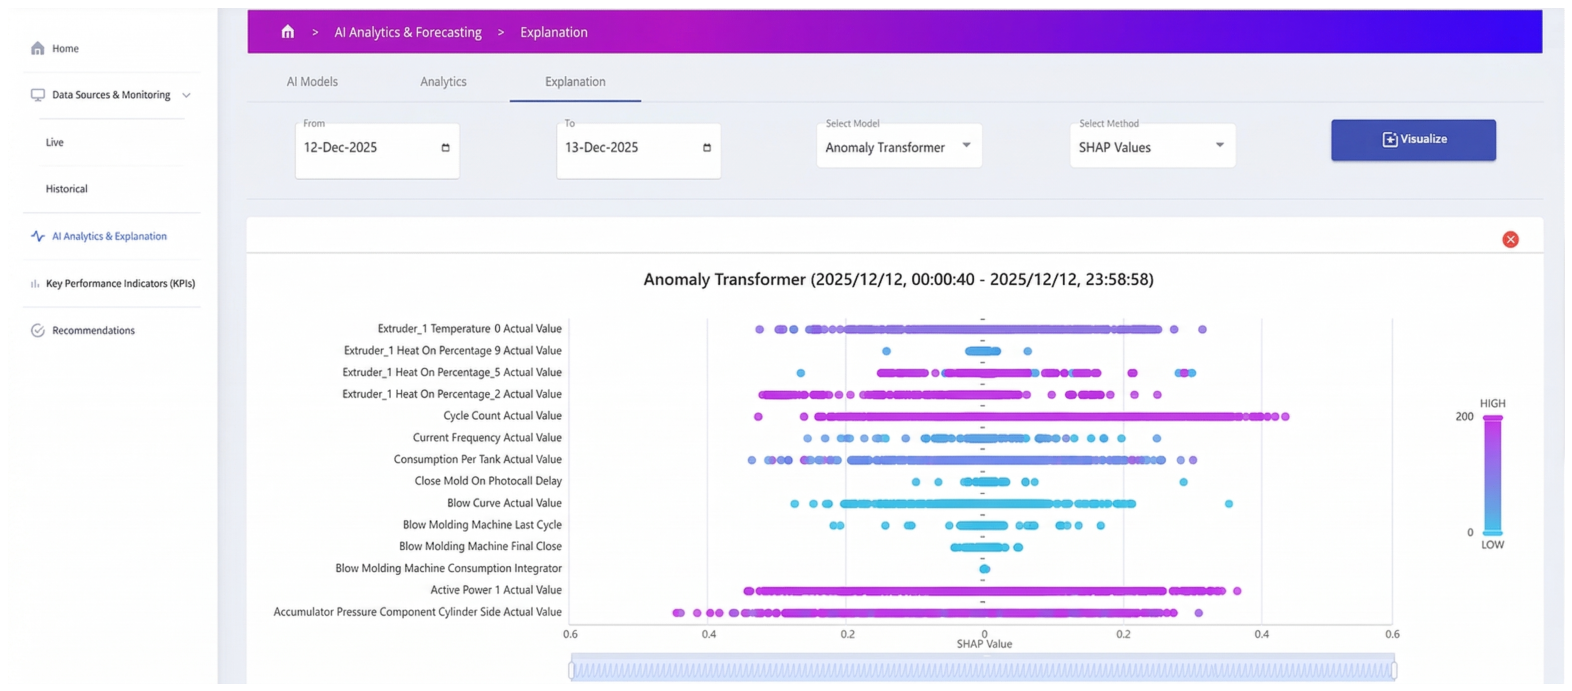
Across the use cases, these human-centric services are realized through explainability dashboards, human-in-the-loop validation interfaces, and retraining mechanisms that allow expert feedback to directly influence system behaviour. In the use case 2 scenario, users can inspect model verdicts and SHAP-based heatmaps (see Figure 11) to verify whether predictions focus on the relevant regions of interest, while a dedicated interaction interface enables the acceptance or rejection of model outputs and supports efficient batch validation of candidate defects. In parallel, the anomaly-detection scenario provides XAI dashboards (see Figure 12) through which process specialists can examine feature importance, identify irregular process changes, and diagnose concept-drift effects before initiating model refinement. More generally, the DSF stores both model verdicts and human decisions, thereby supporting historical analysis and continuous adaptation of the analytical workflow. Taken together, these services define the DSF as a collaborative environment in which explainability, expert supervision, and adaptive retraining are tightly integrated to strengthen the reliability and practical relevance of AI-assisted industrial decision support.

3.6. Visualization Framework

The Visualization Framework was designed to facilitate decision-making by providing intuitive and interactive web-based interfaces. It achieves high efficiency, customizability, and fast development by using modern web technologies.

3.6.1. Technologies and Frameworks Used

The following key technologies and frameworks were used for creating the web-based Visualization Framework of the implemented DSF:
  • Angular [50]: It was selected because it is a free and open-source platform, built using TypeScript, which provides a foundation for building dynamic web applications. Its features promote code organization and maintainability, while also offering a rich set of pre-built functionalities.
  • Bootstrap [51]: This web framework selected to streamline the creation of responsive web interfaces. Unlike Angular, which focuses on building the overall structure of the application, Bootstrap ensures that the interfaces are not only visually appealing but also responsive across different devices and screen sizes, from desktops to mobile phones.
  • Nebular [52]: This open-source Angular UI library provides a collection of pre-designed components specifically designed for building modern admin dashboards. Nebular goes beyond just aesthetics though, offering a theming engine that allows for easy customization. Nebular was a valuable asset for rapidly creating visually appealing and user-friendly interfaces within the DSF.
  • Apache ECharts [53]: This open-source JavaScript library was served as the engine for creating interactive charts and graphs. It offers an extensive library of chart types, from common bar and line charts to more complex visualizations like scatter plots and maps. These charts were easily integrated into DSF web platform and customized to effectively represent the data being analyzed.

3.6.2. Visualization Framework Functionalities

A Visualization Framework is integral to the DSF, providing the necessary interfaces for users to interact with the system. By presenting complex data in a clear and comprehensive way, visualizations enable users to obtain insights and make informed decisions. The visualization framework supports several key functionalities, including live and historical data monitoring, AI analytics, eXplainable AI (XAI) methods, KPI monitoring, and recommendation systems.
  • Live and Historical Data Monitoring:
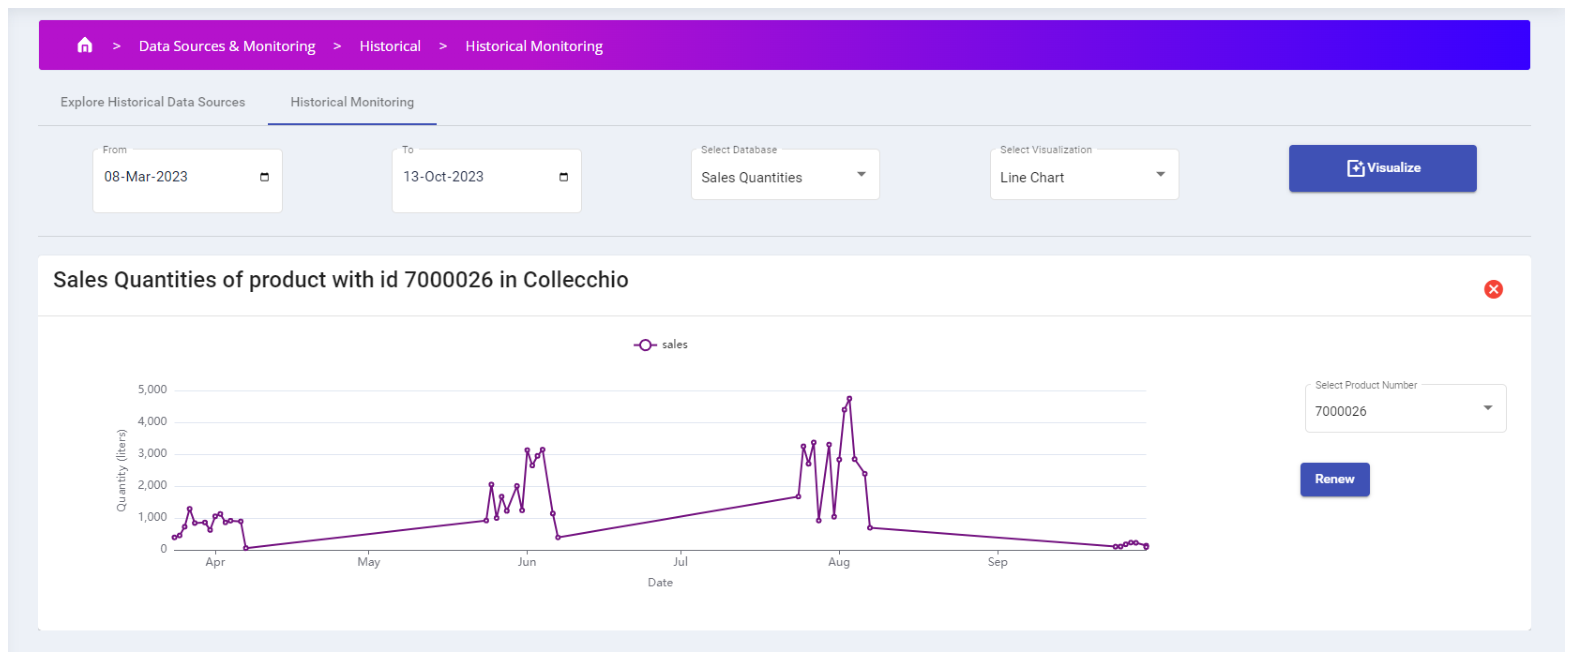
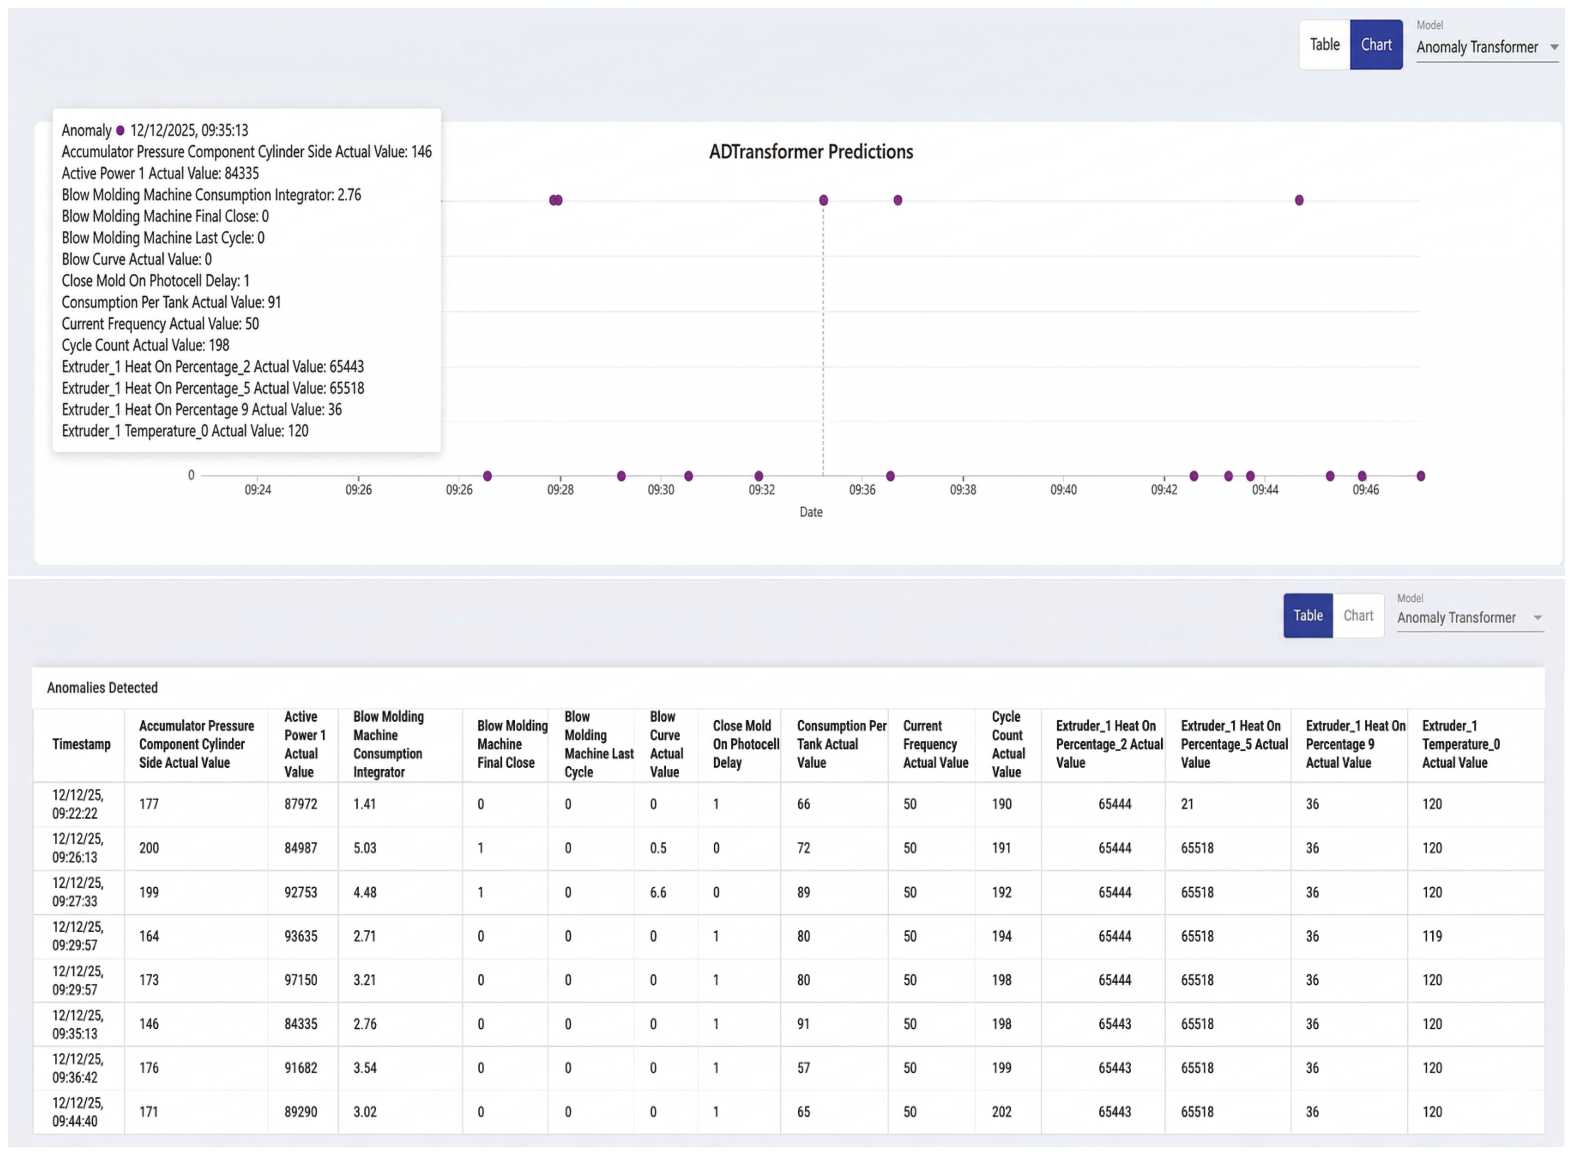
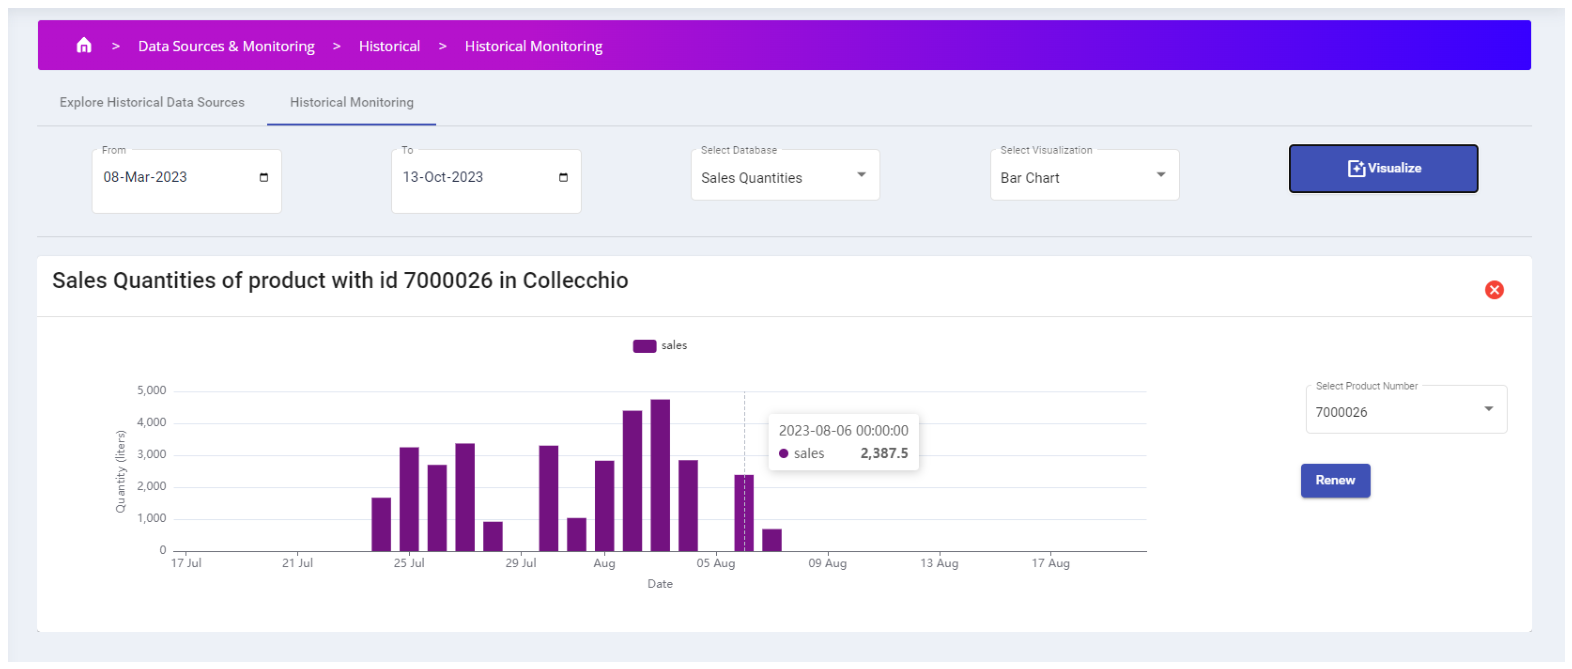
    The Visualization Framework offers dynamic dashboards that support both live and historical data monitoring. Real-time data are displayed through responsive charts, graphs and tables (see corresponding figure in Case Study 3 below), enabling users to observe current trends and make timely decisions. Historical data are presented using time-series plots helping users identify patterns and understand long-term performance (the relevant visualizations are presented in Case Study 1 below). Interactive elements, such as filtering and zooming, allow users to explore data at various levels of detail.
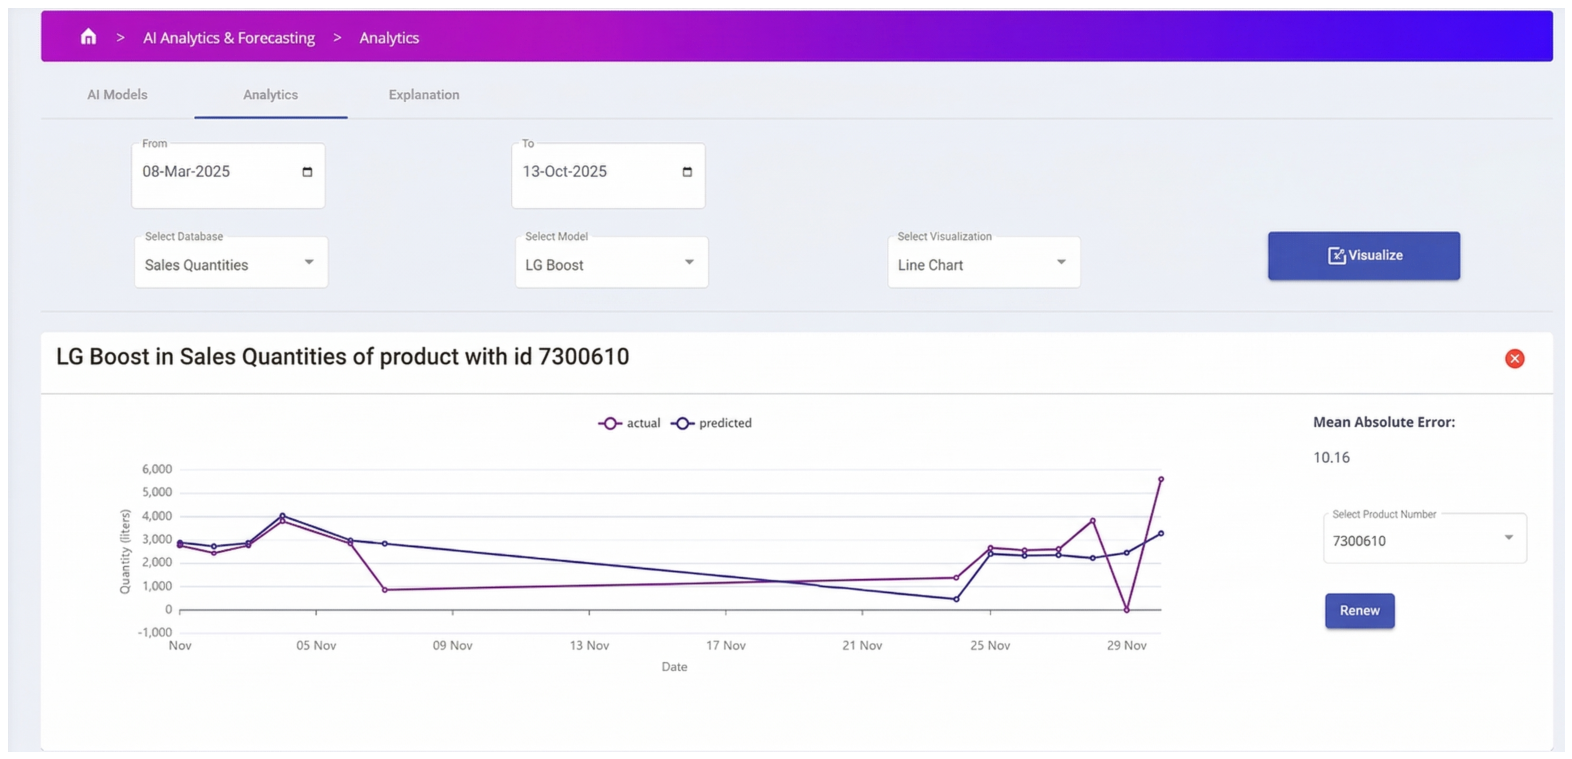
  • AI Analytics: The implemented DSF utilizes advanced AI analytics, with outputs visualized through the framework to facilitate easy interpretation. Predictive models and machine learning algorithms generate results that are depicted using trend lines or images (the relevant visualizations are presented in Case Study 1 below). These visualizations help users to forecast future trends or detect defects.
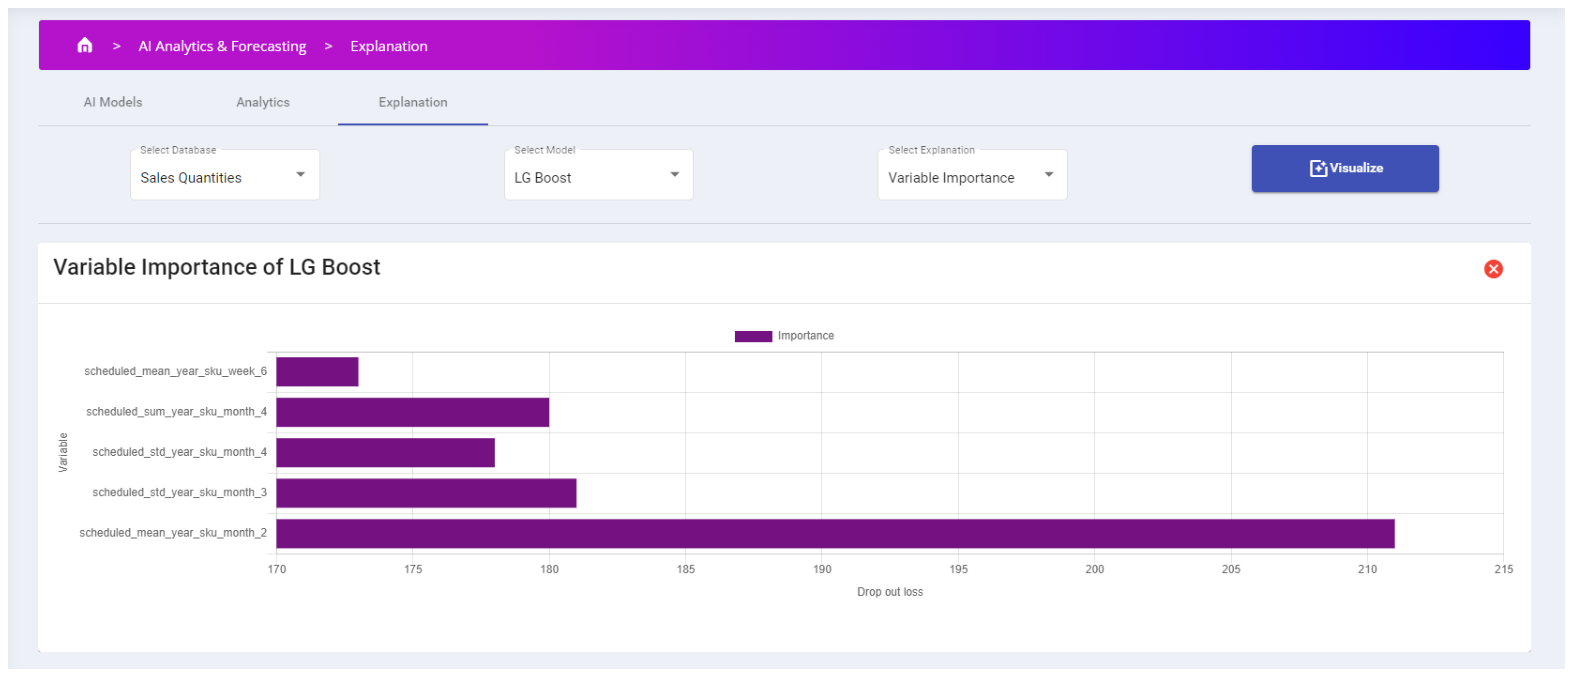
  • Explainable AI (XAI) Methods: The Visualization Framework incorporates eXplainable AI (XAI) methods to ensure the transparency of AI-driven insights. Users can access detailed visual explanations of AI model outputs, such as variable importance charts (see Figure 13), Beeswarm plots (see Figure 12) and image heatmaps (see Figure 11). These visuals enable users to understand the factors that influenced the models’ predictions and help build trust to the AI’s decision-making process.
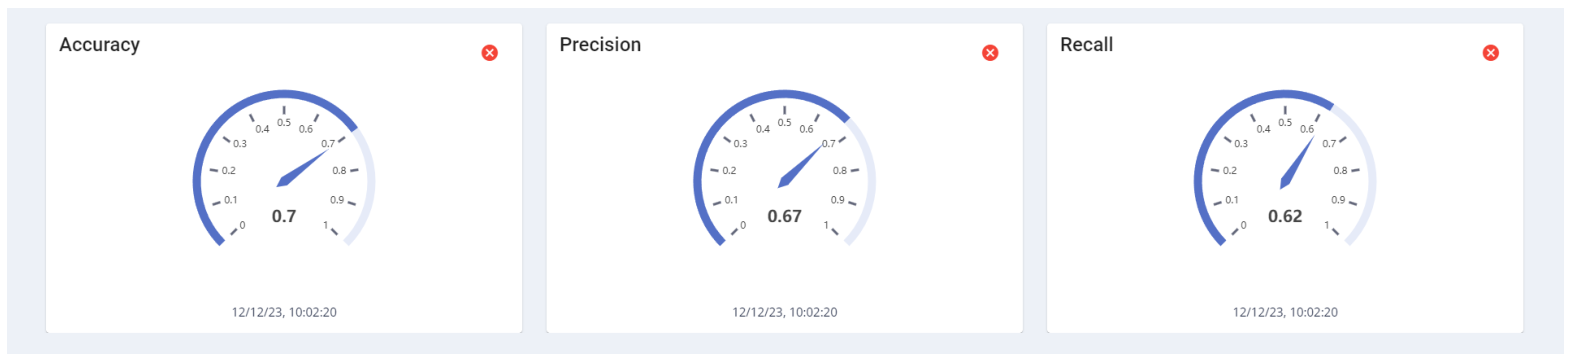
  • Key Performance Indicator (KPI) Monitoring: KPI monitoring is a critical functionality supported by the visualization framework. The developed dashboards display KPIs using gauges (see Figure 14) providing users with a clear and immediate understanding of how the system is performing against established goals.
  • Recommendation Systems: The Visualization Framework within the DSF exhibits versatility by employing various methods to visualize recommendations effectively.
  • Notifications and Fuzzy Logic: A list format is ideal for displaying notifications, each containing a specific recommendation generated by the fuzzy logic system. This approach allows users to quickly scan through available recommendations and prioritize those requiring their attention (see Figure 8).
  • DAG-based Explanatory Relationships: When dealing with recommendations supported by the DAG-based explanatory layer, the framework leverages Directed Acyclic Graphs (DAGs). These visualizations depict candidate directed dependencies among variables, allowing users to inspect plausible structural relationships and formulate root-cause hypotheses for further expert validation. (see Figure 9).
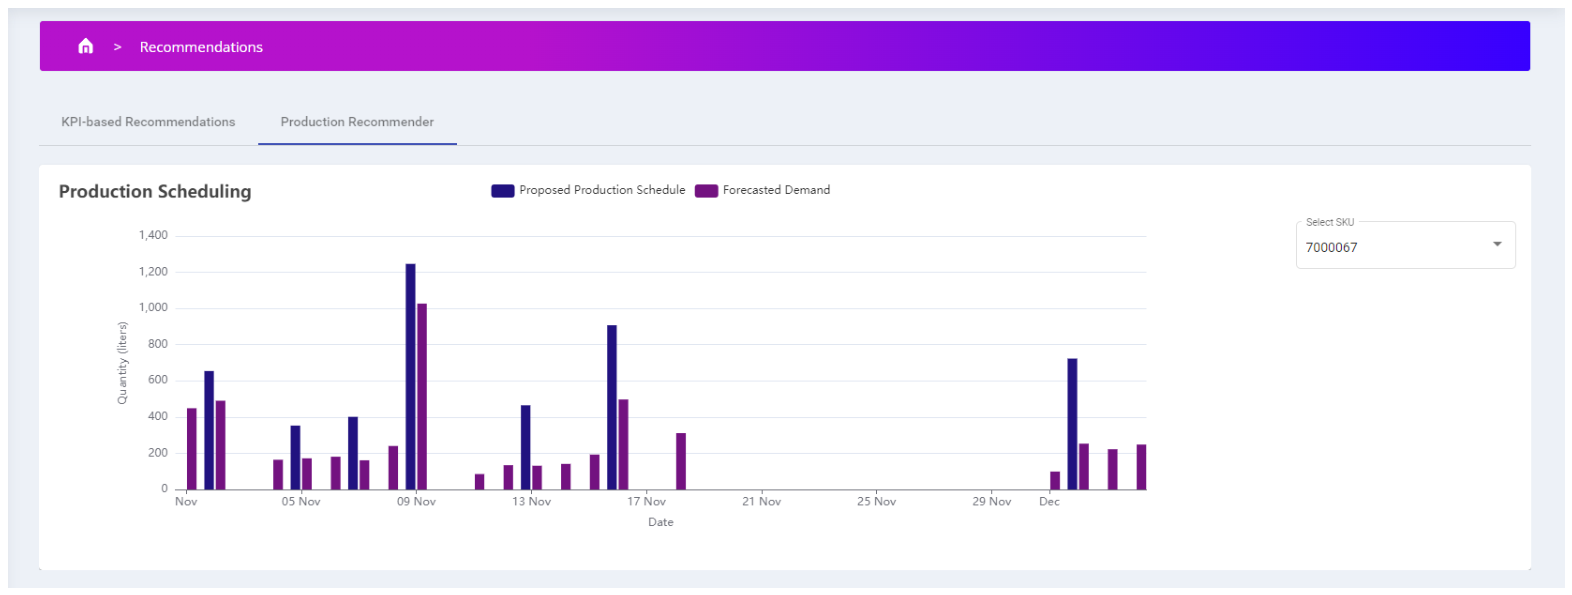
  • Production Scheduling and Bar Charts: For production scheduling recommendations, bar charts excel at visually representing the proposed plan. This format clearly communicates the allocation of resources across a predefined timeline, based on the forecasted demand (see Figure 10).

4. Decision Support Framework in Real World Environments

The primary contribution of this work is at system level as it introduces a platform for decision support in the era of Industry 5.0. Rather than introducing novel isolated machine learning algorithms and components, this manuscript presents a system-level blueprint demonstrating how disparate technologies (specifically AI/ML models, policy-enforced Data Spaces, fuzzy-logic recommendation, DAG-based explanatory analysis, visualizations and web UIs, and XAI workflows) can enable the delivery of a cohesive Industry 5.0 decision platform. The validation presented herein focuses on the DSF application in three different domains. First, its adoption in each domain/use case is presented along with corresponding references to evaluation results regarding the AI/ML models incorporated by DSF in each case. However, as the current work focuses more on the platform perspective the evaluation methodology must shift from pure algorithmic performance to systemic, human-centric viability. Validating a multi-layered platform requires evaluating how domain experts interact with the cohesive flow of the various platform’s aspects. Consequently, our evaluation strategy utilizes a tailored stakeholder questionnaire specifically engineered to capture system-level operational indicators. This platform-centric approach allows us to measure qualitative dimensions—such as software integration, navigation intuitiveness, user-facing onboarding adequacy, and real-world trust in automated explanations—that directly dictate whether a unified digital platform can achieve sustainable, long-term adoption on the shop floor. Of course the small sample of questionnaire’s participants should be considered. Therefore, the evaluation can provide valuable insights but further validation should be considered.
In addition to AI metrics from DSF adoption and users’ validation though the questionnaire which will be presented below, it should be noted that the end-to-end integration of the DSF components introduced significant technical challenges and corresponding platform aspects were benchmarked. Simultaneously orchestrating policy-enforced data space connectors, inference and XAI engines, and client-side visualization frameworks creates a risk of architectural latency bottlenecks that can severely degrade shop-floor responsiveness if not properly used and optimized. To demonstrate that our integrated framework successfully mitigated these synchronization and processing hurdles, various operational metrics were captured across the three real-world pilot cases. In particular, checking the Sovity DAPS and Sovity Connector logs in the three cases they used, the ‘handshake’ (catalog discovery, contract negotiation, and DAPS token verification) required a statistical mean of 1.2 s. The handshake duration was calculated by isolating the specific log outputs of DSF Connector. We captured the exact millisecond timestamps: first we recorded the instant timestamp when the DSF Connector invoked the request API to discover the provider’s data asset and then we recorded the exact millisecond the connector logs a successful contract negotiation and data transfer acceptance. The total duration for a single run was computed using the straightforward difference between end and start time. The reported handshake duration represents the mean value calculated in 80 data transfer negotiations that were executed across a containerized network environment, with a known baseline network latency of 5 ms. In addition, the active data transport latency between the data provider connectors and the local Elasticsearch storage instances was benchmarked. Regarding the multivariate time-series data streams from Case Studies 1 and 3, they completed ingestion in less than 230 ms from the provider to database indexing (based on Elasticsearch metadata). The high-resolution visual inspection image batches (15 MB average per payload) in Case Study 2 recorded a maximum end-to-end transport latency ceiling of 3.1 s. The data transport latency was computed using a timestamp auditing methodology synchronized via Network Time Protocol to eliminate clock drift between nodes. The end-to-end latency delta was calculated as the difference between the internal metadata timestamp (automatically injected upon Elasticsearch database indexing) and the initial millisecond timestamp recorded when the Data Provider Connector dispatched the payload. The reported values represent the upper boundary of these deltas. For Case Studies 1 and 3 the reported value was calculated for 220 payloads and for Case Study 2 it was measured for the transfer of 40 images. Regarding the front-end visualization, it was audited for client-side rendering bottlenecks. We checked the Browser Developer Console (Network and Performance tab) while running DSF Angular-based dashboard to get the UI rendering and ECharts execution speeds. The visualizations, including live time-series bar/line chart updates and SHAP heatmap image overlays, achieved in all cases a Document Object Model (DOM) rendering refresh time of less than 50 ms under concurrent load, which is well below the cognitive threshold for seamless human–machine interaction [54]. The front-end rendering performance was measured using a simple script hooked into the browser’s (Google Chrome) Developer Tools Performance API. The DOM rendering refresh time was defined as the total time the browser spent executing JavaScript code combined with the time it took to visually paint the changes on the screen. In all 43 tested UI interactions, the refresh time was reported under <50 ms as was stated before. However, it should be noted that the testing was conducted on a standard developer workstation (Intel i5 3.00 GHz and 16 MB of RAM) as there was no access to end users’ machines for installing the script that executed the measurements. These system benchmarks serve as indicators that the unified DSF platform is capable of operating with the low latency and high technical robustness required for dynamic industrial environments.

4.1. Case Study 1: Production/Demand Forecasting for Milk Industry

This case study focuses on the production of short shelf-life dairy products such as fresh milk and cream. This production site in Italy operates under strict time constraints, where orders received on a given day must typically be fulfilled within the next day. This “A-for-B” production logic imposes significant challenges in aligning demand, production, and distribution processes along with critical timely production decisions.
The proposed DSF is designed to support data-driven decision-making by integrating data acquisition, processing, and analytical capabilities into a unified workflow. The framework collects and aggregates data from multiple heterogeneous sources, including production systems, inventory databases, and operational logs. These data are pre-processed and transformed into meaningful KPIs, which are used to evaluate the current system state.
Based on this information, the DSF applies predictive models to estimate future demand and system behavior, and subsequently generates alternative decision scenarios related to production scheduling of specific milk products as described by the authors in a dedicated study [55]. Each scenario is evaluated against predefined performance criteria, allowing decision-makers to compare different options. The framework ultimately supports the selection of the most suitable action by providing both quantitative results and structured insights, enabling more informed and proactive decision-making. Figure 15, Figure 16 and Figure 17 provide a brief presentation of the capabilities of the proposed DSF in historical monitoring and in time-series prediction. The recommendation actions proposed by the DSF regarding production scheduling are depicted in Figure 10.

4.2. Case Study 2: Defect Recognition for Gearboxes Assembly Processes

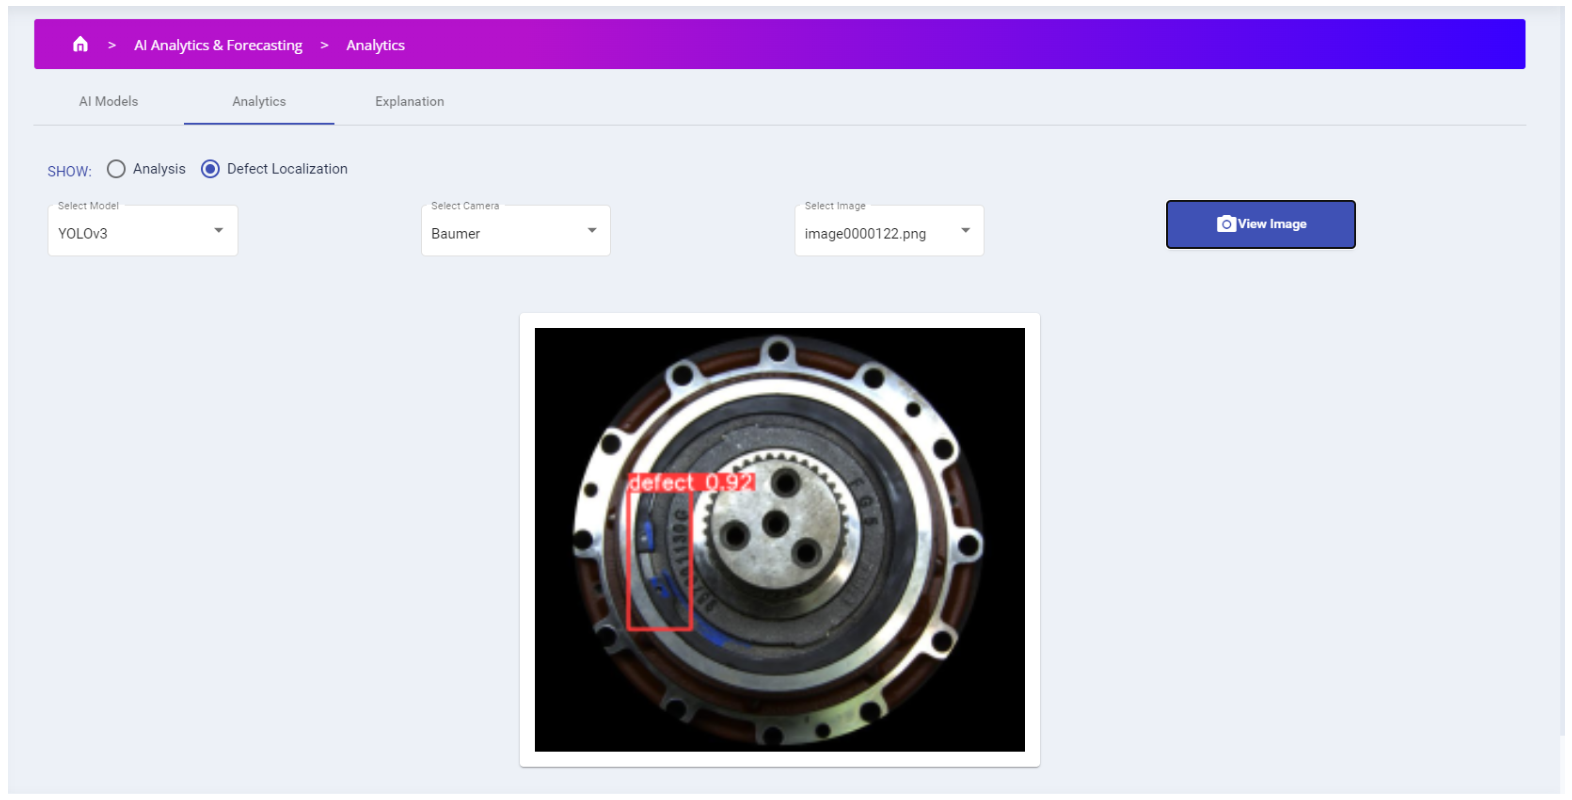
Case Study 2 concerns defect recognition (see Figure 18) in the gearbox assembly processes of a Slovakian manufacturer, where the objective is to improve quality assurance by identifying defects during assembly preparation rather than only at the end of the production line. In the examined industrial scenario, three gear components are inspected through high-resolution image acquisition, with the target defects corresponding to the misplacement of either the brown tape in some metallic parts or the misplacement of the metallic fuse in others. Within this context, the DSF supports the case study by acting as the decision-support layer that transforms image data into actionable quality insights through visualization, explainability, and interaction with AI-based defect-detection services. More specifically, the framework exposes alternative models for defect recognition and localization, enabling the monitoring of model outputs and the delivery of decision-relevant information to process specialists in an operationally meaningful way.
The added value of the DSF in this case lies not only in predictive performance, but also in its explainable and human-centric operation. The use case is supported through SHAP-based heatmaps that visualize the image regions contributing positively or negatively to the model verdict, thereby allowing data scientists and domain experts to assess whether the prediction is grounded in the actual region of interest. This functionality is particularly important in light of the results reported in the accompanying study [56], where the camera dataset yielded very strong defect-detection performance, with ResNet50 reaching 99.1% accuracy and 99.54% F1-score, while YOLOv3 achieved 96.5% precision and 95.2% mAP50 for defect localization. In addition, the DSF enables human-in-the-loop validation, since users may accept or reject model outputs and provide corrected labels. A representation of this functionality is depicted in Figure 11.
Additionally, when a sufficient proportion of labels is revised, retraining is triggered automatically, allowing the system to adapt and improve over time. Consequently, the DSF assists this case study as an integrated environment for accurate defect recognition, interpretable model assessment, and continuous refinement of the inspection process.

4.3. Case Study 3: Anomaly Detection for Fuel Systems Production

This case study examines the use of the DSF for anomaly detection in fuel-systems production in Belgium, with emphasis on explainable prediction, concept-drift identification, and continuous model adaptation. An example of live monitoring and anomaly detection in fuel-system is provided in Figure 19.
Anomaly detection in fuel-systems production constitutes a critical function of the DSF, as it enables the early identification of abnormal process behavior from multivariate manufacturing data and supports timely intervention before deviations affect product quality or process stability. In this case, the DSF operates as an integrated decision-support environment in which anomaly predictions are complemented by explainability mechanisms, allowing process specialists to interpret model outputs in operational terms rather than treating them as isolated alarms. In particular, feature-importance analysis supports the identification of the variables that most strongly influence anomalous behavior, thereby facilitating model debugging, sensor-level inspection, and the refinement of the prediction pipeline. This capability is especially relevant in industrial environments, where anomaly detection must be not only accurate but also interpretable and actionable in practice.
The contribution of the DSF extends beyond anomaly flagging to the continuous adaptation of the analytical workflow through explainability-guided model improvement. By exploiting SHAP-based feature selection, the framework can enhance predictive performance through the retention of the most influential variables. In the examined setting in [57], this led to improvements in accuracy from 83.04% to 84.06%, recall from 89.51% to 91.62%, and F1-score from 84.09% to 85.20%. In addition, the DSF supports concept-drift identification through Morris Sensitivity Analysis, enabling the detection of shifts in process behavior and the subsequent retraining of the model using updated data. A representative example concerns the variable accumulator_pressure_comp_cylinder_side_av, whose marked deviation from the initial training distribution signaled a process change, after explainability-guided feature selection and retraining, guided by the SHAP beeswarm analysis shown in Figure 12, more than 82% of the previously misclassified instances were correctly reclassified. This adaptive and human-centric operation is consistent with recent work on industrial anomaly detection, which emphasizes that effective deployment requires the combined consideration of supervised and unsupervised learning strategies together with robust explainability support.

4.4. DSF Evaluation

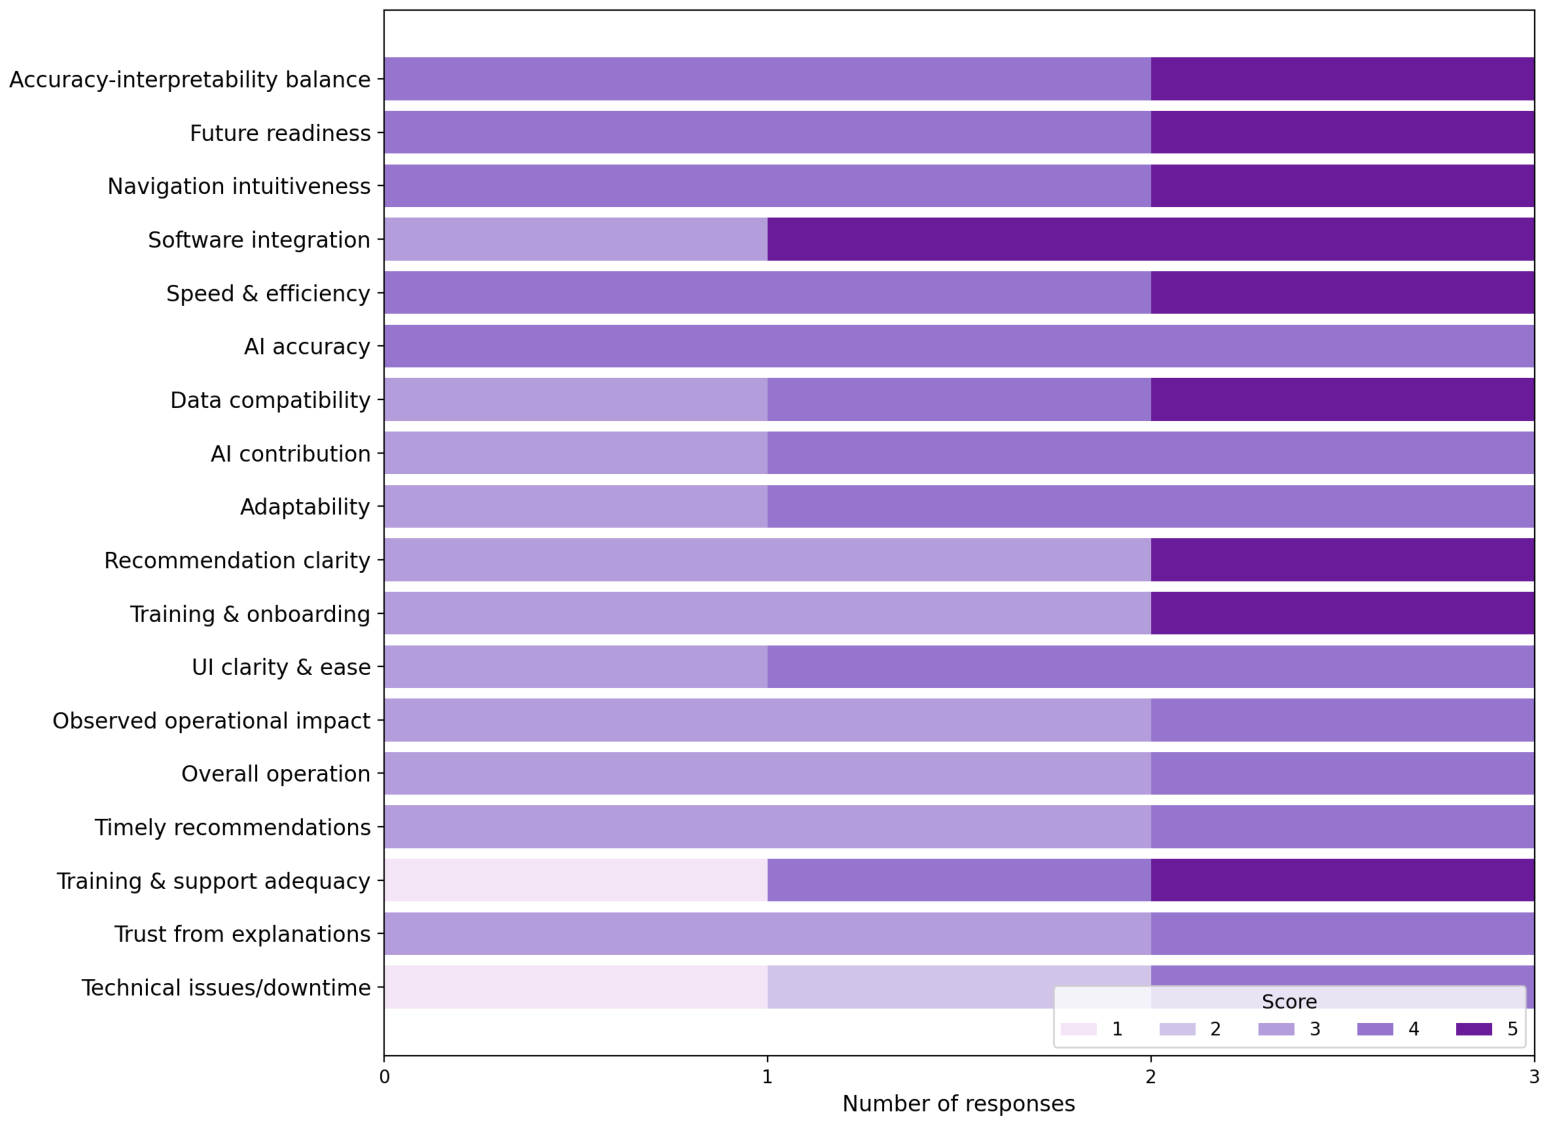
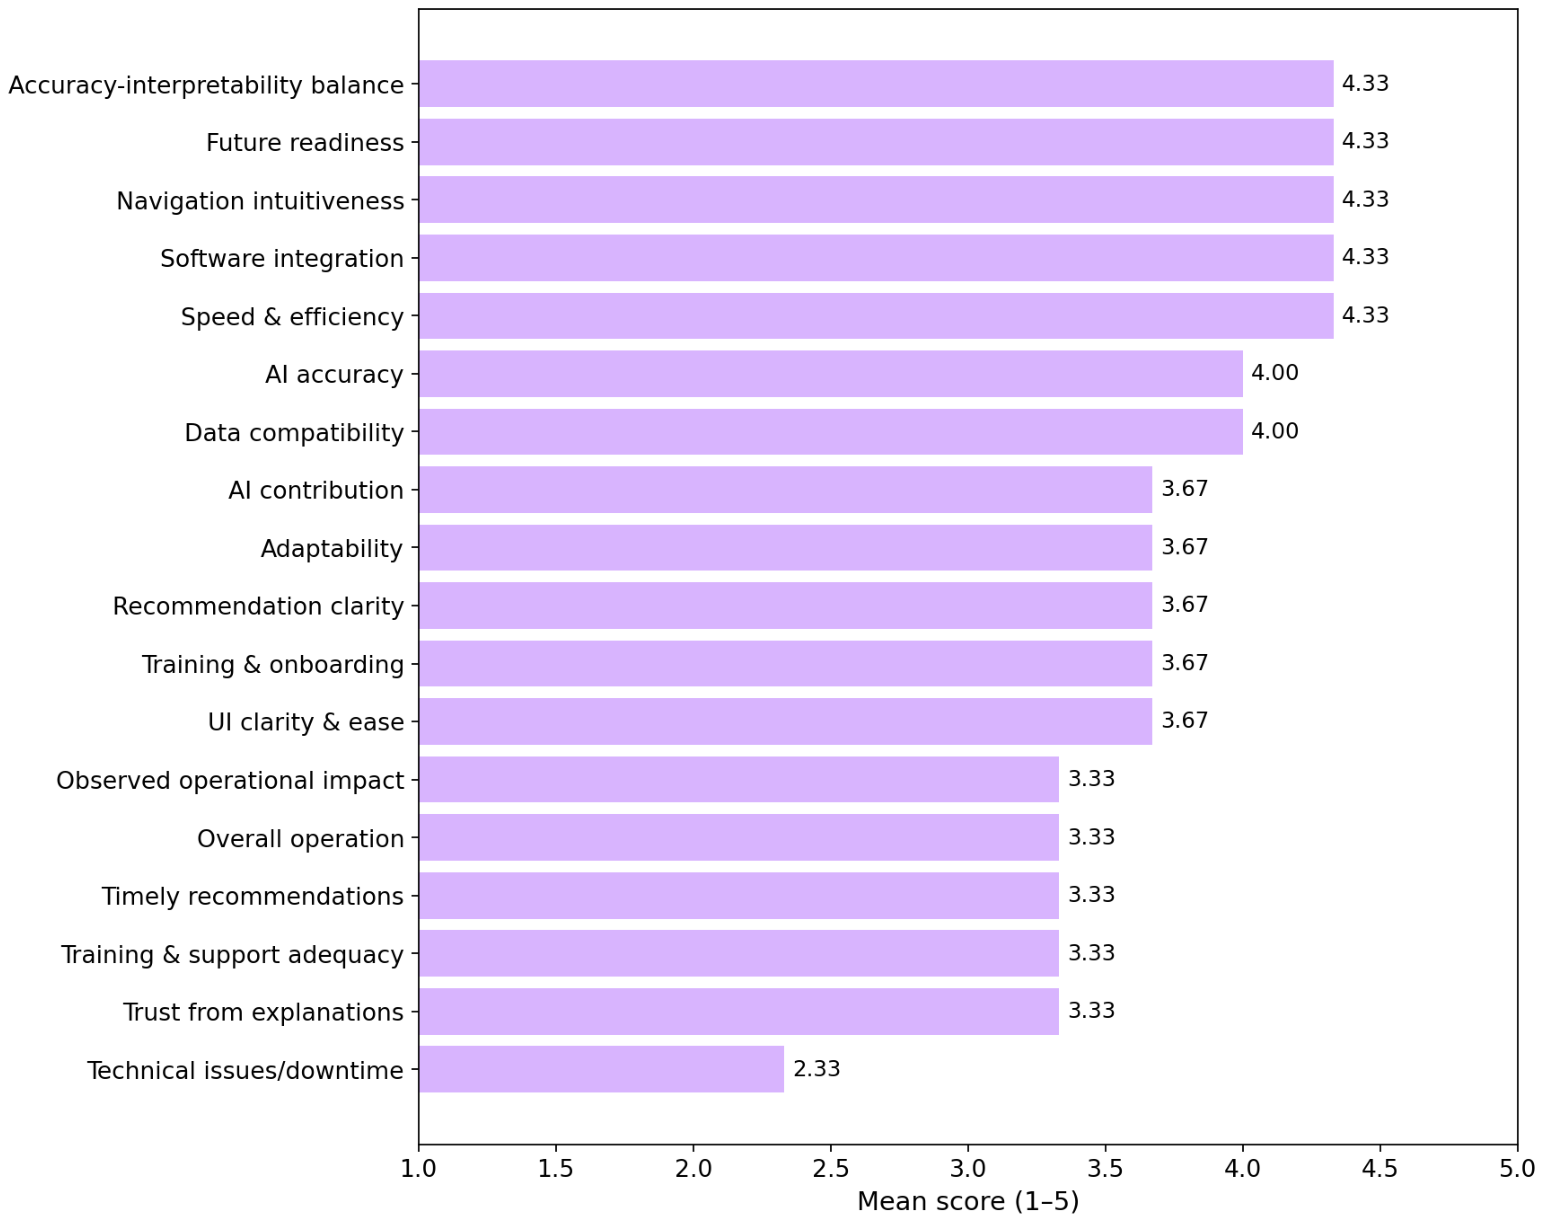
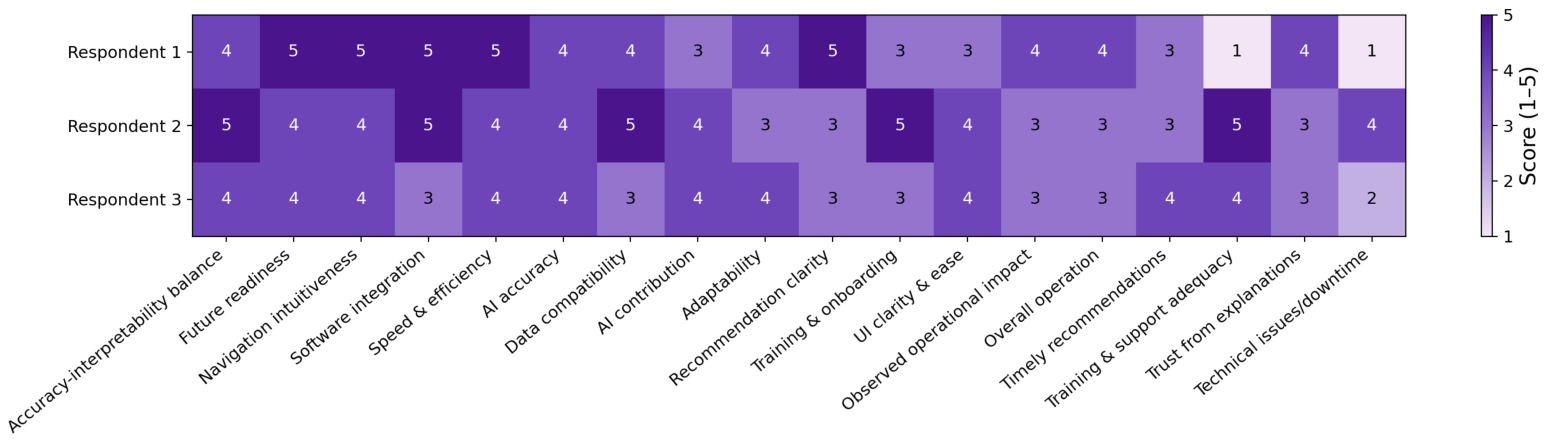
The DSF was further assessed through an end-user questionnaire to evaluate from a qualitative perspective some of its key aspects. As the team sizes of each company participated in pilot evaluation phase of the platform were different (Company 1 had two representatives, Company 2 had three representatives, and Company 3 had one representative), the organization/company was defined as the primary unit of analysis [58]. Aggregating individual responses ensures that each organizational/company entity contributes equally to the findings, regardless of internal team size; therefore n = 3 respondents are considered (one per use case). In addition, we preferred the organizational-level approach as the DSF was applied in three different domains to solve different kind of problems, and therefore it was better to give all of them the same level of importance. The instrument contained 18 close-ended items scored on a five-point Likert scale and four open-ended questions covering usability, explainability, technical robustness, integration, onboarding, and perceived operational impact. Since the number of respondents is limited, the results should be interpreted as an exploratory qualitative–quantitative assessment rather than a statistically generalizable evaluation. Nevertheless, the responses provide useful evidence regarding the perceived strengths of the proposed framework and highlight a small number of areas that deserve further refinement. However, it should be highlighted that the values of mean scores, distributions and heatmaps in the corresponding Figure 20, Figure 21 and Figure 22 are presented strictly to visualize the individual response matrix of the three expert stakeholders (companies) transparently, and should not be interpreted as an inferred quantitative distribution. Given the small sample size ( n = 3 ), formal inter-respondent reliability metrics cannot be mathematically calculated. Accordingly, the numerical evaluations detailed below are presented strictly as descriptive profiles to contextualize the qualitative feedback. Furthermore, item mean differences of ≤0.5 are considered within the margin of small-sample variance and carry no statistical significance; hence, these metrics are utilized to identify broad operational groupings rather than to establish strict mathematical hierarchies between individual system features.
In general, the questionnaire responses indicate a broadly positive perception of the DSF across the three participating organizations. As illustrated in Figure 20 and Figure 21, responses were concentrated toward the upper end of the rating scale regarding speed and efficiency, navigation intuitiveness, software integration, future readiness and the balance between accuracy and interpretability. Participants also expressed favorable views regarding the perceived accuracy of the AI models and the framework’s ability to accommodate heterogeneous data sources. At the same time, a greater variability in responses was observed for aspects associated with training adequacy, understanding of recommendations and the clarity of user interface. A lower degree of consistency among the respondents was observed for aspects such as training adequacy, recommendation timeliness, operational satisfaction and perceived impact on efficiency and decision-making. Responses concerning technical issues and downtime suggest that severe instability was not commonly reported across the three organizations, although some variation in operational experience was still observed. Given the limited sample size, these observations are presented solely as descriptive profiles of the responses and should not be interpreted as comparative rankings or quantitative performance measurements.
A more detailed view of individual responses is provided in Figure 21, which presents the response distribution for each questionnaire item. The figure confirms that the most positive assessments were concentrated around usability and integration-related variables, while a more moderate dispersion is apparent in the items related to training adequacy, recommendation timeliness, operational satisfaction and observed impact on efficiency and decision-making. This distribution-based view is particularly useful because, given the small sample size, mean values alone can hide the degree of agreement or disagreement among respondents.
The respondent-level patterns shown in Figure 22 further illustrate these trends. Although the overall assessment of the DSF was positive, some differences among the three organizations can be observed, particularly regarding training support, recommendation trustworthiness and perceived operational impact. The responses related to technical issues and downtime also indicate that the operational experience was not completely uniform across the pilot settings. Overall, the heatmap highlights both the generally positive reception of the framework and the areas that could benefit from further refinement and long-term validation.
To better contextualize these descriptive trends, the evaluation included open-ended feedback (based on questions related to system’s outcomes, predictions, features and any difficulties) to assess the operational impact of the DSF across its distinct application environments.
In Case Study 1 (Milk Industry), the expert feedback underscored that the primary operational value was driven by the system’s ability to smoothly ingest and pre-process dynamic production logs to generate actionable time-series demand predictions, which directly accommodated their strict next-day delivery cycles. For this domain specialist, the core utility was tied to the reduction of operational uncertainty during scheduling, rather than the visual complexity of the frontend framework.
For Case Study 2 (Automotive Supplier), the qualitative responses highlighted a significant cognitive advantage introduced by the human-centric services. The quality control specialist noted that the SHAP-based image heatmaps provided crucial visual assurance, allowing operators to rapidly verify whether the ResNet50 and YOLOv3 architectures were converging on actual structural assembly defects (such as misplaced metallic fuses or tape errors) rather than background noise. To make the system truly proactive, this respondent explicitly recommended the integration of automated, cross-platform alerting mechanisms (such as direct webhooks to Microsoft Teams or automated corporate email digests).
For Case Study 3 (Fuel Systems Production), the qualitative feedback concentrated heavily on the platform’s continuous adaptation and concept-drift tracking. The process specialist emphasized that using Morris Sensitivity Analysis within the XAI dashboard allowed them to diagnose shifting sensor data distributions—specifically identifying an operational anomaly in accumulator pressure variations—before committing to automated model retraining. This capability shifted the operator’s role from a passive observer of system alarms to an active co-designer of the analytical pipeline.
Regarding adoption potential, two respondents expressed a clear willingness to recommend the DSS to other organizations, citing ease of use, scalability, and applicability across multiple domains, whereas one respondent stated that the evaluation process was still in progress.
Taken together, the questionnaire findings show that the DSF can be a promising decision-support solution, especially with respect to system performance, navigation, data and systems integration and interoperability, and future-readiness. At the same time, the evaluation identifies several practical directions for improvement, particularly in explainability communication, user support, and the consistency of operational deployment. Consequently, the end-user assessment complements the technical results of the three pilot cases by demonstrating that the proposed DSF is not only analytically effective but also viewed positively by users in terms of usability and organizational relevance.

5. Conclusions

This paper introduced a novel Decision Support Framework that bridges the gap between AI integration, human-knowledge consideration, and the needs for trustworthy AI and sovereign data management. By organizing the framework into five interconnected building blocks, Sovereign and Trusted Data Sharing, AI Models Repository, Recommendation Engine, Human-centric Services, and a Visualization Framework, the research provides a holistic decision support platform for modern smart manufacturing. The adoption and implementation of data spaces in the context of DSSs ensure that industrial organizations maintain full sovereignty over their sensitive assets, enabling secure cross-organizational sharing that was previously hindered by a lack of trust. Furthermore, the integration of XAI and techniques like root-cause-oriented investigation promotes AI outputs to transparent, actionable insights, empowering human experts to make informed decisions rather than acting as passive recipients of model data.
The validation across three diverse industrial pilots, a company in the milk industry, an automotive supplier, and a machinery manufacturer, demonstrated the framework’s practical versatility and effectiveness. Preliminary end-user evaluations indicate high satisfaction with the system’s speed, efficiency, navigation intuitiveness and data and systems integration and interoperability. Furthermore, system benchmarks evaluating data space negotiation latency, data ingestion latency, and user interface responsiveness demonstrate that the proposed DSF platform is able to deliver the low latency and technical robustness required for demanding industrial environments. While the technical framework is perceived as mature, future work will focus on refining onboarding materials and enhancing user support mechanisms to facilitate broader organizational adoption. In addition, further validation and testing is planned in current application domains and further domains will be considered as well. Ultimately, this DSF, which is built over AI, XAI and sovereign data sharing mechanisms, provides a robust foundation for achieving operational excellence while keeping the human worker at the core of the industrial process.

Author Contributions

Conceptualization, A.N. and T.K.; methodology, A.N. and P.G.; software, A.N., T.K. and T.V.; validation, A.N. and T.K.; formal analysis, A.N., T.K. and T.V.; data curation, T.K. and T.V.; writing—original draft preparation, A.N., T.K. and T.V.; supervision, D.I., P.G. and P.T.; project administration, D.I.; funding acquisition, D.I. All authors have read and agreed to the published version of the manuscript.

Funding

This research was co-funded by EU Horizon 2020 project named knowlEdge with grant number 957331.

Institutional Review Board Statement

The study was conducted in accordance with the Declaration of Helsinki. Ethical review and approval were waived for this study due to the fact that the survey relied on anonymous and pseudonymized data processing framework. Because the technical and organizational safeguards met the data minimization thresholds outlined in /Article 89(1) of the GDPR/, the study was determined to carry no risk of harm or breach of confidentiality to the participants.

Informed Consent Statement

Informed consent for publication was obtained from all identifiable human participants.

Data Availability Statement

No new data were created during this study. The data used for AI models training are the ones which the industrial pilot partners of the EC-funded project named knowlEdge had provided for research purposes (knowlEdge data repository https://zenodo.org/communities/knowledge-project/records?q=&f=resource_type%3Adataset&l=list&p=1&s=10&sort=newest (accessed on 10 April 2026)). In addition, it should be noted that the values that are presented in the figures of this article are based on anonymized/modified pilot data and do not represent the actual values. Any screenshots with actual components and pilot instances of DSF interfaces used are the ones that are available as knowlEdge EC project results. Besides the public repository, the requests to access further datasets should be directed to the three industrial partners of the knowlEdge project (https://cordis.europa.eu/project/id/957331 (accessed on 10 April 2026)).

Acknowledgments

The authors would like to express their sincere gratitude to the industrial partners/companies (Parmalat, Bonfiglioli Slovakia and Kautex) involved in the tool validation process through their activities in the EC-funded project named knowlEdge. Their technical expertise, provision of real-world use cases, and dedicated testing efforts were instrumental in designing and refining the tool and ensuring its practical applicability. In addition, we would like to thank our colleague V. Dimitriadis for his support regarding the creation of user interfaces. During the preparation of this manuscript/study, the author(s) used Gemini 3 Flash for the purposes of text refinement and improvement. The authors have reviewed and edited the output and take full responsibility for the content of this publication.

Conflicts of Interest

The authors declare no conflicts of interest. The funders had no role in the design of the study; in the collection, analyses, or interpretation of data; in the writing of the manuscript; or in the decision to publish the results.

Abbreviations

The following abbreviations are used in this manuscript:
DSSDecision Support System
DSFDecision Support Framework
AIArtificial Intelligence
XAIeXplainable Artificial Intelligence
MLMachine Learning
UIUser Interface
KPIKey Performance Indicator
DAGsDirected Acyclic Graphs
IoTInternet of Things
DSSCData Space Support Center
ETSError, Trend, Seasonality
BWMBest-Worst Method
DMSDocument Management System
MULTIMOORAMulti-Objective Optimization on the basis of Ratio Analysis
ARIMAAutoregressive Integrated Moving Average
RFIDRadio Frequency Identification
ICTInformation and Communication Technologies
SVMSupport Vector Machine
LIMELocal Interpretable Model-Agnostic Explanations
SHAPSHapley Additive exPlanations

References

  1. Zizic, M.C.; Mladineo, M.; Gjeldum, N.; Celent, L. From industry 4.0 towards industry 5.0: A review and analysis of paradigm shift for the people, organization and technology. Energies 2022, 15, 5221. [Google Scholar] [CrossRef] [Scilit]
  2. Li, W.; Liang, Y.; Wang, S. (Eds.) Data Driven Smart Manufacturing Technologies and Applications; Springer: Berlin/Heidelberg, Germany, 2021. [Google Scholar]
  3. Bregar, A. Decision support for industry 5.0. In Proceedings of TAKE 2022 Conference; Universidade Portucalense: Lisbon, Porto, 2022. [Google Scholar]
  4. Soori, M.; Jough, F.K.G.; Dastres, R.; Arezoo, B. AI-based decision support systems in Industry 4.0, A review. J. Econ. Technol. 2026, 4, 206–225. [Google Scholar] [CrossRef] [Scilit]
  5. Tu, Z.; Zacharewicz, G.; Chen, D. Developing a web-enabled HLA federate based on portico RTI. In Proceedings of the 2011 Winter Simulation Conference (WSC); IEEE: iscataway, NJ, USA, 2011; pp. 2289–2301. [Google Scholar]
  6. Ye, X.; Song, W.S.; Hong, S.H.; Kim, Y.C.; Yoo, N.H. Toward data interoperability of enterprise and control applications via the industry 4.0 asset administration shell. IEEE Access 2022, 10, 35795–35803. [Google Scholar] [CrossRef] [Scilit]
  7. Wei, K.; Sun, J.Z.; Liu, R.J. A review of asset administration shell. In 2019 IEEE International Conference on Industrial Engineering and Engineering Management (IEEM); IEEE: Piscataway, NJ, USA, 2019; pp. 1460–1465. [Google Scholar]
  8. Otto, B. The evolution of data spaces. In Designing Data Spaces: The Ecosystem Approach to Competitive Advantage; Springer International Publishing: Cham, Switzerland, 2022; pp. 3–15. [Google Scholar]
  9. Nizamis, A.; Gkonis, P.; Ioannidis, D.; Ntafalias, A.; Tzovaras, D.; Trakadas, P. Manufacturing data spaces applications in Europe—A survey. Data Brief 2025, 63, 112149. [Google Scholar] [CrossRef] [Scilit] [PubMed]
  10. Yanytska, L. The rise of human-centric manufacturing in the industry 5.0 era. Int. J. Adv. Manuf. Technol. 2025, 139, 5067–5077. [Google Scholar] [CrossRef] [Scilit]
  11. Soldatos, J.; Kyriazis, D. (Eds.) Trusted Artificial Intelligence in Manufacturing: A Review of the Emerging Wave of Ethical and Human Centric AI Technologies for Smart Production; Emerald Group Publishing: West Yorkshire, UK, 2021. [Google Scholar]
  12. Kalasampath, K.; Spoorthi, K.N.; Sajeev, S.; Kuppa, S.S.; Ajay, K.; Maruthamuthu, A. A literature review on applications of explainable artificial intelligence (XAI). IEEE Access 2025, 13, 41111–41140. [Google Scholar] [CrossRef] [Scilit]
  13. Chala, S.A.; Graß, A. Human-AI Interaction for Semantic Knowledge Enrichment of AI Model Output. In Artificial Intelligence in Manufacturing: Enabling Intelligent, Flexible and Cost-Effective Production Through AI; Springer Nature: Cham, Switzerland, 2023; pp. 43–54. [Google Scholar]
  14. Alvarez-Napagao, S.; Ashmore, B.; Barroso, M.; Barrué, C.; Beecks, C.; Berns, F.; Bosi, I.; Chala, S.A.; Ciulli, N.; Garcia-Gasulla, M.; et al. Knowledge project–concept, methodology and innovations for artificial intelligence in industry 4.0. In 2021 IEEE 19th International Conference on Industrial Informatics (INDIN); IEEE: Piscataway, NJ, USA, 2021; pp. 1–7. [Google Scholar]
  15. Alberti, E.; Alvarez-Napagao, S.; Anaya, V.; Barroso, M.; Barrué, C.; Beecks, C.; Bergamasco, L.; Chala, S.A.; Gimenez-Abalos, V.; Graß, A.; et al. Ai lifecycle zero-touch orchestration within the edge-to-cloud continuum for industry 5.0. Systems 2024, 12, 48. [Google Scholar] [CrossRef] [Scilit]
  16. Page, M.J.; McKenzie, J.E.; Bossuyt, P.M.; Boutron, I.; Hoffmann, T.C.; Mulrow, C.D.; Shamseer, L.; Tetzlaff, J.M.; Akl, E.A.; Brennan, S.E.; et al. The PRISMA 2020 statement: An updated guideline for reporting systematic reviews. BMJ 2021, 372, n71. [Google Scholar] [CrossRef] [Scilit] [PubMed]
  17. Mahmoodi, E.; Fathi, M.; Tavana, M.; Chobakhloo, M.; Ng, A.H.C. Data-driven simulation-based decision support system for resource allocation in industry 4.0 and smart manufacturing. J. Manuf. Syst. 2024, 72, 287–307. [Google Scholar] [CrossRef] [Scilit]
  18. Arena, S.; Florian, E.; Zennaro, I.; Orru, P.F.; Sgarbossa, F. A novel decision support system for managing predictive maintenance strategies based on machine learning approaches. Saf. Sci. 2022, 146, 105529. [Google Scholar] [CrossRef] [Scilit]
  19. Psarommatis, F.; Kiritsis, D. A hybrid decision support system for automating decision making in the event of defects in zero defect manufacturing. J. Ind. Inf. Integr. 2022, 26, 100263. [Google Scholar] [CrossRef] [Scilit]
  20. Romeo, L.; Loncarski, J.; Paolanti, M.; Bocchini, G.; Mancini, A.; Frontoni, E. Machine learning-based design support system for heterogeneous machine parameter prediction in industry 4.0. Expert Syst. Appl. 2020, 140, 112869. [Google Scholar] [CrossRef] [Scilit]
  21. Ito, T.; Abd Rahman, M.S.; Mohamad, E.; Abd Rahman, A.A.; Salleh, M.R. Internet of things and simulation approach for decision support system in lean manufacturing. J. Adv. Mech. Desings Syst. Manuf. 2020, 14, 2. [Google Scholar] [CrossRef] [Scilit]
  22. Pereira, E.; Pinto, G.; Coutinho, B.; Goncalves, G.; Correia, J.D.; Reis, P.C. A Zero-Defect Manufacturing Decision-Support System for the Decorative Surfaced Panels Industry. In Proceedings of the 30th IEEE International Conference on Emerging Technologies and Factory Automation (ETFA); IEEE: Piscataway, NJ, USA, 2025. [Google Scholar]
  23. Tiensuu, H.; Tamminen, S.; Puukko, E.; Rönning, J. Evidence-based and explainable smart decision support for quality improvement in stainless steel manufacturing. Appl. Sci. 2021, 11, 10897. [Google Scholar] [CrossRef] [Scilit]
  24. SHapley Additive exPlanations. Available online: https://shap.readthedocs.io/en/latest/ (accessed on 10 April 2026).
  25. Local Interpretable Model-Agnostic Explanations. Available online: https://c3.ai/glossary/data-science/lime-local-interpretable-model-agnostic-explanations/ (accessed on 10 April 2026).
  26. Mabkhot, M.M.; Al-Samhan, A.M.; Hidri, L. An ontology-enabled case-based reasoning decision support system for manufacturing process selection. Adv. Mater. Sci. Eng. 2019, 2019, 2505183. [Google Scholar] [CrossRef] [Scilit]
  27. Marín Díaz, G. A unified fuzzy-explainable AI framework (FAS-XAI) for customer Service Value Prediction and strategic decision-making. AI 2026, 7, 3. [Google Scholar] [CrossRef] [Scilit]
  28. Cheng, Y.-J.; Chen, M.-H.; Cheng, F.-C.; Cheng, Y.-C.; Lin, Y.-S.; Yang, C.-J. Developing a decision support system for a dental manufacturing production line based on data mining. Appl. Syst. Innov. 2018, 1, 17. [Google Scholar] [CrossRef] [Scilit]
  29. von Enzberg, S.; Naskos, A.; Metaxa, I.; Köchling, D.; Kühn, A. Implementation and transfer of predictive analytics for smart maintenance: A case study. Front. Comput. Sci. 2020, 2, 578469. [Google Scholar] [CrossRef] [Scilit]
  30. Marques, M.; Agostinho, C.; Zacharewicz, G.; Jardim-Goncalves, R. Decentralized decision support for intelligent manufacturing in industry 4.0. J. Ambient. Intell. Smart Environ. 2017, 9, 299–313. [Google Scholar] [CrossRef] [Scilit]
  31. Kocsi, B.; Matonya, M.M.; Pusztai, L.P.; Budai, I. Real-time decision-support system for high-mix low-volume production scheduling in industry 4.0. Processes 2020, 8, 912. [Google Scholar] [CrossRef] [Scilit]
  32. González Rodríguez, G.; Gonzalez-Cava, J.M.; Méndez Pérez, J.A. An intelligent decision support system for production planning based on machine learning. J. Intell. Manuf. 2020, 31, 1257–1273. [Google Scholar]
  33. Rosati, R.; Romeo, L.; Cecchini, G.; Tonetto, F.; Viti, P.; Mancini, A.; Frontoni, E. From knowledge-based to big data model: A novel IoT and machine learning-based decision support system for predictive maintenance in industry 4.0. J. Intell. Manuf. 2023, 34, 107–121. [Google Scholar]
  34. Plitsos, S.; Repoussis, P.P.; Mourtos, I.; Tarantilis, C.D. Energy-aware decision support for production scheduling. Decis. Support Syst. 2017, 98, 88–97. [Google Scholar] [CrossRef] [Scilit]
  35. Bumblauskas, D.; Gemmill, D.; Igou, A.; Anzengruber, J. Smart maintenance decision support systems (SMDSS) based on corporate big data analytics. Expert Syst. Appl. 2017, 90, 303–317. [Google Scholar] [CrossRef] [Scilit]
  36. Sarabi, E.P.; Darestani, S.A. Developing a decision support system for logistics service provider selection employing fuzzy MULTIMOORA and BWM in mining equipment manufacturing. Appl. Soft Comput. J. 2021, 98, 106849. [Google Scholar] [CrossRef] [Scilit]
  37. Vafeiadis, T.; Kalatzis, D.; Nizamis, A.; Ioannidis, D.; Apostolou, K.; Metaxa, I.N.; Charisi, V.; Beecks, C.; Insolvibile, G.; Pardi, M.; et al. Data analysis and visualization framework in the manufacturing decision support system of COMPOSITION project. Procedia Manuf. 2019, 28, 57–62. [Google Scholar] [CrossRef] [Scilit]
  38. Pereira, M.T.; Silva, A.; Ferreira, L.P.; Sá, J.C.; Silva, F.J.G. A DMS to support industrial process decision-making: A contribution under industry 4.0. Procedia Manuf. 2019, 38, 613–620. [Google Scholar] [CrossRef] [Scilit]
  39. Silva, D.A.; Rupasinghe, T.D. A decision support system for demand planning: A case study from manufacturing industry. In Proceedings of the Moratuwa Engineering Research Conference (MERCon), Moratuwa, Sri Lanka, 29–31 May 2017; pp. 147–152. [Google Scholar]
  40. Abd Rahman, M.S.; Mohamad, E.; Abdul Rahman, A.A. Development of IoT-enabled data analytics enhanced decision support system for lean manufacturing process improvement. Concurr. Eng. Res. Appl. 2021, 29, 208–220. [Google Scholar] [CrossRef] [Scilit]
  41. Vafeiadis, T.; Nizamis, A.; Apostolou, K.; Charisi, V.; Metaxa, I.; Mastos, T.; Ioannisis, D.; Papadopoulos, A.; Tzovaras, D. Intelligent information management system for decision support application in a lift manufacturer’s shop floor. In Proceedings of the International Symposium on Innovations in Intelligent Systems and Applications (INISTA), Sofia, Bulgaria, 3–5 July 2019; pp. 1–6. [Google Scholar]
  42. DSSC Glossary. Available online: https://blueprint.dssc.eu/?pane=glossary (accessed on 10 April 2026).
  43. Sovity Community Edition EDC Connector. Available online: https://github.com/sovity/edc-ce/ (accessed on 10 April 2026).
  44. Sovity DAPs. Available online: https://github.com/sovity/sovity-daps (accessed on 10 April 2026).
  45. Keycloak Open Source Identity and Access Management. Available online: https://www.keycloak.org/ (accessed on 10 April 2026).
  46. Gaia-X Digital Clearing House (GXDCH). Available online: https://gaia-x.eu/services-deliverables/digital-clearing-house/ (accessed on 10 April 2026).
  47. Nizamis, A.; Schlake, G.; Siachamis, G.; Dimitriadis, V.; Patsonakis, C.; Beecks, C.; Ioannidis, D.; Votis, K.; Tzovaras, D. Designing a marketplace to exchange AI models for industry 5.0. In Artificial Intelligence in Manufacturing: Enabling Intelligent, Flexible and Cost-Effective Production Through AI; Springer Nature: Cham, Switzerland, 2023; pp. 27–41. [Google Scholar]
  48. SkiKit Fuzzy. Available online: https://pythonhosted.org/scikit-fuzzy/overview.html (accessed on 10 April 2026).
  49. Zheng, X.; Aragam, B.; Ravikumar, P.K.; Xing, E.P. DAGs with NO TEARS: Continuous Optimization for Structure Learning. In Proceedings of the 32nd International Conference on Neural Information Processing Systems (NeurIPS), Montréal, QC, Canada, 2–8 December 2018; pp. 9472–9483. [Google Scholar]
  50. Angular Web Framework. Available online: https://angular.dev/ (accessed on 10 April 2026).
  51. Bootstrap Frontend Toolkit. Available online: https://getbootstrap.com/ (accessed on 10 April 2026).
  52. Nebular Library. Available online: https://akveo.github.io/nebular/ (accessed on 10 April 2026).
  53. Apache ECharts Visualization Library. Available online: https://echarts.apache.org/en/index.html (accessed on 10 April 2026).
  54. Doherty, W.J.; Thadhani, A.J. The Economic Value of Rapid Response Time; IBM Report; IBM Press: Armonk, NY, USA, 1982; pp. 1–10. [Google Scholar]
  55. Dimoudis, D.; Vafeiadis, T.; Nizamis, A.; Musiari, E.; Ziliotti, L.; Ioannidis, D.; Tzovaras, D. A holistic framework for production scheduling in Industry 4.0. In 2023 19th International Conference on Distributed Computing in Smart Systems and the Internet of Things (DCOSS-IoT); IEEE: Piscataway, NJ, USA, 2023; pp. 269–276. [Google Scholar]
  56. Kotsiopoulos, T.; Papakostas, G.; Vafeiadis, T.; Dimitriadis, V.; Nizamis, A.; Bolzoni, A.; Bellinati, D.; Ioannidis, D.; Votis, K.; Tzovaras, D.; et al. Revolutionizing defect recognition in hard metal industry through AI explainability, human-in-the-loop approaches and cognitive mechanisms. Expert Syst. Appl. 2024, 255, 124839. [Google Scholar] [CrossRef] [Scilit]
  57. Bardos, A.; Doupidis, P.; Kotsiopoulos, T.; Vafeiadis, T.; Nizamis, A.; Geerdens, H.; Ioannidis, D.; Votis, K.; Tzovaras, D.; Sarigiannidis, P. Anomaly detection in industrial processes: Supervised vs. unsupervised learning and the role of explainability. Open Res. Eur. 2025, 5, 8. [Google Scholar] [CrossRef] [Scilit]
  58. Yin, R.K. Case Study Research and Applications; Sage: Thousand Oaks, CA, USA, 2018; Volume 6. [Google Scholar]
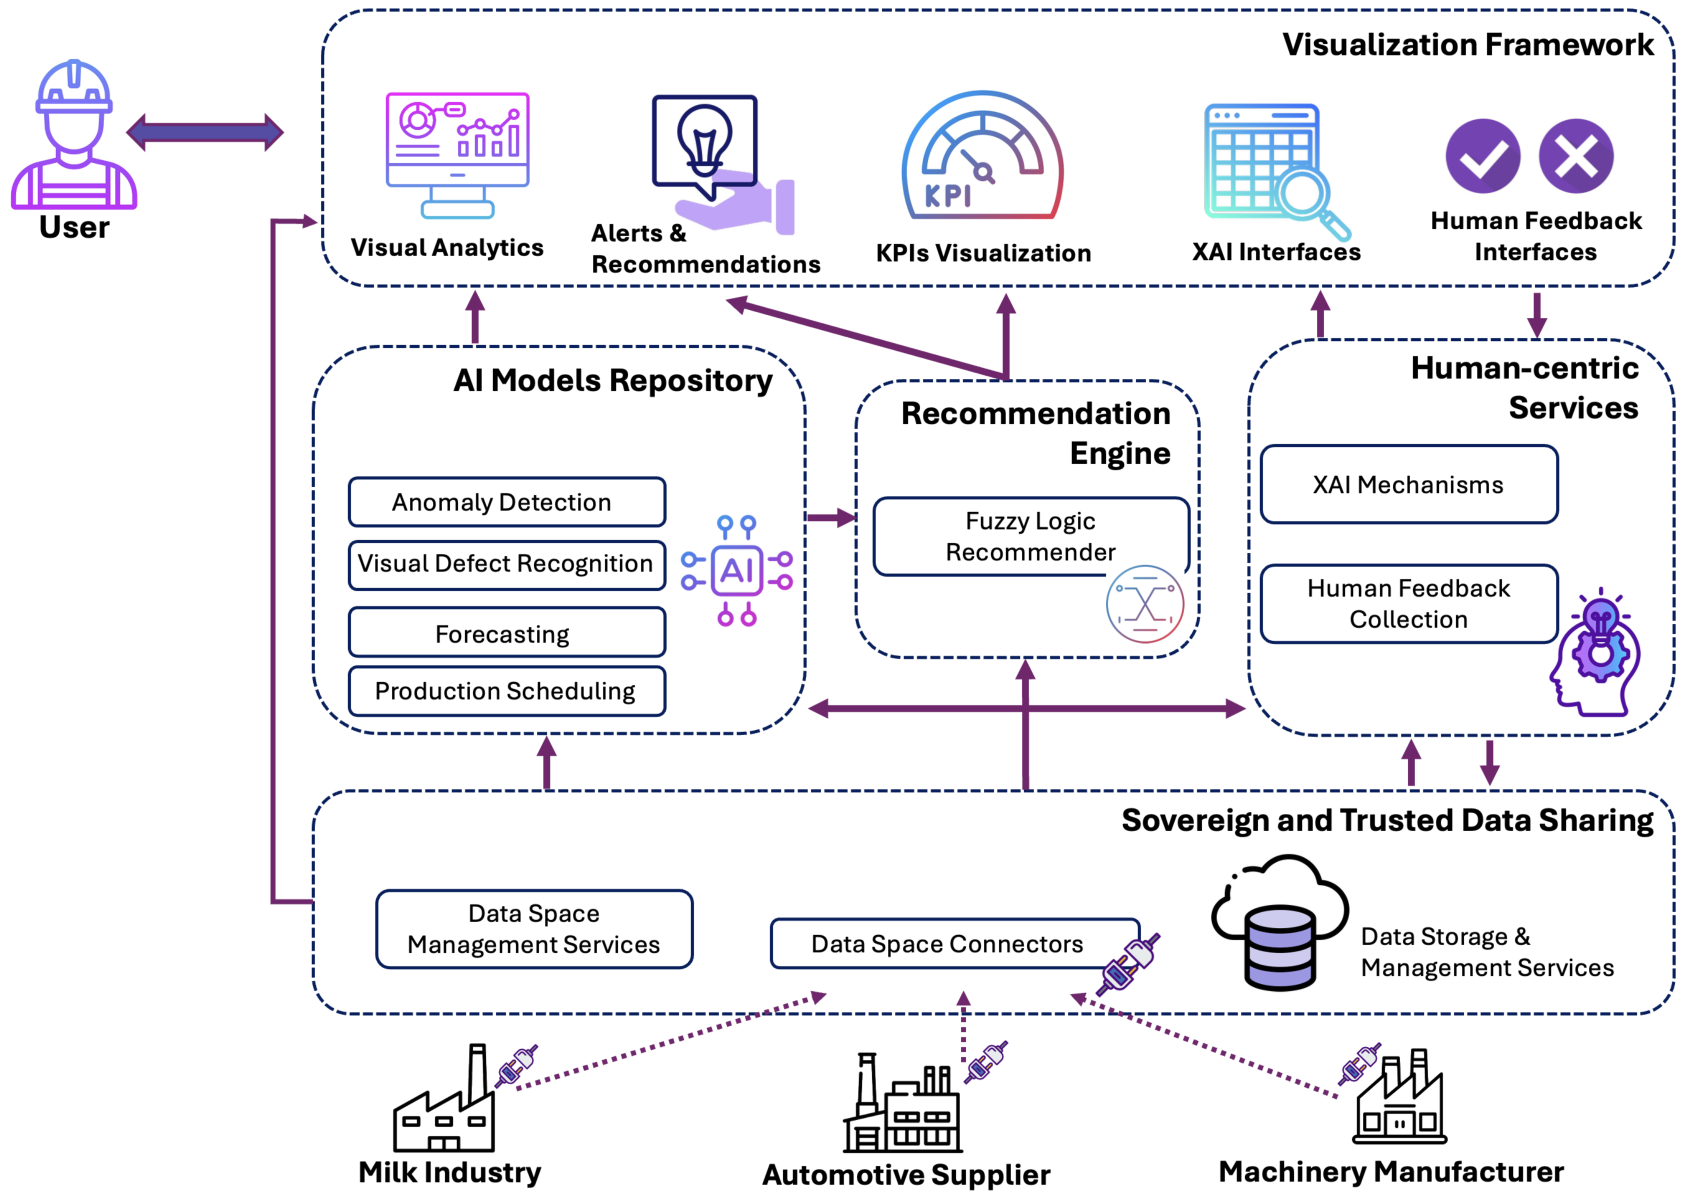
Figure 1. Decision Support Framework high-level architecture.
Platforms 04 00014 g001
Figure 2. Data acquisition and AI analytics workflow of the DSF. Industrial data providers publish data assets through the data-space layer, while the DSF discovers, negotiates, retrieves, stores, and prepares authorized data for pilot-specific AI/ML analytics.
Platforms 04 00014 g002
Figure 3. Recommendation, visualization, and feedback workflow of the DSF. AI/ML outputs and KPIs are processed by the Recommendation Engine through fuzzy logic and the DAG-based explanatory layer, while the Visualization Framework presents recommendations, explanations, and feedback interfaces to the end user.
Platforms 04 00014 g003
Figure 4. Data Space established for DSF sovereign data management.
Platforms 04 00014 g004
Figure 5. High-level presentation of DSF AI models.
Platforms 04 00014 g005
Figure 6. Fuzzy logic system architecture.
Platforms 04 00014 g006
Figure 7. The fuzzy universe of the recommender’s fuzzy logic system.
Platforms 04 00014 g007
Figure 8. Recommendations produced by fuzzy logic recommendation system. The Recommender indicates which production items deviated from the defined KPIs.
Platforms 04 00014 g008
Figure 9. Recommendations from the DAG-based explanatory recommender. The graph visualizes candidate directed dependencies among production variables and supports expert-driven root-cause hypothesis generation.
Platforms 04 00014 g009
Figure 10. Recommendations for production scheduling. The Recommender indicates at which timeslots a specific product needs to be produced and what the demand will be for this product.
Platforms 04 00014 g010
Figure 11. XAI image heatmap.
Platforms 04 00014 g011
Figure 12. XAI Beeswarm plot (SHAP values). Purple values indicate high influence to the model’s decision.
Platforms 04 00014 g012
Figure 13. XAI variable importance chart.
Platforms 04 00014 g013
Figure 14. The DSF support KPI visualization as gauges.
Platforms 04 00014 g014
Figure 15. Historical monitoring line chart.
Platforms 04 00014 g015
Figure 16. Monitoring bar chart.
Platforms 04 00014 g016
Figure 17. Analytics time-series prediction.
Platforms 04 00014 g017
Figure 18. AI analytics image with defect localization.
Platforms 04 00014 g018
Figure 19. Live monitoring anomaly detection (upper) and data table (lower).
Platforms 04 00014 g019
Figure 20. Mean scores for all close-ended DSF evaluation items (five-point Likert scale, n = 3 ).
Platforms 04 00014 g020
Figure 21. Distribution of responses for each close-ended DSF evaluation item.
Platforms 04 00014 g021
Figure 22. Respondent-level heatmap of the DSF evaluation scores.
Platforms 04 00014 g022
Table 1. Overall feature coverage across reviewed studies.
CriterionPapers%
XAI6/2326%
Visual analytics13/2357%
KPIs19/2383%
Recommendations19/2383%
Table 2. Example of access and usage polices used in the data space of DSF.
Data ProviderUsage Policy/Rules
Milk IndustryPermissionPermission of usage is provided to
specific connector of DSF
and for research purposes
Prohibitionwith prohibition of no-forwarding
(the Consumer is forbidden from
sending this data to any third-party
connector)
Obligationand obligation to wipe data
after use (the Consumer’s connector
must delete the local copy of the
data at a specific timestamp
(60 days after receiving the data))
Automotive SupplierPermissionPermission of usage is provided to
specific connector of DSF
and for research purposes
Prohibitionwith prohibition of no-forwarding
Obligationand obligation to wipe data
after use (the Consumer’s connector
must delete the local copy of the
data at a specific timestamp
(30 days after receiving the data))
Machinery ManufacturerPermissionPermission of usage is provided to
specific connector of DSF
and for research purposes
Prohibitionwith prohibition of no-forwarding
Obligationand obligation to wipe data
after use (the Consumer’s connector
must delete the local copy of the
data at a specific timestamp
(60 days after receiving the data))
Table 3. Mapping between pilot-specific indicators and generic fuzzy input variables.
Indicator TypeExample IndicatorsMapped Fuzzy VariableMapping Logic
Technical/process-quality KPIsrejection_rate, quality_kpi, product-quality indicatorsQualityNegative KPIs, such as rejection rate, are inversely mapped, positive quality KPIs are directly mapped.
Model-performance indicatorsaccuracy, recall, F1-score, precision, mAP, confidence, drift indicatorsModelsHigher model performance contributes to higher membership in the Models: high fuzzy set, while poor or unstable model behaviour contributes to lower membership.
Table 4. Fuzzy logic rules for all use cases.
Rule #QualityModelsAction PlanInterpretation
Rule 1highhighlowProcess quality and model reliability are both high, no major intervention is required.
Rule 2highmediummediumProcess quality is acceptable, but model reliability requires attention.
Rule 3highlowmediumProcess quality appears acceptable, but the model output should be checked.
Rule 4mediumhighmediumPossible process degradation is detected while the model remains reliable, user notification is recommended.
Rule 5mediummediummediumModerate process and model uncertainty, inspection is recommended.
Rule 6mediumlowhighProcess uncertainty combined with low model reliability requires stronger intervention.
Rule 7lowhighhighA quality issue is detected with reliable model support, corrective action is recommended.
Rule 8lowmediumhighA quality issue is detected, and additional explanation or expert inspection is required.
Rule 9lowlowhighCritical uncertainty, human validation and possible model refinement or retraining are required.
Table 5. Operational interpretation of the generated action plans.
Action Plan Linguistic LevelOperational Meaning
lowSimple notification indicating that the production process is performing as expected.
medium1. Notification about the KPI values.
2. Recommendation to conduct XAI analysis of the model.
3. Information on how to improve KPIs based on historical data, if available.
4. Notification about products whose production deviates from the expected behavior.
high1. Alert generated from the dashboard.
2. Recommendation to conduct XAI analysis of the model.
3. Information on how to improve KPIs based on historical data, if available.
4. Notification about products whose production deviates from the expected behavior.
5. Root-cause-oriented investigation, if applicable.
6. Human validation or model refinement/retraining, if required.
Disclaimer/Publisher’s Note: The statements, opinions and data contained in all publications are solely those of the individual author(s) and contributor(s) and not of MDPI and/or the editor(s). MDPI and/or the editor(s) disclaim responsibility for any injury to people or property resulting from any ideas, methods, instructions or products referred to in the content.