


Abstract
Familial Alzheimer’s disease (FAD) is an accelerated form of dementia affecting cholinergic neurons. Despite several efforts, no single drug or treatment has demonstrated complete efficacy. Therefore, finding effective therapeutic agents is imperative. Previous studies have shown that the PSEN1 I416T variant induces FAD-like neuropathology in cholinergic-like neurons (ChLNs), characterized by the intracellular accumulation of the Aβ (iAβ) peptide, the oxidation of the stress sensor protein DJ-1, the abnormal phosphorylation of the tau protein at serine 202/threonine 205 (pS202/T205), the loss of mitochondrial membrane potential (ΔΨm), and activation of the pro-apoptotic proteins tumor protein 53 (TP53), Jun proto-oncogene, AP-1 transcription factor subunit (c-JUN), p53 upregulated modulator of apoptosis (PUMA), and cleaved caspase-3 (CC3). We report for the first time that PSEN1 I416T induces abnormal phosphorylation of Leucine-rich repeat kinase 2 (LRRK2) kinase at residue serine 935 (S935), concomitant with phosphorylated alpha-synuclein (αSYN) at residue serine 129 (S129) and abnormal accumulation of autophagosomes and atypical increase in vesicular lysosomal pH, thereby provoking a profound alteration in autophagy in ChLNs. Here, we also demonstrate for the first time that the potent LRRK2 inhibitor PF-06447475 (hereafter referred to as PF475) almost completely attenuated PSEN1 I416T-induced proteinopathy, oxidative stress (OS), and apoptosis and improve autophagy to an activity comparable to untreated wild-type (WT) ChLNs. Overall, PF475 restored the survival of mutant ChLNs. Taken together, these findings suggest that PF475 is an excellent pharmacological tool with which to investigate the regulation of LRRK2-associated pathological signaling in the PSEN1 I416T familial Alzheimer’s disease (FAD) model.
1. Introduction
Alzheimer’s disease (AD) is a form of dementia that affects memory, thinking, and behavior [1], triggered by specific structural and functional losses of cholinergic neuronal projections from the nucleus basalis of Meynert (Ch4) to the cortex and from the medial septal nucleus (Ch1) to the hippocampus [2,3,4]. AD is typically characterized by the deposition of amyloid plaques formed by the extracellular accumulation of Aβ42 (eAβ42), intracellular accumulation of the abnormally phosphorylated protein TAU, and neuronal and synaptic loss [5]. AD can be classified as familial AD (FAD, with an onset age of <64 years) or sporadic AD (SAD, with an onset age of >65 years). Interestingly, FAD is more severe, both clinically and neuropathologically, than SAD [6]. To date, at least three highly penetrant mutated genes, named amyloid precursor protein (APP) gene (APP, >100 variants), presenilin (PSEN) 1 (PSEN1, >350 variants), and PSEN2 (>80 variants) (https://www.alzforum.org/mutations/psen-1, accessed on 26 January 2026), as well as polygenic risk variants, have been identified that are genetically associated with FAD [7,8]. Specifically, a missense mutation in the PSEN1 gene, known as PSEN1 I416T, resulting from an isoleucine to threonine residue substitution at codon 416, has been identified to cause familial early onset (EO) AD in large family communities in Colombia [9,10]. Unfortunately, no effective therapeutic approaches are currently available for the delay or prevention of this type of familial AD. Therefore, alternative therapeutic strategies are needed. However, the development of such therapeutics has been hampered by the lack of a valid in vitro or in vivo model of FAD. In addition, the identification of target proteins associated with PSEN1 pathology has been a challenging task.
Our laboratory has shown that PSEN1 I416T ChLNs exhibit not only the typical high eAβ42/Aβ40 ratio and abnormal phosphorylation of TAU at pathogenic residues serine 202/threonine 205 (S202/T205), but also accumulation of intracellular Aβ (iAβ) fragments and OS, as evidenced by oxidation of the sensor protein DJ-1 (i.e., DJ-1Cysteine 106-SO3); phosphorylation of the transcription factor Jun proto-oncogene; AP-1 transcription factor subunit (c-JUN) at pathogenic residues S63/S73; loss of mitochondrial membrane potential (ΔΨm); expression of apoptosis (a type of regulated cell death) markers such as tumor protein 53 (TP53) and cleaved caspase-3 (CC3); and irresponsiveness to acetylcholine (ACh)-induced Ca2+ ion influx as evidence of neuronal dysfunction [11]. Interestingly, several molecules of natural (e.g., curcumin) and synthetic chemical origin (e.g., SP600125, methylene blue, 4-phenylbutyric acid, tramiprosate), alone or in combination, have almost completely reversed the neuropathologic features of PSEN1 I416T mutant ChLNs [12,13]. All of these reagents work either as anti-amyloidogenic, anti-TAU, antioxidant, and/or specific target blockers. With the exception of Jun N-terminal kinase (JNK) [12], no other major regulatory protein has been identified that is associated with Aβ- and TAU-induced OS and apoptosis in the ChLNs model of FAD.
Leucine-rich region kinase 2 (LRRK2), a multifunctional Parkinson’s disease (PD) kinase [14], was recently shown to be endogenously phosphorylated at residue S935 in PSEN1 E280A ChLNs [15]. In addition, phosphorylated alpha synuclein (p-αSyn) at the pathogenic residue S129 (pS129-αSyn) was also found concomitantly with pS935-LRRK2 in the same mutant ChLNs [15]. Because pS935-LRRK2 not only phosphorylates pS129-αSyn [16] but may also be involved in OS [17,18], apoptosis [19,20], and autophagy [21], among other cellular functions [22,23] in typical PD dopaminergic neurons, we suspected that the neuropathological hallmark of PD αSyn may coexist with FAD and that LRRK2 protein may function in both diseases. However, the mechanism by which LRRK2 induces the coexistence of αSyn, Aβ, and TAU in mutant PSEN1 ChLNs is unknown. Therefore, elucidating the role of LRRK2 may be an important consideration in understanding the pathogenesis of FAD and refining future clinical trials. Given that inhibition of LRRK2 kinase protects nerve-like differentiated cells from OS (e.g., ROS/H2O2) induced cell death [24,25,26], we theorized that specific inhibition of LRRK2 might protect mutant PSEN1 ChLNs from Aβ-induced OS and apoptosis.
To test this hypothesis, we obtained wild-type (WT) and PSEN1 I416T ChLNs derived from menstrual stromal cells (MenSCs), a valid model of FAD ([27] and Supplementary Figure S1). After treatment with the specific LRRK2 kinase inhibitor PF-06447475 (hereafter referred to as PF475 [28]), cellular and biochemical analysis showed that this inhibitor (i) effectively inhibited LRRK2 kinase, and that it almost completely reestablished the (ii) proteinopathy (e.g., iAβ, p-TAU, αSyn), (iii) OS (e.g., DJ-1 Cys106-SO3; DFC-positive cells), (iv) apoptosis (e.g., loss of ΔΨm, TP53, p53-upregulated modulator of apoptosis (PUMA), CC3), and (v) dysfunctional autophagy–lysosomal pathway (ALP e.g., accumulation of autophagosomes, acidic pH lysosomal vacuolar activity) in PSEN1 I416T ChLNs. Taken together, our data suggest that the use of the PF475 agent might be beneficial for reducing iAβ-, TAU-, and αSyn-induced ChLNs damage in FAD.
2. Results
2.1. Inhibitor LRRK2 PF475 Inhibits the Phosphorylation of LRRK2 Kinase in PSEN1 I416T ChLNs
We first evaluated whether LRRK2 kinase would be active in PSEN1 I416T and whether PF475 would block p-LRRK2. As shown in Figure 1, WT ChLNs expressed active pS935-LRRK2 at basal levels (Figure 1A), but the inhibitor reduced phosphorylated LRRK2 by −67% (Figure 1B). Interestingly, PSEN1 I416T ChLNs increased endogenously active phosphorylated LRRK2 by +144% (Figure 1C) compared to untreated WT ChLNs (Figure 1A). Upon exposure to PF475, pS935-LRRK2 in PSEN1 I416T was reduced by −54% (Figure 1D) compared to untreated mutant ChLNs or reduced to basal levels (Figure 1A vs. Figure 1D). The LRRK2 protein was expressed at nearly 100% total LRRK2 kinase levels in all neuronal cells (Figure 1A’–D’). Overall, PF475 reduced the ratio of pS935-LRRK2 (Figure 1E) to total LRRK2 (Figure 1A’–D’,F) by approximately 3.2-fold and 2.2-fold in WT and mutant ChLNs, respectively (Figure 1G). Similar results were obtained by fluorescence microscopy analysis (Figure 1H–N).
Figure 1.
PF475 inhibits pS935-LRRK2 in wild-type (WT) and PSEN1 I416T cholinergic-like neurons (ChLNs) reducing LRRK2 phosphorylation to basal levels. WT and PSEN1 I416T MenSCs were cultured in a cholinergic differentiation medium, as described in the Section 4, in the absence or presence of PF475 (1 μM). (A–D) Representative flow cytometry density plot with density contour analysis showing phosphorylated LRRK2-positive cells at residue S935 (A–D), total LRRK2-positive cells (A’–D’) in WT PSEN1 (A,B) or PSEN1 I416T ChLNs (C,D) in the absence (A,C) or presence (B,D) of PF475. (E–G) Quantification of pS935-LRRK2-positive cells (E), total LRRK2-positive cells (F), and the pS935/total LRRK2 ratio (G). (H–K) Representative immunofluorescence merge image showing pS935-LRRK2 in WT (H,I) or PSEN1 I416T ChLNs (J,K) in the absence (H,J) or presence (I,K) of PF475 stained with antibodies against total LRRK2 (H’–K’, red fluorescence), pS935-LRRK2 (H”–K”, green fluorescence). The nuclei were counterstained using Hoechst 33342 (H’’’–K’’’, blue fluorescence). (L–N) Mean fluorescence intensity (MFI) quantification of pS935-LRRK2 (L), total LRRK2 (M), and the pS935/total LRRK2 ratio (N). Figures represent one of three independent experiments (n = 3). Results are represented as mean ± standard deviation. Statistical significance was analyzed using one-way ANOVA followed by Tukey’s test * p < 0.05, ** p < 0.01, *** p < 0.001. Images were taken at 200× magnification.
2.2. PF475 Inhibits the Phosphorylation of αSynuclein (αSyn)
Next, we investigated whether PSEN1 I416T expresses pS129-αSyn and whether PF475 inhibits αSyn phosphorylation. Figure 2 shows that αSyn was phosphorylated at similar basal levels in untreated WT ChLNs (Figure 2A) or treated with PF475 (Figure 2B). While endogenous pS129-αSyn increased by +240% in PSEN1 I416T (Figure 2C) compared to untreated WT ChLNs, upon exposure to PF475, p-αSyn decreased by −59% in mutant neurons (Figure 2D) compared to untreated mutant ChLNs. Since total αSyn protein was nearly 100% in all neuronal cells (Figure 2A’–D’), PF475 reduced the ratio of pS129-αSyn (Figure 2E)/t-αSyn (Figure 2F) by 2.85-fold in PSEN1 I475T ChLNs (Figure 2G). Similar observations were obtained by fluorescence microscopy analysis (Figure 2H–N).
Figure 2.
PF475 reduces pathological phosphorylation of αSynuclein (pS129-αSYN) in WT and PSEN1 I416T cholinergic-like neurons (ChLNs). WT and PSEN1 I416T MenSCs were cultured in a cholinergic differentiation medium, as described in the Section 4, in the absence or presence of PF475 (1 μM). (A–D) Representative flow cytometry density plot with density contour analysis showing phosphorylated αSyn-positive cells at residue S129 (A–D), total αSyn-positive cells (A’–D’) in WT PSEN1 (A,B) or PSEN1 I416T ChLNs (C,D) in the absence (A,C) or presence (B,D) of PF475. (E–G) Quantification of pS129-αSyn-positive cells (E), total LRRK2-positive cells (F), and the pS129/total αSyn ratio (G). (H–K) Representative immunofluorescence merge image showing pS129-αSyn in WT (H,I) or PSEN1 I416T ChLNs (J,K) in the absence (H,J) or presence (I,K) of PF475 stained with antibodies against total αSyn (H’–K’, red fluorescence), pS129-αSyn (H”–K”, green fluorescence). The nuclei were counterstained using Hoechst 33342 (H’’’–K’’’, blue fluorescence). (L–N) Mean fluorescence intensity (MFI) quantification of pS129-αSyn (L), total αSyn (M), and the pS129/total αSyn ratio (N). Figures represent one of three independent experiments (n = 3). Results are represented as mean ± standard deviation. Statistical significance was analyzed using one-way ANOVA followed by Tukey’s test * p < 0.05, *** p < 0.001. Images were taken at 200× magnification.
2.3. PF475 Diminishes Accumulation of iAβ, Oxidization of Protein DJ-1, and Phosphorylated TAU Protein in PSEN1 I416T ChLNs
We next sought to determine whether PF475 reduces the intracellular accumulation of Aβ (iAβ) and the OS marker oxDJ-1, which is a major target of ROS/(H2O2) [29] and whether it blocks pS202/T205-TAU in mutant ChLNs [11]. As shown in Figure 3, while untreated WT ChLNs (Figure 3A,F) or inhibitor-treated ChLNs (Figure 3B,G) expressed similar basal levels of iAβ (Figure 3E) and oxDJ-1 (Figure 3J), mutant I416T ChLNs increased iAβ and oxidized DJ-1 (oxDJ-1) by +560% (Figure 3C) and +660% (Figure 3H), respectively, compared to WT ChLNs (Figure 3E,J). Upon exposure to PF475, PSEN1 I416T dramatically reduced iAβ and oxDJ-1 by −73% (Figure 3D) and −78% (Figure 3I), respectively (Figure 3E,J). Similar observations were obtained by fluorescence microscopy analysis (Figure 3K–P).
Figure 3.
PF475 blocks reactive oxygen species (ROS) -induced oxidation of DJ-1 (oxDJ-1) and intracellular Aβ (iAβ) accumulation in PSEN1 I416T cholinergic-like neurons (ChLNs). WT and PSEN1 I416T MenSCs were cultured in a cholinergic differentiation medium as described in the Section 4, in the absence or presence of PF475 (1 μM). (A–D) Representative flow cytometry density plot with density contour analysis showing iAβ-positive cells in WT PSEN1 (A,B) or PSEN1 I416T ChLNs (C,D) in the absence (A,C) or presence (B,D) of PF475. (E) Quantification of iAβ. (F–I) Representative flow cytometry density plot with density contour analysis showing oxDJ-1-positive cells in WT PSEN1 (F,G) or PSEN1 I416T ChLNs (H,I) in the absence (F,H) or presence (G,I) of PF475. (J) Quantification of oxDJ-1. (K–N) Representative immunofluorescence merge image showing oxDJ-1 and iAβ in WT (K,L) or PSEN1 I416T ChLNs (M,N) in the absence (K,M) or presence (L,N) of PF475 stained with antibodies against oxDJ-1 (K’–N’, green fluorescence), or iAβ (K”–N”, red fluorescence). The nuclei were counterstained using Hoechst 33342 (K’’’–N’’’, blue fluorescence). (O,P) Mean fluorescence intensity (MFI) quantification of oxDJ-1 (O) and iAβ (P). Figures represent one of three independent experiments (n = 3). Results are represented as mean ± standard deviation. Statistical significance was analyzed using one-way ANOVA followed by Tukey’s test ** p < 0.01, *** p < 0.001. Images were taken at 200× magnification.
Like iAβ and oxDJ-1, PF475 decreased phosphorylated TAU (Figure 4). Indeed, p-TAU was expressed at similar basal levels in untreated (Figure 4A) or treated WT ChLNs (Figure 4B). PSEN1 I416T showed an increase of p-TAU by +580% (Figure 4C), but upon PF475 treatment, p-TAU decreased by −240% (Figure 4D) in PSEN1 I416T compared to untreated mutant ChLNs (Figure 4E). Calculation of the proportion of phosphorylated TAU shows that PF475 reduced the ratio of p-TAU to total TAU protein (Figure 4A’–D’,F) by 2.75-fold in PSEN1 I416T (Figure 4G). Similar observations were obtained by fluorescence microscopy analysis (Figure 4H–N).
Figure 4.
PF475 reduces pS202/T205-TAU protein levels in PSEN1 I416T cholinergic-like neurons (ChLNs). WT and PSEN1 I416T MenSCs were cultured in a cholinergic differentiation medium as described in the Section 4, in the absence or presence of PF475 (1 μM). (A–D) Representative flow cytometry density plot with density contour analysis showing phosphorylated TAU-positive cells at residue S202/T205 (A–D), total TAU-positive cells (A’–D’) in WT PSEN1 (A,B) or PSEN1 I416T ChLNs (C,D) in the absence (A,C) or presence (B,D) of PF475. (E–G) Quantification of pS202/T205-TAU-positive cells (E), total TAU-positive cells (F), and the pS202/T205/total TAU ratio (G). (H–K) Representative immunofluorescence merge image showing pS202/T205-TAU in WT (H,I) or PSEN1 I416T ChLNs (J,K) in the absence (H,J) or presence (I,K) of PF475 stained with antibodies against total TAU (H’–K’, red fluorescence), pS935-LRRK2 (H”–K”, green fluorescence). The nuclei were counterstained using Hoechst 33342 (H’’’–K’’’, blue fluorescence). (L–N) Mean fluorescence intensity (MFI) quantification of pS202/T205-TAU (L), total TAU (M), and the pS202/T205/total TAU ratio (N). Figures represent one of three independent experiments (n = 3). Results are represented as mean ± standard deviation. Statistical significance was analyzed using one-way ANOVA followed by Tukey’s test * p < 0.05, ** p < 0.01, *** p < 0.001. Images were taken at 200× magnification.
2.4. PF475 Increases Mitochondrial Membrane Potential (ΔΨm) and Reduces Reactive Oxygen Species (ROS) Generation in PSEN1 I416T ChLNs
Previous findings have shown that PSEN1 I416T ChLNs exhibit loss of ΔΨm and high production of ROS [11]. Therefore, we wanted to evaluate the effect of PF475 on mitochondria and on ROS. Indeed, PSEN1 I416T ChLNs decreased ΔΨm by −37% (Figure 5A) and produced ROS by +800% (Figure 5C) compared to WT ChLNs (Figure 5B,D). When exposed to PF475, it was harmless to WT ChLNs (Figure 5A–D), but induced an increase of ΔΨm by +45% (Figure 5A,B) and significantly reduced the generation of ROS by −83% in mutant neurons (Figure 5C,D). Similar observations were documented by fluorescence microscopy analysis (Figure 5E–J).
Figure 5.
PF475 increases mitochondrial potential (ΔΨm) and blocks reactive oxygen species (ROS) accumulation in PSEN1 I416T cholinergic-like neurons (ChLNs). WT and PSEN1 I416T MenSCs were cultured in a cholinergic differentiation medium as described in the Section 4, in the absence or presence of PF475 (1 μM). (A) Representative flow cytometry histograms showing the percentage of cells with increased mitochondrial membrane potential (ΔΨm) in PSEN1 WT and I416T ChLNs in the absence or presence of PF475. (B) Quantification of the percentage of MitoTracker-positive cells for the same groups. (C) Representative flow cytometry histograms showing ROS levels detected with DCF in PSEN1 WT and I416T ChLNs in the absence or presence of PF475. (D) Quantification of the percentage of DCF-positive cells for the same groups. (E–H) Representative immunofluorescence merge image showing DCF-positive and Mitotracker fluorescent cells in WT (E,F) or PSEN1 I416T ChLNs (G,H) in the absence (E,G) or presence (F,H) of PF475 stained with DCFH2-DA (E’–H’, green fluorescence) or Mitotracker (E”–H”, red fluorescence). The nuclei were counterstained using Hoechst 33342 (E’’’–H’’’, blue fluorescence). (I,J) Mean fluorescence intensity (MFI) quantification of DFC (I), and Mitotracker (J). Figures represent one of three independent experiments (n = 3). Results are represented as mean ± standard deviation. Statistical significance was analyzed using one-way ANOVA followed by Tukey’s test * p < 0.05, ** p < 0.01, *** p < 0.001. Images were taken at 200× magnification.
2.5. PF475 Diminishes Cell Death Signaling Transcription Factor TP53 and PUMA Protein in PSEN1 I416T ChLNs
Since PSEN1 I416T endogenously activates TP53 and PUMA [11], we investigated whether LRRK2 might be involved in the activation of these signaling molecules. To this end, WT and PSEN1 ChLNs were left untreated or treated with PF475. As shown in Figure 6, TP53 (Figure 6A) and PUMA (Figure 6F) were expressed at basal levels in untreated WT neurons and were not affected by the presence of PF475 (Figure 6B,E,G,J). However, mutant ChLNs endogenously expressed TP53 (Figure 6C) and PUMA (Figure 6H) by +540% and +550%, respectively, in PSEN1 I416T compared to untreated WT ChLNs (Figure 6E,J). Upon treatment with PF475, TP53 (Figure 6D) and PUMA (Figure 6I) were reduced by −59% and −64%, respectively, in PSEN1 I416T ChLNs (Figure 6E,J). Similar results were obtained by fluorescence microscopy analysis (Figure 6K–P).
Figure 6.
PF475 mitigates cell death signaling by reducing TP53 and PUMA expression in PSEN1 I416T cholinergic-like neurons (ChLNs). WT and PSEN1 I416T MenSCs were cultured in a cholinergic differentiation medium as described in the Section 4, in the absence or presence of PF475 (1 μM). (A–D) Representative flow cytometry density plot with density contour analysis showing TP53-positive cells in WT PSEN1 (A,B) or PSEN1 I416T ChLNs (C,D) in the absence (A,C) or presence (B,D) of PF475. (E) Quantification of TP53. (F–I) Representative flow cytometry density plot with density contour analysis showing PUMA-positive cells in WT PSEN1 (F,G) or PSEN1 I416T ChLNs (H,I) in the absence (F,H) or presence (G,I) of PF475. (J) Quantification of PUMA. (K–N) Representative immunofluorescence merge image showing PUMA and TP53 in WT (K,L) or PSEN1 I416T ChLNs (M,N) in the absence (K,M) or presence (L,N) of PF475 stained with antibodies against PUMA (K’–N’, green fluorescence) or TP53 (K”–N”, red fluorescence). The nuclei were counterstained using Hoechst 33342 (K’’’–N’’’, blue fluorescence). (O,P) Mean fluorescence intensity (MFI) quantification of PUMA (O) and TP53 (P). Figures represent one of three independent experiments (n = 3). Results are represented as mean ± standard deviation. Statistical significance was analyzed using one-way ANOVA followed by Tukey’s test * p < 0.05, ** p < 0.01, *** p < 0.001. Images were taken at 200× magnification.
2.6. PF475 Decreases Pro-Death Transcription Factor c-JUN and Executor Protein Cleaved Caspase-3 (CC3)
In addition, we tested whether PF475 could also block the activation of c-JUN and caspase-3, referred to as CC3 [11]. Figure 7 shows that untreated or treated WT expressed similar low basal levels of p-c-JUN at pathological Ser63/73 (Figure 7A,B) and inactive CC3 (Figure 7F,G), respectively. While PSEN1 I416T expressed p-c-JUN (Figure 7C) and CC3 (Figure 7H) by +617% and +620%, respectively, compared to untreated WT neurons (Figure 7E,J), the inhibitor decreased both markers by −58% (Figure 7D) and −83% (Figure 7I), respectively, compared to untreated mutant cells (Figure 7E,J). Fluorescence microscopy analysis showed similar results (Figure 7K–P).
Figure 7.
PF475 reduces pro-death transcription factor c-JUN and executor protein cleaved caspase-3 (CC3) in PSEN1 I416T cholinergic-like neurons (ChLNs). WT and PSEN1 I416T MenSCs were cultured in a cholinergic differentiation as described in the Section 4, in the absence or presence of PF475 (1 μM). (A–D) Representative flow cytometry density plot with density contour analysis showing pS63/73-c-JUN-positive cells in WT PSEN1 (A,B) or PSEN1 I416T ChLNs (C,D) in the absence (A,C) or presence (B,D) of PF475. (E) Quantification of pS63/73-c-JUN. (F–I) Representative flow cytometry density plot with density contour analysis showing CC3-positive cells in WT PSEN1 (F,G) or PSEN1 I416T ChLNs (H,I) in the absence (F,H) or presence (G,I) of PF475. (J) Quantification of CC3. (K–N) Representative immunofluorescence merge image showing CC3 and pS63/73-c-JUN in WT (K,L) or PSEN1 I416T ChLNs (M,N) in the absence (K,M) or presence (L,N) of PF475 stained with antibodies against CC3 (K’–N’, green fluorescence) or pS63/73-c-JUN (K”–N”, red fluorescence). The nuclei were counterstained using Hoechst 33342 (K’’’–N’’’, blue fluorescence). (O,P) Mean fluorescence intensity (MFI) quantification of CC3 (O) and pS63/73-c-JUN (P). Figures represent one of three independent experiments (n = 3). Results are represented as mean ± standard deviation. Statistical significance was analyzed using one-way ANOVA followed by Tukey’s test * p < 0.05, *** p < 0.001. Images were taken at 200× magnification.
2.7. PF475 Relieves PSEN1 I416T-Induced Dysfunctional Autophagy–Lysosomal Pathway (ALP) in ChLNs
Accumulating evidence indicates that PSEN1 mutations or knockout (KO) impair ALP function [30,31]. Therefore, we investigated the effect of PF475 on ALP in PSEN1 I416T and WT ChLNs in the absence or presence of PF475, assessing lysosomal acidification using LysoTracker Green® DND-26 and monitoring LC3-II levels to track autophagosome formation [32].
As shown in Figure 8, untreated WT ChLNs showed a basal level of autophagosome development, as evidenced by 7% LC3-II marker (Figure 8A), whereas PSEN1 I416T ChLNs showed an increase in LC3-II marker of +243% (Figure 8B), reflecting the accumulation of autophagosomes. Interestingly, WT ChLNs treated with PF475 increased LC3-II by +57% (Figure 8C), reflecting the enhancement of autophagosome development, but mutant ChLNs treated with PF475 dramatically reduced LC3-II by −45% (Figure 8D). Similar observations were made by fluorescence microscopy analysis (Figure 8A,H–S). For illustrative purposes, rapamycin (RAP), a positive inducer of autophagy [33], and bafilomycin A1 (BAF), a selective inhibitor of lysosomal vATPase [34], were included as control compounds. As expected, RAP increased LC3-II by +114% (Figure 8E,G,L,N), but BAF dramatically induced LC3-II accumulation by +628% in WT ChLNs (Figure 8F,G,M,N).
Figure 8.
PF475 improves autophagy–lysosomal pathway (ALP) functionality in PSEN1 I416T cholinergic-like neurons (ChLNs). WT and PSEN1 I416T MenSCs were cultured in a cholinergic differentiation medium as described in the Section 4, in the absence or presence of PF475 (1 μM). (A–D) Representative flow cytometry density plot with density contour analysis showing LC3-II-positive cells in WT PSEN1 (A,B) or PSEN1 I416T ChLNs (C,D) in the absence (A,C) or presence (B,D) of PF475, and WT cells treated with either rapamycin (1 nM RAP, (E)) or bafilomycin (1 nM BAF, (F)). Quantification of LC3-II (G). (H–M) Representative immunofluorescence merge image showing LC3-II in WT (H,I) or PSEN1 I416T ChLNs (J,K) in the absence (H,J) or presence (I,K) of PF475, and WT cells treated with either rapamycin (RAP, (L)) or bafilomycin (BAF, (M)) stained with antibodies against LC3-II (H’–M’, red fluorescence). The nuclei were counterstained using Hoechst 33342 (H”–M”, blue fluorescence). (N) Mean fluorescence intensity (MFI) quantification of LC3-II. Figures represent one of three independent experiments (n = 3). Results are represented as mean ± standard deviation. Statistical significance was analyzed using one-way ANOVA followed by Tukey’s test * p < 0.05, ** p < 0.01, *** p < 0.001. Images were taken at 200× magnification.
Analysis of acidic vesicles (i.e., lysosomes) using LysoTracker Green® DND-26 reagent shows that WT ChLNs had a basal percentage of LysoTracker Green® DND–26-positive cells of 20% (Figure 9A) and that the mutant ChLNs reduced the percentage of LysoTracker Green® DND–26-positive cells by −35% (Figure 9B) compared to untreated WT ChLNs. Figure 9C shows that PF475 had no effect on WT ChLNs (Figure 9C); however, mutant ChLNs increased LysoTracker Green® DND-26-positive cells to almost control levels when exposed to this inhibitor (Figure 9D). Fluorescence microscopy analysis revealed similar results (Figure 9H–K,N). As expected, WT ChLNs exposed to RAP showed no significant change in the acidification of vacuoles (lysosomes, Figure 9E,G,L,N), but ChLNs exposed to BAF significantly decreased the detection of LysoTracker Green® DND–26-positive cells by −122% (Figure 9F,G,M,N).
Figure 9.
PF475 restores lysosomal pathway functionality in PSEN1 I416T cholinergic-like neurons (ChLNs). WT PSEN1 and I416T MenSCs were cultured in a cholinergic differentiation medium as described in the Section 4, in the absence or presence of PF475 (1 μM). (A–D) Representative flow cytometry density plot with density contour analysis showing LysoTracker Green® DND-26-positive cells in WT PSEN1 (A,B) or PSEN1 I416T ChLNs (C,D) in the absence (A,C) or presence (B,D) of PF475, and WT cells treated with either rapamycin (1 nM RAP, (E)) or bafilomycin (1 nM BAF, (F)). Quantification of LysoTracker Green® DND-26 (G). (H–M) Representative fluorescence merge image showing LysoTracker Green® DND-26 in WT (H,I) or PSEN1 I416T ChLNs (J,K) in the absence (H,J) or presence (I,K) of PF475, and WT cells treated with either rapamycin (RAP, (L)) or bafilomycin (BAF, (M)) stained with LysoTracker Green® DND-26 (H’–M’, green fluorescence). The nuclei were counterstained using Hoechst 33342 (H”–M”, blue fluorescence). (N) Mean fluorescence intensity (MFI) quantification of LysoTracker Green® DND-26. Figures represent one of three independent experiments (n = 3). Results are represented as mean ± standard deviation. Statistical significance was analyzed using one-way ANOVA followed by Tukey’s test * p < 0.05, ** p < 0.01, *** p < 0.001. Images were taken at 200× magnification.
3. Discussion
In the present investigation, we confirm that PSEN1 I416T ChLNs displayed the typical pathological phenotype of FAD, including accumulation of iAβ, generation of OS, oxidation of the OS sensor protein DJ-1, and expression of pS202/T205-TAU, as well as loss of ΔΨm, and expression of the apoptosis markers TP53, pS63/73-c-JUN, and CC3 [11]. Interestingly, similarly to PSEN1 E280A [15], mutant I416T neurons also exhibited endogenous pS935-LRRK2 and pS129-αSyn. Our data suggest that LRRK2 may be a common kinase involved in the pathophysiology of AD and PD [35]. However, whether pS935-LRRK2/pS129-αSyn contributes to the deterioration of cholinergic neurons in brain of FAD patients remains to be elucidated [36] and merits further investigation.
Collectively, PSEN1 variants could function through PSEN/γ secretase-dependent or -independent pathways, as shown in Figure 10. Importantly, iAβ induces apoptosis either through H2O2-induced signal transduction pathways [37] or through mitochondrial damage [38]. In fact, Aβ-induced H2O2 acts as a second messenger molecule [39], directly or indirectly involved in the oxidation of several proteins, including DJ-1 [40], activation of transcription factors (e.g., JNK/c-JUN) [41], and kinases such as LRRK2 (p-LRRK2, e.g., through the IKK pathway) [42], ultimately leading to neuronal cell death [43]. Accumulating evidence suggests that once activated, pS935-LRRK2 may function as an upstream regulator kinase involved in OS and apoptosis associated with PD [17,18,26,44].
In fact, a significant reduction in ROS/H2O2 could subsequently stop further H2O2-induced associated signaling, including pS935-LRRK2 and mitochondrial damage [43]. This observation may also explain why PF475 rescued ΔΨm in PSEN1 I416T ChLNs. Interestingly, pS935-LRRK2 indirectly activates JNK [45], which in turn either phosphorylates and downregulates nuclear factor erythroid 2-related factor 2 (Nfr2) [46], which is involved in xenobiotic detoxification and expression of cytoprotective proteins [47,48], or inhibits PRDX3 activity [49]. Therefore, blocking p-LRRK2 might increase the expression of antioxidant proteins and enhance peroxireductase activity. Third, PF475 decreased pS202/T205-TAU. A possible explanation for this observation is that PF475 might break the Aβ-driven JNK > p-TAU axis [50] by blocking LRRK2 [51]. Finally, as noted above, PF475 not only increased ΔΨm and reduced OS, but it also significantly reduced the apoptotic executioner protein CC3 in I416T ChLNs. This result is not surprising given that the upstream deleterious signaling had already been eliminated. As a proof of concept, PF475 dramatically reduced pS63/S73-c-JUN, TP53, and PUMA. Thus, specific inhibition of p-LRRK2 by PF475 results in deactivation of the cell death cascade JNK > TP53, c-JUN > PUMA > loss of ΔΨm > CC3.
In addition to phosphorylating α-Syn through protein–protein interactions [16] or via chaperone proteins (e.g., 14-3-3 proteins, HSP70, and HSP90 [52]), p-LRRK2 has been shown to phosphorylate at least three key target molecules. (i) It activates MKK4, which activates the pro-apoptotic factor c-JUN via, for example, the MKK4/JNK pathway [45]; (ii) it activates the mitochondrial fission dynamin-like protein 1 (DLP-1) protein, which, together with the fission protein-1 (Fis-1) receptor [53], induces mitochondrial depolarization, fragmentation, and aggregation [54]; (iii) it inactivates peroxiredoxin 3 (PRDX3) [49], thereby preventing H2O2 catalysis. We therefore postulate that abnormal LRRK2 kinase activity may also play a critical role in AD. Indeed, Henderson and coworkers [55] have demonstrated abundant Aβ pathology, prominent pS202/T205-TAU, and pS129-αSyn pathology in 12 brain samples from LRRK2 mutation carriers. Taken together, these observations suggest that p-LRRK2 and αSyn PD-associated proteinopathy are consistent with comorbid AD pathology.
Figure 10.
A schematic representation of a proposed model of cell signaling induced by PSEN1/γ-secretase and the effect of PF475 in PSEN1 I416T ChLNs. (A) PSEN1/γ secretase-dependent signaling mechanism. The PSEN1 gene encodes a 467 aa (catalytic and) non-catalytic PSEN1 I416T protein that, by a mechanism not yet fully understood, alters the metabolism of the type I transmembrane protein APP by overproducing iAβ (1). The iAβ peptide binds to the ubiquinone binding site of mitochondrial complex I (NADH: ubiquinone oxidoreductase), preventing electron transfer via flavin mononucleotide (FMN) to coenzyme Q10. Interruption of the electron transport chain simultaneously generates an anion, superoxide (O2−), and hydrogen peroxide (H2O2) (2). The latter is capable of either directly oxidizing the stress sensor protein DJ-1Cys106-SH to DJ-1Cys106-SO3 (3), or indirectly activates LRRK2 (leucine-rich repeat kinase 2) kinase through IKK pathway (4). Once LRRK2 is phosphorylated at S935, the active p-S935 LRRK2 kinase phosphorylates four major targets: (i) alpha-synuclein (αSyn) at the pathological residue S129 (5); (ii) inactivates protein peroxiredoxin 3 (PRDX3), preventing H2O2 catalysis; and (iii) activates the mitochondrial fission protein DLP-1 (dynamin-like protein 1), which, together with the fission protein-1 (Fis-1) receptor, induces loss of mitochondrial potential (ΔΨm) (6). Finally, (iv) pS935-LRRK2 indirectly phosphorylated JNK, which in turn repressed Nrf2-associated expression of antioxidant proteins, phosphorylated protein TAU (at S202/T205 [55], 7), and activated the transcription factors TP53 and c-JUN (8). Both TP53 and c-JUN factors transcribe PUMA (9), a BH-3-only Bcl-2 protein involved in further mitochondrial depolarization. Impairment of mitochondrial potential leads to the release of apoptogenic proteins (e.g., cytochrome C), resulting in the production of cleaved caspase-3 (10), which is responsible for chromatin condensation and DNA fragmentation (11), typical apoptotic features in PSEN1 I416T ChLNs. PSEN1/γ-secretase-independent signaling mechanism. Alternatively, PSEN1 binds directly to the V0a1 subunit of v-ATPase, affecting its maturation and assembly of the v-ATPase complex. The reduced catalytic activity of v-ATPase leads to a decrease in lysosomal pH (12), thereby limiting enzymatic degradation of obsolete components of the cell itself or toxic elements, such as Aβ. In addition, the fusion of autophagosomes and lysosomes is impaired (13), leading to their respective accumulation in mutant ChLNs. (B) Upon exposure to PF475 (14), p-LRRK2-associated apoptosis signaling is drastically reduced (faint grey line). As a result, reactivated PRDX3 activity and increased expression of Nfr2-induced antioxidant proteins (15), thereby decreasing Aβ-induced ROS/H2O2 (2), increasing ΔΨm (6), and increasing degradation of iAβ (16) through improvment of the function of the autophagy–lysosomal pathway (17), and activation of the lysosomal β-glucocerebrosidase (GCase) enzyme. All these actions lead to global neuronal recovery and survival of PSEN1 I416T ChLNs (18).
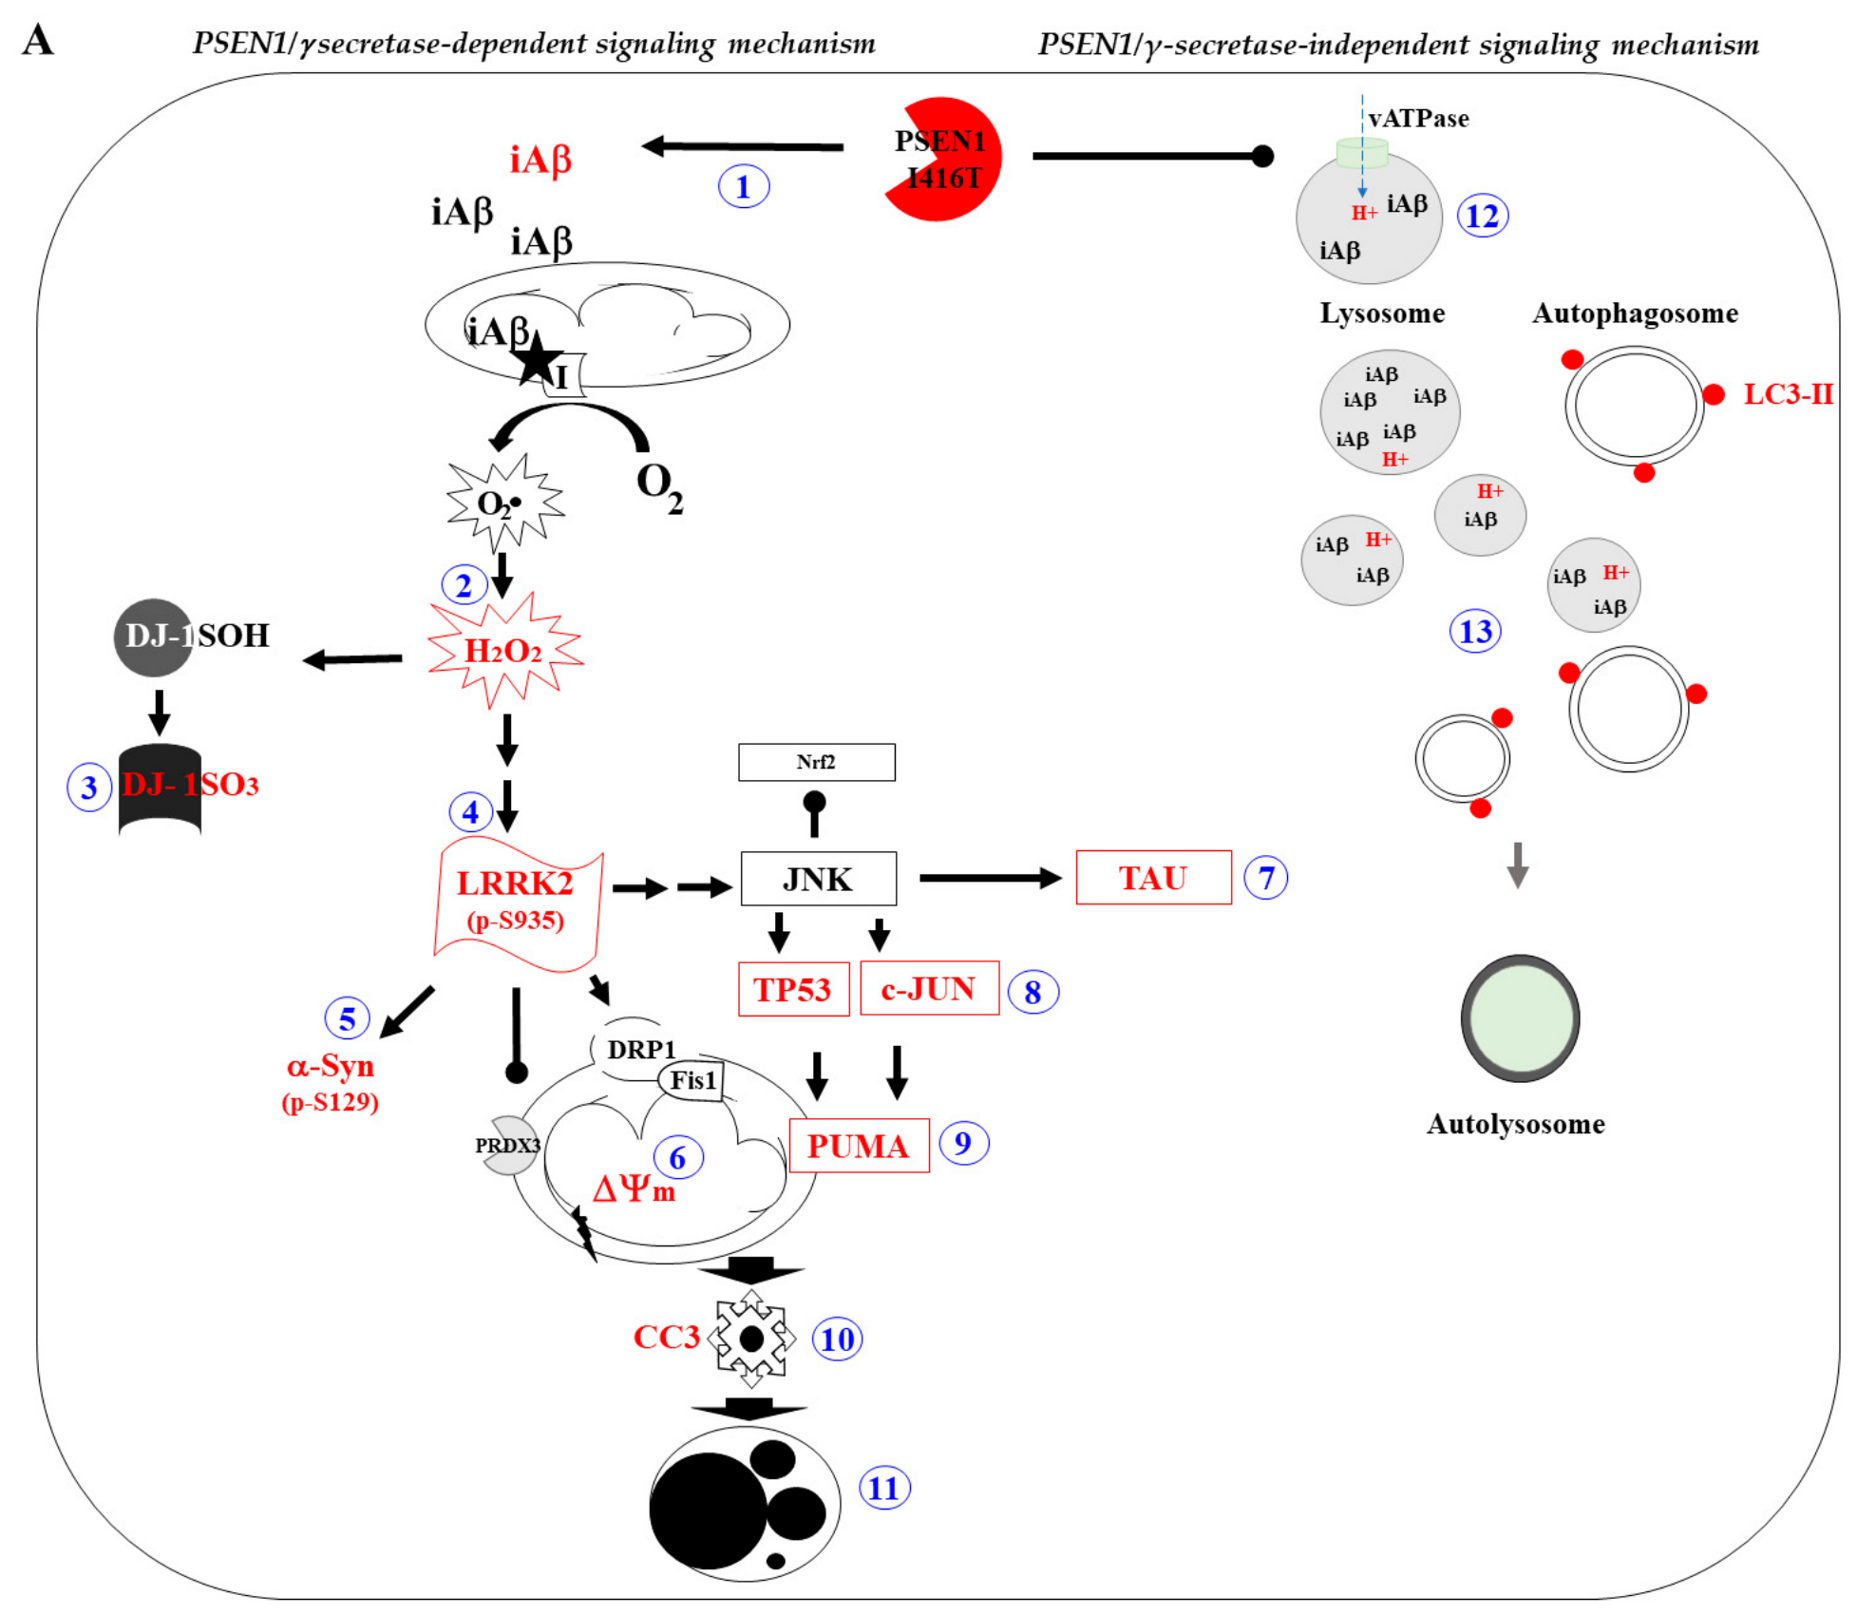
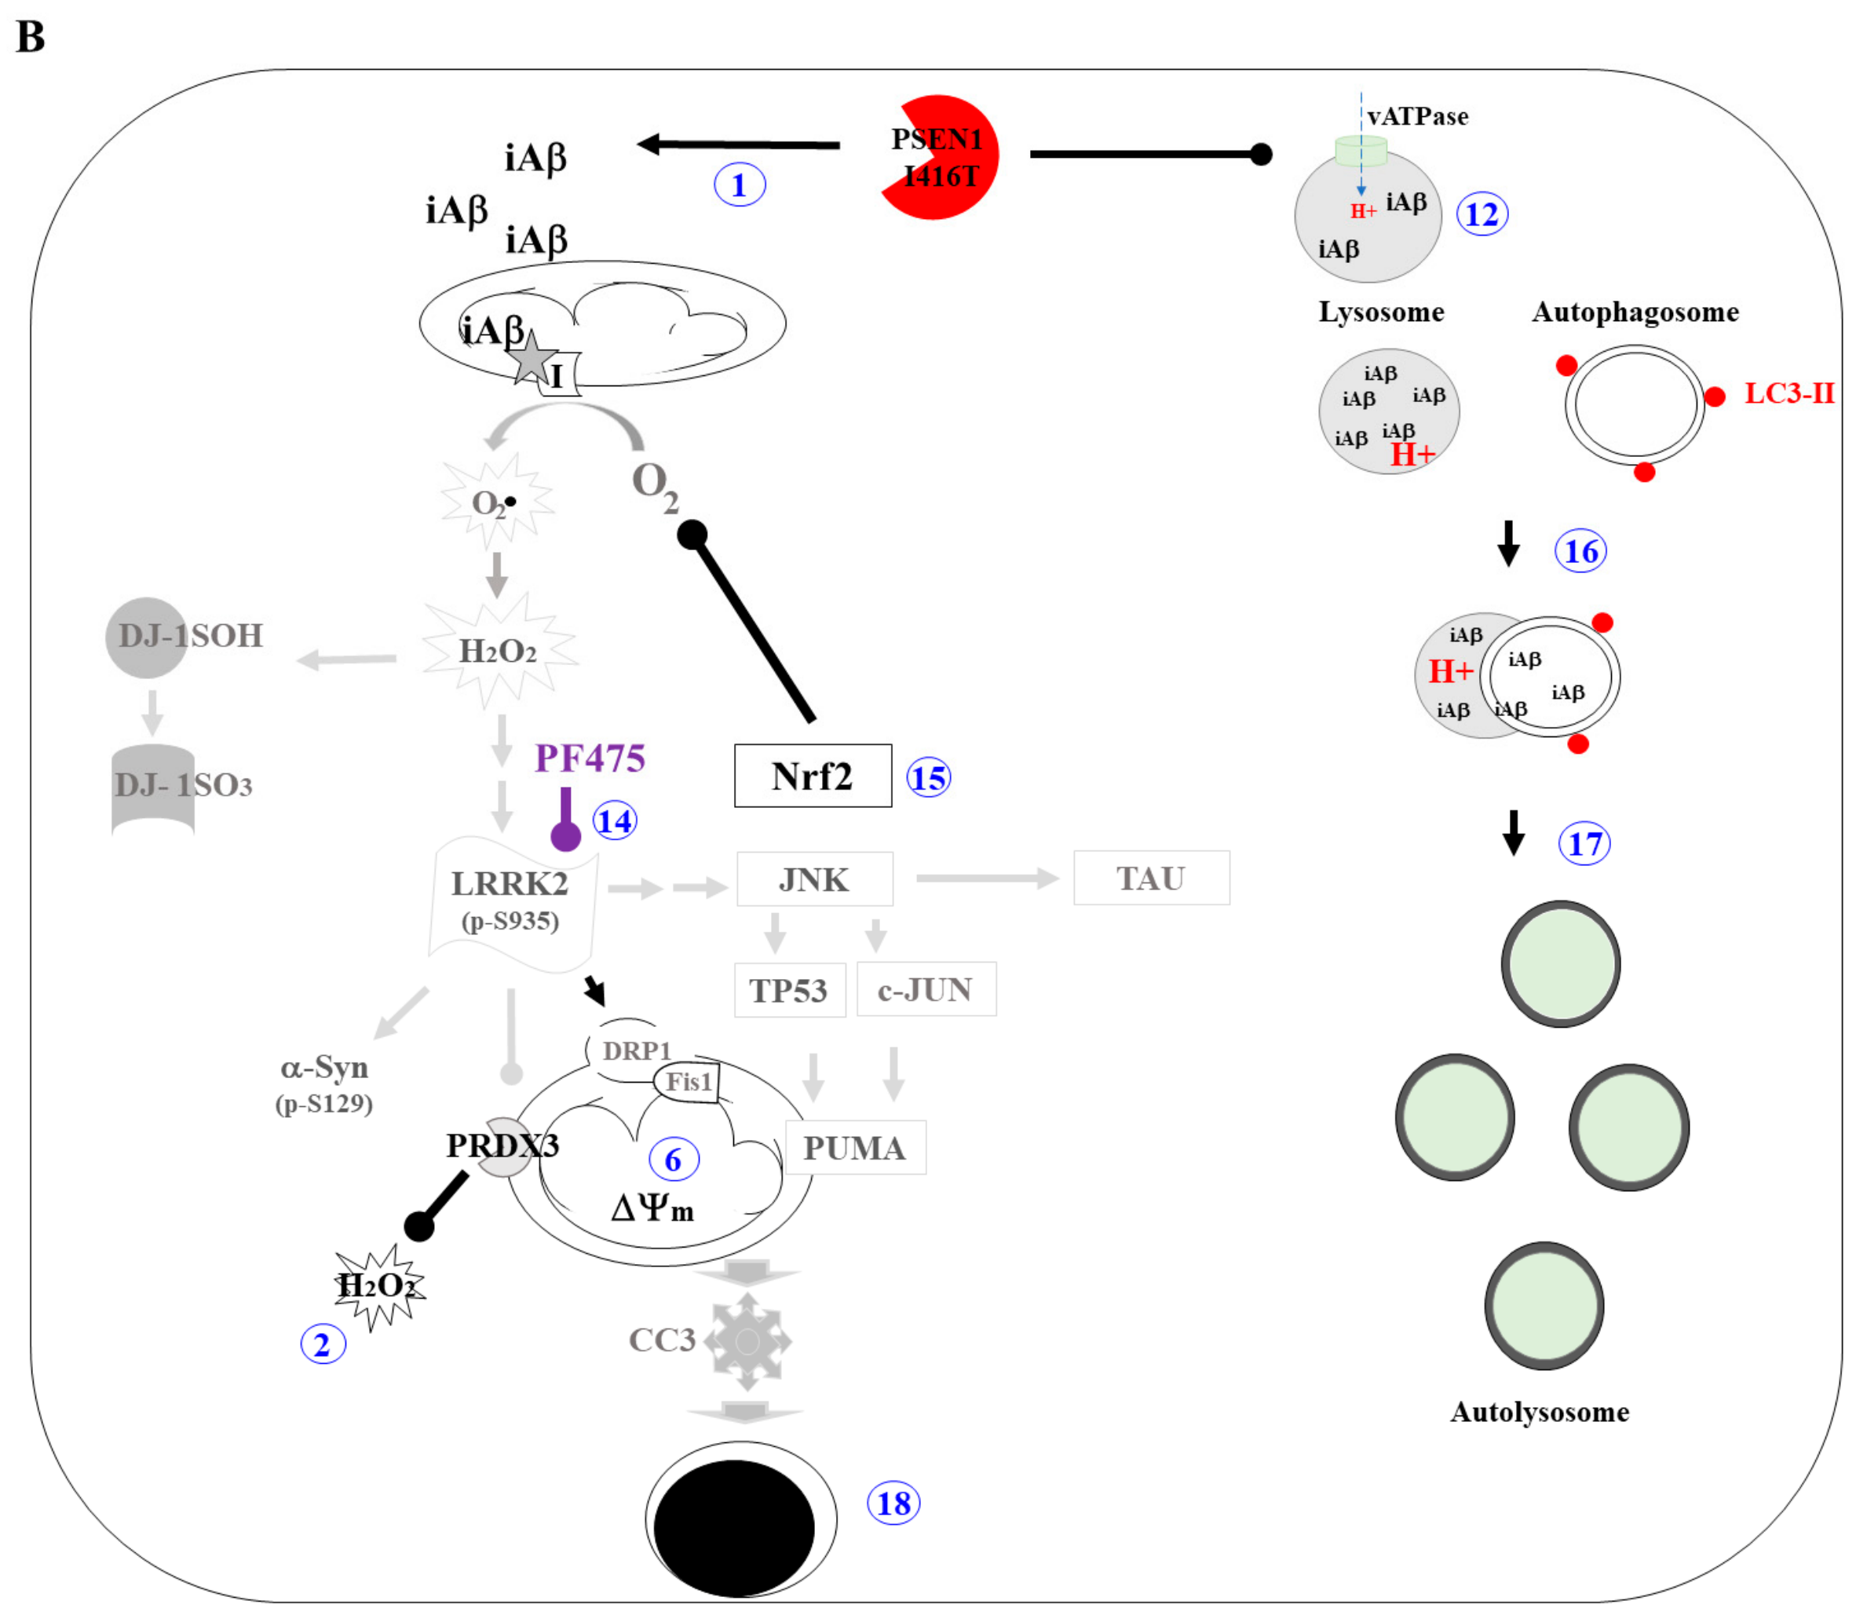
Here, we show that the LRRK2 inhibitor PF475 attenuated proteinopathy, OS, apoptosis, and dysfunctional ALP in PSEN1 I416T ChLNs (Figure 10B). This premise is supported by several observations. First, as expected, PF475 inhibited the phosphorylation of p-LRRK2 at S935 in I416T ChLNs to a comparable percentage of phosphorylation observed in inhibitor-treated WT ChLNs. As a result, pS129-αSyn in I416T ChLNs also decreased to a basal percentage of phosphorylation. These observations suggest a direct relationship between pS935-LRRK2 and pS129-αSyn and may serve as a distinctive pathological marker in FAD. However, p-LRRK2 and p-αSyn have not been systematically investigated as neuropathological markers in AD/FAD. Therefore, for pathological analysis, both markers should be included as routine tests in future AD/FAD brain autopsy cases or searched for in autopsy cases in the brain bank with documented PSEN1 variants for qualitative and/or quantitative analysis. Second, PF475 efficiently reduced the accumulation of iAβ and oxDJ-1. Although the exact mechanism by which this inhibitor blocks Aβ and prevents oxidation of DJ-1 remains to be elucidated, PF475 may reduce iAβ by improving ALP, thereby increasing the clearance of Aβ fragments. Consequently, it might also reduce Aβ-induced generation of OS via mitochondrial complex I, which is one of the major sources of ROS/H2O2 [56]. These results suggest a functional link between LRRK2 signaling and the PSEN1 I416T FAD ChLNs phenotype.
In addition, we report for the first time that mutant ChLNs exhibit abnormal ALP. In fact, I416T ChLNs are biologically similar to WT ChLNs treated with BAF. Indeed, we found that mutant ChLNs increased the accumulation of autophagosomes according to the LC3-II assay, but lysosome detection according to LysoTracker Green® DND-26 was limited in I416T ChLNs. These observations suggest that the I416T mutation most likely affects the functionality of lysosomes by decreasing their lysosomal pH to a more basic rather than acidic vesicular environment through the loss of V0a1 vATPase subunits, which are normally involved in the transport of H+ to lysosomal vesicles [30].
Some data suggest that PSEN1 is required for proper autophagy in neurons [57,58]. Indeed, it was found that knockout (KO) or mutations in PSEN1 altered substrate proteolysis and autophagosome clearance during autophagy by failing PS1-dependent targeting of the v-ATPase V0a1 subunit to lysosomes, resulting in selective impairment of autolysosome acidification [30]. Alternatively, PSEN1 deficiency may cause autophagy suppression in human neuronal stem cells through downregulation of the ERK/CREB pathway [59]. Whatever the mechanism, PSEN1 is essential for v-ATPase targeting to lysosomes and proteolysis during autophagy. Consistent with this view, in this study, PSEN1 I416T induced a significant accumulation of autophagosomes (i.e., as evidenced by a high percentage of LC3-II-positive cells) and decreased lysosomal acidification (as indicated by a low fluorescence signal according to the LysoTracker Green® DND-26 assay), resulting in defective Aβ-dependent autophagy–lysosomal proteolysis, as reflected by the accumulation of iAβ in ChLNs. Notably, PSEN1 I416T variant-induced ALP defects mimic WT ChLNs upon BAF exposure. This observation suggests that the I416T mutation may be involved in the impairment of lysosomal acidification and Aβ proteolysis. Remarkably, PF475 improved ALP-associated alterations by increasing the development of autophagosomes and partially normalized LC3-II accumulation and lysosomal acidification which suggests an improvement in the function of the autophagy–lysosomal pathway. One possible explanation is that p-LRRK2 could decrease autophagosome–lysosome fusion and maintain lysosomal pH by directly binding to H+-ATPase [60]. However, LRRK2 is also involved in ALP, including regulation of phagophore and autophagosome formation, autophagosome–lysosome fusion, lysosomal maturation, calcium levels, and lysosomal protein degradation [21]. Indeed, p-LRRK2 phosphorylates the regulator of intracellular membrane trafficking Ras-related protein 10 (Rab-10) at residue T73 [61], thereby inducing lysosomal β-glucocerebrosidase (GCase) enzyme dysfunction and ALP impairment [62]. Whatever the mechanism, LRRK2 mutations may disrupt lysosomal function in a kinase-dependent manner. Therefore, the specific inhibition of p-LRRK2 could improve the activity of the ALP in PSEN1 I416T ChLNs [62]. Taken together, these findings suggest that PF475 improves the function of the altered ALP and thereby detoxifies ChLNs from the accumulation of iAβ. These results suggest a functional link between LRRK2 signaling and the PSEN1 I416T FAD ChLNs model and the PSEN1 I416T FAD ChLNs phenotype.
Several therapeutic attempts to treat AD, including immunotherapy [63] and non-drug therapies [64], have either failed or shown limited efficacy. Part of the reason for these puzzling results may be the limited knowledge of Aβ pathophysiology (e.g., ref. [65]). Some data suggest that iAβ, rather than eAβ, may be the earliest insult involved in the destruction of cholinergic and/or hippocampal neurons in human AD brain [66,67,68,69], rodents [70,71], and in vitro models of FAD [11,27,72]. Therefore, drug discovery efforts targeting iAβ or iAβ-induced signaling molecules should be the primary focus for future therapeutic strategies [43]. Here, we show that PF475 directly blocks p-LRRK2 and indirectly promotes the deactivation of pro-death proteins and normalization of ALP in mutant ChLNs. Thus, PF475 reveals that LRRK2 may be a potential druggable kinase for the design of pharmacological treatment of FAD, as has been proposed for PD [73]. Interestingly, PF-06447475 is one of the inhibitors that has advanced to the pre-clinical in vivo stage. Radiolabeled [11C]PF-06447475 has shown binding specificity for LRRK2, with high bound radioactivity detected in several regions of the rat brain, including the striatum, cerebral cortex, and hippocampus. In contrast, low bound radioactivity was observed in the pons and cerebellum [74]. Notably, these are the same regions implicated in Alzheimer’s disease (AD) [5]. PF-06447475 is a potent, brain-penetrant, ATP-competitive inhibitor of LRRK2 [75]. However, using a single compound does not entirely eliminate the possibility of pharmacological effects unrelated to LRRK2. Future comparative studies may be highly informative, using structurally distinct inhibitors, including MLi-2, GSK2578215A, the GNE series, DNL201, and BIIB122/DNL151, to demonstrate robust engagement with the LRRK2 target in in vitro and in vivo studies [76,77]. Therefore, further studies repeating the protective phenotype using one or more of these chemically distinct inhibitors, and measuring the direct LRRK2 substrate pT73-Rab10 in combination with genetic LRRK2 suppression studies, might provide stronger evidence that the observed effects are specifically mediated by the inhibition of LRRK2 kinase signaling.
This study is the first to report that PF475 protects against Alzheimer’s disease-associated pathology in PSEN1 I416T cholinergic-like neurons.
However, the potential usefulness of PF475 for treating FAD requires further validation in preclinical and clinical studies.
4. Materials and Methods
4.1. Obtention of Menstrual Stromal Cells Derived Cholinergic-like Neurons
The procedure for differentiation followed the guidelines is described in ref. [78]. Menstrual blood was collected from two donors: a healthy individual (Tissue Bank Code, TBC #540871) and an asymptomatic patient with familial Alzheimer’s disease (FAD) (TBC #45000). The procedure of obtaining MenSCs occurred from multiple (2–3) menstrual cycle. The cells derived from the healthy donor were identified and characterized as wild type (WT), while the cells from the patient with FAD were identified and characterized as PSEN1 I416T, as reported previously [11]. The consent form for participation was distributed to all participants and signed. Indeed, both donors signed informed consent forms, which were approved by the ethics committee of the Sede de Investigación Universitaria (SIU) at the University of Antioquia, Medellín, Colombia (Act 2020-10-846, approval date 26 August 2020). Consent was obtained from all participants in the research. The mesenchymal stem cells (MSCs) were initially seeded at a density of 1–1.5 × 10⁴ cells/cm2 on plates coated with laminin using a standard culture medium (RCm) that included low-glucose DMEM (Gibco cat# 11885084, Grand Island, NY, USA) and 10% fetal bovine serum (FBS, Gibco cat# A5256701, Grand Island, NY, USA) for 24 h. After this period, the culture medium was switched to a cholinergic differentiation medium, known as Ch-N-Rm, which comprised DMEM/F-12 Nutrient Mixture (Gibco cat# 10565018, Grand Island, NY, USA), 1% fetal bovine serum (BSA), and a specific mix of nerve growth factors as cited elsewhere [79]. This process was maintained at 37 °C for 7 days. The transdifferentiated cells (85–100% double cholinergic marker choline acetyltransferase (ChAT)/vesicular acetylcholine transporter (VAChT)-positive cells) were designated as WT or PSEN1 I416T ChLNs. After the initial transdifferentiation phase, the ChLN cells were cultured for an additional four days in regular culture medium (RCm) to eliminate any elements (e.g., growth factors) in Ch-N-Rm that might interfere with the experiment’s accuracy and data interpretation.
4.2. Assay Protocol
PF-06447475 (PF475, Sigma-Aldrich cat# PZ0248, St. Louis, MO, USA), a selective LRRK2 inhibitor, was used at an optimal concentration of 1 µM. This concentration was used because it effectively inhibited the phosphorylation of LRRK2 kinase at serine 935 (S935), completely prevented the generation of reactive oxygen species (ROS), and significantly reversed all apoptosis signaling and oxidative stress markers induced by rotenone, used as control, restoring them to levels comparable to the control as shown by [15,24]. For these analyses, the ChLN cells were divided into four groups: (i) untreated WT; (ii) WT treated with PF475 (1 µM); (iii) untreated PSEN1 I416T; and (iv) PSEN1 I416T treated with PF475 (1 µM). The chemical inhibition assay was performed by pre-incubating the ChLN cells with PF475 (1 µM) for 4 days in regular culture medium (RCm).
4.3. Immunofluorescence Analysis
The detection of markers associated with Alzheimer’s disease, oxidative stress, and cell death was conducted following the method outlined by [11], and theoretical considerations as described in Ref. [80]. Briefly, cells subjected to various treatments, as previously described, were initially fixed with 4% paraformaldehyde for 20 min, followed by permeabilization using 0.1% Triton X-100 (Sigma-Aldrich cat# X100, St. Louis, MO, USA) and a blocking step with 10% bovine serum albumin (BSA). For staining, cells were incubated overnight at 4 °C with primary antibodies targeting several specific proteins, as detailed in Table 1. These antibodies include those for detecting the N-terminal amino acids of the Aβ peptide, total and phosphorylated tau for evaluating tau pathology, and oxidized DJ-1 for assessing oxidative stress. Antibodies against α-synuclein and LRRK2 were also used to evaluate protein aggregation and LC3-II (cat #NB100-2220, Novus Biologicals, Englewood, CO, USA) to monitor autophagic flux. To analyze markers of apoptosis, cells were stained with primary antibodies conjugated to fluorescent dyes, such as those against PUMA, TP53, phospho-c-JUN, and a caspase-3 activity fluorescent probe. Additionally, to evaluate lysosomal activity, cells were incubated with LysoTracker Green® DND-26 (50 nM, cat #L7526, Thermo Fisher Scientific, Waltham, MA, USA) in combination with LC3-II antibody staining to monitor autophagic vesicles. After thorough washing, the cells were incubated with appropriate secondary fluorescent antibodies, as specified in Table 1, to visualize primary antibody binding.
Table 1.
List of antibodies used for immunofluorescence (IF) staining and flow cytometry (FC) analysis of protein aggregation, oxidative stress, neurodegeneration, apoptosis, autophagy flux, and lysosomal activity.
4.4. Flow Cytometry Analysis
After each treatment, cells were detached using trypsin and then centrifuged for 10 min at 2000 rpm. The cells were subsequently washed with phosphate-buffered saline (PBS) and fixed overnight in cold 96% ethanol. Following two additional washes with PBS, the cells were permeabilized for 30 min using a solution containing 0.2% Triton X-100 and 1.5% bovine serum albumin (BSA). The permeabilized cells were then incubated overnight at 4 °C with primary antibodies targeting various proteins, including markers for Alzheimer’s disease, OS, and apoptosis, as outlined in Table 1. After thorough rinsing to remove unbound primary antibodies, the cells were incubated with the appropriate secondary fluorescent antibodies, also detailed in Table 1, diluted to 1:500. Fluorescence was measured using a BD LSRFortessa II flow cytometer (BD Biosciences, San Jose, CA, USA), with cells (WT and PSEN1 I416T ChLN) not treated with primary antibodies serving as the negative control. Data from 10,000 events were collected for each sample. These data files were then exported in fcs format and analysed using FlowJo™ software (version 10.8.1; FlowJo LLC, Ashland, OR, USA), which generated quantitative figures and visualisations. Event analysis was performed by identifying cell populations that exceeded the baseline fluorescence of the negative control (measured at 488 nm or 594 nm), which facilitated the creation of density plots and histograms to visualize the distribution and intensity of fluorescence across different cell populations [81].
4.5. Assessment of Intracellular Reactive Oxygen Species (ROS) by Fluorescence Microscopy and Flow Cytometry
To evaluate intracellular reactive oxygen species (ROS), we employed 2′,7′-dichlorofluorescein diacetate (5 μM, DCFH2-DA; Invitrogen cat #D399, Carlsbad, CA, USA). ChLNs were maintained in RCm for four days. Subsequently, cells (5 × 10³) were treated with DCFH2-DA for 30 min at 37 °C in the dark. Following this, cells were washed, and the fluorescence intensity of DCF was assessed using fluorescence microscopy. The nuclei were counterstained with Hoechst 33342 (0.5 μM). The experiment was conducted three times to ensure reliability. For a complementary analysis, cells (1 × 10⁴) were subjected to the same DCFH2-DA treatment and then analyzed using flow cytometry with an LSRFortessa (BD Biosciences). The quantitative data were analyzed with FlowJo™ software (version 10.8.1). This assessment was also performed in triplicate, with both the experimenter and the flow cytometer analyst being blind to the experimental conditions.
4.6. Evaluation of Mitochondrial Membrane Potential (ΔΨm) by Fluorescence Microscopy and Flow Cytometry
To assess mitochondrial membrane potential (ΔΨm), ChLNs were cultured in regular medium (RCm) for four days. Cells (5 × 10³) were then incubated with MitoTracker deep red dye (20 nM, final concentration; cat# M22426, Invitrogen, Waltham, MA, USA) for 20 min at room temperature in the dark. Following the incubation, cells were washed twice with PBS, and MitoTracker fluorescence intensity was analyzed using fluorescence microscopy. The nuclei were counterstained with Hoechst 33342 (0.5 μM). This procedure was repeated in three independent experiments to ensure consistency. For a complementary analysis, ChLNs (1 × 10⁴) were treated with the same MitoTracker dye and subsequently analyzed using an LSRFortessa flow cytometer (BD Biosciences). Data acquisition was performed for 10,000 events per sample, and the results were analyzed using FlowJo 10.8.1 software. The flow cytometry-based assessment was also repeated three times, with both the experimenter and the flow cytometer analyst being blind to the experimental conditions.
4.7. Imaging and Quantitative Analysis of Fluorescence Microscopy Data
Optical and fluorescence microscopy images were acquired using a Zeiss Axio Vert.A1 microscope with an AxioCam Cm1 (Carl Zeiss Microscopy GmbH, Jena, Germany). For fluorescence microscopy, the Zeiss Axio Vert.A1 Fluorescence Microscope was employed. Fluorescence images were processed by converting them into 8-bit format and subtracting the background using Zen 3.4 blue edition software. Subsequent analysis of the images was performed between October 2024 and July 2025 using ImageJ software, version 1.54k (https://imagej.net/downloads, accessed 15 October 2024), with a custom macro. Regions of interest (ROIs) were delineated around nuclei for analyzing transcription factors and apoptosis markers or around the entire cell body for cytoplasmic probes. Fluorescence intensity was measured by applying a uniform threshold across control and treatment conditions. The mean fluorescence intensity (MFI) was calculated by normalizing the total fluorescence to the number of nuclei, with a standard of 250 nuclei per analysis.
4.8. Experimental Design and Statistical Analysis
The study included cells derived from menstrual stromal cells (MenSCs), from one wild-type donor and one donor carrying the PSEN1 I416T variant. The entire cell expansion, neuronal differentiation, treatment, and analysis workflow was conducted three times using cell preparations that were cultured independently. Therefore, n = 3 denotes independent experimental repetitions rather than independent donors. Within each experiment, treatments were randomly assigned to separate wells, which were considered the experimental units [82]. Individual cells, microscopy fields, and flow cytometry events within each well were treated as subsamples and summarized to generate one value per condition and experimental repetition. The Shapiro–Wilk test was used to evaluate data distribution, and Levene’s test was used to assess homogeneity of variance. When the assumptions were met, statistical comparisons were performed using one-way ANOVA followed by Tukey’s multiple comparison test. Data are presented as mean ± SD. Statistical significance was defined as follows: * p < 0.05, ** p < 0.01, *** p < 0.001. This study’s limitation is its use of only one donor per genotype, which impairs the generalization across individuals. This could be overcome in future studies by using additional donors or isogenic PSEN1-corrected cell lines.
5. Conclusions
Despite the cellular and molecular complexity of AD [83], we have identified for the first time LRRK2 as an upstream regulatory kinase protein involved in cell death and abnormal ALP in PSEN1 I416T ChLNs. Indeed, LRRK2 kinase activity directly or indirectly modulates the accumulation of intracellular neurotoxic proteins (e.g., Aβ, pS202/T205-TAU, pS129-αSyn), generation of OS (e.g., ROS/H2O2; oxDJ-1), loss of ΔΨm, abnormal activation of apoptotic transcription factors (e.g., TP53, c-JUN), apoptogenic proteins (e.g., PUMA, CC3), accumulation of autophagosomes, and alteration of acidic lysosomal vacuoles in PSEN1 I416T ChLNs (Figure 10A). Interestingly, PF475 significantly reduced proteinopathy (e.g., iAβ, p-TAU, αSyn) and OS, improved ALP, and reduced apoptosis, thereby restoring the survival of mutant ChLNs (Figure 10B). Therefore, we report for the first time that PF-06447475 protects against Alzheimer’s disease-associated pathology in PSEN1 I416T cholinergic-like neurons.
In summary, PF-06447475 was found to reduce several cellular abnormalities associated with PSEN1 I416T in ChLNs FAD, including changes in LRRK2-related phosphorylation, proteinopathy, OS, mitochondrial dysfunction, altered apoptotic signaling, and changes in autophagy–lysosomal markers. These results suggest a functional link between LRRK2 signaling and the PSEN1 I416T FAD ChLNs model.
However, further research is needed to establish whether LRRK2 is the primary upstream driver of the neuropathology associated with the PSEN1 I416T FAD ChLNs phenotype, and whether PF-06447475 constitutes a promising candidate for the treatment of PSEN1 I416T FAD patients. Future research should involve the use of different autophagic markers, such as SQSTM1/p62, direct LRRK2 substrate measurements, structurally unrelated inhibitors, and genetic manipulation of LRRK2 in preclinical models.
Therefore, our results suggest that PF475 is an excellent pharmacological tool for investigating the regulation of LRRK2-associated neuropathological signaling in the PSEN1 I416T ChLN FAD model.
Supplementary Materials
The following supporting information can be downloaded at: https://www.mdpi.com/article/10.3390/kinasesphosphatases4030027/s1, Figure S1. Wild-type presenilin 1 mesenchymal stromal cells (WT PSEN 1 MSCs) and PSEN 1 E280A MSCs transdifferentiated into cholinergic-like neurons (ChLNs).
Author Contributions
Conceptualization: M.J.-D.-R. and C.V.-P.; methodology, M.J.-D.-R. and C.V.-P.; validation, N.G.-S.; formal analysis, N.G.-S. and C.V.-P.; investigation, N.G.-S.; resources, M.J.-D.-R. and C.V.-P.; data curation, N.G.-S.; writing—original draft preparation, M.J.-D.-R. and C.V.-P.; writing—review and editing, N.G.-S., C.V.-P., and M.J.-D.-R.; visualization, M.J.-D.-R., and C.V.-P.; supervision, M.J.-D.-R.; project administration, M.J.-D.-R.; funding acquisition, M.J.-D.-R. and C.V.-P. All authors have read and agreed to the published version of the manuscript.
Funding
This research was funded by Colciencias/MinCiencias, grant number 1115-844-67062 (Approval Founding on 24 December 2019) (contract # 830-2019, code 2020-32092).
Institutional Review Board Statement
Menstrual specimen donors provided a signed informed consent and experimental protocols were approved by the ethics committee of the Sede de Investigación Universitaria (SIU), University of Antioquia, Medellín, Colombia (Act 2020-10-846) (Informed consent and experimental protocols were approved on 26 August 2020). All methods were carried out in accordance with relevant guidelines and research from Colombian regulations (Law 2253 of 2022 Congress of the Republic of Colombia).
Informed Consent Statement
Informed consent was obtained from all subjects involved in the study.
Data Availability Statement
All data generated or analyzed during this study are included in this published article.
Conflicts of Interest
The authors declare no conflicts of interest. The funders had no role in the design of the study; in the collection, analyses, or interpretation of data; in the writing of the manuscript; or in the decision to publish the results.
References
- López, O.L.; Dekosky, S.T. Clinical symptoms in Alzheimer’s disease. Handb. Clin. Neurol. 2008, 89, 207–216. [Google Scholar] [CrossRef] [Scilit] [PubMed]
- Fernández-Cabello, S.; Kronbichler, M.; Van Dijk, K.R.A.; Goodman, J.A.; Spreng, R.N.; Schmitz, T.W.; Alzheimer’s Disease Neuroimaging Initiative. Basal forebrain volume reliably predicts the cortical spread of Alzheimer’s degeneration. Brain 2020, 143, 993–1009. [Google Scholar] [CrossRef] [Scilit] [PubMed]
- Lin, C.P.; Frigerio, I.; Boon, B.D.C.; Zhou, Z.; Rozemuller, A.J.M.; Bouwman, F.H.; Schoonheim, M.M.; van de Berg, W.D.J.; Jonkman, L.E. Structural (dys)connectivity associates with cholinergic cell density in Alzheimer’s disease. Brain 2022, 145, 2869–2881. [Google Scholar] [CrossRef] [Scilit] [PubMed]
- Mieling, M.; Meier, H.; Bunzeck, N. Structural degeneration of the nucleus basalis of Meynert in mild cognitive impairment and Alzheimer’s disease—Evidence from an MRI-based meta-analysis. Neurosci. Biobehav. Rev. 2023, 154, 105393. [Google Scholar] [CrossRef] [Scilit] [PubMed]
- Doher, N.; Davoudi, V.; Magaki, S.; Townley, R.A.; Haeri, M.; Vinters, H.V. Illustrated Neuropathologic Diagnosis of Alzheimer’s Disease. Neurol. Int. 2023, 15, 857–867. [Google Scholar] [CrossRef] [Scilit] [PubMed]
- Mendez, M.F. Early-Onset Alzheimer Disease. Neurol. Clin. 2017, 35, 263–281. [Google Scholar] [CrossRef] [Scilit] [PubMed]
- Karch, C.M.; Goate, A.M. Alzheimer’s disease risk genes and mechanisms of disease pathogenesis. Biol. Psychiatry 2015, 77, 43–51. [Google Scholar] [CrossRef] [Scilit] [PubMed]
- Lill, C.M.; Bertram, L. Genome-wide analysis furthers decoding of Alzheimer disease genetics. Nat. Rev. Neurol. 2022, 18, 387–388. [Google Scholar] [CrossRef] [Scilit] [PubMed]
- Ramirez Aguilar, L.; Acosta-Uribe, J.; Giraldo, M.M.; Moreno, S.; Baena, A.; Alzate, D.; Cuastumal, R.; Aguillón, D.; Madrigal, L.; Saldarriaga, A.; et al. Genetic origin of a large family with a novel PSEN1 mutation (Ile416Thr). Alzheimer’s Dement. 2019, 15, 709–719. [Google Scholar] [CrossRef] [Scilit] [PubMed]
- Acosta-Uribe, J.; Aguillón, D.; Cochran, J.N.; Giraldo, M.; Madrigal, L.; Killingsworth, B.W.; Singhal, R.; Labib, S.; Alzate, D.; Velilla, L.; et al. A neurodegenerative disease landscape of rare mutations in Colombia due to founder effects. Genome Med. 2022, 14, 27. [Google Scholar] [CrossRef] [Scilit] [PubMed]
- Gomez-Sequeda, N.; Mendivil-Perez, M.; Jimenez-Del-Rio, M.; Lopera, F.; Velez-Pardo, C. Cholinergic-like neurons and cerebral spheroids bearing the PSEN1 p.Ile416Thr variant mirror Alzheimer’s disease neuropathology. Sci. Rep. 2023, 13, 12833. [Google Scholar] [CrossRef] [Scilit] [PubMed]
- Gomez-Sequeda, N.; Jimenez-Del-Rio, M.; Velez-Pardo, C. Combination of Tramiprosate, Curcumin, and SP600125 Reduces the Neuropathological Phenotype in Familial Alzheimer Disease PSEN1 I416T Cholinergic-like Neurons. Int. J. Mol. Sci. 2024, 25, 4925. [Google Scholar] [CrossRef] [Scilit] [PubMed]
- Gomez-Sequeda, N.; Jimenez-Del-Rio, M.; Velez-Pardo, C. The Antiproteinopathy, Antioxidant, and Antiapoptotic Effects of Methylene Blue and 4-Phenylbutyric Acid Alone, and in Combination on Familial Alzheimer’s Disease PSEN1 I416T Cholinergic-like Neurons. ACS Chem. Neurosci. 2024, 15, 3563–3575. [Google Scholar] [CrossRef] [Scilit] [PubMed]
- Berwick, D.C.; Heaton, G.R.; Azeggagh, S.; Harvey, K. LRRK2 Biology from structure to dysfunction: Research progresses, but the themes remain the same. Mol. Neurodegener. 2019, 14, 49. [Google Scholar] [CrossRef] [Scilit] [PubMed]
- Giraldo-Berrio, D.; Mendivil-Perez, M.; Velez-Pardo, C.; Jimenez-Del-Rio, M. Rotenone Induces a Neuropathological Phenotype in Cholinergic-like Neurons Resembling Parkinson’s Disease Dementia (PDD). Neurotox. Res. 2024, 42, 28. [Google Scholar] [CrossRef] [Scilit] [PubMed]
- Qing, H.; Wong, W.; McGeer, E.G.; McGeer, P.L. Lrrk2 phosphorylates alpha synuclein at serine 129: Parkinson disease implications. Biochem. Biophys. Res. Commun. 2009, 387, 149–152. [Google Scholar] [CrossRef] [Scilit] [PubMed]
- Keeney, M.T.; Rocha, E.M.; Hoffman, E.K.; Farmer, K.; Di Maio, R.; Weir, J.; Wagner, W.G.; Hu, X.; Clark, C.L.; Castro, S.L.; et al. LRRK2 regulates production of reactive oxygen species in cell and animal models of Parkinson’s disease. Sci. Transl. Med. 2024, 16, eadl3438. [Google Scholar] [CrossRef] [Scilit] [PubMed]
- Heo, H.Y.; Park, J.M.; Kim, C.H.; Han, B.S.; Kim, K.S.; Seol, W. LRRK2 enhances oxidative stress-induced neurotoxicity via its kinase activity. Exp. Cell Res. 2010, 316, 649–656. [Google Scholar] [CrossRef] [Scilit] [PubMed]
- Quintero-Espinosa, D.A.; Velez-Pardo, C.; Jimenez-Del-Rio, M. High Yield of Functional Dopamine-like Neurons Obtained in NeuroForsk 2.0 Medium to Study Acute and Chronic Rotenone Effects on Oxidative Stress, Autophagy, and Apoptosis. Int. J. Mol. Sci. 2023, 24, 15744. [Google Scholar] [CrossRef] [Scilit] [PubMed]
- Quintero-Espinosa, D.A.; Jimenez-Del-Rio, M.; Velez-Pardo, C. LRRK2 Kinase Inhibitor PF-06447475 Protects Drosophila melanogaster against Paraquat-Induced Locomotor Impairment, Life Span Reduction, and Oxidative Stress. Neurochem. Res. 2024, 49, 2440–2452. [Google Scholar] [CrossRef] [Scilit] [PubMed]
- Madureira, M.; Connor-Robson, N.; Wade-Martins, R. “LRRK2: Autophagy and Lysosomal Activity”. Front. Neurosci. 2020, 14, 498. [Google Scholar] [CrossRef] [Scilit] [PubMed]
- Taylor, M.; Alessi, D.R. Advances in elucidating the function of leucine-rich repeat protein kinase-2 in normal cells and Parkinson’s disease. Curr. Opin. Cell Biol. 2020, 63, 102–113. [Google Scholar] [CrossRef] [Scilit] [PubMed]
- Follett, J.; Farrer, M.J. LRRK2; a dynamic regulator of cellular trafficking. Brain Res. 2021, 1761, 147394. [Google Scholar] [CrossRef] [Scilit] [PubMed]
- Mendivil-Perez, M.; Velez-Pardo, C.; Jimenez-Del-Rio, M. Neuroprotective Effect the LRRK2 Kinase Inhibitor PF-06447475 in Human Nerve-Like Differentiated Cells Exposed to Oxidative Stress Stimuli: Implications for Parkinson’s Disease. Neurochem. Res. 2016, 41, 2675–2692. [Google Scholar] [CrossRef] [Scilit] [PubMed]
- Quintero-Espinosa, D.A.; Sanchez-Hernandez, S.; Velez-Pardo, C.; Martin, F.; Jimenez-Del-Rio, M. LRRK2 Knockout Confers Resistance in HEK-293 Cells to Rotenone-Induced Oxidative Stress, Mitochondrial Damage, and Apoptosis. Int. J. Mol. Sci. 2023, 24, 10474. [Google Scholar] [CrossRef] [Scilit] [PubMed]
- Ilieva, N.M.; Hoffman, E.K.; Ghalib, M.A.; Greenamyre, J.T.; De Miranda, B.R. LRRK2 kinase inhibition protects against Parkinson’s disease-associated environmental toxicants. Neurobiol. Dis. 2024, 196, 106522. [Google Scholar] [CrossRef] [Scilit] [PubMed]
- Mendivil-Perez, M.; Velez-Pardo, C.; Lopera, F.; Kosik, K.S.; Jimenez-Del-Rio, M. PSEN1 E280A Cholinergic-like Neurons and Cerebral Spheroids Derived from Mesenchymal Stromal Cells and from Induced Pluripotent Stem Cells Are Neuropathologically Equivalent. Int. J. Mol. Sci. 2023, 24, 8957. [Google Scholar] [CrossRef] [Scilit] [PubMed]
- Henderson, J.L.; Kormos, B.L.; Hayward, M.M.; Coffman, K.J.; Jasti, J.; Kurumbail, R.G.; Wager, T.T.; Verhoest, P.R.; Noell, G.S.; Chen, Y.; et al. Discovery and preclinical profiling of 3-[4-(morpholin-4-yl)-7H-pyrrolo[2,3-d]pyrimidin-5-yl]benzonitrile (PF-06447475), a highly potent, selective, brain penetrant, and in vivo active LRRK2 kinase inhibitor. J. Med. Chem. 2015, 58, 419–432. [Google Scholar] [CrossRef] [Scilit] [PubMed]
- Kinumi, T.; Kimata, J.; Taira, T.; Ariga, H.; Niki, E. Cysteine-106 of DJ-1 is the most sensitive cysteine residue to hydrogen peroxide-mediated oxidation in vivo in human umbilical vein endothelial cells. Biochem. Biophys. Res. Commun. 2004, 317, 722–728. [Google Scholar] [CrossRef] [Scilit] [PubMed]
- Lee, J.H.; Yu, W.H.; Kumar, A.; Lee, S.; Mohan, P.S.; Peterhoff, C.M.; Wolfe, D.M.; Martinez-Vicente, M.; Massey, A.C.; Sovak, G.; et al. Lysosomal proteolysis and autophagy require presenilin 1 and are disrupted by Alzheimer-related PS1 mutations. Cell 2010, 141, 1146–1158. [Google Scholar] [CrossRef] [Scilit] [PubMed]
- Lee, J.H.; McBrayer, M.K.; Wolfe, D.M.; Haslett, L.J.; Kumar, A.; Sato, Y.; Lie, P.P.; Mohan, P.; Coffey, E.E.; Kompella, U.; et al. Presenilin 1 Maintains Lysosomal Ca2+ Homeostasis via TRPML1 by Regulating vATPase-Mediated Lysosome Acidification. Cell Rep. 2015, 12, 1430–1444. [Google Scholar] [CrossRef] [Scilit] [PubMed]
- Yoshii, S.R.; Mizushima, N. Monitoring and Measuring Autophagy. Int. J. Mol. Sci. 2017, 18, 1865. [Google Scholar] [CrossRef] [Scilit] [PubMed]
- Ballou, L.M.; Lin, R.Z. Rapamycin and mTOR kinase inhibitors. J. Chem. Biol. 2008, 1, 27–36. [Google Scholar] [CrossRef] [Scilit] [PubMed]
- Wang, R.; Wang, J.; Hassan, A.; Lee, C.H.; Xie, X.S.; Li, X. Molecular basis of V-ATPase inhibition by bafilomycin A1. Nat. Commun. 2021, 12, 1782. [Google Scholar] [CrossRef] [Scilit] [PubMed]
- Buck, S.A.; Ervin, J.F.; Wang, S.H.J.; Cohen, T.J.; Sanders, L.H. Markers of leucine-rich repeat kinase 2 activity are associated with pathological protein aggregation across neurodegenerative diseases. Alzheimer’s Dement. 2025, 21, e107317. [Google Scholar] [CrossRef] [Scilit]
- He, B.; Ospina Lopera, P.; Espinosa, A.; Becerra, J.C.; Osorio, L.; Alzate, D.; Alvarez, S.; Grazia, A.; Teipel, S.J.; Malotaux, V.; et al. Association between basal forebrain volume and age in the presenilin-1 E280A autosomal dominant Alzheimer’s disease kindred. Alzheimer’s Dement. 2026, 22, e71052. [Google Scholar] [CrossRef] [Scilit] [PubMed]
- Kadowaki, H.; Nishitoh, H.; Urano, F.; Sadamitsu, C.; Matsuzawa, A.; Takeda, K.; Masutani, H.; Yodoi, J.; Urano, Y.; Nagano, T.; et al. Amyloid beta induces neuronal cell death through ROS-mediated ASK1 activation. Cell Death Differ. 2005, 12, 19–24. [Google Scholar] [CrossRef] [Scilit] [PubMed]
- Sinclair, P.; Baranova, A.; Kabbani, N. Mitochondrial Disruption by Amyloid Beta 42 Identified by Proteomics and Pathway Mapping. Cells 2021, 10, 2380. [Google Scholar] [CrossRef] [Scilit] [PubMed]
- Di Marzo, N.; Chisci, E.; Giovannoni, R. The Role of Hydrogen Peroxide in Redox-Dependent Signaling: Homeostatic and Pathological Responses in Mammalian Cells. Cells 2018, 7, 156. [Google Scholar] [CrossRef] [Scilit] [PubMed]
- Neves, M.; Grãos, M.; Anjo, S.I.; Manadas, B. Modulation of signaling pathways by DJ-1: An updated overview. Redox Biol. 2022, 51, 102283. [Google Scholar] [CrossRef] [Scilit] [PubMed]
- Nadeau, P.J.; Charette, S.J.; Landry, J. REDOX reaction at ASK1-Cys250 is essential for activation of JNK and induction of apoptosis. Mol. Biol. Cell 2009, 20, 3628–3637. [Google Scholar] [CrossRef] [Scilit] [PubMed]
- Dzamko, N.; Inesta-Vaquera, F.; Zhang, J.; Xie, C.; Cai, H.; Arthur, S.; Tan, L.; Choi, H.; Gray, N.; Cohen, P.; et al. The IkappaB kinase family phosphorylates the Parkinson’s disease kinase LRRK2 at Ser935 and Ser910 during Toll-like receptor signaling. PLoS ONE 2012, 7, e39132. [Google Scholar] [CrossRef] [Scilit] [PubMed]
- Volloch, V.; Rits-Volloch, S. The Amyloid Cascade Hypothesis 2.0: Generalization of the Concept. J. Alzheimer’s Dis. Rep. 2023, 7, 21–35. [Google Scholar] [CrossRef] [Scilit] [PubMed]
- Quintero-Espinosa, D.A.; Ortega-Arellano, H.F.; Velez-Pardo, C.; Jimenez-Del-Rio, M. Phenolic-rich extract of avocado Persea americana (var. Colinred) peel blunts paraquat/maneb-induced apoptosis through blocking phosphorylation of LRRK2 kinase in human nerve-like cells. Environ. Toxicol. 2022, 37, 660–676. [Google Scholar] [CrossRef] [Scilit] [PubMed]
- Chen, C.Y.; Weng, Y.H.; Chien, K.Y.; Lin, K.J.; Yeh, T.H.; Cheng, Y.P.; Lu, C.S.; Wang, H.L. (G2019S) LRRK2 activates MKK4-JNK pathway and causes degeneration of SN dopaminergic neurons in a transgenic mouse model of PD. Cell Death Differ. 2012, 19, 1623–1633. [Google Scholar] [CrossRef] [Scilit] [PubMed]
- Chen, Y.; Liu, K.; Zhang, J.; Hai, Y.; Wang, P.; Wang, H.; Liu, Q.; Wong, C.C.L.; Yao, J.; Gao, Y.; et al. c-Jun NH2 -Terminal Protein Kinase Phosphorylates the Nrf2-ECH Homology 6 Domain of Nuclear Factor Erythroid 2-Related Factor 2 and Downregulates Cytoprotective Genes in Acetaminophen-Induced Liver Injury in Mice. Hepatology 2020, 71, 1787–1801. [Google Scholar] [CrossRef] [Scilit] [PubMed]
- He, F.; Ru, X.; Wen, T. NRF2, a Transcription Factor for Stress Response and Beyond. Int. J. Mol. Sci. 2020, 21, 4777. [Google Scholar] [CrossRef] [Scilit] [PubMed]
- Kryszczuk, M.; Kowalczuk, O. Significance of NRF2 in physiological and pathological conditions an comprehensive review. Arch. Biochem. Biophys. 2022, 730, 109417. [Google Scholar] [CrossRef] [Scilit] [PubMed]
- Angeles, D.C.; Gan, B.H.; Onstead, L.; Zhao, Y.; Lim, K.L.; Dachsel, J.; Melrose, H.; Farrer, M.; Wszolek, Z.K.; Dickson, D.W.; et al. Mutations in LRRK2 increase phosphorylation of peroxiredoxin 3 exacerbating oxidative stress-induced neuronal death. Hum. Mutat. 2011, 32, 1390–1397. [Google Scholar] [CrossRef] [Scilit] [PubMed]
- Reynolds, C.H.; Betts, J.C.; Blackstock, W.P.; Nebreda, A.R.; Anderton, B.H. Phosphorylation sites on tau identified by nanoelectrospray mass spectrometry: Differences in vitro between the mitogen-activated protein kinases ERK2, c-Jun N-terminal kinase and P38, and glycogen synthase kinase-3beta. J. Neurochem. 2000, 74, 1587–1595. [Google Scholar] [CrossRef] [Scilit] [PubMed]
- Solas, M.; Vela, S.; Smerdou, C.; Martisova, E.; Martínez-Valbuena, I.; Luquin, M.R.; Ramírez, M.J. JNK Activation in Alzheimer’s Disease Is Driven by Amyloid β and Is Associated with Tau Pathology. ACS Chem. Neurosci. 2023, 14, 1524–1534. [Google Scholar] [CrossRef] [Scilit] [PubMed]
- O’Hara, D.M.; Pawar, G.; Kalia, S.K.; Kalia, L.V. LRRK2 and α-Synuclein: Distinct or Synergistic Players in Parkinson’s Disease? Front. Neurosci. 2020, 14, 577. [Google Scholar] [CrossRef] [Scilit] [PubMed]
- Stojanovski, D.; Koutsopoulos, O.S.; Okamoto, K.; Ryan, M.T. Levels of human Fis1 at the mitochondrial outer membrane regulate mitochondrial morphology. J. Cell Sci. 2004, 117, 1201–1210. [Google Scholar] [CrossRef] [Scilit] [PubMed]
- Wang, X.; Yan, M.H.; Fujioka, H.; Liu, J.; Wilson-Delfosse, A.; Chen, S.G.; Perry, G.; Casadesus, G.; Zhu, X. LRRK2 regulates mitochondrial dynamics and function through direct interaction with DLP1. Hum. Mol. Genet. 2012, 21, 1931–1944. [Google Scholar] [CrossRef] [Scilit] [PubMed]
- Henderson, M.X.; Sengupta, M.; Trojanowski, J.Q.; Lee, V.M.Y. Alzheimer’s disease tau is a prominent pathology in LRRK2 Parkinson’s disease. Acta Neuropathol. Commun. 2019, 7, 183. [Google Scholar] [CrossRef] [Scilit] [PubMed]
- Atlante, A.; Valenti, D. Mitochondrial Complex I and β-Amyloid Peptide Interplay in Alzheimer’s Disease: A Critical Review of New and Old Little Regarded Findings. Int. J. Mol. Sci. 2023, 24, 15951. [Google Scholar] [CrossRef] [Scilit] [PubMed]
- Neely, K.M.; Green, K.N.; LaFerla, F.M. Presenilin is necessary for efficient proteolysis through the autophagy-lysosome system in a γ-secretase-independent manner. J. Neurosci. 2011, 31, 2781–2791. [Google Scholar] [CrossRef] [Scilit] [PubMed]
- Duggan, S.P.; McCarthy, J.V. Beyond γ-secretase activity: The multifunctional nature of presenilins in cell signalling pathways. Cell. Signal. 2016, 28, 1–11. [Google Scholar] [CrossRef] [Scilit] [PubMed]
- Chong, C.M.; Ke, M.; Tan, Y.; Huang, Z.; Zhang, K.; Ai, N.; Ge, W.; Qin, D.; Lu, J.H.; Su, H. Presenilin 1 deficiency suppresses autophagy in human neural stem cells through reducing γ-secretase-independent ERK/CREB signaling. Cell Death Dis. 2018, 9, 879. [Google Scholar] [CrossRef] [Scilit] [PubMed]
- Wallings, R.; Connor-Robson, N.; Wade-Martins, R. LRRK2 interacts with the vacuolar-type H+-ATPase pump a1 subunit to regulate lysosomal function. Hum. Mol. Genet. 2019, 28, 2696–2710. [Google Scholar] [CrossRef] [Scilit] [PubMed]
- Kuwahara, T.; Funakawa, K.; Komori, T.; Sakurai, M.; Yoshii, G.; Eguchi, T.; Fukuda, M.; Iwatsubo, T. Roles of lysosomotropic agents on LRRK2 activation and Rab10 phosphorylation. Neurobiol. Dis. 2020, 145, 105081. [Google Scholar] [CrossRef] [Scilit] [PubMed]
- Perez-Abshana, L.P.; Mendivil-Perez, M.; Velez-Pardo, C.; Jimenez-Del-Rio, M. Protective Effect of the LRRK2 Kinase Inhibition in Human Fibroblasts Bearing the Genetic Variant GBA1 K198E: Implications for Parkinson’s Disease. Neuromolecular Med. 2025, 27, 42. [Google Scholar] [CrossRef] [Scilit] [PubMed]
- Vogt, A.S.; Jennings, G.T.; Mohsen, M.O.; Vogel, M.; Bachmann, M.F. Alzheimer’s Disease: A Brief History of Immunotherapies Targeting Amyloid β. Int. J. Mol. Sci. 2023, 24, 3895. [Google Scholar] [CrossRef] [Scilit] [PubMed]
- Li, X.; Ji, M.; Zhang, H.; Liu, Z.; Chai, Y.; Cheng, Q.; Yang, Y.; Cordato, D.; Gao, J. Non-drug Therapies for Alzheimer’s Disease: A Review. Neurol. Ther. 2023, 12, 39–72. [Google Scholar] [CrossRef] [Scilit] [PubMed]
- Volloch, V.; Rits-Volloch, S. Effect of Lecanemab in Early Alzheimer’s Disease: Mechanistic Interpretation in the Amyloid Cascade Hypothesis 2.0 Perspective. J. Alzheimer’s Dis. 2023, 93, 1277–1284. [Google Scholar] [CrossRef] [Scilit] [PubMed]
- Wertkin, A.M.; Turner, R.S.; Pleasure, S.J.; Golde, T.E.; Younkin, S.G.; Trojanowski, J.Q.; Lee, V.M. Human neurons derived from a teratocarcinoma cell line express solely the 695-amino acid amyloid precursor protein and produce intracellular beta-amyloid or A4 peptides. Proc. Natl. Acad. Sci. USA 1993, 90, 9513–9517. [Google Scholar] [CrossRef] [Scilit] [PubMed]
- Gouras, G.K.; Tsai, J.; Naslund, J.; Vincent, B.; Edgar, M.; Checler, F.; Greenfield, J.P.; Haroutunian, V.; Buxbaum, J.D.; Xu, H.; et al. Intraneuronal Abeta42 accumulation in human brain. Am. J. Pathol. 2000, 156, 15–20. [Google Scholar] [CrossRef] [Scilit] [PubMed]
- Gyure, K.A.; Durham, R.; Stewart, W.F.; Smialek, J.E.; Troncoso, J.C. Intraneuronal abeta-amyloid precedes development of amyloid plaques in Down syndrome. Arch. Pathol. Lab. Med. 2001, 125, 489–492. [Google Scholar] [CrossRef] [Scilit] [PubMed]
- D’Andrea, M.R.; Nagele, R.G.; Wang, H.Y.; Lee, D.H. Consistent immunohistochemical detection of intracellular beta-amyloid42 in pyramidal neurons of Alzheimer’s disease entorhinal cortex. Neurosci. Lett. 2002, 333, 163–166. [Google Scholar] [CrossRef] [Scilit] [PubMed]
- Takahashi, R.H.; Nagao, T.; Gouras, G.K. Plaque formation and the intraneuronal accumulation of β-amyloid in Alzheimer’s disease. Pathol. Int. 2017, 67, 185–193. [Google Scholar] [CrossRef] [Scilit] [PubMed]
- LaFerla, F.M.; Green, K.N.; Oddo, S. Intracellular amyloid-beta in Alzheimer’s disease. Nat. Rev. Neurosci. 2007, 8, 499–509. [Google Scholar] [CrossRef] [Scilit] [PubMed]
- Iulita, M.F.; Allard, S.; Richter, L.; Munter, L.M.; Ducatenzeiler, A.; Weise, C.; Do Carmo, S.; Klein, W.L.; Multhaup, G.; Cuello, A.C. Intracellular Aβ pathology and early cognitive impairments in a transgenic rat overexpressing human amyloid precursor protein: A multidimensional study. Acta Neuropathol. Commun. 2014, 2, 61. [Google Scholar] [CrossRef] [Scilit] [PubMed]
- Soto-Mercado, V.; Mendivil-Perez, M.; Jimenez-Del-Rio, M.; Velez-Pardo, C. Combination of Epigallocatechin-3-Gallate and Tramiprosate Prevent Accumulation of Intracellular Aβ and Dysfunctional Autophagy-Lysosomal Pathway at Earliest Stage of Transdifferentiation of Mesenchymal Stromal Cells into PSEN1 E280A Cholinergic-like Neurons. Int. J. Mol. Sci. 2025, 26, 3756. [Google Scholar] [CrossRef] [Scilit] [PubMed]
- Zhu, H.; Hixson, P.; Ma, W.; Sun, J. Pharmacology of LRRK2 with type I and II kinase inhibitors revealed by cryo-EM. Cell Discov. 2024, 10, 10. [Google Scholar] [CrossRef] [Scilit] [PubMed]
- Chen, Z.; Wang, L.; Ishii, H.; Yamasaki, T.; Shao, T.; Shao, Y.; Josephson, L.; Zhang, M.-R.; Liang, S. Radiosynthesis and Preclinical Evaluation of [11C]PF-06447475 for LRRK2 Imaging. J. Nucl. Med. 2019, 60, 1609. [Google Scholar]
- Jennings, D.; Huntwork-Rodriguez, S.; Vissers, M.F.J.M.; Daryani, V.M.; Diaz, D.; Goo, M.S.; Chen, J.J.; Maciuca, R.; Fraser, K.; Mabrouk, O.S.; et al. LRRK2 Inhibition by BIIB122 in Healthy Participants and Patients with Parkinson’s Disease. Mov. Disord. 2023, 38, 386–398. [Google Scholar] [CrossRef] [Scilit] [PubMed]
- Tan, S.; Liu, H.; Yao, X. LRRK2 Inhibitors as Promising Treatment for Parkinson’s Disease. ACS Chem. Neurosci. 2024, 15, 4092–4094. [Google Scholar] [CrossRef] [Scilit] [PubMed]
- Quintero-Espinosa, D.; Soto-Mercado, V.; Quintero-Quinchia, C.; Mendivil-Perez, M.; Velez-Pardo, C.; Jimenez-Del-Rio, M. Latent Tri-lineage Potential of Human Menstrual Blood-Derived Mesenchymal Stromal Cells Revealed by Specific In Vitro Culture Conditions. Mol. Neurobiol. 2021, 58, 5194–5209. [Google Scholar] [CrossRef] [Scilit] [PubMed]
- Mendivil-Perez, M.; Velez-Pardo, C.; Jimenez-Del-Rio, M. Direct transdifferentiation of human Wharton’s jelly mesenchymal stromal cells into cholinergic-like neurons. J. Neurosci. Methods 2019, 312, 126–138. [Google Scholar] [CrossRef] [Scilit] [PubMed]
- Lichtman, J.W.; Conchello, J.A. Fluorescence microscopy. Nat. Methods 2005, 2, 910–919. [Google Scholar] [CrossRef] [Scilit] [PubMed]
- Adan, A.; Alizada, G.; Kiraz, Y.; Baran, Y.; Nalbant, A. Flow cytometry: Basic principles and applications. Crit. Rev. Biotechnol. 2017, 37, 163–176. [Google Scholar] [CrossRef] [Scilit] [PubMed]
- Lazic, S.E.; Clarke-Williams, C.J.; Munafò, M.R. What exactly is ‘N’ in cell culture and animal experiments? PLoS Biol. 2018, 16, e2005282. [Google Scholar] [CrossRef] [Scilit] [PubMed]
- Zhang, J.; Zhang, Y.; Wang, J.; Xia, Y.; Zhang, J.; Chen, L. Recent advances in Alzheimer’s disease: Mechanisms, clinical trials and new drug development strategies. Signal Transduct. Target. Ther. 2024, 9, 211. [Google Scholar] [CrossRef] [Scilit] [PubMed]
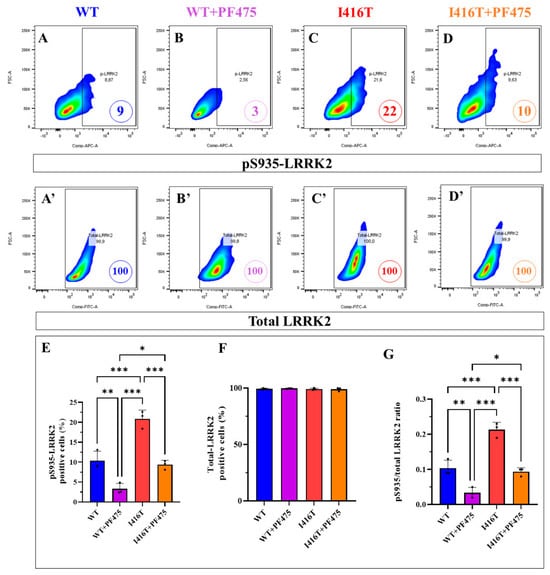
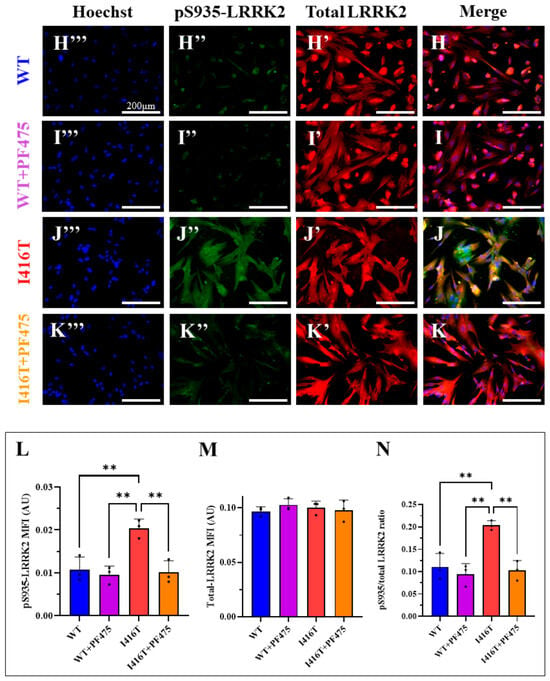
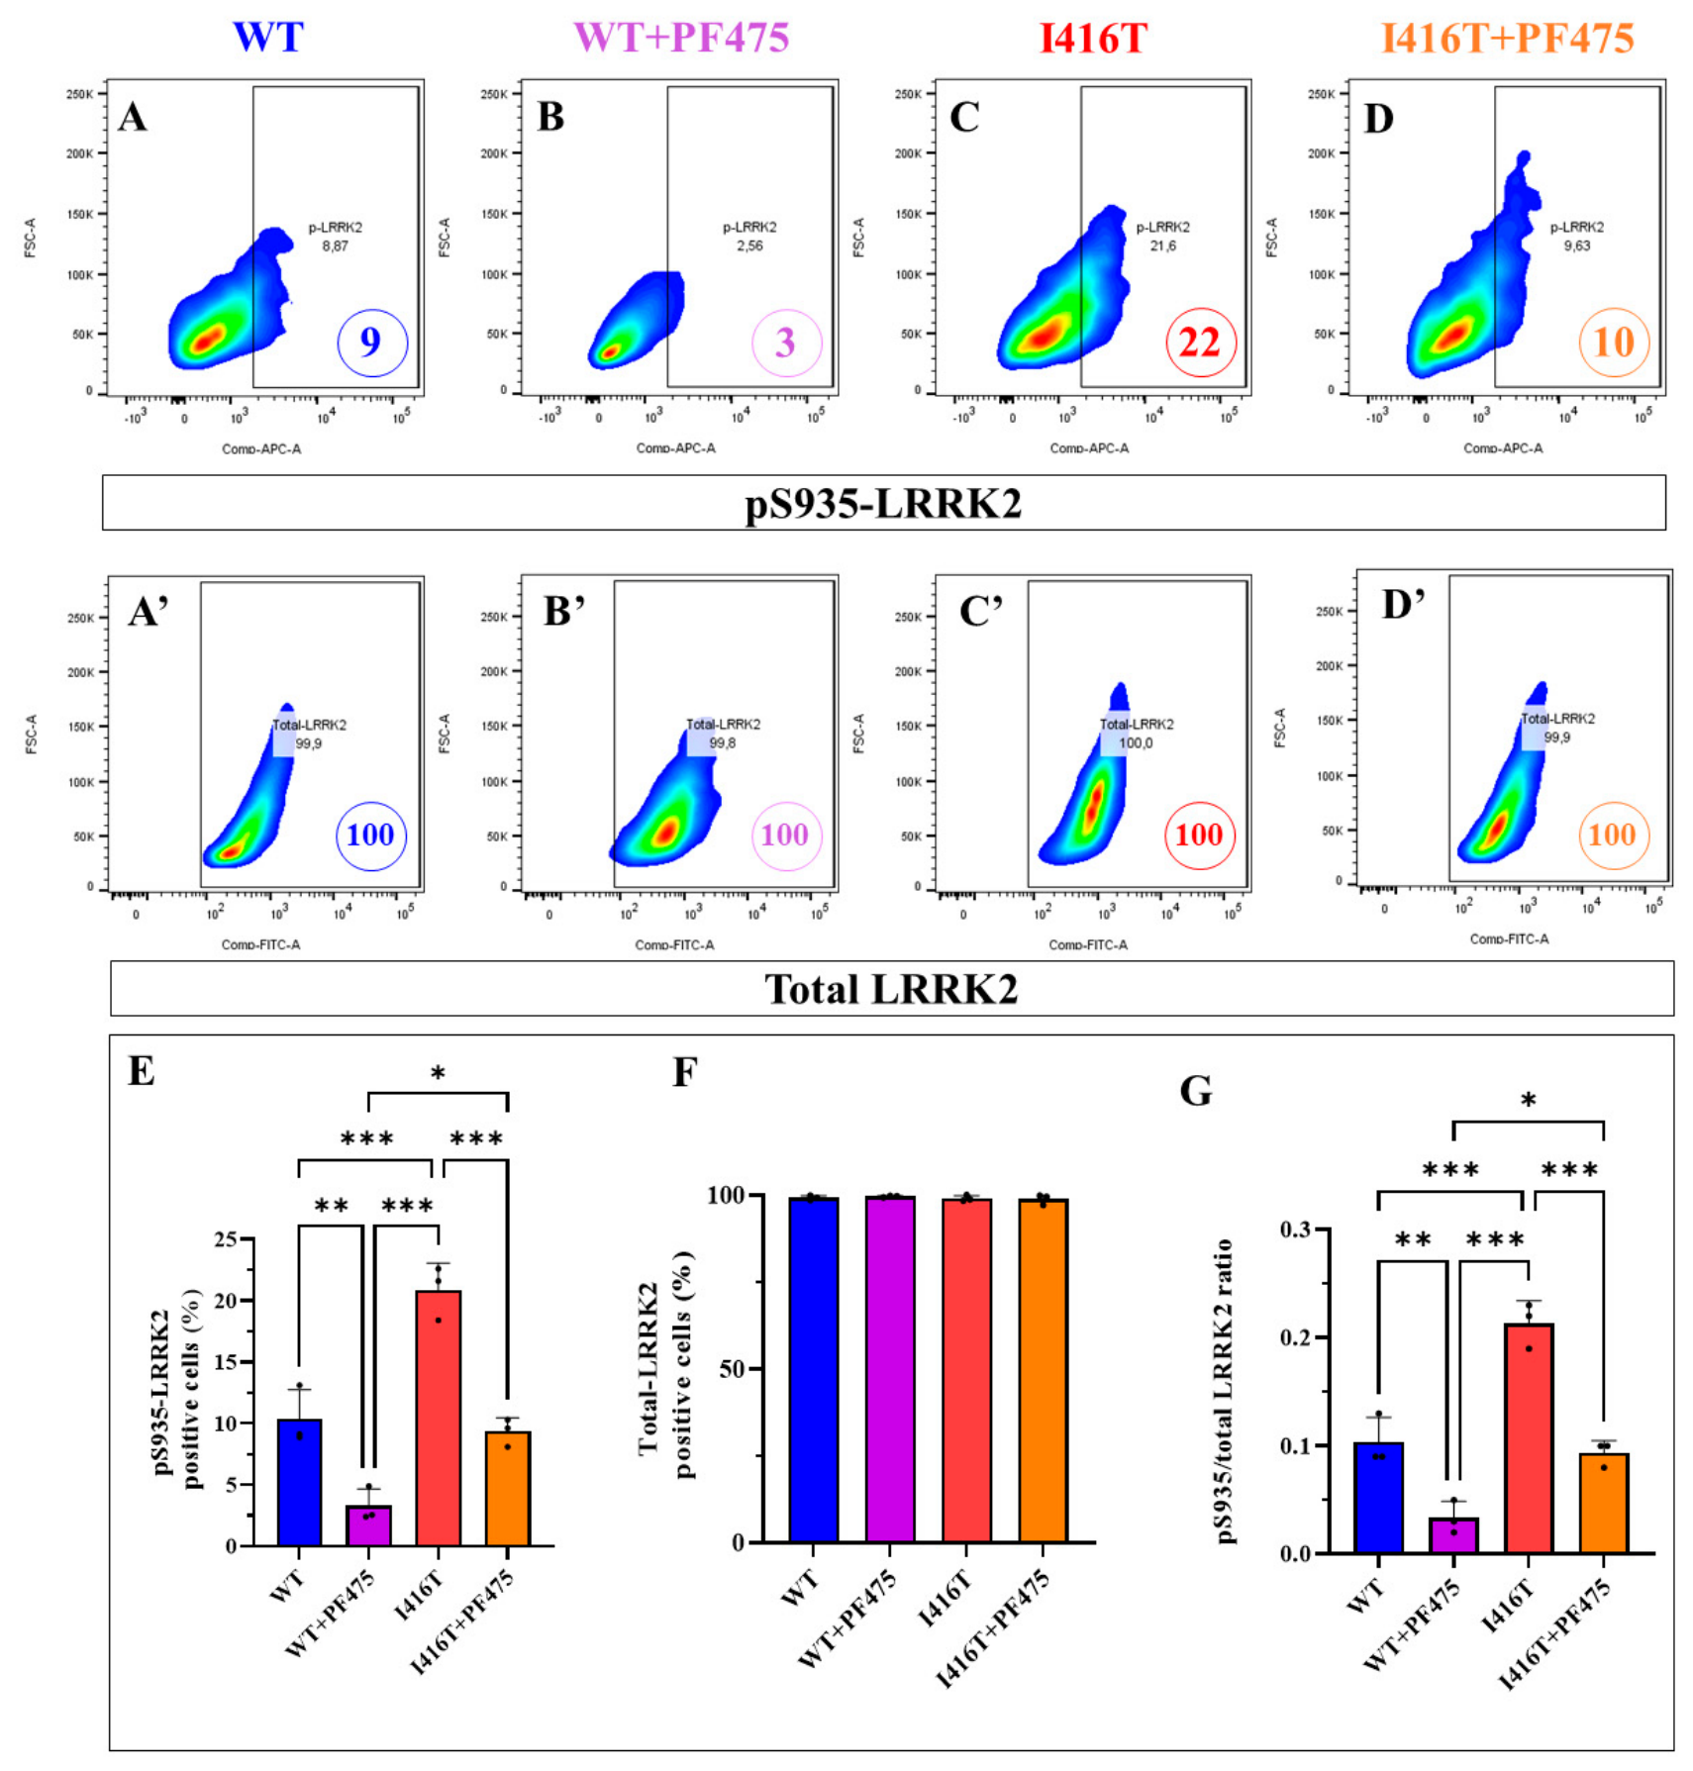
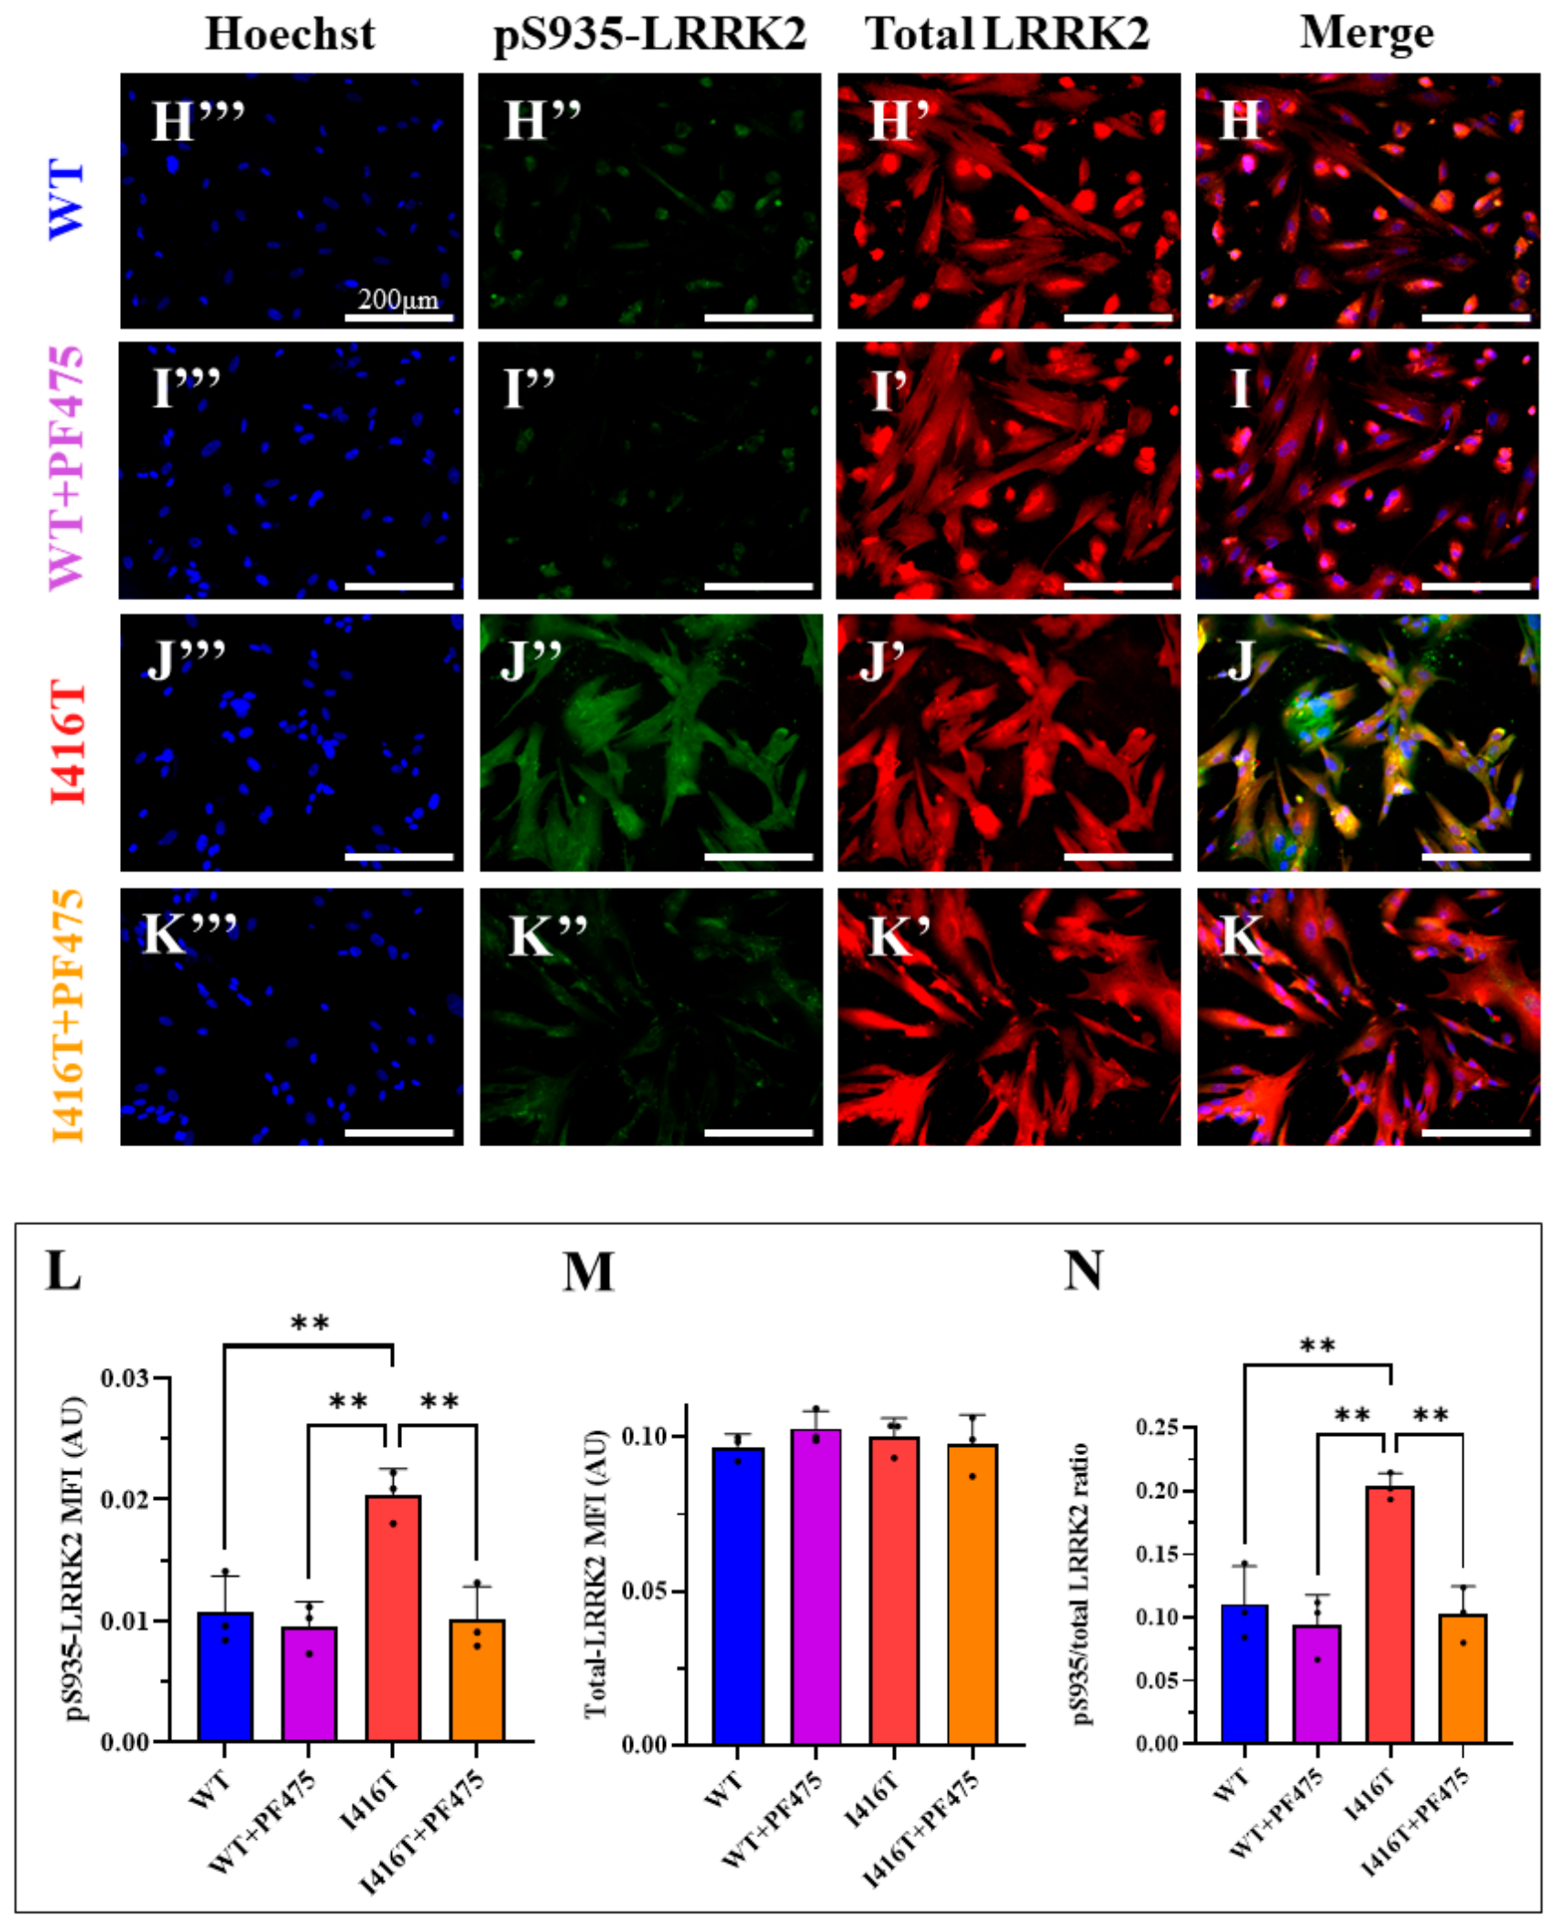
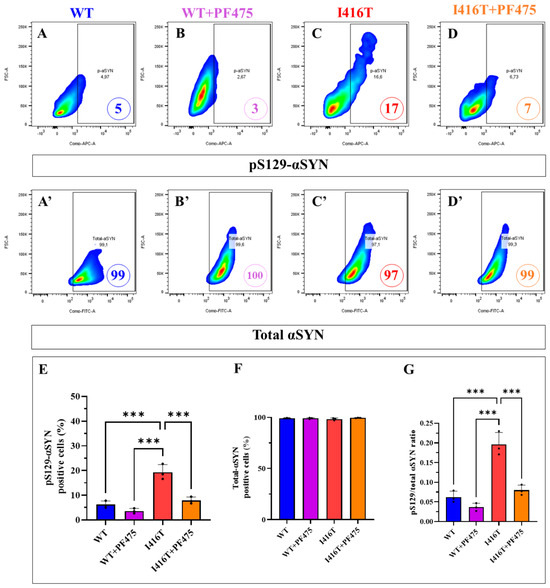
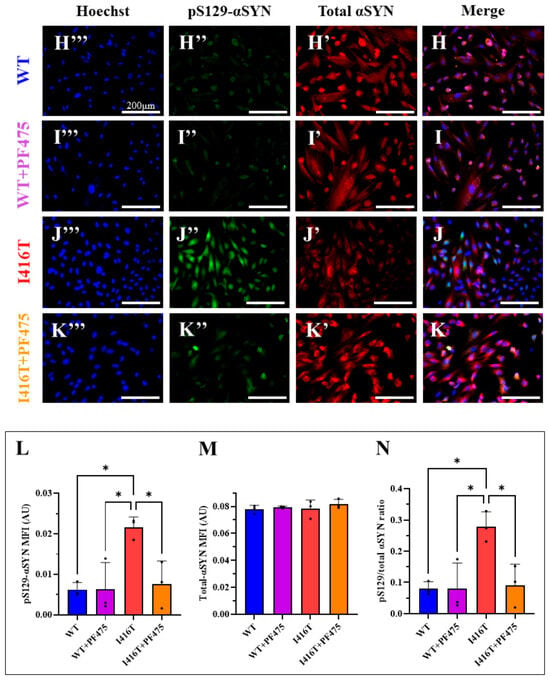
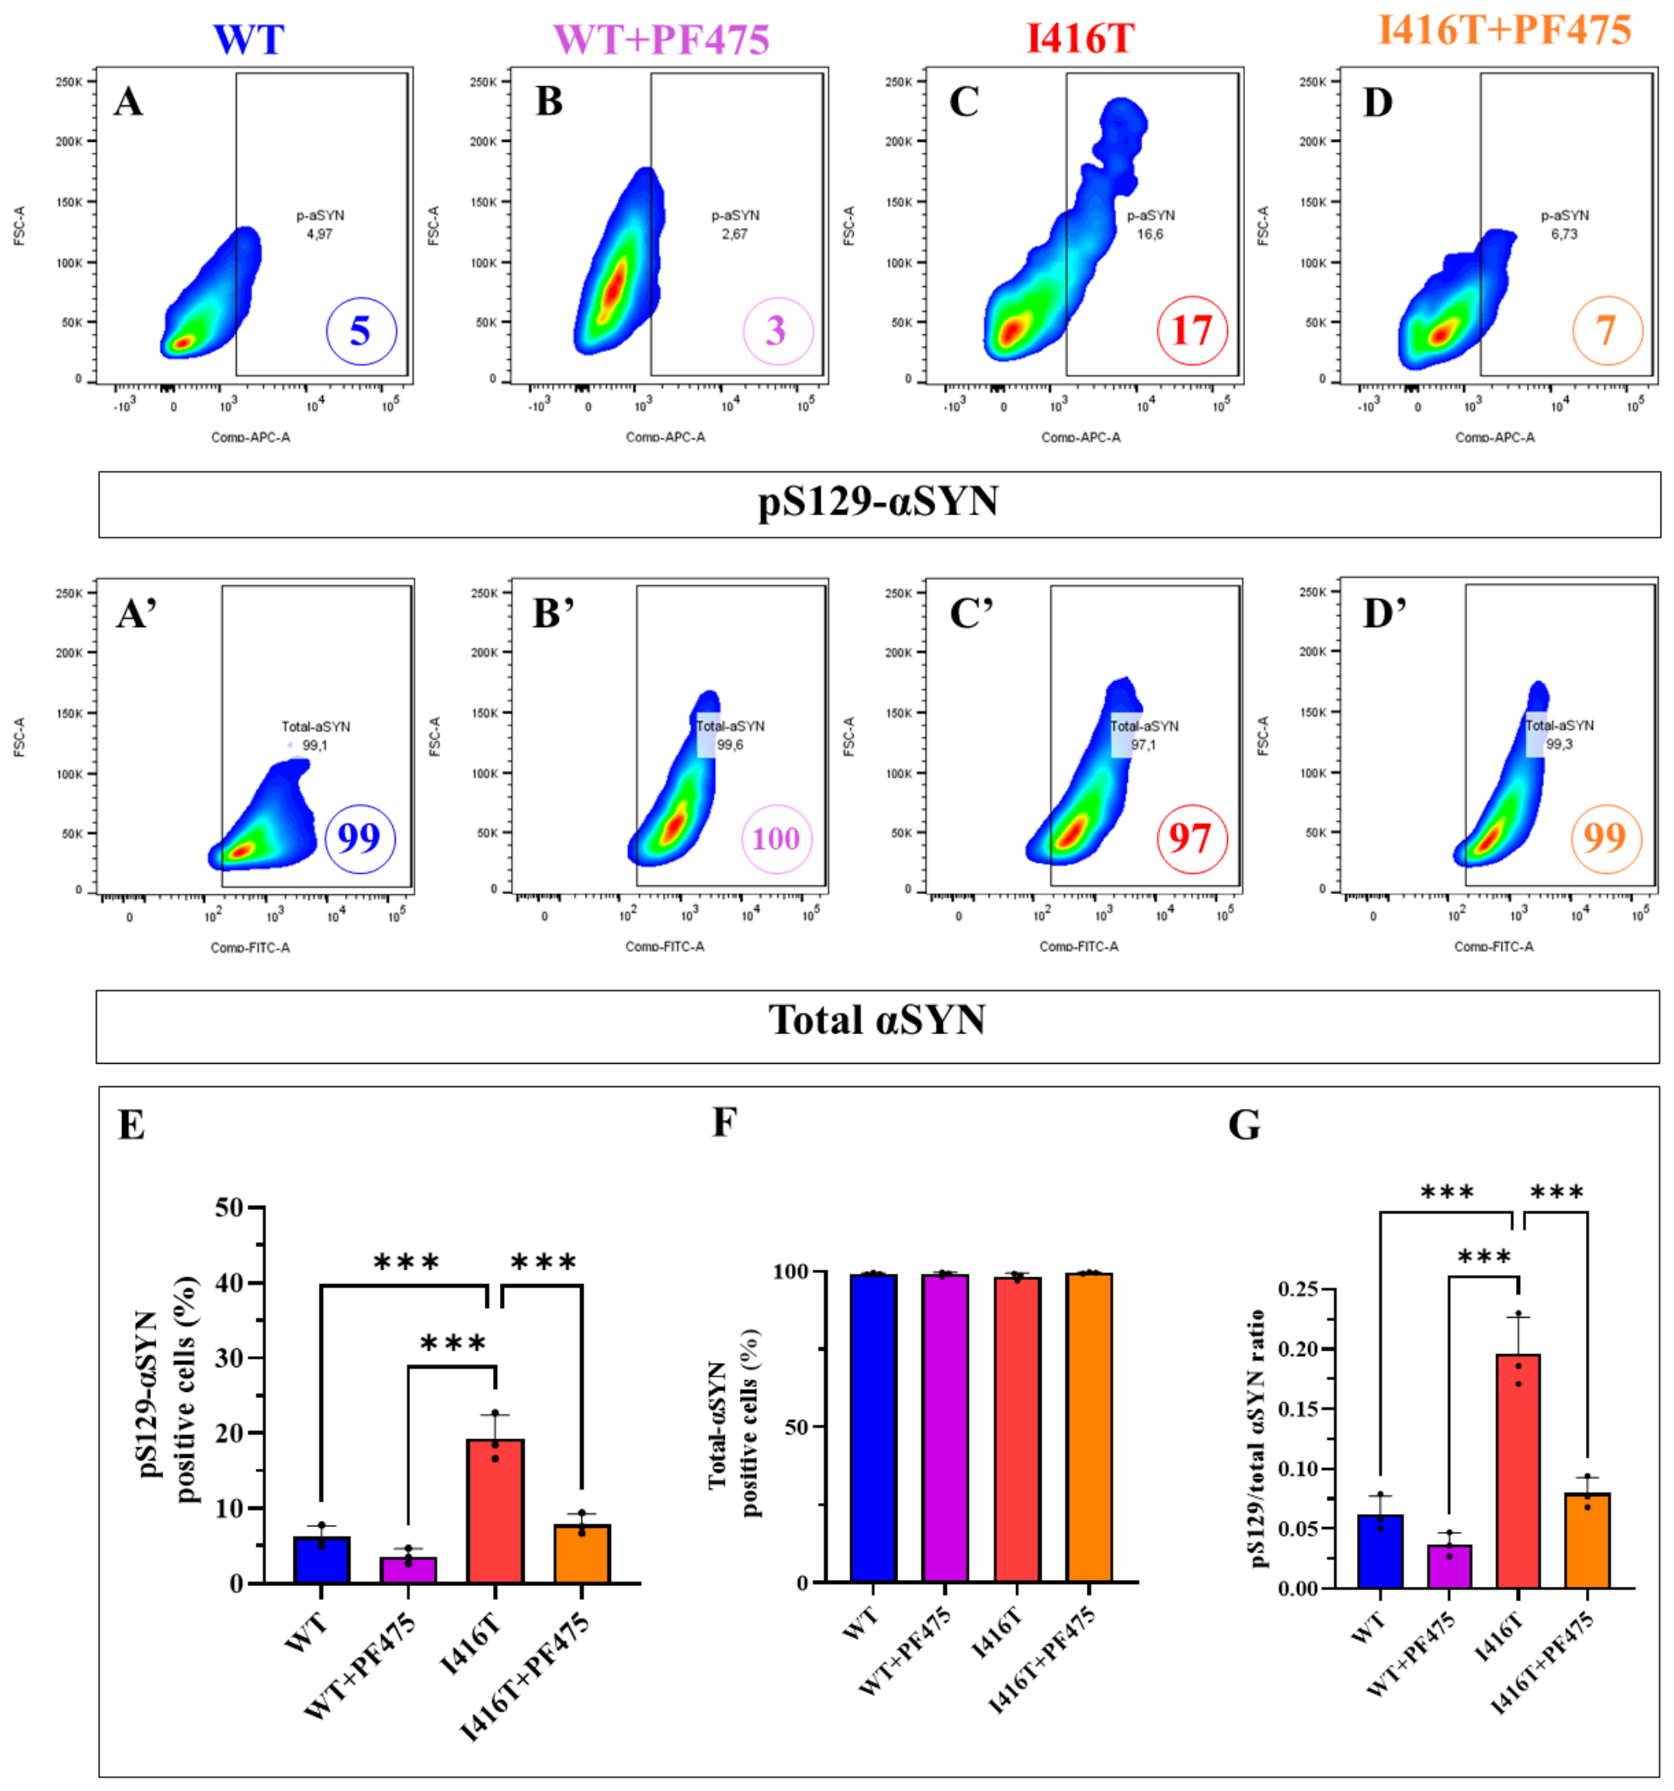
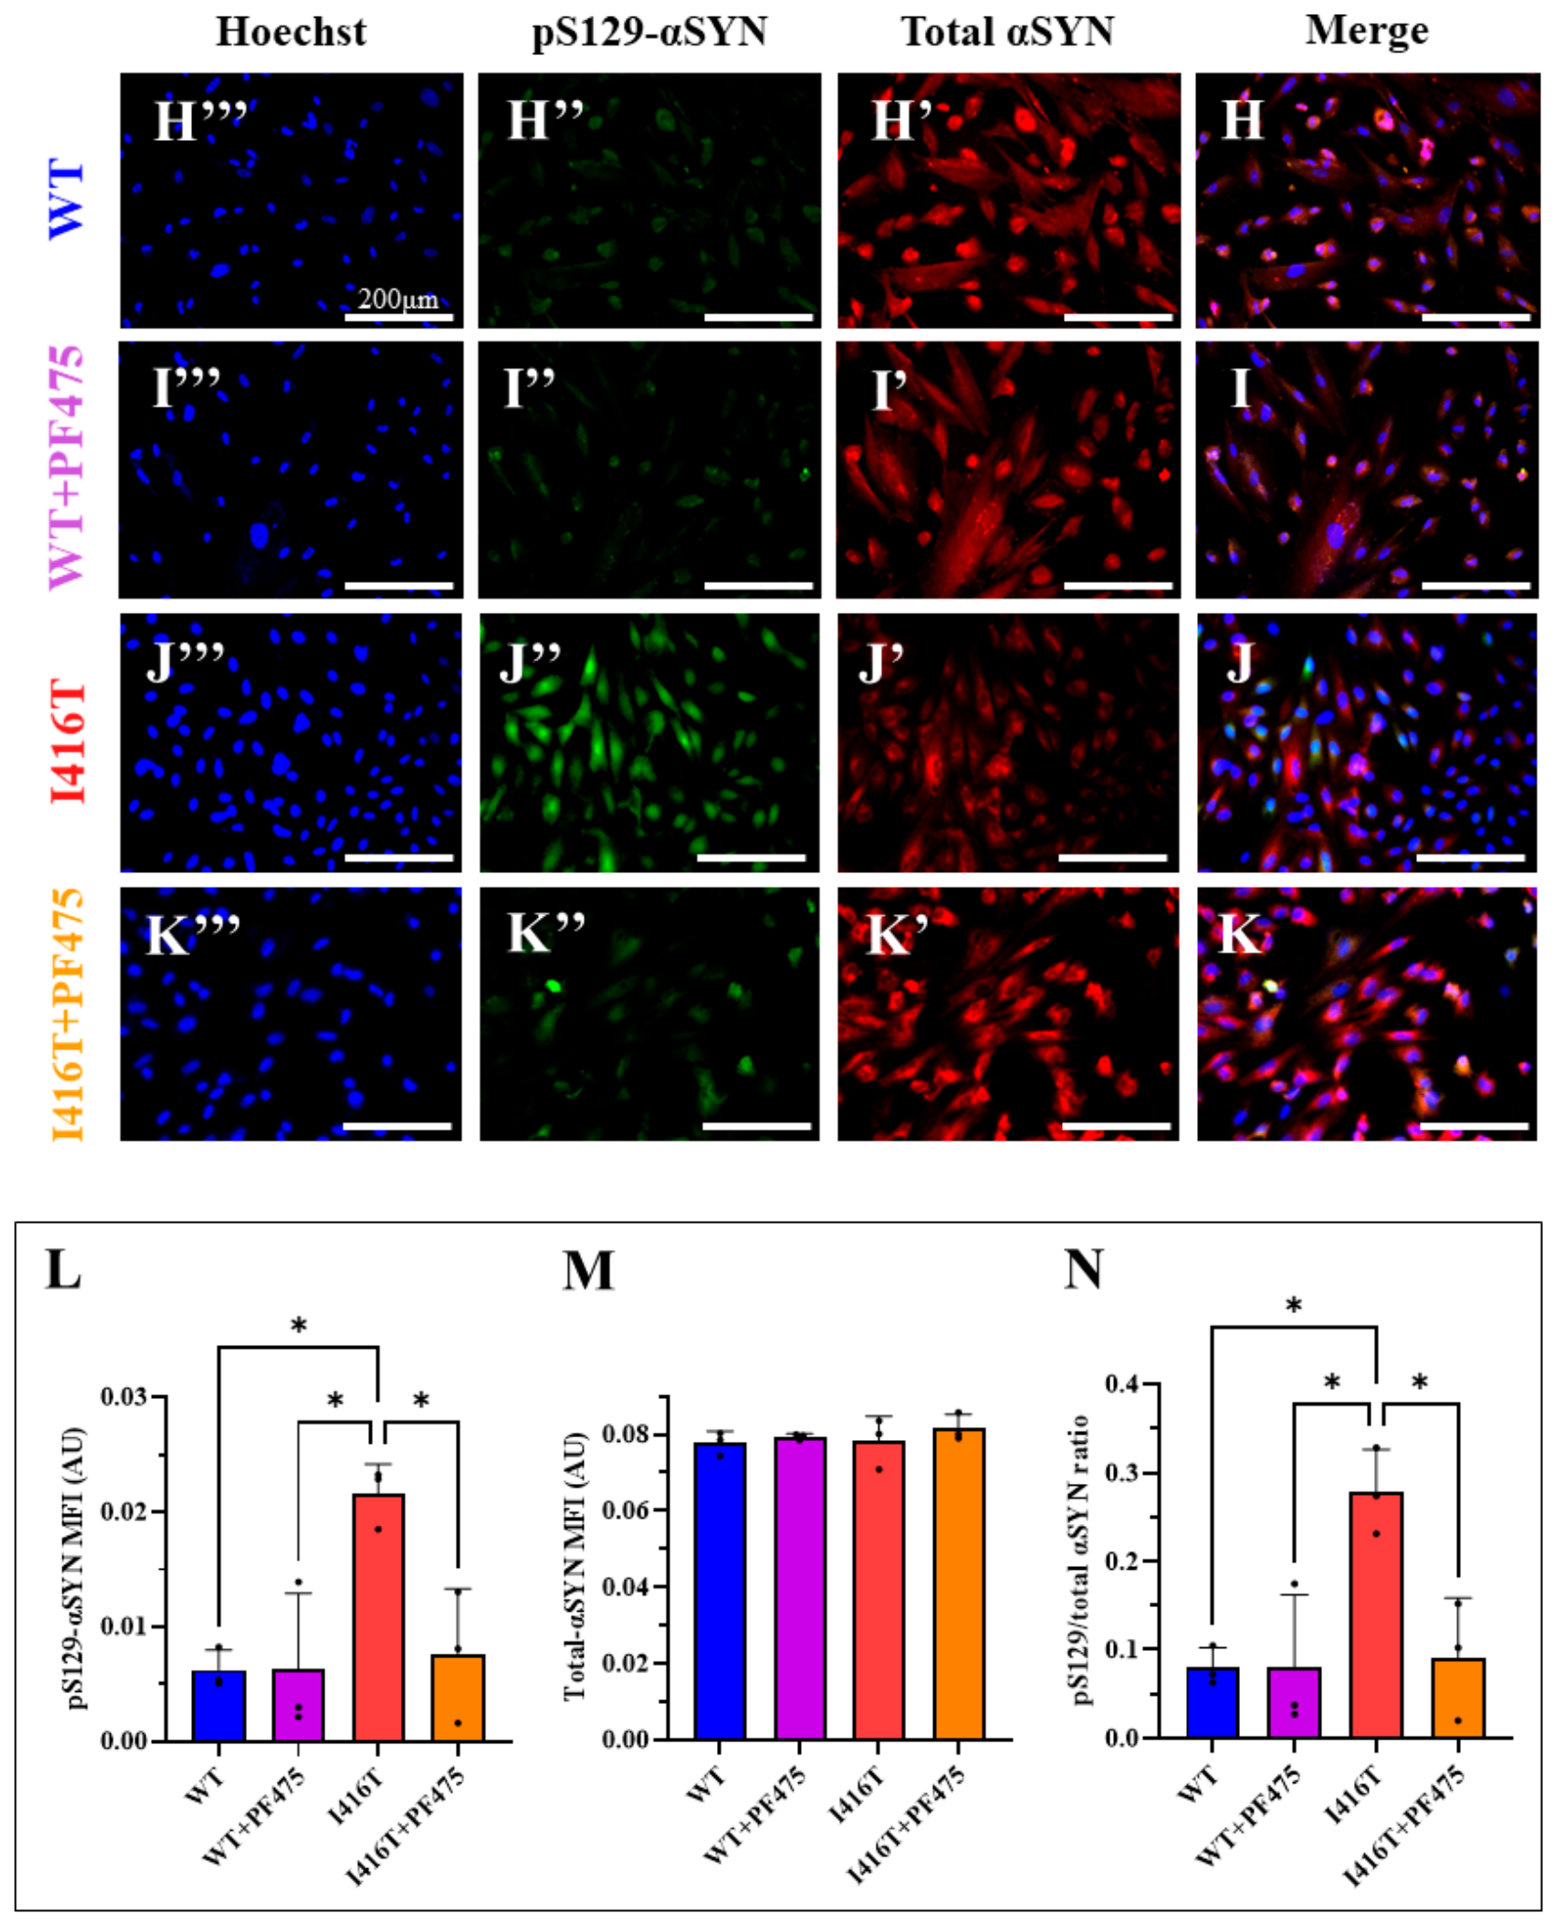
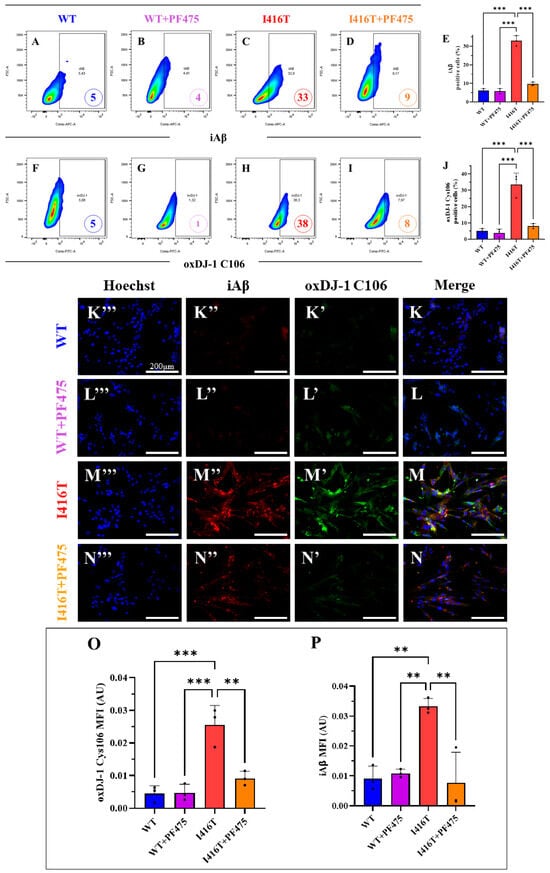
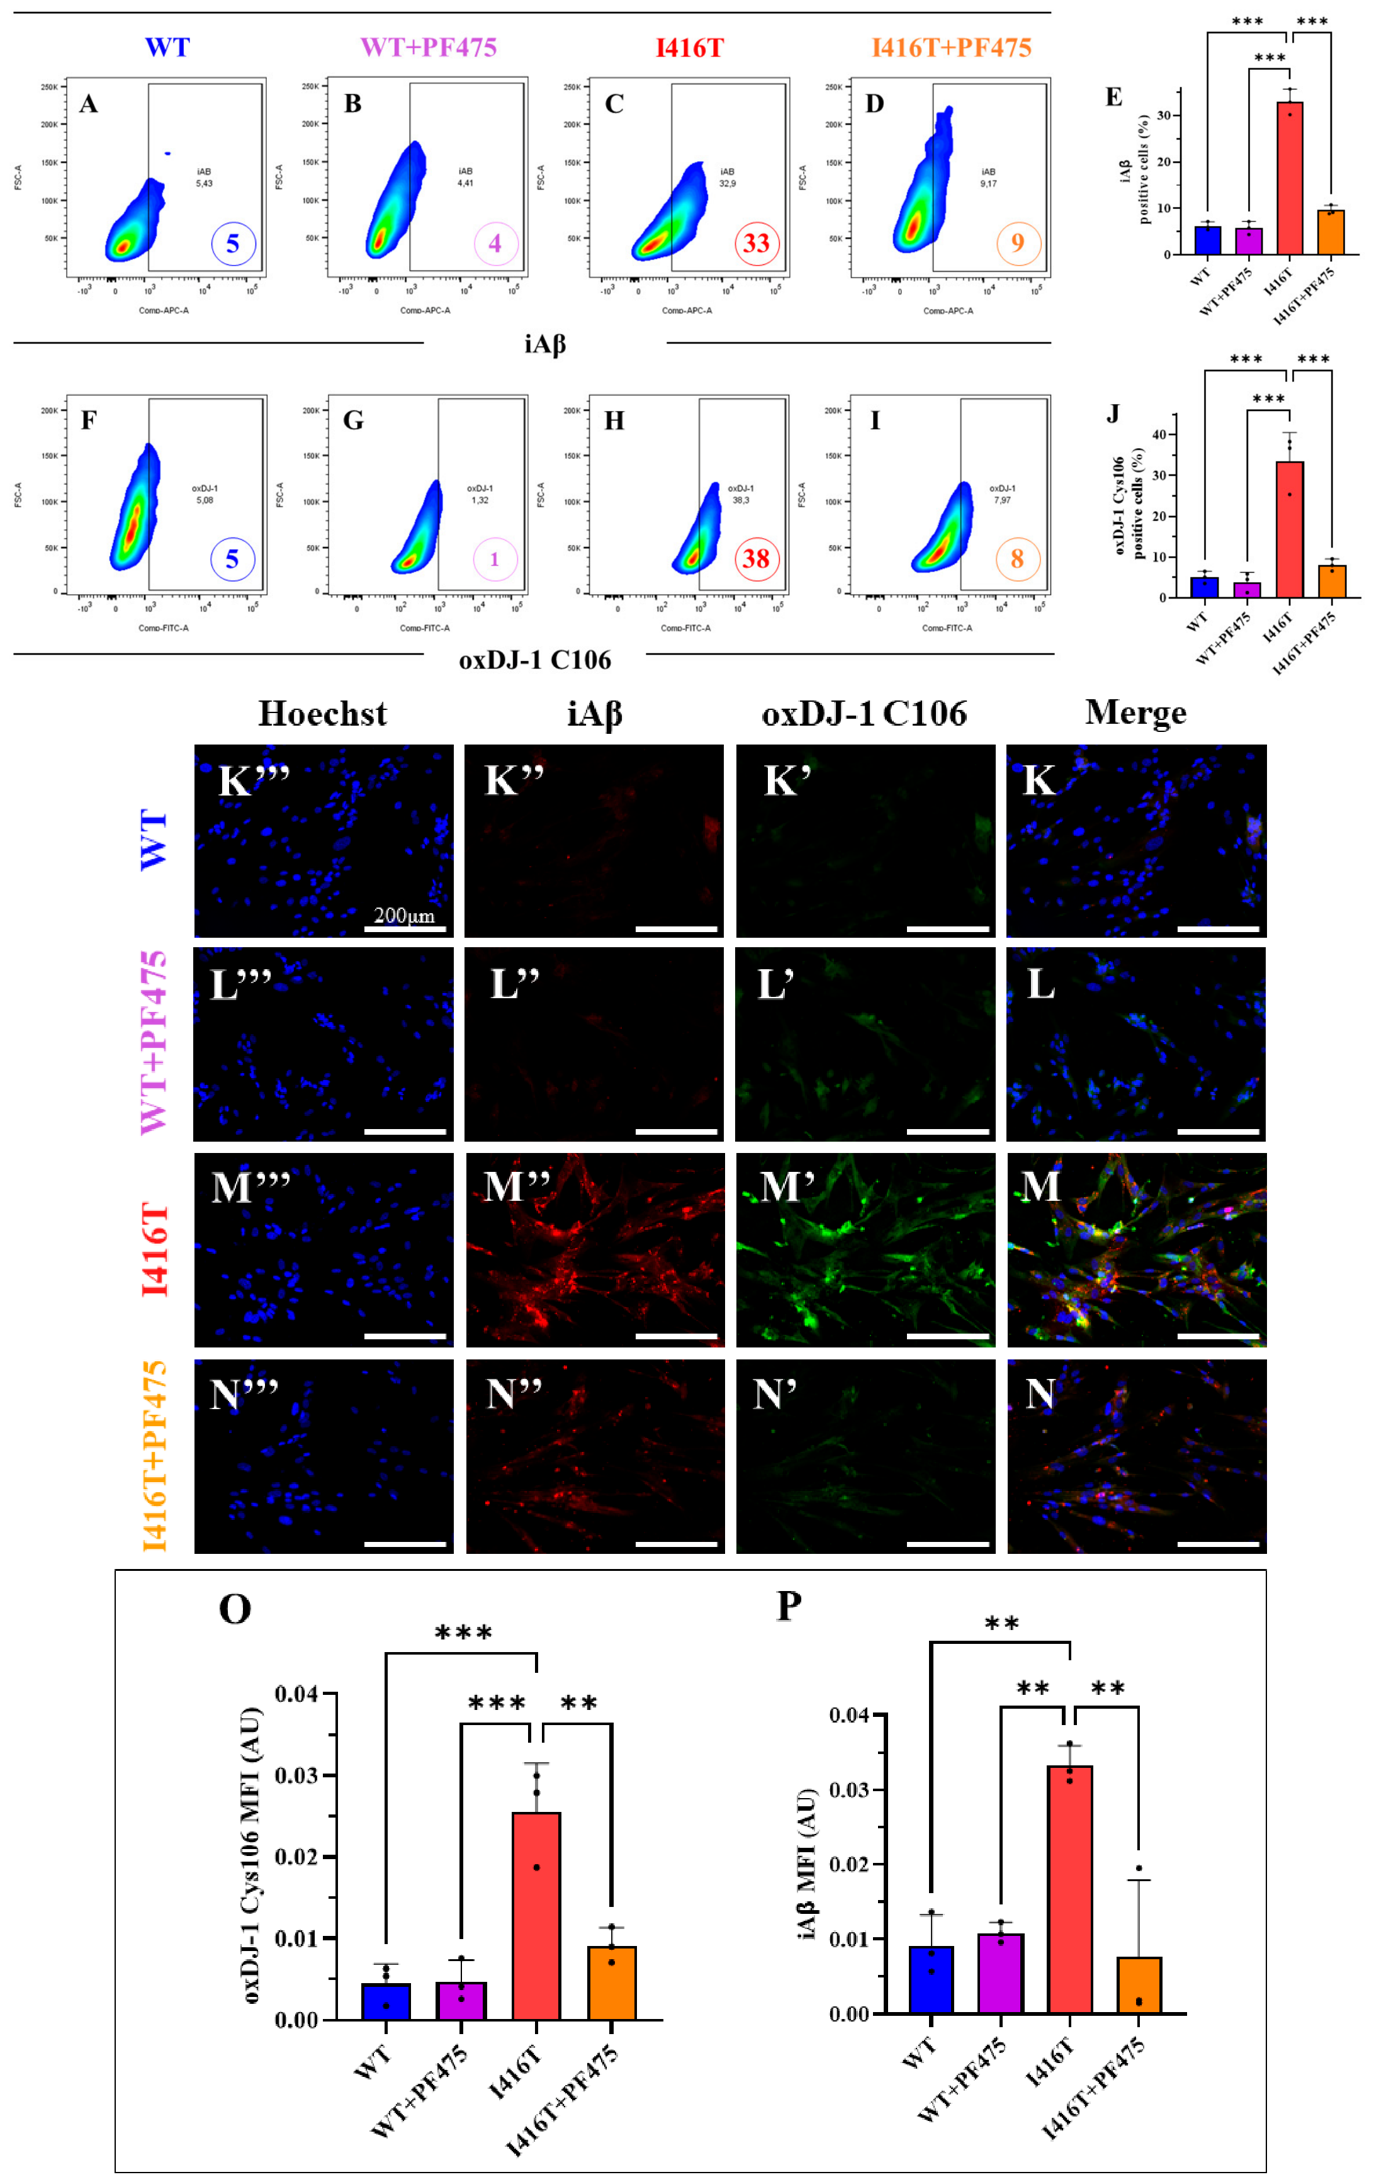
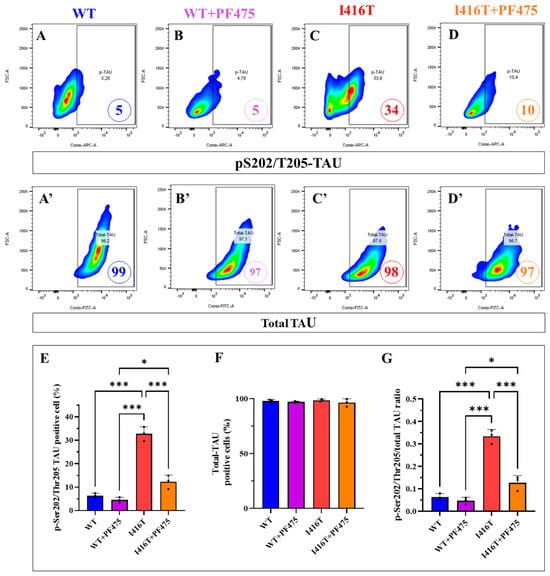
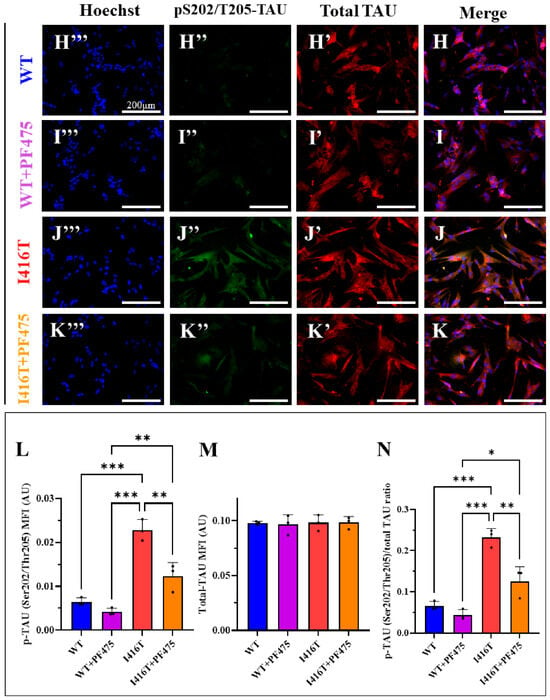
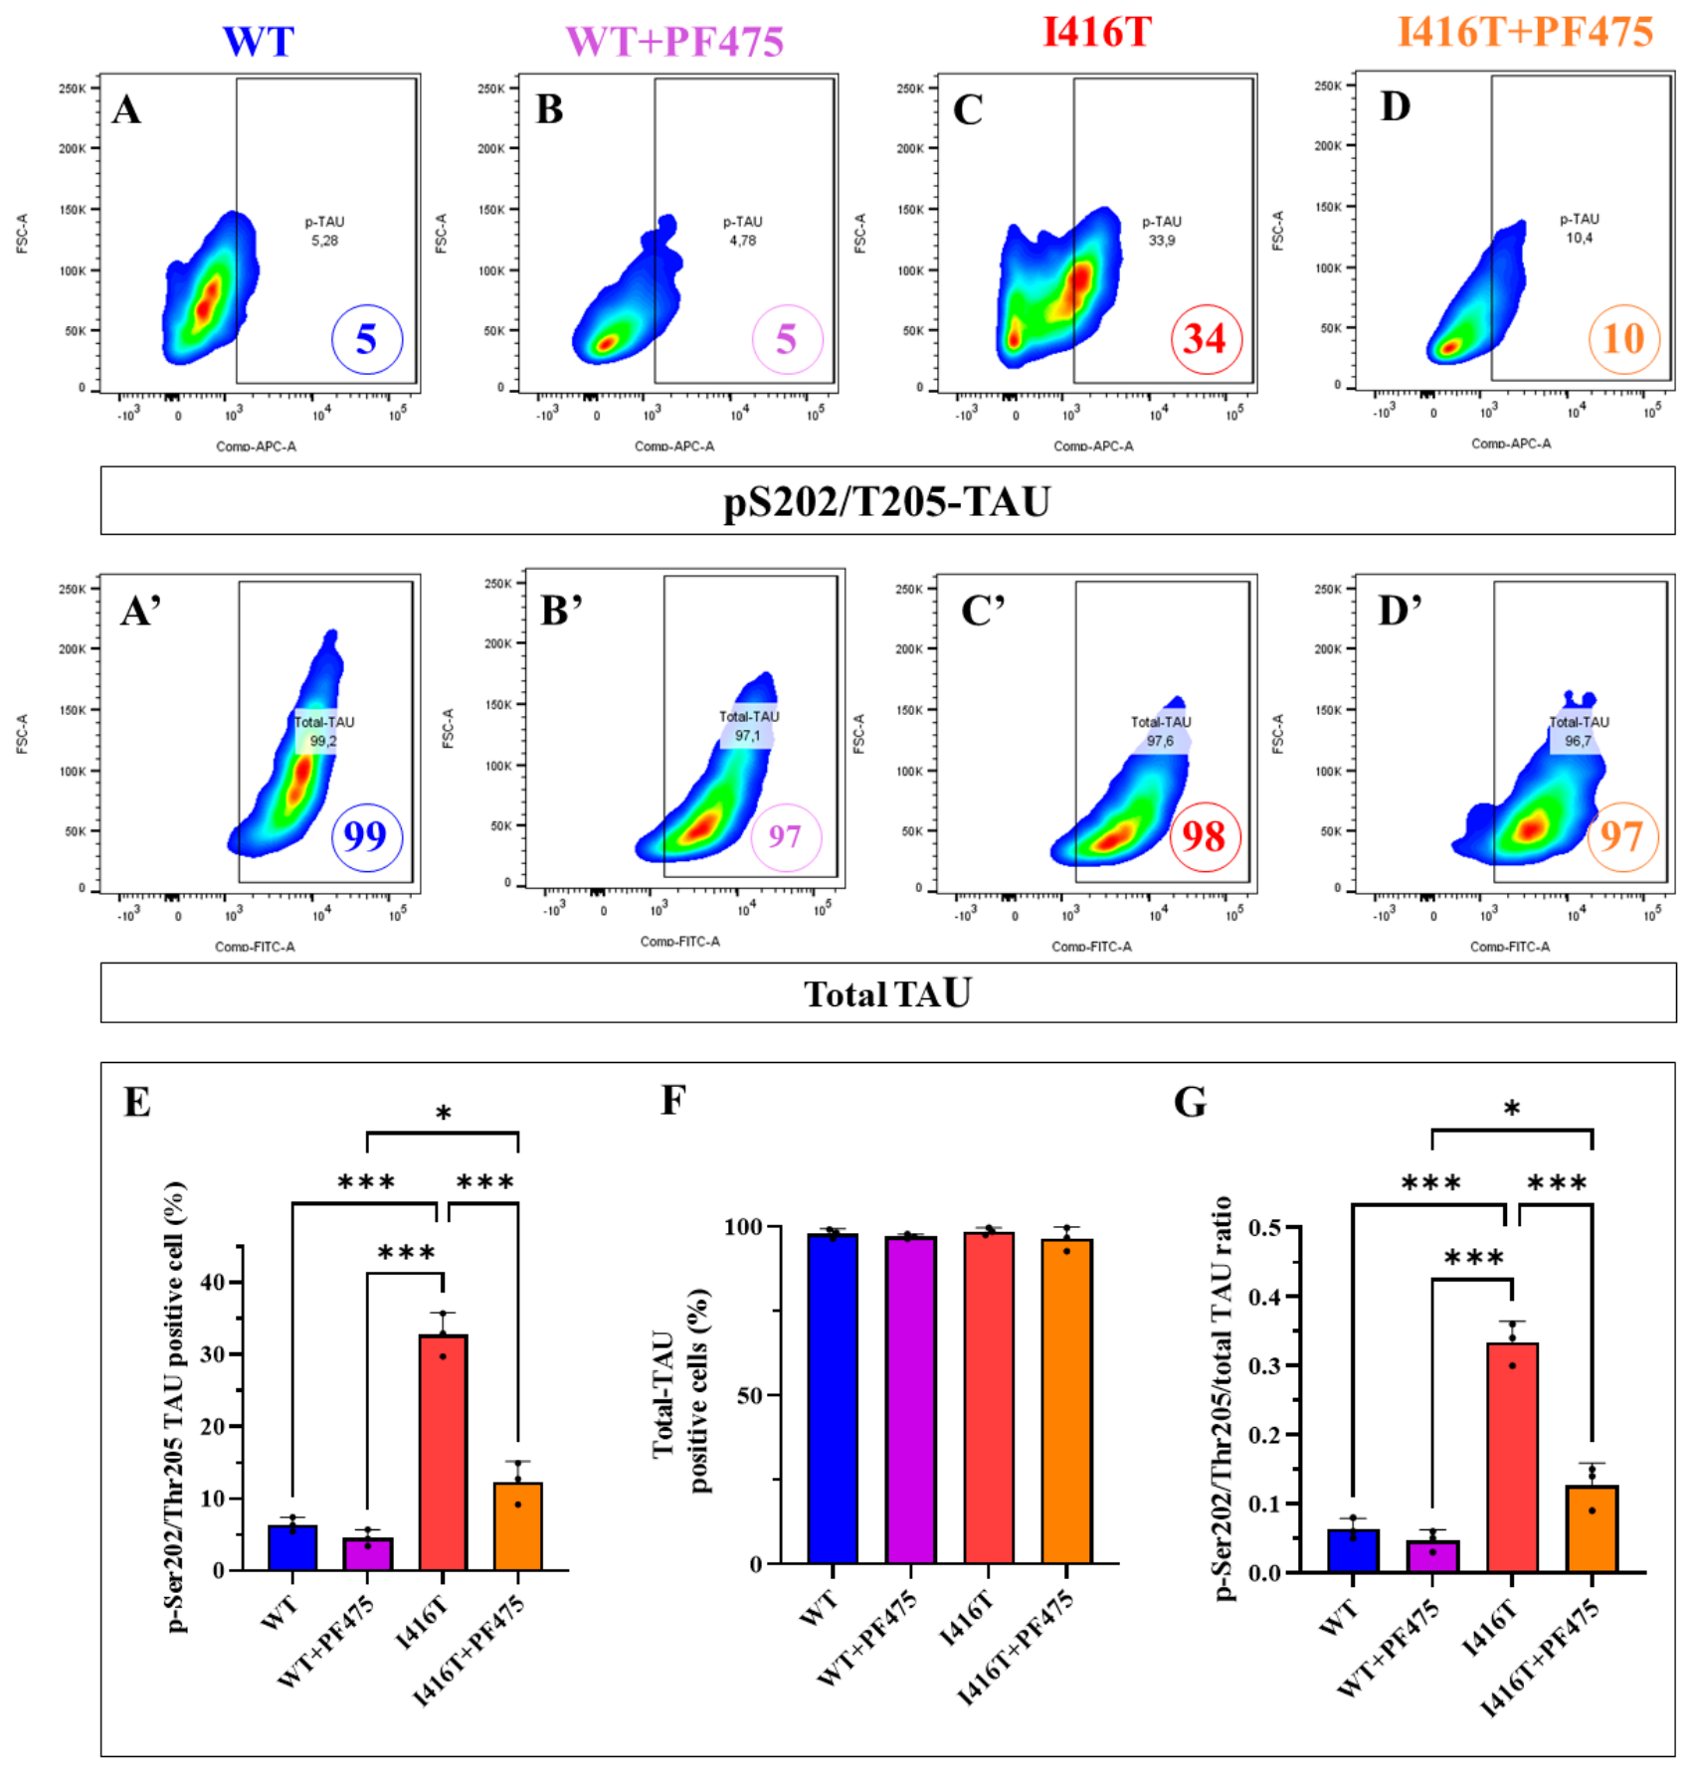
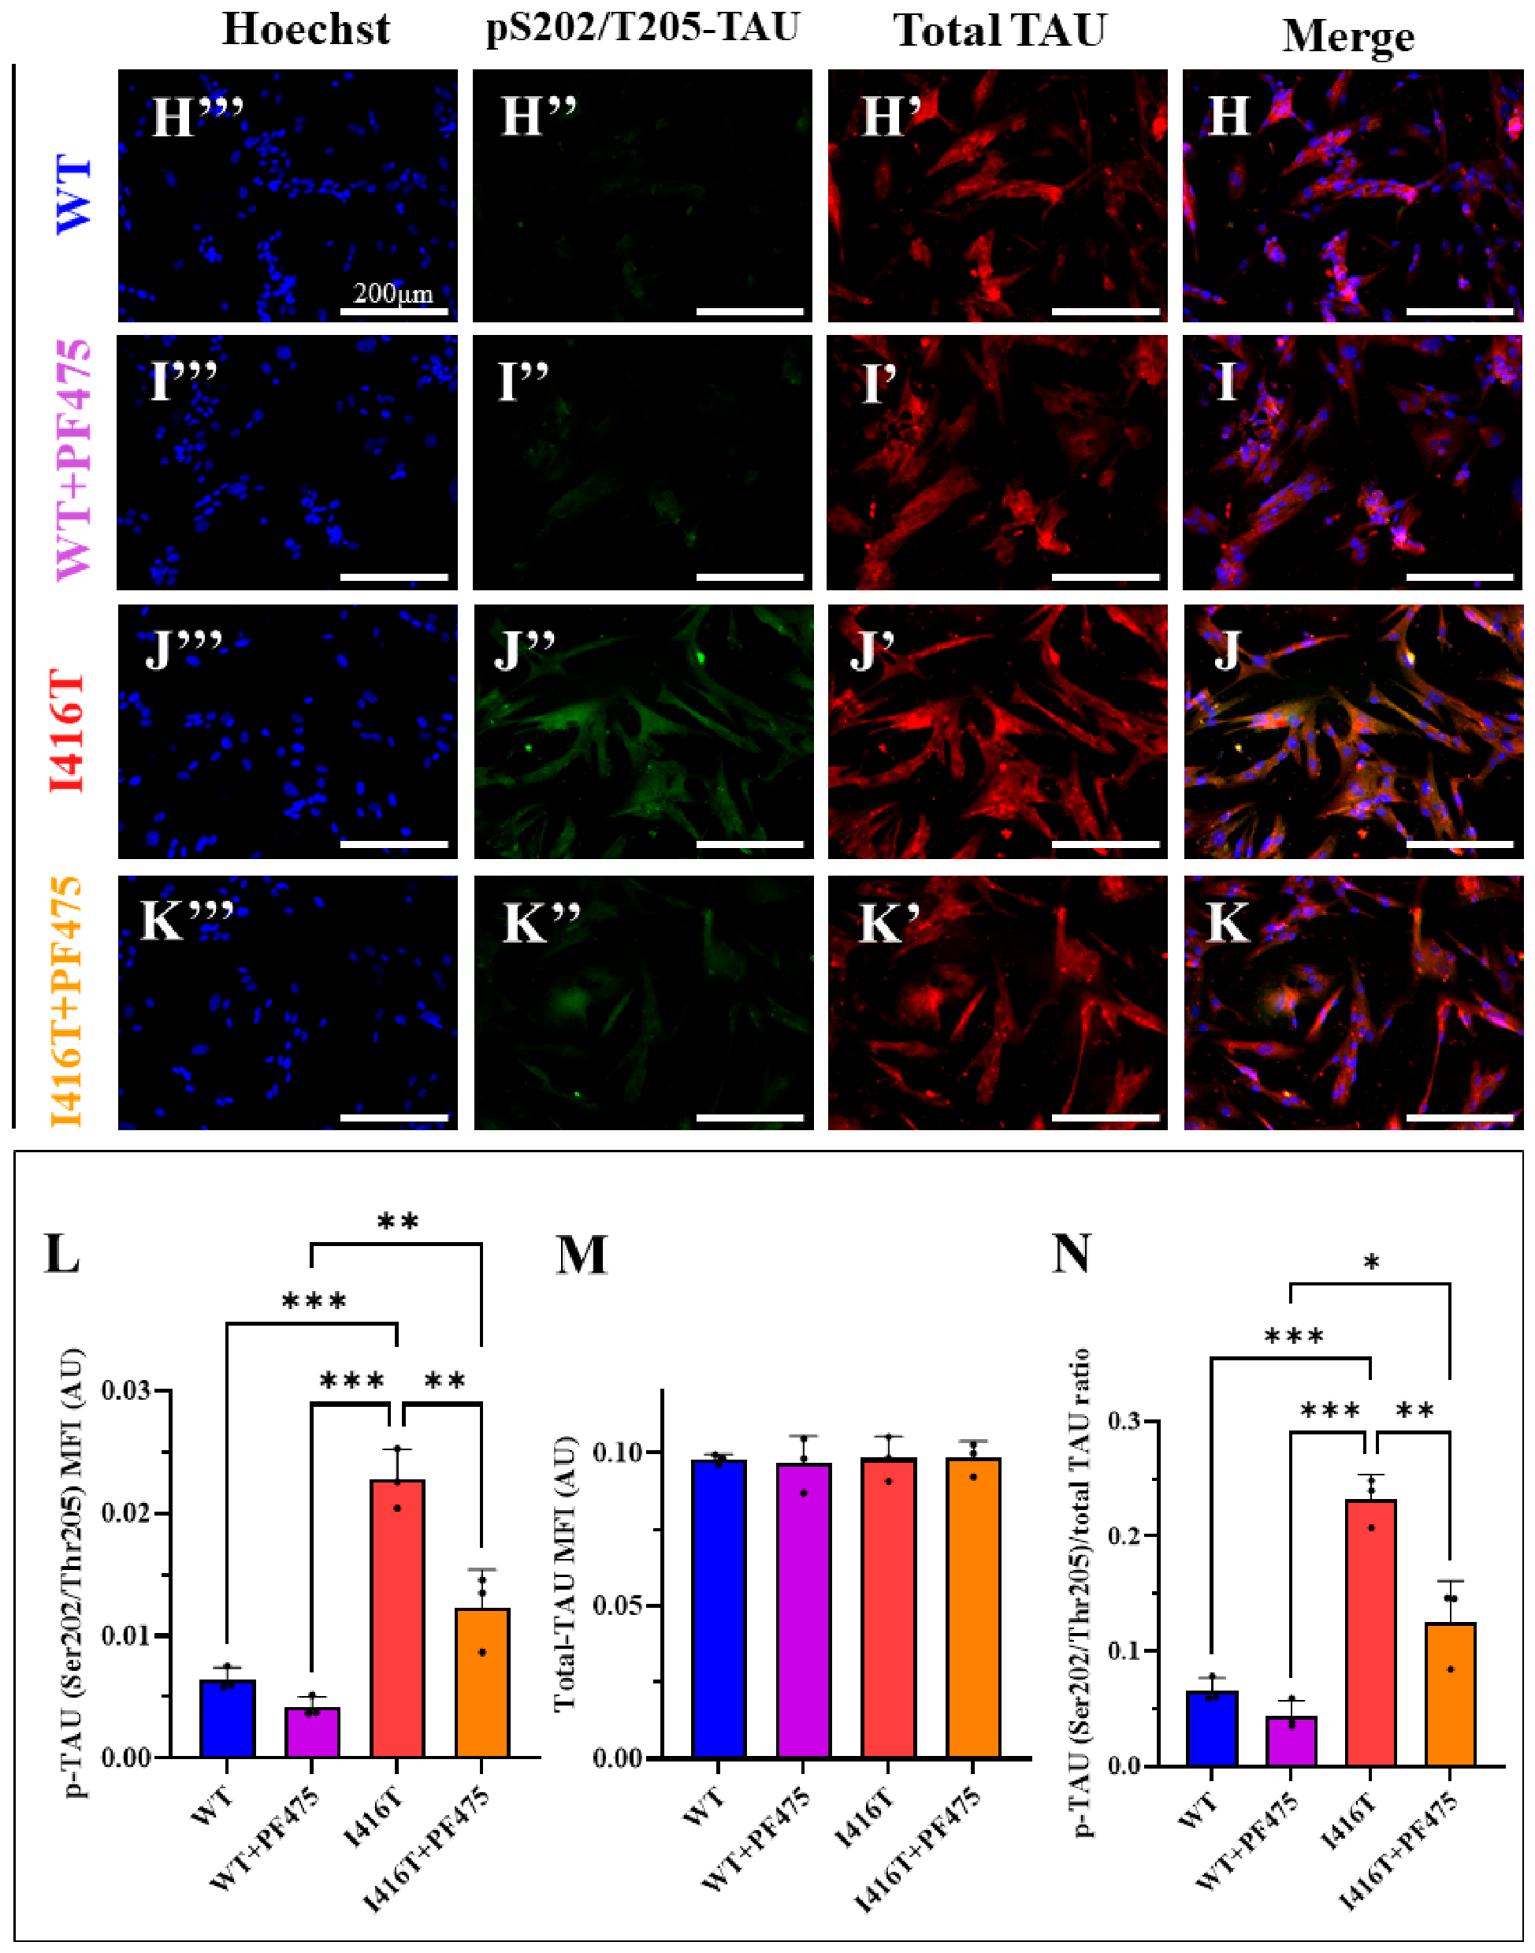
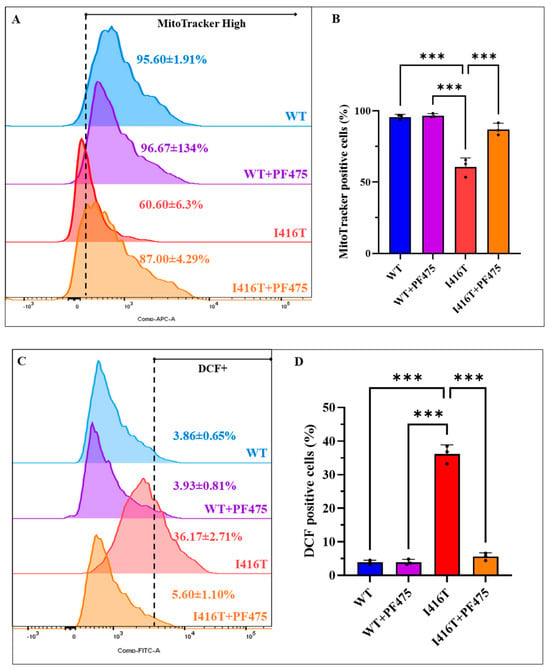
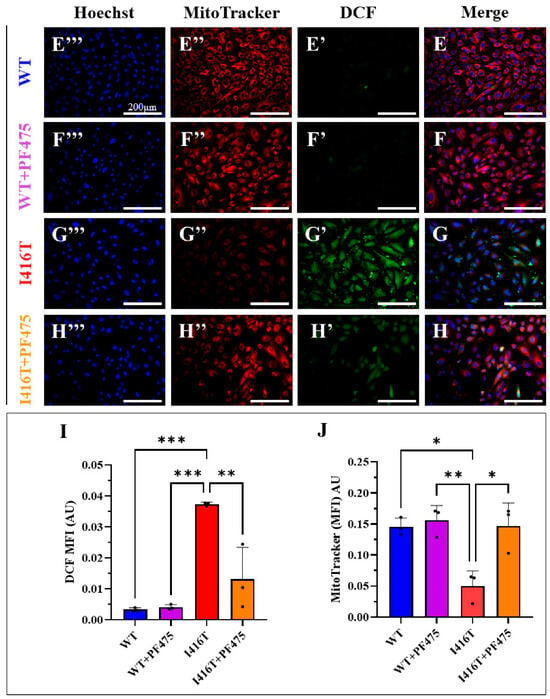
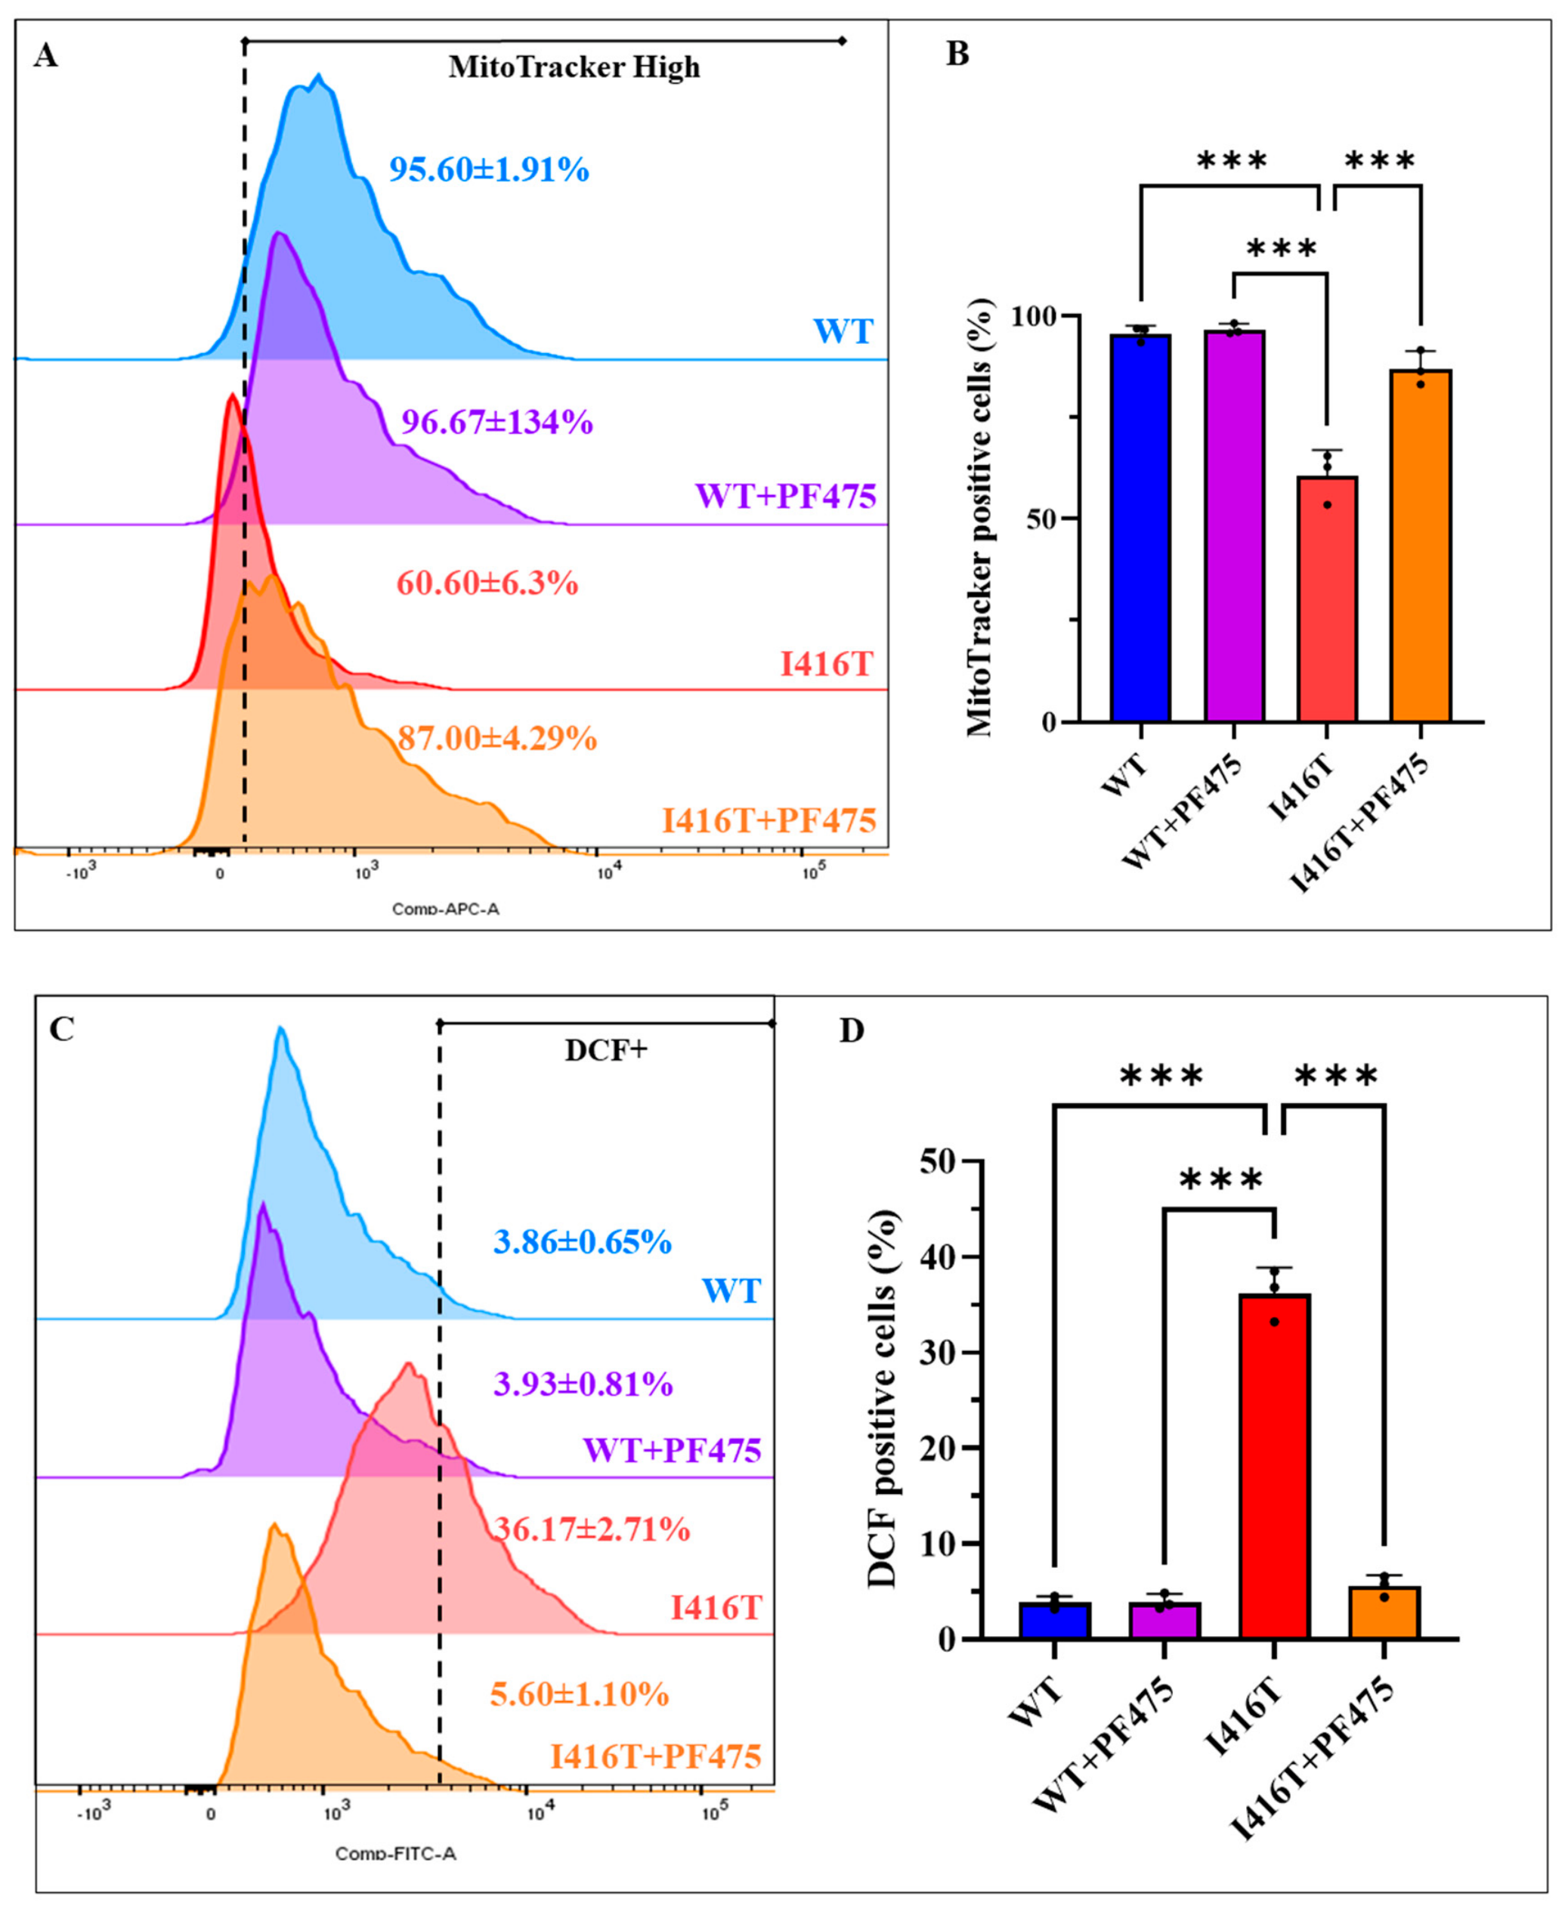
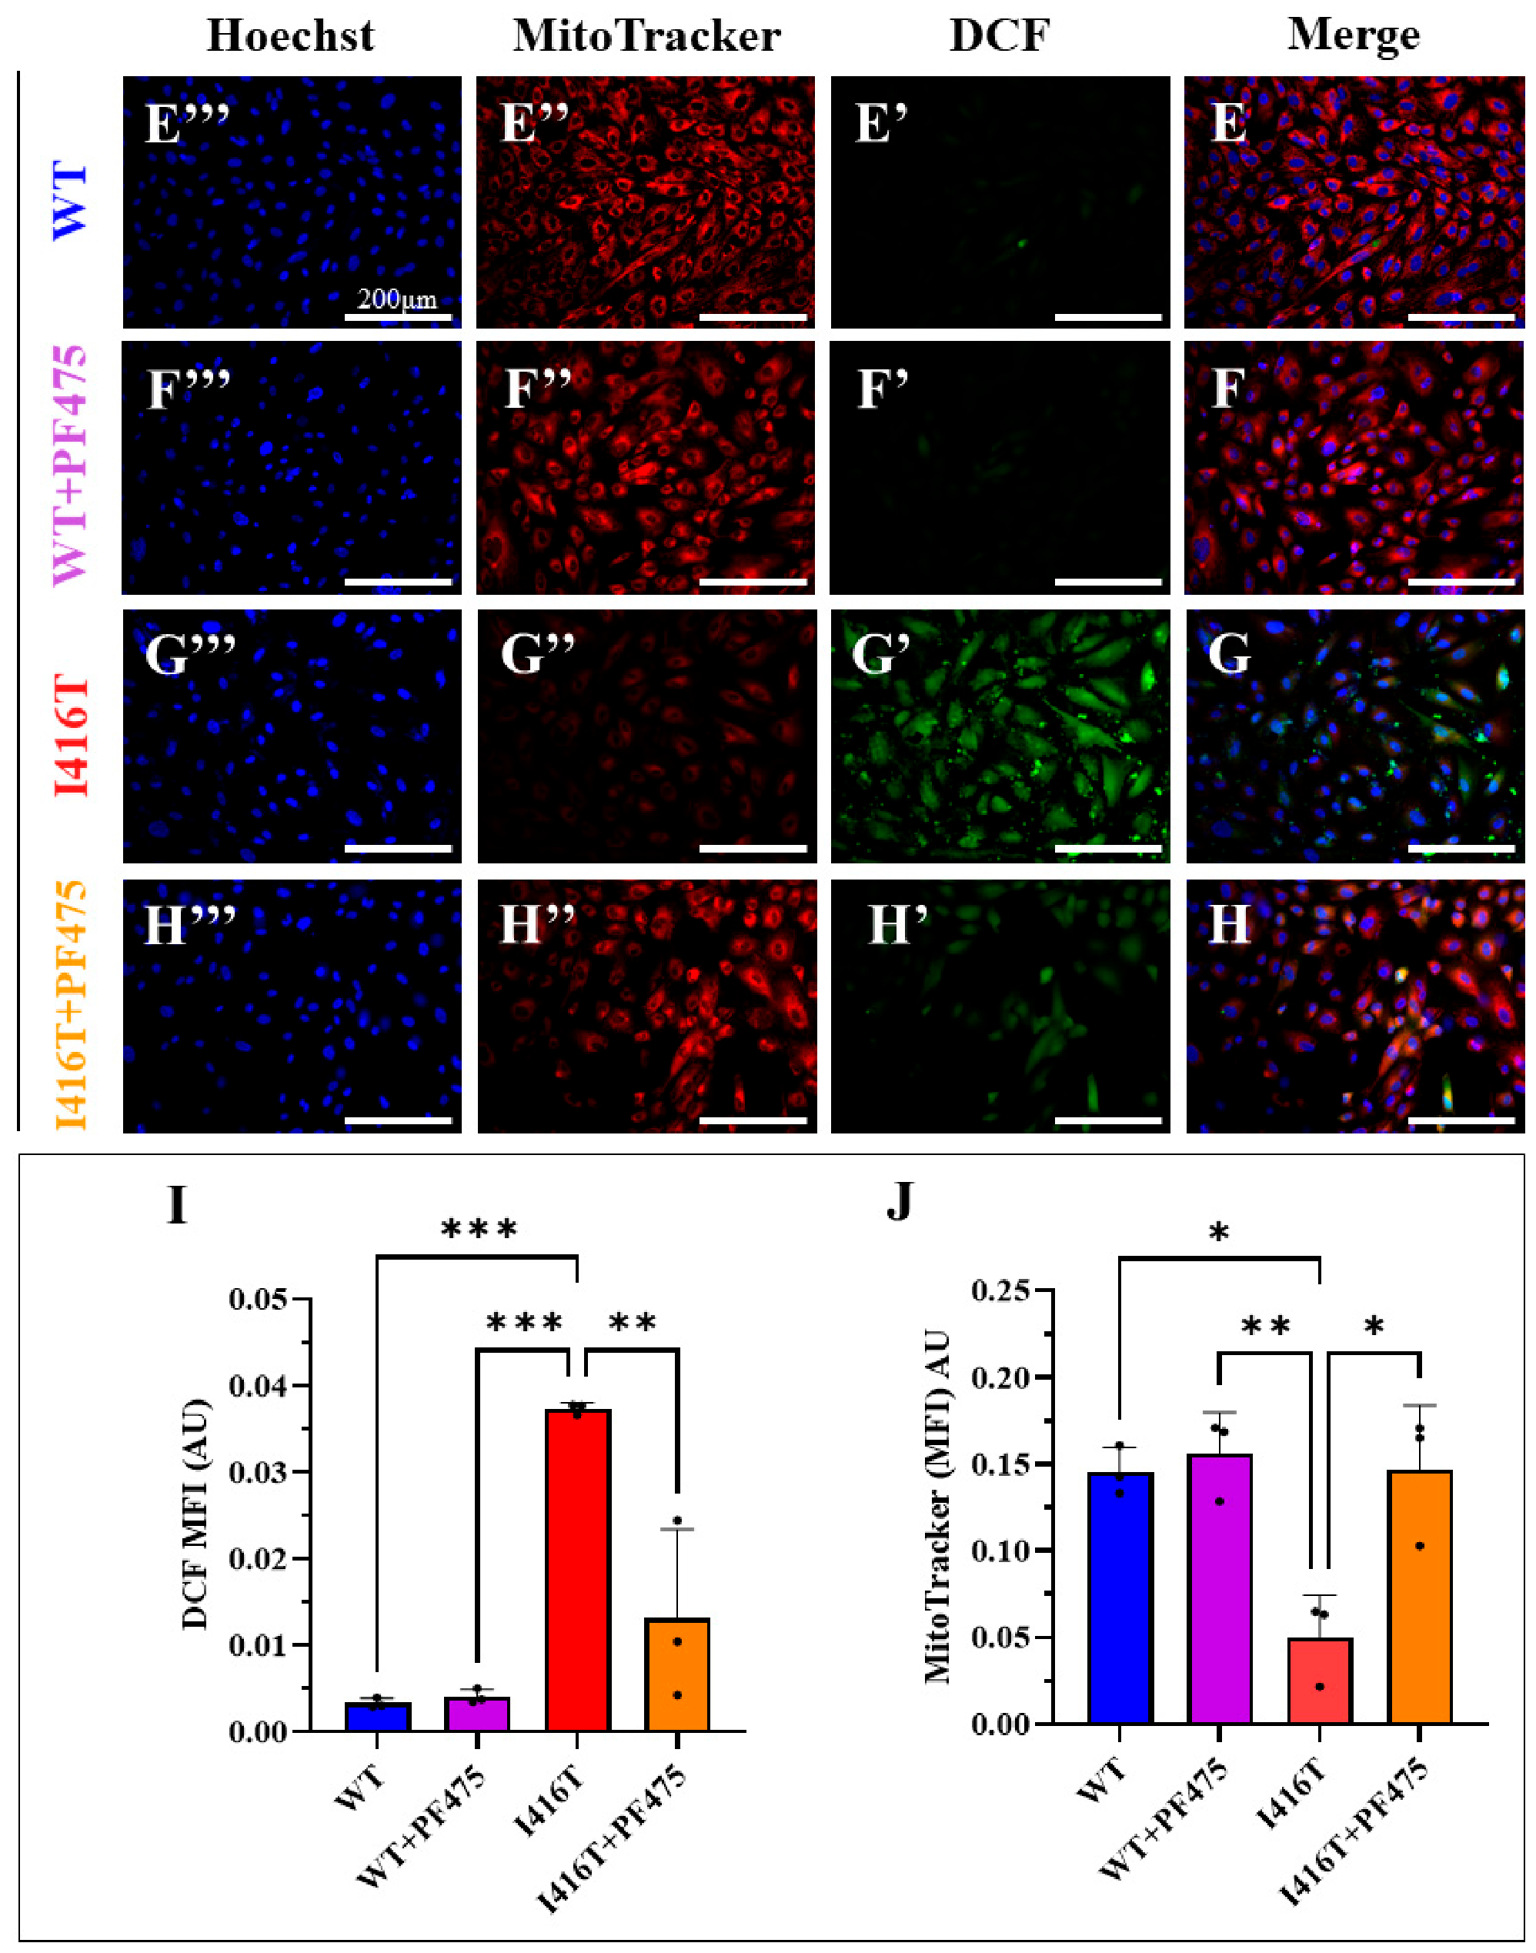
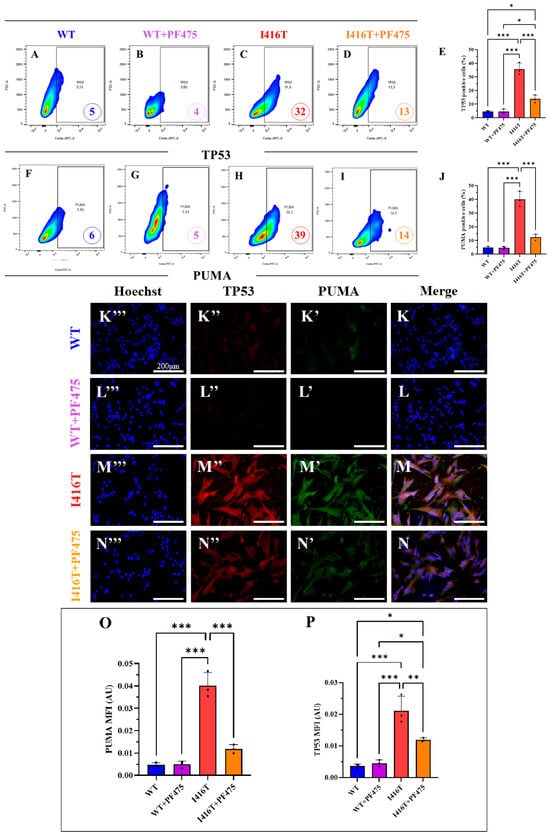
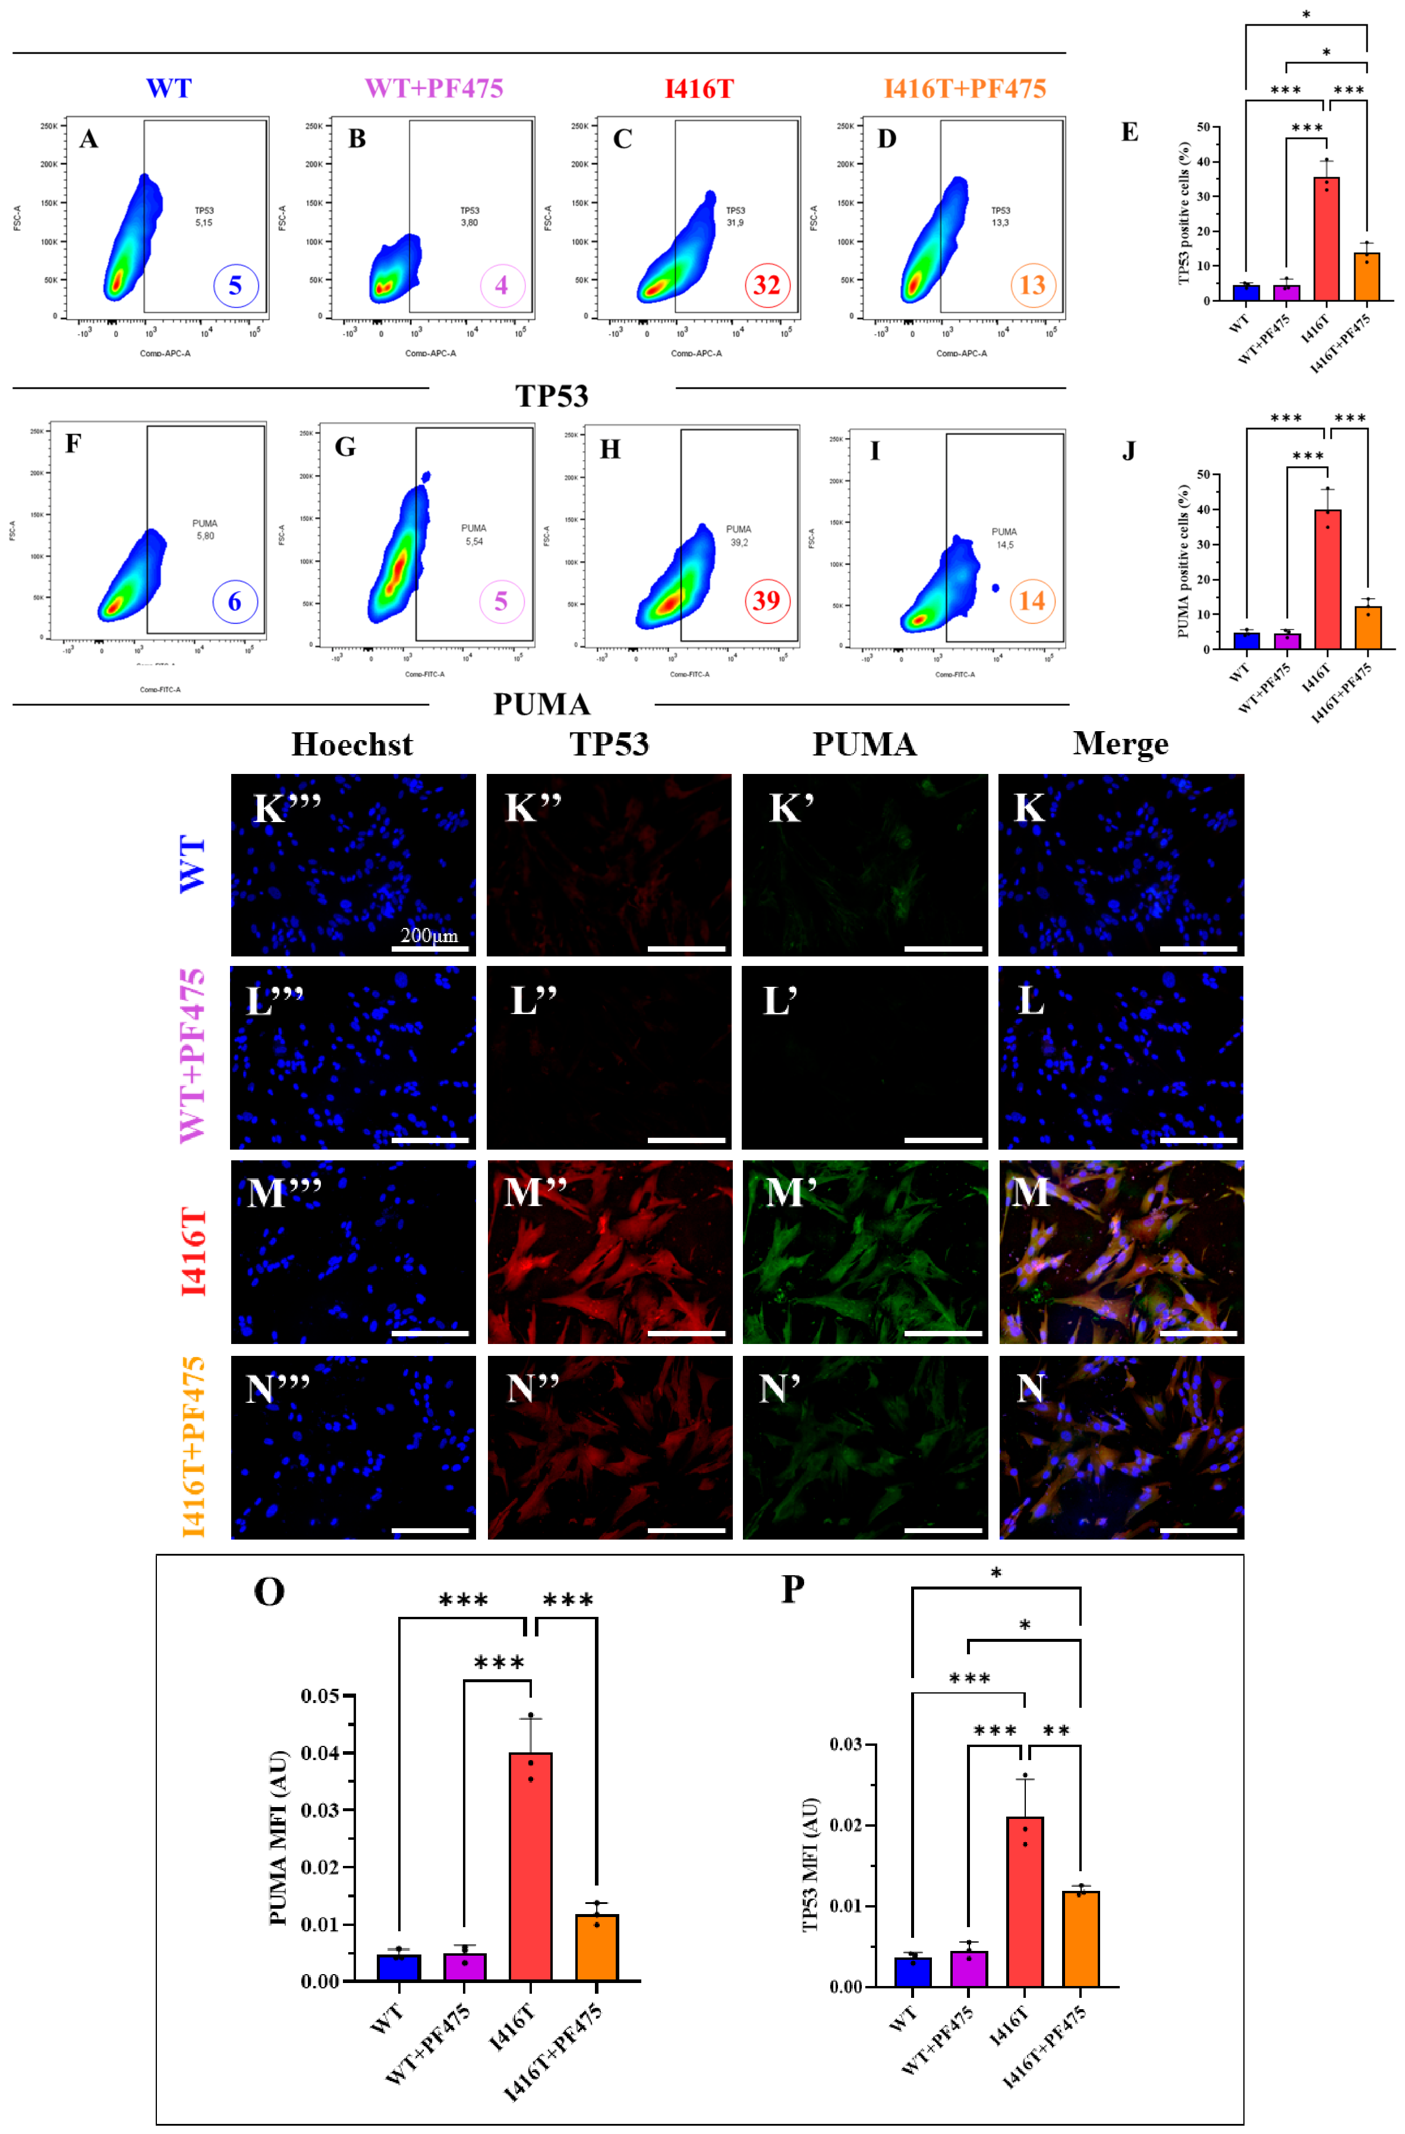
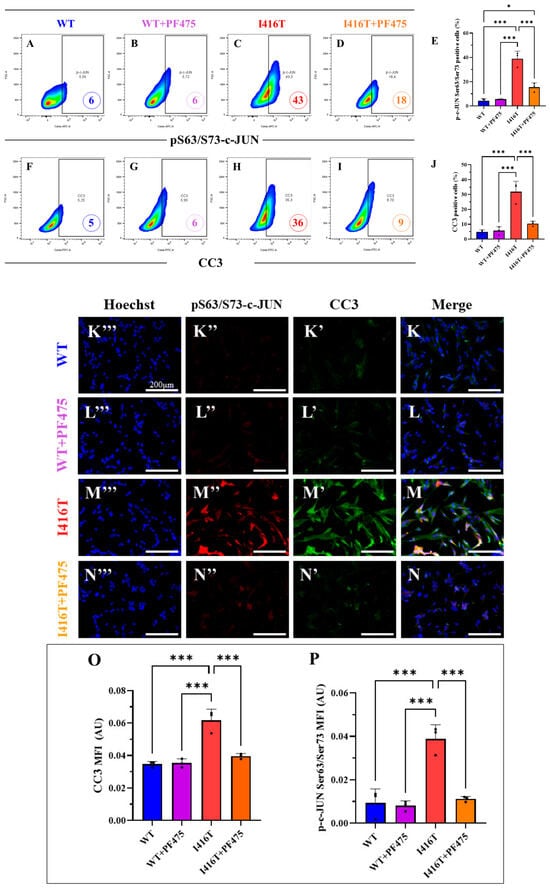
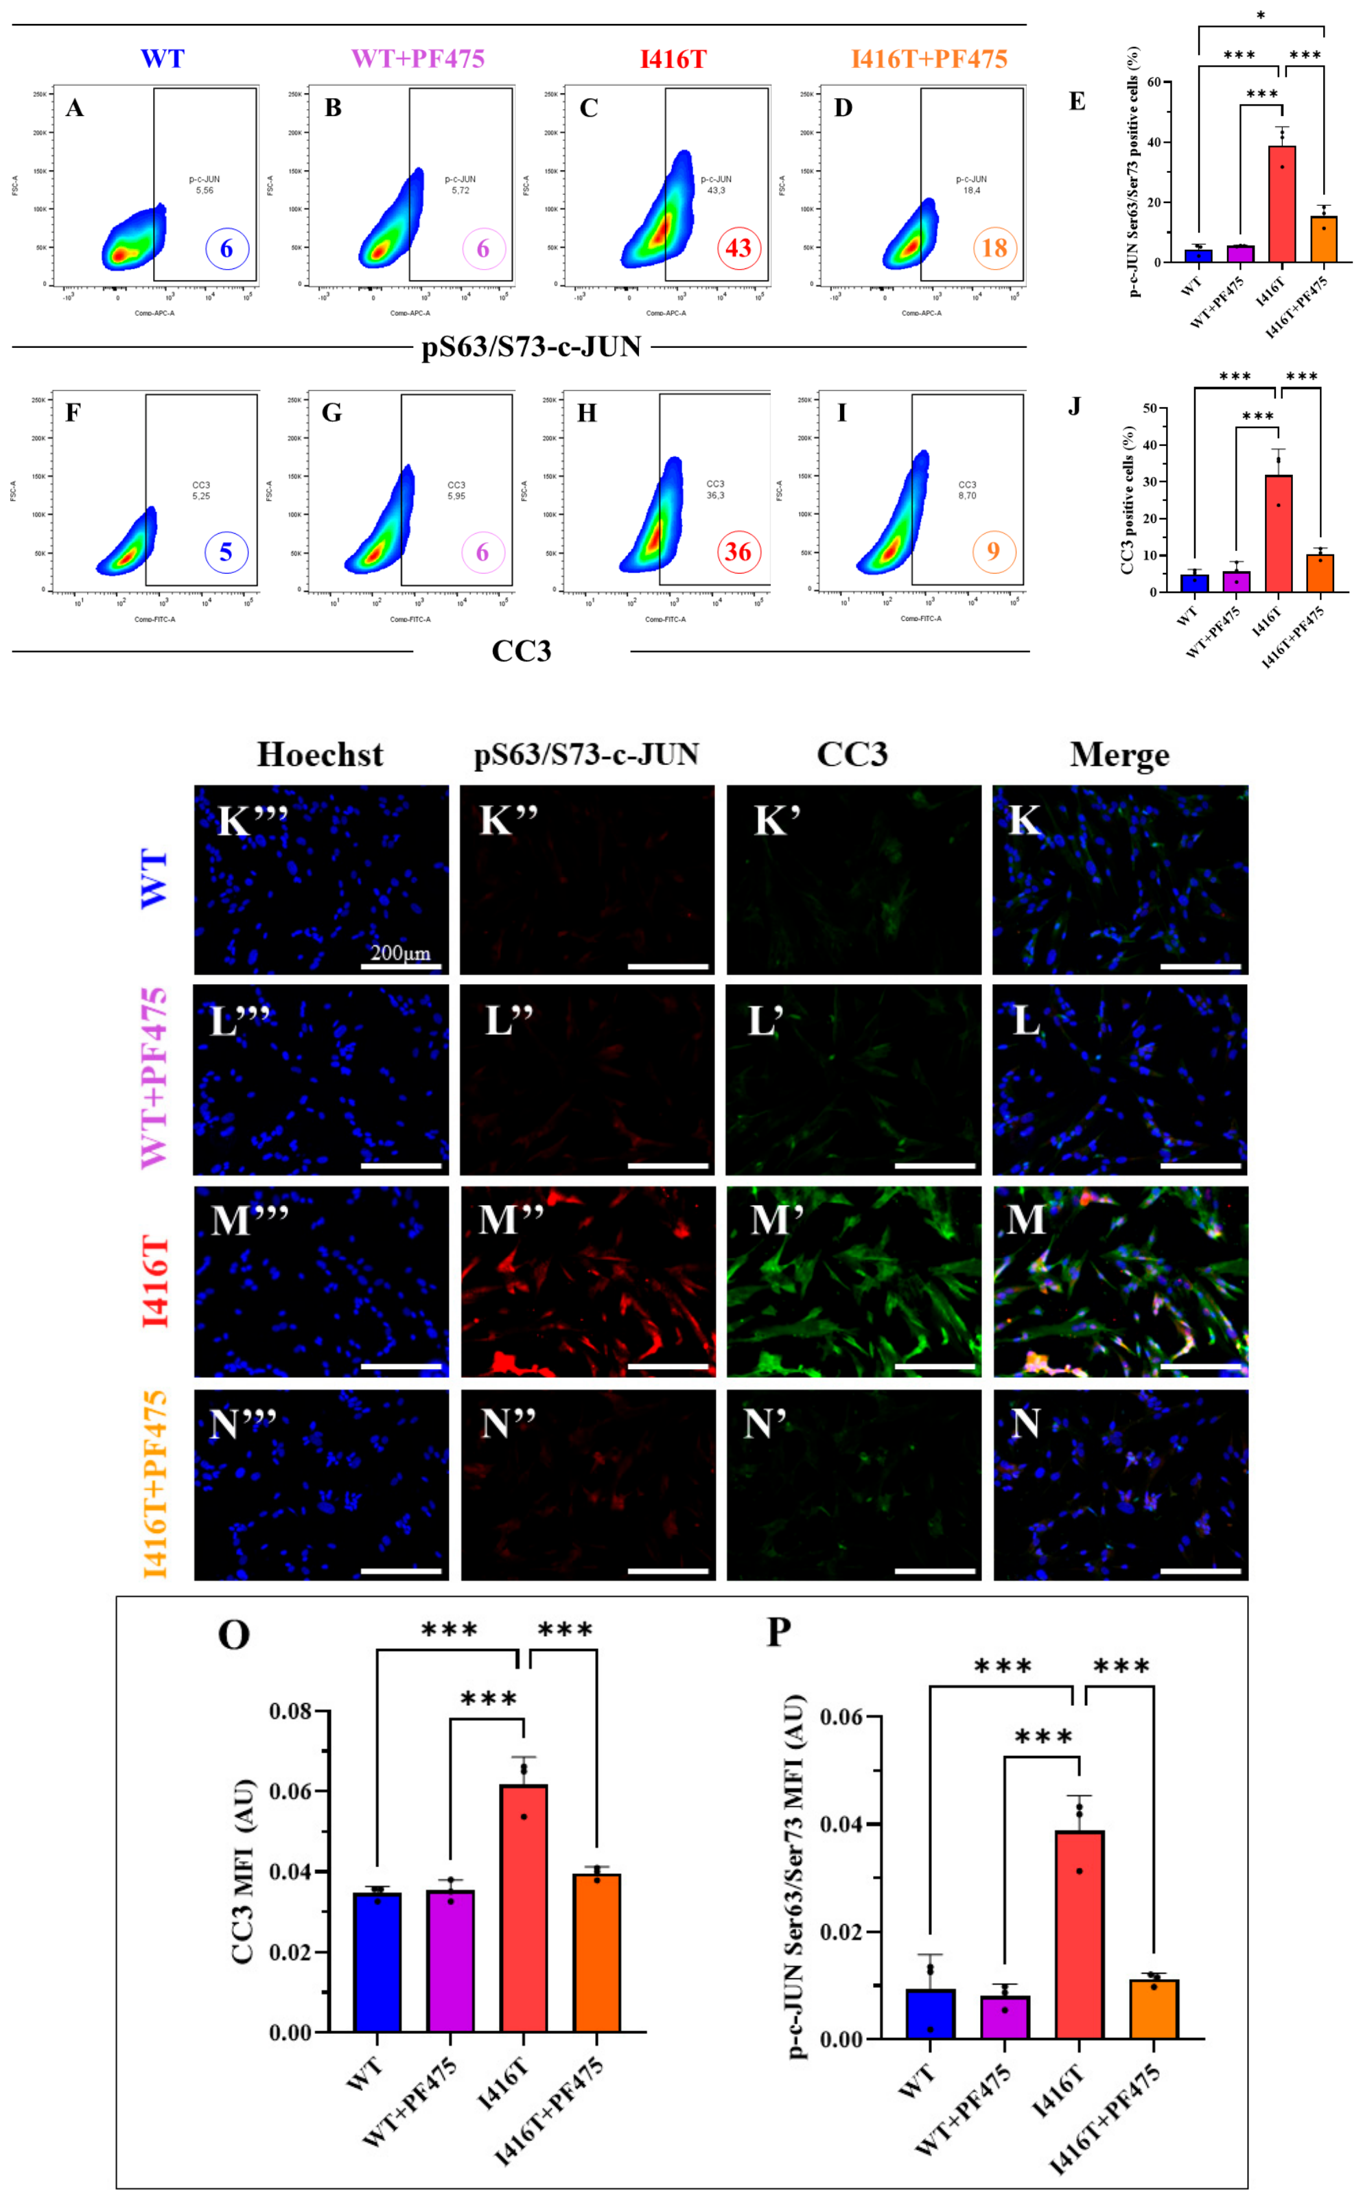
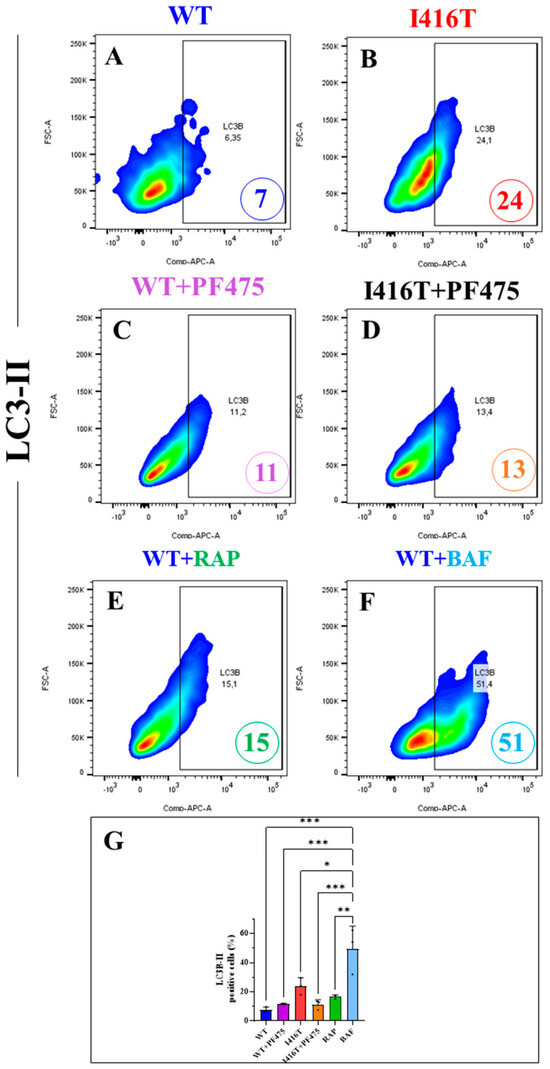
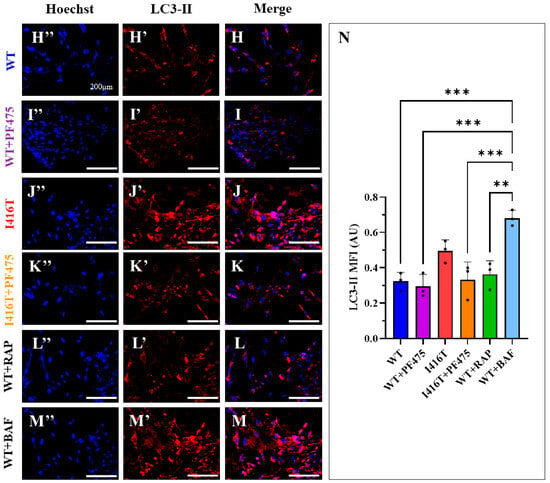
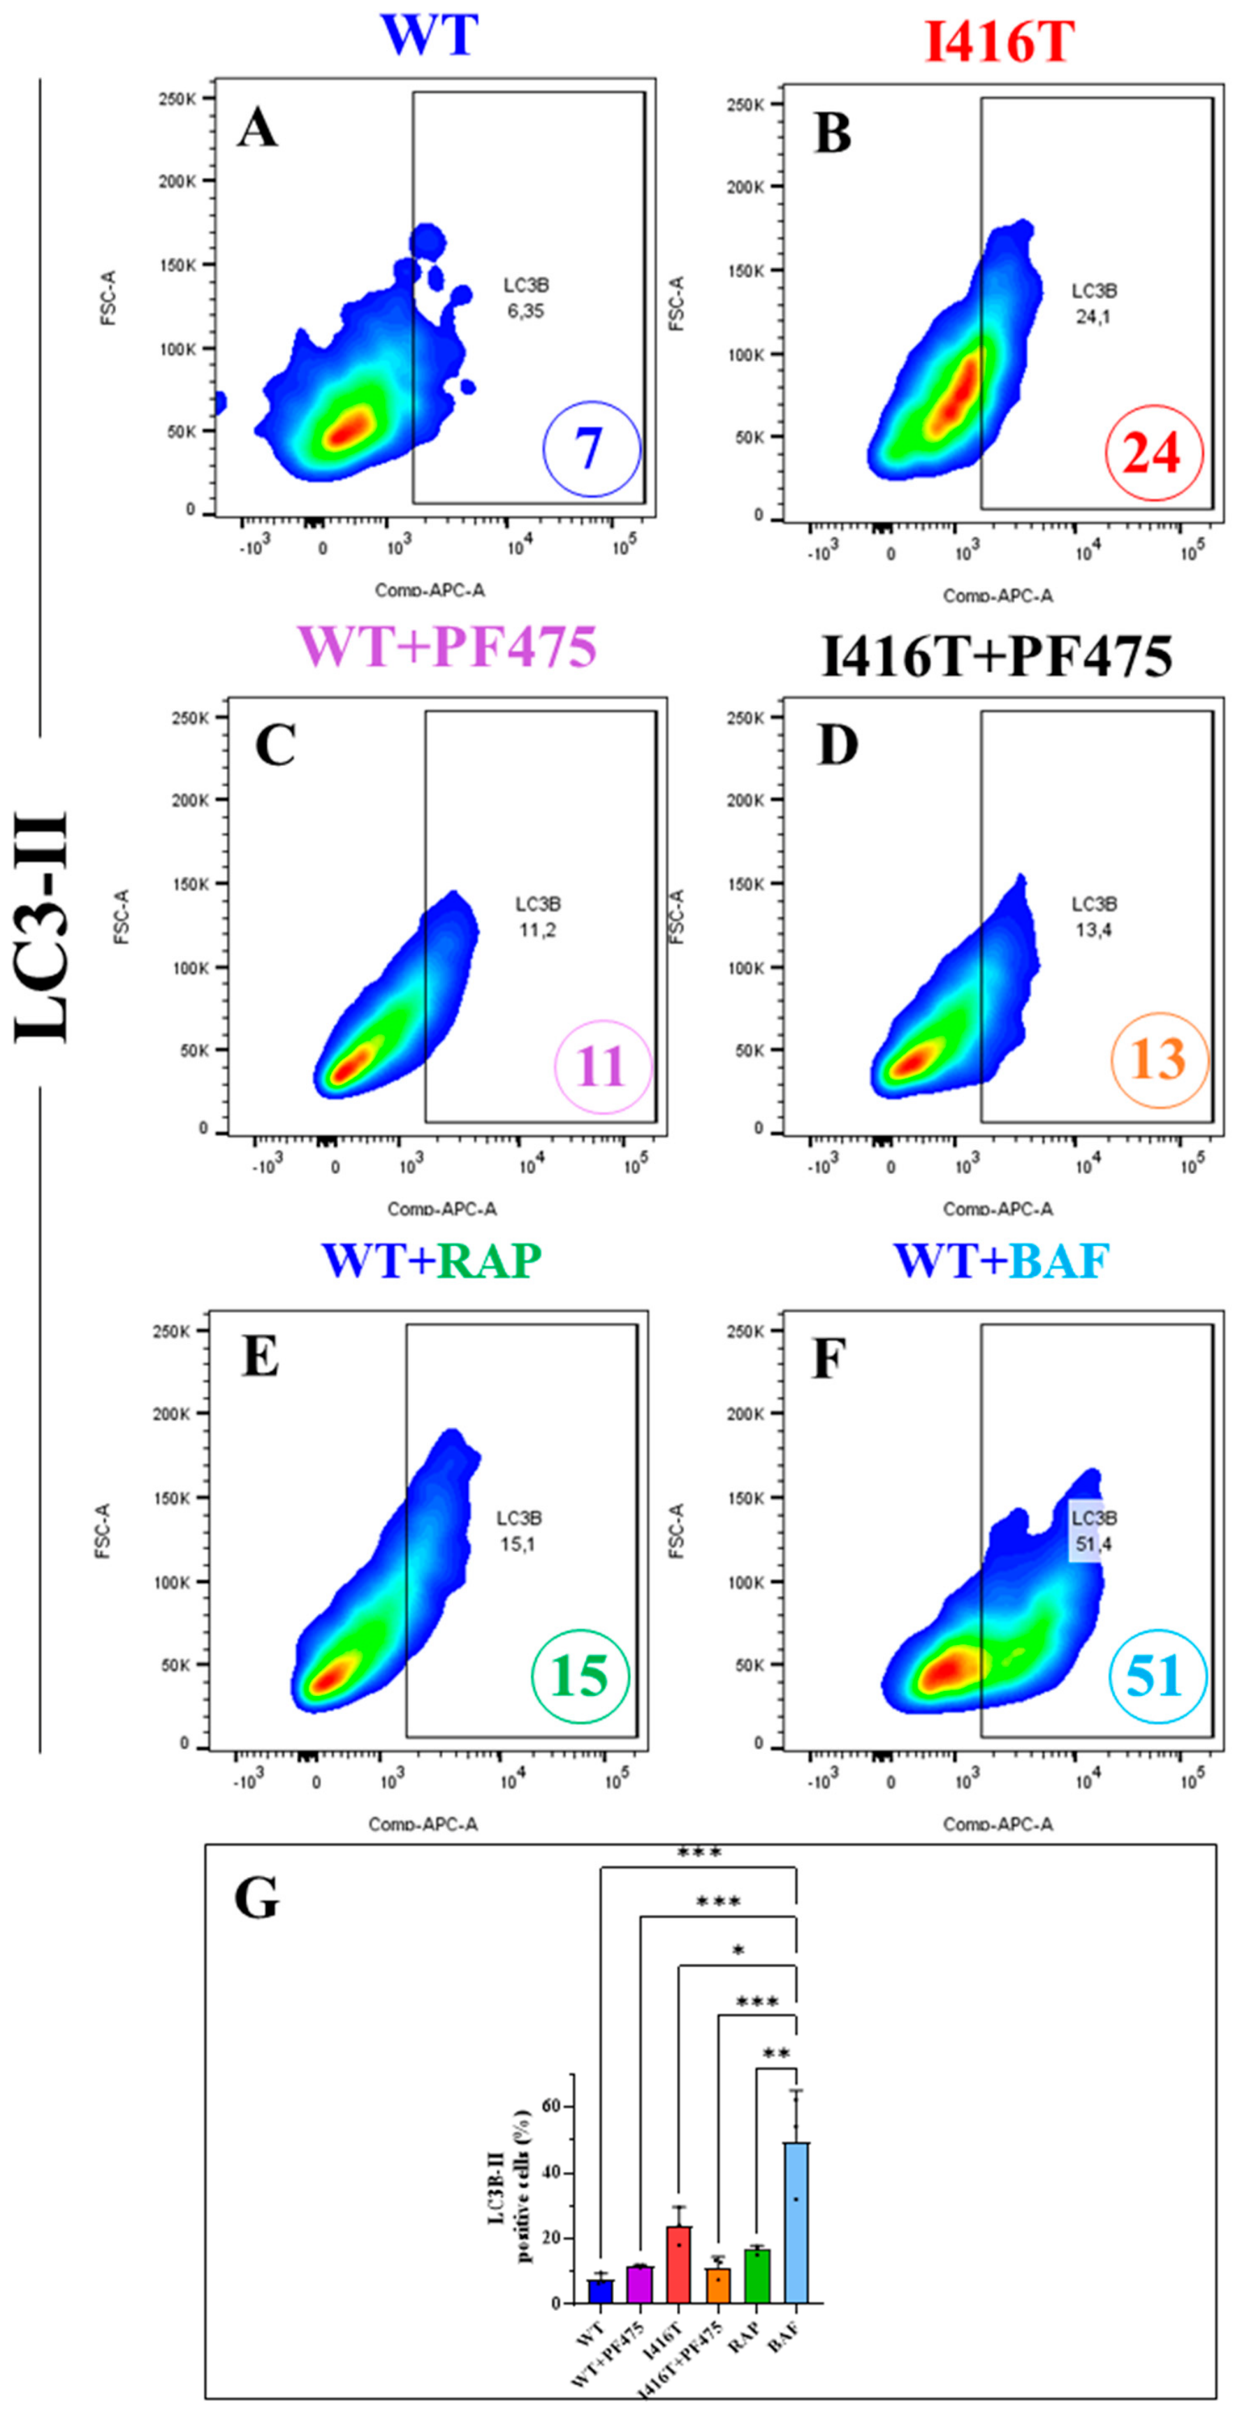
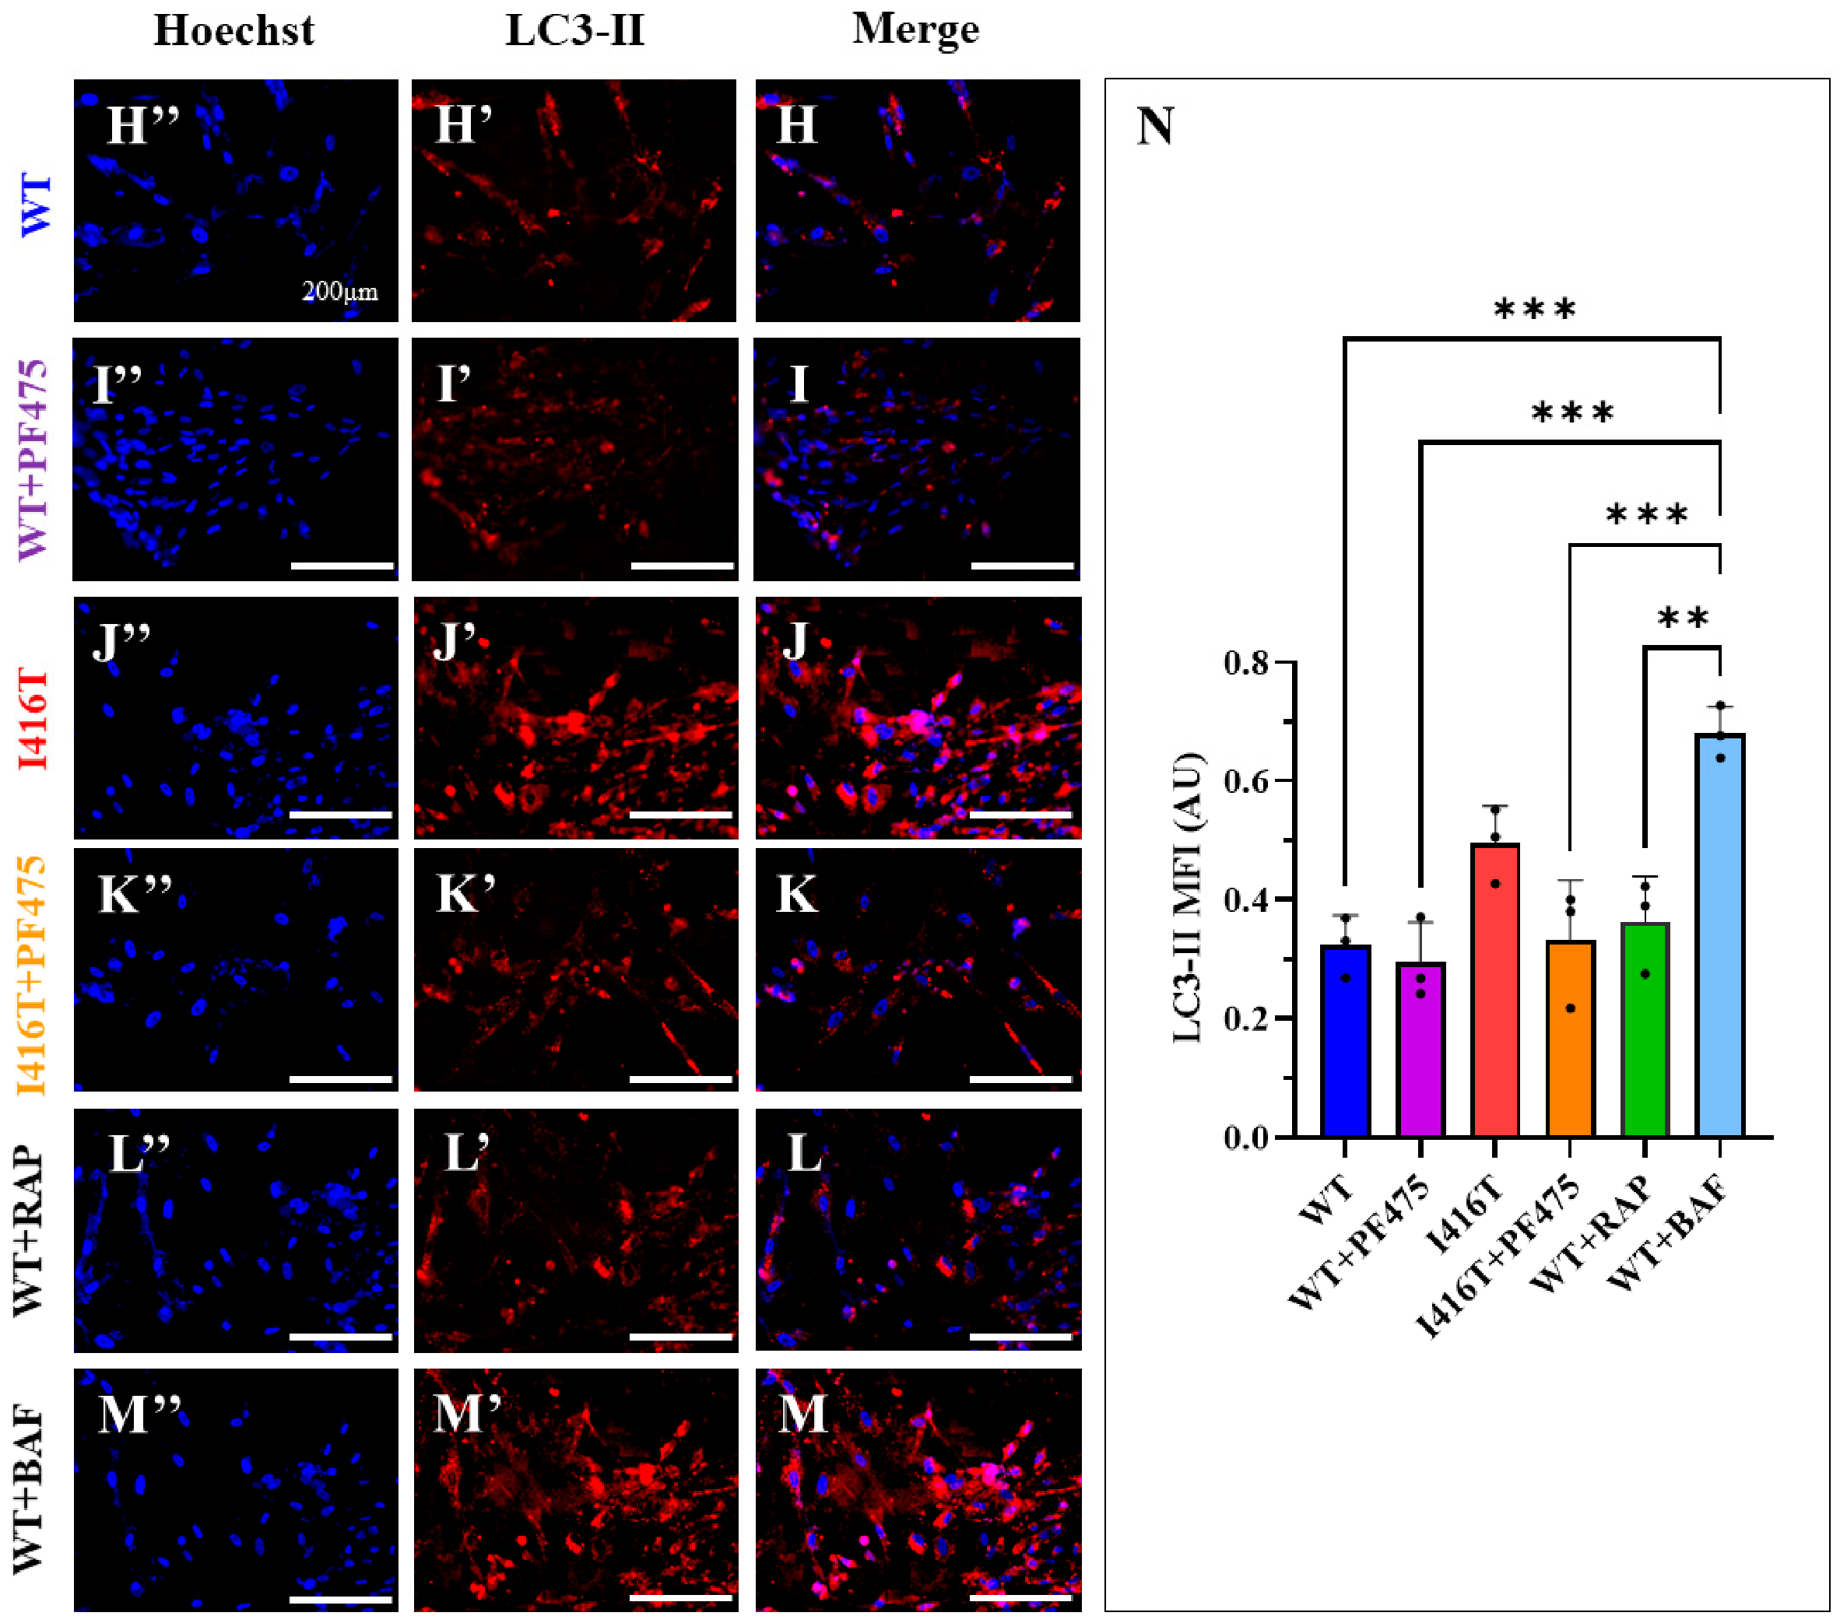
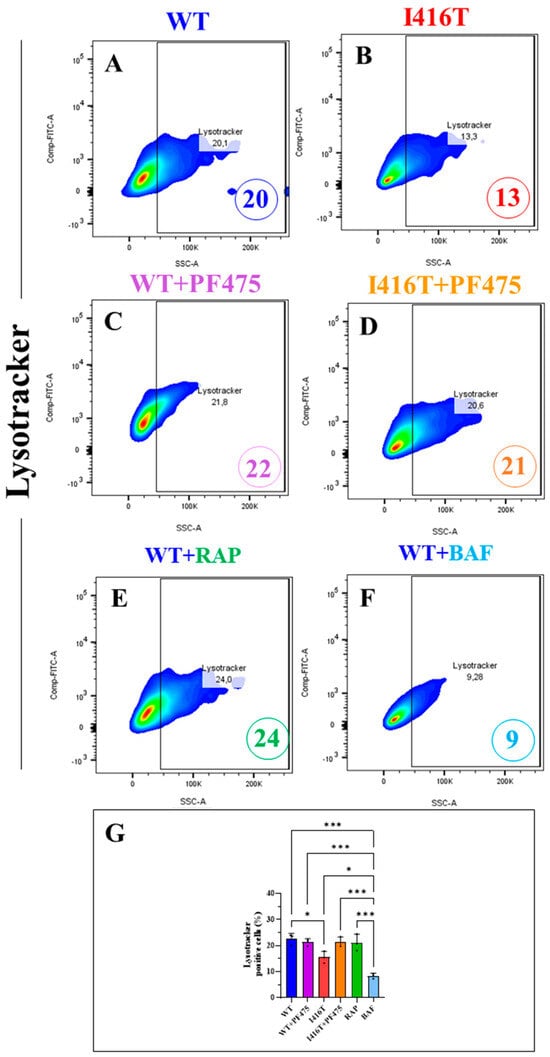
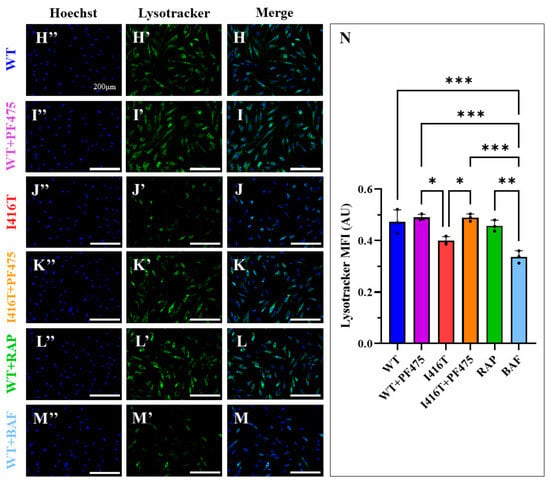
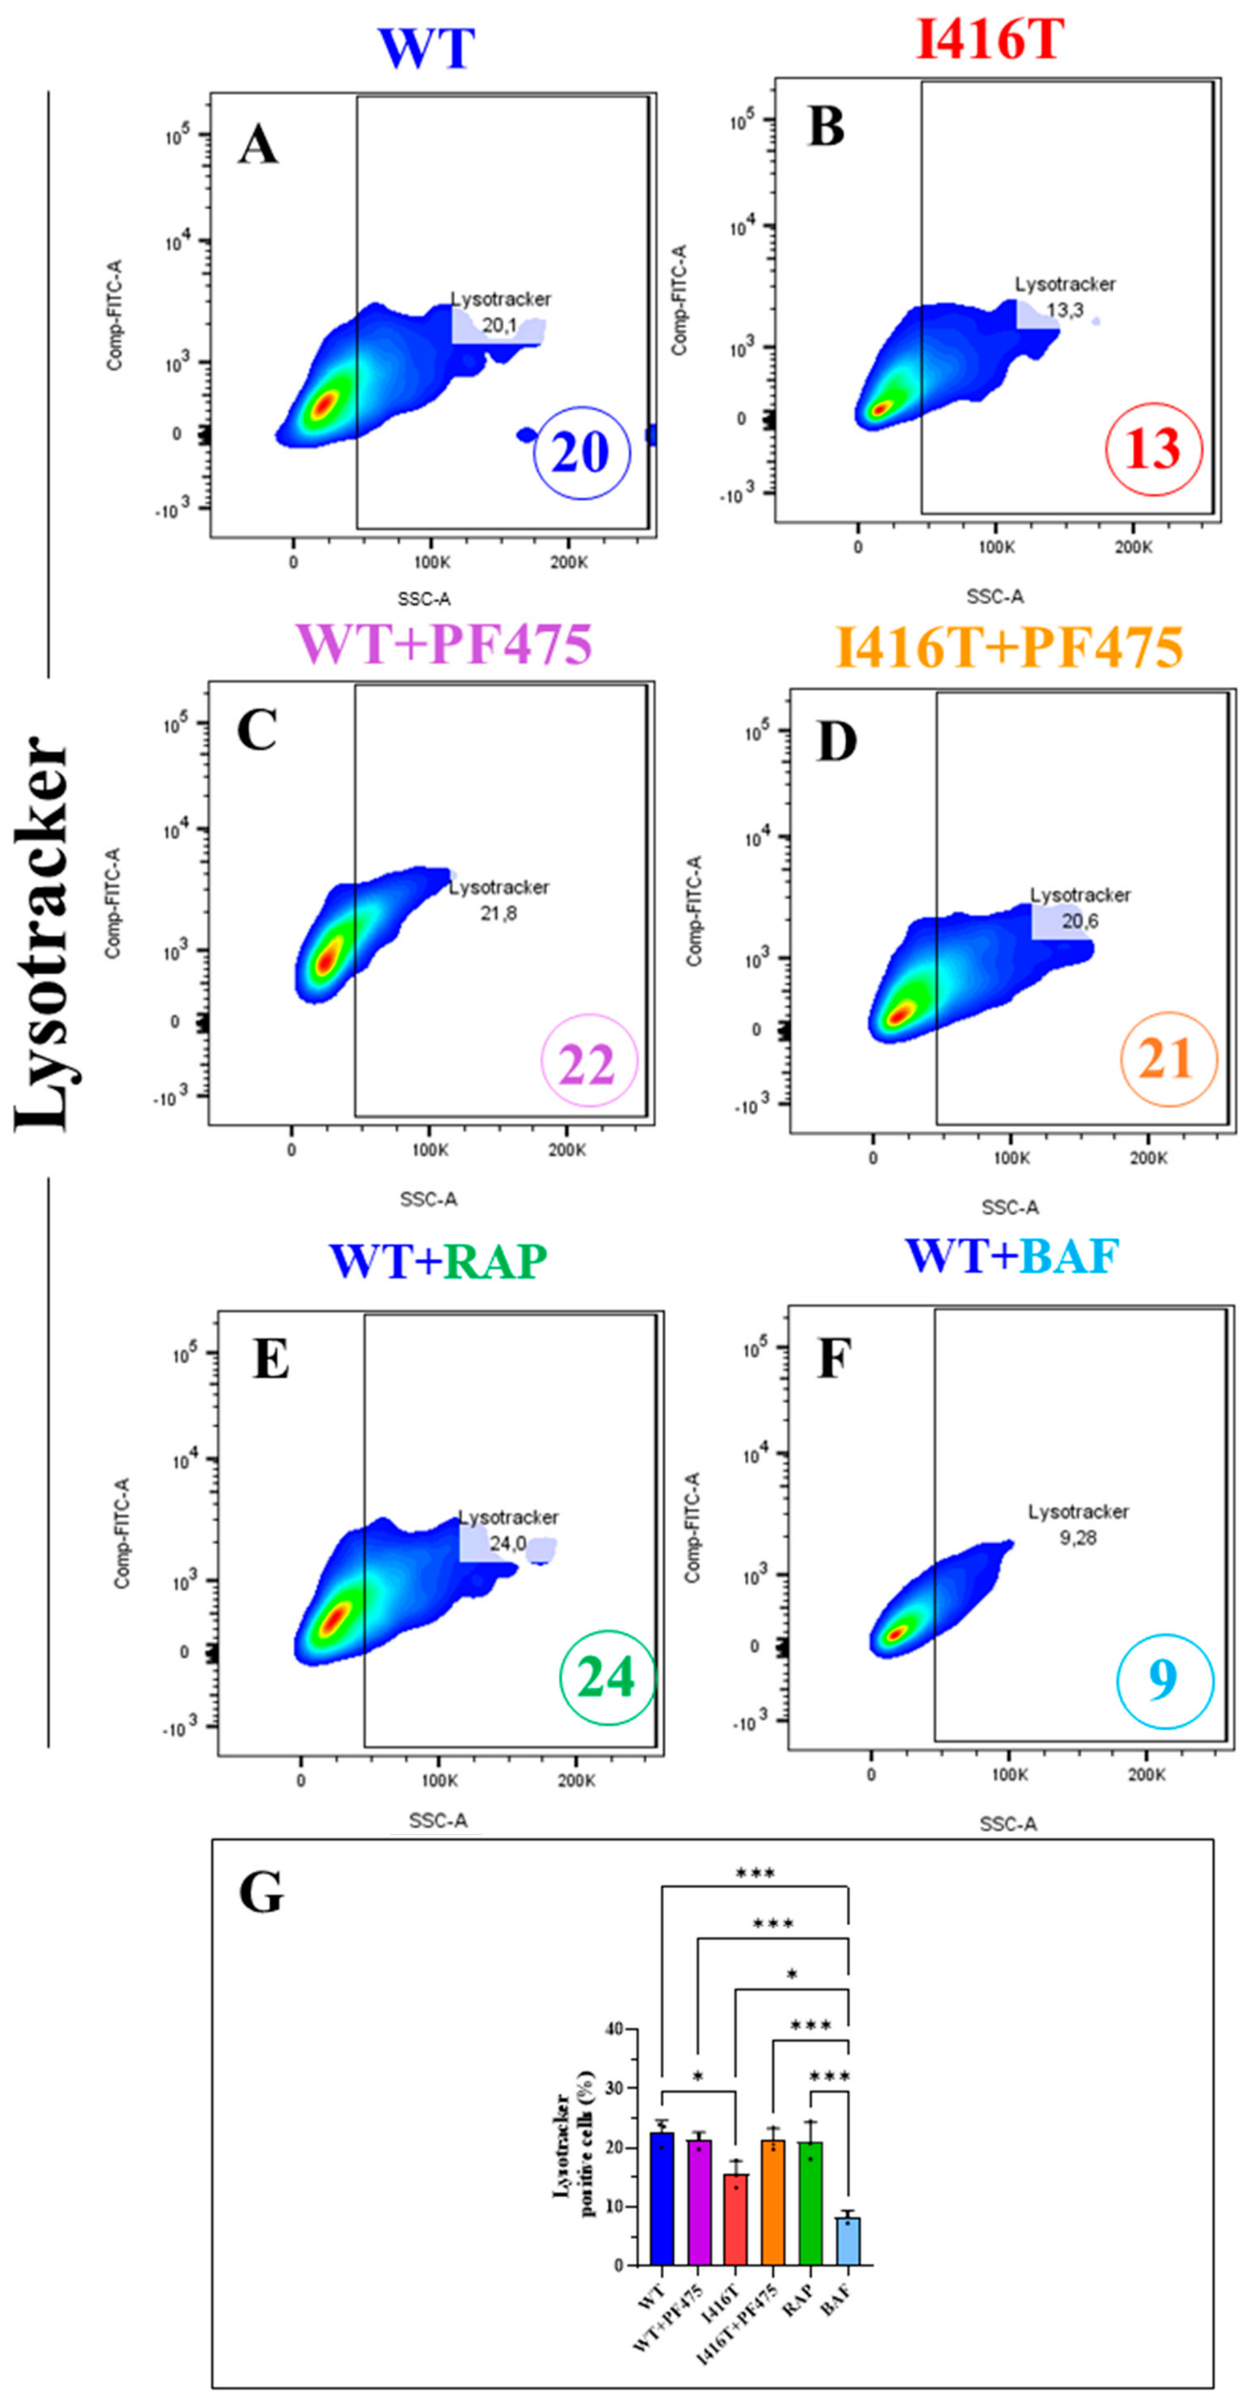
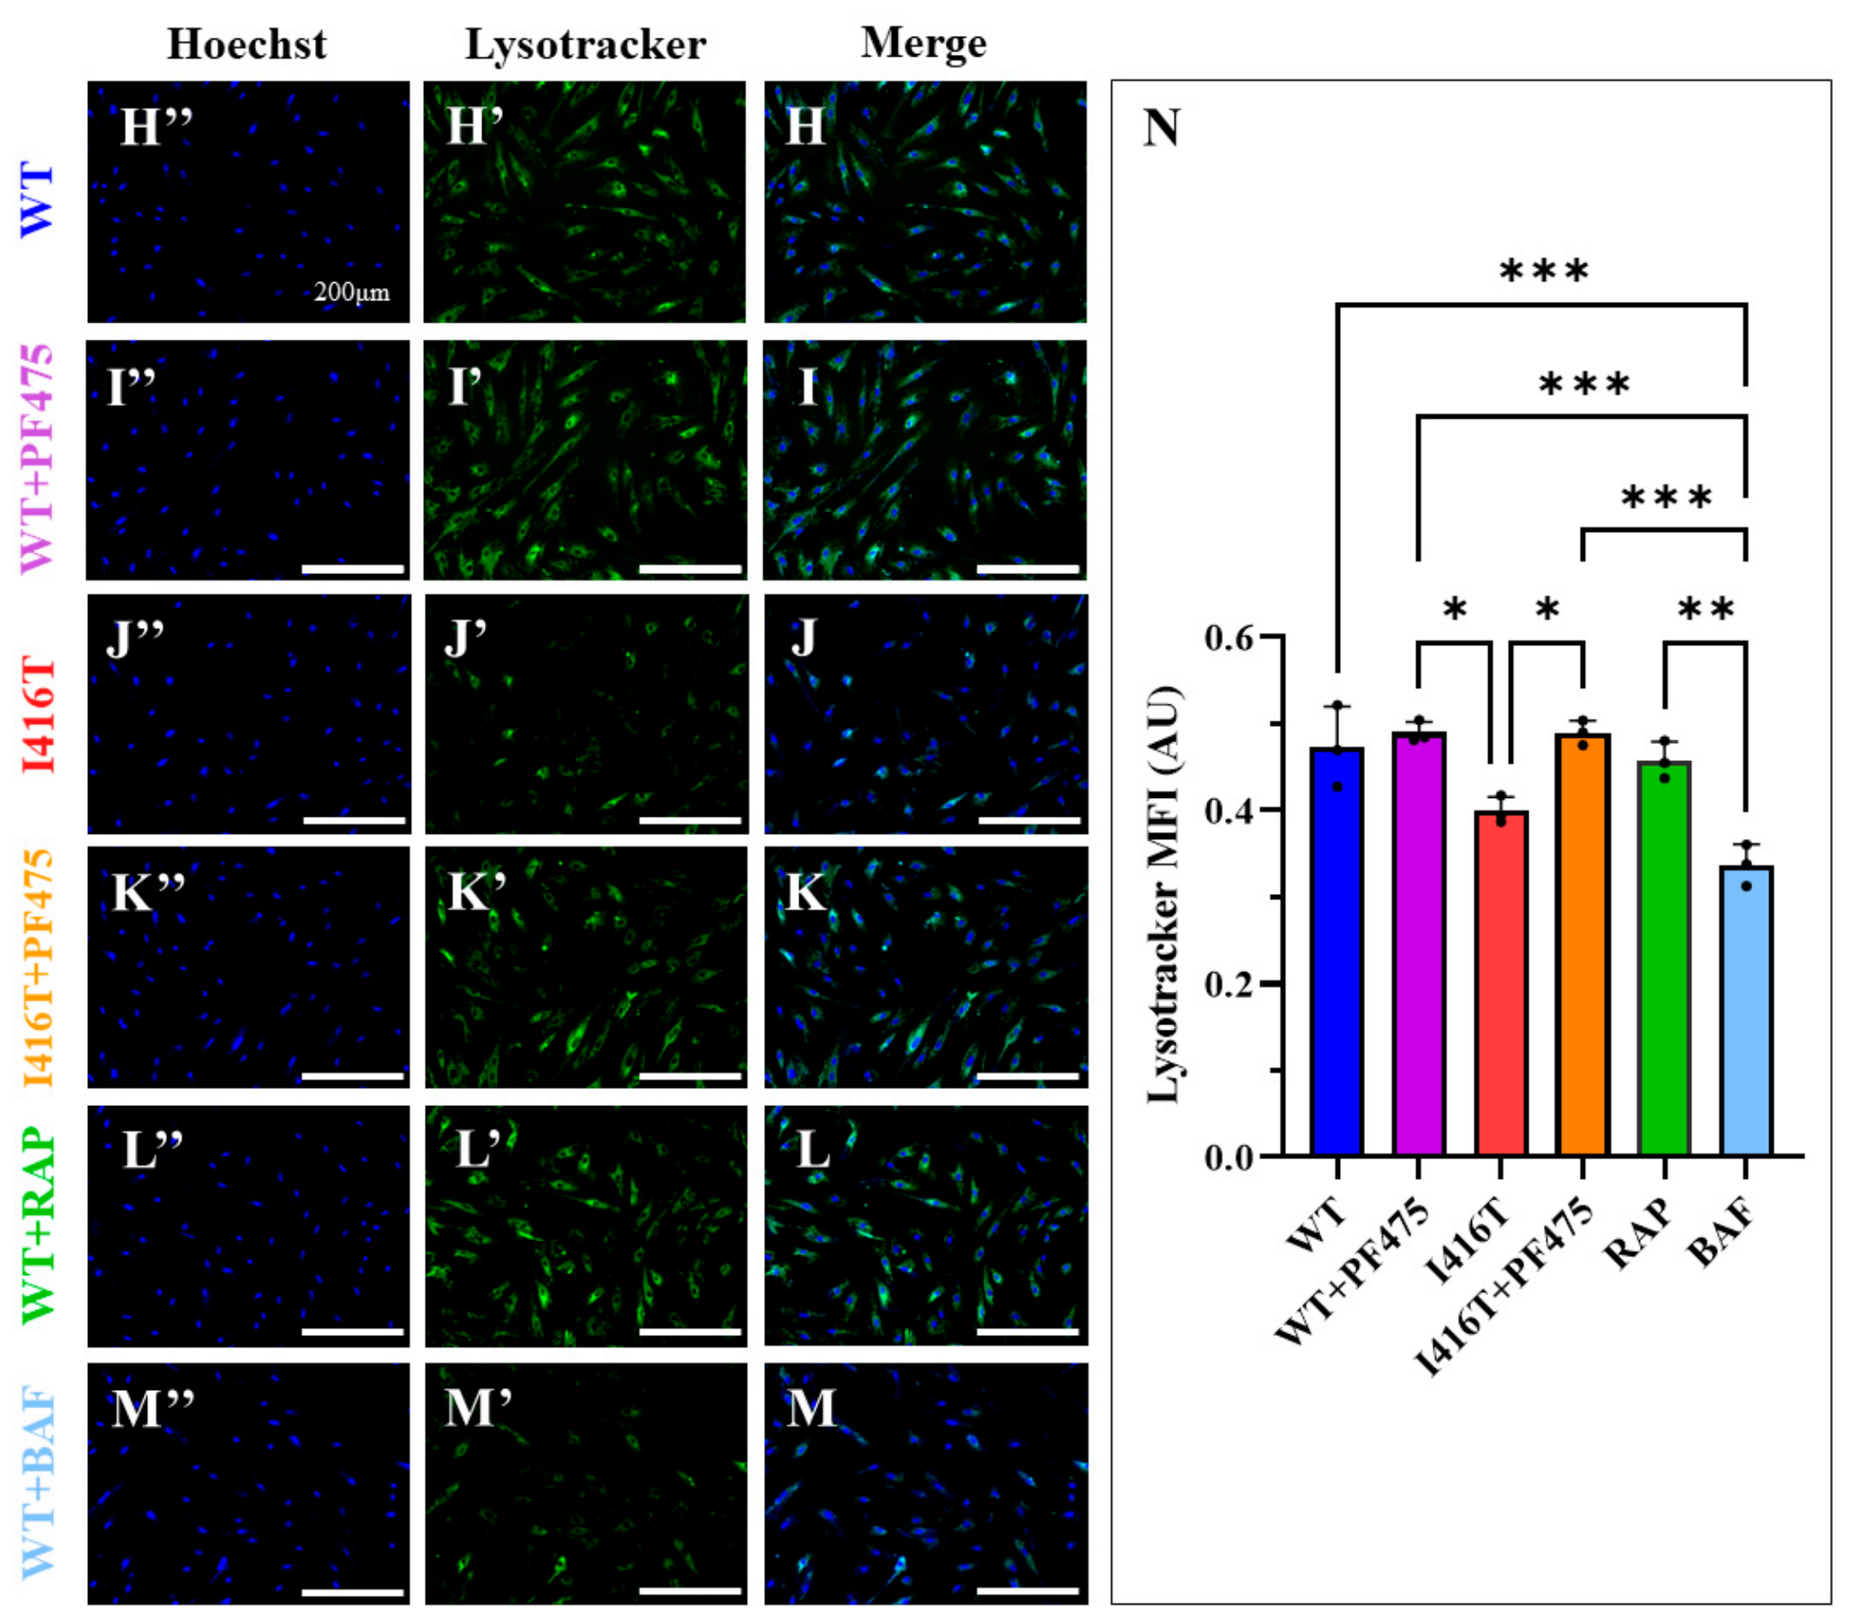

Disclaimer/Publisher’s Note: The statements, opinions and data contained in all publications are solely those of the individual author(s) and contributor(s) and not of MDPI and/or the editor(s). MDPI and/or the editor(s) disclaim responsibility for any injury to people or property resulting from any ideas, methods, instructions or products referred to in the content. |
© 2026 by the authors. Licensee MDPI, Basel, Switzerland. This article is an open access article distributed under the terms and conditions of the Creative Commons Attribution (CC BY) license.