


Highlights
What are the main findings?
- In the pooled analysis, both between-animal and within-animal live weight dynamics were positively associated with equation-derived herbage dry matter intake, but these associations were not consistent across pasture access-time groups.
- The pooled within-animal association and its interaction with lactation stage were attenuated and no longer statistically significant after adjustment for milk yield.
- WoW-derived live weight dynamics provided information associated with intake-related processes under part-time grazing conditions.
What are the implications of the main findings?
- Repeated live weight monitoring may provide complementary information for monitoring intake-related processes in grazing dairy sheep.
- Independent validation against directly measured individual herbage intake is required before WoW-derived indicators can be used to estimate individual intake.
Abstract
Accurate estimation of individual herbage intake in grazing ruminants is essential for improving feeding efficiency and animal performance, yet it remains challenging under field conditions. This study evaluated the association between live weight dynamics recorded by an automated walk-over-weighing (WoW) system and equation-derived herbage dry matter intake (HDMI) in dairy ewes and whether this association changed throughout lactation. The study was conducted over two years (2023–2024) using 92 Sarda dairy ewes managed under part-time grazing with two daily pasture access times (2 or 6 h day−1). Live weight was recorded daily before and after pasture access, and daily live weight change was averaged weekly. HDMI was estimated using a published prediction equation based on milk yield, herbage neutral detergent fibre concentration, and pasture access time. Live weight change was partitioned into between-animal (DW_mean) and within-animal (DW_dev) components, allowing persistent differences among animals to be distinguished from short-term within-animal fluctuations, and analysed using linear mixed-effects models. In the pooled model, both components were positively associated with equation-derived HDMI (p < 0.001), while the significant DW_dev × days-in-milk interaction (p = 0.004) indicated that the association between within-animal live weight change and equation-derived HDMI decreased as lactation advanced. However, pasture access-time-specific sensitivity analyses showed that the associations with DW_mean and DW_dev persisted within AT-6h but were not detected within AT-2h, while adjustment for milk yield attenuated the within-animal association, which was no longer statistically significant, and also removed statistical support for the DW_dev × days-in-milk interaction. The mixed-effects model explained a substantial proportion of the variability in equation-derived HDMI (marginal R2 = 0.64; conditional R2 = 0.94), and equation-derived and model-fitted HDMI were positively correlated (r = 0.77). These findings indicate that WoW-derived live weight dynamics provide non-invasive information associated with equation-derived HDMI under the conditions of this study, but independent validation against directly measured individual herbage intake is required before their use for individual intake estimation.
1. Introduction
Estimating individual herbage intake in grazing ruminants remains a major challenge for improving pasture management, feeding strategies, animal performance, and the sustainability of grass-based dairy production systems [1]. In dairy sheep, herbage intake varies with pasture availability and quality, sward structure, supplementation, pasture access time, and stage of lactation [2]. However, direct measurement of individual intake under grazing conditions is technically difficult because animals freely select their diet within a heterogeneous pasture environment. Prediction equations based on animal performance and pasture characteristics therefore represent a practical approach for estimating herbage intake and may provide a useful reference for evaluating alternative proxy indicators.
Herbage intake is commonly described as the product of grazing time, bite rate, and bite mass [3], with bite mass being particularly difficult to quantify because of its dependence on sward characteristics and animal selectivity. Traditional methods, including internal and external markers, controlled grazing trials, and double-weighing techniques, have provided valuable information but are generally labour-intensive, invasive, expensive, or difficult to implement routinely under grazing conditions [4,5].
For this reason, increasing attention has been devoted to alternative approaches based on animal behaviour, sensor technologies, and predictive models [6]. In recent years, precision livestock farming (PLF) technologies have substantially expanded opportunities for monitoring grazing animals [7,8,9,10]. Accelerometers, acoustic sensors, electromyography, and other sensor-based systems have been used to characterise grazing activity, jaw movements, and feeding behaviour and to estimate herbage intake under grazing conditions [11,12,13,14,15,16].
Although these technologies are promising, their practical application may be constrained by environmental noise, signal interpretation, equipment cost, and the difficulty of translating behavioural measurements into quantitative estimates of herbage intake [17]. Our previous work showed that live weight dynamics recorded by WoW can provide information on animal responses to nutritional conditions [18]. Short-term changes in live weight during grazing are influenced by gastrointestinal fill, water intake, excretion, and, over longer periods, tissue mobilisation or deposition [19]. Because gastrointestinal fill is partly determined by recent herbage consumption, changes in live weight recorded before and after pasture access may contain biologically meaningful information on intake-related processes during grazing. Automated walk-over-weighing (WoW) systems offer the possibility of recording such changes repeatedly with limited animal handling. WoW systems have been used to monitor live weight dynamics in dairy cows, adult sheep, and growing ewe lambs [20,21,22]. After appropriate animal adaptation and data-cleaning procedures, they can provide reliable information on individual live weight trajectories, although incomplete or irregular crossings, behavioural disturbances, multiple animals entering the platform, and anomalous weight records remain practical challenges requiring appropriate data filtering [23]. González-García et al. [24] further showed that short-term WoW-derived live weight changes could be used to estimate individual forage intake in sheep under confined and controlled conditions. Under grazing conditions, however, the relationship is more complex because short-term live weight change reflects not only herbage consumption but also water intake, excretion, digesta dynamics, supplementation, and animal physiological status. WoW-derived live weight change should therefore be regarded as an indicator of intake-related processes rather than a direct measure of herbage intake.
Stage of lactation may modify this association because nutrient requirements, milk production, voluntary feed intake, and gastrointestinal fill change throughout lactation [25]. In addition, repeated live weight measurements contain two distinct sources of variation: persistent differences among animals and short-term deviations within the same animal. These components may reflect different biological processes related to intake capacity, grazing behaviour, and digestive fill. Separating live weight change into between-animal and within-animal components therefore provides a useful framework for interpreting longitudinal live weight data [26].
Previous studies have primarily evaluated WoW systems for monitoring live weight or investigated their relationship with forage intake under controlled conditions. Whether between- and within-animal components of WoW-derived live weight change are associated with variation in equation-derived HDMI in lactating dairy ewes under part-time grazing and whether these associations change across lactation remain unclear. Because direct measurements of individual herbage intake were not available in the present study, equation-derived herbage dry matter intake (HDMI), calculated from animal performance and pasture characteristics, was used as the reference intake estimate.
Therefore, the objective of this study was to evaluate the association between WoW-derived live weight dynamics and equation-derived HDMI in part-time grazing dairy ewes. Specifically, we examined the between-animal and within-animal components of live weight change and whether their associations with equation-derived HDMI varied throughout lactation. We hypothesised that both between-animal and within-animal components of WoW-derived live weight change would be positively associated with equation-derived HDMI and that the strength of these associations would vary with the stage of lactation.
2. Materials and Methods
2.1. Experimental Conditions, Animals and Feeding Management
The study was conducted over two consecutive spring grazing seasons (2023 and 2024) at the Bonassai experimental farm of AGRIS Sardegna (Agricultural Research Agency of Sardinia), located in north-western Sardinia, Italy (40°40′16.2″ N, 8°22′0.4″ E; 32 m a.s.l.). All experimental procedures were conducted in accordance with European Union Directive 2010/63/EU [27] on the protection of animals used for scientific purposes and were approved by the Ethical Committee for Animal Experimentation (O.P.B.S.A.) of the University of Sassari and AGRIS Sardegna (approval no. 52682, 6 May 2021).
The experiments were conducted from mid-April to mid-June in 2023 and from late March to late May in 2024.
In each year, a different cohort of 48 adult lactating Sarda ewes was selected and allocated to two experimental groups (n = 24 each), balanced according to age, days in milk (DIM), milk yield, live weight (LW), and body condition score (BCS). At the beginning of the 2023 experiment, ewes had a mean (± SE) age of 3.5 ± 0.8 years, were 51 ± 7 days in milk (DIM), produced 2308 ± 70 g ewe−1 day−1 of milk, and had a live weight of 49.9 ± 0.9 kg and a body condition score of 2.7 ± 0.03. At the beginning of the 2024 experiment, ewes had a mean (± SE) age of 3.0 ± 0.7 years and were at a more advanced stage of lactation (111 ± 3 DIM), producing 1847 ± 39 g ewe−1 day−1 of milk, with a live weight of 49.6 ± 0.7 kg and a body condition score of 2.6 ± 0.04. The experimental groups consisted exclusively of the lactating ewes included in the study; no lambs, rams, or other animals were present during grazing or housing.
The experimental factor was daily pasture access time (AT): 6 h day−1 (AT-6h) or 2 h day−1 (AT-2h). Within each year, each pasture access-time level was applied to a single grazing group; therefore, individual ewes represented observational units but not independent experimental replicates of pasture-access time. Supplementation strategies differed between experimental years, as detailed below.
Following a two-week adaptation period, during which all animals had access to ryegrass pasture for 4 h day−1 and received hay and concentrate supplements, the experimental groups were managed on annual pastures. In 2023, the pasture consisted predominantly of Italian ryegrass (Lolium multiflorum Lam.) and berseem clover (Trifolium alexandrinum L.), whereas in 2024, it was composed of Italian ryegrass and burr medic (Medicago polymorpha L.). These differences in botanical composition reflected the pasture conditions available in each experimental year and did not constitute experimental treatments. Pasture access was allowed between approximately 08:30 and 14:30 for the AT-6h group and between 08:30 and 10:30 for the AT-2h group. Pasture access time was defined as the period during which the ewes had access to pasture and did not represent the actual time spent grazing. Grazing, resting, ruminating, and other behavioural activities were not recorded during the pasture-access period. In 2023, all ewes received 0.400 kg head−1 day−1 of commercial concentrate offered during the two daily milkings and 0.720 kg head−1 day−1 of ryegrass hay offered indoors during the evening. In 2024, supplementation consisted of 0.250 kg head−1 day−1 of maize grain offered at morning milking and 0.250 kg head−1 day−1 of commercial concentrate offered at evening milking. Foxtail millet (Setaria italica (L.) P. Beauv.) hay was offered indoors at 1.3 and 1.1 kg head−1 day−1 for the AT-6h and AT-2h groups, respectively.
The two experimental years shared the same general comparison between 2 and 6 h day−1 of pasture access but differed in lactation stage, pasture composition, and supplementation. Accordingly, the 2023 and 2024 studies were considered as two experiments conducted under different biological and management conditions rather than as strict temporal replications of an identical experiment.
Grazing management was similar in both years. The grazing area (approximately 1.8 ha) was divided into 12 paddocks using temporary electric fencing and managed under a rotational grazing system, with animals remaining in each paddock for seven days before rotation. Water was freely available in both the pasture and housing facilities.
The daily management routine included morning milking (07:00–07:30), concentrate distribution, and live weight recording through an automated walk-over-weighing (WoW) system. Ewes were then moved to the pasture between 08:30 and 09:00. Animals in the AT-2h group returned to the housing area between 10:30 and 11:00, were weighed again while passing through the WoW system, and received hay indoors. Animals in the AT-6h group returned between 14:30 and 15:00 and were weighed immediately after returning from pasture, before afternoon milking. Following the second milking (15:30–16:00) and concentrate distribution, animals were housed and offered their allocated hay allowance.
Pre-pasture WoW measurements from the 2023 experiment were also included in a previous study evaluating longitudinal live-weight responses to nutritional conditions [18], in which only pre-pasture measurements were used to examine live-weight trajectories over time. In contrast, the present study analyses paired pre- and post-pasture WoW measurements from both 2023 and 2024 to derive live weight change (DW), decompose it into between-animal (DW_mean) and within-animal (DW_dev) components, and evaluate their associations with equation-derived HDMI across lactation. Thus, although part of the underlying 2023 live-weight data overlaps with the previous study, the derived variables, analytical approach, and research question are distinct.
2.2. Walk-over-Weighing (WoW) System and Data Acquisition
Live weight (LW) was recorded using an automated walk-over-weighing (WoW) system consisting of an aluminium weighing platform (Maréchalle Pesage, Chauny, France) equipped with MP600 load bars, a WOW2 electronic weighing indicator, and an XRP2 electronic identification (EID) reader (Tru-Test Ltd., Auckland, New Zealand), following the methodology described by González-García et al. [21]. Each ewe was equipped with a ruminal EID bolus (Datamars HDX, Datamars SA, Bedano, Switzerland), which was detected by an antenna connected to the XRP2 reader. The weighing system incorporated automatic taring, and its performance was checked weekly using known 20-kg weights. In a previous validation conducted in Sarda dairy ewes, WoW measurements showed high concordance with static live-weight measurements (CCC = 0.98; r = 0.98; Cb = 0.99) [28].
To ensure reliable data acquisition, animals were habituated during the adaptation period to a predefined passage route incorporating the weighing platform. This habituation procedure was designed to minimise stress, hesitation, and behavioural disturbances that could affect weighing accuracy.
Throughout the experimental period, each ewe crossed the WoW platform four times per day as part of the normal management routine: two consecutive passages before turnout to pasture and two consecutive passages immediately after returning from pasture. At each pre- and post-pasture weighing session, ewes were guided through a short circuit that required them to pass over the WoW platform twice consecutively. The interval between the end of the first passage and the beginning of the second was less than 1 min. Thus, the four daily passages represented two replicate measurements at each of two time points (pre- and post-pasture access), rather than four separate measurement periods. The interval between the pre- and post-pasture weighing sessions differed between the two pasture access-time groups, reflecting their different pasture access schedules, although it did not correspond exactly to the nominal 2- or 6-h pasture-access periods because of the timing of routine management procedures.
The controlled passage through the weighing platform was adopted to improve the repeatability and comparability of live weight measurements among animals and across days, while reducing the occurrence of missing, duplicated, or biologically implausible records. The weighing procedure was fully integrated into routine animal handling and did not require additional restraint or manipulation.
Although animals were guided through the system rather than crossing it voluntarily, the system preserved the main functional characteristics of a WoW system, including automatic animal identification, automated digital recording, reduced labour requirements, and minimal operator intervention.
2.3. Additional Measurements
Pasture availability was monitored weekly throughout the experimental period using quadrat sampling. Herbage mass was estimated by harvesting representative quadrats (0.5 m2 each) at ground level, while botanical composition was determined by manually separating the main botanical species.
Individual concentrate supplementation was recorded during milking, whereas hay intake was measured at group level by weighing feed offered and refusals. Direct measurement of individual herbage intake was not feasible under the experimental grazing conditions. Therefore, herbage dry matter intake (HDMI) was estimated using the prediction equation proposed by Molle et al. [2], which was developed for Mediterranean dairy sheep under grazing conditions:
where HDMI is herbage dry matter intake (g DM day−1), MY is milk yield (g ewe−1 day−1), NDFh is the neutral detergent fibre concentration of grazed herbage (% DM), and AT is daily pasture access time (h), corresponding to 2 or 6 h day−1 in the present study and defined as the period during which animals had access to pasture rather than the actual time spent grazing.
HDMI = 802 + 0.32·MY − 28.98·NDFh + 545.53·AT − 51.74·AT2
Herbage samples were collected on three occasions during each experimental year (beginning, middle, and end of the grazing season) using the hand-plucking technique to simulate the diet selected by grazing ewes. Samples were oven-dried at 65 °C to a constant weight, ground through a 1-mm screen, and analysed using near-infrared reflectance spectroscopy (NIRS; NIRS 5000, FOSS NIRSystems, Silver Spring, MD, USA), calibrated against reference laboratory methods, to determine chemical composition and in vitro dry matter digestibility (IVDMD). For the calculation of weekly equation-derived HDMI, each measured NDFh value was assigned to the adjacent experimental weeks corresponding to the respective sampling period. Thus, NDFh values used in the weekly HDMI calculations represented the corresponding broader pasture sampling period rather than independently measured weekly values.
Individual milk yield was recorded every two weeks in 2023 and weekly in 2024. In 2023, milk yield values for weeks without a direct measurement were obtained by temporal interpolation between consecutive milk recordings and were then used in the calculation of weekly equation-derived HDMI. In 2024, weekly measured milk yield values were used directly. Milk samples were analysed for fat, true protein (N × 6.38), and urea using an infrared analyser (Milkoscan, FOSS, Hillerød, Denmark). Fat- and protein-corrected milk yield (FPCM) was calculated according to Pulina and Nudda [29]. Live weight was recorded fortnightly using a static electronic scale (Gallagher TWR-5 Weigh Scale, Hamilton, New Zealand). Static live weight measurements were used as a reference to assess long-term changes in live weight independently of the short-term live weight dynamics recorded by the WoW system. At each static weighing, body condition score (BCS) was assessed using a 1-to-5 scoring scale according to Russel et al. [30].
2.4. Data Processing and Statistical Analysis
Raw live weight records obtained from the walk-over-weighing (WoW) system were first screened to remove observations lacking valid electronic identification (EID). Raw records were stored and processed separately for each ewe and for the pre- and post-pasture weighing periods. The remaining individual live weight time series were subsequently filtered using the ORIOLE web application [31], which implements the KFINO (Kalman Filter with Impulse Noised Outliers) algorithm [32] for the automatic detection of anomalous WoW records. KFINO is a robust sequential algorithm based on a modified Kalman filter that accounts for impulse-noise outliers in longitudinal data. ORIOLE was applied before daily averaging, and only records retained after filtering were used to calculate daily mean live weight separately for the pre- and post-pasture periods. Four ewes were excluded from the WoW analysis because repeated EID reading failures resulted in an insufficient number of valid records after ORIOLE filtering. All four exclusions occurred in 2023, with two ewes excluded from each pasture access-time group. Consequently, the final dataset comprised 92 animals. Thus, the exclusions did not alter the numerical balance between pasture access-time groups, with 46 ewes per group in the final dataset, although the number of animals differed slightly between experimental years (44 in 2023 and 48 in 2024).
For each ewe and day, the valid WoW records remaining after ORIOLE filtering were averaged separately for the pre- and post-pasture weighing periods to obtain daily pre-pasture (LWpre) and post-pasture (LWpost) live weight values. Daily live weight change (DW) was then calculated as:
where LWpost and LWpre represent the corresponding post- and pre-pasture mean live weight values, respectively. To reduce random day-to-day variability and align live weight records with the temporal resolution of milk recording and feed quality assessments, weekly mean DW values were calculated for each animal and used in subsequent analyses. This aggregation also ensured consistency between the temporal resolution of the explanatory live weight measurements and that of the equation-derived herbage dry matter intake (HDMI) values.
DW = LWpost − LWpre
Pasture biomass, botanical composition, and herbage chemical composition were analysed using linear mixed-effects models (PROC MIXED), including year (2023 or 2024), pasture access time (AT; AT-2h or AT-6h), and their interaction as fixed effects. For these variables, pasture sampling date nested within year was included as a random blocking factor to account for temporal variation in herbage availability and quality across successive grazing cycles.
Milk yield and composition, live weight, and body condition score were analysed using separate linear mixed-effects models including year, pasture access time (AT), and their interaction as fixed effects. Animal identity (EID) was included as a random intercept to account for the correlation among repeated observations obtained from the same ewe throughout the experimental period. For each response variable, the corresponding baseline measurement was included as a covariate to account for initial differences among animals before the experimental period.
Data from the two experimental years were analysed jointly to evaluate the relationship between WoW-derived live weight dynamics and equation-derived HDMI across the range of biological and management conditions represented in the dataset. Year was included as a fixed effect to account for systematic differences between the two experiments; however, because year was confounded with differences in lactation stage, pasture composition, supplementation, and other year-specific conditions, its coefficient was not interpreted as an independent biological effect of year.
The primary response variable for the analysis of live weight dynamics was equation-derived herbage dry matter intake (HDMI). The main explanatory variables were the between-animal (DW_mean) and within-animal (DW_dev) components of WoW-derived live weight change. Days in milk (DIM), included as both linear and quadratic terms, experimental year, and the DW_dev × DIM interaction were included as additional explanatory terms in the final mixed-effects model. Differences between pasture access-time groups (AT-2h vs. AT-6h) were additionally examined through group-specific sensitivity analyses.
To separate these two sources of variation, DW was decomposed following the approach proposed by van de Pol and Wright (2009) [26]. For each ewe, two variables were derived:
- DW_mean, representing the individual’s mean DW across the experimental period and describing persistent between-animal differences;
- DW_dev, representing the deviation of each weekly observation from the individual mean and describing short-term within-animal variation.
Days in milk (DIM) was included as both a linear and a quadratic term to account for non-linear changes associated with lactation stage. The interaction between DW_dev and DIM was included to evaluate whether the association between short-term live weight fluctuations and equation-derived herbage dry matter intake changed throughout lactation.
The final pooled mixed-effects model was:
where uEID represents the random intercept associated with animal identity, and ε is the residual error term.
HDMI = β0 + β1DW_mean + β2DW_dev + β3DIM + β4DIM2 + β5(DW_dev × DIM) + β6Year + uEID + ε
Random effects and residuals were assumed to be normally distributed with mean zero and variances σ2u and σ2e, respectively. Model parameters were estimated using restricted maximum likelihood (REML), degrees of freedom were approximated using the Kenward–Roger method, and statistical significance was declared at p < 0.05.
Model adequacy and in-sample fit were evaluated through residual diagnostics, Pearson correlation between equation-derived HDMI and corresponding model-fitted values, root mean squared error (RMSE), mean bias, and the marginal and conditional coefficients of determination (R2m and R2c), representing the proportion of variance explained by the fixed effects alone (R2m) and by the full mixed-effects model (R2c), respectively.
To assess whether the association between live weight dynamics and equation-derived HDMI was driven by the common influence of pasture access time on both variables, a sensitivity analysis was performed by fitting the final mixed-effects model separately within the AT-2h and AT-6h pasture access-time groups (46 ewes per group in the final dataset). The same fixed- and random-effect structure was retained, including DW_mean, DW_dev, DIM, DIM2, the DW_dev × DIM interaction, Year, and a random intercept for ewe identity. By fitting the models separately within each group, pasture access time was held constant at either 2 or 6 h day−1.
Because milk yield (MY) is explicitly included in the equation used to derive HDMI and may also be biologically related to live weight dynamics, an additional sensitivity analysis was performed by refitting the pooled mixed-effects model with MY included as an additional covariate. This analysis was used to assess whether the associations of DW_mean and DW_dev with equation-derived HDMI were attenuated after accounting for variation associated with milk production.
All statistical analyses were performed using SAS version 9.4 (SAS Institute Inc., Cary, NC, USA) [33]. The minimal dataset used for the final mixed-effects analysis is provided as Supplementary File S1.
3. Results
3.1. Pasture Characteristics
Pasture biomass and botanical composition according to year and pasture access time (AT) are presented in Table 1. Mean available biomass (t DM ha−1) did not differ significantly between years or pasture access-time groups (p > 0.05). In contrast, estimated hourly herbage allowance (kg DM head−1 h−1) differed between years (p = 0.048) and pasture access-time groups (p = 0.003), with a significant Year × AT interaction (p = 0.013).
Table 1.
Pasture availability and botanical composition by year and pasture access time (AT).
The botanical composition of the pasture also differed between years. Italian ryegrass remained the dominant species in both years, whereas the associated legume changed from berseem clover in 2023 to burr medic in 2024. The proportion of the legume component was significantly greater in 2024 than in 2023 (p < 0.001), while ryegrass proportion differed between pasture access-time groups (p = 0.023).
Overall, available pasture biomass remained relatively high throughout the study. Differences in hourly herbage allowance were observed between pasture access-time groups and varied between years, as indicated by the significant Year × AT interaction.
3.2. Chemical Composition of Grazed Herbage
The chemical composition of hand-plucked herbage samples collected to simulate the diet selected by grazing ewes is presented in Table 2. Crude protein concentration ranged from 13.2 to 15.9% DM and did not differ significantly between years or pasture access-time groups, with no significant Year × AT interaction (p > 0.05). In contrast, significant differences between years were detected for DM, NDF, ADF, ADL, and IVDMD (p < 0.05). Compared with 2023, herbage collected in 2024 had lower NDF, ADF, and ADL concentrations and greater IVDMD.
Table 2.
Chemical composition of hand-plucked herbage samples by year and pasture access time (AT).
No significant overall differences between pasture access-time groups were detected for any of the measured variables (p > 0.05). The Year × AT interaction was significant only for ADL (p = 0.038), whereas no significant interactions were detected for the remaining variables.
3.3. Milk Yield and Composition
As shown in Table 3, after adjustment for the corresponding baseline values, significant differences between pasture access-time groups were detected for milk yield, fat- and protein-corrected milk (FPCM), milk fat concentration, and milk urea concentration (p < 0.05), whereas the milk protein concentration did not differ between groups. Ewes in the AT-6h group produced more milk and FPCM than those in the AT-2h group. The milk fat concentration was higher in the AT-2h group, whereas the milk urea concentration was higher in the AT-6h group; the milk protein concentration did not differ between pasture access-time groups.
Table 3.
Milk yield and composition by year and pasture access time (AT).
Significant year effects were detected for FPCM, milk fat, protein, and urea concentrations (p < 0.05), whereas milk yield did not differ between years after adjustment for baseline production (p = 0.381). Compared with 2023, ewes in 2024 had higher milk fat and protein concentrations, a lower milk urea concentration, and greater FPCM, despite the similar milk yield. No significant Year × AT interactions were detected for any of the measured variables (p > 0.05).
3.4. Live Weight and Body Condition
The average live weight and body condition score are presented in Table 4. After adjustment for the corresponding baseline values, significant differences between years were detected for both live weight and BCS (p < 0.001). Compared with 2023, ewes in 2024 were heavier and had a higher BCS. The live weight differed significantly between pasture access-time groups (p < 0.001), with ewes in the AT-6h group being heavier than those in the AT-2h group. BCS did not differ between pasture access-time groups (p = 0.871). No significant Year × AT interactions were detected for either variable (p > 0.05).
Table 4.
Live weight and body condition score by year and pasture access time (AT).
3.5. Mixed-Model Analysis of Live Weight Dynamics and Equation-Derived Herbage Intake
Descriptive statistics of the variables included in the mixed-model analysis are presented in Table 5. Following data filtering, the final dataset comprised 92 ewes. Across the experimental period, equation-derived herbage dry matter intake (HDMI) averaged 1126 g DM day−1 (range: 403–1996 g DM day−1), whereas the live weight change across the pasture-access period (DW) averaged 2.45 kg (SD = 1.18 kg), with considerable variation among observations.
Table 5.
Descriptive statistics of the main variables used in the analysis.
Parameter estimates of the final mixed-effects model are reported in Table 6, whereas goodness-of-fit statistics are summarised in Table 7. The model explained a substantial proportion of the variability in equation-derived HDMI, with marginal and conditional coefficients of determination (R2m and R2c) of 0.64 and 0.94, respectively. The higher conditional than marginal R2 indicates that the ewe-level random effect contributed substantially to the variance explained by the full model. The mixed-effects model identified significant associations of live weight dynamics and lactation stage with equation-derived HDMI (Table 6).
Table 6.
Fixed-effect estimates of the mixed-effects model relating equation-derived herbage dry matter intake (HDMI) to live weight dynamics and lactation stage.
Table 7.
Goodness-of-fit and in-sample model-fit statistics of the final mixed-effects model.
Both the between-animal (DW_mean) and within-animal (DW_dev) components of live weight change were positively associated with equation-derived HDMI (p < 0.001). Animals with greater average live weight gain across the pasture-access period also had greater equation-derived HDMI (β = 275.91 ± 29.09 g DM day−1 per kg DW), while positive short-term deviations in live weight were also associated with greater equation-derived HDMI (β = 85.98 ± 18.91 g DM day−1 per kg DW).
Days in milk was significantly associated with equation-derived HDMI, with both linear (β = −18.91 ± 0.91; p < 0.001) and quadratic (β = 0.052 ± 0.004; p < 0.001) terms indicating a non-linear relationship between lactation stage and equation-derived HDMI. In addition, a significant interaction between DW_dev and DIM was detected (β = −0.49 ± 0.17; p = 0.004), indicating that the association between short-term live weight fluctuations and equation-derived HDMI varied across lactation.
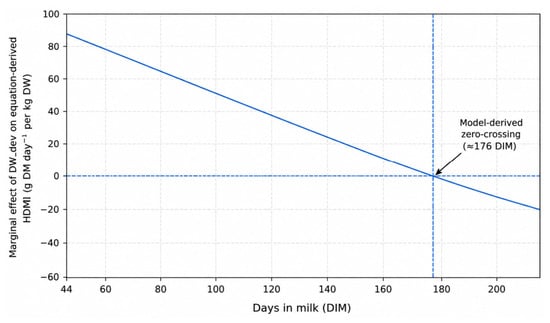
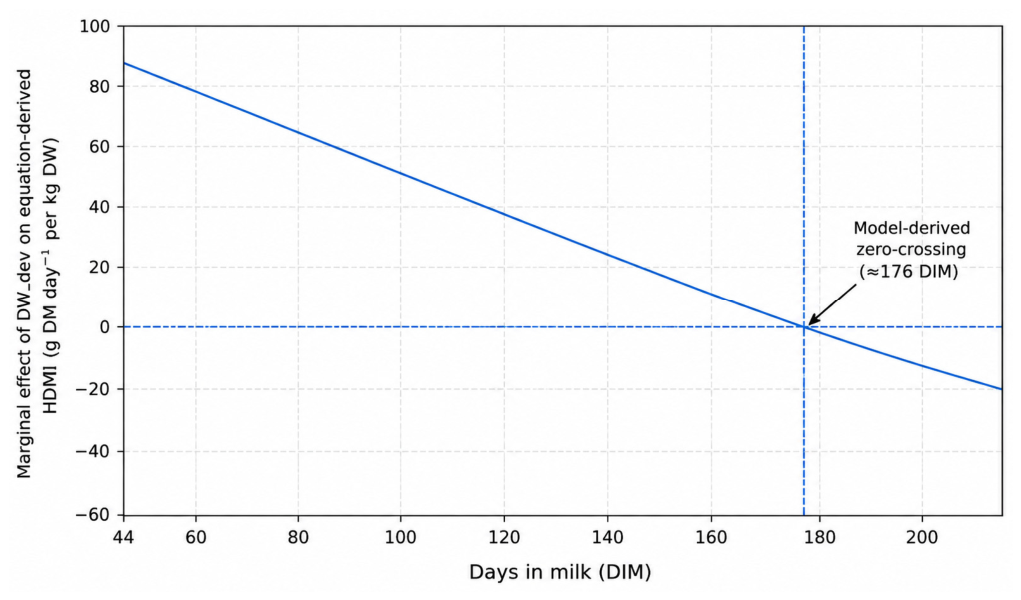
A significant difference between experimental years was also detected (p < 0.001), with a lower model estimate for 2023 than for 2024 (β = −589.88 ± 46.30 g DM day−1). The estimated zero-crossing occurred at approximately 176 DIM, representing the estimated stage of lactation at which the predicted marginal effect of within-animal live weight change (DW_dev) on equation-derived HDMI became zero. Because this crossing point occurred toward the upper end of the observed DIM range (44–201 days), it should be interpreted as a model-derived feature of the fitted relationship rather than as a physiological threshold. As illustrated in Figure 1, the estimated marginal association between DW_dev and equation-derived HDMI progressively declined as lactation advanced.
Figure 1.
Marginal association between within-animal live weight change (DW_dev) and equation-derived herbage dry matter intake (HDMI) across lactation. The relationship is derived from the interaction between DW_dev and days in milk (DIM) estimated by the final mixed-effects model. The dashed lines indicate the model-derived zero-crossing (approximately 176 DIM), corresponding to the DIM at which the estimated marginal association between DW_dev and equation-derived HDMI becomes zero. This value should not be interpreted as a physiological threshold.
As a sensitivity analysis, the final mixed-effects model was fitted separately within each pasture access-time group (Table 8). In AT-2h, neither DW_mean nor DW_dev was significantly associated with equation-derived HDMI (p = 0.447 and p = 0.764, respectively), and the DW_dev × DIM interaction was also non-significant (p = 0.422). In contrast, within AT-6h, both DW_mean (β = 71.97 ± 24.20 g DM day−1 per kg; p = 0.005) and DW_dev (β = 74.99 ± 27.46 g DM day−1 per kg; p = 0.007) remained positively associated with equation-derived HDMI, whereas the DW_dev × DIM interaction was not significant (p = 0.117). These group-specific analyses indicate that the associations observed in the pooled dataset were not consistent across pasture access-time groups, as they persisted within AT-6h but were not detected within AT-2h.
Table 8.
Sensitivity analysis of the association between live weight dynamics and equation-derived HDMI within each pasture access-time group.
In an additional sensitivity analysis, MY was included as a covariate in the pooled mixed-effects model to account for its direct contribution to equation-derived HDMI. After adjustment for MY, DW_mean remained positively associated with equation-derived HDMI (β = 224.23 ± 26.22 g DM day−1 per kg; p < 0.001), whereas the association with DW_dev was attenuated and was no longer statistically significant (β = 25.75 ± 14.98 g DM day−1 per kg; p = 0.086). The DW_dev × DIM interaction was also no longer significant (p = 0.357).
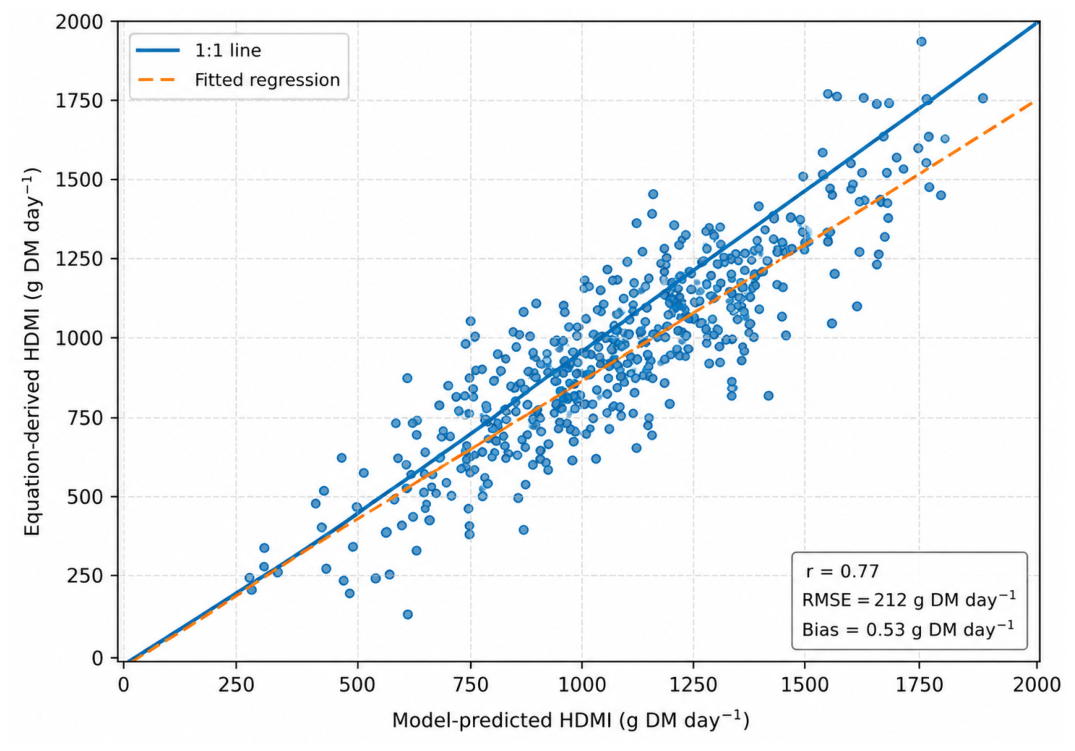
The relationship between equation-derived HDMI and the corresponding model-fitted values is shown in Figure 2. Equation-derived and model-fitted HDMI were positively correlated (Pearson’s r = 0.77), with an RMSE of 212.14 g DM day−1 and a mean bias of 0.53 g DM day−1.
Figure 2.
Relationship between equation-derived and model-fitted herbage dry matter intake (HDMI). The solid line represents the 1:1 relationship, whereas the dashed line represents the fitted regression line.
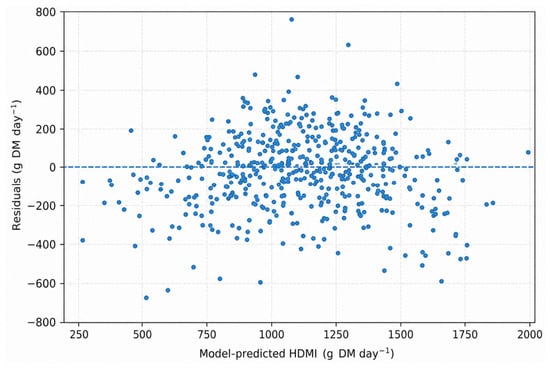
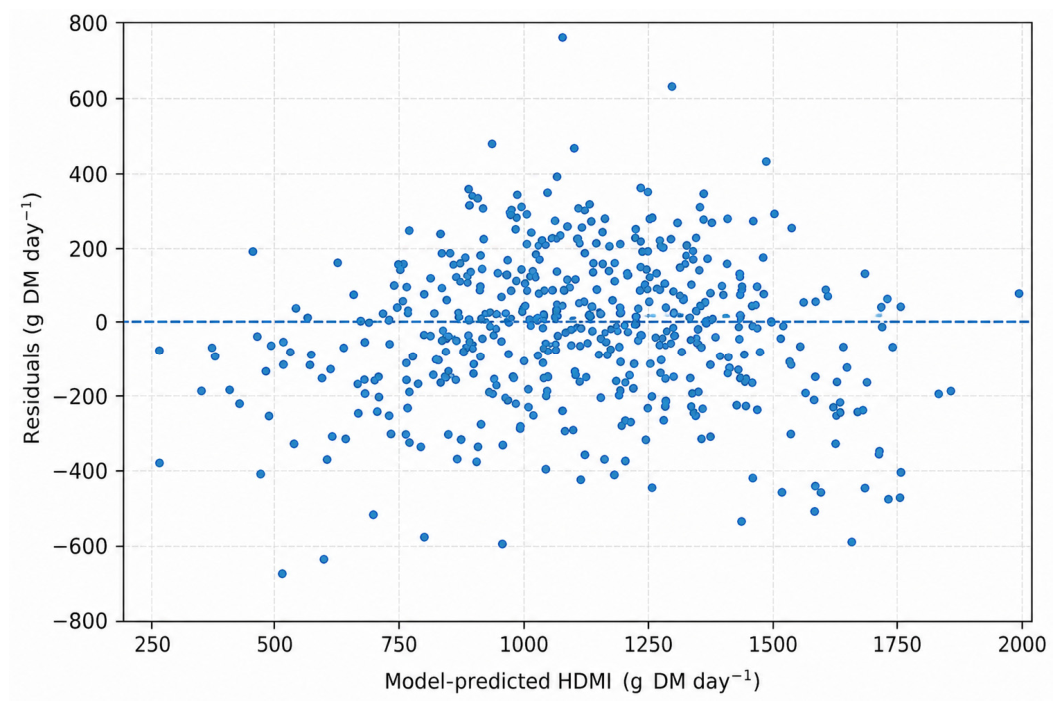
Residual diagnostics (Figure 3) did not reveal major deviations from model assumptions. Residuals were evenly distributed across the range of fitted values and no evident systematic patterns were detected.
Figure 3.
Residuals plotted against model-fitted herbage dry matter intake (HDMI). The dashed horizontal line represents zero residuals.
Overall, the pooled mixed-effects model identified significant positive associations of both the between-animal (DW_mean) and within-animal (DW_dev) components of live weight change with equation-derived HDMI. In addition, the significant DW_dev × DIM interaction in the pooled model indicated that the association between within-animal live weight change and equation-derived HDMI varied across lactation. However, group-specific sensitivity analyses showed that the associations with DW_mean and DW_dev persisted within AT-6h but were not detected within AT-2h, and the DW_dev × DIM interaction was not significant within either pasture access-time group. Furthermore, after adjustment for milk yield, the association with DW_mean persisted, whereas the associations with DW_dev and the DW_dev × DIM interaction were attenuated and no longer statistically significant.
4. Discussion
In the pooled analysis, live weight dynamics recorded across the pasture-access period were associated with equation-derived herbage dry matter intake (HDMI) in part-time grazing dairy ewes. Both the between-animal (DW_mean) and within-animal (DW_dev) components were positively associated with equation-derived HDMI, indicating that animals with greater average live weight gain across the pasture-access period, as well as positive short-term deviations from their own mean, tended to have greater equation-derived HDMI. However, pasture access-time-specific sensitivity analyses showed that these associations were not consistent across pasture access-time groups, as neither DW_mean nor DW_dev was significantly associated with equation-derived HDMI within AT-2h, whereas both associations remained significant within AT-6h. Therefore, the pooled associations should be interpreted as relationships observed under the specific conditions represented by the present dataset rather than as general relationships across pasture access-time conditions. WoW-derived live weight dynamics should also be interpreted as providing information associated with equation-derived HDMI rather than as direct indicators of actual herbage intake.
In the pooled model, the stronger association observed for DW_mean compared with DW_dev suggests that persistent differences among animals contributed substantially to variation in equation-derived HDMI, highlighting the importance of separating between- and within-animal sources of variation in mixed models [26]. This may reflect consistent individual differences in grazing behaviour, intake capacity, digestive fill, and other physiological characteristics. At the same time, DW_dev was significantly associated with equation-derived HDMI in the pooled model, suggesting an apparent relationship between short-term within-animal live weight fluctuations and equation-derived HDMI. However, this association was substantially attenuated and was no longer statistically significant after adjustment for milk yield, indicating that the within-animal relationship was not robust to accounting for variation associated with milk production. Accordingly, the within-animal association should be interpreted cautiously and should not be considered independent of milk yield.
The positive association between live weight change and equation-derived HDMI is biologically plausible. Short-term changes in live weight during grazing are largely influenced by gastrointestinal fill, water intake, and excretion. Experimental studies in sheep have shown that increased feed intake results in greater digesta fill and consequently larger short-term live weight gains, reflecting changes in gastrointestinal contents rather than body tissue accretion [34]. This physiological basis may explain why live weight dynamics respond rapidly to changes associated with intake-related processes, particularly under restricted grazing conditions. Animals exhibiting greater live weight gain across the pasture-access period may therefore have experienced greater changes in gastrointestinal fill associated with herbage consumption. Under these conditions, WoW-derived live weight change should be interpreted as an indirect indicator of intake-related processes rather than a direct measure of herbage intake. Similar applications of automated walk-over-weighing systems have been reported in cattle and sheep for monitoring short-term live weight dynamics under grazing conditions [18,20,24].
The responses observed in milk production, live weight, and body condition further support this interpretation. Ewes in the AT-6h group had a higher milk yield, FPCM, and live weight than those in the AT-2h group, whereas the body condition score did not differ between pasture access-time groups. These results are consistent with the possibility that the observed differences in live weight were associated with short-term variation in feed intake and gastrointestinal fill rather than with changes in body reserves. Similar responses have been reported in previous studies on part-time grazing dairy ewes, where animals subjected to restricted pasture access partially compensated by increasing the grazing intensity and intake rate, although this behavioural adaptation was insufficient to completely offset the reduction in herbage intake under the shortest grazing periods [35].
Although average standing herbage biomass did not differ significantly between pasture access-time groups, herbage allowance per hour of pasture access varied between years and groups because of differences in pasture availability and access duration. In particular, the lower hourly herbage allowance observed for the AT-2h group in 2024 may have contributed to differences in equation-derived HDMI. Consequently, variation in equation-derived HDMI may have been associated with both grazing opportunity and herbage allowance during the pasture-access period rather than with standing herbage biomass alone.
In the pooled model, the significant interaction between DW_dev and DIM indicated that the estimated association between short-term live weight fluctuations and equation-derived HDMI decreased as lactation advanced. The fitted relationship yielded a model-derived zero-crossing point at approximately 176 DIM. However, because this value lies toward the upper end of the observed DIM range (44–201 days), it should not be interpreted as a physiological threshold. Rather, it indicates where the estimated DW_dev slope crossed zero within the fitted model and dataset. The declining association with advancing DIM is biologically plausible, as nutrient requirements, milk production, voluntary feed intake, and gastrointestinal fill generally change throughout lactation [25]. Nevertheless, the precise shape and magnitude of this relationship, particularly at advanced DIM, should be interpreted cautiously. Moreover, the DW_dev × DIM interaction was attenuated and was no longer statistically significant when milk yield was included as an additional covariate, further indicating that the apparent DIM-dependent relationship should not be interpreted as evidence of a specific physiological transition at approximately 176 DIM.
A significant difference in equation-derived HDMI was also observed between the two experimental years. However, this effect should not be interpreted as an independent biological effect of year. The two experiments differed in several respects, including lactation stage, pasture composition, supplementation, herbage allowance, and nutritive value, as well as potentially other environmental and management conditions. Although DIM was explicitly included in the statistical model, the remaining Year effect necessarily represents the combined influence of measured and unmeasured differences between the two experimental conditions that were not otherwise accounted for by the model. Accordingly, the Year coefficient should be regarded primarily as an adjustment for systematic between-experiment differences rather than as evidence of a specific year-related effect on HDMI. The observed between-year difference in equation-derived HDMI may therefore reflect the combined influence of biological, nutritional, pasture, management, and environmental differences, whose individual contributions cannot be separated within the present experimental design.
Overall, the relationship between live weight dynamics and equation-derived HDMI should be interpreted within the broader context of pasture and experimental conditions. The experimental groups differed primarily in grazing opportunity through their different pasture access times, whereas the two experimental years also differed in herbage allowance, pasture quality, lactation stage, supplementation, and other environmental and management conditions. These interacting factors should therefore be considered when interpreting the biological significance of WoW-derived live weight responses under grazing conditions.
The relatively high marginal and conditional R2 values indicate that the model explained a substantial proportion of the variability in equation-derived HDMI within the present dataset. The higher conditional than marginal R2 further highlights the contribution of the ewe-level random effect to the explanatory fit of the model. However, the conditional R2 incorporates the random ewe effect and therefore reflects explanatory fit for the animals included in the dataset rather than predictive performance for new animals. Similarly, DW_mean was calculated from each ewe’s observations across the entire experimental period and was used to separate between- and within-animal sources of variation. In its present form, DW_mean would therefore not be available prospectively at the beginning of real-time monitoring. Consequently, the present model should be regarded primarily as an explanatory model of the association between live weight dynamics and equation-derived HDMI rather than as a validated tool for prospective intake prediction. Future applications would require prospective estimation of animal-specific reference values and validation in independent animals and datasets.
Equation-derived and model-fitted HDMI were positively correlated (Pearson’s r = 0.77), with an RMSE of approximately 212 g DM day−1 and a mean bias of 0.53 g DM day−1. The high conditional coefficient of determination (conditional R2, R2c = 0.94) indicates that the mixed-effects model explained a substantial proportion of the variability in equation-derived HDMI when persistent animal-specific effects were included. These findings suggest that live weight dynamics contain biologically relevant information associated with the variation described by the reference intake equation. However, because model-fitted values were obtained from the same dataset used for model fitting, these statistics describe in-sample model fit rather than independent predictive performance and should not be interpreted as validation against independently measured herbage intake.
Several limitations of the present study should be acknowledged. First, HDMI was equation-derived rather than directly measured; therefore, the observed relationships should be interpreted as associations with an intake estimate rather than as validation of WoW against directly measured herbage intake. Moreover, because pasture access time and milk yield contributed to the equation used to derive HDMI, part of the observed associations may reflect determinants that are already incorporated into the response variable. This interpretation is supported by the pasture access-time-specific and milk-yield-adjusted sensitivity analyses. Second, within each year, each pasture access-time group corresponded to a single grazing group; therefore, pasture access time and grazing groups were confounded, and individual ewes were not independent experimental replicates of the pasture access-time comparison. Consequently, differences between AT-2h and AT-6h should be interpreted descriptively rather than causally. Third, the two experimental years differed in lactation stage, pasture botanical composition, and supplementation and should therefore not be regarded as strict temporal replications of identical experimental conditions. In addition, the different pasture access durations resulted in unequal intervals between pre- and post-grazing live weight measurements. Changes in live weight over these intervals may reflect not only feed intake but also drinking, excretion, gut-fill dynamics, and other short-term changes in body mass. WoW passages were also controlled rather than voluntary, and some temporal mismatch existed among measurements used to derive HDMI, particularly milk yield and pasture NDF. These factors should be considered when interpreting the associations observed in the present study. Independent validation against directly measured individual herbage intake under grazing conditions is therefore required before WoW-derived live weight dynamics can be used as a standalone indicator of individual herbage intake.
A related consideration concerns milk yield, which is explicitly included in the equation used to derive HDMI and is also biologically related to nutritional and production status. In the sensitivity analysis including MY as an additional covariate, the between-animal association with DW_mean remained significant, whereas the within-animal association with DW_dev and its interaction with DIM were attenuated and were no longer statistically significant. This suggests that part of the short-term association between live weight dynamics and equation-derived HDMI may reflect variation associated with milk production. Importantly, however, the objective of the present study was not to demonstrate that WoW-derived live weight change predicts herbage intake independently of pasture access time, milk production, and physiological stage, but to evaluate whether live weight dynamics recorded under contrasting pasture-access conditions were associated with variation in equation-derived HDMI.
Despite these limitations, the present study suggests that automated live weight monitoring may have potential applications in precision management of grazing dairy sheep. WoW systems offer a non-invasive, low-labour approach for collecting repeated live weight measurements and may provide complementary indicators of intake-related processes that could potentially contribute to grazing management decisions. Rather than replacing conventional intake estimation methods, WoW-derived indicators should be viewed as complementary tools capable of providing frequent information on live weight dynamics associated with intake-related processes. This perspective is consistent with the broader development of precision livestock farming technologies for pasture-based systems [7,8,9].
Future studies should validate WoW-derived indicators against independent measurements of herbage intake and evaluate their predictive validity in independent animals and datasets, as well as their applicability across different grazing systems, pasture types, supplementation strategies, and environmental conditions. Nevertheless, the present findings indicate that live weight dynamics recorded across the pasture-access period provide information associated with equation-derived HDMI and may have potential to complement other indicators used to support grazing management in part-time grazing dairy ewes.
5. Conclusions
WoW-derived live weight dynamics were associated with equation-derived herbage dry matter intake (HDMI) in part-time grazing dairy ewes. In the pooled analysis, both persistent between-animal differences (DW_mean) and short-term within-animal fluctuations (DW_dev) were positively associated with the equation-derived HDMI. However, these associations were not consistent across pasture access-time groups, and adjustment for milk yield substantially attenuated the within-animal association, which was no longer statistically significant. The apparent decline in the DW_dev–HDMI association with advancing lactation should also be interpreted cautiously, as the DW_dev × DIM interaction was not significant in the sensitivity analyses.
These findings indicate that repeated WoW measurements provide information associated with variation in the equation-derived HDMI, but they do not demonstrate that WoW can directly measure or independently predict individual herbage intake. Because HDMI was equation-derived and the present analyses were based on the same dataset used for model fitting, independent validation against directly measured individual herbage intake is required. WoW-derived indicators may nevertheless complement existing approaches for monitoring intake-related processes in grazing dairy sheep, particularly where frequent individual monitoring under grazing conditions is difficult to achieve.
Supplementary Materials
The following supporting information can be downloaded at: https://www.mdpi.com/article/10.3390/grasses5040041/s1. Supplementary File S1: Minimal dataset used for the final mixed-effects analysis, provided as an Excel workbook containing three worksheets: Data (individual ewe-week observations), README (variable definitions and methodological notes), and Summary (dataset summary information).
Author Contributions
Conceptualisation, M.D. and M.A.; methodology, M.D., M.A., M.S., A.C., and V.G.; validation, M.D., M.G.S., A.F. and M.S.; formal analysis, M.D., M.A. and V.G.; investigation, V.G., M.A., A.F., M.G.S. and A.C.; resources, M.D., A.F. and M.S.; writing—original draft preparation, M.D., V.G. and M.S.; writing—review and editing, M.D., M.A., M.S., A.F., A.C., M.G.S. and V.G.; supervision, M.D. and M.A.; project administration, M.D. All authors have read and agreed to the published version of the manuscript.
Funding
This research was conducted within the TechCare project, funded by the European Union’s Horizon 2020 Research and Innovation Programme under Grant Agreement No. 862050.
Institutional Review Board Statement
The animal study protocol was approved by the Ethical Committee for Animal Experimentation (O.P.B.S.A.) of the University of Sassari and AGRIS Sardegna (approval No. 52682; 6 May 2021).
Data Availability Statement
The original contributions presented in this study are included in the article/supplementary material. Further inquiries can be directed to the corresponding author.
Acknowledgments
The authors thank S. Picconi and A. Pintore for their technical support during the experimental work, and M. Delrio, M. Niolu, M. A. Sanna, L. Sanna, M. Torru, and the laboratory staff for performing the chemical analyses. During the preparation of this manuscript, the authors used ChatGPT (OpenAI, GPT-6) solely for English-language editing and to improve the clarity and readability of the text. The authors reviewed and edited all AI-assisted output and take full responsibility for the content of this publication.
Conflicts of Interest
The authors declare no conflicts of interest.
Abbreviations
The following abbreviations are used in this manuscript:
| WoW | Walk-over-weighing |
| EID | Electronic identification |
| LW | Live weight |
| MY | Milk yield |
| DW | Live weight change across the pasture-access period |
| DW_mean | Individual mean live weight change across the study (between-animal component) |
| DW_dev | Deviation of weekly live weight change from the individual mean (within-animal component) |
| HDMI | Equation-derived herbage dry matter intake |
| DIM | Days in milk |
| AT | Pasture access time |
| AT-6h | 6 h day−1 of pasture access |
| AT-2h | 2 h day−1 of pasture access |
| BCS | Body condition score |
| DM | Dry matter |
| CP | Crude protein |
| NDF | Neutral detergent fibre |
| ADF | Acid detergent fibre |
| ADL | Acid detergent lignin |
| IVDMD | In vitro dry matter digestibility |
| FPCM | Fat- and protein-corrected milk |
| LSMeans | Least-squares means |
| RMSE | Root mean squared error |
| REML | Restricted maximum likelihood |
| R2c | Conditional coefficient of determination |
| R2m | Marginal coefficient of determination |
References
- Forbes, J.M. Voluntary Food Intake and Diet Selection in Farm Animals, 2nd ed.; CABI: Wallingford, UK, 2007; Available online: https://www.cabidigitallibrary.org/doi/book/10.1079/9781845932794.0000 (accessed on 28 September 2026).
- Molle, G.; Cannas, A.; Gregorini, P. A review on the effects of part-time grazing herbaceous pastures on feeding behaviour and intake of cattle, sheep and horses. Livest. Sci. 2022, 263, 104982. [Google Scholar] [CrossRef] [Scilit]
- Hodgson, J. The control of herbage intake in the grazing ruminant. Proc. Nutr. Soc. 1985, 44, 339–346. [Google Scholar] [CrossRef] [Scilit] [PubMed]
- Mayes, R.W.; Lamb, C.S.; Colgrove, P.M. The use of dosed and herbage n-alkanes as markers for the determination of herbage intake. J. Agric. Sci. 1986, 107, 161–170. [Google Scholar] [CrossRef] [Scilit]
- Dove, H.; Mayes, R.W. Protocol for the analysis of n-alkanes and other plant-wax compounds and for their use as markers for quantifying the nutrient supply of large mammalian herbivores. Nat. Protoc. 2006, 1, 1680–1697. [Google Scholar] [CrossRef] [Scilit] [PubMed]
- Smith, W.B.; Galyean, M.L.; Kallenbach, R.L.; Greenwood, P.L.; Scholljegerdes, E.J. Understanding intake on pastures: How, why, and a way forward. J. Anim. Sci. 2021, 99, skab062. [Google Scholar] [CrossRef] [Scilit] [PubMed]
- Berckmans, D. General introduction to precision livestock farming. Anim. Front. 2017, 7, 6–11. [Google Scholar] [CrossRef] [Scilit]
- Giovanetti, V.; Cossu, R.; Molle, G.; Acciaro, M.; Mameli, M.; Cabiddu, A.; Serra, M.G.; Manca, C.; Rassu, S.P.G.; Decandia, M.; et al. Prediction of bite number and herbage intake by an accelerometer-based system in dairy sheep exposed to different forages during short-term grazing tests. Comput. Electron. Agric. 2020, 175, 105582. [Google Scholar] [CrossRef] [Scilit]
- Aquilani, C.; Confessore, A.; Bozzi, R.; Sirtori, F.; Pugliese, C. Review: Precision livestock farming technologies in pasture-based livestock systems. Animal 2022, 16, 100429. [Google Scholar] [CrossRef] [Scilit] [PubMed]
- Chelotti, O.; Martinez-Rau, S.L.; Ferrero, M.; Vignolo, L.D.; Galli, J.R.; Planisich, A.M.; Rufiner, H.L.; Giovanini, L.L. Livestock feeding behaviour: A review on automated systems for ruminant monitoring. Biosyst. Eng. 2024, 246, 150–177. [Google Scholar] [CrossRef] [Scilit]
- Rutter, S.M.; Champion, R.A.; Penning, P.D. An automatic system to record foraging behaviour in free-ranging ruminants. Appl. Anim. Behav. Sci. 1997, 54, 185–195. [Google Scholar] [CrossRef] [Scilit]
- Andriamandroso, A.L.H.; Bindelle, J.; Mercatoris, B.; Lebeau, F. A review on the use of sensors to monitor cattle jaw movements and feeding behaviour. Biotechnol. Agron. Soc. Environ. 2016, 20, 273–286. [Google Scholar] [CrossRef] [Scilit]
- do Nascimento Amorim, M.; Mourão, G.B.; Turco, S.H.N.; da Silva-Miranda, K.O. Applications and trends of accelerometer and artificial intelligence techniques in livestock production: A scoping review. Smart Agric. Technol. 2026, 13, 101889. [Google Scholar] [CrossRef] [Scilit]
- Ding, L.; Lv, Y.; Jiang, R.; Zhao, W.; Li, Q.; Yang, B.; Yu, L.; Ma, W.; Gao, R.; Yu, Q. Predicting the Feed Intake of Cattle Based on Jaw Movement Using a Triaxial Accelerometer. Agriculture 2022, 12, 899. [Google Scholar] [CrossRef] [Scilit]
- Wang, K.; Wu, P.; Cui, H.; Xuan, C.; Su, H. Identification and classification of sheep foraging behavior based on acoustic signal and deep learning. Comput. Electron. Agric. 2021, 187, 106275. [Google Scholar] [CrossRef] [Scilit]
- Wang, K.; Xuan, C.; Wu, P.; Liu, F.; Fan, X. Feeding intake estimation in sheep based on ingestive chewing sounds. Comput. Electron. Agric. 2022, 194, 106698. [Google Scholar] [CrossRef] [Scilit]
- Ungar, E.D. Ingestive behaviour. In The Ecology and Management of Grazing Systems; Hodgson, J., Illius, A.W., Eds.; CAB International: Wallingford, UK, 1996; pp. 185–218. [Google Scholar]
- Decandia, M.; Acciaro, M.; Molle, G.; Frongia, A.; Sitzia, M.; Serra, M.G.; Cabiddu, A.; Llach, I.; González-García, E.; Giovanetti, V. Detection of nutritionally driven live weight changes in dairy ewes using a walk-over-weighing system. Sensors 2026, 26, 3732. [Google Scholar] [CrossRef] [Scilit] [PubMed]
- Decruyenaere, V.; Buldgen, A.; Stilmant, D. Factors affecting intake by grazing ruminants and related quantification methods: A review. Biotechnol. Agron. Soc. Environ. 2009, 13, 559–573. [Google Scholar]
- Dickinson, R.A.; Morton, J.M.; Beggs, D.S.; Anderson, G.A.; Pyman, M.F.; Mansell, P.D.; Blackwood, C.B. An automated walk-over weighing system as a tool for measuring liveweight change in lactating dairy cows. J. Dairy Sci. 2013, 96, 4477–4486. [Google Scholar] [CrossRef] [Scilit] [PubMed]
- González-García, E.; Alhamada, M.; Pradel, J.; Douls, S.; Parisot, S.; Bocquier, F.; Menassol, J.B.; Llach, I.; González, L.A. A mobile and automated walk-over-weighing system for close and remote monitoring of liveweight in sheep. Comput. Electron. Agric. 2018, 153, 226–238. [Google Scholar] [CrossRef] [Scilit]
- Leroux, E.; Llach, I.; Besche, G.; Guyonneau, J.-D.; Montier, D.; Bouquet, P.-M.; Sanchez, I.; González-García, E. Evaluating a walk-over-weighing system for the automatic monitoring of growth in postweaned Mérinos d’Arles ewe lambs under Mediterranean grazing conditions. Anim. Open Space 2023, 2, 100032. [Google Scholar] [CrossRef] [Scilit]
- González-García, E.; Sanchez, I.; Llach, I.; Decandia, M.; Giovanetti, V.; Cloez, B. Validating kfino algorithm (Kalman filter with impulse noised outliers) to filter liveweight outliers produced by the walk-over-weighing (WoW) platform in a large spectrum of farming systems. Smart Agric. Technol. 2025, 12, 101374. [Google Scholar] [CrossRef] [Scilit]
- González-García, E.; de Oliveira Golini, P.; Hassoun, P.; Bocquier, F.; Hazard, D.; González, L.A.; Ingham, A.B.; Bishop-Hurley, G.J.; Greenwood, P.L. An assessment of walk-over-weighing to estimate short-term individual forage intake in sheep. Animal 2018, 12, 1174–1181. [Google Scholar] [CrossRef] [Scilit] [PubMed]
- Cannas, A. Feeding of lactating ewe. In Dairy Sheep Nutrition; Pulina, G., Ed.; CABI International: Wallingford, UK, 2004; pp. 79–108. Available online: https://www.cabidigitallibrary.org/doi/book/10.1079/9780851996813.0000 (accessed on 28 September 2026).
- van de Pol, M.; Wright, J. A simple method for distinguishing within- versus between-subject effects using mixed models. Anim. Behav. 2009, 77, 753–758. [Google Scholar] [CrossRef] [Scilit]
- European Parliament and Council of the European Union. Directive 2010/63/EU of 22 September 2010 on the protection of animals used for scientific purposes. Off. J. Eur. Union 2010, L 276, 33–79. [Google Scholar]
- Decandia, M.; Acciaro, M.; Giovanetti, V.; Molle, G.; Chessa, F.; Llach, I.; González-García, E. Monitoring liveweight in Sarda dairy sheep using a walk-over-weighing system. In Book of Abstracts of the 74th Annual Meeting of the European Federation of Animal Science (EAAP); Wageningen Academic Publishers: Wageningen, The Netherlands, 2023; Volume 29, p. 504. [Google Scholar] [CrossRef] [Scilit]
- Pulina, G.; Nudda, A. Milk production. In Dairy Sheep Nutrition; Pulina, G., Ed.; CABI Publishing: Wallingford, UK, 2004; pp. 1–12. [Google Scholar]
- Russel, A.J.F. Body condition scoring of sheep. Practice 1984, 6, 91–93. [Google Scholar] [CrossRef] [Scilit] [PubMed]
- Sanchez, I.; González-García, E.; Fontez, B.; Cloez, B. ORIOLE: A web application for cleaning data from walk-over-weighing device in livestock systems. In Book of Abstracts of the 74th Annual Meeting of the European Federation of Animal Science (EAAP); Wageningen Academic Publishers: Wageningen, The Netherlands, 2023; Volume 29, p. 504. [Google Scholar] [CrossRef] [Scilit]
- Cloez, B.; Fontez, B.; González-García, E.; Sanchez, I. Kalman filter with impulse-noised outliers: A robust sequential algorithm to filter data with a large number of outliers. Int. J. Biostat. 2024, 20, 641–660. [Google Scholar] [CrossRef] [Scilit] [PubMed]
- SAS Institute Inc. SAS/STAT® 9.4 User’s Guide; SAS Institute Inc.: Cary, NC, USA, 2013. [Google Scholar]
- Clauss, M.; Stewart, M.; Price, E.; Peilon, A.; Savage, T.; Van Ekris, I.; Munn, A. The effect of feed intake on digesta passage, digestive organ fill and mass, and digesta dry matter content in sheep (Ovis aries): Flexibility in digestion but not in water reabsorption. Small Rumin. Res. 2016, 138, 12–19. [Google Scholar] [CrossRef] [Scilit]
- Molle, G.; Decandia, M.; Giovanetti, V.; Manca, C.; Acciaro, M.; Epifani, G.; Salis, L.; Cabiddu, A.; Sitzia, M.; Cannas, A. Effects of restricted time allocation to pasture on feeding behaviour, intake and milk production of dairy sheep rotationally grazing Italian ryegrass (Lolium multiflorum Lam.) in spring. Anim. Prod. Sci. 2014, 54, 1233–1237. [Google Scholar] [CrossRef] [Scilit]

Disclaimer/Publisher’s Note: The statements, opinions and data contained in all publications are solely those of the individual author(s) and contributor(s) and not of MDPI and/or the editor(s). MDPI and/or the editor(s) disclaim responsibility for any injury to people or property resulting from any ideas, methods, instructions or products referred to in the content. |
© 2026 by the authors. Licensee MDPI, Basel, Switzerland. This article is an open access article distributed under the terms and conditions of the Creative Commons Attribution (CC BY) license.