


Abstract
Augmented reality (AR) offers promising opportunities to support manual assembly, but there is little consensus on how much information AR instructions should contain, reflecting debates between cognitive-load-oriented minimalism and multimedia-learning-based benefits of redundancy. These debates manifest in practice as rich, multimodal overlays or minimal, complexity-adaptive visualizations designed to avoid clutter and ease authoring. This study compares these approaches by contrasting a redundant AR concept combining three-dimensional models, photographs, and videos with a minimal concept that adapts visualization types to assembly step complexity. In a between-subject experiment with 30 participants (mixed-experience; heterogeneous backgrounds) performing a heat-pump assembly task for the first time in a spatially constrained setup, errors, task time, workload, and usability were measured. The redundant concept led to significantly fewer errors and a lower per-step error probability than the minimal concept, without a penalty in assembly time. Workload and usability were comparable across concepts and primarily driven by performance rather than by visualization style. Step complexity strongly predicted completion time but not error rates, suggesting that operators slow down on complex steps while failures are more sensitive to instructional design. These findings suggest that overly minimal AR instructions increase error risk, whereas redundant AR instructions stabilize performance.
1. Introduction
Augmented reality (AR) has rapidly evolved in recent years, driven by advances in both hardware and software that have significantly improved system performance, stability, and usability. As technological barriers continue to decline, AR is becoming increasingly viable for industrial deployment [1], and user acceptance has grown accordingly [2]. Political and economic actors likewise emphasize the strategic importance of emerging digital technologies, identifying AR as a key enabler of innovation and competitiveness [3]. Beyond industrial applications, immersive technologies such as AR and virtual reality (VR) are discussed as promising tools for training and education because they can embed learning in a situated context and provide contextualized guidance at the point of need [2,4]. In a survey study in English as a Foreign Language (EFL) classrooms, Zhang and Miao found that learners’ literacy with AI and AR/VR tools significantly predicted engagement and motivation [5]. These characteristics make AR especially relevant for vocational environments, where training resources are limited and equipment used for educational purposes cannot simultaneously support productive operations.
Within the broader digital transformation of Industry 4.0, AR is increasingly investigated for industrial training and assistance. A recent systematic literature review identifies studies reporting that AR can support the transfer of technical knowledge and practical skills and may improve efficiency and accuracy in assembly-related tasks [6]. More broadly, AR/VR technologies are becoming established across a wide range of industrial application areas as the supporting technologies mature [7]. Conventional assembly documentation—typically text-heavy manuals or schematic black-and-white drawings—cannot adapt to users’ differing levels of prior knowledge. As a result, experienced workers often encounter redundant information, whereas less experienced workers receive insufficient guidance [8]. AR has the potential to overcome these limitations by presenting spatially precise, context-relevant information directly in the user’s field of view [9].
Empirical comparisons report that AR-based assistance can reduce assembly errors compared to conventional instruction media, although outcomes depend on the device and implementation [10]. Recent work further suggests that the presentation approach itself (e.g., in situ vs. side-by-side) affects performance and that a comprehensive, up-to-date comparison of presentation approaches is still missing [11]. At the design level, the literature reports a lack of established patterns or design rules for AR instructions and no agreement on the best way to present procedural information [12]. In industrial AR specifically, selecting appropriate visualization methods and visual assets is described as a non-trivial open issue, compounded by missing standards and guidelines for technical assets [13]. Even for basic legibility factors (e.g., text style, color coding, illuminance), authors note the absence of standard guidelines and provide only partial recommendations [14]. Finally, practitioners still face difficulty selecting appropriate techniques and information-presentation methods for a given use case, motivating decision-support guidelines and tools [15]. Existing approaches vary widely in the amount and form of information provided, ranging from highly redundant multimodal instruction sets to minimalistic representations. The lack of standardized, methodologically grounded visualization strategies increases development effort, hinders scalability, and poses a barrier to broader industrial adoption.
From a theoretical perspective, prior work motivates diverging hypotheses about how much information AR instructions should present. Multimedia learning frameworks and the redundancy principle suggest that multiple, converging representations of the same content can stabilize understanding and reduce errors in complex tasks, provided that they are well aligned and not merely decorative [16]. By contrast, cognitive load theory (CLT) assumes that learning is constrained by severely limited working-memory capacity and that inefficient search processes can consume capacity that would otherwise be available for schema acquisition [17]. CLT differentiates intrinsic load (driven by element interactivity), extraneous load (imposed by the instructional format), and germane load (mental effort invested in schema construction) [18,19]. Accordingly, instructional designs should minimize extraneous load and manage intrinsic load so that remaining capacity can be devoted to germane processing; moreover, the optimal amount of instructional guidance depends on learners’ prior knowledge (expertise reversal effect) [18,19,20]. In line with this view, recent work on minimal AR argues that AR work instructions should convey only the minimum information needed to accomplish a task, and reports that visual assets with excess or redundant information do not improve performance or task comprehension [8,21]. To operationalize what “minimum” means at the step level, the minimal AR authoring approach models the required information in terms of work-instruction demands and affordance constraints (dependent on equipment characteristics and operator capabilities) [21]. Complementarily, Gattullo et al. propose a task-analytic decomposition of work instructions into elemental information types (identity, location, order, way-to, notification, orientation) and link each type to suitable visual assets and properties, providing a structured basis for selecting a smallest sufficient visual-asset set per step [22]. Additionally, from a human–computer interaction (HCI) perspective, prior work suggests that perceived usability is strongly influenced by visual appearance and perceived simplicity, and that design elements supporting orientation and structure can enhance usability judgments even in relatively complex interfaces [23,24].
Despite extensive work on AR instructions and individual visualization elements, there remains limited empirical evidence on how the degree of visual redundancy versus minimality should be designed and deployed to support first-time execution of non-trivial, spatially constrained manual assembly tasks, particularly when uncertainty varies across steps. Controlled comparisons that isolate redundant versus minimal (and complexity-adaptive) visualization strategies while jointly assessing their effects on assembly errors, completion time, cognitive workload, usability, and the role of step complexity remain scarce. To address this gap and to contribute evidence toward more generalizable design guidance for AR instruction authoring in manual assembly, the following research questions (RQ) are formulated. RQ0 is the overarching research question and is addressed through RQ1–RQ2, while RQ3 examines the contribution of step complexity independent of the visualization concept.
- RQ0 (Design): Which instruction-structuring strategy—redundant multimodal vs. minimal, complexity-adaptive—is more effective and user-friendly for supporting first-time performance in a spatially constrained manual assembly task?
- RQ1 (Performance): How does a redundant multimodal instruction strategy differ from a minimal, complexity-adaptive strategy with respect to assembly errors and assembly time?
- RQ2 (User experience): How does a redundant multimodal instruction strategy differ from a minimal, complexity-adaptive strategy with respect to cognitive workload and usability?
- RQ3 (Complexity effects): How is step complexity associated with assembly errors and assembly time, independent of the visualization concept?
The present study addresses these RQs by comparing two contrasting AR visualization concepts (VC) for manual assembly—hereafter referred to as VC1 and VC2: one relying on redundant multimodal information based on findings by Jasche et al. [25] (VC1) and one following a minimal, complexity-adaptive approach derived from a decomposition of assembly steps into elemental information units based on Laviola et al. [8] (VC2). The key differences can be summarized as follows:
- Redundancy level: VC1 provides a consistently high level of redundant information, whereas VC2 varies the information density adaptively based on step complexity.
- Modality: VC1 employs a broad, fixed set of multimodal representations (e.g., video, photo, computer aided design (CAD) models, animations), while VC2 expands modalities only as needed.
- Adaptivity: VC1 is non-adaptive, whereas VC2 derives its visualization dynamically from the complexity level based on the elemental informational requirements of each assembly step.
The aim is to investigate how these different information design philosophies influence assembly performance, cognitive workload, and user experience, and how step complexity relates to errors and assembly time. By empirically evaluating the practical effects of redundant versus minimal visualization strategies, the study seeks to contribute to the development of generalizable design guidelines that support AR developers and reduce industrial implementation effort. Therefore, this study is explicitly interdisciplinary: it integrates (i) industrial engineering and manufacturing research on AR-based work assistance, (ii) cognitive psychology and learning sciences (e.g., cognitive load theory and multimedia learning) to derive competing predictions about redundancy versus minimalism, and (iii) HCI research to capture user experience, perceived workload, and usability. Epistemologically, this combination bridges two complementary knowledge traditions: theory-driven accounts of human information processing on the one hand, and design- and application-oriented engineering knowledge on the other. AR VCs are treated as testable instructional hypotheses and evaluated empirically in an ecologically grounded assembly task, thereby informing evidence-based design implications for industrial AR instruction authoring and deployment.
Figure 1 summarizes the proposed causal mechanisms linking VCs and step complexity to performance and user-experience outcomes, and it motivates the hypotheses derived below. The VC is assumed to influence performance and user-experience outcomes via two proximal AR mechanisms: representational coverage (coverage of required information types such as identity, location, way-to, and orientation) and perceptual availability (the degree to which required cues are perceptually accessible at the moment of action). Step complexity (operationalized via the required information types per step) serves as a proxy for intrinsic load and is expected to primarily affect completion time. The model further highlights boundary conditions (moderators) such as prior AR and domain expertise and perceptual workspace constraints like visibility (whether the critical physical interface is in view), salience (how strongly task-relevant cues stand out), spatial registration (accuracy and stability of overlay alignment), and workspace occlusion (virtual/physical elements blocking critical cues).
Figure 1.
Conceptual model linking VC and step complexity with assembly errors, assembly time, workload and usability. Blue-framed boxes denote independent variables, green-framed boxes mediators, red-framed boxes moderators, and purple-framed boxes dependent variables. Solid arrows indicate hypothesized relationships expected for both VCs, whereas dashed arrows indicate relationships expected only for one VC.
Based on these theoretical considerations and prior experimental studies showing that AR-based work instructions can reduce errors, shorten task completion time, and lower task load [26], the following hypotheses (H) were derived to operationalize RQ1–RQ3 and thereby provide empirical answers to RQ0: In the present study, the redundant multimodal instruction strategy is operationalized as VC1, whereas the minimal, complexity-adaptive strategy is operationalized as VC2.
- H1a: VC1 reduces assembly errors compared to VC2. (Based on the redundancy principle in multimedia learning.)
- H1b: VC2 reduces assembly time compared to VC1. (Based on the minimal AR approach and anti-clutter design.)
- H2a: VC2 reduces cognitive workload compared to VC1. (Based on CLT and the reduction of extraneous load.)
- H2b: VC2 enhances usability compared to VC1. (Based on HCI findings on visual simplicity and perceived usability.)
Independent of the VC, step complexity was expected to influence task performance. Therefore, the following hypotheses were proposed:
- H3a: Step complexity is positively associated with assembly errors. (Based on CLT and intrinsic load.)
- H3b: Step complexity is positively associated with assembly time. (Based on complexity-based AR design models.)
Finally, the paper is structured to address the research questions and hypotheses explicitly. Section 2 positions the work in the literature on AR work instructions, redundancy versus minimality, and complexity-sensitive guidance, thereby motivating RQ0–RQ3 and the derived hypotheses. Section 3 details the assembly scenario and apparatus, the operationalization of RQ1–RQ3 into measurable outcomes (errors, time, workload, usability, and step complexity), the study design, and the statistical procedures, thereby enabling replication. Section 4 reports the empirical evidence in a question- and hypothesis-driven structure: objective performance outcomes answering RQ1/testing H1a–H1b are reported in Section 4.2; subjective workload and usability answering RQ2/testing H2a–H2b are reported in Section 4.3; and exploratory analyses addressing step complexity answering RQ3/testing H3a–H3b are reported in Section 4.4. Section 5 synthesizes these findings to answer the overarching RQ0 and to derive design implications (see Section 5.1 and Section 5.2), while delimiting the scope of inference and discussing limitations (Section 5.3). In closing, Section 6 concisely summarizes the answers to RQ0–RQ3, highlights the main contributions, and outlines directions for future research.
In summary, the study shows that, in this first-time, non-trivial, spatially constrained assembly task with a mixed-experience participant sample, the redundant concept (VC1) significantly reduced assembly errors, whereas the minimal, complexity-adaptive concept (VC2) did not yield measurable improvements in assembly time, cognitive workload, or usability. Step complexity did not predict error frequency but was strongly associated with increased assembly time.
2. Related Work
Research on AR in industrial contexts has grown substantially over the last two decades, with a particular focus on manual assembly support. Early experimental work demonstrated that spatially registered AR instructions can improve task performance compared to conventional 2D media such as paper manuals or screen-based displays [10]. Tang et al. showed that AR can reduce mental transformation effort in an object-assembly task and lead to faster, more accurate performance than monitor-based instructions, although this came at the cost of higher technological complexity at the time [27]. Radkowski et al. investigate how spatially registered visual features in AR-based assembly instructions should be selected to match the difficulty of the respective assembly operation [28]. In a standardized assembly benchmark, Blattgerste et al. report that an optical see-through HMD (Microsoft HoloLens; Microsoft Corporation, Redmond, WA, USA) achieves container-localization times comparable to paper instructions and reduces errors in the part-picking phase, while pictorial instructions remain faster for locating the assembly position [10]. Beyond basic performance comparisons, several works have examined how AR instructions should be structured for industrial use. Palmarini et al. reviewed AR applications in maintenance and production and concluded that many prototypes lack systematic design principles and are difficult to scale beyond pilot projects [29]. In response, methodological frameworks for AR manuals have been proposed: Gattullo et al. introduced a stepwise methodology for designing AR manuals for Industry 4.0, emphasizing the decomposition of tasks into operations, the mapping of each operation to suitable visualization primitives, and the integration into existing product lifecycle data [30]. These approaches highlight the need to treat AR instructions as engineered artefacts rather than ad hoc overlays. A more recent line of work focuses specifically on the information design of AR instructions. Radkowski et al. varied visual features such as highlighting, motion cues, and animation and found that richer spatial cues can benefit error-prone or difficult assembly steps, whereas very simple steps do not require complex augmentations [28]. Blattgerste et al. compared different AR display modalities and also reported that in situ 3D overlays are particularly helpful when spatial relations are non-trivial, but that additional media (e.g., pictures or videos) can improve comprehensibility for inexperienced users [10]. These findings align with general multimedia learning research suggesting that multiple, converging representations can provide useful redundancy for complex tasks [16].
Building on this line of work, prior findings on redundant and multimodal AR visualizations directly informed the design of the first VC investigated in the present study. In line with results reported by Blattgerste et al., VC1 adopts a redundancy-oriented information design by providing multiple, functionally equivalent representations of the same assembly information. For each assembly operation, VC1 combines spatially registered 3D CAD overlays with supplementary representations such as text, photographs, and in situ video, thereby implementing representational redundancy intended to support comprehension and error avoidance in non-trivial assembly steps.
In contrast, concerns about visual clutter and cognitive overload have motivated research into more parsimonious AR visualizations. Tainaka et al. proposed a guideline and tool for designing AR assembly support that systematically selects information types and visualization methods per step in order to avoid unnecessary overlays while still providing sufficient guidance [15]. Building on this idea, Laviola et al. introduced the minimal AR authoring approach, which optimizes the set of visual assets used in industrial AR work instructions and evaluates a minimalistic, complexity-based authoring strategy [21]. Reflecting this design philosophy, VC2 in the present study draws on the same set of underlying representation types as VC1, but selectively presents only a subset of these representations depending on the complexity of the respective assembly step, thereby reducing concurrent visual information while preserving the core semantic content.
Complementary to these visualization-oriented approaches, several authors have argued for systematic complexity models as a basis for adaptive AR instructions. Gattullo et al. proposed a decomposition of assembly steps into elemental information units (identity, location, way-to, notification, order, and orientation) and used the resulting complexity score to reason about which information must be conveyed at each step [22]. Geng et al. developed a design method for adaptive AR work instructions that adjusts the level of detail based on task complexity and operator needs, illustrating that dynamic adaptation can reduce information overload while preserving task success [31]. More general work on HMD-based AR in manufacturing emphasizes that successful assistance systems must be designed for the realities of the shop floor and therefore consider human-factor and technical perspectives such as visualization, context awareness, human–machine interaction, ergonomics, and usability [32]. At the instruction-authoring level, requirements vary by use case, and designers face recurring difficulty selecting appropriate information-presentation methods; accordingly, Tainaka et al. propose choosing presentation methods by filtering candidates based on subtask type, tracking capabilities, and the working environment [15]. Complementing this, the minimal AR authoring approach shows empirically that adding visual assets with excess information does not significantly improve performance; instead, it recommends matching information density to what is required by the current situation (e.g., minimal cues for location, but richer assets when identity or orientation must be conveyed), suggesting that one-size-fits-all extremes are unlikely to be optimal [8].
Taken together, the literature suggests that AR can substantially improve manual assembly performance, but it also reveals a lack of consensus on how much information should be presented and how redundancy should be used. Existing approaches span a spectrum: some focus on converting full “traditional” manuals into structured AR documentation and report improved clarity of the resulting information layout (e.g., controlled language, symbol-based instructions, and structured content) [30]. Related assembly-support work enriches in situ guidance with different visual features matched to operation difficulty and task complexity, rather than assuming a one-size-fits-all presentation [28]. In contrast, authoring-oriented lines of research argue for designing the smallest sufficient set of AR signifiers/visual assets to support task comprehension, because redundant visuals can be unnecessary, while also reducing media creation and authoring effort through systematic selection guidance [15,21,22]. Several experimental studies have compared AR instructions against conventional 2D media and reported not only objective performance but also subjective outcomes such as perceived workload, user preference, or ease of use [27,28]. However, these studies typically vary the display modality at a coarse level (e.g., AR vs. monitor) and do not systematically manipulate the degree of redundancy within AR instructions themselves. As a result, very few works directly compare redundant and minimal AR VCs within the same realistic industrial assembly scenario and quantify the trade-off between error performance, task time, cognitive workload, and usability. The present study addresses this gap by experimentally contrasting a redundant, multimodal AR VC with a minimal, complexity-adaptive concept in a real-world heat-pump assembly task.
3. Materials and Methods
This section details the study design (Section 3.1), including the procedure (Section 3.1.1), measures (Section 3.1.2) and data analysis (Section 3.1.3), as well as the assembly scenario (Section 3.2) and VCs (Section 3.3), to enable replication. It further explains how the research questions were operationalized into measurable outcomes (Section 3.1.2).
3.1. Study Design
The experiment investigated the influence of two AR VCs on the performance and subjective experience of users completing an assembly task. A between-subject design was deliberately chosen to mitigate learning and crossover effects commonly observed in assembly and procedural tasks. Prior research and established practice indicate that repeated exposure to similar assembly instructions leads to rapid skill acquisition, strategy optimization, and error reduction, which can confound comparisons between different instructional designs. Once participants have completed an assembly sequence, subsequent executions are influenced by memory of part locations, action order, and error recovery strategies rather than the VC itself.
Empirical evidence for such strong learning effects in assembly tasks is provided by Hou et al. (2013), who showed that AR-based animated guidance not only resulted in faster task completion and fewer errors compared to traditional manuals, but also produced a steep learning curve across repeated task executions [26]. As a consequence, repeated task execution can substantially confound comparisons between different instructional designs.
From a cognitive load perspective, this is particularly critical, as instructional effectiveness is strongly dependent on the learner’s level of prior knowledge. According to the expertise reversal effect, instructional guidance that is essential for novices can become redundant or even detrimental for more experienced learners, as redundant information imposes unnecessary cognitive load on working memory [20]. Repeated exposure to an assembly task can therefore systematically alter how participants process instructional information, shifting the balance between guidance-dependent and schema-driven performance. As a result, differences between VCs may be masked or distorted in within-subject designs.
By assigning each participant to only one VC, the study ensures that observed differences in performance and experience can be attributed to the instructional design rather than learning or carryover effects. The study followed a mixed-methods approach using quantitative primary data collection. While the VC served as the independent variable with two levels (VC1 and VC2), four dependent variables were defined: assembly time, number of assembly errors, cognitive workload, and usability. All participants completed the same assembly scenario in identical step order, which allowed the assessment of complexity effects within the task but without re-exposing participants to multiple VCs.
3.1.1. Procedure
A total of 30 participants were randomly assigned to one of two VCs, resulting in 15 participants per AR VC. No target-group filtering was applied; therefore, participants with technical, craft-related, social science, or non-technical backgrounds were admitted. In the context of this study, non-expert or mixed-experience refers to participants who were not trained on the specific heat-pump subtask and whose domain expertise was not controlled by targeted recruitment. Before participation, all individuals were informed about risks associated with the AR HMD (Microsoft HoloLens 2; Microsoft Corporation, Redmond, WA, USA), including motion sickness, and provided written informed consent. For safety reasons, participants were screened for a history of epileptic conditions, as AR devices may trigger epileptic reactions. Prior experience with the Microsoft HoloLens 2 was assessed. Participants without prior experience completed the embedded Microsoft “Tips” tutorial, which introduced basic gestures and interactions. The duration of the tutorial was not recorded to prevent biases related to task familiarity. After fitting the Microsoft HoloLens 2 and confirming correct calibration, the study personnel launched the experimental application. Participants were instructed to read the initial AR text panel and start the assembly via the virtual start button. A protocol describing all instructions before the start of the experiment is provided in Appendix A. No verbal assistance was provided during the assembly. All participants completed the 10 steps independently. The system automatically recorded step-wise assembly time, while experimenters documented all assembly errors and verbal comments. After completing the task, the device was removed, and participants filled out a digital questionnaire. A description of the study procedure can be found in Table 1.
Table 1.
Study procedure. The table summarizes the three study phases and their main activities.
3.1.2. Measures
Assembly errors were defined as any deviation from the correct assembly result for the respective step, including incorrect component choice, incorrect orientation, placement at the wrong connection point, or any deviation that produced an invalid intermediate state. An error was coded at the step level whenever the participant produced such an incorrect intermediate state that required correction before a valid end state could be reached. Assembly time was automatically recorded per step by the AR application. Cognitive workload was measured using the unweighted version of the NASA–TLX [33]; all six subscales were analyzed individually without applying the original pairwise weighting procedure, and no global weighted composite score was computed. Usability was measured using the System Usability Scale (SUS) [34], and demographic as well as experience-based factors were assessed using a standardized pre-survey. The questionnaire also included an open-ended free-text item that allowed participants to provide qualitative feedback on their experience with the AR instructions. This item was used to capture additional user insights that were not covered by the structured quantitative scales, with particular attention to recurring themes related to visual interference and the spatial relationship between virtual overlays and the physical workspace. No pre-study stratified sampling was conducted to avoid influencing participant expectations. The complexity of each assembly step was derived using the method developed by Gattullo et al. [22], which decomposes each step into elemental information units. Each unit corresponds to one of six information types: identity, location, way-to, notification, order, and orientation. The sum of these elemental information units directly defines the step complexity score, such that each additional required information unit increases the score by one. In the present industrial assembly scenario, even the simplest steps required at least identity, location, and way-to information, and several also included orientation constraints. Very low scores (e.g., 1 or 2) would only occur for trivial operations that require, for instance, merely identifying a component without specifying where and how it should be manipulated, which did not occur in this task. As a result, all steps fell into the mid-to-upper range of the Gattullo scale (scores between 3 and 6), so that the index is used here primarily to differentiate between moderately and highly complex operations within a deliberately non-trivial task, rather than to span the full theoretical range from very simple to highly complex procedures. A detailed step-by-step decomposition is provided in Appendix B, Table A1.
3.1.3. Data Analysis
The collected data were analyzed using standard statistical methods: Group differences between VCs were evaluated using independent-samples t-tests. In addition, step-level logistic regression models were used to estimate the odds of committing an error as a function of VC and step, and Pearson’s r as well as Spearman’s were computed to relate step complexity to error counts and completion times. All analyses were performed with standard significance thresholds (). For assembly time, histograms were inspected and the group comparison was repeated using log-transformed completion times. The pattern of results was unchanged (Welch’s , ), and analyses are therefore reported on the original (untransformed) time scale for ease of interpretation.
To quantify the inferential limits imposed by the fixed sample size, a sensitivity power analysis for the primary between-subject comparisons (two independent groups, per condition, two-sided ) was conducted. The analysis determined the minimum detectable standardized mean difference (Cohen’s d) for conventional power levels (80% and 90%). This sensitivity analysis was used to inform the interpretation of non-significant group differences; no equivalence testing was performed. Resulting limitations are reported in Section 5.3 to contextualize null findings.
3.2. Assembly Scenario
The assembly task represented a real-world sub-process of installing a Vaillant heat-pump system. Participants assembled a drinking water expansion tank by completing 10 defined assembly steps. The scenario intentionally reflects a spatially constrained installation-like setting: wall-mounted connectors and the vessel geometry restrict approach angles and make correct orientation at the physical interfaces critical.
The experimental setup (Figure 2a) consisted of a 1.5 m × 1.2 m wooden board painted matte black to prevent reflections that may interfere with AR rendering. The board was mounted upright using aluminum profile supports. A real expansion vessel was fixed at the center. A threaded 3/8-inch connection at the top allowed for subsequent assembly operations. Two wall-mounted connectors were positioned left and right of the vessel to simulate integration into a plumbing system. A 20 cm × 20 cm high-contrast computer-generated fiducial quick response (QR) marker, visible in the upper left corner of Figure 2a, served as the global alignment target for spatial registration within the AR environment.
Figure 2.
Experimental setup and assembly components. (a) Experimental rig with wall panel, expansion vessel, and fiducial QR marker used for AR spatial registration. (b) Mechanical components mounted to the vessel and wall connectors during the assembly task. Numbers in (b) correspond to components (1)–(8) listed in the text.
A total of 10 plumbing components (Figure 2b) were used in the assembly scenario: (1) a three-way ball valve with cylindrical 3/8-inch internal threads on both sides; (2) a T-connector with three 3/8-inch internal threads; (3) two double nipples with cylindrical 3/8-inch external threads; (4) a 90° elbow with 3/8-inch external threads on both sides; (5) a 90° elbow with 3/8-inch internal and external threads; (6) a second 90° elbow with 3/8-inch external threads; (7) a 90° elbow with union nut and cylindrical 3/8-inch internal and external threads; and (8) two flexible hoses equipped with cylindrical 3/8-inch union nuts (length: 50 cm). The procedure comprised 10 sequential steps, including mounting the ball valve, pre-assembling the T-connector with the appropriate nipples and elbows, preparing wall connections, installing angle connectors, and attaching both flexible hoses to complete the inlet and outlet routing.
3.3. Visualization Concepts
Both AR VCs were developed in Unity (version 2021.3.30f1 LTS). The Universal Windows Platform (UWP) render pipeline was used, and Microsoft’s Mixed Reality Toolkit (MRTK) version 2.3 provided user interface (UI) components and interaction templates. OpenXR Toolkit version 1.8 enabled deployment to the HoloLens 2. Spatial registration was achieved using the Vuforia 10.15 software development kit (SDK) and an image-tracking target based on a custom high-contrast QR marker as seen in Figure 2a. In line with Laviola et al., redundant information was defined as multiple, functionally equivalent representations of the same information type (e.g., component identity or orientation) presented simultaneously in AR [8]. VC1 deliberately implemented such redundancy by combining animated CAD models, textual instructions, photographs, and first-person video for every step, so that different representational channels converged on the same target action. All videos (in VC1 and in the video-supported Steps 9 and 10 of VC2) were recorded in advance with the integrated HoloLens RGB camera from an egocentric expert perspective, played back in real time (1× speed) and presented as looping clips without temporal scaling. Because the underlying manipulation sequences differed between steps, clip durations varied moderately (approximately 12–18 s for Steps 1–8 and 28–30 s for the more complex Steps 9 and 10), but playback speed and looping characteristics were held constant across all steps and both VCs. VC2, in contrast, followed a minimal, complexity-adaptive strategy: for each step, only the information types identified by the decomposition in Table A1 were visualized, and usually with a single representational channel per type (e.g., an animated CAD model or an auxiliary arrow, but no additional photo or video). Thus, the two VCs differed primarily in the degree of representational redundancy rather than in the semantic content of the instructions (Figure 3).
Figure 3.
Instructional modalities across assembly steps for VC1 and VC2. Each cell indicates whether a modality is present for VC1 (upper-left triangle, blue), VC2 (lower-right triangle, orange), or absent (grey). The rightmost column (c) shows the complexity level per step.
VC1 followed the approach by Jasche et al., referred to as Concrete Augmented Reality Visualizations with Video (CAR+V), and presented all assembly steps using the same visualization structure, regardless of their complexity [25]. Accordingly, VC1 operationalized the core CAR+V design characteristics described by Jasche et al., namely CAD-based 3D component models placed at the mounting location, animated movement cues with a three-second dwell time and repeated loops, and the integration of expert-perspective photo/video material captured with the Microsoft HoloLens 2 RGB camera within a step-centered main panel including navigation controls [25]. Redundant information was deliberately included to maximize clarity. As shown in Figure 4 all instructions consisted of 3D CAD-based component models (7) showing the target position and animated movement path in combination with a circular rotational arrow indicating the tightening direction (8). Animations repeated after a three-second dwell time. A main panel (1) displayed step number (2), videos of the assembly step recorded from an expert’s perspective using the Microsoft HoloLens 2 RGB camera (6) and a background-free photograph of the required component (5). Navigation buttons (3) and (4) allowed stepwise progression.
Figure 4.
Visualization of assembly Step 8 with the redundant concept VC1. Numbered callouts indicate: (1) main panel, (2) assembly step number, (3) previous button, (4) next button, (5) component photo, (6) expert video, (7) CAD model, and (8) auxiliary circular arrow indicating the tightening direction.
VC2 followed the principle proposed by Laviola et al., which aims to minimize redundant information and adapt the visualization strategy to the information requirements and, by extension, step complexity (Table 2) [8]. Only the information types required per step (as determined by the Gattullo decomposition [22]) were visualized. In line with Laviola et al.’s minimal-AR authoring logic, only those AR signifiers necessary to close the remaining information gap were selected after considering what could already be conveyed by the real-world scene and component affordances at a task level (i.e., not individually adapted to user expertise) [8]. In this context, affordances refer to task-relevant information that can be directly perceived from the physical components and their spatial configuration without additional AR augmentation [35]. Accordingly, low-complexity steps used minimal overlays, whereas more complex steps included additional spatial cues, orientation indicators, or movement paths (Table 2).
Table 2.
AR visualizations selected based on assembly step complexity. The table lists the AR elements used for each assembly step in VC2.
Depending on the complexity of an assembly step VC2 includes several interface elements that are also present in VC1. In case of assembly Step 2 with complexity level 5, shown in Figure 5, these comprise panels taken from the MRTK sample collection (1), a header area (2) indicating the number of the current assembly step, navigation buttons for moving to the previous (3) or subsequent step (4), and background-free photographs of the required components (5), which are displayed at a larger size than in VC1. In addition to these shared elements, VC2 integrates a 3D vertical arrow (6) that indicates the required movement direction, as well as a circular rotational arrow (7) that visualizes the tightening direction. In contrast to VC1, VC2 does not use animated CAD models in Step 8. Instead, the animations are limited to the auxiliary arrows, which are displayed directly at the corresponding assembly location. In other steps, VC2 also employs CAD models where required (Table 2).
Figure 5.
Visualization of assembly Step 8 with the minimal, complexity-adaptive concept VC2. Numbered callouts indicate: (1) main panel, (2) assembly step number, (3) previous button, (4) next button, (5) component photo, (6) auxiliary vertical arrow indicating the movement direction, and (7) auxiliary circular arrow indicating the tightening direction.
4. Results
Section 4 reports the empirical results in a structured manner. It first summarizes sample characteristics to document baseline comparability Section 4.1, then presents objective performance outcomes (errors and time; Section 4.2), followed by subjective workload and usability ratings (Section 4.3), exploratory analyses addressing potential moderators and step complexity (Section 4.4), and a brief summary of findings (Section 4.5).
4.1. Sample Characteristics
The final sample consisted of unique participants, balanced equally between the two VCs ( per group). The cohort exhibited heterogeneous educational and professional backgrounds, consistent with the study’s inclusion criteria. Descriptive statistics regarding age, gender, technical background, and prior AR experience are summarized in Table 3. Group-wise comparisons of these baseline characteristics indicated no systematic differences between the two VCs, supporting the interpretation that observed performance differences are attributable to the visualization manipulation rather than pre-existing sample imbalances.
Table 3.
Sample characteristics by VC.
4.2. Objective Performance
Objective performance was evaluated in terms of assembly errors and total assembly time at the participant level (Table 4). Assembly errors were documented by the study personnel during the assembly procedure. Step-wise assembly time was automatically recorded by the AR application and aggregated to total assembly time per participant. Participant-level distributions of assembly errors and total assembly time are shown in Figure 6. VC1 yielded markedly fewer errors than VC2, , , . Thus, H1a was supported. This difference is also reflected in the first-time yield: 13 of 15 participants (86.7%) in the VC1 condition completed the assembly without any error, compared to 8 of 15 (53.3%) in the VC2 condition, , . To obtain a stepwise estimate of error risk, a logistic regression model was fitted at the level of individual assembly steps, with the binary error outcome (error vs. no error) as the dependent variable and VC and step number as predictors. The model showed that the odds of committing an error in a given step were markedly higher under VC2 than under VC1 (odds ratio (OR) = 6.45, 95% confidence interval (CI) [1.40, 29.81], ). Based on this model, the predicted error probability averaged across all 10 steps was approximately 1.3% per step for VC1 and 8.0% per step for VC2 (Figure 7). A closer inspection of the step-wise error distribution and the video recordings revealed that a large share of errors under VC2 clustered in Step 7 of the assembly (Figure 7a). However, when formally comparing error rates between VC1 and VC2 in Step 7 using Fisher’s exact test, the difference was not statistically reliable (VC1: 2/15 participants with an error; VC2: 3/15 participants; OR = 1.63, ). The observation that Step 7 is an error hotspot should therefore be interpreted descriptively and not as a statistically reliable difference between VC1 and VC2 in this specific step. Notably, the two errors observed under VC1 occurred exclusively in Step 7 of the assembly.
Table 4.
Objective performance by VC and step-level error risk.
Figure 6.
Objective performance by VC. (a) Total number of assembly errors per participant recorded during the assembly procedure. (b) Total assembly time in seconds, aggregated from step-wise times automatically logged by the AR application. Boxes show interquartile ranges, lines the median, whiskers 1.5 × IQR, and dots individual participants.
Figure 7.
Error risk across the assembly sequence. (a) Empirical error rates per assembly step and VC based on the recorded step-level errors. (b) Average model-based error probability per step derived from the step-level logistic regression model ().
Step 7 involves mounting a 90° elbow with external thread into the right wall connection with a specific end orientation and a sealing side facing the wall (cf. Table A1). In both VCs, the operation was supported by an animated product model of the elbow placed at the mounting position, including the screwing direction. In VC1, this animation was supplemented by a photograph of the real component and a first-person in situ video demonstrating the assembly step. Inspection of the step-wise error distribution showed that Step 7 constituted an error hotspot in both conditions. Video analysis further revealed that, during this step, the animated product model partially overlapped with the real connection point in both concepts, intermittently obscuring visual access to the mounting interface. This observation is consistent with participants’ qualitative feedback (see Supplementary Materials): 10 out of 30 participants reported that projected AR elements partially obscured critical areas of the physical workspace (e.g., threads or connection points), which they perceived as hindering precise execution of the assembly steps. An additional descriptive pattern emerged when inspecting the VC2 step-level error distribution (see Appendix C, Figure A1a) in relation to the modality configuration (see Figure 3). In VC2, the only steps presented as video-only demonstrations (Steps 9 and 10; complexity level 6) were error-free across all participants (0 errors across 30 step-level observations), whereas all VC2 errors occurred in the remaining eight non-video steps (Steps 1–8), where at least one error was observed in 11 of 120 step-level observations (). This observation is descriptive and confounded with step identity and sequence position, and it also coincides with a broader modality change (video-only vs. overlay-based visualizations), which may reduce occlusion and visual interference at the workspace. Therefore, the data do not allow attributing the absence of errors in Steps 9 and 10 to the video modality per se. Nevertheless, the pattern motivates the hypothesis that egocentric video demonstrations can serve as a robust high-bandwidth representation for complex operations and should be tested in future factorial or ablation designs.
Total assembly time showed considerable between-participant variability, but there was no evidence for a systematic difference between VC1 and VC2, Welch’s , (Table 4). Because the raw times were mildly right-skewed, the analysis was repeated on log-transformed completion times; the result remained non-significant, , , indicating that the inference is robust to reasonable deviations from normality. Accordingly, there was no evidence that the minimal, complexity-adaptive strategy (VC2) reduced completion time relative to the redundant strategy (VC1); therefore, H1b was not supported.
Overall, these results complete the answer to RQ1: the strategies differed statistically significantly in error outcomes, but not statistically significantly in total assembly time in the present sample and task context.
4.3. Subjective Workload and Usability
Subjective workload was assessed using the unweighted version of the NASA–TLX (i.e., based on the six raw subscale scores without pairwise weighting or aggregation into a global weighted index), and perceived usability using the SUS. Overall, the assembly task was experienced as moderately demanding across both VCs, and both VCs received usability ratings in the range typically interpreted as “good” usability (Table 5).
Table 5.
Subjective workload (NASA–TLX subscales) and usability (SUS) by VC.
Descriptive differences between the NASA–TLX dimensions were small and unsystematic. VC2 showed slightly higher ratings on mental demand and effort, whereas physical and temporal demand were rated similarly across conditions. However, Welch-type independent-samples t-tests did not indicate statistically reliable differences on any workload subscale at the conventional significance threshold of . SUS scores were descriptively higher for VC2 than for VC1 (83.83 vs. 79.50), but this difference was not statistically significant, , , . Exploratory linear regression analyses with mental demand and SUS score as dependent variables and VC, number of assembly errors, and total assembly time as predictors suggested that subjective ratings were primarily related to performance outcomes: participants who made fewer errors and completed the task more quickly tended to report lower mental demand and higher usability. The unique contribution of VCs, over and above these performance indicators, was small and did not reach conventional levels of statistical significance. Accordingly, H2a and H2b were not supported.
Taken together, these results answer RQ2: VC1 and VC2 did not differ in a statistically reliable manner with respect to subjective workload (NASA–TLX) or perceived usability (SUS) in the present sample and task context.
4.4. Exploratory Analyses
Given the heterogeneous backgrounds of the participants, exploratory analyses were conducted to examine whether the advantage of VC1 depended on individual characteristics. Logistic regression models with interaction terms between VCs and technical background, and between VCs and prior AR experience, were estimated at the participant level. Across all models, the main effect of VCs remained in the expected direction, with VC2 being associated with a higher probability of making at least one error, whereas none of the interaction terms reached statistical significance. Supplementary Fisher’s exact tests within the subgroups yielded a similar picture, with no consistent evidence that the relative performance of the concepts differed systematically between technically experienced and non-experienced participants or between AR-experienced and AR-naïve users. Finally, error patterns were considered in relation to the predefined step complexity derived from the Gattullo et al. [22] method. Descriptively, one of the more complex assembly steps (Step 7) showed a pronounced peak in error rates (VC1: 2 errors; VC2: 3 errors), whereas other steps with similarly high complexity remained largely error-free. When correlating the complexity index with the number of errors per step across the 10 assembly steps, neither Spearman’s rank correlation nor Pearson’s product–moment correlation indicated a statistically reliable association between step complexity and error frequency (, ; , ). Accordingly, H3a was not supported. When relating step complexity to average completion time per step (collapsed across all participants and both VCs), however, a clear positive association emerged: more complex steps tended to take longer to complete, as shown in Appendix C, Figure A1b (Pearson’s , ; Spearman’s , ). Thus, H3b was supported by the Pearson correlation analysis, while the rank-based association did not reach statistical significance.
In sum, these exploratory results provide an answer to RQ3: step complexity was meaningfully associated with temporal demands (step completion time) but did not translate into systematically higher error frequency in the present task context. Importantly, in the step-level logistic regression model (), VC2 still showed higher error odds than VC1 after controlling for step number. This indicates that the higher error risk under VC2 cannot be explained by where the steps appear in the sequence.
4.5. Summary of Findings
In summary, the results show a clear dissociation between objective process reliability and subjective user experience. VC1 led to substantially fewer assembly errors than VC2, without a corresponding disadvantage in overall assembly time. A stepwise logistic regression analysis demonstrated that the odds of committing an error in a given assembly step were more than six times higher under VC2 than under VC1 (OR = 6.45, 95% CI [1.40, 29.81]), corresponding to an increase in the average per-step error probability from about 1.3% (VC1) to 8.0% (VC2). This reliability advantage was observed across the task sequence and did not appear to be restricted to specific participant subgroups, while average completion times differed by only around 20 s and were statistically indistinguishable between conditions.
By contrast, subjective workload and usability ratings were broadly similar between concepts, with only small, non-significant descriptive advantages for VC2 on some measures. Participants generally rated both AR instruction concepts as usable and experienced the assembly task as moderately demanding, with perceived workload and usability strongly linked to how successfully they completed the task. From a process perspective, these findings indicate that, for mixed-experience or first-time users in a quality-critical assembly context similar to ours, VC1 offers a substantially more favorable trade-off between reliability and efficiency: it reduces error risk by a factor of more than six without incurring a meaningful penalty in assembly time, whereas the potential subjective benefits of VC2 are modest and not sufficient to compensate for its higher error risk in a quality-critical assembly context.
5. Discussion
The present study set out to systematically compare a redundant, multimodal AR VC (VC1) with a minimal, complexity-adaptive AR VC (VC2) for a real-world assembly task and to examine how step complexity relates to errors and assembly time. Overall, the pattern of results provides clear support for H1a and H3b, while H1b, H2a, H2b, and H3a were not supported. In the remainder of this section, the main findings are first interpreted in relation to the Hs and RQs (Section 5.1). Implications for AR instruction design in
manual assembly are then derived (Section 5.2), followed by a discussion of methodological considerations and limitations that delimit the scope of inference (Section 5.3). Finally, directions for future research are outlined (Section 5.4).
5.1. Interpretation of the Main Findings
Consistent with H1a, in the mixed-experience sample performing the procedure for the first time, the redundant concept (VC1) led to substantially fewer assembly errors than the minimal concept (VC2). This advantage was robust across multiple indicators: participants using VC1 committed fewer errors on average, achieved a higher first-time yield, and showed a markedly lower model-based error probability at the step level. From an industrial trainingonboarding and first-time perspective, this reliability benefit is particularly relevant, as rework, scrap, and quality deviations often dominate the cost structure of manual assembly processes. In contrast, total assembly time did not differ significantly between concepts, , , although VC2 showed a small, non-significant trend toward shorter completion times (Table 4; Figure 6). From a quality-management perspective, this lack of a clear time advantage for VC2, together with its substantially increased error risk, suggests that the redundant concept provides a more favorable trade-off between speed and reliability. The findings for subjective measures did not support H2a or H2b. Minimal visualizations neither reduced perceived workload nor clearly enhanced usability. NASA–TLX and SUS scores were broadly comparable between conditions, and regression analyses indicated that subjective ratings were driven primarily by actual performance outcomes (errors and time) rather than by the VC as such. In other words, participants appeared to evaluate the AR system largely based on how successful they felt in completing the task, not on whether information was presented redundantly or minimally. This dissociation between objective reliability and subjective experience underlines the importance of including hard performance metrics in the evaluation of AR support systems, as user preferences alone may not reliably indicate the safer or more robust design.
With regard to step complexity, H3a was not supported: the predefined complexity index did not show a significant association with error frequency across steps. This pattern can be interpreted by distinguishing between temporal and cognitive demand. The step complexity measure operationalized cognitive demand as the number of required information types based on the decomposition proposed by Gattullo et al. [22], which is more likely to be reflected in longer completion times. In contrast, perceptual and spatial risk at the physical interface (e.g., limited visibility, tight spatial constraints, or occlusion and misalignment caused by AR overlays) is not explicitly represented by that information-type count and may therefore better explain why errors can cluster in specific steps despite similar complexity scores, highlighting that complexity-based authoring alone is insufficient to prevent errors when overlays interfere with the visibility of task-relevant physical features at the workspace. Nevertheless, Step 7 exhibited a distinct error peak in both VCs, indicating that this step posed specific challenges that were not captured by the global complexity metric. Step 7 was classified as medium complex (complexity level 5) due to the amount and nature of information required, including component identity, installation location, final orientation, and the constraint that the side with the sealing rings must face the wall (see Table A1). Importantly, the common element across both concepts was the animated product model of the 90° elbow (male thread) shown at the mounting position, including the screwing direction. Analysis of the assembly recordings suggests that, during Step 7, this AR animation partially overlapped with the real connection point and intermittently occluded critical visual cues related to orientation and proper seating. The interpretation of Step 7 as an occlusion-driven error hotspot is supported by qualitative user feedback (see Supplementary Materials). Multiple participants explicitly stated that AR projections or animations partially covered relevant physical features, such as threads or insertion points, making it difficult to perceive the correct mounting position. This suggests that visual interference was not merely an analytical inference based on video recordings, but a user-experienced phenomenon affecting task execution. The recurrence of this theme across multiple participants suggests that the observed occlusion effects are unlikely to reflect isolated usability complaints, but instead point toward a recurring design-related issue. Given the subtle and partly hidden constraints of the operation, such visual interference represents a plausible mechanism for the observed concentration of errors. While VC1 supplemented the animation with a photograph of the real component and a first-person video demonstrating the step, these additional references appear to have only partially mitigated the issue, consistent with the slightly lower error count in VC1 compared to VC2. Overall, the data suggest that, for steps requiring precise spatial interpretation at the physical interface, the placement and visual dominance of AR overlays can be a critical determinant of performance, particularly when overlays risk obstructing the workspace.
However, in line with H3b, step complexity exhibited a strong positive correlation with average completion time. Participants slowed down on more complex steps, independent of the VC, which suggests that the complexity metric captures temporal and cognitive demands rather than directly predicting where errors will occur. Together with the strong main effect of VC on error probability, this pattern indicates that instructional design played a more decisive role for process reliability than inherent task complexity.
Collectively, these findings answer RQ0: in this first-time, spatially constrained assembly task, the redundant multimodal instruction strategy (VC1) was overall more effective than the minimal, complexity-adaptive strategy (VC2), because it significantly reduced assembly errors while the minimal strategy did not yield statistically significant improvements in assembly time, cognitive workload, or usability. Accordingly, under the present task constraints and participant characteristics, the primary benefit of redundancy was increased process reliability rather than faster execution or improved subjective experience.
5.2. Implications for AR Instruction Design in Manual Assembly
The comparison of the two concepts has several implications for the design of AR-based assembly assistance. First, the results challenge the intuitive assumption that minimal visualizations are always preferable because they avoid information overload. In this study, reducing redundancy did not lead to measurable gains in efficiency or workload, but it did compromise error performance. Importantly, this result should be interpreted as evidence for the particular redundancy configuration implemented in VC1 (i.e., the concurrent combination of spatial 3D overlays/animations with complementary media such as component photographs and first-person video) in the present heat-pump assembly task and a mixed-experience, largely non-expert sample. It does not imply that adding more information is universally beneficial. Redundancy can be ineffective or even detrimental when representations are poorly aligned, when tasks are simple, or when users are highly experienced (expertise reversal). Accordingly, the conclusions are restricted to representational redundancy as operationalized here, not to redundancy as a general design principle. Following distinctions commonly made in multimedia learning frameworks such as that of Clark and Mayer [16], redundancy in the present study was operationalized primarily as representational redundancy: VC1 provided multiple, functionally equivalent representations of the same assembly information (e.g., combining 3D CAD overlays, text, photographs, and in situ video for the same operation), whereas VC2 reduced the number of concurrent representations while keeping the underlying semantic content largely constant. This pattern suggests that, at least for non-trivial assembly tasks and mixed-experience user groups, such representational redundancy may function as a safety buffer rather than as unnecessary visual clutter. Second, the findings highlight the importance of distinguishing between different kinds of redundancy. In the present operationalisation, redundancy did not refer to adding new semantic content (informational redundancy), but offering several partially overlapping representations of the same information (i.e., representational redundancy). The comparison between two VCs suggests that such redundancy is especially valuable when operations involve non-obvious orientations or concealed functional features. In terms of CLT [17,18,19], these additional representations can be interpreted as supporting germane load, by facilitating the construction of appropriate mental models of critical spatial relations, rather than merely increasing extraneous load.
VC1 systematically combined multiple representational channels (3D CAD overlays, movement animations, text, and video demonstrations) that converged on the same target action. Such representational redundancy may support comprehension and error checking by providing mutually reinforcing cues and by accommodating inter-individual differences in how users process visual and verbal information. By contrast, VC2 selectively visualized only those information types deemed necessary by the complexity analysis. This design can be interpreted as an attempt to minimize potential extraneous load by reducing visual density and avoiding overlays that are not strictly required from a task-analytic perspective. However, the empirical data show that removing cues that appear redundant from a designer’s perspective can still eliminate valuable scaffolding for users, particularly when they are unfamiliar with the product or with AR-based instructions. In other words, the same design decision that reduces formal representational redundancy may also reduce germane load that is functionally important for error prevention. Beyond the concept-level comparison, the VC2 step-level error pattern suggests a potentially important role of temporal-dynamic procedural information. In VC2, the two steps implemented as video-only demonstrations (Steps 9 and 10) were error-free, while all VC2 errors occurred in overlay-based non-video steps. This evidence is correlational and confounded with step identity, step order, and the fact that the video steps also removed spatial overlays that may cause occlusion. However, from a multimedia learning perspective, egocentric video can convey action dynamics (movement sequences, hand positioning, and timing) that are difficult to communicate with static product models or photographs alone, and it may therefore function as a robust single-modality representation for certain complex assembly operations. Prior AR assembly work likewise suggests benefits of video and animated guidance for procedural execution, although modality-specific effects require controlled isolation [10,26].
Third, the dissociation between objective and subjective outcomes has practical consequences for industrial introduction projects. Because both concepts were rated as similarly usable, decision-makers who rely purely on questionnaire-based usability data might be tempted to prefer the leaner minimal concept, assuming that it is good enough from the users’ perspective and more efficient to implement. Yet, the observed six-fold increase in step-wise error odds under VC2 argues strongly against such a choice in quality-critical contexts. From a Cognitive Load perspective, this pattern underscores that users’ subjective impressions of workload and usability may not reliably reflect the balance between extraneous and germane load induced by different visualization strategies. AR design guidelines for assembly should therefore emphasize that perceived usability must be interpreted in conjunction with hard performance indicators such as error rates and rework, rather than in isolation.
Finally, the step-complexity results suggest a nuanced role for complexity-driven adaptation. The strong positive association between step complexity and completion time suggests that operators spend more time on steps with higher information-processing demands. From a cognitive load theory perspective, step complexity as operationalized in this study can be understood as a proxy for higher element interactivity and thus higher intrinsic load, which increases the amount of processing required in working memory and can plausibly translate into longer completion times [18,19]. Adaptive AR systems could leverage this behaviour by providing more detailed or more redundant guidance specifically in those phases where users already tend to slow down, thereby preserving reliability while keeping overall information volume manageable across the task. At the same time, the present study shows that complexity-based reduction of cues must be validated carefully to ensure that it does not unintentionally remove elements that support germane load and, as a consequence, degrade process reliability in ways that are not immediately apparent from subjective ratings alone.
5.3. Methodological Considerations and Limitations
First, the sample size of participants (15 per VC) is typical for controlled AR user studies, but it limits the statistical power of the between-subject comparisons, particularly for small to medium effects. To quantify this limitation, a sensitivity analysis for the between-subject comparisons (two independent groups, per condition, two-sided ) indicates that the design achieves 80% power only for large standardized mean differences (Cohen’s ; 90% power at ). Accordingly, the study was sufficiently powered to detect large effects but underpowered for small-to-medium differences. Therefore, non-significant results for assembly time, workload, and usability should not be interpreted as evidence of equivalence between the concepts, as no formal equivalence testing was performed. Instead, these null findings need to be viewed as inconclusive and primarily as a motivation for replication studies with larger samples. Second, the study used a single assembly scenario derived from a specific industrial context. While this increases ecological validity compared to purely laboratory tasks, it also constrains generalizability. Therefore, general validity across assembly tasks cannot be claimed; instead, the findings should be interpreted as evidence for first-time, non-trivial, spatially constrained assembly tasks where orientation and precise interface perception are required. Tasks with different spatial characteristics (e.g., open bench-top layouts, larger clearances, different reachability/occlusion conditions) may yield different trade-offs between redundant and minimal AR guidance. Future work should test the concepts in at least one additional assembly scenario with different spatial characteristics to probe the robustness of the observed effects. Different products, tool requirements, or spatial constraints might influence the relative benefits of redundant versus minimal visualization strategies. Future work should test whether the observed reliability advantage of redundant AR instructions replicates across other assembly domains, including tasks with higher physical demands or more dynamic environments. Third, the participant group comprised non-expert users with heterogeneous backgrounds rather than trained installers. This choice reflects many realistic AR deployment scenarios, such as training, onboarding, or support for non-specialist staff. Given the expertise reversal effect, it should be tested whether the present redundancy configuration remains beneficial, neutral, or detrimental for expert installers and repeated task executions [20]. Participants did not receive structured technical training on the specific assembly procedure beyond the standardized study instructions and, where necessary, the generic HoloLens tutorial; no minimum level of domain-specific expertise was enforced. While this mirrors typical first-time or onboarding use, it may have increased inter-individual variability and slightly reduced comparability between participants. Follow-up studies should therefore explicitly compare novice and expert populations and could include a brief standardized pre-training phase to examine potential expertise-related differences in optimal visualization density under more controlled baseline conditions. Alternatively, future iterations could implement stratified sampling or stratified (blocked) random assignment based on technical background (and/or prior domain experience) to better balance baseline expertise across conditions without introducing additional task training. Fourth, the study employed a between-subject design to avoid learning and carry-over effects between VCs. While this was appropriate given the assembly task, it precluded within-subject comparisons of perceived differences between concepts. Carefully designed repeated-measures studies, possibly using counterbalanced task variants, could complement the present findings by capturing more fine-grained subjective preferences and adaptation processes over time. Finally, the measures of step complexity and visualization adaptation were based on one specific decomposition method and a particular operationalization of minimalism. Alternative complexity models or adaptive rules might produce different trade-offs between redundancy and parsimony. The present results should therefore be viewed as evidence about one concrete implementation of complexity-based minimal visualization, not as a general refutation of the concept. Finally, modality-specific effects (e.g., video) cannot be isolated in the present design because VC2 used video only in two steps and VC1 differed from VC2 in multiple concurrent modalities; thus, any video-related interpretation remains hypothesis-generating. Therefore, the present evidence supports the VC1 bundle relative to the VC2 bundle in this specific task context, rather than supporting redundancy as a universal principle. In particular, VC1 was associated with lower error risk in the present sample and scenario, but the study design does not allow attributing this advantage to any single representational element. More generally, the most effective degree and type of redundancy may depend on boundary conditions such as user expertise, task demands (e.g., orientation vs. simple placement), and the quality of spatial registration and visual alignment.
5.4. Directions for Future Research
Building on these findings, several avenues for future research emerge. Future work should disentangle which components of representational redundancy drive performance gains by using ablation or factorial designs (e.g., systematically adding/removing video, photo, text, and animation while keeping semantic content constant). In addition, interaction and attention measures (e.g., log data on video viewing, dwell time on panels, or gaze-based attention to overlays) would help identify whether benefits arise from specific modalities, their combinations, or from task-dependent allocation of attention. One important direction is to translate such findings into design heuristics that specify when and for whom redundancy is beneficial (e.g., novices vs. experts, identity vs. orientation subtasks), rather than treating redundancy as uniformly helpful or harmful. This would allow the derivation of more fine-grained design heuristics than a simple “redundant versus minimal” dichotomy. Another promising line of work is the development of adaptive AR systems that dynamically adjust visualization density based on real-time indicators of user state and performance (e.g., error patterns, completion times, gaze behaviour). Such systems could provide richer guidance when difficulties arise and gradually reduce support as users become more proficient, potentially combining the robustness benefits of redundant instructions with the efficiency of minimal overlays. Further research should also explore long-term usage scenarios. The present experiment focused on first-time performance; however, in industrial practice, AR assistance is often used repeatedly. Longitudinal studies could investigate how different visualization strategies affect learning, retention, and eventual independence from AR support. It may well be that redundant visualizations are especially beneficial in early learning phases, whereas minimal overlays become preferable once workers have internalized the procedure.
Lastly, integrating qualitative data—such as think-aloud protocols or in-depth interviews—with quantitative performance metrics could provide deeper insights into how operators interpret and appropriate different AR visualizations. Understanding where users feel over- or under-supported, and how they reconcile conflicting cues, would help refine both the theoretical models of AR information design and their practical implementations.
6. Conclusions
The present study provides empirical evidence that the design of AR visualizations has a substantial impact on the reliability of manual assembly processes. Across all analyses, the redundant concept (VC1) consistently outperformed the minimal, complexity-adaptive concept (VC2) in terms of error prevention, thereby supporting H1a. This finding indicates that, in the present experiment, the specific redundant, multimodal configuration implemented in VC1 reduced assembly errors compared to the minimal, complexity-adaptive configuration (VC2), thereby improving process reliability in this task context. Importantly, this should not be interpreted as evidence that redundancy is universally beneficial; its effects may depend on task characteristics, alignment of representations, and user expertise. In contrast, no significant benefits of minimal visualizations were observed for assembly time, cognitive workload, or usability (H1b–H2b). These results indicate that reducing information in an effort to avoid overload does not automatically translate into greater efficiency or a more favorable user experience. From the perspective of industrial deployment, they also suggest that accepting a somewhat higher initial authoring effort for robust, redundantly designed AR instructions may be more economical in the long run than relying on lean minimal concepts that increase the risk of rework, scrap, and additional support. Beyond the empirical findings, the study provides an interdisciplinary bridge between learning-science theory, HCI evaluation, and industrial AR authoring practice. Regarding task characteristics, step complexity showed no measurable relationship with error rates (H3a), but it was strongly associated with increased completion time (H3b). This pattern suggests that operators naturally slow down on complex steps—possibly as a self-regulatory mechanism—while the occurrence of errors appears to depend more on instructional design than on inherent task complexity. For scalable AR roll-outs across products and variants, this implies that complexity models can be used to target additional guidance specifically at those steps where users already invest more time, rather than uniformly increasing information density throughout the procedure. Taken together, the findings suggest that, in quality-critical scenarios with mixed-experience, first-time users performing unfamiliar, spatially constrained assemblies, AR instruction design should prioritize reliability over strict minimalism. While complexity-based adaptation remains a promising approach in principle, the present results demonstrate that removing cues deemed redundant from a designer’s perspective can unintentionally degrade performance. Effective AR guidance must therefore balance informational parsimony with sufficient scaffolding to support accurate execution. In practical terms, scalable industrial use will likely depend on authoring methods and toolchains that allow such robust, redundantly designed visualization patterns to be reused, parameterized, and adapted across different assembly contexts, rather than being crafted ad hoc for each individual task.
Future work should refine this balance by dissecting which types of redundancy are beneficial, how adaptive systems can respond dynamically to user needs, and how visualization strategies influence performance and learning over time. By advancing these insights, the field can move toward robust, evidence-based design guidelines that enhance both the usability and the operational safety of AR-supported assembly, while remaining compatible with the scalability requirements of industrial deployment.
Supplementary Materials
The following supporting information can be downloaded at: https://www.mdpi.com/article/10.3390/virtualworlds5010014/s1. File S1: Redundant or Minimal MDPI Supplementary Materials Data Collection DE; File S2: Redundant or Minimal MDPI Supplementary Materials Data Collection EN; File S3: data_analysis_components (.zip).
Author Contributions
Conceptualization, Y.K.; methodology, Y.K. and M.M.; software, M.M.; validation, Y.K., M.M. and L.P.M.M.; formal analysis, L.P.M.M. and Y.K.; investigation, M.M.; resources, A.R.; data curation, Y.K., M.M. and L.P.M.M.; writing–original draft preparation, Y.K. and L.P.M.M.; writing–review and editing, Y.K., L.P.M.M., E.-M.G. and A.R.; visualization, Y.K., M.M. and L.P.M.M.; supervision, Y.K., E.-M.G. and A.R.; project administration, Y.K., E.-M.G. and A.R.; funding acquisition, A.R., Y.K. and M.M. All authors have read and agreed to the published version of the manuscript.
Funding
This research was funded by the German Federal Ministry for Economic Affairs and Climate Action (BMWK) through the projects Mittelstand-Digital Zentrum Rheinland grant number 01MF21010A and easyARguide grant number 01MF21010A. The APC was funded by the German Federal Ministry of Labour and Social Affairs (BMAS) through the project KI-basierte AR-Anleitungen (KIARA) grant number CI-1-0008.
Institutional Review Board Statement
Ethical review and approval were waived for this study because it involved a non-interventional user experiment with adult volunteers, posed no foreseeable physical or psychological risk beyond everyday technology use, and did not involve the collection of personal or sensitive data. All data were fully anonymized at the moment of collection. The study was conducted in accordance with the principles of the Declaration of Helsinki. Therefore, ethical review and approval were exempted by the Research Ethics Committee of TH Köln (application number: THK-2026-0002; date of approval: 30 January 2026).
Informed Consent Statement
Written informed consent was obtained from all participants prior to the study. Participants were informed about the study purpose, procedure, duration, and their right to withdraw at any time without consequences. All risks associated with the use of the Microsoft HoloLens 2—such as susceptibility to motion sickness, visual discomfort, epileptic sensitivity to light patterns, interference with medical devices, and other safety considerations—were clearly communicated. Only adults aged 18 years or older were permitted to participate. All data were recorded in fully anonymized form, preventing any direct or indirect identification of individuals.
Data Availability Statement
The data collected in this study were anonymized immediately upon recording and stored on secure servers of the Technische Hochschule Köln. Due to irreversible anonymization, data cannot be linked to individual participants. Anonymized datasets are available from the corresponding author upon reasonable request.
Acknowledgments
The authors thank Carla Sophia Frohn (née Jakobowsky) for her methodological support during the development of the study design and her advice on statistical analysis. We also acknowledge Jan-Niklas Terschüren for his assistance in the development of the AR application in Unity, and Robert Steinbüchel for his contributions to the design of the experimental setup. Furthermore, we thank the members of the Cologne Cobots Lab for their helpful discussions and general support throughout the project.
Conflicts of Interest
The authors declare no conflicts of interest.
Abbreviations
The following abbreviations are used in this manuscript:
| AR | augmented reality |
| CAD | computer aided design |
| CAR+V | Concrete Augmented Reality Visualizations with Video |
| CI | confidence interval |
| CLT | cognitive load theory |
| df | degrees of freedom |
| EFL | English as a Foreign Language |
| HCI | human–computer interaction |
| HMD | head-mounted display |
| MRTK | Mixed Reality Toolkit |
| NASA–TLX | National Aeronautics and Space Administration Task Load Index |
| OR | odds ratio |
| QR | quick response |
| RQ | research question |
| SD | standard deviation |
| SDK | software development kit |
| SUS | system usability scale |
| UI | user interface |
| UWP | Universal Windows Platform |
| VC | visualization concept |
| VR | virtual reality |
Appendix A. Experimental Protocol
This appendix provides the protocol used for instructing participants before the experiment and recording their performance during the assembly task.
Instructions Provided to Participants Before the Start of the Experiment
- Motion sickness may occur; please inform the experimenter immediately if you experience any symptoms.
- Have you previously worked with an AR headset?
- Are you familiar with the functions of the HoloLens 2? If required, the “Tips” app can be opened for clarification.
- Regarding the assembly task:
- –
- The procedure represents a subprocess of a heat pump installation.
- –
- The expansion vessel in front of you must be connected to the wall-mounted plumbing lines.
- –
- No leak test will be performed.
- –
- The sealing rings serve both realism and simplify disassembly after the experiment.
- –
- Therefore, please avoid overtightening the threaded connections.
- –
- The components to be assembled will be briefly introduced by the experimenter.
- A short explanation of the user interface will be provided.
- The Next and Back buttons will be explained.
- If the virtual objects appear misaligned, please look at the QR marker again to re-trigger image tracking.
- If visualization issues occur during assembly, please report them immediately.
- When you feel ready, please begin by pressing the Start button.
Appendix B. Experimental Setup
Appendix B provides additional information for replicating the study procedures. It includes a comprehensive overview of all assembly steps, including their elemental information units.
Table A1.
Information requirements and complexity levels of the assembly steps. The table lists required information types per step based on the Gattullo decomposition.
Appendix C. Figure
Figure A1.
Step-level performance by assembly step for VC1 and VC2. (a) Error proportions by assembly step, expressed as . (b) Mean completion time by assembly step in seconds. The shaded area highlights Steps 9 and 10, the only steps for which no errors occurred in either VC1 or VC2.
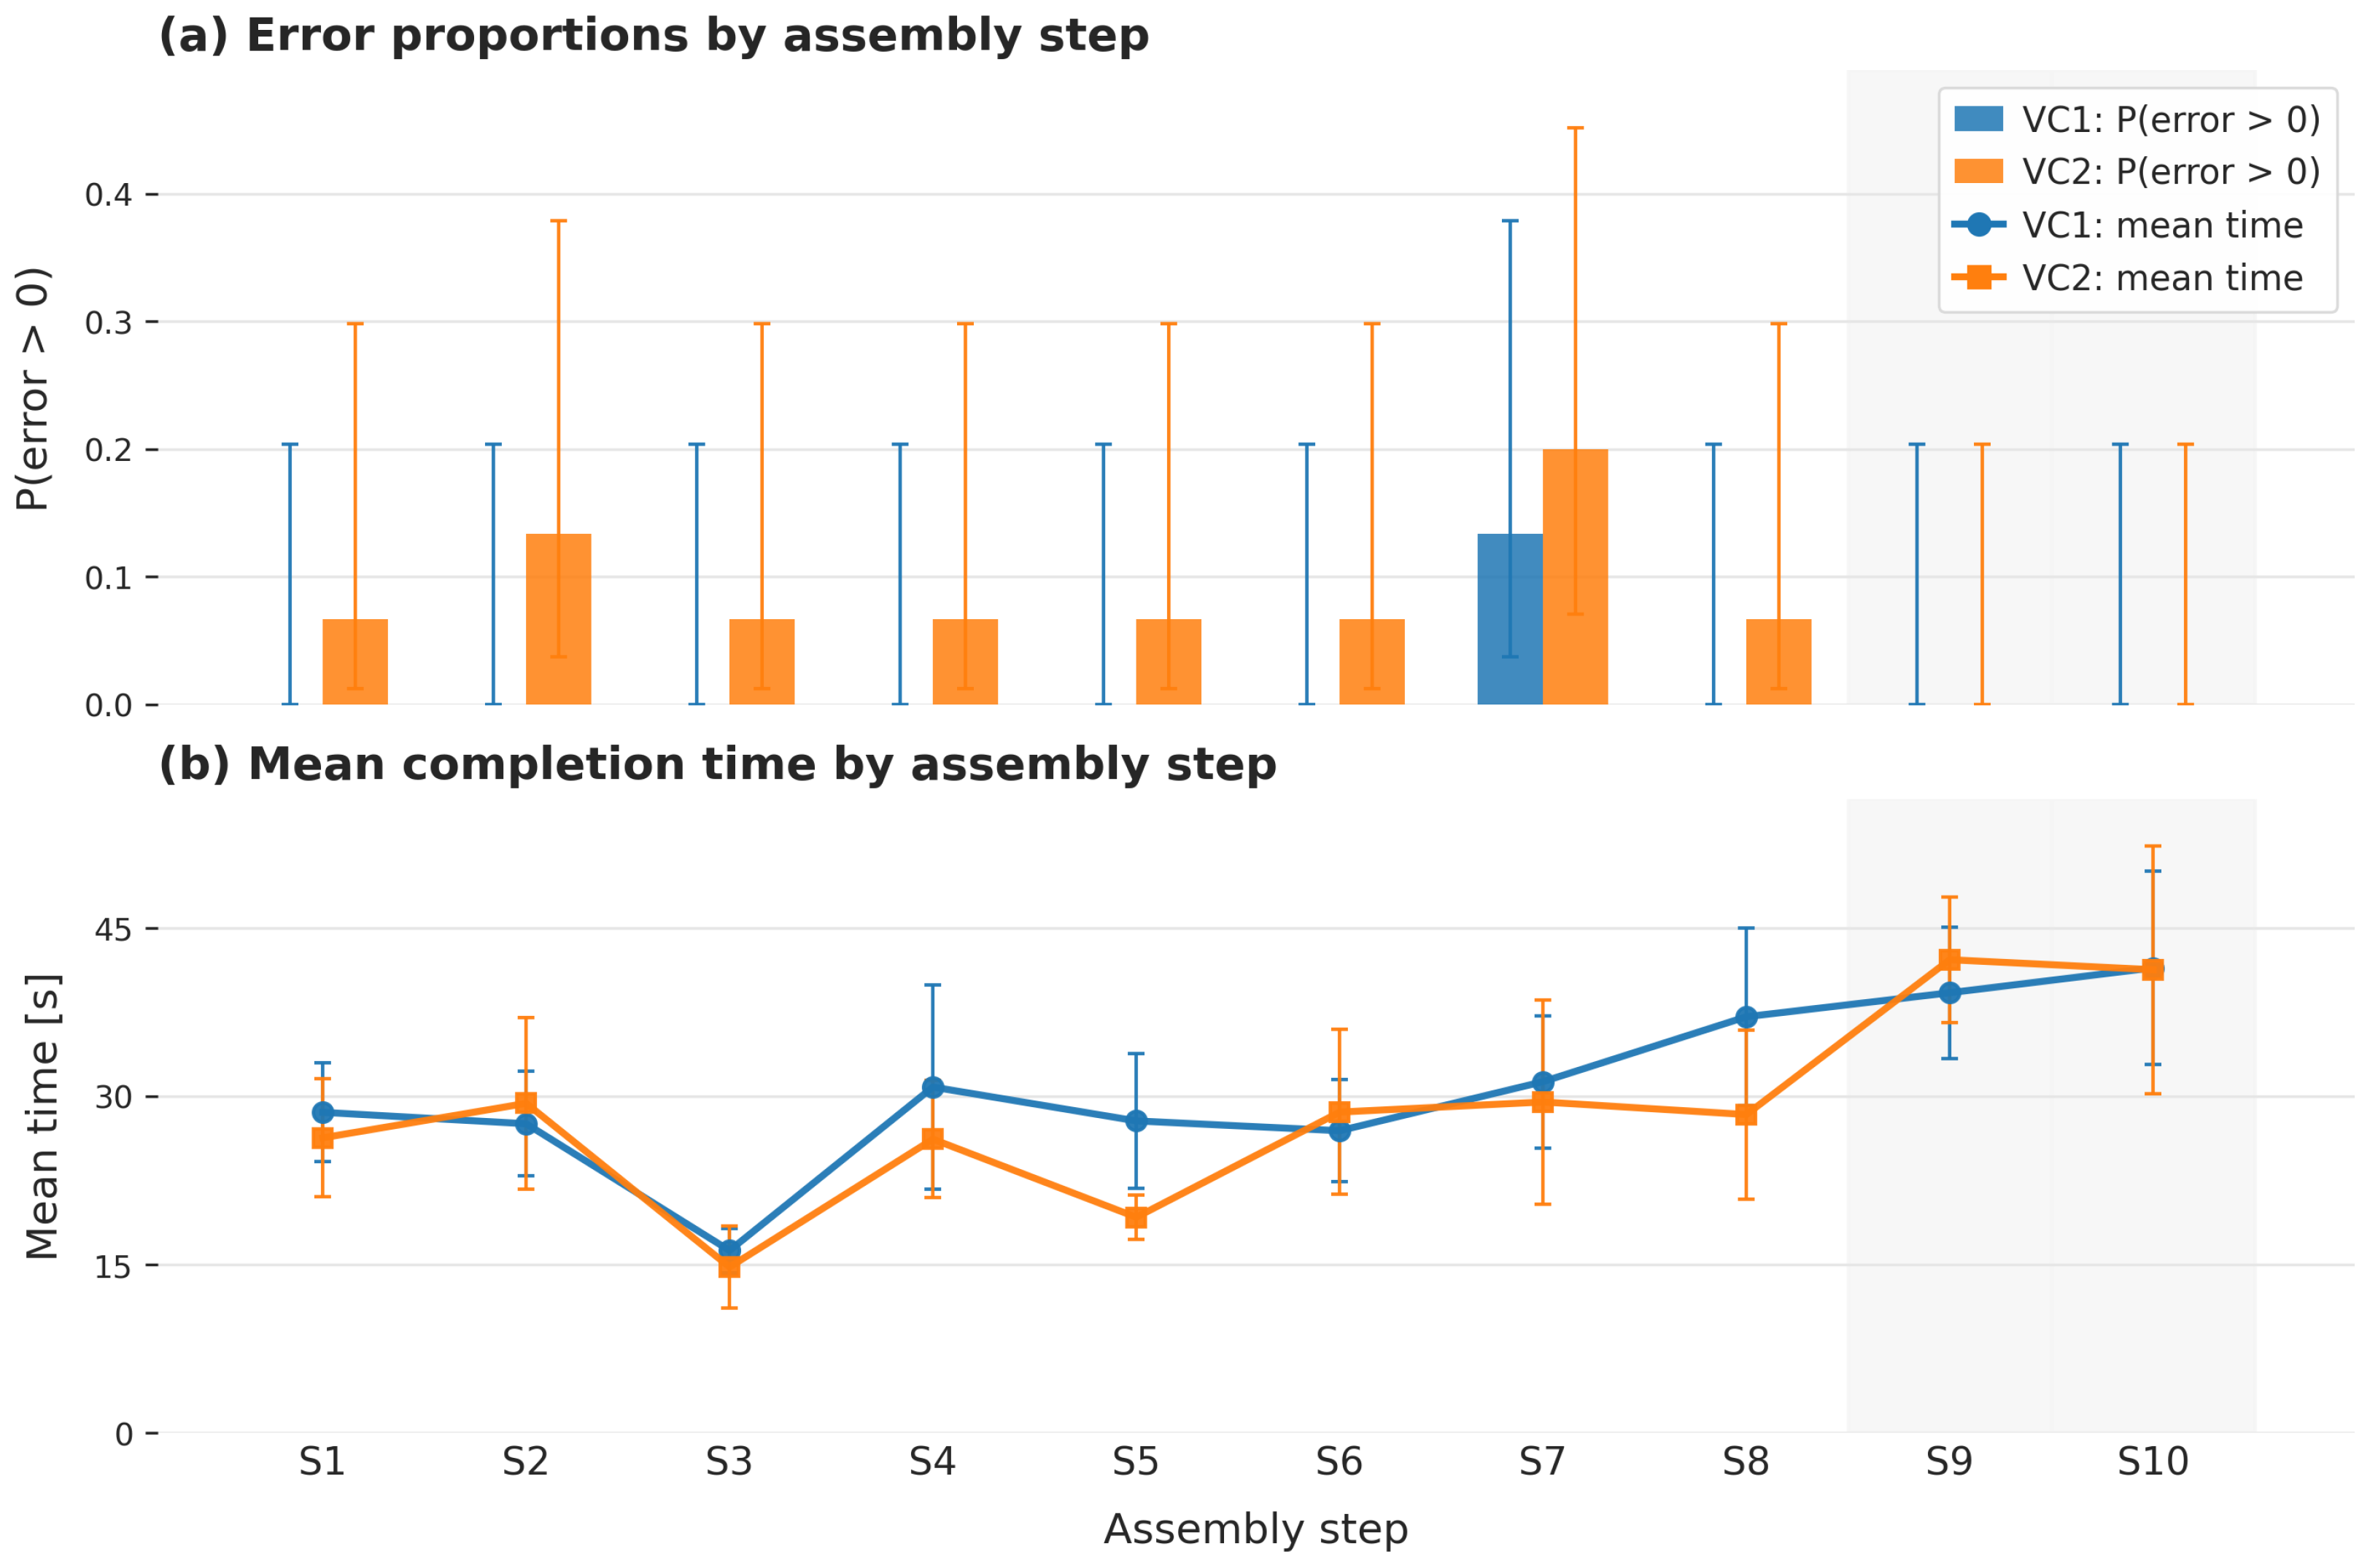
References
- Adelmann, R. Augmented Reality in Der Industriellen Praxis. In Virtual Reality und Augmented Reality in der Digitalen Produktion; Orsolits, H., Lackner, M., Eds.; Springer Fachmedien Wiesbaden: Wiesbaden, Germany, 2020; pp. 7–32. [Google Scholar] [CrossRef] [Scilit]
- Buehler, K.; Kohne, A. Besser Lernen Mit VR/AR Anwendungen. In Virtual Reality und Augmented Reality in der Digitalen Produktion; Orsolits, H., Lackner, M., Eds.; Springer Fachmedien Wiesbaden: Wiesbaden, Germany, 2020; pp. 75–97. [Google Scholar] [CrossRef] [Scilit]
- Dhanalakshmi, R.; Mai, C.D.; Latha, B.; Vijayaraghavan, N. AR and VR in Manufacturing. In Futuristic Trends in Intelligent Manufacturing: Optimization and Intelligence in Manufacturing; Palanikumar, K., Natarajan, E., Sengottuvelu, R., Davim, J.P., Eds.; Springer International Publishing: Cham, Switzerland, 2021; pp. 171–183. [Google Scholar] [CrossRef] [Scilit]
- Winn, W.; Jackson, R. Fourteen Propositions About Educational Uses of Virtual Reality. Educ. Technol. 1999, 39, 5–14. [Google Scholar]
- Zhang, Y.; Miao, Z. Enhancing EFL Learners’ Engagement and Motivation Through Immersive Technologies: The Role of Artificial Intelligence, Augmented Reality, Virtual Reality, and Mobile Applications. Eur. J. Educ. 2025, 60, e70128. [Google Scholar] [CrossRef] [Scilit]
- Morales Méndez, G.; del Cerro Velázquez, F. Augmented Reality in Industry 4.0 Assistance and Training Areas: A Systematic Literature Review and Bibliometric Analysis. Electronics 2024, 13, 1147. [Google Scholar] [CrossRef] [Scilit]
- Knoll, M.; Stieglitz, S. Augmented Reality und Virtual Reality – Einsatz im Kontext von Arbeit, Forschung und Lehre. HMD Prax. Wirtsch. 2022, 59, 6–22. [Google Scholar] [CrossRef] [Scilit]
- Laviola, E.; Gattullo, M.; Manghisi, V.M.; Fiorentino, M.; Uva, A.E. Minimal AR: Visual Asset Optimization for the Authoring of Augmented Reality Work Instructions in Manufacturing. Int. J. Adv. Manuf. Technol. 2022, 119, 1769–1784. [Google Scholar] [CrossRef] [Scilit] [PubMed]
- Runde, C. VR-/AR-anwendungsfelder im Produktionskontext. In Virtual Reality und Augmented Reality in der Digitalen Produktion; Orsolits, H., Lackner, M., Eds.; Springer Fachmedien Wiesbaden: Wiesbaden, Germany, 2020; pp. 51–73. [Google Scholar] [CrossRef] [Scilit]
- Blattgerste, J.; Strenge, B.; Renner, P.; Pfeiffer, T.; Essig, K. Comparing Conventional and Augmented Reality Instructions for Manual Assembly Tasks. In Proceedings of the 10th International Conference on PErvasive Technologies Related to Assistive Environments; ACM: New York, NY, USA, 2017; PETRA ’17; pp. 75–82. [Google Scholar] [CrossRef] [Scilit]
- Blattgerste, J.; Renner, P.; Strenge, B.; Pfeiffer, T. In-Situ Instructions Exceed Side-by-Side Instructions in Augmented Reality Assisted Assembly. In Proceedings of the 11th PErvasive Technologies Related to Assistive Environments Conference, Corfu, Greece, 2018; ACM: New York, NY, USA, 2018; pp. 133–140. [Google Scholar] [CrossRef] [Scilit]
- Rolim, C.; Schmalstieg, D.; Kalkofen, D.; Teichrieb, V. [POSTER] Design Guidelines for Generating Augmented Reality Instructions. In Proceedings of the 2015 IEEE International Symposium on Mixed and Augmented Reality (ISMAR), Fukuoka, Japan, 2015; IEEE: New York, NY, USA, 2015; pp. 120–123. [Google Scholar] [CrossRef] [Scilit]
- Gattullo, M.; Scurati, G.W.; Evangelista, A.; Ferrise, F.; Fiorentino, M.; Uva, A.E. Informing the Use of Visual Assets in Industrial Augmented Reality. In Design Tools and Methods in Industrial Engineering: Proceedings of the International Conference on Design Tools and Methods in Industrial Engineering, ADM 2019, Modena, Italy, 9–10 September 2019; Rizzi, C., Andrisano, A.O., Leali, F., Gherardini, F., Pini, F., Vergnano, A., Eds.; Springer International Publishing: Cham, Switzerland, 2019; pp. 106–117. [Google Scholar] [CrossRef] [Scilit]
- Gattullo, M.; Uva, A.E.; Fiorentino, M.; Gabbard, J.L. Legibility in Industrial AR: Text Style, Color Coding, and Illuminance. IEEE Comput. Graph. Appl. 2015, 35, 52–61. [Google Scholar] [CrossRef] [Scilit]
- Tainaka, K.; Fujimoto, Y.; Kanbara, M.; Kato, H.; Moteki, A.; Kuraki, K.; Osamura, K.; Yoshitake, T.; Fukuoka, T. Guideline and Tool for Designing an Assembly Task Support System Using Augmented Reality. In Proceedings of the 2020 IEEE International Symposium on Mixed and Augmented Reality (ISMAR), Porto de Galinhas, Brazil, 2020; IEEE: New York, NY, USA, 2020; pp. 486–497. [Google Scholar] [CrossRef] [Scilit]
- Clark, R.C.; Mayer, R.E. E-Learning and the Science of Instruction: Proven Guidelines for Consumers and Designers of Multimedia Learning, 4th ed.; Wiley: Hoboken, NJ, USA, 2016. [Google Scholar] [CrossRef] [Scilit]
- Sweller, J. Cognitive Load During Problem Solving: Effects on Learning. Cogn. Sci. 1988, 12, 257–285. [Google Scholar] [CrossRef]
- Sweller, J.; van Merriënboer, J.J.G.; Paas, F.G.W.C. Cognitive Architecture and Instructional Design. Educ. Psychol. Rev. 1998, 10, 251–296. [Google Scholar] [CrossRef] [Scilit]
- Paas, F.; Renkl, A.; Sweller, J. Cognitive Load Theory and Instructional Design: Recent Developments. Educ. Psychol. 2003, 38, 1–4. [Google Scholar] [CrossRef] [Scilit]
- Kalyuga, S.; Ayres, P.; Chandler, P.; Sweller, J. The Expertise Reversal Effect. Educ. Psychol. 2003, 38, 23–31. [Google Scholar] [CrossRef] [Scilit]
- Laviola, E.; Uva, A.E.; Gattullo, M. The minimal AR authoring approach: Validation in a real assembly scenario. Comput. Ind. 2024, 154, 104026. [Google Scholar] [CrossRef] [Scilit]
- Gattullo, M.; Laviola, E.; Uva, A.E. From Therbligs to Visual Assets: A Technique to Convey Work Instructions in Augmented Reality Technical Documentation. In Advances on Mechanics, Design Engineering and Manufacturing IV; Gerbino, S., Lanzotti, A., Martorelli, M., Mirálbes Buil, R., Rizzi, C., Roucoules, L., Eds.; Springer International Publishing: Cham, Switzerland, 2023; pp. 1327–1339. [Google Scholar] [CrossRef] [Scilit]
- Tractinsky, N. Does Aesthestics Matter in Human-Computer Interaction? In Mensch und Computer 2005: Kunst und Wissenschaft—Grenzüberschreitung der Interaktiven Art; Oldenbourg Verlag: Munich, Germany, 2005; pp. 29–42. Available online: https://dl.gi.de/handle/20.500.12116/6985 (accessed on 26 February 2026).
- Eytam, E. The Effect of Design Elements on Simplicity, Usability, and Product Preference: A Video Conference Application Case Study. Interact. Comput. 2023, 35, 461–480. [Google Scholar] [CrossRef] [Scilit]
- Jasche, F.; Hoffmann, S.; Ludwig, T.; Wulf, V. Comparison of Different Types of Augmented Reality Visualizations for Instructions. In Proceedings of the 2021 CHI Conference on Human Factors in Computing Systems, Yokohama, Japan, 2021; ACM: New York, NY, USA, 2021; pp. 1–13. [Google Scholar] [CrossRef] [Scilit]
- Hou, L.; Wang, X.; Bernold, L.; Love, P.E.D. Using Animated Augmented Reality to Cognitively Guide Assembly. J. Comput. Civ. Eng. 2013, 27, 439–451. [Google Scholar] [CrossRef] [Scilit]
- Tang, A.; Owen, C.; Biocca, F.; Mou, W. Comparative effectiveness of augmented reality in object assembly. In Proceedings of the SIGCHI Conference on Human Factors in Computing Systems, New York, NY, USA, 2003; CHI ’03; ACM: New York, NY, USA, 2003; pp. 73–80. [Google Scholar] [CrossRef] [Scilit]
- Radkowski, R.; Herrema, J.; Oliver, J. Augmented Reality-Based Manual Assembly Support with Visual Features for Different Degrees of Difficulty. Int. J. Hum.-Interact. 2015, 31, 337–349. [Google Scholar] [CrossRef] [Scilit]
- Palmarini, R.; Erkoyuncu, J.A.; Roy, R.; Torabmostaedi, H. A systematic review of augmented reality applications in maintenance. Robot. Comput.-Integr. Manuf. 2018, 49, 215–228. [Google Scholar] [CrossRef] [Scilit]
- Gattullo, M.; Scurati, G.W.; Fiorentino, M.; Uva, A.E.; Ferrise, F.; Bordegoni, M. Towards augmented reality manuals for industry 4.0: A methodology. Robot. Comput.-Integr. Manuf. 2019, 56, 276–286. [Google Scholar] [CrossRef] [Scilit]
- Geng, J.; Song, X.; Pan, Y.; Tang, J.; Liu, Y.; Zhao, D.; Ma, Y. A systematic design method of adaptive augmented reality work instruction for complex industrial operations. Comput. Ind. 2020, 119, 103229. [Google Scholar] [CrossRef] [Scilit]
- Fang, W.; Chen, L.; Zhang, T.; Chen, C.; Teng, Z.; Wang, L. Head-Mounted Display Augmented Reality in Manufacturing: A Systematic Review. Robot. Comput.-Integr. Manuf. 2023, 83, 102567. [Google Scholar] [CrossRef] [Scilit]
- Hart, S.G.; Staveland, L.E. Development of NASA-TLX (Task Load Index): Results of Empirical and Theoretical Research. In Human Mental Workload; Hancock, P.A., Meshkati, N., Eds.; North-Holland: Amsterdam, The Netherlands, 1988; Volume 52, Advances in Psychology; pp. 139–183. [Google Scholar] [CrossRef] [Scilit]
- Brooke, J. SUS: A “Quick and Dirty” Usability Scale. In Usability Evaluation in Industry; Jordan, P.W., Thomas, B., Weerdmeester, B.A., McClelland, I.L., Eds.; Taylor & Francis: London, UK, 1996; pp. 189–194. [Google Scholar] [CrossRef] [Scilit]
- Norman, D.A. The Design of Everyday Things: Revised and Expanded Edition; Basic Books: New York, NY, USA, 2013. [Google Scholar]
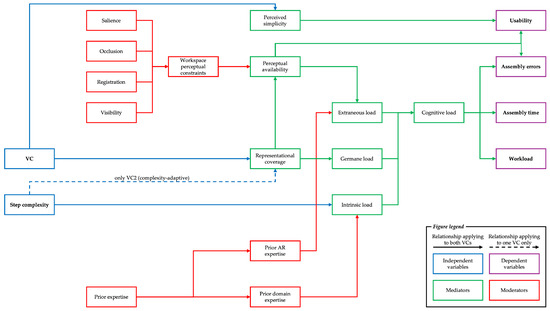
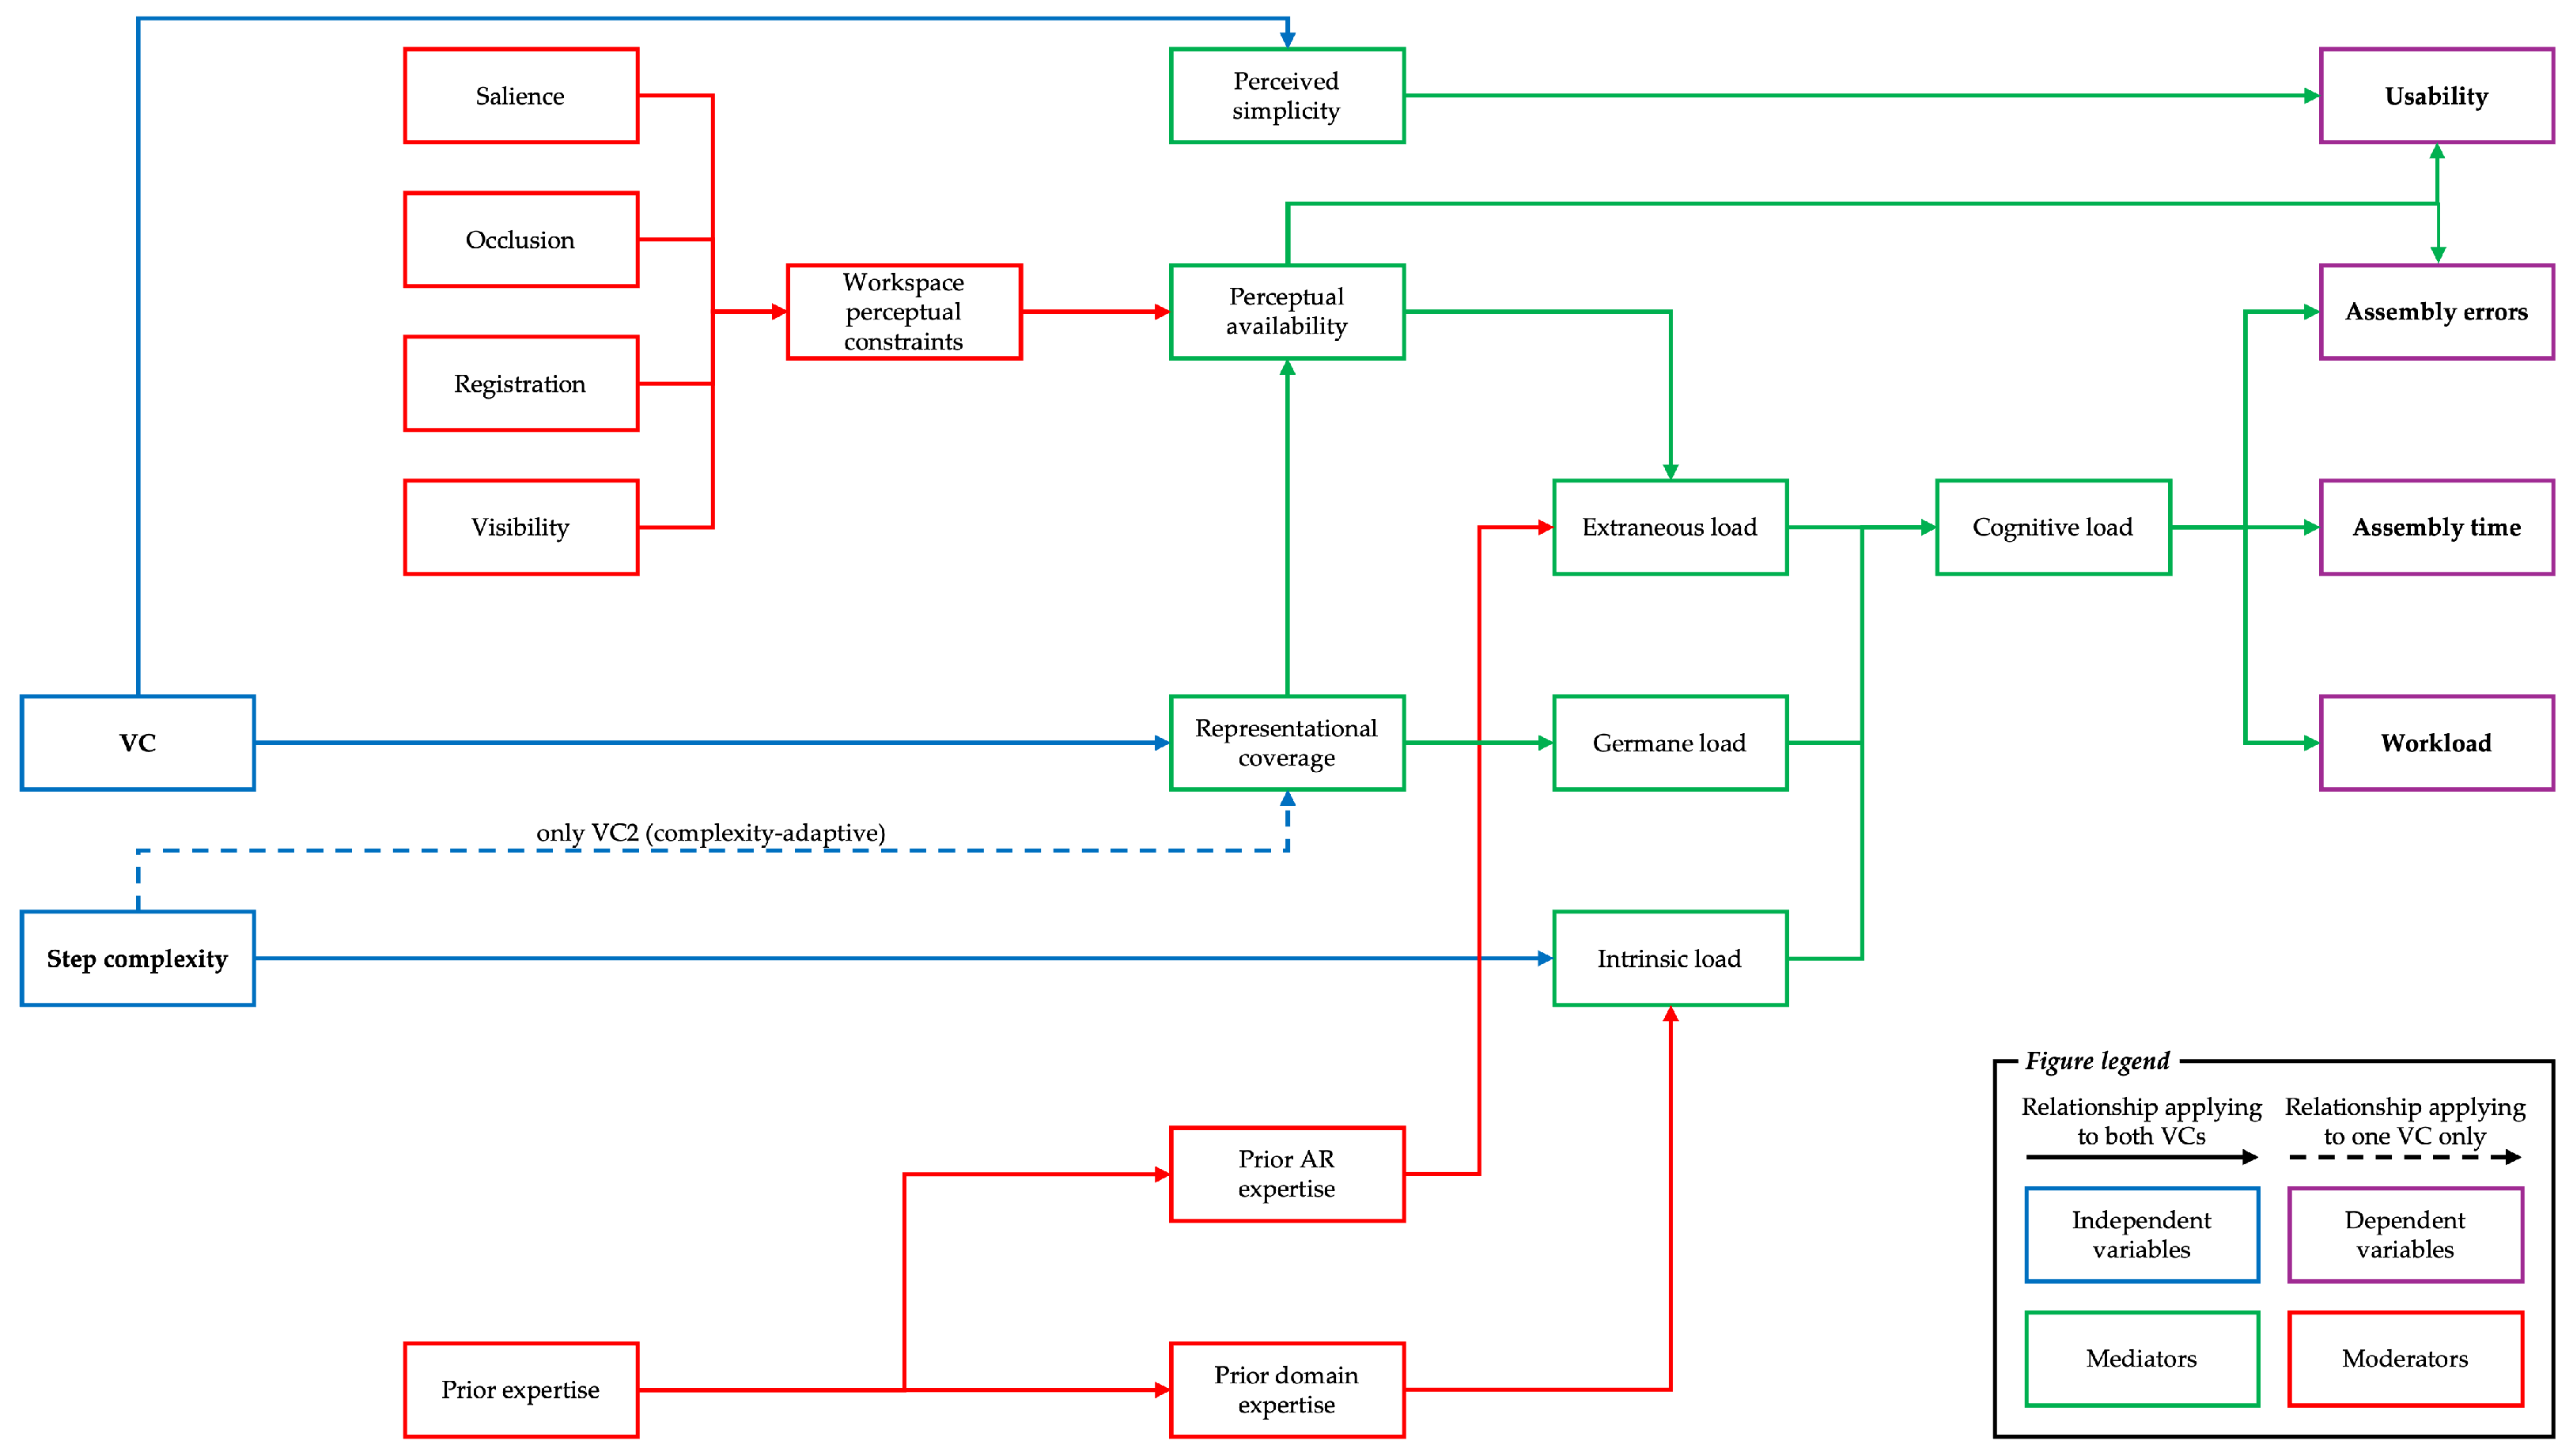
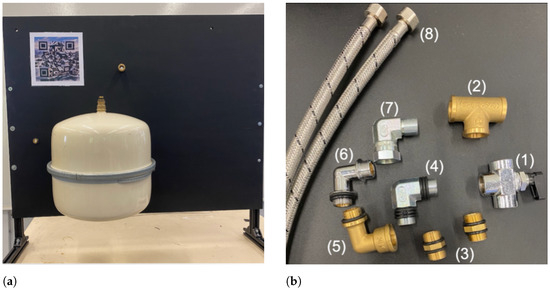
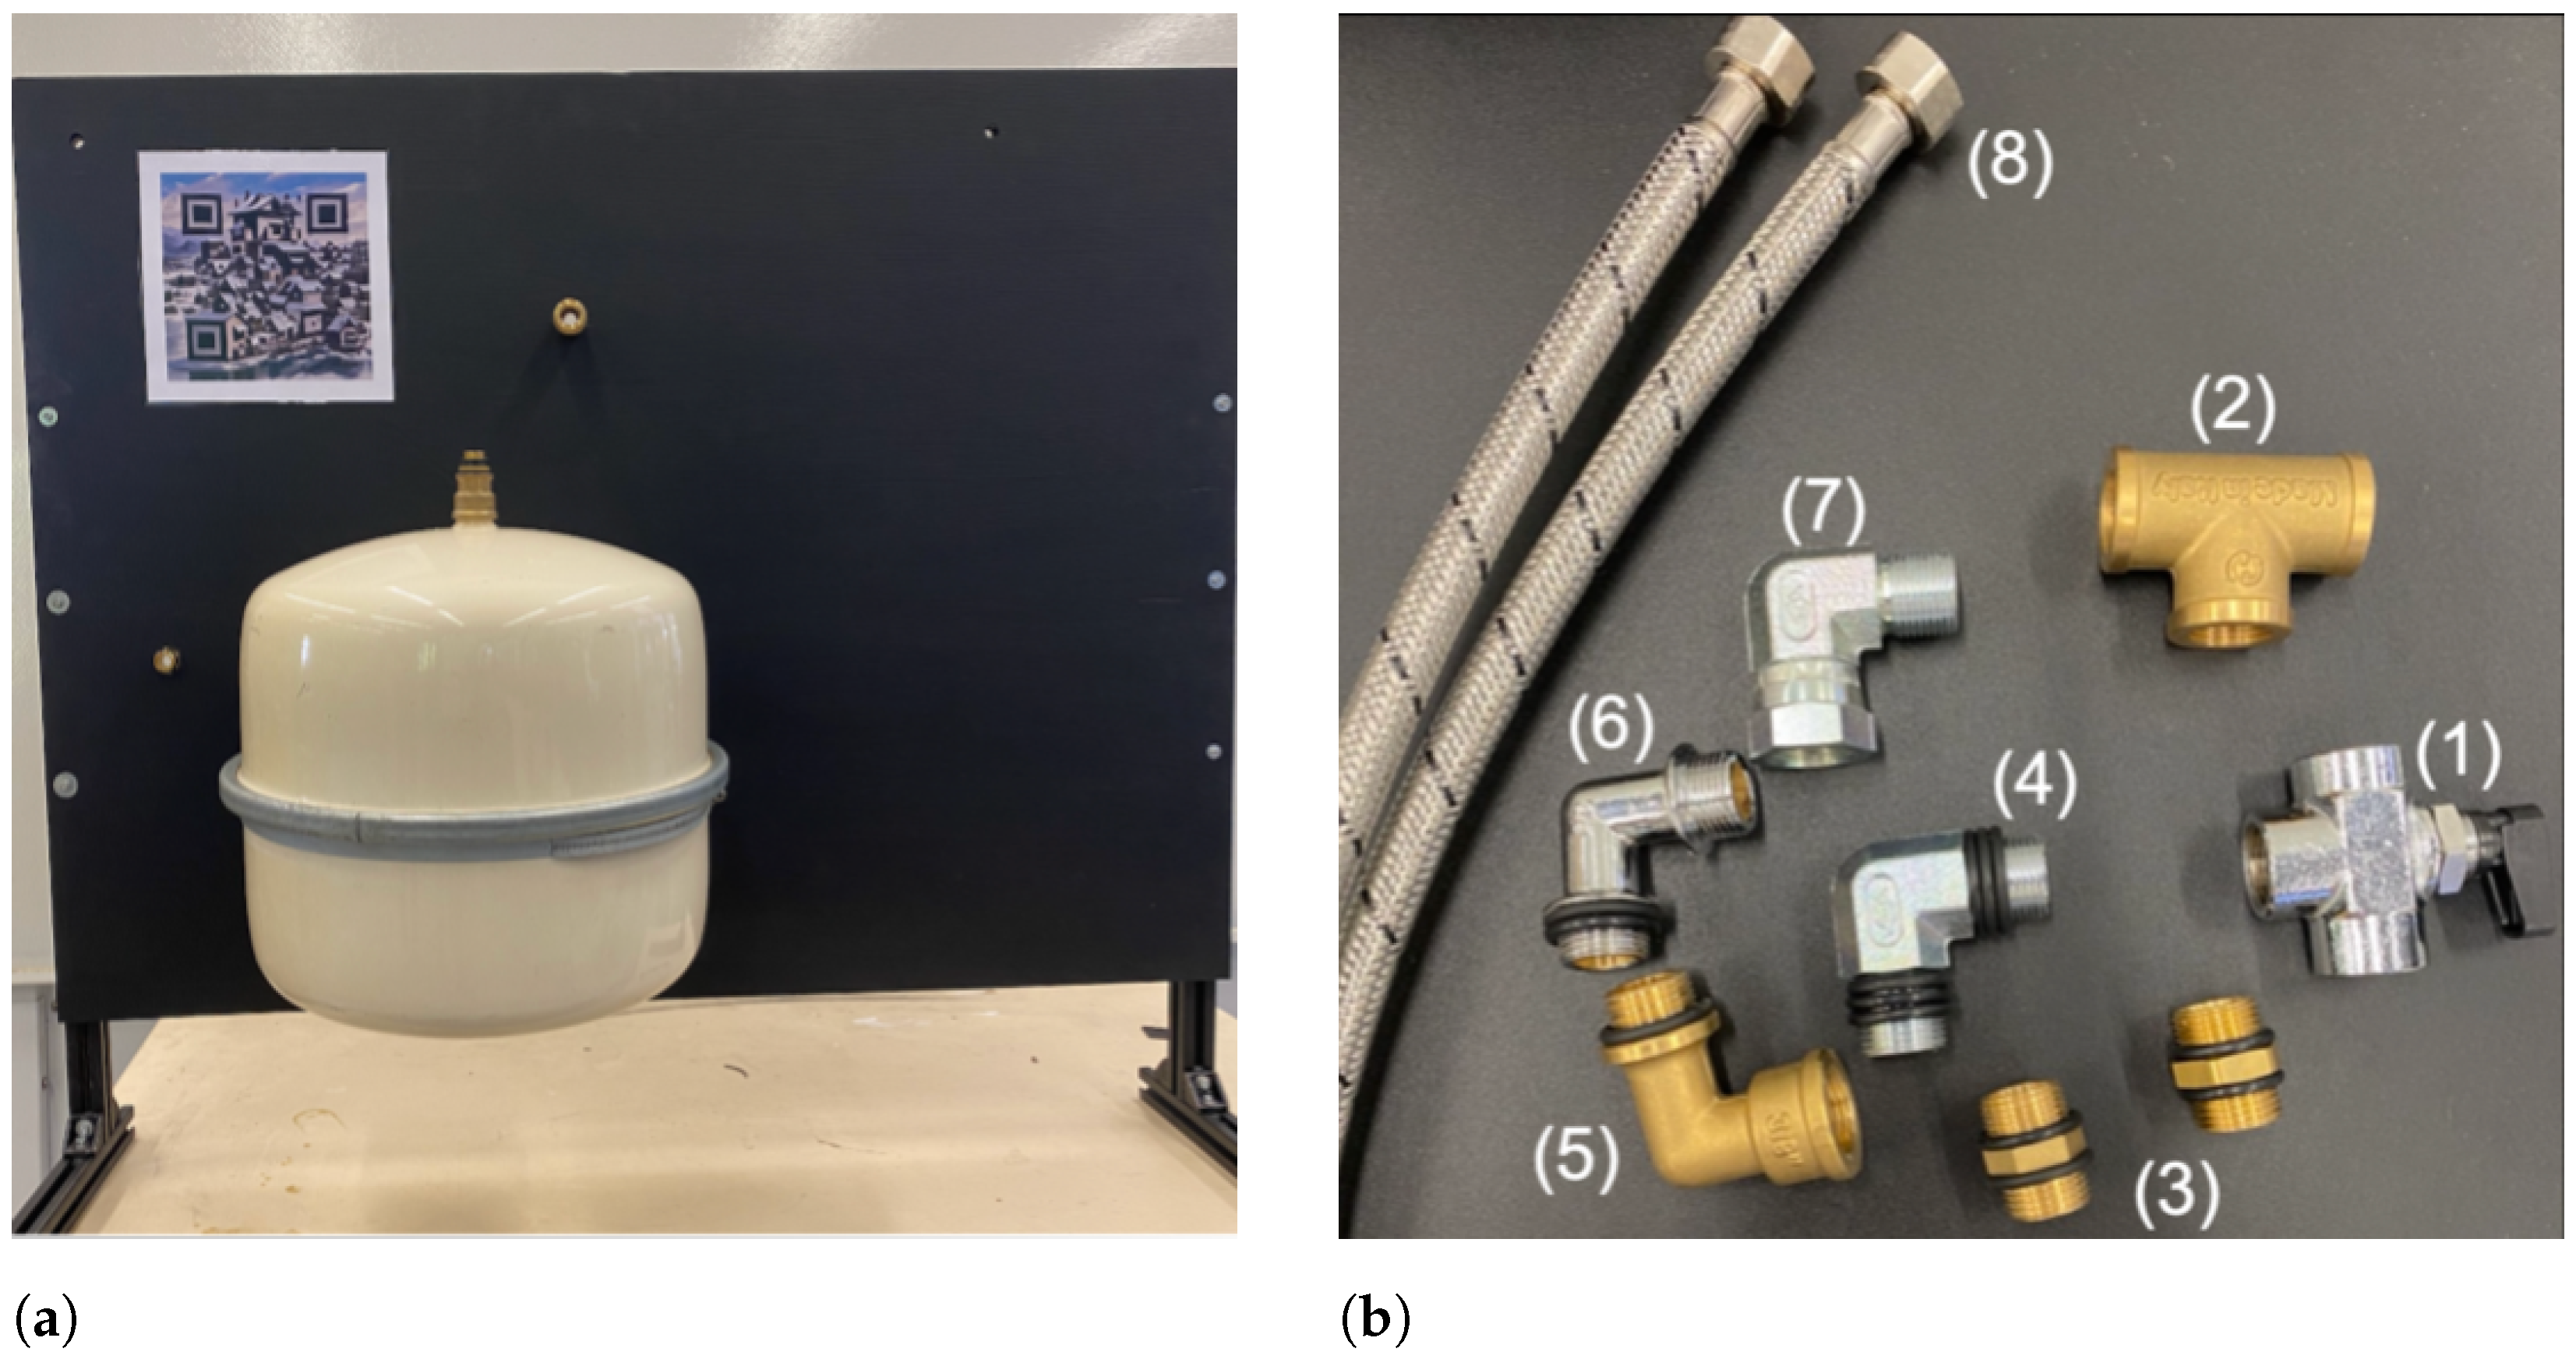
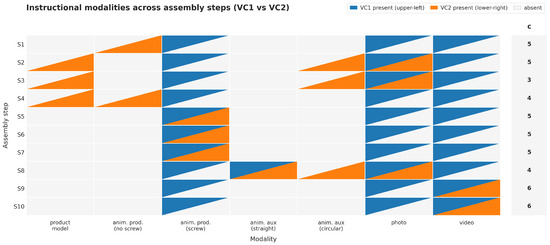
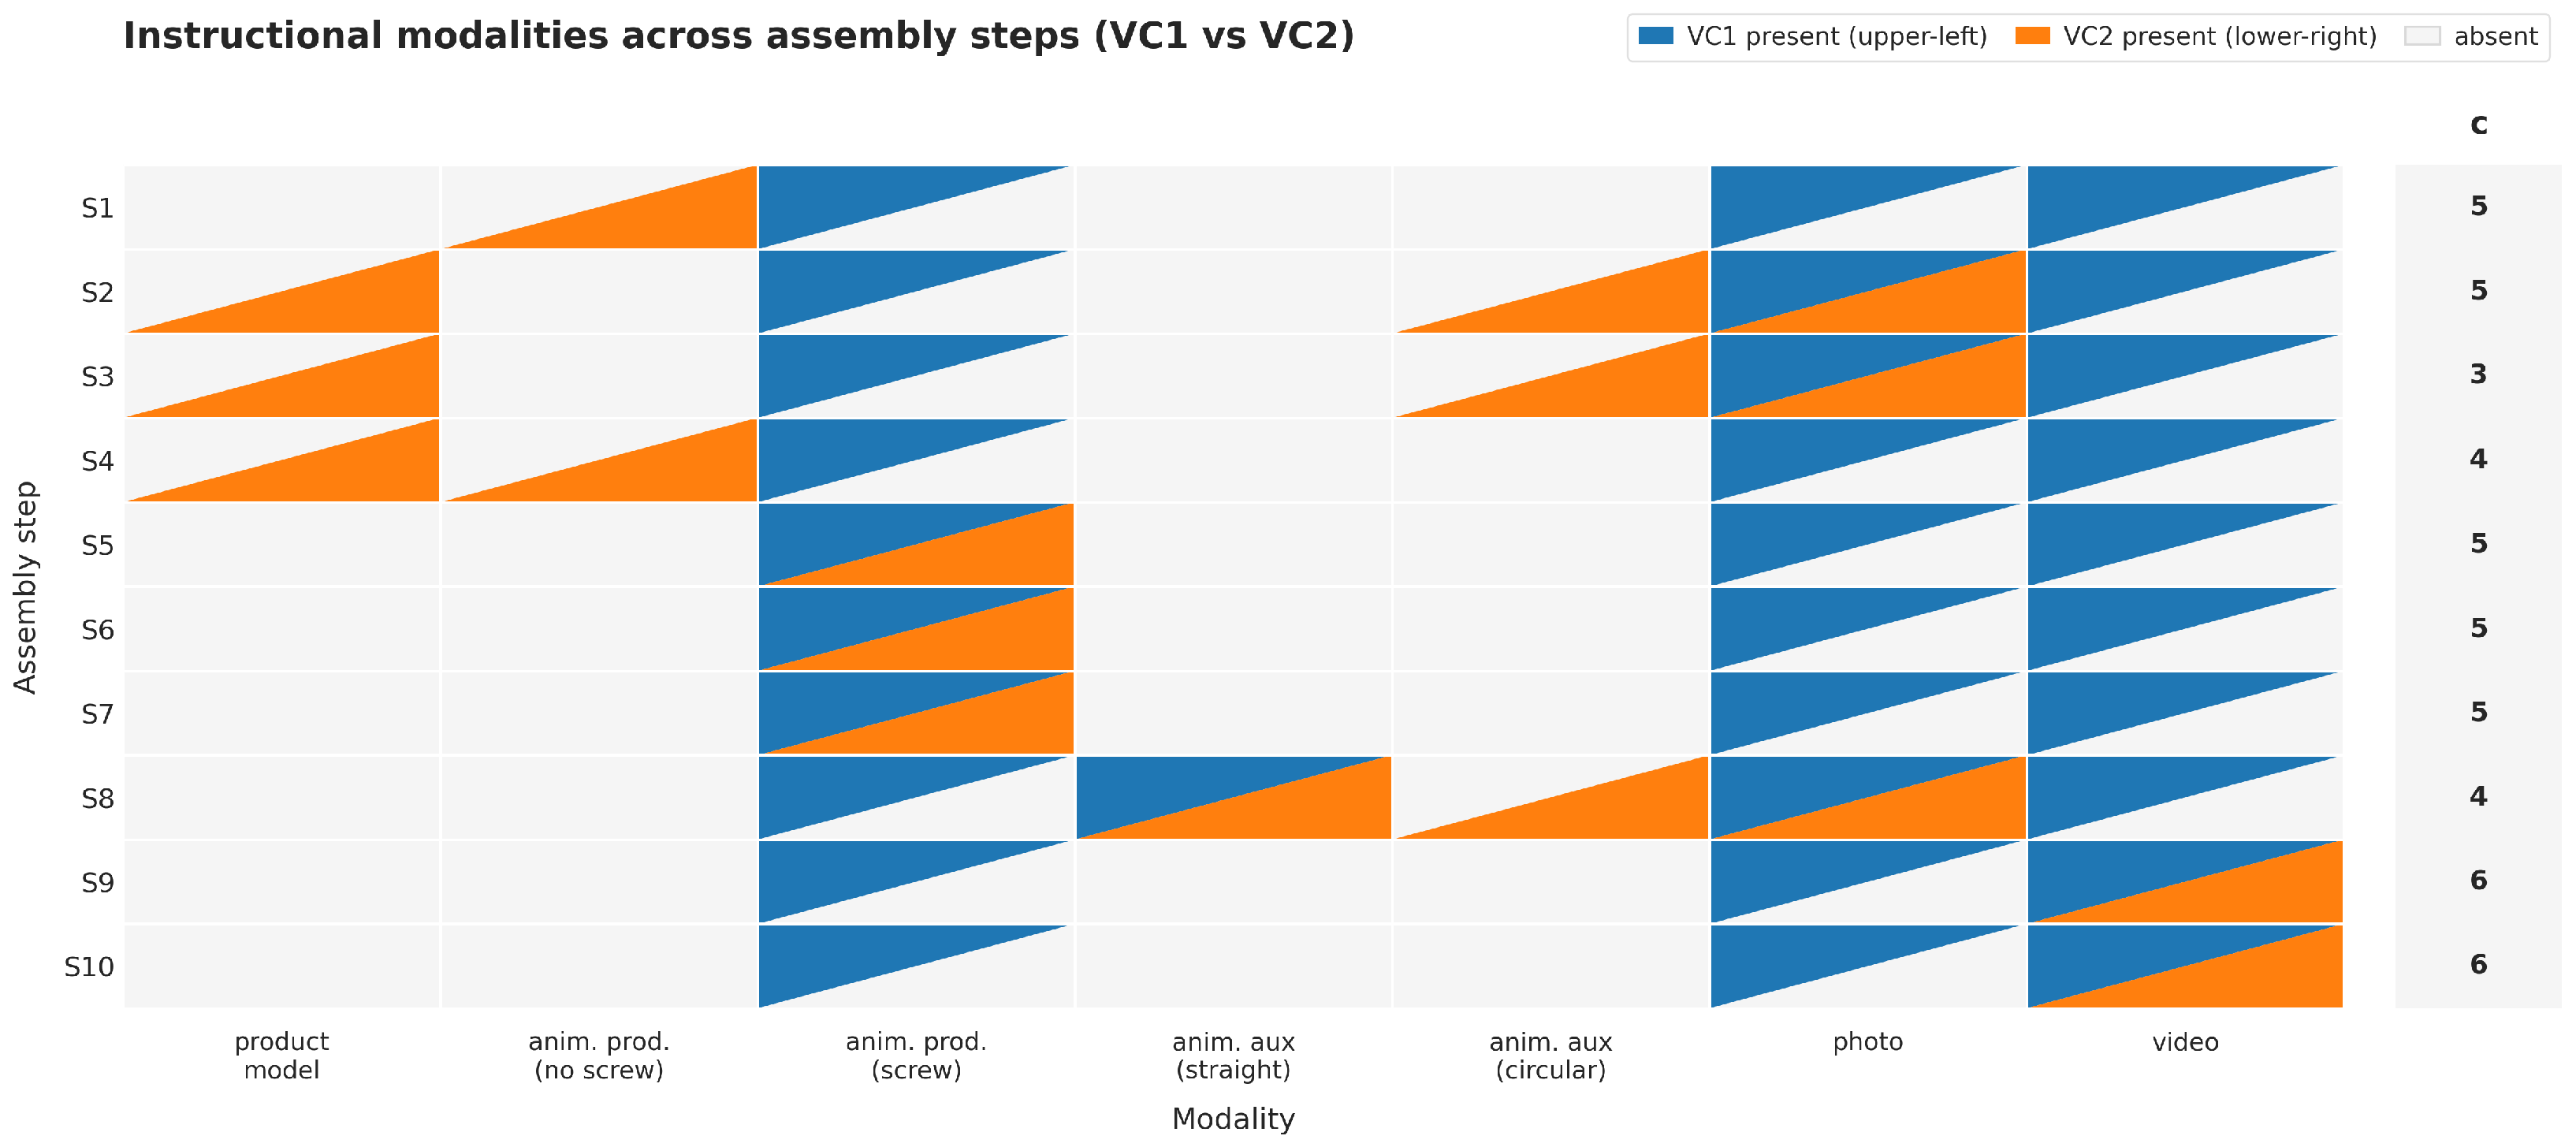
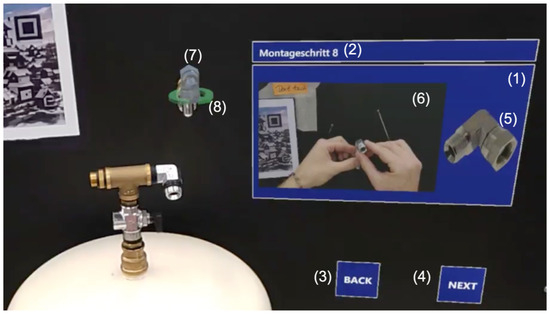
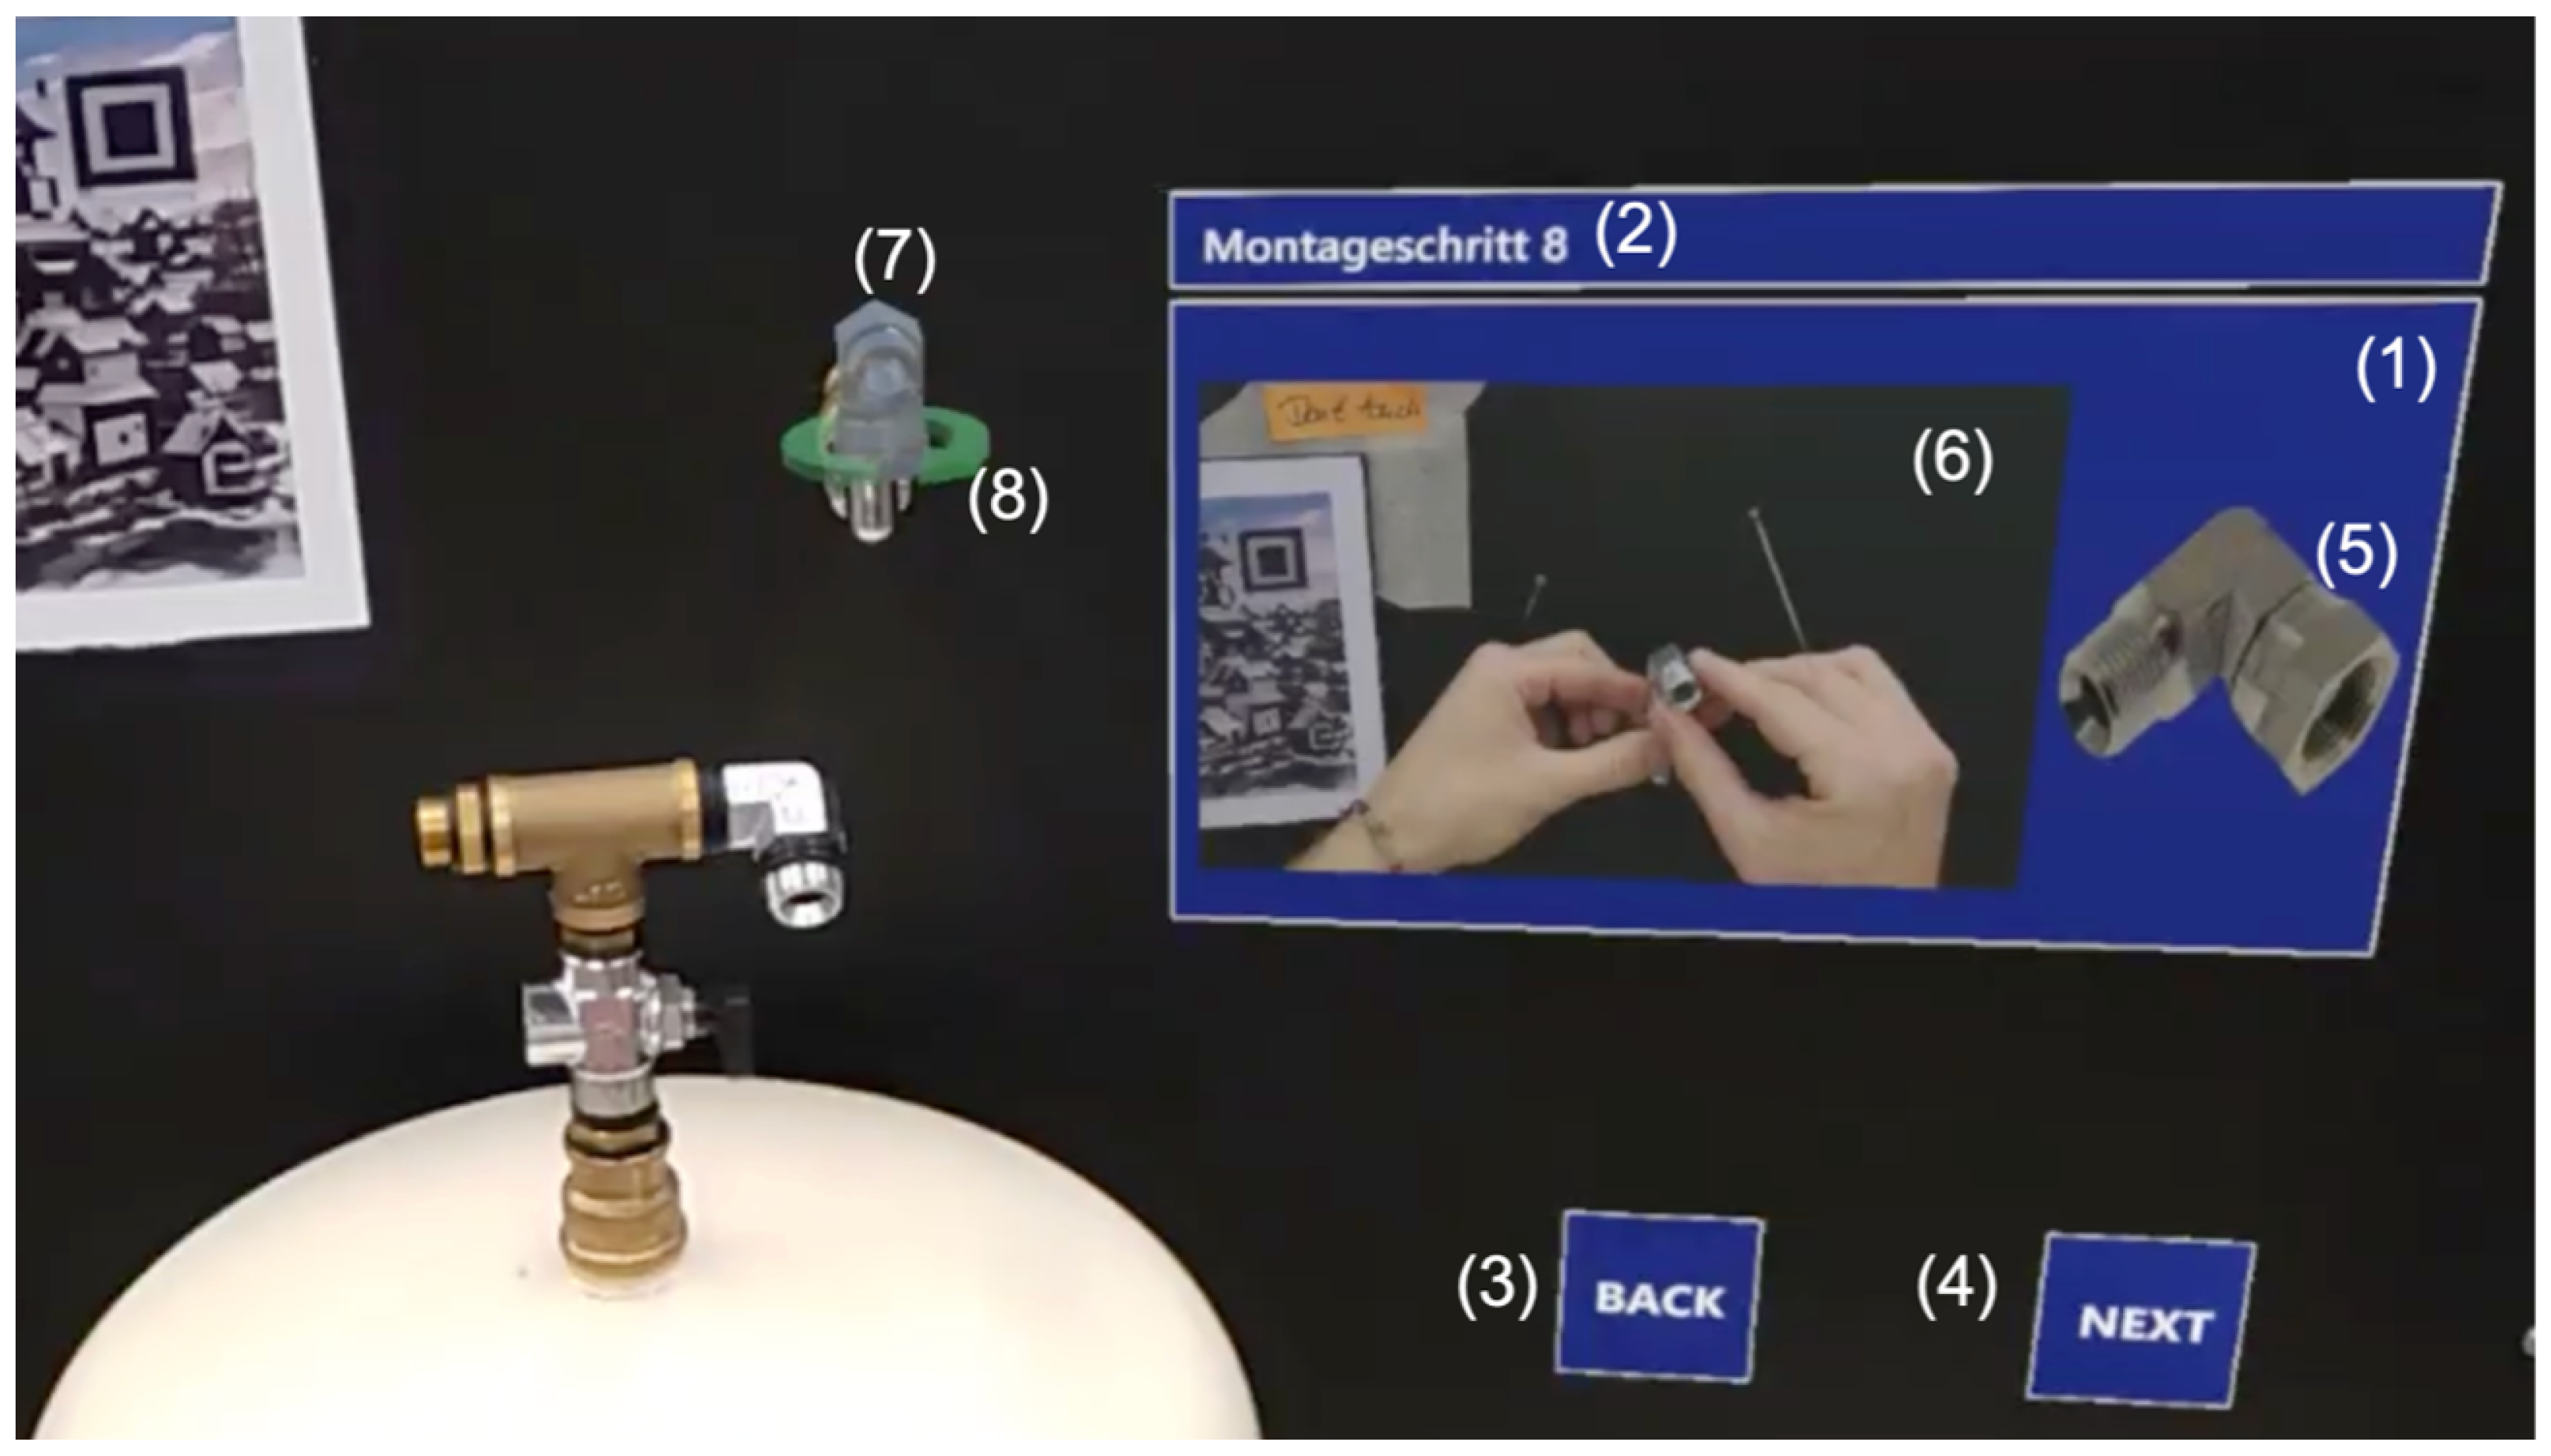
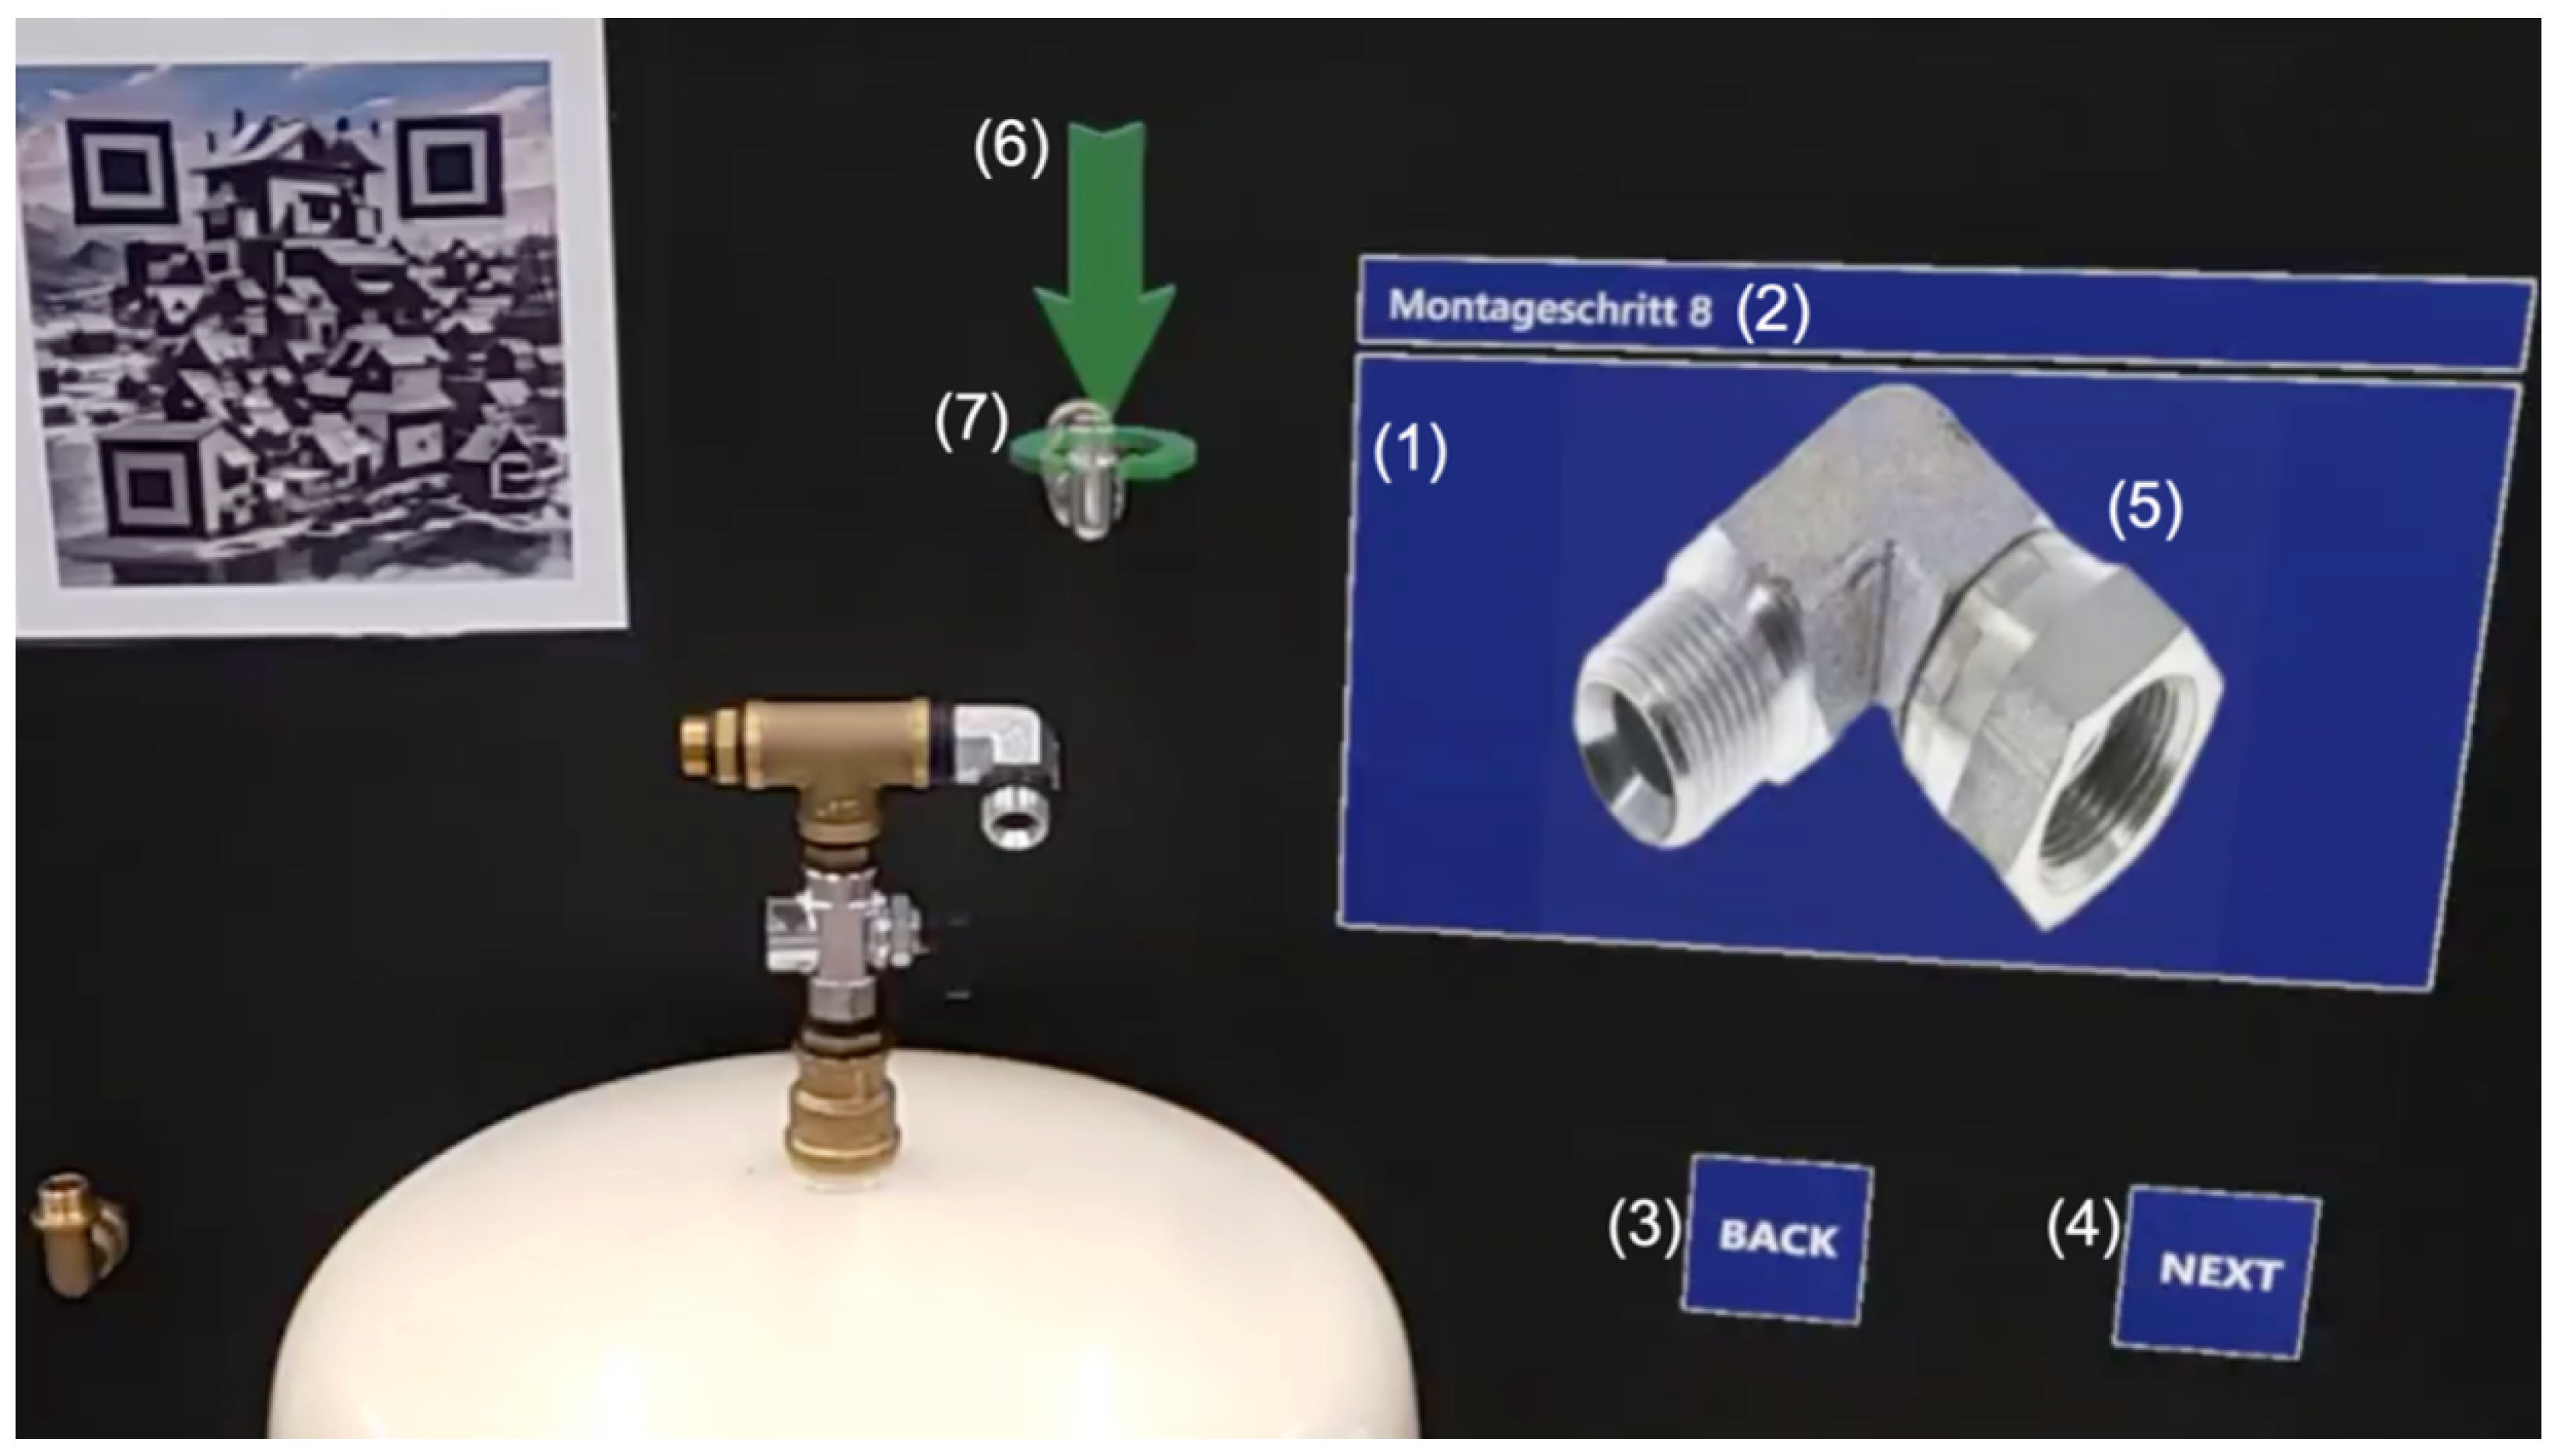
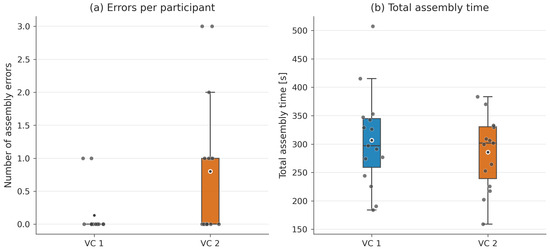
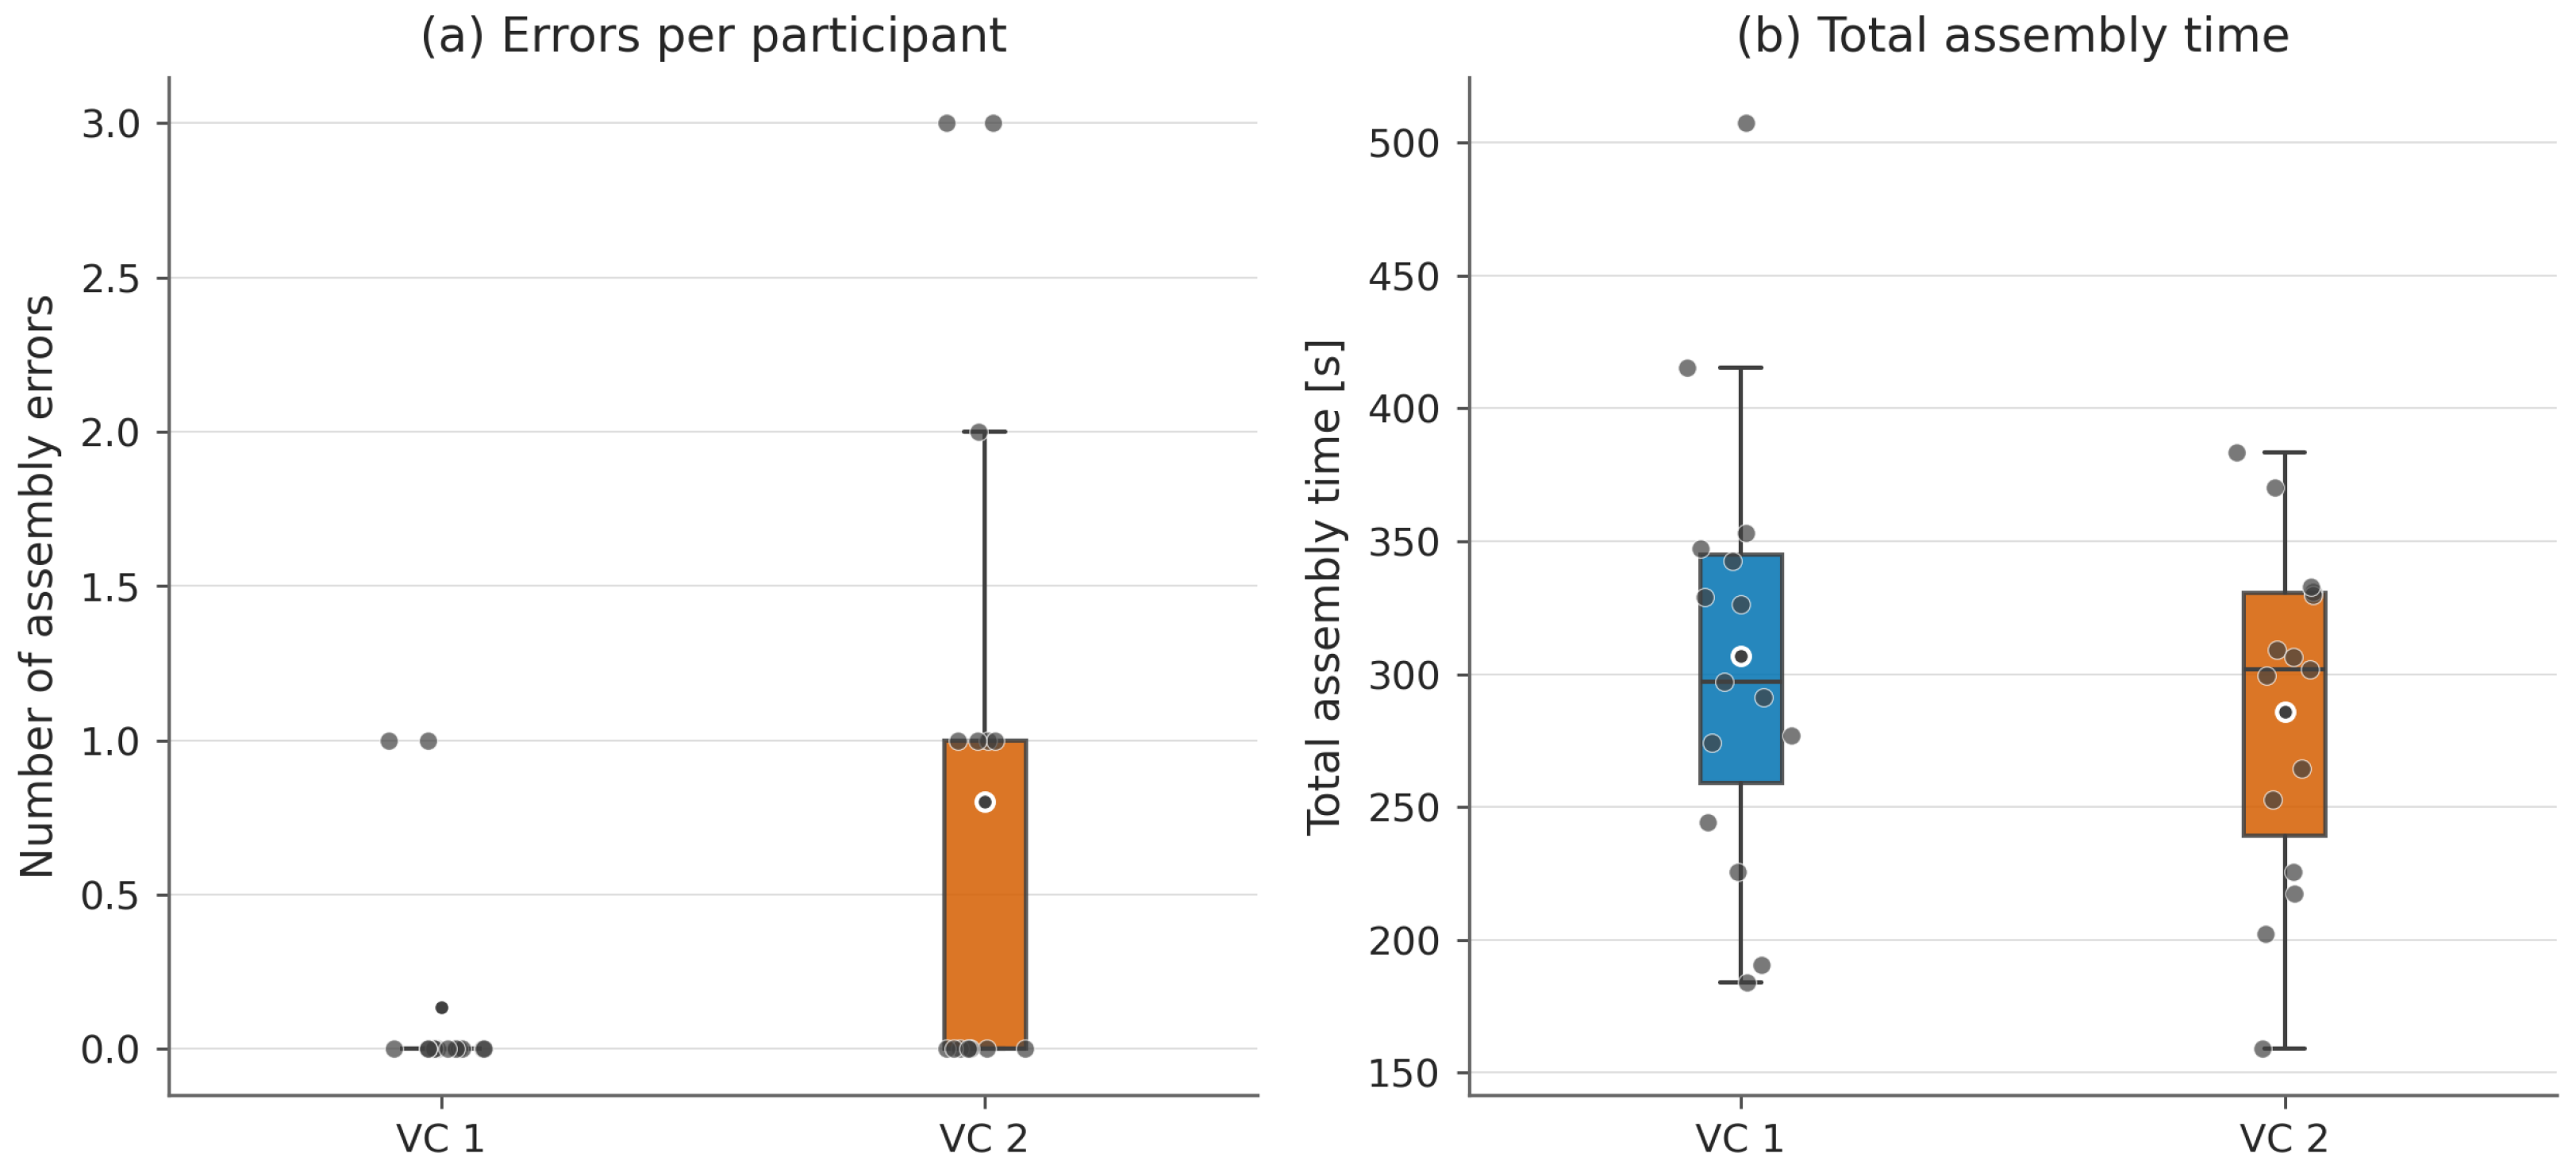
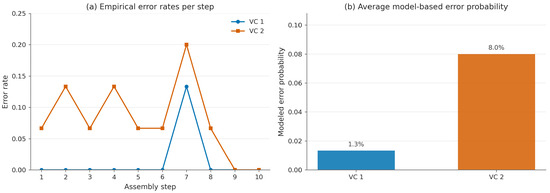
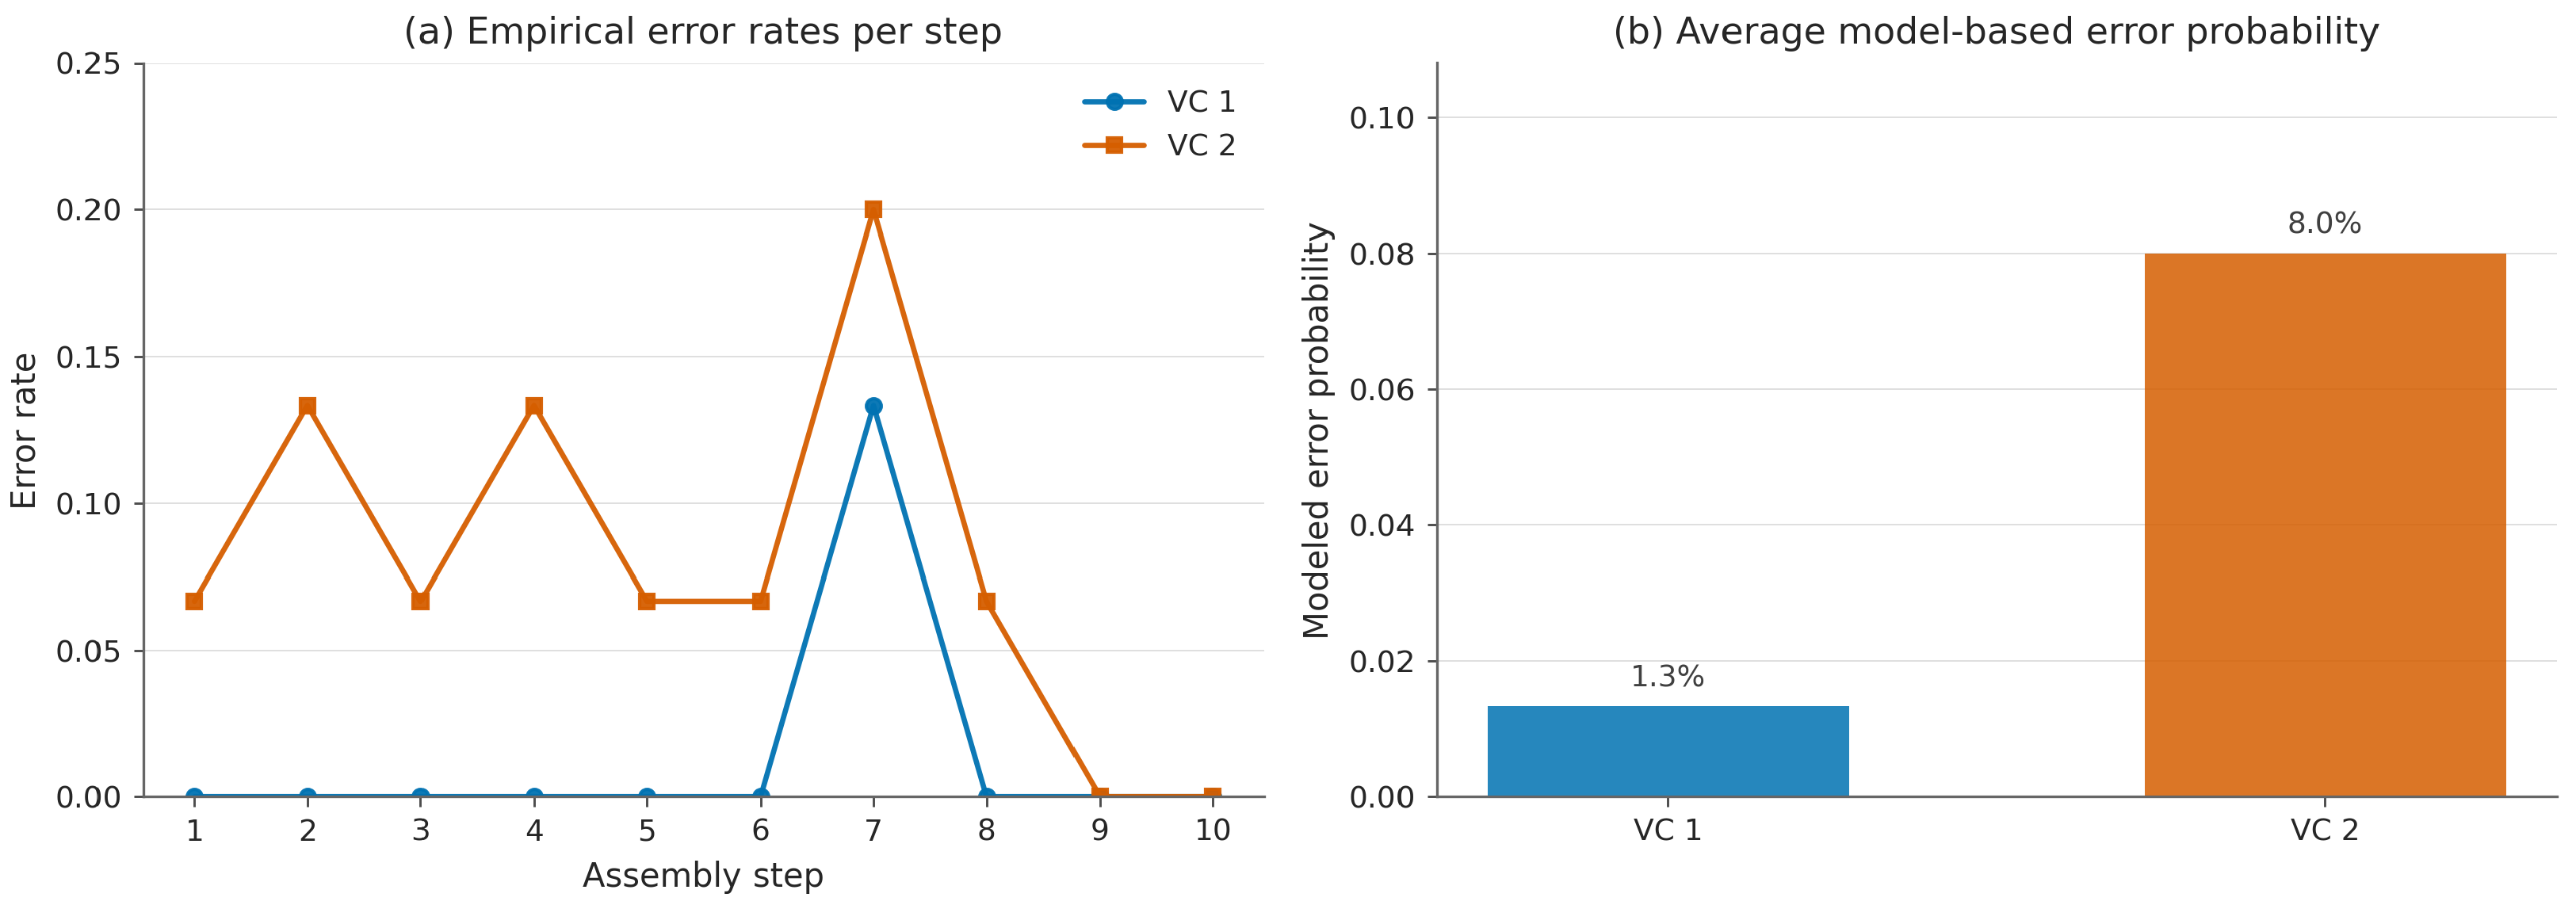

Disclaimer/Publisher’s Note: The statements, opinions and data contained in all publications are solely those of the individual author(s) and contributor(s) and not of MDPI and/or the editor(s). MDPI and/or the editor(s) disclaim responsibility for any injury to people or property resulting from any ideas, methods, instructions or products referred to in the content. |
© 2026 by the authors. Licensee MDPI, Basel, Switzerland. This article is an open access article distributed under the terms and conditions of the Creative Commons Attribution (CC BY) license.