


Abstract
Background/Objectives: Primary non-adherence occurs when a prescribed medicine is never collected, preventing treatment from the beginning. Despite non-adherence being a widespread problem, most evidence comes from Western European and North American systems, and the Baltic region has rarely been assessed. Using Lithuania’s nationwide e-prescription system, we estimated primary non-adherence, identified associated factors, and characterised regional variation. Methods: We conducted a nationwide study of all outpatient electronic prescriptions issued in Lithuania, 2018–2024. We used open, anonymised quarterly prescribing and dispensing records from the national e-prescription subsystem and the national e-Health Services and Cooperation Infrastructure Information System (ESPBI IS). Prescribing and dispensing were deterministically linked. Prescriptions were classified as completed (dispensed quantity ≥ 90% of that prescribed), partially completed (dispensed quantity > 0% but <90%), or not completed (no quantity dispensed, defining primary non-adherence). Logistic regression estimated associations with patient, prescriber, prescription, and geographic characteristics; the results are reported as adjusted odds ratios (aOR) with 99% confidence intervals. Results: Of 108,204,007 prescriptions, 10.0% were never dispensed. Primary non-adherence was strongly associated with non-reimbursed status (aOR 3.47, 99% CI 3.46–3.48), younger age (18–44 years: 19.2% vs. ≥65 years: 7.0%), and short-term treatment (≤30 days: 14.1% vs. >90 days: 5.7%). Primary non-adherence rates were highest in cities (11.8%) and concentrated in the Vilnius metropolitan area (15.3%) and lowest in rural municipalities (5.5–6.0%). Conclusions: One in ten Lithuanian prescriptions is never dispensed. Non-adherence showed a marked, persistent geographic variance, with higher rates centred around Vilnius. Reimbursement status was the dominant correlate, pointing to cost as a key lever at the point of initiation.
1. Introduction
A prescription can benefit a patient only if the medicine is actually obtained and then used as instructed. Failure in either of these processes is termed non-adherence [1,2]. Two forms are conventionally distinguished: primary non-adherence occurs at the very first step, when a newly prescribed medicine is not collected from the pharmacy, so treatment never begins, and secondary non-adherence arises once treatment has started, when patients take less than prescribed, interrupt, or stop early.
Poor adherence is associated with worse clinical outcomes, including higher mortality [3], and imposes a substantial avoidable burden on health systems through excess hospitalisation and disease progression [4,5]. The burden of primary non-adherence is greatest in chronic conditions such as diabetes, hypertension, and hyperlipidaemia, where up to half of patients are non-adherent [4]. Harm is greatest in primary non-adherence because the patient is never exposed to the medicine and none of its potential benefits can be realised. Beyond the clinical cost, prescriptions issued but never dispensed also represent a prescribing effort that contributes to system-level inefficiency and waste in healthcare [6].
Despite this avoidable harm, primary non-adherence is both common and persistent. Across healthcare settings, primary non-adherence ranges from a few per cent to around 20% [7,8,9], with the highest rates observed for newly prescribed drugs for chronic conditions such as hypertension, hyperlipidaemia, and diabetes [7]. Danish general practice reported an overall primary non-adherence rate of approximately 9%, though it varied widely by therapeutic group [10]. A Canadian study further linked even modest out-of-pocket costs to a higher likelihood of primary non-adherence [11].
The reported rates nonetheless differ markedly across countries and care settings, reflecting variation in health-system structures, medicine financing, prescribing practice, and patients’ beliefs [12]. Although the three Baltic States operate comparable, comprehensive national e-prescription systems [13], most evidence on primary non-adherence still comes from Western European and North American systems, and the phenomenon has rarely been assessed in the Baltic region [14,15]. This gap is consequential for Lithuania, which carries a heavier chronic-disease and avoidable-mortality burden than its Nordic neighbours and, in 2020, had the second-highest avoidable mortality in the EU [16,17]. However, medicine adherence studies in Lithuania are often limited to selected medicine groups, and a comprehensive overview is lacking [18,19,20,21,22].
Drawing on Lithuania’s nationwide electronic prescription system, which captures virtually all outpatient prescribing and has been mandatory across all healthcare institutions since 2018 [23,24], we set out to analyse all outpatient prescriptions issued between 2018 and 2024 at the prescription level. This study aims to (1) estimate primary non-adherence across Lithuania between 2018 and 2024, (2) identify prescription-, prescriber-, and patient-level factors associated with it, and (3) characterise its regional variation.
2. Materials and Methods
2.1. Study Design
We conducted a descriptive, nationwide, registry-based study of outpatient electronic prescriptions and their dispensing in Lithuania from 1 January 2018 to 31 December 2024. Prescriptions issued in 2025 were excluded because their dispensing window, which can last up to 365 days in some cases, may not have closed by the data-publication date (27 January 2026) [24]. Therefore, retaining 2025 would misclassify not-yet-dispensed prescriptions as non-adherent and overstate primary non-adherence.
2.2. Data Sources
The data came from two publicly available datasets on the Lithuanian Open Data Portal, both derived from the e-Prescription subsystem of the national e-Health Services and Cooperation Infrastructure Information System (ESPBI IS): a dataset of issued outpatient prescriptions and a dataset of dispensed prescriptions by community pharmacies [25,26,27]. The datasets were linked deterministically through a pseudonymised prescription identifier.
Both datasets are de-identified at the source and openly available under the Creative Commons Attribution 4.0 licence; therefore, ethical approval and informed consent were not required. Because the data are aggregated and released as open data rather than extracted under a study-specific protocol, the analysis adopts the publisher’s variable definitions and suppression rules. The applied small-cell suppression rules within each calendar quarter were as follows. The prescribing-institution municipality and the patient’s residence municipality are each suppressed where fewer than five prescriptions were issued for a given diagnosis in that municipality and quarter. Prescriber qualification is suppressed where fewer than three physicians of the same qualification prescribed in a given institution municipality and quarter. Suppressed values were retained throughout as an explicit “Unknown” category so that no records were lost to suppression.
2.3. Study Population and Unit of Analysis
The electronic prescription system covers the entire Lithuanian population, and prescribing through it has been mandatory across all healthcare institutions and community pharmacies since 2018 [23,24]. We included all outpatient electronic prescriptions for medicinal products issued during the study period. Medical devices, named-patient and extemporaneous preparations, and other non-medicinal items were excluded. Extemporaneous preparations and named-patient medicines each accounted for approximately 0.06% of all issued prescriptions; their rarity meant that including them would introduce disproportionate small-cell suppression of other variables under the applied confidentiality rules (Section 2.2), so they were excluded from the main analysis, alongside medical devices and named-patient preparations. Dispensing records were retained by matching prescription identifiers.
The unit of analysis was the individual prescription. Because no patient identifier was available, prescriptions were treated as independent observations, and all patient-level results describe distributions of prescriptions rather than persons.
2.4. Outcome
The main outcomes of the study were prescription adherence and primary non-adherence. Because the Lithuanian system permits partial dispensing, the total quantity dispensed for each prescription was summed across all linked dispensing events, regardless of the dispensing quarter, and compared with the prescribed quantity. Prescriptions were classified into three mutually exclusive categories: completed (dispensed quantity ≥ 90% of that prescribed), partially completed (some quantity dispensed but <90%), and not completed (no quantity dispensed). The ≥90% threshold for “completed” was chosen a priori to allow for minor rounding and pack-size mismatches between prescribed and dispensed quantity, consistent with thresholds used in dispensing-based adherence studies. The not-completed category defined primary non-adherence, the primary outcome.
2.5. Covariates
Prescribed medicines were classified using the WHO Anatomical Therapeutic Chemical (ATC) system at the anatomical main group (level 1) and therapeutic subgroup (level 2) [28]. Because the ATC classification is revised annually, to ensure consistent classification across the years, every code was mapped to its current valid equivalent using a reference crosswalk before analysis (ATC/DDD version 2024); codes with no surviving equivalent were classified as “Unknown”. Reimbursement status was recorded as reimbursed or non-reimbursed from the prescription data, reflecting whether the prescription was issued as eligible for reimbursement rather than the actual reimbursement at dispensing; it therefore captures prescribing intent. Intended treatment duration, derived from the prescribed duration in days, was categorised as short-term (≤30 days), medium-term (31–90 days), or long-term (>90 days) to distinguish acute courses from the longer-term management of chronic disease.
Patient characteristics, recorded at the time of the prescription, comprised sex (female, male, or unknown) and age group (0–17, 18–44, 45–64, ≥65 years, or unknown). These age groups follow standard demographic dependency thresholds [29]: children are typically still in education, people aged 15–64 are considered the working-age population, and those aged 65 and over are more likely to be retired, while the 18–44 and 45–64 subgroups help distinguish earlier and later working-life stages with different labour-market participation, health profiles and care needs.
Prescriber characteristics comprised speciality (general practitioner, internal medicine physician, psychiatrist, other physician, physician with multiple specialities, non-physician prescriber (i.e., healthcare professionals other than medical doctors with legal authority to prescribe in Lithuania, such as specialist nurses and dentists; pharmacists were not classified as prescribers, as they do not hold independent prescribing authority), or unknown) and location relative to the patient, determined by comparing the prescribing institution’s municipality with the patient’s declared municipality. Pharmacists’ role in Lithuania for independent dispensing of medicines is limited. Pharmacists may dispense certain prescription-only medicines without a currently valid prescription to support continuity of previously prescribed ongoing treatment. However, this can be done only for a short duration to allow the patient to obtain a valid prescription. Therefore, it does not constitute independent prescribing and is not captured in the issued-prescription dataset used to define our study cohort, so it cannot bias the classification of primary non-adherence reported here.
Geographic characteristics comprised the patient’s declared municipality of residence (one of Lithuania’s 60 municipalities) and its degree of urbanisation (city, town or suburb; rural area), derived from the Eurostat Degree of Urbanisation (DEGURBA) classification of local administrative units [30].
2.6. Statistical Analysis
The analyses were descriptive. We summarised the distribution of prescriptions across patient, prescriber, geographic, and drug characteristics, reporting the number of prescriptions and the proportion in each fulfilment category (completed, partially completed, not completed) as percentages for each subgroup. To describe temporal and spatial patterns, primary non-adherence was estimated by calendar quarter and by municipality, each with a 95% Wilson confidence interval [31].
To examine which factors were associated with primary non-adherence, we modelled the binary outcome of not completed versus completed or partially completed using logistic regression. Crude odds ratios were obtained from separate univariable logistic regression models, one per covariate. Adjusted odds ratios were obtained from a single multi-variable model that adjusted for calendar year, quarter, sex, age group, reimbursement status, treatment duration, degree of urbanisation, prescriber speciality, prescriber location, and ATC level-1 class, with the first level of each variable as the reference. Because of its high dimensionality (60 categories), the municipality was assessed using crude odds ratios only and was not included in the adjusted model [32].
Because the dataset comprises more than 100 million prescriptions, conventional hypothesis testing is uninformative [33]. We therefore interpret odds ratios descriptively, by direction and magnitude rather than by statistical significance, and report 99% confidence intervals to convey precision while discouraging threshold-based reading.
Data management and analyses were conducted in RStudio (version 2025.9.2.418 with R version 4.5.2).
2.7. Missing Data
Categorical covariate values missing due to source de-identification were retained as an explicit “Unknown” category and included in all the analyses, so no records were dropped via listwise deletion. Where the dispensed quantity was censored in the source data, the event was treated as dispensing at least one unit to avoid misclassifying unquantified dispensing as null. No other imputation was performed.
3. Results
3.1. Study Population and Overall Prescription Fulfilment
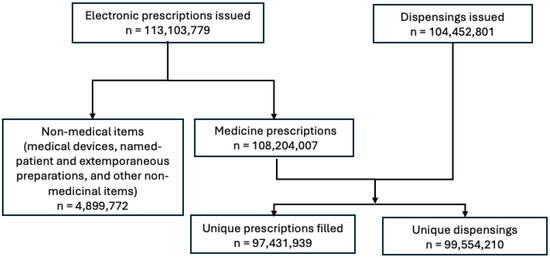
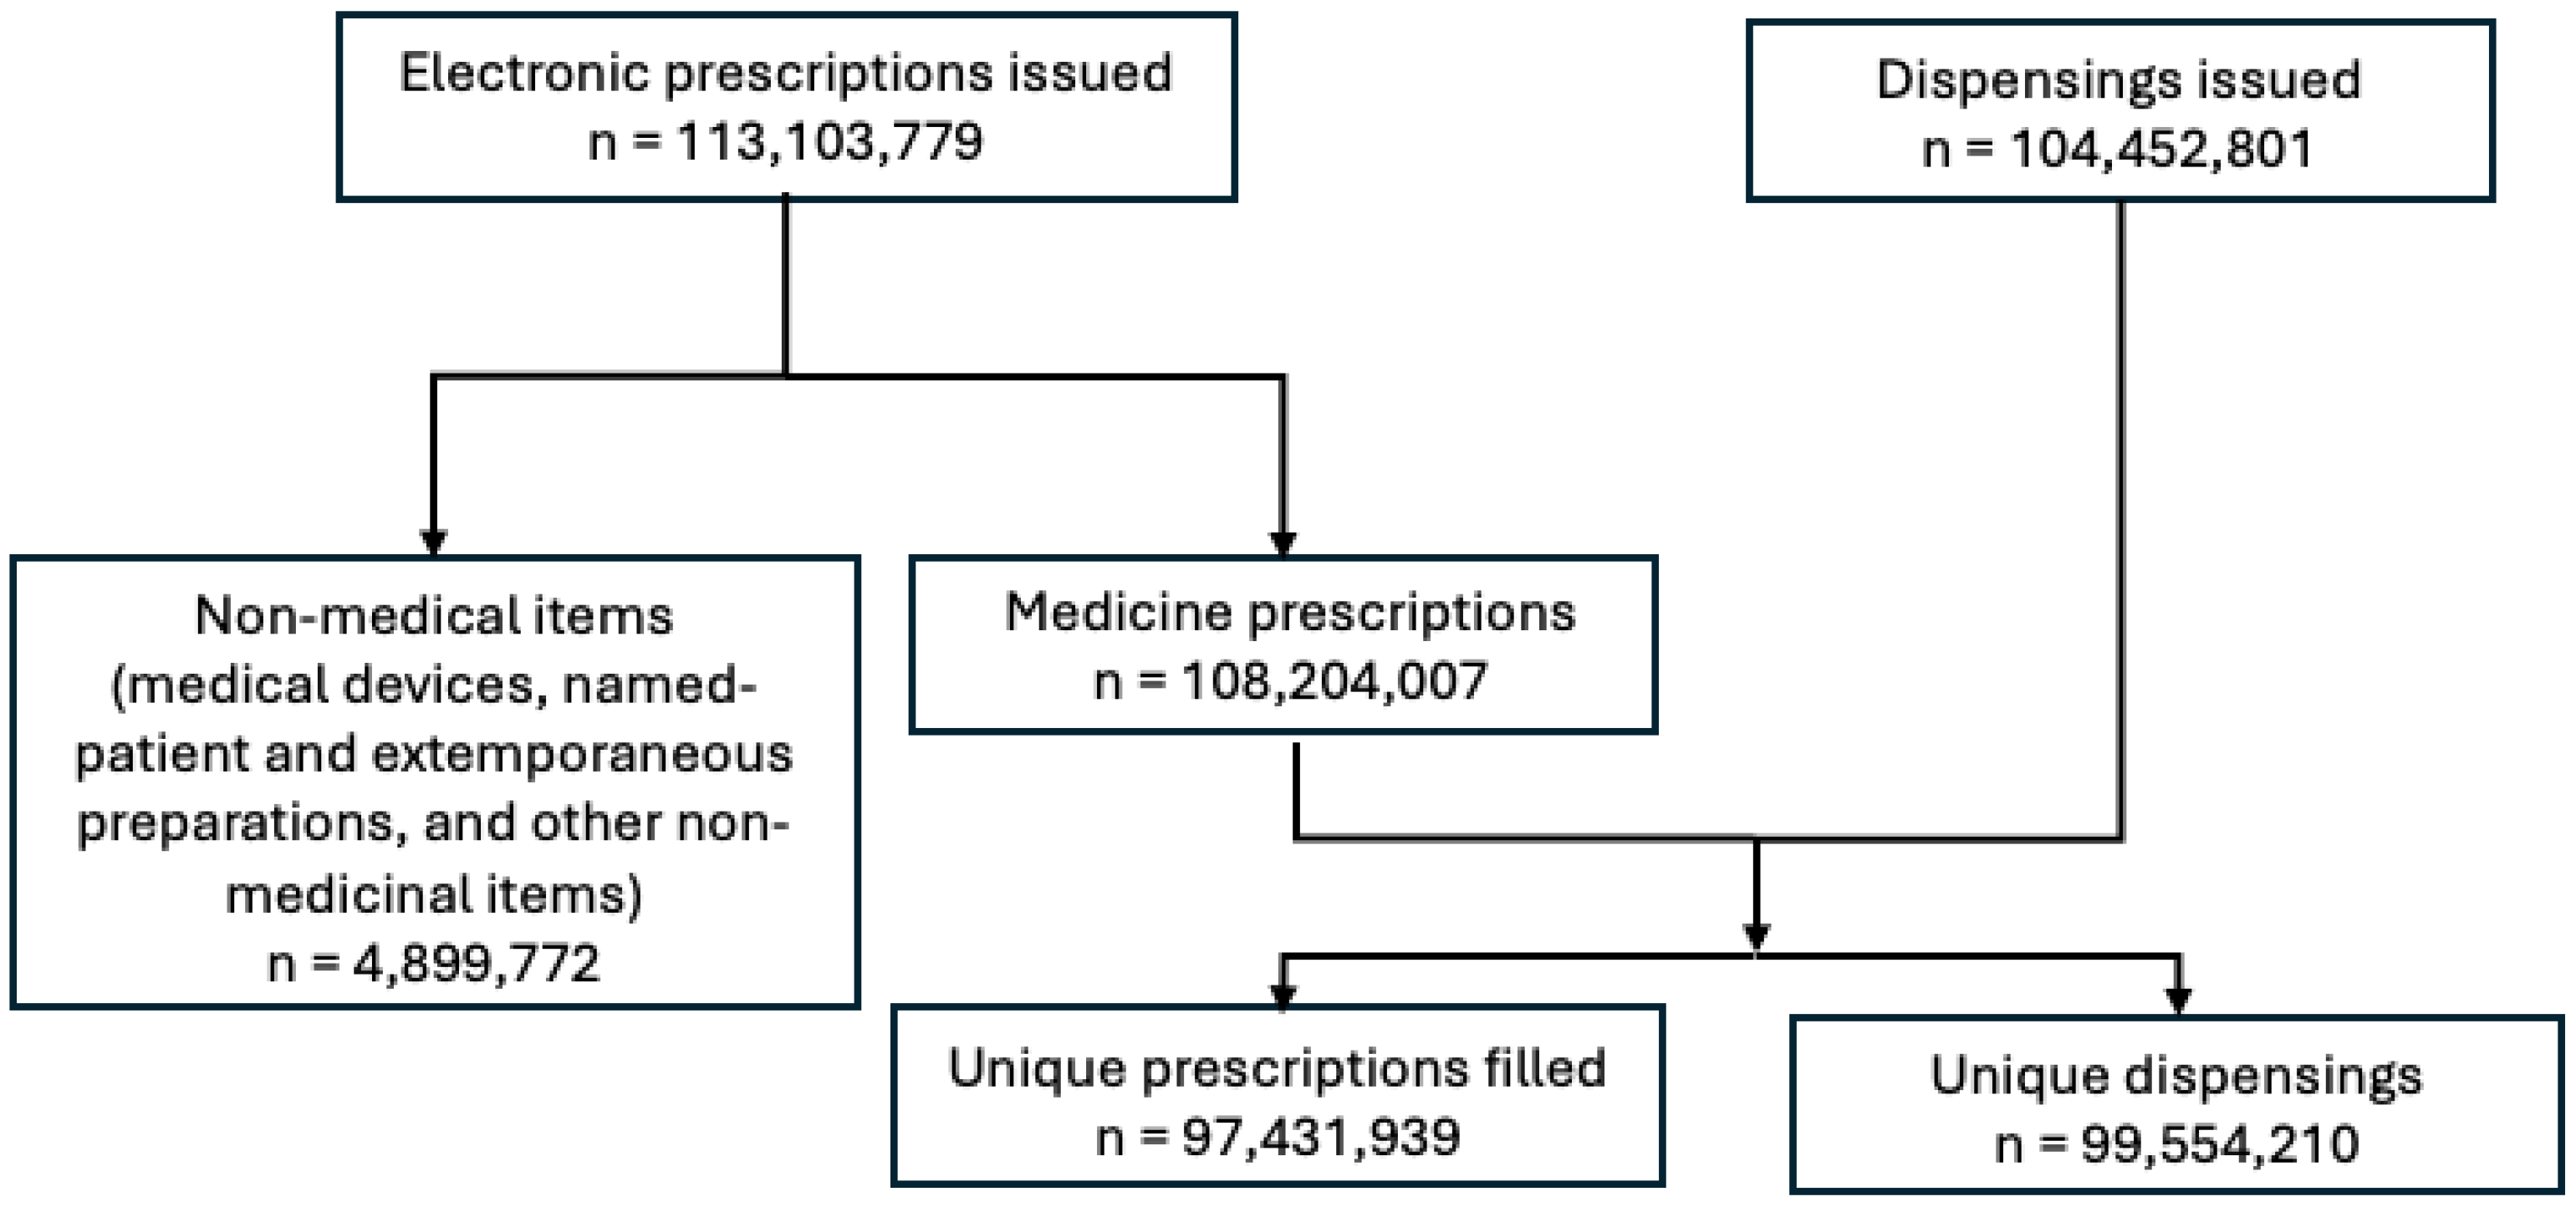
Between 2018 and 2024, 108,204,007 medicine prescriptions issued through the national electronic prescription system met the inclusion criteria and were linked to dispensing records (Figure 1). Their characteristics are summarised in Table 1. Most were issued to patients aged ≥65 years (52.7%) and to women (62.9%). Most (62.8%) were marked as reimbursable by the prescriber. Cardiovascular (ATC group C, 38.5%) and nervous system (group N, 19.2%) medicines together accounted for more than half of all the prescriptions, and 59.6% were issued by general practitioners (Table 1).
Figure 1.
Flow diagram for selecting electronic prescription records and linking them to dispensing records in Lithuania, 2018–2024.
Table 1.
Characteristics of electronically issued medicine prescriptions, Lithuania 2018–2024.
Overall, 94,002,217 (86.9%) prescriptions were completed, 3,429,721 (3.2%) were partially completed, and 10,772,069 (10.0%) were never dispensed and therefore classified as primary non-adherence (Supplementary Table S1).
Of 113,103,779 prescription records issued, 4,899,772 (4.3%) were excluded: medical devices (n = 4,424,109, 3.91%), other non-medicinal items (n = 344,679, 0.30%), named-patient medicines (n = 68,690, 0.06%), and extemporaneous medicines (n = 62,294, 0.06%), leaving 108,204,007 (95.7%) eligible outpatient medicine prescriptions.
Eligible prescriptions were deterministically linked to 104,452,801 pharmacy dispensing records using a pseudonymised prescription identifier generated for each prescription and present in both prescription and dispensing datasets. Overall, 99,554,210 dispensing records were successfully matched, corresponding to 97,431,939 unique prescriptions with at least one dispensing record.
3.2. Yearly Trends
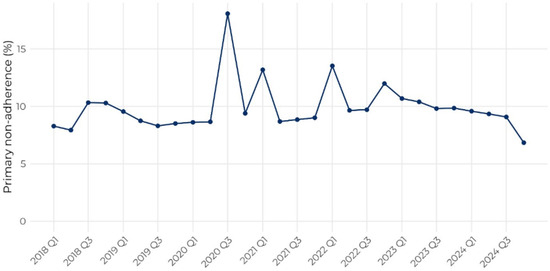
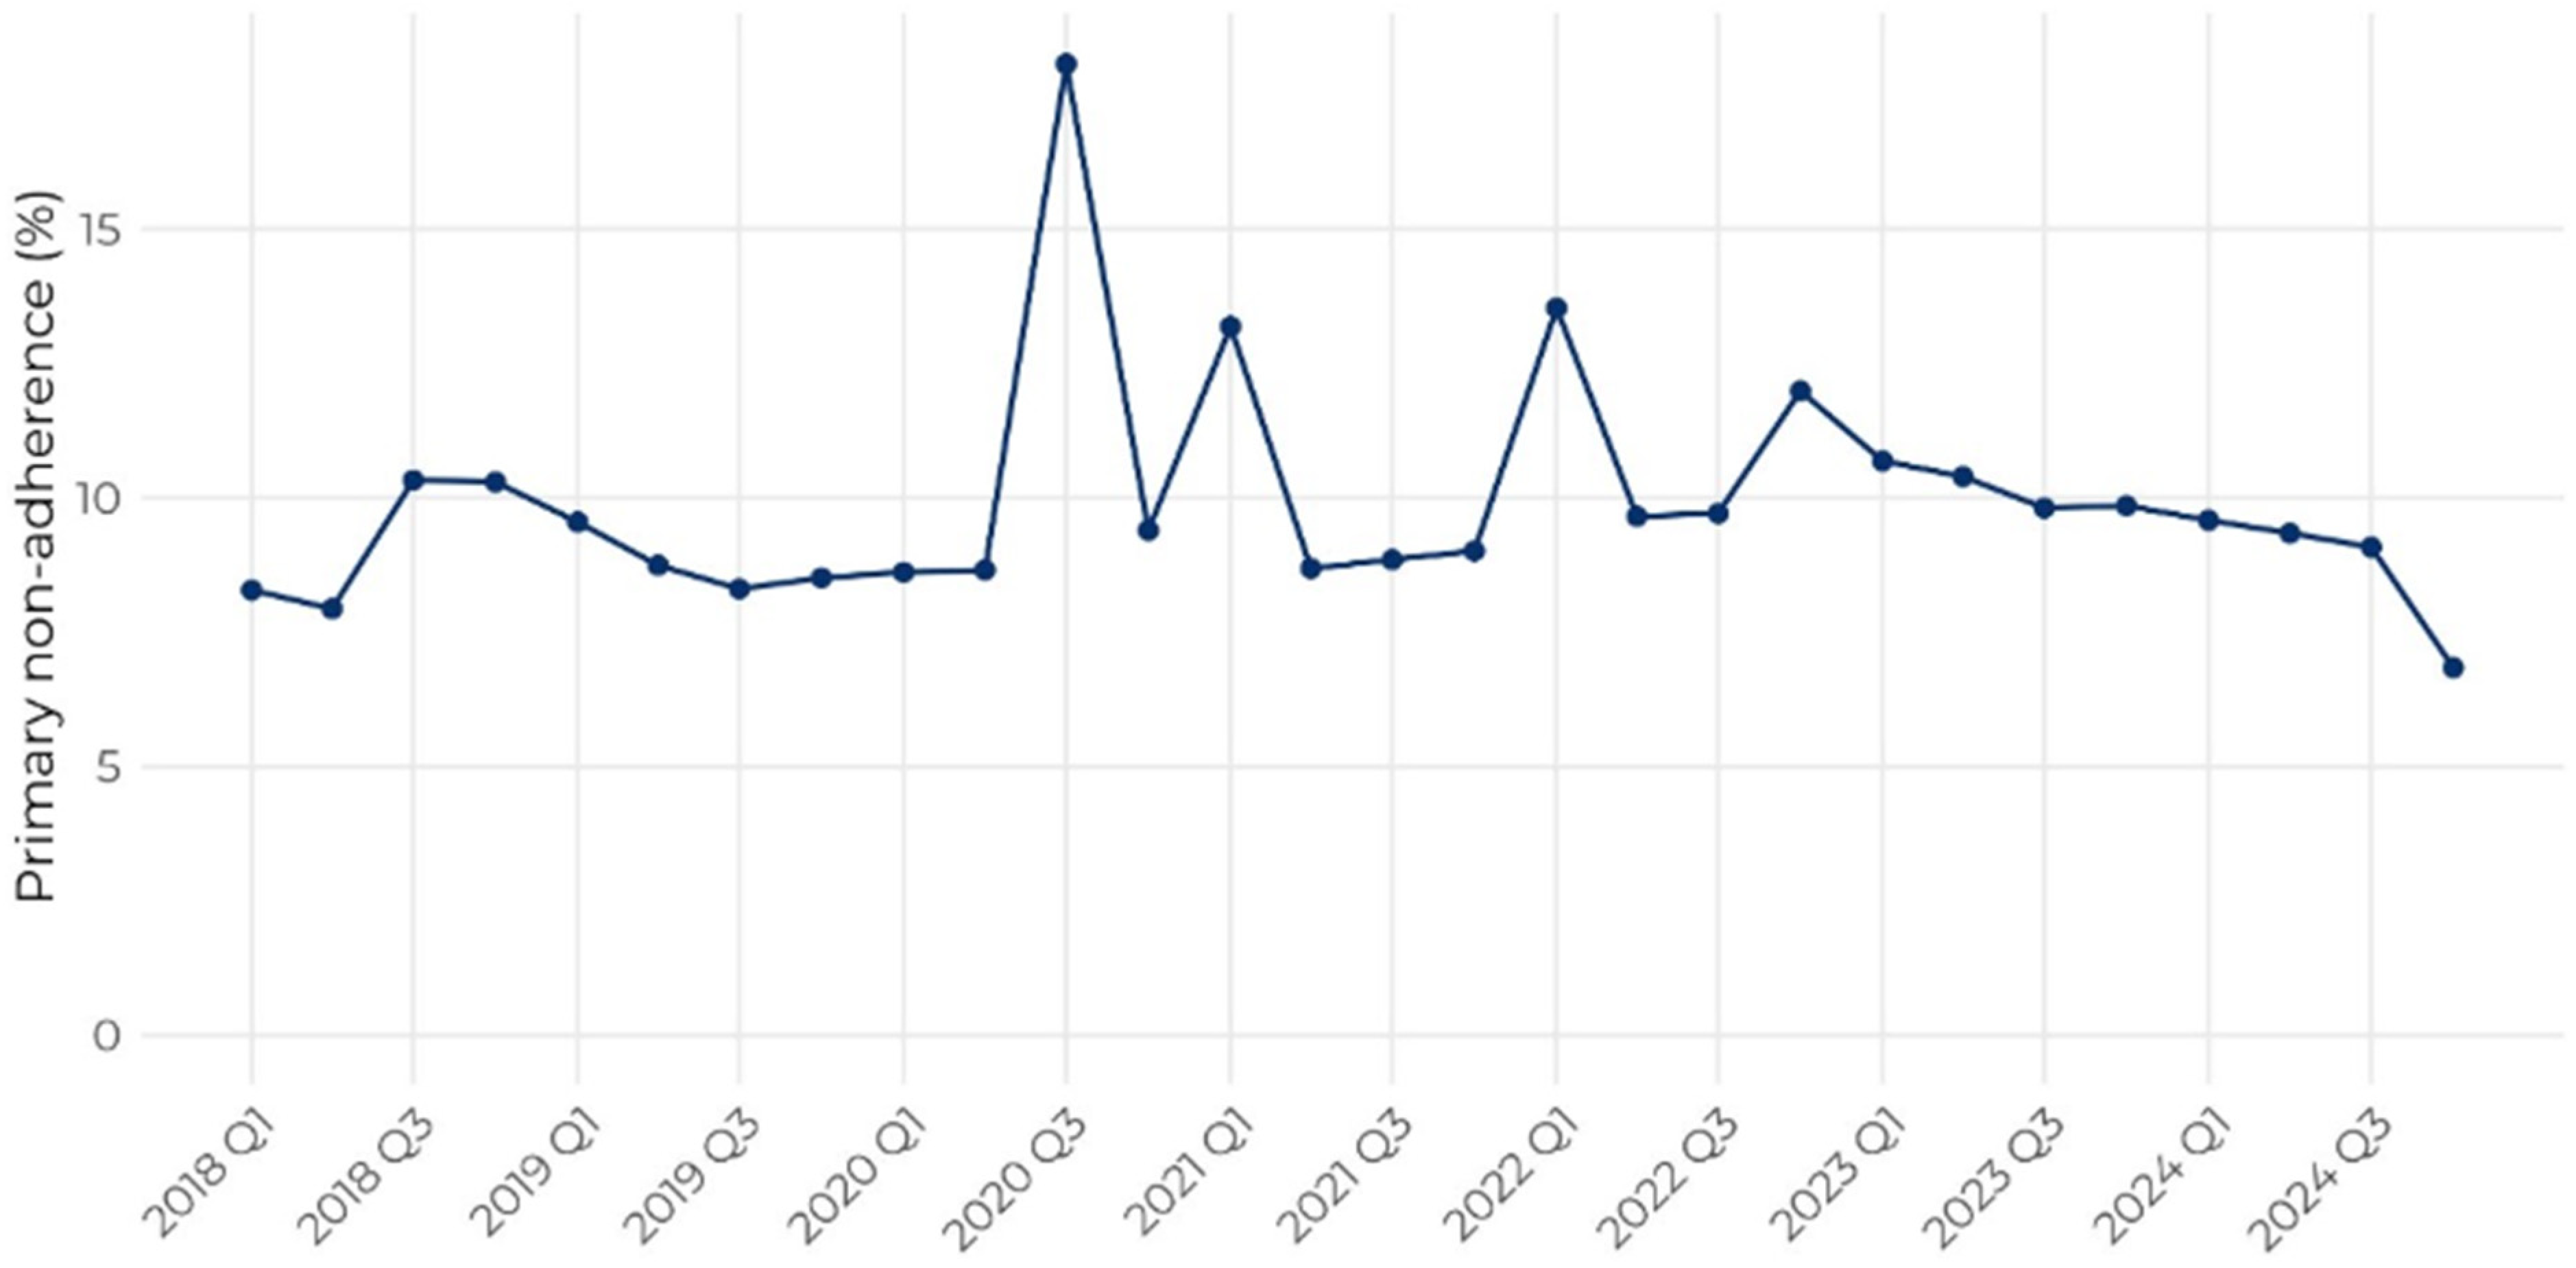
The crude annual primary non-adherence rate fluctuated between 8.7% and 11.3% over the study period, with peaks in 2020 (11.2%) and 2022 (11.3%), and the lowest rate in 2024 (8.7%) (Figure 2, Supplementary Table S1). After adjustment for case mix, however, the odds of primary non-adherence declined steadily relative to 2018, reaching an adjusted odds ratio (aOR) of 0.66 (99% CI 0.66–0.66) in 2024 (Table 2). The discordance between the crude peaks and the downward trend indicates that the apparent increases in 2020 and 2022 were attributable to shifts in prescribing composition rather than to a genuine rise in non-adherence.
Figure 2.
Quarterly trend in primary non-adherence to outpatient electronic prescriptions, Lithuania, 2018–2024.
Table 2.
Crude and adjusted OR of factors associated with primary non-adherence.
3.3. Patient-Level Factors
A pronounced age gradient was observed: primary non-adherence fell from 19.2% among adults aged 18–44 years to 7.0% among those aged 65 years or older (Supplementary Table S1), corresponding to an aOR of 0.56 (99% CI 0.56–0.56) for the oldest relative to the youngest (0–17 years) group (Table 2). Women were modestly less likely than men to leave a prescription undispensed (9.4% vs. 10.9%; aOR 0.91, 99% CI 0.91–0.91).
3.4. Prescription and Therapeutic-Class Factors
Primary non-adherence was most prevalent in short-term therapies (14.1%) and markedly lower in medium- and long-term treatments (5.9% and 5.7%; aOR 0.82 and 0.79 vs. short-term) (Table 2, Supplementary Table S1). Variation across the therapeutic classes was substantial: primary non-adherence was the lowest for antineoplastic and immunomodulating agents (group L, 2.8%), systemic hormonal preparations (group H, 6.2%), and cardiovascular medicines (group C, 6.6%), and the highest for musculoskeletal (group M, 18.2%), respiratory (group R, 17.0%), and dermatological (group D, 16.9%) medicines. The “Various” class (group V) was an extreme outlier at 67.3% (aOR 7.10, 99% CI 7.06–7.14).
Primary non-adherence by prescription quarter, Lithuania, 2018–2024. Primary non-adherence is defined as the proportion of issued electronic prescriptions that were never dispensed among all the prescriptions issued in that quarter. The marked peak in Q3 2020 coincides with the COVID-19 period.
At the subgroup level (Supplementary Table S2), chronic cardiometabolic therapies showed the lowest primary non-adherence—drugs used in diabetes (A10, 4.4%), antihypertensives (C02, 4.9%), and beta-blockers (C07, 5.4%)—whereas symptomatic and supplement-type preparations showed the highest, including drugs for constipation (A06, 40.4%), vasoprotectives (C05, 39.5%), and vitamins (A11, 23.3%). The strongest single correlate of primary non-adherence was reimbursement status. Non-reimbursed prescriptions were left undispensed in 17.8% of cases, compared with 5.3% of reimbursed prescriptions (Supplementary Table S1), an association that persisted after full adjustment (aOR 3.47, 99% CI 3.46–3.48) (Table 2).
3.5. Prescriber-Related Factors
Primary non-adherence varied by prescriber type (Supplementary Table S1). Prescriptions written by psychiatrists were the least likely to be left undispensed (5.3%; aOR 0.67, 99% CI 0.66–0.67) compared with those from general practitioners, whereas those from non-physician prescribers (19.2%) and “other physician” specialities (15.2%) showed higher crude rates (Table 2). For non-physician prescribers, the crude association (OR 2.36) was reversed after adjustment (aOR 0.74, 99% CI 0.74–0.75), suggesting confounding by patient and medicine characteristics of these prescriptions. Prescriptions issued by a prescriber located outside the patient’s own municipality were slightly more likely to be left undispensed (10.6% vs. 9.5%; aOR 1.16, 99% CI 1.16–1.17).
3.6. Geographic Variation
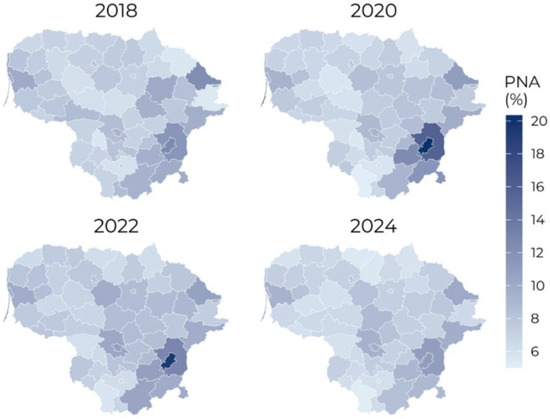
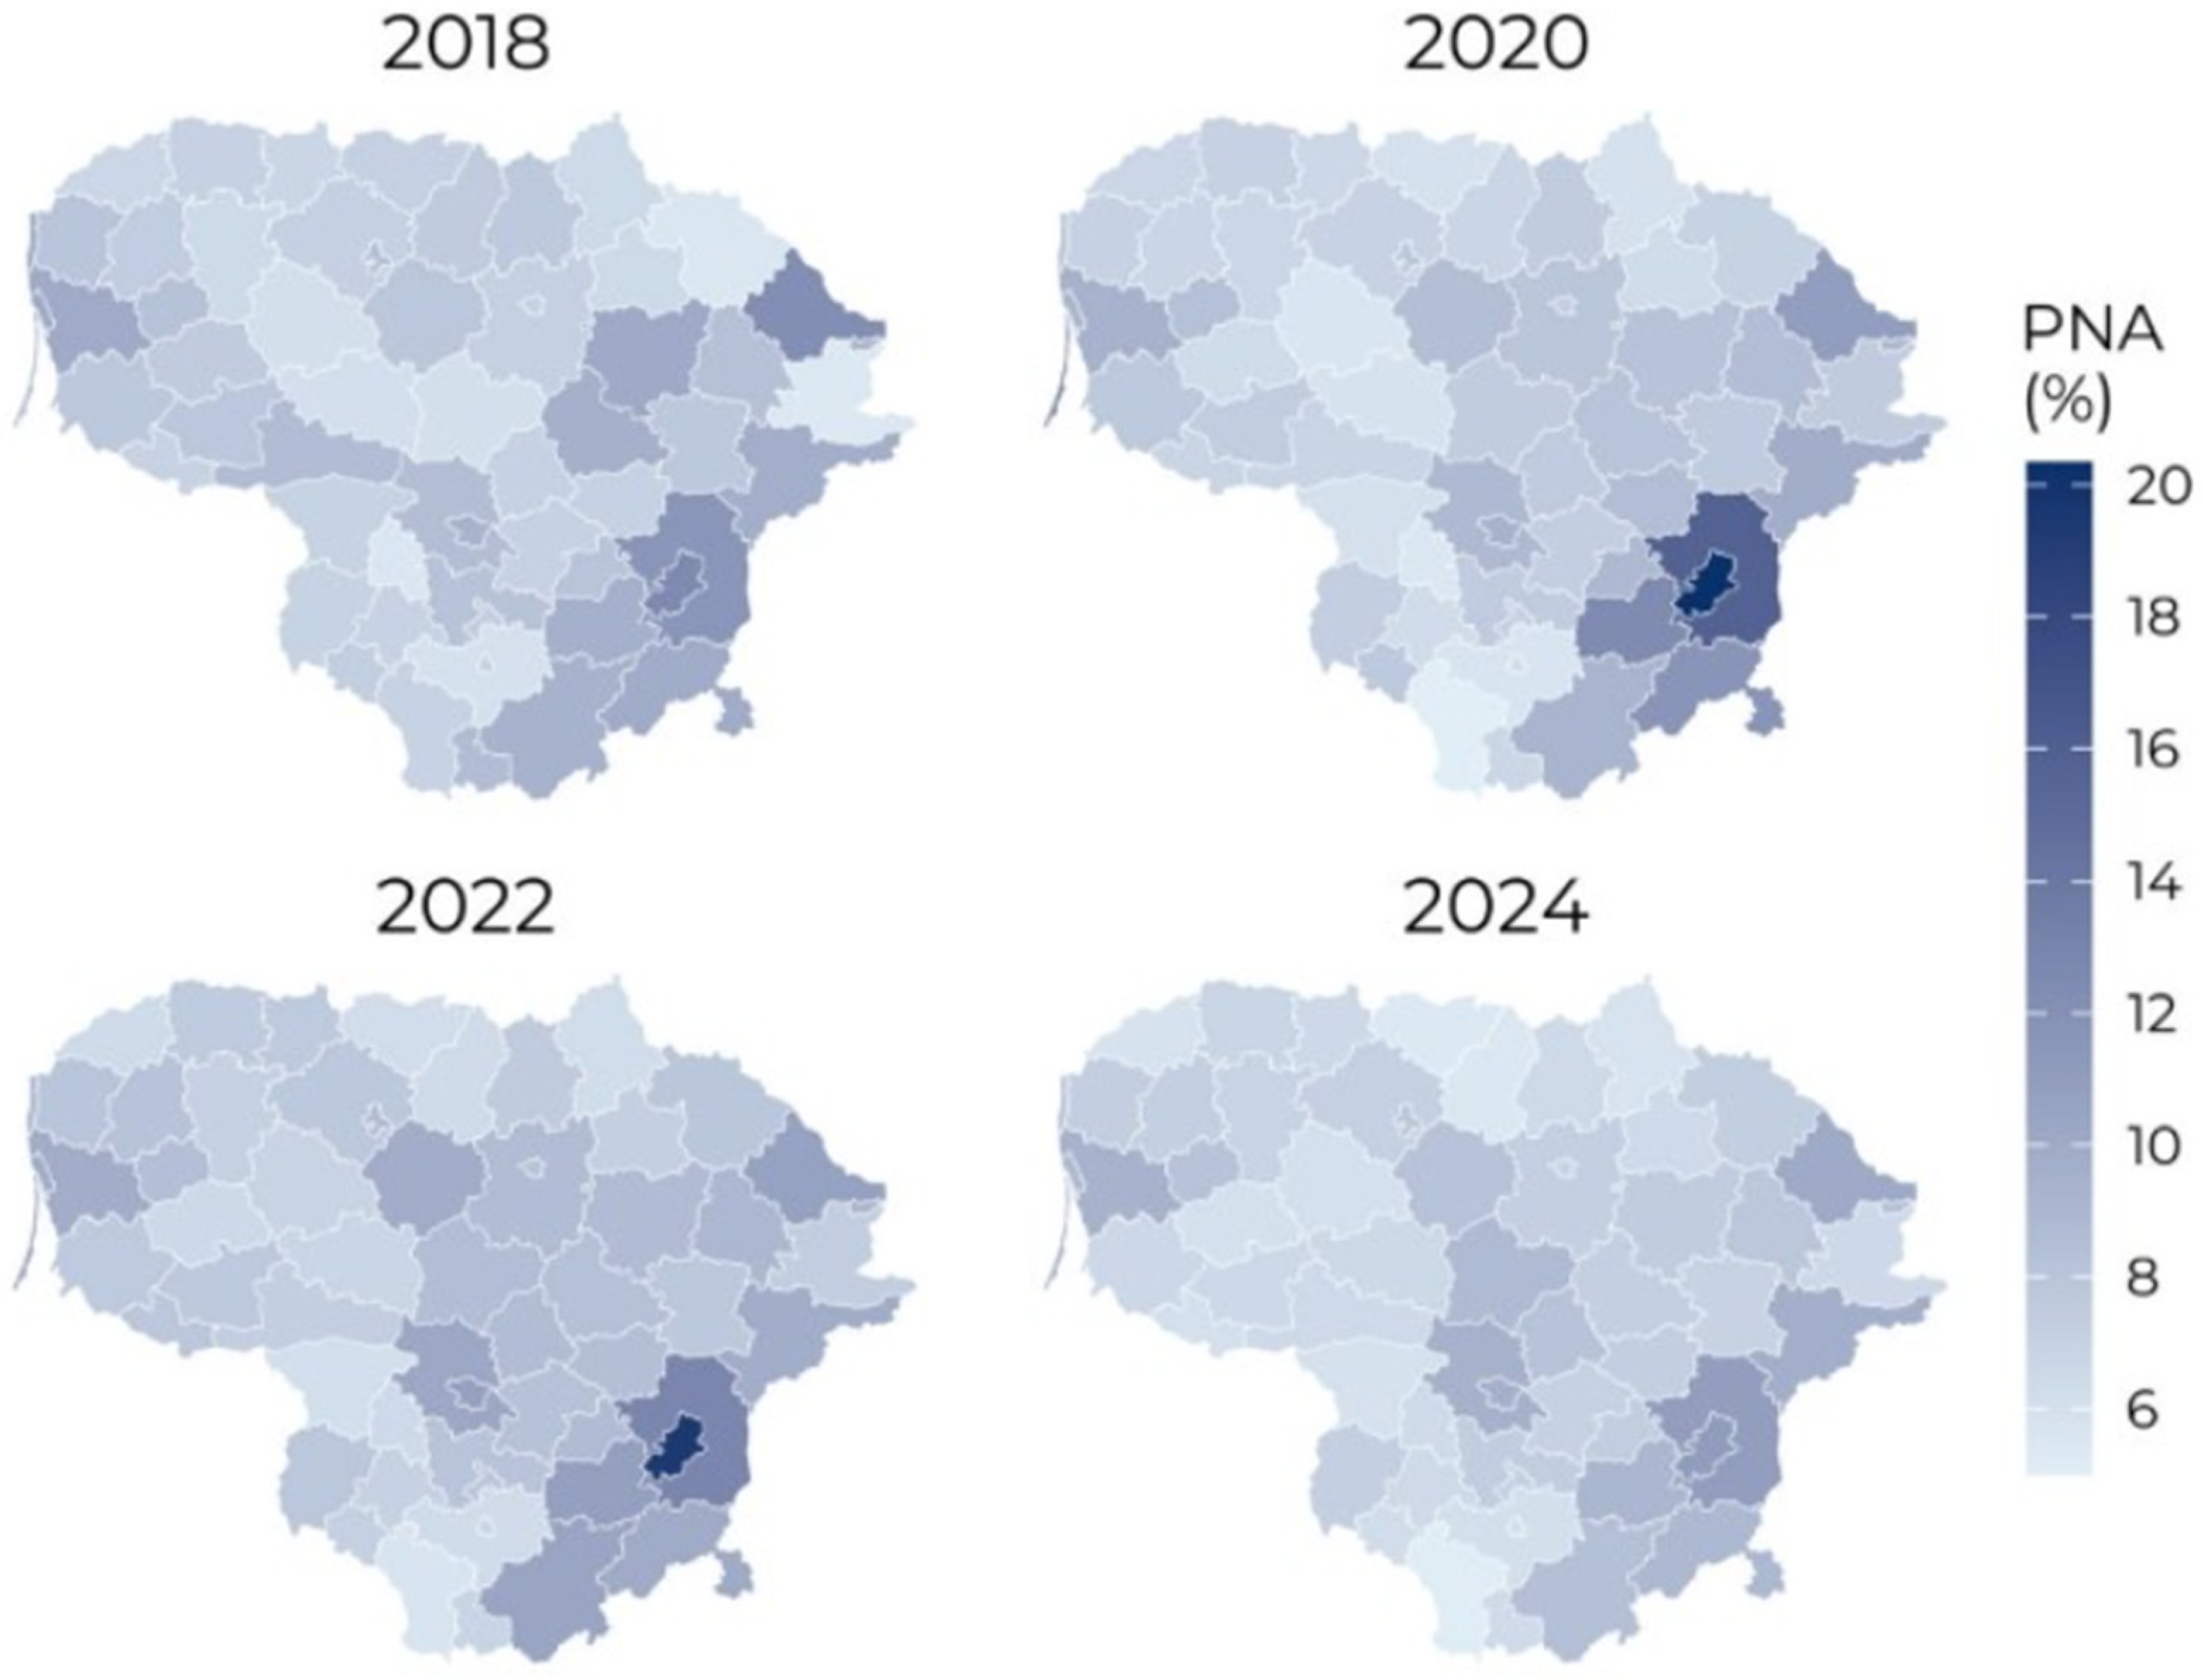
Primary non-adherence was higher in cities (~11.8%) than in towns or suburbs (~7.5%) and in rural areas (~8.1%) (Supplementary Table S1), with adjusted ORs of 0.79 and 0.80 relative to cities (Table 2). This urban excess was driven largely by the two largest cities: Vilnius city municipality had the highest primary non-adherence of any municipality (15.3%), followed by Vilnius district (12.4%), while the lowest rates were in predominantly rural municipalities such as Lazdijai (5.5%) and Biržai (6.0%) (Supplementary Table S3). The municipality-level primary non-adherence rate showed a persistent geographic pattern over time, with consistently elevated non-adherence in and around the Vilnius metropolitan area (Figure 3).
Figure 3.
Geographic distribution of primary non-adherence across Lithuanian municipalities, 2018–2024.
Primary non-adherence was defined as the proportion of electronic prescriptions that were never dispensed among all the prescriptions issued in a given municipality and year. The colour intensity is scaled to the Primary non-adherence rate, with darker blue indicating higher non-adherence and lighter blue indicating lower non-adherence. Each of the 60 Lithuanian municipalities is mapped to its 2021 administrative boundary (Eurostat/GISCO LAU geometry, joined on LAU code [30]).
The figure consists of four panels, one per year, containing maps of Lithuania designed to convey two things at once: the spatial pattern of primary non-adherence (which municipalities have high vs. low rates) and its temporal evolution across the 2018–2024 study window, sampled biennially.
4. Discussion
In this nationwide analysis of more than 108 million outpatient electronic prescriptions issued in Lithuania between 2018 and 2024, one in ten (10.0%) was never dispensed, constituting primary non-adherence, with an additional 3.2% partially dispensed. The single largest correlate was reimbursement status: prescriptions issued as non-reimbursable were more than three times as likely to remain undispensed. Primary non-adherence was further associated with short-course prescriptions and younger patients, and it showed a persistent geographic pattern, with higher non-adherence rates around the capital.
The overall rate of 10.0% falls within the internationally reported range but towards its lower end: roughly one in five new US e-prescriptions go unfilled [7]; the Danish whole-population estimate is approximately 9% [10]; and a meta-analysis of chronic-disease prescriptions placed the pooled rate near one in six (17%) [8]. The closest regional comparison comes from Estonia, where the national e-prescription system was used to estimate primary non-adherence of 13.1% for osteoporosis medicines [14]. The similarity of our results to those in Danish and Estonian articles might be explained by a comparable setting—a population-wide register linkage of issued and dispensed prescriptions in a tax-funded system with near-universal reimbursement [10].
Direct comparison is nonetheless limited by a definitional difference: most prior studies measure non-initiation of incident (first-ever) prescriptions [9,10,11], whereas our denominator comprised all prescriptions. Because established therapy generates a succession of mostly dispensed prescriptions up to the point of non-persistence, this all-prescription denominator can lower our primary non-adherence estimate relative to incident-prescription studies. However, established therapy can still fail at some point along its course [19,34,35], and these later breakdowns are likely captured partly by our partially completed category.
The strongest single correlate was reimbursement status: non-reimbursed prescriptions were more than three times as likely to go undispensed as reimbursed ones. This aligns with Canadian evidence that even modest out-of-pocket costs raise non-initiation [11] and with the broader principle that financial barriers operate at the threshold of treatment, before any exposure begins [4,5]. In the Quebec cohort, eliminating prescription co-payments for low-income groups was associated with substantially lower non-initiation (OR 0.37), and higher-cost drugs were the least likely to be filled, directly implicating the price faced at the counter [11]. Higher co-payments likewise emerged as one of the few consistently reported correlates of primary non-adherence across chronic diseases in the meta-analysis [8], and a scoping review of interventions found that co-payment relief, manufacturer coupons, and out-of-pocket subsidies were among the most reliably effective levers for reducing non-initiation [36]. As reimbursement in these data reflects the eligibility recorded on the prescription rather than realised payment, it captures the cost signal a patient anticipates at the counter. However, even though benzodiazepines are reimbursed in only a minority of cases, these classes demonstrate high adherence and persistence both in Lithuania and in the rest of the Baltic States [13,22]. The pharmacology of this drug class offers a plausible additional explanation: benzodiazepines cause physical and psychological dependence, and tolerance develops with repeated use, both of which are likely to sustain collection and re-prescribing independently of reimbursement status. This should be regarded as a plausible contextual factor rather than a causal explanation that our data can directly test. Therefore, much of the apparent variation can probably be explained by therapeutic class and therapeutic indications.
The class and duration patterns reinforce this interpretation but in a direction opposite to some earlier work. Non-initiation was lowest for chronic cardiometabolic therapies—drugs used in diabetes (4.4%), antihypertensives (4.9%), beta-blockers (5.4%), and lipid-lowering agents—and for long-course prescriptions and was highest for short-course, symptomatic, and discretionary products: anti-inflammatory and musculoskeletal agents, respiratory and cough-and-cold preparations, laxatives, vasoprotectives, and vitamins, culminating in the heterogeneous “Various” group, two-thirds of which was never dispensed. This is the reverse of the classic US observation that newly prescribed preventive medicines for hypertension, hyperlipidaemia, and diabetes are among the least likely to be filled [5]. It is, however, closely consistent with the Danish register study, where cardiovascular medicines (ATC group C) had the lowest non-initiation of any main group (4.7%), and with Cheen’s meta-analysis, in which diabetes had the lowest pooled primary non-adherence of the conditions examined (10%) [8,10]. The most plausible explanation is again reimbursement and clinical necessity: in Lithuania, chronic cardiometabolic medicines are typically reimbursed and embedded in ongoing disease management, whereas the high-primary non-adherence classes are largely symptomatic, frequently non-reimbursed, and often perceived as non-essential [37]. The low non-initiation of cardiometabolic medicines also complements existing Lithuanian work on the continuation of such therapies [13,14], extending the picture to the initiation stage. The contrast is instructive: those studies showed that, once started, only around 41% of Lithuanian statin users persisted at one year [19]. The present data show that initiating these reimbursed therapies through the pharmacy is comparatively reliable, with the principal loss for cardiometabolic drugs occurring at the implementation and persistence stages rather than at initiation.
The higher non-adherence among children and younger adults and lower rate among older patients mirrors international findings [5,6] and the pooled evidence, in which younger age is among the most consistently reported patient-level correlates of primary non-adherence. Studies of younger populations report higher rates (19% vs. 11% for mean age <65 vs. ≥65 years) [8], and this pattern is consistent with the same account, since older patients receive a proportionally higher share of reimbursed chronic-disease prescriptions. Differences by prescriber type largely dissolved or reversed on adjustment: the high crude non-initiation among non-physician prescribers (19.2%) reversed to below-average adjusted odds (aOR 0.72), indicating confounding by the acute, non-reimbursed mix of what they prescribe rather than any intrinsic prescriber effect. By contrast, the consistently low rate for psychiatrists (aOR 0.67) is compatible with the chronic, reimbursed, and closely followed nature of psychotropic treatment. Prescriptions issued outside the patient’s home municipality were modestly more likely to go undispensed (aOR 1.16), perhaps reflecting care obtained away from the usual source and weaker follow-up [38,39].
Additionally, the COVID-19 pandemic fell within our study period and coincided with a marked crude peak in primary non-adherence (2020, 11.2%). This crude peak did not persist after adjustment for case mix, indicating that it reflects a pandemic-related shift in the composition of prescribing rather than a genuine increase in patients’ propensity not to collect prescribed medicines.
The most novel finding is the magnitude and persistence of geographic variation. Non-initiation was consistently higher in cities than in towns or rural areas, and the capital stood out sharply: Vilnius city (15.3%) and Vilnius district (12.4%) recorded the highest rates of any municipality, whereas the lowest were in predominantly rural municipalities such as Lazdijai (5.5%) and Biržai (6.0%), a pattern stable across the study period. A higher urban-than-rural rate of non-initiation is consistent with the only comparable population-wide analysis from a neighbouring Central European system, in which Hungarian adherence was significantly lower in urban than in rural settlements and varied markedly by geographic region [40]. This capital-centred primary non-adherence is counterintuitive, as Vilnius combines the country’s best physical access to pharmacies with its highest incomes. Several non-exclusive explanations are plausible: a younger, working-age urban population receiving a disproportionate share of acute, non-reimbursed treatment, and greater use of private and specialist care, generating discretionary paper prescriptions. Because these associations are ecological and measured at the prescription level—and because the municipality was examined using crude odds ratios only—they cannot be attributed to individual behaviour and should be read as a signal warranting individual-level investigation rather than as evidence of specific local causes. That high-primary non-adherence municipalities showed elevated non-initiation across multiple therapeutic groups argues against pure case-mix and points towards population- or system-level factors. Documented regional and income-related inequalities in Lithuanian health-service use—for example, the wide variation in cancer-screening coverage across municipalities and income quintiles—make such system-level explanations plausible [16,41,42].
This study has several strengths. First, it captures the entire national output of outpatient electronic prescribing over seven years, thereby removing selection bias and yielding larger sample sizes even within small subgroups. The national e-prescription system captures virtually all outpatient prescribing in Lithuania, supporting this claim of completeness [23]. Second, prescriptions and dispensings were deterministically linked, allowing primary non-adherence to be measured directly as the gap between what was prescribed and what was collected rather than inferred from claims. Because the linkage is one-to-many, the quantities dispensed across multiple partial fills could be summed, distinguishing fully, partially, and never-dispensed prescriptions rather than treating dispensing as a simple binary. Finally, because the source datasets are openly published, the analysis is fully reproducible.
However, several limitations remain. First, the unit of analysis was the prescription: without a patient identifier, we could not isolate incident (first-ever) prescriptions or merge prescriptions into treatment episodes. Second, our data does not capture medicines obtained outside the community-pharmacy pathway. Third, the open data source censors small-cell counts introduced an “Unknown” category for some categorical variables, most consequentially for municipality and prescriber qualification, which themselves carried high non-initiation and reduced precision in some strata. Fourth, given the sample size, conventional confidence intervals collapse to the point estimate; we therefore report 99% intervals and interpret associations descriptively, by magnitude and direction, rather than as significance tests. Fifth, drug shortages could cause a prescription to remain undispensed for reasons unrelated to patient behaviour; because our data cannot distinguish supply-side unavailability from a patient’s decision not to collect a medicine, some prescriptions classified as primary non-adherence may instead reflect shortages, which could inflate our estimate to an unknown degree. Finally, because individual clinical and socioeconomic information was unavailable, residual confounding cannot be excluded, and the geographic findings remain ecological.
Primary non-adherence represents a large, modifiable, and largely invisible loss between prescribing and treatment. Because it focuses on non-reimbursed and discretionary prescriptions, the most direct levers are financial—reducing the cost at initiation, particularly for essential short-course therapies—and pharmacy-based, such as collection prompts and expiry reminders within the e-prescription system [36]. A recent scoping review found that the two most-studied intervention families—socioeconomic measures that lower out-of-pocket costs and pharmacist-led counselling, reminders, and follow-up contact after non-collection—most consistently reduced primary non-adherence, although the effects were heterogeneous and rigorous trials remain scarce [31,36]. Realising such pharmacy-based prompts at scale would also require addressing the workforce and data-integration barriers that European clinicians identify as limiting adherence management [43]. The pronounced capital-centred geographic gradient further argues for geographically targeted monitoring and intervention. More broadly, analyses restricted to dispensed or reimbursed medicines systematically understate unrealised prescribing intent, and our findings quantify the size of that blind spot in a whole-population setting.
5. Conclusions
In a comprehensive national series spanning 2018–2024, one in ten electronic outpatient prescriptions in Lithuania was never dispensed. Non-adherence showed a marked, persistent geographic variance, with higher rates centred around Vilnius. Reimbursement status was the dominant correlate, indicating cost as a key lever at initiation. Regional variation indicates that targeted interventions might be needed to improve primary adherence.
Supplementary Materials
The following supporting information can be downloaded at https://www.mdpi.com/article/10.3390/pharma5030033/s1, Supplementary Table S1: Characteristics of electronically issued medicine prescriptions by therapeutic class and by municipality, Lithuania 2018–2024; Supplementary Table S2: Distribution of prescription fulfilment status according to prescription and patient characteristics; Supplementary Table S3: Distribution of prescription fulfilment status by therapeutic subgroup (ATC level 2); Supplementary Table S4: Prescription fulfilment status (completed, partially completed and not completed) according to municipality and degree of urbanisation; Supplementary Table S5. Crude OR patients’ municipalities associated with primary non-adherence.
Author Contributions
Conceptualization: V.B. and T.L.; methodology: V.B. and T.L.; software: V.B.; validation: V.B., M.B. and J.A.K.; formal analysis: V.B., M.B. and J.A.K.; investigation: V.B.; resources: V.B., M.B. and J.A.K.; data curation: V.B. and M.B.; writing—original draft preparation: V.B.; writing—review and editing: T.L., L.K., J.A.K. and M.B.; visualization: V.B.; supervision: T.L. and L.K.; project administration: V.B. and L.K. All authors have read and agreed to the published version of the manuscript.
Funding
This research received no external funding.
Institutional Review Board Statement
Both datasets are de-identified at source and openly available under the Creative Commons Attribution 4.0 licence; therefore, ethical approval was not required.
Informed Consent Statement
Both datasets are de-identified at source and openly available under the Creative Commons Attribution 4.0 licence; therefore, informed consent was not required. Because the data are aggregated and released as open data rather than extracted under a study-specific protocol, the analysis adopts the publisher’s variable definitions and suppression rules.
Data Availability Statement
Data are publicly available on the Lithuanian Open Data Portal [25,26]. The code used for analysis will be archived, versioned, and published on Zenodo for public access upon manuscript acceptance [44].
Acknowledgments
During the preparation of this manuscript, the authors used generative artificial intelligence (Claude, Sonnet 5) for language refinement and language clarity. The scientific content, analysis, interpretation, and conclusion were written by the authors.
Conflicts of Interest
The authors declare no conflicts of interest.
Abbreviations
The following abbreviations are used in this manuscript:
| aOR | Adjusted Odd Ratio |
| ATC | Anatomical Therapeutic Chemical classification |
| CI | Confidence Interval |
| DDD | Defined Daily Dose |
| OR | Odds ratio |
| ESPBI IS | National e-Health Services and Cooperation Infrastructure Information System |
References
- Vrijens, B.; De Geest, S.; Hughes, D.A.; Przemyslaw, K.; Demonceau, J.; Ruppar, T.; Dobbels, F.; Fargher, E.; Morrison, V.; Lewek, P.; et al. A New Taxonomy for Describing and Defining Adherence to Medications. Br. J. Clin. Pharmacol. 2012, 73, 691–705. [Google Scholar] [CrossRef] [PubMed]
- Cramer, J.A.; Roy, A.; Burrell, A.; Fairchild, C.J.; Fuldeore, M.J.; Ollendorf, D.A.; Wong, P.K. Medication Compliance and Persistence: Terminology and Definitions. Value Health 2008, 11, 44–47. [Google Scholar] [CrossRef] [Scilit] [PubMed]
- Simpson, S.H.; Eurich, D.T.; Majumdar, S.R.; Padwal, R.S.; Tsuyuki, R.T.; Varney, J.; Johnson, J.A. A Meta-Analysis of the Association between Adherence to Drug Therapy and Mortality. BMJ 2006, 333, 15. [Google Scholar] [CrossRef] [Scilit] [PubMed]
- Khan, R.; Socha-Dietrich, K. Investing in Medication Adherence Improves Health Outcomes and Health System Efficiency: Adherence to Medicines for Diabetes, Hypertension, and Hyperlipidaemia; OECD Health Working Papers; OECD Publishing: Paris, France, 2018; Volume 105. [Google Scholar]
- Cutler, R.L.; Fernandez-Llimos, F.; Frommer, M.; Benrimoj, C.; Garcia-Cardenas, V. Economic Impact of Medication Non-Adherence by Disease Groups: A Systematic Review. BMJ Open 2018, 8, e016982. [Google Scholar] [CrossRef] [Scilit] [PubMed]
- Kardas, P.; Agh, T. Medication Non-Adherence as a Driver of Pharmaceutical Waste: Integrating Top-down Policies with Bottom-up Practice. Front. Public Health 2025, 13, 1714049. [Google Scholar] [CrossRef] [Scilit] [PubMed]
- Fischer, M.A.; Stedman, M.R.; Lii, J.; Vogeli, C.; Shrank, W.H.; Brookhart, M.A.; Weissman, J.S. Primary Medication Non-Adherence: Analysis of 195,930 Electronic Prescriptions. J. Gen. Intern. Med. 2010, 25, 284–290. [Google Scholar] [CrossRef] [Scilit] [PubMed]
- Cheen, M.H.H.; Tan, Y.Z.; Oh, L.F.; Wee, H.L.; Thumboo, J. Prevalence of and Factors Associated with Primary Medication Non-Adherence in Chronic Disease: A Systematic Review and Meta-Analysis. Int. J. Clin. Pract. 2019, 73, e13350. [Google Scholar] [CrossRef] [Scilit] [PubMed]
- Aznar-Lou, I.; Fernández, A.; Gil-Girbau, M.; Fajó-Pascual, M.; Moreno-Peral, P.; Peñarrubia-María, M.T.; Serrano-Blanco, A.; Sánchez-Niubó, A.; March-Pujol, M.A.; Jové, A.M.; et al. Initial Medication Non-Adherence: Prevalence and Predictive Factors in a Cohort of 1.6 Million Primary Care Patients. Br. J. Clin. Pharmacol. 2017, 83, 1328–1340. [Google Scholar] [CrossRef] [Scilit] [PubMed]
- Pottegård, A.; dePont Christensen, R.; Houji, A.; Christiansen, C.B.; Paulsen, M.S.; Thomsen, J.L.; Hallas, J. Primary Non-Adherence in General Practice: A Danish Register Study. Eur. J. Clin. Pharmacol. 2014, 70, 757–763. [Google Scholar] [CrossRef] [Scilit] [PubMed]
- Tamblyn, R.; Eguale, T.; Huang, A.; Winslade, N.; Doran, P. The Incidence and Determinants of Primary Nonadherence With Prescribed Medication in Primary Care: A Cohort Study. Ann. Intern. Med. 2014, 160, 441–450. [Google Scholar] [CrossRef] [Scilit] [PubMed]
- McQuaid, E.L.; Landier, W. Cultural Issues in Medication Adherence: Disparities and Directions. J. Gen. Intern. Med. 2018, 33, 200–206. [Google Scholar] [CrossRef] [Scilit] [PubMed]
- Essink, S.C.M.; Lasys, T.; Santa-Ana-Tellez, Y.; Siiskonen, S.J.; Weir, D.L.; Zomerdijk, I.M.; Groenwold, R.H.H.; Saliete, I.; Poplavska, E.; Kurvits, K.; et al. Dispensing of Benzodiazepines and Benzodiazepine-Related Drugs in Estonia, Latvia and Lithuania: A Cross-National Drug Utilisation Study. Nord. J. Psychiatry 2026, 80, 265–276. [Google Scholar] [CrossRef] [Scilit] [PubMed]
- Laius, O.; Pisarev, H.; Volmer, D.; Kõks, S.; Märtson, A.; Maasalu, K. Use of a National Database as a Tool to Identify Primary Medication Non-Adherence: The Estonian ePrescription System. Res. Soc. Adm. Pharm. 2018, 14, 776–783. [Google Scholar] [CrossRef] [Scilit] [PubMed]
- Lõiveke, P.; Marandi, T.; Ainla, T.; Fischer, K.; Eha, J. Adherence to Recommendations for Secondary Prevention Medications after Myocardial Infarction in Estonia: Comparison of Real-World Data from 2004 to 2005 and 2017 to 2018. BMC Cardiovasc. Disord. 2021, 21, 505. [Google Scholar] [CrossRef] [Scilit] [PubMed]
- OECD. Lithuania: Country Health Profile 2023; OECD Publishing: Paris, France, 2023. [Google Scholar]
- OECD. Country Health Profile 2025: Lithuania; OECD Publishing: Paris, France, 2025. [Google Scholar]
- Treciokiene, I.; Daukintyte, K.; Hjemdahl, P.; Wettermark, B. Trends in Statin Utilization and Ischemic Heart Disease Mortality in Lithuania and Sweden, 2000–2020. Upsala J. Med. Sci. 2024, 129, e10412. [Google Scholar] [CrossRef] [Scilit] [PubMed]
- Kirilova, K.; Trečiokienė, I.; Bratčikovienė, N.; Qvarnström, M.; Wettermark, B. Persistence to Statin Treatment: A Cohort Study in Lithuania. Basic Clin. Pharm. Toxicol. 2024, 135, 43–51. [Google Scholar] [CrossRef] [Scilit] [PubMed]
- Makarevičius, G.; Rinkūnienė, E.; Badarienė, J. National Trends in Statin Use in Lithuania from 2010 to 2021. Medicina 2022, 59, 37. [Google Scholar] [CrossRef] [Scilit] [PubMed]
- Duchovskiene, N.; Mickeviciene, D.; Jurkeviciene, G.; Dirziuviene, B.; Balnyte, R. Factors Associated with Adherence to Disease Modifying Therapy in Multiple Sclerosis: An Observational Survey from a Referral Center in Lithuania. Mult. Scler. Relat. Disord. 2017, 13, 107–111. [Google Scholar] [CrossRef] [Scilit] [PubMed]
- Lasys, T.; Essink, S.C.M.; Santa-Ana-Tellez, Y.; Siiskonen, S.J.; Weir, D.L.; Zomerdijk, I.M.; Groenwold, R.H.H.; De Bruin, M.L.; Gardarsdottir, H. Impact of Policy Measures Targeting Benzodiazepines and Benzodiazepine-Related Drugs in Lithuania: Interrupted Time Series Analysis. Eur. J. Clin. Pharmacol. 2026, 82, 68. [Google Scholar] [CrossRef] [Scilit] [PubMed]
- Juodakis, J.; Zubavičiūtė, S.; Dapkutė, A.; Greičienė, S.; Masiliūnas, R.; Narkevičienė, I.; Trinkūnas, J.; Žemaitytė, J.; Literskė, G. Data Resource Profile: The Lithuanian Health Data Reuse Pathway. Int. J. Epidemiol. 2025, 54, dyaf118. [Google Scholar] [CrossRef] [Scilit] [PubMed]
- Lietuvos Respublikos Sveikatos Apsaugos Ministerija. Order No. V-112 of the Minister of Health of the Republic of Lithuania, "On the Approval of the Rules for the Writing of Prescriptions and the Dispensing (Sale) of Medicinal Products, Medical Devices (Medical Appliances), and Reimbursable Medical Aid Devices to Residents in Pharmacies, and for the Storage of Paper Prescriptions after Medicinal Products, Medical Devices (Medical Appliances), and Reimbursable Medical Aid Devices Have Been Dispensed (Sold) in a Pharmacy"; Ministry of Health of the Republic of Lithuania: Vilnius, Lithuania, 2002.
- Valstybės Įmonė Registrų Centras. ESPBI IS e-Prescription Subsystem: Data on Prescription Medicines Prescribed by Physicians. Lithuanian Open Data Portal (data.gov.lt). Available online: https://data.gov.lt/datasets/2020/?resource_version=1666 (accessed on 20 June 2026).
- Valstybės Įmonė Registrų Centras. ESPBI IS e-Prescription Subsystem: Data on Prescription Medicines Dispensed by Pharmacies. Lithuanian Open Data Portal (data.gov.lt). Available online: https://data.gov.lt/datasets/2557/?resource_version=1042 (accessed on 20 June 2026).
- Lietuvos Respublikos Sveikatos Apsaugos Ministerija. Order No. V-657 of the Minister of Health of the Republic of Lithuania, "On the Approval of the Description of the Procedure for the Use of the Electronic Health Services and Cooperation Infrastructure Information System"; Minister of Health of the Republic of Lithuania: Vilnius, Lithuania, 2015.
- WHO. Collaborating Centre for Drug Statistics Methodology Guidelines for ATC Classification and DDD Assignment 2024. Available online: https://atcddd.fhi.no/atc_ddd_index/ (accessed on 16 September 2024).
- State Data Agency. Statistics Lithuania. Gyventojų Senėjimas [Population Aging]. Oficialiosios Statistikos Portalas. Available online: https://osp.stat.gov.lt/lietuvos-gyventojai-2022/salies-gyventojai/gyventoju-senejimas (accessed on 3 July 2026).
- European Commission; Statistical Office of the European Union. Applying the Degree of Urbanisation: A Methodological Manual to Define Cities, Towns and Rural Areas for International Comparisons: 2021 Edition; Manuals and Guidelines; Publications Office of the European Union: Luxembourg, 2021; ISBN 978-92-76-20306-3. [Google Scholar]
- Wilson, D.H.; Rein, L.J.; Fountain, M.; Brookhart, A.; Atchley, D.; Hohmeier, K.C. A Pilot Study Exploring the Impact of a Primary Medication Non-Adherence Intervention among Four Chronic Disease States in One Regional Division of a Large Community Pharmacy Chain. Pharmacy 2023, 11, 11. [Google Scholar] [CrossRef] [Scilit] [PubMed]
- Greenland, S.; Mansournia, M.A.; Altman, D.G. Sparse Data Bias: A Problem Hiding in Plain Sight. BMJ 2016, 352, i1981. [Google Scholar] [CrossRef] [Scilit] [PubMed]
- Lin, M.; Lucas, H.C.; Shmueli, G. Research Commentary. Too Big to Fail: Large Samples and the p-Value Problem. Inf. Syst. Res. 2013, 24, 906–917. [Google Scholar] [CrossRef] [Scilit]
- Koo, H.M.; Jun, Y.K.; Choi, Y.; Shin, C.M.; Park, Y.S.; Kim, N.; Lee, D.H.; Shin, Y.K.; Yoon, H. 10 Years of Biologic Use Patterns in Patients with Inflammatory Bowel Disease: Treatment Persistence, Switching and Dose Intensification—A Nationwide Population-Based Study. Ther. Adv. Gastroenterol. 2023, 16, 17562848231201728. [Google Scholar] [CrossRef] [Scilit] [PubMed]
- Guerci, B.; Chanan, N.; Kaur, S.; Jasso-Mosqueda, J.G.; Lew, E. Lack of Treatment Persistence and Treatment Nonadherence as Barriers to Glycaemic Control in Patients with Type 2 Diabetes. Diabetes Ther. 2019, 10, 437–449. [Google Scholar] [CrossRef] [Scilit] [PubMed]
- Leong, N.-W.; Maharjan, S.; Nasruddin, S.Z.; Gandy, C.; Strum, D.W.; Yang, Y. Interventions to Improve Primary Medication Nonadherence: A Scoping Review. J. Am. Pharm. Assoc. 2026, 66, 102938. [Google Scholar] [CrossRef] [Scilit] [PubMed]
- Murauskiene, L.; Janoniene, R.; Veniute, M.; van Ginneken, E.; Karanikolos, M. Lithuania: Health System Review. Health Syst. Transit. 2013, 15, 1–150. [Google Scholar] [CrossRef] [Scilit] [PubMed]
- Dossa, A.R.; Moisan, J.; Guénette, L.; Lauzier, S.; Grégoire, J.-P. Association between Interpersonal Continuity of Care and Medication Adherence in Type 2 Diabetes: An Observational Cohort Study. CMAJ Open 2017, 5, E359–E364. [Google Scholar] [CrossRef] [Scilit] [PubMed]
- Tammes, P.; Payne, R.A.; Salisbury, C. Association between Continuity of Primary Care and Both Prescribing and Adherence of Common Cardiovascular Medications: A Cohort Study among Patients in England. BMJ Open 2022, 12, e063282. [Google Scholar] [CrossRef] [Scilit] [PubMed]
- Harsha, N.; Kőrösi, L.; Pálinkás, A.; Bíró, K.; Boruzs, K.; Ádány, R.; Sándor, J.; Czifra, Á. Determinants of Primary Nonadherence to Medications Prescribed by General Practitioners Among Adults in Hungary: Cross-Sectional Evaluation of Health Insurance Data. Front. Pharmacol. 2019, 10, 01280. [Google Scholar] [CrossRef] [Scilit] [PubMed]
- Lazutka, R.; Poviliunas, A.; Zalimiene, L. European Social Policy Network (ESPN) Thematic Report on Inequalities in Access to Healthcare–Lithuania; European Commission, Directorate-General for Employment, Social Affairs and Inclusion: Brussels, Belgium, 2018. [Google Scholar]
- Burneika, D.; Ubarevičienė, R.; Valatka, V. Socio-Economic Segregation in Growing Urban Regions of Lithuania. Filos. Sociol. 2016, 26, 277–292. [Google Scholar] [CrossRef] [Scilit]
- Hafez, G.; Aarnio, E.; Mucherino, S.; Kamusheva, M.; Qvarnström, M.; Potočnjak, I.; Trečiokiene, I.; Mihajlović, J.; Ekenberg, M.; van Boven, J.F.M.; et al. Barriers and Unmet Educational Needs Regarding Implementation of Medication Adherence Management Across Europe: Insights from COST Action ENABLE. J. Gen. Intern. Med. 2024, 39, 2917–2926. [Google Scholar] [CrossRef] [Scilit] [PubMed]
- Butrimaite, V.; Blockyte, M.; Kazlauskaite, J.A.; Lasys, T.; Kubiliene, L. Repository for the Manuscript: Primary Non-Adherence to Electronic Prescriptions in Lithuania, 2018–2024: Nationwide Prevalence, Factors, and Regional Variation. Zenodo 2026. [Google Scholar] [CrossRef]

Disclaimer/Publisher’s Note: The statements, opinions and data contained in all publications are solely those of the individual author(s) and contributor(s) and not of MDPI and/or the editor(s). MDPI and/or the editor(s) disclaim responsibility for any injury to people or property resulting from any ideas, methods, instructions or products referred to in the content. |
© 2026 by the authors. Licensee MDPI, Basel, Switzerland. This article is an open access article distributed under the terms and conditions of the Creative Commons Attribution (CC BY) license.