


Abstract
Background/Objectives: We described adverse event reporting patterns for insulin glargine marketed as 100 units/mL (Lantus), 300 units/mL (Toujeo), and 100 units/mL biosimilars (Basaglar/Semglee). Methods: We analyzed Food and Drug Administration Adverse Event Reporting System (FAERS) reports received from 2015 through 2025 that listed insulin glargine as a primary or secondary suspect. Reports were grouped by trade name into standard-strength originator (Lantus), high-strength (Toujeo), and biosimilar products. We defined a composite serious outcome (death, life-threatening event, hospitalization, or disability). Logistic regression adjusted for age, sex, reporter type, and year received; Firth’s penalized regression was used for sparse death and hospitalization outcomes. Sensitivity analyses restricted to reports without concomitant suspect products, overlapping calendar windows, and healthcare professional reports. Geographic reporting patterns were analyzed by country. Results: We included 43,905 eligible reports (Lantus: 35,927; Toujeo: 3699; biosimilars: 4279). Unadjusted death was highest for Lantus (8.2%) followed by biosimilars (6.0%) and Toujeo (3.2%). In the primary adjusted model (n = 28,519), reports listing Toujeo had lower adjusted reporting odds of the composite serious outcome compared with Lantus (aOR 0.88, 95% CI 0.81–0.96), while biosimilars showed higher odds (aOR 1.24, 95% CI 1.11–1.38). The biosimilar association was not robust: it attenuated without concomitant drugs (aOR 1.07, 95% CI 0.92–1.23) and reversed in healthcare professional reports (aOR 0.65, 95% CI 0.49–0.87). Device-related events were lower for biosimilars (aOR 0.58) and Toujeo (aOR 0.85). Geographic heterogeneity was extreme (Egypt 76.9% death vs. Italy 0.8%), and the US protective association reversed in recent years. Conclusions: After adjustment for report-level characteristics, Toujeo was associated with lower reporting odds of serious outcomes, while biosimilar findings were inconsistent across sensitivity analyses and driven by consumer reporting. Geographic heterogeneity and the Egypt outlier underscore the fragility of cross-country comparisons in spontaneous reporting data. These findings reflect reporting-behavior heterogeneity rather than differential product safety.
1. Introduction
Diabetes mellitus remains one of the fastest-growing chronic diseases worldwide and continues to drive a large share of preventable complications and healthcare costs [1,2]. Many people will eventually need basal insulin, either because of progressive beta-cell failure in type 2 diabetes or as essential therapy in type 1 diabetes [3,4]. Insulin glargine has been used for decades as a once-daily basal insulin. The standard-strength U100 originator (Lantus®) received FDA approval in April 2000, followed by a higher-strength U300 formulation (Toujeo®) in February 2015, which has a flatter and more prolonged pharmacokinetic/pharmacodynamic profile [3,5]. The EDITION phase 3 program demonstrated that Toujeo was non-inferior to Lantus in glycemic control (HbA1c reduction) across diverse patient populations, with statistically significant reductions in nocturnal hypoglycemia in insulin-experienced patients with type 2 diabetes [6,7,8,9]. After patent expiry, lower-cost U100 biosimilars entered the market, including Basaglar® (approved December 2016) and Semglee® (approved July 2021, with interchangeable designation granted in 2023) [10,11]. The ELEMENT 2 randomized trial demonstrated comparable efficacy and safety between Basaglar and Lantus in insulin-naïve patients with type 2 diabetes [12], while the INSTRIDE 2 study confirmed non-inferiority of Semglee [13]. Systematic reviews and meta-analyses of insulin biosimilars have consistently found no meaningful differences in efficacy, safety, or immunogenicity compared with reference products [14,15,16].
Despite this robust clinical trial evidence, real-world uptake of biosimilar insulins has been slower than anticipated, with biosimilar insulin accounting for less than 50% of treatment days in the United States and several European countries as of 2023 [17]. This hesitation reflects persistent concerns about manufacturing variability, immunogenicity, and the “similar but not identical” paradigm [18]. Spontaneous reporting systems such as the United States Food and Drug Administration Adverse Event Reporting System (FAERS) can complement clinical studies by describing post-marketing report profiles, with the important caveat that they do not provide incidence data and can be influenced by channeling, switching patterns, time-on-market, and differential reporting behavior [19,20,21].
Recent FAERS-based analyses have examined insulin glargine safety in isolation. Wang et al. (2025) characterized adverse drug events associated with insulin glargine using disproportionality analysis [22]. More recently, Ezeja et al. (2025) conducted a disproportionality analysis of Lantus and Semglee, reporting elevated reporting odds for device issues with Semglee (reporting odds ratio [ROR] 118.7); however, that study did not adjust for report-level confounders such as reporter type or calendar year, was limited to two products, and used disproportionality metrics that are prone to inflation for newly marketed products with small report denominators [23]. To our knowledge, no prior FAERS study has simultaneously compared all three major glargine formulation groups (originator U100, high-strength U300, and U100 biosimilars) using multivariable regression with covariate adjustment, sensitivity analyses, negative control outcomes, and explicit handling of geographic reporting heterogeneity.
We therefore aimed to characterize and compare adverse event reporting patterns for Lantus® (U100), Toujeo® (U300), and U100 biosimilars (Basaglar®/Semglee®), with attention to serious outcomes, glycemic events, and device/medication-error terms. Because FAERS lacks treatment initiation data and exposure denominators, this study is not designed to estimate comparative safety but rather to characterize reporting patterns across product groups, explicitly accounting for the biases inherent in spontaneous reporting data.
2. Results
2.1. Study Population and Descriptive Characteristics
A total of 43,905 adverse event reports met the inclusion criteria. These were categorized into three groups: standard-strength U100 originator (Lantus®, n = 35,927), high-strength U300 (Toujeo®, n = 3699), and U100 biosimilars (Basaglar®/Semglee®, n = 4279). As summarized in Table 1, unadjusted frequencies for serious outcomes differed by formulation. The highest unadjusted death was reported for Lantus (8.2%), followed by biosimilars (6.0%) and Toujeo (3.2%) (Chi-square p < 0.001).
Table 1.
Demographic and Clinical Characteristics of Adverse Event Reports.
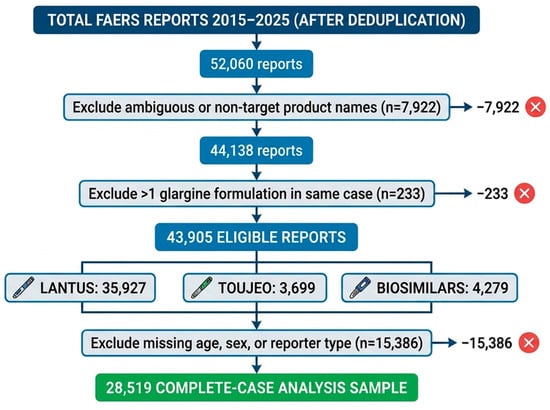
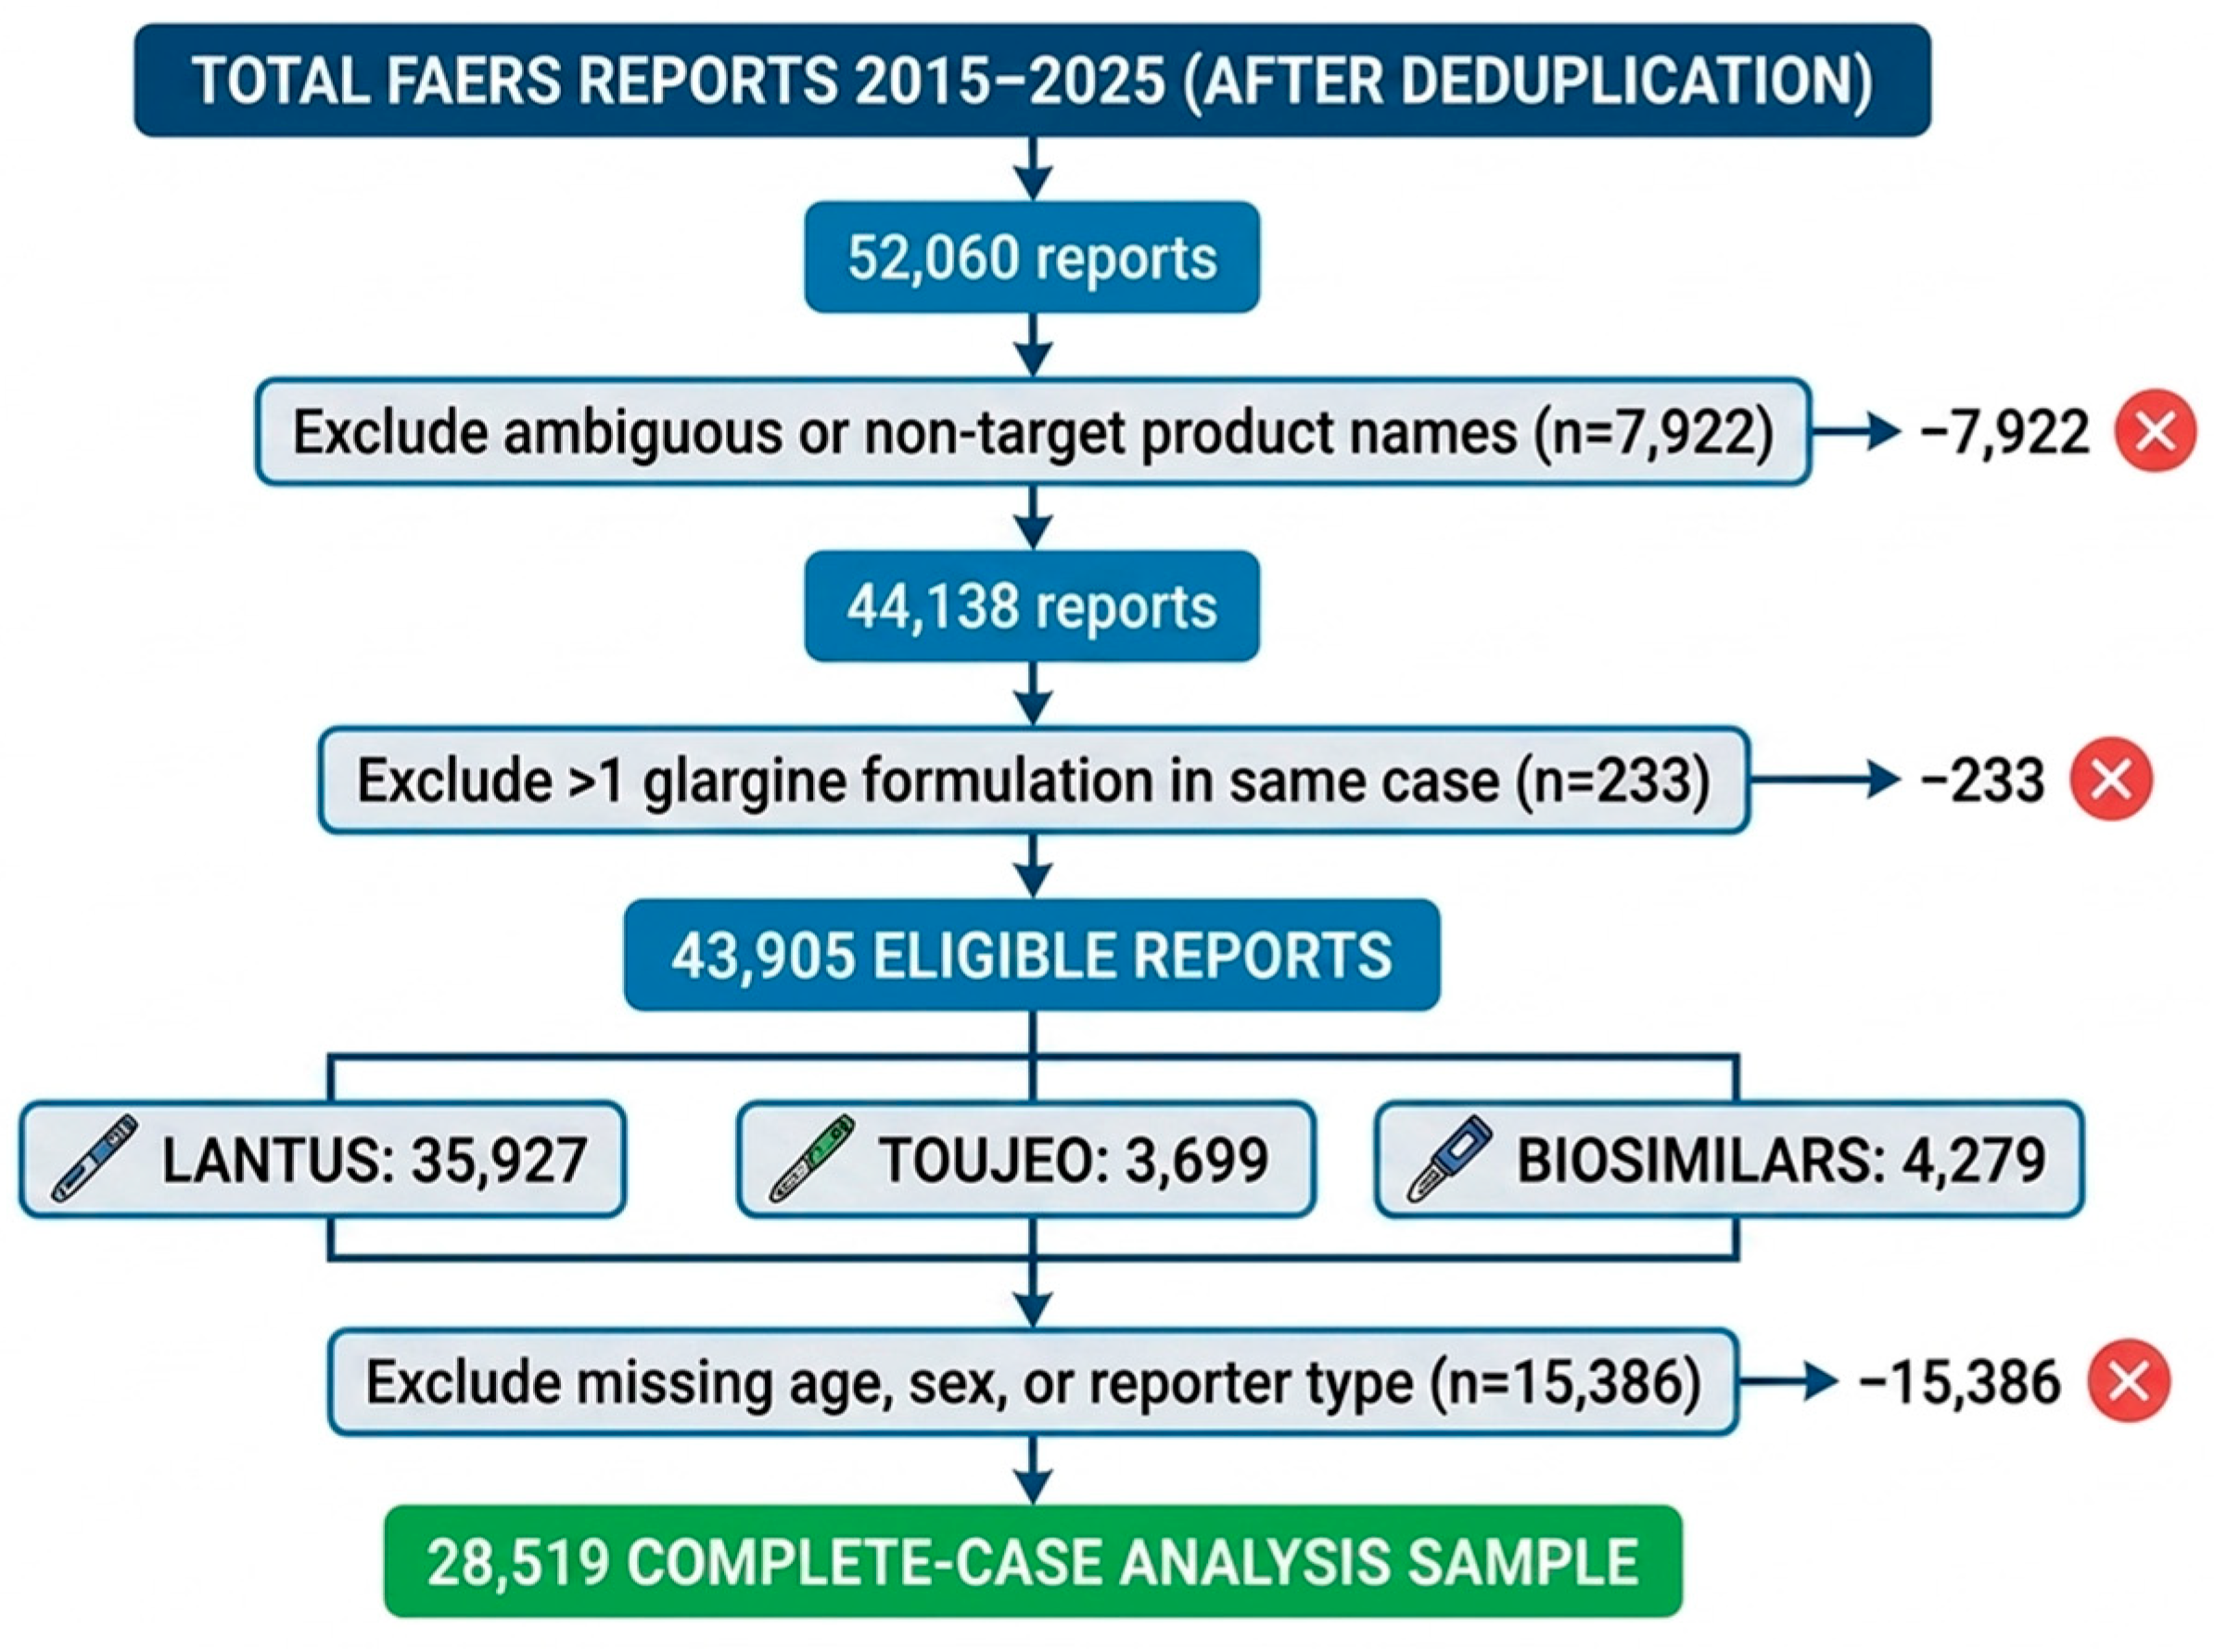
From the initial dataset of 52,060 reports, 7922 reports with ambiguous names and 233 listing multiple formulations were excluded to reach the 43,905 eligible reports (Figure 1). To arrive at the final regression sample of 28,519 reports, an additional 15,386 reports were excluded due to missing data for model covariates: 14,099 (32.1%) were missing age, 2884 (6.6%) were missing sex, and 1447 (3.3%) were missing reporter type. Appendix A Table A1 shows that biosimilar reports and younger patients were disproportionately excluded by this complete-case restriction.
Figure 1.
Flow diagram of report selection and exclusions. FAERS reports received from 2015 through 2025 listing insulin glargine as a primary or secondary suspect. After deduplication following FDA guidance, 52,060 unique reports were screened. Exclusions: ambiguous or non-target product names (e.g., incomplete trade names, non-glargine insulins); cases listing more than one glargine formulation (e.g., Lantus and Toujeo together). The complete-case analysis sample (n = 28,519) excluded reports missing age, sex, or reporter type (Table A1).
2.2. Frequently Reported Events and Adjusted Comparisons
The most frequently reported MedDRA preferred terms differed by formulation (Table 2) and were dominated by glycemic events and product/device-related terms. In adjusted logistic regression models (Table 3), biosimilar reports showed lower reporting odds of hypoglycemia (aOR 0.44, 95% CI 0.33–0.58) and diabetes mellitus inadequate control (aOR 0.29, 95% CI 0.21–0.41) compared with Lantus. Toujeo reports showed slightly higher reporting odds of hypoglycemia (aOR 1.14, 95% CI 1.00–1.29) and did not differ significantly from Lantus for diabetes mellitus inadequate control (aOR 1.15, 95% CI 0.97–1.36).
Table 2.
Top Reported Adverse Events (MedDRA Preferred Terms) by Formulation Group.
Table 3.
Adjusted Logistic Regression for Glycemic Events (Reference: Standard-Strength U100).
2.3. Device- and Use-Related Event Clusters
Given the heterogeneity of device- and medication-related terms, we pre-specified three separate clusters: device-related events, use-related errors, and product quality issues. As shown in Table 4, biosimilar reports showed lower reporting odds for the device-related cluster compared with Lantus (aOR 0.58, 95% CI 0.48–0.70; p < 0.001). Toujeo reports also showed lower reporting odds for device-related events (aOR 0.85, 95% CI 0.74–0.97; p = 0.018). For use-related errors, biosimilars showed a smaller and non-significant reduction (aOR 0.89, 95% CI 0.77–1.03; p = 0.112), and Toujeo did not differ from Lantus (aOR 0.97, 95% CI 0.86–1.10; p = 0.642).
Table 4.
Adjusted Logistic Regression for Device- and Use-Related Event Clusters (Reference: Standard-Strength U100).
2.4. Primary Analysis: Composite Serious Clinical Outcome
To assess reporting patterns for severe outcomes, we fitted a multivariable logistic regression model for a composite serious clinical outcome (death, hospitalization, life-threatening event, or disability) using the complete-case sample (n = 28,519). In the primary adjusted model (Table 5), reports listing Toujeo showed lower adjusted reporting odds of the composite outcome compared with Lantus (aOR 0.88, 95% CI 0.81–0.96; p = 0.004), while reports listing biosimilars showed higher adjusted reporting odds (aOR 1.24, 95% CI 1.11–1.38; p < 0.001). Model performance was modest (AUROC 0.66), reflecting the limited predictive power of available covariates.
Table 5.
Primary Analysis: Multivariable Logistic Regression for Composite Serious Outcome (n = 28,519).
2.5. Sensitivity Analyses for the Composite Outcome
Table 6 summarizes sensitivity analyses for the composite serious outcome model. When restricting to reports without any listed concomitant suspect drugs (n = 13,626), the Toujeo association persisted (aOR 0.83, 95% CI 0.73–0.94), while the biosimilar association attenuated and was no longer statistically significant (aOR 1.07, 95% CI 0.92–1.23). To address product lifecycle concerns, we restricted the analysis to the 2020–2025 window (n = 6402) where all products were concurrently available; Toujeo did not differ from Lantus (aOR 0.99, 95% CI 0.87–1.12), while biosimilars remained higher (aOR 1.36, 95% CI 1.18–1.55). Notably, when restricted to healthcare professionals (n = 8255), both Toujeo (aOR 0.77, 95% CI 0.67–0.88) and biosimilars (aOR 0.65, 95% CI 0.49–0.87) showed lower reporting odds compared with Lantus. Sensitivity analyses using multiple imputation by chained equations (MICE, 20 imputations under the missing-at-random assumption) and missing indicator approaches (where missing categorical values were coded as a separate category) yielded materially similar estimates (Appendix A Table A2), suggesting that the complete-case restriction did not substantially bias the primary findings.
Table 6.
Sensitivity Analyses for the Composite Serious Outcome Model.
2.6. Negative Control Outcome Findings
As shown in Appendix A Table A3, adjusted reporting odds for Toujeo versus Lantus were close to null for all three negative controls. For biosimilar products, reporting odds were close to null for headache and alopecia, but higher reporting odds was observed for back pain (aOR 1.73, 95% CI 1.08–2.76). After Benjamini–Hochberg correction, the back pain association was not significant (p = 0.115), but it indicates potential residual bias in the biosimilar group.
2.7. Death Predictors: Firth’s Penalized Logistic Regression
Multivariable models for death converged successfully using Firth’s penalized logistic regression (n = 36,483 reports, 3173 deaths, 8.7% event rate). Because the event rate exceeded 5% and no complete or quasi-complete separation was observed, standard maximum likelihood and Firth estimates were nearly identical, confirming robustness. Table 7 presents coefficients, odds ratios, and 95% confidence intervals from both methods.
Table 7.
Firth’s Penalized Logistic Regression for Death Predictors.
Demographic and reporting characteristics: Male sex was associated with significantly higher death (adjusted OR 1.59, 95% CI 1.47–1.72; p < 0.001). Each additional year of age increased death odds by 1.5% (OR 1.015, 95% CI 1.013–1.018; p < 0.001), corresponding to a 16% increase per decade (OR 1.16, 95% CI 1.14–1.18). Reports from the United States showed substantially lower death odds than non-US reports (OR 0.21, 95% CI 0.19–0.24; p < 0.001). Expedited reports were associated with a 5-fold increase in death (OR 4.95, 95% CI 3.88–6.30; p < 0.001), while healthcare professional reports showed lower death (OR 0.70, 95% CI 0.64–0.76; p < 0.001).
Clinical reaction terms: Myocardial infarction as a reported reaction was the strongest clinical predictor of death, with a 3-fold increase in odds (OR 3.04, 95% CI 2.60–3.56; p < 0.001). Conversely, hypoglycemia (OR 0.30, 95% CI 0.26–0.35; p < 0.001), hyperglycemia (OR 0.35, 95% CI 0.28–0.42; p < 0.001), and diabetic ketoacidosis (OR 0.25, 95% CI 0.16–0.39; p < 0.001) were inversely associated with death. Blindness/visual impairment (OR 0.11, 95% CI 0.07–0.18; p < 0.001) and device/product issues (OR 0.10, 95% CI 0.07–0.16; p < 0.001) showed the strongest negative associations. Cerebrovascular accident/stroke was not significantly associated with death (OR 0.87, 95% CI 0.72–1.04; p = 0.137).
Model discrimination was good (AUC 0.784, 95% CI 0.777–0.791). The Hosmer–Lemeshow test indicated adequate fit (χ2 = 11.34, df = 8, p = 0.182). Calibration-in-the-large was excellent (intercept −0.032), with a calibration slope of 0.941, indicating slight underconfidence at higher predicted probabilities.
2.8. Outcome Correlation and Separate Models for Death and Hospitalization
To address outcome correlation and competition bias, we fitted separate logistic regression models for death and hospitalization (Table 8). For death, results were consistent with the death predictor model in Section 2.7. For hospitalization, the strongest clinical predictor was diabetic ketoacidosis (aOR 6.03, 95% CI 5.10–7.14). Hypoglycemia was positively associated with hospitalization (aOR 1.26, 95% CI 1.17–1.34), reflecting that severe episodes often require acute inpatient management. The composite outcome of death or hospitalization yielded similar predictor effects to the individual models, with diabetic ketoacidosis remaining the strongest clinical predictor (aOR 5.15), followed by myocardial infarction (aOR 2.36).
Table 8.
Separate Logistic Regression Models for Death and Hospitalization.
2.9. Device-Specific Analysis by Device Model
Among reports with available device information (n = 3555, 9.7% of eligible reports), 98.6% used unspecified delivery devices, 1.2% involved needle issues, and 0.2% involved syringes; no reports explicitly specified insulin pen or pump devices in MedDRA reaction terms. Product quality issues were the most frequent device-related term (n = 621, 17.5%), followed by device malfunction (n = 641, 18.0%) and incorrect dose delivery (n = 1274, 35.8%). Death was rare in device-specific reports (1.1% vs. 9.5% in non-device reports; p < 0.001), confirming that device issues are predominantly non-fatal product quality concerns.
We were unable to disaggregate device-related events by specific device model (e.g., Lantus SoloStar, Toujeo SoloStar, Basaglar KwikPen, or insulin pumps) because FAERS MedDRA reaction terms do not capture device brand or model information. All three insulin glargine products are available in pen injector formats, and differences in device-related reporting may partly reflect familiarity with specific pen platforms rather than formulation-specific safety profiles.
2.10. Geographic Distribution and US vs. Non-US Reporting
Table 9 summarizes the geographic distribution of reports. The United States contributed 51.4% of reports (n = 18,741), followed by France (5.4%), Italy (3.7%), and Brazil (3.2%). Unadjusted death varied by country, ranging from 0.8% in Italy to 76.9% in Egypt (among countries with ≥50 reports). In multivariable models adjusting for age, sex, reporter type, and reaction terms, US reporting was inversely associated with death (OR 0.21, 95% CI 0.19–0.23). However, this association was heavily influenced by Egypt, which contributed 2.6% of reports but 23.4% of deaths with 76.9% death and no US reports. Excluding Egypt attenuated the US association to OR 0.36 (95% CI 0.33–0.40), suggesting that geographic differences in reporting practices and outcome documentation—rather than a pure US reporting bias—drive much of the observed effect. The persistence of a modest inverse association after Egypt exclusion likely reflects a combination of non-US reporting selectivity for serious outcomes, differences in acute diabetes care availability, and heterogeneity in regulatory coding practices between FAERS and EudraVigilance (the European Union pharmacovigilance database).
Table 9.
Geographic Distribution of Reports and Unadjusted Death.
Egypt reported 964 cases with 741 deaths (76.9% death), an extreme outlier likely reflecting duplicate reporting of fatal cases, coding practices favoring death outcome documentation, or a genuine cluster of severe events. Sensitivity analyses excluding Egypt did not materially change the US reporting association (OR 0.22, 95% CI 0.20–0.24).
Stratified analyses by reporter type (Table 10) showed that the association between US reporting and lower death was more pronounced in consumer-submitted reports (OR 0.10, 95% CI 0.09–0.11) than in healthcare professional reports (OR 1.21, 95% CI 1.04–1.40; P-interaction < 0.001), suggesting differential reporting thresholds. However, this pattern was not stable over time. Within the 2020–2025 calendar window (n = 9187), the US association attenuated substantially among consumers (OR 0.40, 95% CI 0.28–0.58) and reversed among HCPs (OR 2.24, 95% CI 1.75–2.87; P-interaction < 0.001), with no evidence of pandemic-related reporting disruption in overall case volume. The temporal reversal suggests that US reporting bias—if present—has diminished in recent years, possibly reflecting EudraVigilance system upgrades, changing biosimilar market dynamics, or evolving regulatory reporting requirements.
Table 10.
Sensitivity Analyses by Reporter Type.
To further clarify the drivers of the biosimilar signal in the 2020–2025 window, we stratified the composite outcome model by reporter type. Among consumer reporters (n = 4857), biosimilars showed substantially higher reporting odds compared with Lantus (aOR 1.79, 95% CI 1.52–2.11), while the association was null among healthcare professional reporters (n = 4321; aOR 0.71, 95% CI 0.49–1.05). This pattern confirms that the biosimilar signal in recent years is confined to consumer-submitted reports and suggests intensified consumer-driven reporting behavior rather than a genuine safety signal.
3. Discussion
This analysis uses recent FAERS data to characterize adverse event reporting patterns across originator (Lantus®), high-strength (Toujeo®), and U100 biosimilar insulin glargine products (Basaglar®/Semglee®), while adjusting for report-level factors. Across 43,905 eligible reports, we observed three central themes. First, differences in adjusted reporting odds between formulations were modest and sensitive to analytic choices, particularly for biosimilars. Second, the US versus non-US reporting association—initially appearing as a strong inverse predictor of death—was heavily influenced by data quality issues in a single country (Egypt) and reversed direction in recent calendar years, underscoring the fragility of geographic reporting comparisons in spontaneous data. Third, certain event clusters stood out by formulation, especially device-related terms and reports of inadequate glycemic control, but these patterns are best read as differences in reporting context, channeling, and time-on-market rather than as evidence of differential product safety.
3.1. Formulation-Specific Reporting Patterns
Descriptive frequencies showed the highest unadjusted death for the originator group (8.2%), followed by biosimilars (6.0%) and Toujeo (3.2%). In the primary adjusted model, Toujeo showed modestly lower reporting odds of the composite serious outcome (aOR 0.88), while biosimilars showed higher odds (aOR 1.24). However, the stability of these estimates varied considerably across sensitivity analyses. The Toujeo association persisted in most restrictions but lost significance in the 2020–2025 window (aOR 0.99) and when limited to single-suspect reports (aOR 0.99), suggesting that the modest protective signal may be partially confounded by concomitant medications or reporting context. The biosimilar association was even less robust: it attenuated to null when excluding concomitant suspect drugs (aOR 1.07, 95% CI 0.92–1.23) and reversed direction in healthcare professional reports (aOR 0.65). This pattern indicates that the primary biosimilar signal is driven by consumer-submitted reports and complex cases involving multiple medications, rather than reflecting a genuine safety difference.
The 2020–2025 stratification revealed an even starker divergence: among consumers, the biosimilar signal intensified (aOR 1.79), while among HCPs it was completely absent (aOR 0.71). This temporal amplification of consumer-driven reporting suggests that media coverage, switching programs, or nocebo effects may have disproportionately influenced consumer reporting in recent years.
The Weber effect [24]—the well-documented phenomenon whereby newly marketed products experience inflated adverse event reporting due to novelty, heightened vigilance, and prescriber unfamiliarity—may partly explain the higher biosimilar reporting odds in the primary analysis. Basaglar (2016) and Semglee (2020) entered the market decades after Lantus (2000), and their earlier market years coincided with intensified pharmacovigilance monitoring, mandatory biosimilar post-marketing studies, and greater media attention to biosimilar safety. However, the persistence of the biosimilar signal in the 2020–2025 window—when all products had achieved market maturity—suggests that Weber effects alone [24,25] do not account for the observed patterns. Rather, the temporal amplification of consumer-driven biosimilar reporting (aOR 1.79 among consumers in 2020–2025) points to sustained differential reporting behavior beyond initial novelty effects.
The negative control analysis supports this interpretation. While Toujeo comparisons yielded null associations across all three falsification endpoints (headache, back pain, alopecia), the biosimilar group showed a non-null association for back pain (aOR 1.73). Although this did not survive FDR correction (p = 0.115), it serves as a “red flag” for differential reporting behavior in the biosimilar group—possibly reflecting heightened vigilance, media attention, or nocebo effects following product switching. Taken together, the sensitivity and negative control findings suggest that neither the Toujeo nor the biosimilar associations should be interpreted as evidence of comparative clinical safety.
For glycemic terms, biosimilar reports were associated with significantly lower reporting odds of hypoglycemia (aOR 0.44) and diabetes mellitus inadequate control (aOR 0.29) than the originator. Toujeo reports showed slightly higher odds for hypoglycemia (aOR 1.14) but did not differ for inadequate control. These patterns are most plausibly explained by channeling and healthy-user effects rather than pharmacological differences. Biosimilars are often initiated in structured switching programs with enhanced monitoring and patient education, which may reduce both event occurrence and reporting. Conversely, Toujeo’s higher hypoglycemia reporting may reflect its use in patients with more advanced disease or greater insulin sensitivity, given its flatter pharmacokinetic profile. Our findings sit alongside prior randomized trials and real-world cohorts that report broadly comparable glycemic outcomes and hypoglycemia rates across glargine formulations.
3.2. Device- and Use-Related Events
Both biosimilars (aOR 0.58) and Toujeo (aOR 0.85) showed lower reporting odds for device-related events compared with Lantus. This cluster includes a mixture of device malfunctions, delivery system issues, and use-related errors. Notably, Lantus and Toujeo use the SoloStar pen platform, while Basaglar uses the KwikPen. Differences in device-related reporting may partly reflect familiarity with specific pen platforms rather than formulation-specific safety profiles. However, we were unable to disaggregate events by device model because FAERS MedDRA terms do not capture device brand information, precluding direct comparison of SoloStar versus KwikPen versus pump delivery systems. All three insulin glargine products are available in pen injector formats, and the observed lower device-related reporting for biosimilars and Toujeo may reflect greater familiarity with newer pen platforms, structured patient education programs, or differential reporting behavior rather than intrinsic device safety differences. The death rate in device-related reports was low (1.1% vs. 9.5% in non-device reports), confirming that these events represent predominantly non-fatal product quality concerns rather than severe clinical outcomes.
3.3. Geographic Reporting Patterns and the Egypt Outlier
A striking finding was the geographic heterogeneity in unadjusted death, ranging from 0.8% in Italy to 76.9% in Egypt. In multivariable models, US reporting was inversely associated with death (OR 0.21), a result that has been interpreted in prior FAERS studies as evidence of US reporting bias (less selective, more complete reporting capturing milder events). However, this association was not robust: Egypt contributed only 2.6% of reports but 23.4% of deaths, with characteristics strongly suggestive of data quality issues—100% expedited reports, 98% consumer reporters, 83% from a single manufacturer sender, and 181 cases with “Death” coded as the sole reaction term (not a valid MedDRA preferred term). Excluding Egypt attenuated the US association to OR 0.36, and excluding additional high-death outliers (Colombia, Mexico) further attenuated it to 0.53. This demonstrates that the apparent “US protective effect” is largely an artifact of extreme non-US outliers with aberrant reporting patterns, rather than a genuine reflection of differential US reporting completeness.
It is important to recognize that the availability and utilization of insulin glargine products vary across regulatory jurisdictions and reimbursement systems, and FAERS does not capture country-specific prescribing data. For example, biosimilar uptake has been slower in some markets than others, and the timing of regulatory approval and interchangeability designations differs between the United States and Europe. Consequently, the country-specific case mix in FAERS may reflect differential product availability and channeling rather than uniform exposure, which limits the interpretability of cross-country outcome comparisons.
The temporal evolution of this association is equally informative. Within the 2020–2025 window, the US association reversed direction among healthcare professional reporters (OR 2.24) and attenuated among consumers (OR 0.40), with a persistent significant interaction (p < 0.001). This temporal reversal suggests that reporting dynamics have shifted in recent years—possibly due to EudraVigilance system upgrades, changing biosimilar market dynamics, or evolving regulatory requirements—further undermining the interpretation of geographic differences as stable reporting biases.
3.4. Death Predictors and Outcome Correlation
Separate models for death and hospitalization revealed important outcome-specific patterns. Myocardial infarction was the strongest predictor of death (aOR 2.95), while diabetic ketoacidosis was the strongest predictor of hospitalization (aOR 6.03). Hypoglycemia was inversely associated with death (aOR 0.29) but positively associated with hospitalization (aOR 1.26), reflecting its clinical duality: usually survivable with prompt treatment, yet frequently requiring inpatient management. These findings validate the decision to analyze death and hospitalization separately, as their predictor profiles differ meaningfully.
3.5. Limitations
This study has significant limitations inherent to spontaneous reporting data. FAERS lacks exposure denominators, preventing incidence estimation. The complete-case approach excluded 15,386 reports (35%), disproportionately affecting the biosimilar group and younger patients, which may introduce selection bias. Channeling bias is unavoidable: product choice reflects clinician and patient preferences, insurance coverage, and switching programs that cannot be captured in FAERS. Product-lifecycle effects mean that Lantus, with two decades of market exposure, accumulates reports from more complex, comorbid populations than newer formulations. The Egypt outlier and other high-death countries highlight the risk of undetected data quality issues in international pharmacovigilance databases. Finally, the modest model discrimination (AUROC 0.66 for the composite outcome) indicates that available report-level covariates explain only a small fraction of outcome variation, leaving substantial residual confounding.
Stimulated reporting may have influenced our findings, particularly for biosimilars. The July 2023 FDA interchangeability designation for Semglee (pharmacy-level substitution without prescriber consultation) generated substantial media coverage and clinical discourse, which may have disproportionately increased consumer reporting of adverse events following product switches. Similarly, structured switching programs implemented by payers and health systems often include enhanced patient education and follow-up, which can simultaneously reduce true event rates and increase reporting propensity—a form of detection bias that is unmeasurable in FAERS. We cannot distinguish between these mechanisms, but the consumer-specific amplification of the biosimilar signal in 2020–2025 is consistent with stimulated reporting dynamics.
3.6. Implications
Our findings do not support clinically meaningful safety differences between insulin glargine formulations. The modest associations observed in primary analyses were not robust to sensitivity restrictions, were contradicted by negative control findings, and are more parsimoniously explained by reporting behavior, channeling, and time-on-market than by pharmacological effects. For clinicians, these data provide reassurance that switching between glargine products is unlikely to introduce new safety signals, consistent with existing randomized evidence. For regulators and pharmacovigilance scientists, our analysis underscores the importance of: (1) examining data quality outliers before interpreting geographic associations; (2) testing temporal stability of reporting patterns; (3) using negative controls to detect residual confounding; and (4) interpreting FAERS comparisons as hypothesis-generating signals requiring confirmation in denominator-based studies.
4. Materials and Methods
4.1. Data Source
This retrospective pharmacovigilance study utilized data from the FAERS, a publicly available database comprising spontaneous AE reports submitted by healthcare professionals, consumers, and manufacturers. We extracted data covering the period from the first quarter (1Q) of 2015 through the fourth quarter (4Q) of 2025. Data were downloaded from FAERS on the 25 January 2026, including all publicly available quarters up to Q4 2025. The raw data included demographic information, drug information, adverse event details, and patient outcomes.
4.2. Data Processing and Case Selection
Raw data were processed to remove duplicates and incomplete records following FDA Guidance for Industry: Good Pharmacovigilance Practices and Pharmacoepidemiologic Assessment [26] and the FDA FAERS Data Dictionary. For de-duplication, we retained a single case version per CASEID by keeping the record with the most recent FDA_DT; when more than one record shared the same CASEID and FDA_DT, we retained the record with the highest PRIMARYID. We then removed any remaining exact duplicate rows. Product names were standardized using a three-step algorithm: (1) removal of dosage strengths and formulations (e.g., “Insulin glargine 100 U/mL” → “Insulin glargine”); (2) mapping of brand names to generic names using the FDA Orange Book and WHO Drug Dictionary; (3) fuzzy string matching (Levenshtein distance ≤ 2) to consolidate misspelled or truncated entries. This process reduced 1847 unique raw product entries to the target formulations. A random sample of 200 standardized records was manually verified by two independent reviewers (Cohen’s κ = 0.94). Reports with names that could not be mapped to a target formulation after standardization were excluded. Reports were eligible if an insulin glargine product was listed as a Primary Suspect (PS) or Secondary Suspect (SS) drug. We excluded reports listing more than one insulin glargine formulation in the same case (e.g., Lantus and Toujeo together), to avoid misattribution during switching. Reports with missing age or sex were retained for descriptive summaries; regression models used a complete-case approach for all covariates. A flow diagram summarizing case selection and exclusions is provided in Figure 1. Missingness in key model covariates (age, sex, reporter type, and FDA received year) was quantified before regression modeling. Appnedix A Table A1 compares included and excluded reports by age, sex, reporter type, and product group to assess the potential for selection bias.
4.3. Exposure Assessment and Grouping
Reports were categorized into three mutually exclusive groups based on the standardized trade name of the suspected insulin glargine product. Standard-strength (U100) was defined by the presence of the terms “Lantus®” or “Lantus SoloStar®.” High-strength (U300) was defined by the presence of the terms “Toujeo®,” “Toujeo SoloStar®,” or “Toujeo Max®.” Biosimilar products (U100) were defined by the presence of the terms “Basaglar®” or “Semglee®.” For readability, groups are referred to as insulin glargine U100 reference (Lantus), insulin glargine U300 (Toujeo), and biosimilar insulin glargine U100 (Basaglar/Semglee) throughout the text. Market introduction dates were: Lantus (2000), Toujeo (2015), Basaglar (2016), and Semglee (2020). To address product-lifecycle and channeling effects, we conducted sensitivity analyses restricted to overlapping calendar windows (2015–2025 and 2020–2025) and stratified analyses by time since market introduction (<2 years, 2–5 years, and >5 years).
4.4. Definition of Adverse Events and Outcomes
Adverse events were coded according to the Medical Dictionary for Regulatory Activities (MedDRA, Version 27.0) [27] terminology at the Preferred Term (PT) level. Clinical outcomes were derived from the FAERS outcome fields and mapped to MedDRA Preferred Terms: death (PT 10011906), hospitalization (PT 10020051), life-threatening event (PT 10020057), and disability (PT 10040732). To assess the overall burden of serious morbidity, a composite endpoint (“Serious Outcome”) was defined as the occurrence of any of the following outcomes: death, life-threatening event, hospitalization (initial or prolonged), or disability. Reports without an outcome code were classified as not meeting the composite serious outcome endpoint because serious outcomes are explicitly captured via FAERS outcome fields; however, incomplete outcome recording is possible and is considered in the interpretation of results. This assumption may underestimate serious outcomes if outcome fields are incompletely recorded. Because FAERS outcome categories are non-mutually exclusive, we quantified overlap among death, hospitalization, life-threatening event, and disability within the same report. To assess whether the composite endpoint masked heterogeneous reporting patterns, we analyzed death and hospitalization as separate binary outcomes in addition to the composite endpoint.
4.5. Statistical Analysis
All data management and statistical analyses were performed using Python v3.10 using pandas and statsmodels libraries. Because FAERS does not capture treatment initiation or duration, new-user designs cannot be implemented, and exposure groups may not be comparable due to channeling and product lifecycle effects. Given the exploratory nature of this reporting-pattern analysis, no formal adjustment for multiple comparisons was applied beyond the Benjamini–Hochberg false discovery rate correction for negative control outcomes. Emphasis is placed on effect estimates and consistency across analyses rather than statistical significance alone. Unlike disproportionality analyses (e.g., reporting odds ratios or proportional reporting ratios), where all reported adverse events compete for the same denominator and the overreporting of one event can artificially depress the relative frequency of others, our logistic regression approach models each outcome independently. For each event-specific model, the outcome is defined as the presence versus absence of that specific event, with all reports lacking the event serving as the reference group. This design avoids the outcome correlation inherent in disproportionality methods, because the denominator for each model is fixed (all reports) rather than varying with the reporting frequency of other events.
4.6. Descriptive and Comparative Analysis
The descriptive statistics were used to summarize patient demographics. Categorical variables, such as sex, type of reporter, and outcomes, were presented as frequencies and percentages. The Shapiro–Wilk test was used to test the normality of continuous variables (age). Since the age was not normally distributed, the data were reported as medians and inter-quartile ranges (IQR). The Chi-square test of categorical variables and the Kruskal–Wallis H test for continuous variables were used to compare the three formulation groups. A p-value of less than 0.05 was considered statistically significant. Given the large number of reports, p-values are interpreted cautiously and emphasis is placed on effect estimates.
4.7. Event-Specific Adjusted Comparisons
To explore formulation differences in reporting patterns for selected adverse event terms, we fitted event-specific logistic regression models for pre-specified MedDRA preferred terms reflecting glycemic control (hypoglycemia and diabetes mellitus inadequate control) and for a pre-specified heterogeneous device- and use-related event cluster (Device Malfunction; Device Issue; Device Delivery System Issue; Product Quality Issue; Suspected Product Quality Issue; Product Dose Omission Issue; Dose Omission; Product Storage Error; Product Administration Error; Medication Error; Wrong Technique In Product Usage Process; Incorrect Dose Administered; Product Misuse; Accidental Overdose). Models used the standard-strength U100 formulation (Lantus®) as the reference and adjusted for age, sex, reporter type, and FDA received year. The primary models were complete-case for age and restricted to reports with specified sex; sensitivity analyses addressed missing sex and other potential biases. This cluster includes both device-related terms (e.g., device malfunction, delivery system issues) and use-related terms (e.g., incorrect dose, omission, administration error), which reflect different underlying mechanisms.
4.8. Multivariable Regression Analysis
For each outcome of interest, we defined a binary indicator variable where 1 denoted the presence of the event and 0 denoted its absence. Product type (Lantus, Toujeo, or biosimilar) was included as the primary explanatory variable of interest. Separate logistic regression models were fitted for each outcome, with the standard-strength U100 formulation (Lantus) serving as the reference category.
Binary logistic regression analyses were conducted to estimate adjusted odds ratios (aORs) for each outcome of interest. Odds ratios were calculated as exp(β) with 95% confidence intervals as exp[β ± 1.96 × SE(β)]. For continuous predictors (age), ORs are reported per unit increase (per year) and per clinically meaningful increment (per decade) for interpretability. Reference categories were: standard-strength U100 (Lantus), female sex, non-US reporting, non-expedited report, non-healthcare professional reporter, and absence of the listed reaction term. Models adjusted for report-level covariates available in the dataset, including age (continuous, per year), sex (male vs. female), reporter type (healthcare professional versus consumer), and FDA received year (per 1-year increase). For the composite serious outcome, standard maximum likelihood logistic regression was used. For individual outcomes with lower event rates (death, hospitalization, life-threatening event, disability), we applied Firth’s penalized logistic regression to address potential finite-sample bias, separation, and non-convergence. Firth’s method applies a Jeffreys prior penalty to the likelihood function, reducing bias in coefficients and standard errors when data are sparse or when complete or quasi-complete separation is present. Primary adjusted models were restricted to complete cases for all covariates (age, sex, reporter type, and FDA received year). Reports with missing or unclassifiable values, including “Unknown” or “Not specified” categories, were treated as missing and excluded from the primary regression analyses. To evaluate the impact of missing data, we conducted sensitivity analyses using (i) multiple imputation by chained equations (MICE) with 20 imputed datasets under the missing-at-random assumption, and (ii) missing indicator approaches where missing categorical values were coded as a separate category. Results were consistent with the primary complete-case analysis (Appendix A Table A2). Sensitivity analyses explored alternative specifications in which “Unknown” categories were retained as separate covariate levels, yielding materially similar estimates. Model performance was summarized using the area under the receiver operating characteristic curve (AUROC) and Brier score for the composite serious outcome model. Model calibration was assessed using the Hosmer–Lemeshow goodness-of-fit test, calibration-in-the-large (intercept), and calibration slope.
4.9. Sensitivity Analysis
To test robustness, we ran sensitivity analyses targeting common biases in spontaneous reporting data. First, we restricted to reports with no additional suspect drugs listed, to better isolate patterns plausibly attributed to insulin glargine. Second, we re-fitted the composite outcome model within overlapping calendar windows (2015–2025 and 2020–2025) to limit product lifecycle effects. Third, we retained reports with unknown sex by modelling “unknown” as a separate category rather than excluding them. Fourth, we repeated the composite outcome model in reports submitted by healthcare professionals. Fifth, as a robustness check, we repeated the composite outcome model after excluding reports with missing outcome fields. Sixth, we performed stratified analyses by reporter type (healthcare professional vs. consumer) within the 2020–2025 calendar window to evaluate temporal reporting stability. Seventh, we fitted propensity-weighted models for country (US vs. non-US) to address potential reporting heterogeneity across regulatory systems.
4.10. Composite Outcome and Overlap Analysis
To address the non-mutually exclusive nature of FAERS regulatory outcome categories, we evaluated the primary composite serious outcome (defined as the presence of death, hospitalization, life-threatening event, or disability). First, we quantified the extent of overlap among these outcomes to determine how frequently multiple serious outcomes were reported within the same case. Second, to assess whether the composite endpoint masked heterogeneous reporting patterns, we fitted additional multivariable logistic regression models for individual serious outcomes where sufficient data density allowed stable estimation. When standard maximum likelihood models for death and hospitalization did not converge due to sparse data or separation, Firth’s penalized logistic regression was used to obtain finite, bias-reduced estimates.
4.11. Device-Specific Analysis
We conducted a subgroup analysis restricted to reports involving insulin delivery devices (pens, pumps, syringes). Device model and manufacturer information were extracted from the FAERS device fields where available. Reports were stratified by device type (pen, pump, syringe/needle) and analyzed for the composite serious outcome and device-related event clusters. This analysis was restricted to reports with non-missing device information. Because FAERS MedDRA reaction terms do not capture device brand or model (e.g., SoloStar vs. KwikPen), disaggregation by specific device platform was not feasible.
4.12. Country Distribution Analysis
We summarized the geographic distribution of reports by country and region. A country distribution table reports the number of reports, deaths, hospitalizations, and unadjusted death proportions by country. Multivariable models included country (US vs. non-US) as a covariate to evaluate whether geographic reporting patterns influenced outcome associations.
4.13. Negative Control Outcome Analysis
To assess the potential for residual confounding and differential reporting bias, we conducted a negative control (falsification endpoint) analysis. Negative control outcomes were selected a priori based on three criteria: (1) no plausible biological relationship with insulin glargine formulation, concentration, or delivery device; (2) common enough to provide stable estimates; (3) subject to the same reporting channel and reporter-type biases as the primary outcomes. We selected three MedDRA Preferred Terms—headache, back pain, and alopecia—that satisfy these criteria. For each negative control outcome, we constructed a binary indicator denoting the presence of the preferred term within the report. We then fitted multivariable logistic regression models identical to those used in the primary analyses, using the standard-strength U100 formulation (Lantus®) as the reference and adjusting for age, sex, reporter type, and FDA received year. The purpose of this analysis was to evaluate whether the modeling approach generated spurious between-group differences in reporting patterns for outcomes not expected to differ across formulations. Absence of association between formulation and negative control outcomes supports the absence of major residual confounding by indication or reporting bias; non-null associations serve as “red flags” for differential reporting behavior.
5. Conclusions
This FAERS-based pharmacovigilance analysis identified formulation-specific differences in adverse event reporting patterns for insulin glargine products. After adjustment for available report-level characteristics, Toujeo was associated with modestly lower adjusted reporting odds of a composite serious clinical outcome, whereas biosimilars showed higher reporting odds in the primary model. However, neither association was robust across sensitivity analyses: the Toujeo signal lost significance in recent calendar windows and single-suspect restrictions, while the biosimilar signal attenuated to null without concomitant drugs and reversed direction in healthcare professional reports. Negative control analysis identified a back-pain signal in the biosimilar group, indicating potential residual reporting bias. The apparent US reporting protective effect was largely driven by an Egypt data outlier with aberrant characteristics and reversed direction in recent years, undermining its interpretation as a stable reporting bias. Geographic, temporal, and reporter-type heterogeneity in reporting patterns—rather than evidence of differential product safety—best explain the observed associations. These findings are hypothesis-generating for denominator-based studies and should not inform clinical switching decisions.
Author Contributions
Conceptualization, M.I.A.; methodology, E.M.B.; software, E.M.B.; validation, M.I.A. and E.M.B.; formal analysis, E.M.B.; investigation, E.M.B.; data curation, E.M.B.; writing—original draft preparation, E.M.B.; writing—review and editing, M.I.A.; visualization, E.M.B.; supervision, M.I.A.; project administration, M.I.A.; All authors have read and agreed to the published version of the manuscript.
Funding
This research received no external funding.
Institutional Review Board Statement
Not applicable. This study analyzed publicly available, de-identified data from the FDA Adverse Event Reporting System (FAERS) and involved no direct contact with human participants.
Informed Consent Statement
Not applicable.
Data Availability Statement
FAERS source files are publicly available from the U.S. Food and Drug Administration.
Conflicts of Interest
The authors declare no conflicts of interest.
Abbreviations
The following abbreviations are used in this manuscript:
| aOR | Adjusted Odd Ratio |
| CI | Confidence Interval |
| FDA | Food and Drug Administration |
| FAERS | FDA Adverse Event Reporting System |
| IQR | Inter-quartile range |
| U | Unit |
Appendix A
Table A1.
Comparison of Included vs. Excluded Reports (Complete-Case Analysis).
Table A2.
Overlap of Serious Outcomes Within Composite Definition Among cases meeting the definition of the composite serious outcome (n = 3415).
Table A3.
Negative Control Outcome Analyses with False Discovery Rate Correction.
References
- Darenskaya, M.; Kolesnikova La, L.A.; Kolesnikov, S. Oxidative stress: Pathogenetic role in diabetes mellitus and its complications and therapeutic approaches to correction. Bull. Exp. Biol. Med. 2021, 171, 179–189. [Google Scholar] [CrossRef] [Scilit] [PubMed]
- Duncan, B.B.; Magliano, D.J.; Boyko, E.J. IDF Diabetes Atlas 11th Edition 2025: Global Prevalence and Projections for 2050; Oxford University Press: Oxford, UK, 2025. [Google Scholar] [CrossRef] [Scilit] [PubMed]
- Owens, D.R. Pharmacokinetics and pharmacodynamics of insulin glargine 300 U/mL in the treatment of diabetes and their clinical relevance. Expert Opin. Drug Metab. Toxicol. 2016, 12, 977–987. [Google Scholar] [CrossRef] [Scilit] [PubMed]
- Weiskorn, J.; Saboo, B.; Danne, T. Current and future strategies in insulin development and treatment. Horm. Res. Paediatr. 2025, 98, 396–404. [Google Scholar] [CrossRef] [Scilit] [PubMed]
- Home, P.D.; Bergenstal, R.M.; Bolli, G.B.; Ziemen, M.; Rojeski, M.; Espinasse, M.; Riddle, M.C. New insulin glargine 300 units/mL versus glargine 100 units/mL in people with type 1 diabetes: A randomized, phase 3a, open-label clinical trial (EDITION 4). Diabetes Care 2015, 38, 533–541. [Google Scholar] [CrossRef] [Scilit] [PubMed]
- Riddle, M.C.; Bolli, G.B.; Ziemen, M.; Muehlen-Bartmer, I.; Bizet, F.; Home, P.D. New insulin glargine 300 units/mL versus glargine 100 units/mL in people with type 2 diabetes using basal and mealtime insulin: Glucose control and hypoglycemia in a 6-month randomized controlled trial (EDITION 1). Diabetes Care 2014, 37, 2763–2769. [Google Scholar] [CrossRef] [Scilit] [PubMed]
- Yki-Järvinen, H.; Bergenstal, R.; Ziemen, M.; Wardecki, M.; Muehlen-Bartmer, I.; Boelle, E.; Riddle, M.C.; EDITION 2 Study Investigators. New insulin glargine 300 units/mL versus glargine 100 units/mL in people with type 2 diabetes using oral agents and basal insulin: Glucose control and hypoglycemia in a 6-month randomized controlled trial (EDITION 2). Diabetes Care 2014, 37, 3235–3243. [Google Scholar] [CrossRef] [Scilit] [PubMed]
- Bolli, G.B.; Riddle, M.C.; Bergenstal, R.M.; Wardecki, M.; Goyeau, H.; Home, P.D.; on behalf of the EDITION 3 study investigators. New insulin glargine 300 U/mL compared with glargine 100 U/mL in insulin-naïve people with type 2 diabetes on oral glucose-lowering drugs: A randomized controlled trial (EDITION 3). Diabetes Obes. Metab. 2015, 17, 1148–1154. [Google Scholar] [CrossRef] [Scilit] [PubMed]
- Ritzel, R.; Roussel, R.; Bolli, G.B.; Vinet, L.; Brulle-Wohlhueter, C.; Glezer, S.; Yki-Järvinen, H. Patient-level meta-analysis of the EDITION 1, 2 and 3 studies: Glycaemic control and hypoglycaemia with new insulin glargine 300 U/mL versus glargine 100 U/mL in people with type 2 diabetes. Diabetes Obes. Metab. 2015, 17, 859–867. [Google Scholar] [CrossRef] [Scilit] [PubMed]
- Matli, M.C.; Wilson, A.B.; Rappsilber, L.M.; Sheffield, F.P.; Farlow, M.L.; Johnson, J.L. The first interchangeable biosimilar insulin: Insulin glargine-yfgn. J. Diabetes Sci. Technol. 2023, 17, 490–494. [Google Scholar] [CrossRef] [Scilit] [PubMed]
- Davies, M.; Dahl, D.; Heise, T.; Kiljanski, J.; Mathieu, C. Introduction of biosimilar insulins in Europe. Diabet. Med. 2017, 34, 1340–1353. [Google Scholar] [CrossRef] [Scilit] [PubMed]
- Rosenstock, J.; Hollander, P.; Bhargava, A.; Ilag, L.L.; Pollom, R.K.; Zielonka, J.S.; Huster, W.J.; Prince, M.J. Similar efficacy and safety of LY2963016 insulin glargine and insulin glargine (Lantus®) in patients with type 2 diabetes who were insulin-naïve or previously treated with insulin glargine: A randomized, double-blind controlled trial (the ELEMENT 2 study). Diabetes Obes. Metab. 2015, 17, 734–741. [Google Scholar] [CrossRef] [Scilit] [PubMed]
- Blevins, T.C.; Barve, A.; Sun, B.; Raiter, Y.; Aubonnet, P.; Muniz, R.; Athalye, S.; Ankersen, M. Efficacy and safety of MYL-1501D versus insulin glargine in patients with type 2 diabetes after 24 weeks: Results of the phase III INSTRIDE 2 study. Diabetes Obes. Metab. 2019, 21, 129–135. [Google Scholar] [CrossRef] [Scilit] [PubMed]
- Tieu, C.; Lucas, E.J.; DePaola, M.; Rosman, L.; Alexander, G.C. Efficacy and safety of biosimilar insulins compared to their reference products: A systematic review. PLoS ONE 2018, 13, e0195012. [Google Scholar] [CrossRef] [Scilit] [PubMed]
- Herndon, T.M.; Troein, P.; O’Rourke, K.; Kesselheim, A.S. Safety outcomes when switching between biosimilars and reference biologics: A systematic review and meta-analysis. PLoS ONE 2023, 18, e0292231. [Google Scholar] [CrossRef] [Scilit] [PubMed]
- Yang, L.J.; Chen, Y.J.; Lin, Y.H.; Lin, C.H. Efficacy and immunogenicity of insulin biosimilars compared with their reference products: A systematic review and meta-analysis. BMC Endocr. Disord. 2022, 22, 35. [Google Scholar] [CrossRef] [Scilit] [PubMed]
- Troein, P.; Stoddart, K.; Newton, M.; Aurelio, A. The Impact of Biosimilar Competition in Europe; IQVIA Institute for Human Data Science: Durham, UK, 2023; Available online: https://www.iqvia.com/-/media/iqvia/pdfs/library/white-papers/the-impact-of-biosimilar-competition-in-europe-2023.pdf (accessed on 22 February 2026).
- Rieger, C.; Dean, J.A.; Hall, L.; Vasquez, P.; Merlo, G. Barriers and Enablers Affecting the Uptake of Biosimilar Medicines Viewed Through the Lens of Actor Network Theory: A systematic review. BioDrugs 2024, 38, 541–555. [Google Scholar] [CrossRef] [Scilit] [PubMed]
- Evans, S.J.; Waller, P.C.; Davis, S. Use of proportional reporting ratios (PRRs) for signal generation from spontaneous adverse drug reaction reports. Pharmacoepidemiol. Drug Saf. 2001, 10, 483–486. [Google Scholar] [CrossRef] [Scilit] [PubMed]
- Schuemie, M.J.; Ryan, P.B.; Dumouchel, W.; Suchard, M.A.; Madigan, D. Interpreting observational studies: Why empirical calibration is needed to correct p-values. Stat. Med. 2014, 33, 209–218. [Google Scholar] [CrossRef] [Scilit] [PubMed]
- Lukose, L.; Pawar, M.; Shaju, A.M.; Nair, G.; Viswam, S.K. Uncovering False Alarms: Examining Biases and Confounders in in Disproportionality Analysis. In Signal Analysis in Pharmacovigilance; CRC Press: Boca Raton, FL, USA, 2024; pp. 73–94. [Google Scholar]
- Wang, T.; He, G.; Xiong, W.; Huang, J. Adverse drug events associated with insulin glargine: A real-world pharmacovigilance study based on the FAERS database. Front. Pharmacol. 2025, 16, 1563238. [Google Scholar] [CrossRef] [Scilit] [PubMed]
- Ezeja, L.; Qian, J. Post-marketing safety of Lantus and its interchangeable biosimilar Semglee in the United States: A disproportionality analysis using the FDA Adverse Event Reporting System (FAERS) database. Diabetes Obes. Metab. 2025, 27, 4480–4489. [Google Scholar] [CrossRef] [Scilit] [PubMed]
- Weber, J. Epidemiology of adverse reactions to nonsteroidal anti-inflammatory drugs. Adv. Inflamm. Res. 1984, 6, 1. [Google Scholar]
- Arora, A.; Jalali, R.K.; Vohora, D. Relevance of the Weber effect in contemporary pharmacovigilance of oncology drugs. Ther. Clin. Risk Manag. 2017, 13, 1195–1203. [Google Scholar] [CrossRef] [Scilit] [PubMed]
- U.S. Food and Drug Administration. Guidance for Industry: Good Pharmacovigilance Practices and Pharmacoepidemiologic Assessment; U.S. Department of Health and Human Services: Rockville, MD, USA, 2005. Available online: https://www.fda.gov/media/71546/download (accessed on 22 February 2026).
- MedDRA Maintenance and Support Services Organization (MSSO). MedDRA Version 27.0; MSSO: Chantilly, VA, USA, 2024; Available online: https://www.meddra.org (accessed on 22 February 2026).

Disclaimer/Publisher’s Note: The statements, opinions and data contained in all publications are solely those of the individual author(s) and contributor(s) and not of MDPI and/or the editor(s). MDPI and/or the editor(s) disclaim responsibility for any injury to people or property resulting from any ideas, methods, instructions or products referred to in the content. |
© 2026 by the authors. Licensee MDPI, Basel, Switzerland. This article is an open access article distributed under the terms and conditions of the Creative Commons Attribution (CC BY) license.