


Abstract
Multi-omics is a field that studies the interactions between different biological modalities to obtain a more precise medical understanding of biological phenomena. With recent advances in high-throughput technologies, multi-omics datasets have become more accessible, enabling a better characterization of clinical observations. However, multi-omics data integration comes with many challenges, such as high dimensionality, small sample sizes, multimodality, missing omics layers, batch effects, and technical artifacts among others. The rapid evolution of deep learning presents a promising solution to address these issues. More specifically, recent advances in representation learning allow the extraction of meaningful and compact embeddings that combine information from multiple sources. Additionally, explainable predictive modeling can help uncover key features and support biomarker identification. The scope of this review is to provide a comprehensive overview of multi-omics data, focusing on integration strategies and emerging deep learning frameworks that enhance modern precision medicine, improve disease diagnosis and prognosis, support biomarker discovery and enable personalized treatment prediction. We aim to bridge the gap between molecular biology and artificial intelligence and highlight how multi-omics integration has the potential to uncover complex biological mechanisms, improve clinical decision making and contribute to a more complete understanding of disease development, progression and treatment response.
1. Introduction
High-throughput technologies enable the generation of large amounts of data that were not accessible before. Recently, we have been able to obtain a molecular profile with high precision for patients. Single-cell multi-omics is a major breakthrough where we can obtain cell-precision omics layers such as genomics, epigenomics and transcriptomics. Each omic layer reflects a different level of cellular organization, from the static genetic blueprint to dynamic regulatory, functional and metabolic states. The quality of data sequencing is also reaching new levels of accuracy where reads have fewer missing values and less sparsity. This enabled a totally new perspective of what the future of medicine and healthcare would look like. Instead of only relying on observable biological phenomena, a full biological pathway can now be studied to define with unprecedented precision the diagnosis of a disease, the prognosis of a patient, the discovery of biological pathways, the identification of biomarkers, and personalized treatment.
However, turning this wealth of information into actionable knowledge is far from trivial. Multi-omics data are high-dimensional, noisy and heterogeneous: most modalities are encoded as large expression or abundance matrices, while others, such as histopathology images or raw sequences, are inherently unstructured.
Also, datasets can be extracted from the bulk level, where signals from many cells in an organism are aggregated through averaging and combined in a single omic profile. This approach neglects the diversity of cell functions and their heterogeneous aspect within the same sample, but remains less sparse and less challenging to preprocess. The more recent approach profiles each cell on its own, introducing diversity and allowing to profile the differences between cells but introducing more difficulties in dealing with missing values and sparse representations.
In addition, many studies also suffer from missing omics layers where not all the patients have all omics, imposing a robustness-to-missing-omics constraint on the trained models. Non-overlapping feature spaces and study- or technology-specific biases are also another challenge. The absence of a unified range of features between multiple datasets makes it challenging to train a model across datasets, which is very important due to the curse of dimensionality (). The central problem we address in this review is how to design deep learning methods that can integrate such complex, partially observed and multi-scale data in a way that allows us to reach the goals of neo-medicine.
The fast evolution of deep learning offers a promising toolbox to tackle these challenges. Deep models can extract non-linear relationships from high-dimensional omics, learn latent representations that compress molecular profiles, perform cross-omics fusion and even generate missing omics layers. In this review, we adopt a structured perspective along three main axes: (i) data characteristics, distinguishing structured vs. unstructured inputs and bulk vs. single-cell settings; (ii) integration strategies, ranging from early feature-level fusion to intermediate representation learning and late decision-level combination, as well as hybrid schemes; and (iii) learning objectives, including discriminative models for prediction, generative models for reconstruction and imputation, and self-supervised or contrastive objectives for representation learning.
Within this framework, we outline the main families of deep learning approaches used for multi-omics integration, without focusing on individual models. Representation learning methods based on variational autoencoders [1] and related architectures compress omics into low-dimensional latent spaces that facilitate downstream tasks, but may raise questions about interpretability. Attention-based and Transformer-style architectures [2] explicitly model dependencies within and between omics, offering flexible fusion mechanisms at the cost of higher data and computational requirements. Generative and probabilistic frameworks incorporate likelihood-based decoders and alignment losses to handle missing omics layers and correct batch effects, but depend on modeling assumptions that must be carefully validated. Finally, clustering- and survival-oriented objectives shape the latent space to better capture disease subtypes or risk groups, while still requiring rigorous biological and clinical evaluation. By discussing these approaches along the three axes above, our goal is to bridge the gap between molecular biology and cutting-edge artificial intelligence, and to highlight how data-driven multi-omics integration can help uncover complex biological mechanisms and support clinical decision making.
Several reviews have already discussed machine learning and deep learning for multi-omics integration, but they approach the field from different perspectives. Dhillon et al. [3] mainly focus on computational methods for biomarker identification using single- and multi-omics data. Acharya and Mukhopadhyay [4] provide a broader overview of machine learning approaches for multi-omics integration, but with a particular focus on precision oncology. Sartori et al. [5] review deep learning approaches for multi-omics cancer research, while Zhang et al. [6] focus more specifically on cancer diagnosis and treatment. More recently, Benabbou et al. [7] provide a scoping review of machine learning and deep learning multi-omics approaches, but remain specifically centered on cancer. Other reviews, such as Ballard et al. [8], provide a more computational perspective by organizing multi-omics integration mainly according to the different deep learning architectures and integration mechanisms. Therefore, existing reviews often focus on a particular disease, downstream objective or computational aspect of multi-omics integration.
In contrast, one of the main considerations of this review is to provide a more practical view of the field. In practice, obtaining several molecular omics layers from the same patients remains difficult, while clinical information and pathomics or other medical imaging data are routinely generated and generally more readily available in clinical settings. For this reason, this review does not restrict multi-omics integration to frameworks combining molecular omics only. We also consider studies integrating molecular omics with clinical data, pathomics/imaging and spatial information, since these settings represent an important part of how multimodal precision medicine is applied in practice. Purely single-omic studies, however, are excluded from the application-based analysis to maintain a consistent integration-oriented scope.
Another contribution of this review lies in its temporal coverage. Instead of focusing only on recent frameworks, we include earlier approaches that introduced relevant integration strategies together with more recent studies, with particular attention to developments from 2025 to 2026. This allows us to observe how the field has evolved from relatively simple feature concatenation, autoencoder-based representations and fully connected architectures toward attention mechanisms, Transformers, GNNs, spatial modeling and more adaptive integration strategies. Therefore, the review does not only provide a snapshot of the current methods, but also highlights recent tendencies and how they differ from earlier approaches.
In this study, we will try to respond to the following RQs:
- RQ1: What are the major modalities and molecular layers combined for medical downstream tasks?
- RQ2: Which integration strategies and deep learning architectures are mainly used?
- RQ3: What are the main challenges that limit multi-omics integration?
- RQ4: How is prior biological knowledge incorporated into these models?
- RQ5: What are the emerging tendencies in multi-omics integration?
2. Multi-Omics Data Overview
2.1. Data Characteristics
Multi-omics data present many challenges as extracting knowledge from multimodal heterogeneous data require a per-omic handling strategy.
On the one hand, most omics layers are represented as high-dimensional tabular matrices (e.g., genes × samples), while on the other hand, some modalities such as histopathology or raw sequencing reads are inherently unstructured. In addition, each study comes with a batch shift resulting from sequencing technology or specific parameters that makes it hard to define a general framework that apply to multiple datasets. In addition, datasets can be generated either at the bulk level, where multiple cell signals are aggregated, or at the single-cell level, capturing cell-to-cell heterogeneity. These aspects have a direct impact on how models are designed and how information is integrated across omics layers.
- Structured data (e.g., expression matrices).The majority of omics data can be represented as structured data in the form of tabular data , where N is the number of samples (or cells) and P the number of features (e.g., genes, CpG sites, CNV segments, proteins). To mention some of these omics, single-cell RNA-seq count matrices, DNA methylation -value matrices, copy-number profiles and proteomics abundance can be encoded as tables.
- Unstructured data (e.g., sequences, images).Other omics are inherently unstructured and require a customized feature extractor. For instance, histopathology images require convolutional neural networks (CNNs), vision Transformers or multiple-instance learning frameworks. Similarly, raw sequential data like RNA, DNA or chromatin accessibility data requires recurrent models or 1-D convolutional networks. In most of the works, these data are first embedded into a structured space before being utilized for the task at hand.
- Single-cell vs. bulk omics.Another categorization aspect of data is omics precision. Bulk omics measure averaged signals from multiple cells. It produces one profile for a specific sample. This approach drops the cell-specific information resulting in smoothing the cellular heterogeneity. An advantage of this approach is a less sparse data, reducing the missing values issue. The second approach is single-cell level data. It extracts signals from each of the cells and return a much larger matrices (N in the order of –) that are sparse, noisy and highly heterogeneous.The advantage of this approach is it enables to study the cells level heterogeneity but require more preprocessing steps before passing it to models.
2.2. Types of Omics
Genomics.
Genomics is the study of the complete DNA sequence of an organism. All the biological pathways are represented in the form of a sequence of A, T, G and C (adenine, thymine, guanine and cytosine). These sequences and their order shape genes, regulatory regions and structural elements, and how these, in turn, define biological traits. While all the cells in an organism carry almost the same genome, this omic is profiled using Next-Generation Sequencing. There are three strategies to choose the target regions of the DNA. WGS (Whole Genome Sequencing) profiles the entire genome. WES (Whole Exome Sequencing) profiles the coding regions of the genome. A more targeted approach is called Targeted Next-Generation Sequencing (tNGS) where a specific region encoding a particular phenotype is sequenced. Reads of the sequence can either be stored in a FASTQ file (sequences and quality of sequencing), FASTA (only sequences), SAM (reads aligned with a reference genome) or VCF (genetic variations).
Epigenomics.
While the DNA is static and remains the same in all the cells, different cells have different functions. This results from regulatory factors imposed by epigenomics. Epigenomics describes this regulatory layer that decides which parts of the genome can be expressed and which parts should be silenced. For instance, the regions responsible for muscular behavior are silenced in a nervous cell, while nervous functionalities are well expressed in this type of cell. It focuses on chemical modifications such as DNA methylation, histone marks and chromatin remodeling, which act as molecular switches controlling whether a gene is turned “on” or “off”. There are three strategies to profile epigenomics. ChIP-Seq [9] localizes regulatory proteins in the DNA. Bisulfite-Seq [10] detects the methylation of DNA regions. The most common technique is ATAC-Seq [11], which identifies open regions of the chromatin and therefore accesses the expressible parts. The same technologies and file formats are utilized to extract and store epigenomic data.
Transcriptomics.
The accessible parts of the chromatin are transcribed and encoded using RNA. These reads are studied in transcriptomics, which captures the set of RNA molecules transcribed from DNA. These sequences represent the gene activity at a given time and in a given context. It reveals which genes are expressed and at what level, effectively turning the static genomic code into dynamic instructions for the cell. Unlike the genome, which is relatively stable, the transcriptome is highly dynamic. Four main strategies to collect transcriptomics data are bulk RNA sequencing (RNA-seq) [12], single-cell RNA-seq [13], LncRNA-seq [14] and miRNA-Seq [15]. The same technologies and storage structures as genomics and epigenomics are employed to capture transcriptomics.
Proteomics.
All the phenotypes, from eye color to skin cancer, in an organism are the result of a combination of proteins and their abundance. Transcription of accessible genomic regions produces RNA transcripts, which subsequently translate into proteins by ribosomes, showing the importance of proteomics.
Proteomics focuses on the full set of proteins produced by a cell or organism, the main actors that execute biological functions. Proteins catalyze reactions, transmit signals, form structural scaffolds and modulate gene expression. While transcriptomics indicates which proteins could be produced, proteomics tells us which proteins are actually present, in what abundance and with which post-translational modifications. This omic layer is typically profiled using liquid chromatography–mass spectrometry (LC–MS/MS) [16,17] workflows or high-throughput protein arrays and stored in a CSV file or a protein identification result (mzIdentML).
Metabolomics.
Metabolomics investigates small molecules—metabolites—generated by biochemical reactions inside cells and tissues. These metabolites (sugars, amino acids, lipids, hormones, etc.) reflect the current physiological state of the system and provide a direct readout of metabolic activity. While genomics describes what can happen and transcriptomics describes what is planned, metabolomics reveals what is actually happening in near real time. Changes in metabolite concentrations expose how pathways respond to diet, disease, drugs or environmental perturbations. Nuclear magnetic resonance (NMR) [18] spectroscopy and mass spectrometry are the core technologies used in this field, enabling quantitative and often untargeted profiling of metabolic networks.
Summary. Each omics layer captures a distinct aspect of biological organization:
- Genomics: The static genetic blueprint (what can happen).
- Epigenomics: The regulatory control of gene accessibility (what should happen).
- Transcriptomics: The transcribed instructions (what is being planned).
- Proteomics: The executed functional machinery (what is being done).
- Metabolomics: The biochemical output of all processes (what has happened).
Together, they form a hierarchical cascade from DNA to phenotype, providing a multidimensional understanding of life’s molecular complexity.
3. Multi-Omics Datasets
Several public datasets have become widely used benchmarks for evaluating multi-omics integration methods in different downstream tasks, including disease subtype classification, survival prediction, drug response prediction, biomarker discovery, and patient stratification. In cancer research, The Cancer Genome Atlas (TCGA) remains the most frequently used resource.
It is a rich source of multi-layer molecular profiles across many cancer and clinical phenotypes. Depending on the use case, it includes gene expression, DNA methylation, miRNA expression, and clinical measures [19].
Because of its large scale and diversity of tumor types, TCGA has been extensively used to evaluate deep learning models for cancer subtype classification, prognosis prediction, survival risk stratification, and molecular biomarker discovery.
Another important cancer resource is the Clinical Proteomic Tumor Analysis Consortium (CPTAC), which focuses on proteogenomic characterization of tumors by combining genomic, transcriptomic, proteomic, phosphoproteomic, imaging, and clinical data [20,21].
In contrast to TCGA, which provides proteomics for a limited number of samples, CPTAC includes deep mass-spectrometry proteomics and phosphoproteomics, an important measurement for cancer-related downstream tasks. Protein abundances reflect underlying biological phenomena, making CPTAC useful for tumor subtyping, pathway activity estimation, drug target discovery, and the identification of clinically relevant protein biomarkers.
Breast cancer studies also frequently use the Molecular Taxonomy of Breast Cancer International Consortium (METABRIC) dataset. METABRIC combines CNAs, gene expression profiles, and the eventual clinical outcome of breast cancer patients [22]. Due to the availability of survival and clinical annotations, this dataset is often used for prognosis prediction, risk stratification, and molecular subtype discovery. Similarly, the Therapeutically Applicable Research to Generate Effective Treatments (TARGET) program can be considered a pediatric counterpart to TCGA, providing genomic, transcriptomic, epigenomic, and clinical data for childhood cancers [23]. TARGET is useful for studying pediatric cancer biology and for developing predictive models in settings where sample size is more limited.
Drug response prediction is among the most studied challenges in multi-omics integration. Therefore, datasets were collected to address it. The Cancer Cell Line Encyclopedia (CCLE) and the Genomics of Drug Sensitivity in Cancer (GDSC) are commonly used to train models for predicting drug response. CCLE is a collection of genomic characterizations of cancer cell lines together with pharmacological profiles, while GDSC provides drug sensitivity measurements across large panels of cancer cell lines [24,25]. Combined, they provide a direct link between the observed response to treatment and the molecular profile of cell lines.
There are also datasets that tackle neurodegenerative diseases. For instance, the Religious Orders Study and Memory and Aging Project (ROSMAP), available through the AMP-AD Knowledge Portal, provides clinical, pathological, genomic, transcriptomic, epigenomic, proteomic, and other molecular data related to aging and Alzheimer’s disease [26]. ROSMAP is commonly used for disease classification, biomarker discovery, and modeling Alzheimer’s disease progression. Similarly, the Alzheimer’s Disease Neuroimaging Initiative (ADNI) provides longitudinal clinical, imaging, genetic, biofluid biomarker, and omics-related data, making it useful for multimodal and multi-omics prediction of disease conversion and progression [27].
Finally, general repositories such as the Gene Expression Omnibus (GEO) are frequently used to obtain independent omics cohorts for validation or external testing [28]. Unlike TCGA, CPTAC, or METABRIC, GEO is not a single harmonized multi-omics cohort, but rather a large public repository containing many transcriptomic, epigenomic, and functional genomics datasets. Therefore, GEO datasets are often used to validate biomarkers, reproduce findings across independent cohorts, or complement larger benchmark datasets.
Table 1 summarizes the main public multi-omics resources and their commonly used modalities and applications.
Table 1.
Summary of commonly used benchmark datasets and resources for multi-omics integration studies.
4. Integration of Prior Biological Knowledge
Due to the high dimensionality and limited number of samples in multi-omics datasets, several recent approaches include the biological prior knowledge in the design of their architectures. The detection of underlying dependencies within an omics layer and cross multi-omics require a high number of samples and a high computational power to analyse the connection between all the features. Prior biological knowledge allows to sparsify the analysed relationships and guide the learning to accelerate the downstream goals.
These priors are usually obtained from pathway databases, protein–protein interaction networks, gene co-expression networks, or known regulatory relationships between omics layers.
Pathway databases such as KEGG and Reactome are among the most used sources of biological prior knowledge. KEGG provides manually curated pathway maps describing molecular interactions, reactions, metabolic processes, signaling pathways, disease mechanisms, and drug-related processes [29]. Similarly, Reactome provides curated and peer-reviewed biological reactions and pathways, mainly focused on human biology [30]. In multi-omics deep learning models, these pathway annotations can be used to group genes into biologically meaningful modules, guide the connection between input genes and hidden pathway nodes, or generate pathway-level embeddings. This improves interpretability because the learned hidden units can be linked to known biological processes instead of abstract latent features.
Protein–protein interaction networks are another important source of prior knowledge. Databases such as STRING provide functional protein association networks built from experimental evidence, computational prediction, text mining, and curated databases [31]. These networks are often used to construct graph-based models where genes or proteins are represented as nodes and biological interactions are represented as edges.
These graphs allow graph neural networks to update genes or proteins representations by aggregating a weighted sum that include adjacent nodes. This aspect is very useful in abnormal cases like cancer studies where dysregulated pathways appear and are only recorded in clinical observations of the disease.
Gene co-expression networks are also widely used to introduce biological structure into multi-omics models. In this case, the relationships between genes are not directly taken from external databases but inferred from the data itself based on correlation patterns across samples. Methods such as WGCNA identify modules of highly correlated genes that may be involved in similar biological functions or regulatory programs [32]. These modules can then be used as graph structures, feature groups, or intermediate biological representations.
Compared with fully connected models, co-expression-guided approaches are more practical as they sparsify the adjacency matrix of graphs and allow a faster and guided identification of genes that influence the final prediction.
Prior biological knowledge can also be introduced through known regulatory relationships between omics layers. For instance, miRNAs inherently repress mRNA. Therefore, they are modeled as negative regulators of mRNA expression. DNA methylation is often associated with the repression of transcriptomics expressions depending on the genomic context. CNVs can also be modeled as negative or positive regulators depending on the final objective as they influence gene expression by changing gene dosage. Some multi-omics models explicitly encode these assumptions by connecting miRNA, methylation, CNV, and mRNA features according to their expected regulatory effects. This allows the model to capture inter-omics relationships in a more biologically meaningful way instead of treating each omics layer as an independent group of features.
Overall, the integration of prior biological knowledge is an important direction in multi-omics deep learning. It helps reduce model complexity, improves interpretability, and allows the learned representations to be linked back to pathways, molecular interactions, regulatory mechanisms, or gene modules. However, these approaches still depend on the quality and completeness of the external knowledge bases.
Incomplete annotations, context-specific interactions, and tissue-specific regulatory mechanisms can limit the generalizability of prior-guided models. Therefore, combining curated biological knowledge with data-driven learning remains an important challenge for future multi-omics frameworks.
5. Deep Learning Architectures for Multi-Omics Integration
Modern deep learning architectures give a variety of tools to handle missing modalities, heterogeneous data structures, interpretability, and high dimensionality. Most of the architectures used to integrate the different omics layers for the downstream study objective focus on learning a compact, informative, and interpretable representation of these omics layers, whether jointly or individually. Embeddings and representation learning have benefited from the LLM and VLM trend, where text, video, audio, etc., are transformed into tailored, compact, and practical representations to achieve the downstream goal. This trend has given us a toolkit of advanced techniques that can be adapted to the integration of multiple modalities and, more specifically, multi-omics, to either diagnose disease, predict survival chances, discover biomarkers, or detect new subtypes and clusters for biological analysis. These architectures are often used to combine transcriptomics, epigenomics, genomics, proteomics, metabolomics, clinical records, or imaging-derived features into a shared representation for downstream prediction tasks. Depending on the objective, the integration can be performed at the input level, the latent representation level, or the decision level. The most common architectures include autoencoders, variational autoencoders, graph neural networks, convolutional neural networks, and Transformers.
5.1. Autoencoders
Autoencoders are among the most commonly used architectures for unsupervised or semi-supervised multi-omics representation learning. The main objective of autoencoders is to distill data into a compact and low dimensional embedding while maintaining relevant information for the downstream analyses. It usually starts with an encoder that reduces the dimensionality of the data into a latent space, then a decoder reconstructs the initial vector to enforce that the latent space still preserves the essential information required to rebuild the vector. Another objective can be denoising the data, where during training, synthetic noise is added to the input vector while the decoder is asked to generate the noise-free data using a loss function that includes the original data. Imputation can also be achieved by autoencoders, where parts of the original data are masked and the decoder is forced, via the loss function, to generate the original unmasked data.
Figure 1 illustrates autoencoder-based representation learning, denoising and entry-level imputation.
Figure 1.
An illustration of autoencoders. A bottleneck autoencoder encodes an omics input to a compressed latent code z—the objective-guided embedding—and reconstructs the input through the decoder. The reconstruction denoises the signal and fills scattered missing entries (value-level imputation), as the inset shows. The diagram abstracts over design choices: the encoder may be a single network over fused (concatenated) omics or per-omics encoders fused at the bottleneck, and one or several decoders may be used.
Autoencoders can be tailored depending on the integration study. In early-fusion, all omics features are concatenated into one large vector and passed through a single encoder. This approach’s advantage is the ability to learn cross omics interactions while compressing the data into a campact embedding, but its limitation is that different omics can have different scales and data formats, making it less practical. In intermediate-fusion, each omic can have a dedicated encoder that learns an omic-specific latent space. These embeddings can be fused using a wide variety of techniques or simply be concatenated. This approach is more practical when each omics layer has its own scale or data distribution.
5.2. Graph Neural Networks
The most widely used algorithm in multi-omics are graph neural networks as they inherently consider the biological data nature that contain relational structures. GNNs explicitly model the relational aspect between nodes. In the framework of multi-omics integration, graphs can be constructed in two modes: a patient-centric perspective, where nodes are patients and edges illustrate similarities between them, and a feature-centric or gene-centric graph where each node represents a gene, protein, pathway or molecular feature, and edges represent biological or statistical relationships between them.
In patient-centric graphs, edges are usually obtained using similarity measures such as Euclidean distance, Pearson correlation, or Mahalanobis distance. In order to avoid a fully connected graph where all nodes are connected, a sparsification step follows. This can be achieved by utilizing k-nearest-neighbours or attention mechanism weights where only the most similar nodes remains connected. In feature-centric graphs, edges can be derived from biological prior knowledge such as KEGG pathways, Reactome pathways, STRING protein–protein interactions, gene co-expression networks or regulatory relationships between omics layers. The advantage of this approach is that it allow the guidance of the model for downstream tasks while introducing an interpretability in the integral structure of GNNs.
The most utilized GNNs are graph convolutional networks (GCN). They operate by aggregating information from adjacent nodes. At each level, the representation of a node is updated using its features and the neighbouring features. Figure 2 illustrates graph construction and graph-level or embedding-level fusion for multi-omics learning.
Figure 2.
An illustration of graph convolutional networks (GCN). A graph is first constructed from each omics layer: nodes are either patients (patient similarity network) or genes/features (feature-centric graph), and edges come from k-nearest-neighbour sparsification of a distance/similarity (Euclidean, Mahalanobis, Pearson correlation) or from prior-knowledge bases (KEGG/Reactome pathways, STRING PPI). The per-omics adjacencies (heatmap) are then integrated by one of two strategies: (a) graph-level fusion, where similarity network fusion (SNF) cross-diffuses the networks into a single consensus A processed by one shared GCN; or (b) embedding-level fusion, where each omics graph is processed by its own GCN and the resulting node embeddings are fused (concatenation, attention, or a correlation-discovery network as in MOGONET). Each convolution reweights and aggregates neighbour embeddings; a GAT variant makes the weights learnable. Either route gives an objective-guided node/graph embedding H (patient-level for a patient similarity network or feature-level for a feature graph).
5.3. Convolutional Neural Networks
Although they were originally developed for image analysis, convolutional neural networks have also been adapted for multi-omics integration. Conventional 2-D CNNs are naturally suited for image-based modalities such as histopathology and other medical images. In imaging-omics integration, they can be used to extract pathomics representations from histopathology or whole-slide images before integrating them with molecular omics. They can also be applied directly to molecular profiles by reshaping omics layers into square matrices. Due to the low-sample, high-dimensionality aspect of multi-omics datasets, reshaping omics layers into a square matrix has become widely used. This serves to reformulate the data aspect from thousands of features per patient into one image with thousands of pixels per patient. CNNs’ main advantage over classical neural networks is their ability to model relationships between adjacent pixels while preserving a relatively low number of parameters, making them suitable for multi-omics downstream analysis.
Figure 3 illustrates how a 2-D CNN processes an image or a reshaped omics profile.
Figure 3.
An illustration of CNNs. A conventional 2-D CNN processes either a spatial image, such as a histopathology WSI tile, or an omics vector reorganized into a 2-D matrix. Pink and purple input tiles schematically represent WSI images.
A very popular CNN architecture in multi-omics integration is 1-D CNNs, where a filter slides across the feature sequence and learns local combinations of adjacent features that are useful for the downstream objective. After several convolution and pooling layers, the model produces a compact embedding that can be used for classification, regression, or survival prediction. Two approaches of 1-D CNNs are utilized. The first employs a CNN per omic, then fuses the learned embeddings, whether by concatenating them or using any other technique. The second way is to concatenate all omics vectors into one long feature sequence and apply a single 1-D CNN. This can only be applied when omics layers have a sequential structure like CNVs, DNA methylation, miRNA, etc. The model in this case learns cross-omics patterns directly, but it depends strongly on the ordering of the features.
Figure 4 illustrates 1-D convolution and the two multi-omics fusion strategies described above.
Figure 4.
An illustration of 1-D CNNs. A width-K filter slides along a single ordered omics vector, at each position computing then ReLU to form one entry of the feature map (stacked conv+pool blocks summarize the sequence). Multi-omics inputs are handled either (a) by a separate 1-D CNN per omic whose embeddings are fused, or (b) by concatenating the omics vectors into one sequence for a single 1-D CNN. Either route yields an objective-guided embedding H.
Feature ordering is one of the most important challenges when applying CNNs to omics data. Unlike pixels in an image, omics features do not naturally have a spatial arrangement. Therefore, the order of features must be defined carefully. Some studies order features by genomic position, pathway membership, correlation structure, biological hierarchy, or clustering methods. When correlated or biologically related features are placed close to each other, the data becomes fit to the base assumption of CNNs, which consider that adjacent features, or pixels, mostly tend to represent the same object. In multi-omics terminology, objects are diseases, biomarkers, survival chances, etc. However, CNNs’ main limitation is that they capture mostly local dependencies, while long-range interactions between distant features may be harder to model.
5.4. Variational Autoencoders
Variational autoencoder is a more sophisticated version that, instead of simply learning the deterministic latent space, it learns the probabilistic distribution of it. Usually, the encoder learns the parameters of a Gaussian distribution defined by the mean and the variance. A vector is then sampled from this distribution to reconstruct the input data. This probabilistic formulation allows the model to learn the underlying distribution of the omics data and generate new or missing information from the learned latent space.
In the framework of multi-omics, VAEs are mostly utilized when the dataset is missing one or more omics layers. The main objective of introducing this architecture is that, when a patient is missing an omic layer, a signal guided by other available omics can serve to sample from the underlying missing omic learned distribution to generate the missing omic. When combined with other probabilistic tools like product of experts (PoE) or mixture of experts (MoE), VAE can become very robust and practical even without generating the missing omics layers. This can be achieved by employing an omics-specific VAE that learns a latent distribution called marginal posterior. Utilizing PoE, we can obtain a joint approximate posterior distribution that can accommodate missing layers since the product of two Gaussians is still a Gaussian.
VAE advantage over classic AE is that they not only tackle, dimensionality reduction, denoising and imputing omics layers but also allow the generation of entire omics layers. The latent space distribution can be employed for downstream tasks. However, the cost of training VAEs is higher as they require balancing reconstruction loss and latent regularization through the KL-divergence term and a lot of data to learn a robust latent distribution. The main challenge of training VAEs remains the low sample sizes in most multi-omics datasets.
Figure 5 illustrates a product-of-experts variational autoencoder that can infer latent representations from the observed omics and reconstruct missing modalities.
Figure 5.
An illustration of a variational auto-encoder (VAE). Each observed omic is encoded to a Gaussian expert ; the product of experts forms the joint posterior , regularized toward the prior by the KL term so the latent captures the joint distribution of the omics. Because the posterior is a product over observed modalities, a missing omic (here methylation) drops out of the product; is inferred from the remaining omics and the generative decoder reconstructs all omics layers, thereby imputing the missing one. The sampled latent thus serves two ends: it is the objective-guided embedding, usable for the downstream objective even when an omics layer is absent, and it drives the decoder to generate the missing layer.
5.5. Transformers
Transformers have become widely used in the context of multi-omics integration due to their ability to model long-range dependencies within and between omic layers. In contrast to CNNs which focus mainly on local relationships in data, Transformers tokenize data and apply self-attention mechanisms to compare each token to others. In complex biological pathways, distant genes in sequential omics interact. Transformers can mimic these interaction across the entire input. Transformers start by tokenizing the input. Tokens can represent individual genes, groups of genes, pathways, genomic regions, etc. Each token is then embedded and combined with positional, task-specific or modality information. These embeddings are then passed through Transformer encoder blocks sequencing multi-head self-attention, normalization layers and feed-forward networks. Multi-head attention allows the model to learn different types of relationships in parallel, such as gene-to-gene interactions, pathway-level dependencies or cross-omics associations.
Self-attention is mainly used to model dependencies within an omic; for instance, in transcriptomics, if the sequence is tokenized by genes, self-attention can learn which genes or pathways influence each other. Cross attention is often used to model the cross-omics dependencies. For example, transcriptomic tokens can act as queries while methylation or CNV tokens act as keys and values. This mechanism allows the model to align information between omics layers and learn how one omics layer contributes to or regulates another. One of the main advantages of Transformers are attention weights that can serve for interpretability. Their magnitude may indicate which features contributed the most to the prediction, revealing biomarkers for the downstream use case. They also show interactions between genes serving to discover new pathways and grouping genes. Their main downfall is the computational cost of total attention where each token must attend to all other tokens. To mitigate this downside, Transformers are often preceded by feature selection or dimensionality reduction techniques. Attention mechanisms can also be guided by prior biological knowledge bases to only allow for modeling known relationships. Figure 6 illustrates within-modality self-attention and cross-modality attention in a Transformer-based integration framework.
Figure 6.
An illustration of a Transformer. Omics features are tokenized and embedded, then processed by L encoder blocks (multi-head self-attention → Add & Norm → FFN); cross-attention integrates modalities and attention pooling yields the objective-guided embedding. (a) In self-attention, queries, keys and values are all projections of the same token set, so the matrix scores every token against every other and reweights the values . (b) In cross-attention, the queries come from one omics layer and the keys/values from another, so the (rectangular) score matrix aligns one omics layer to another. This mechanism serves to model cross dependencies between omics layers. The attention matrix provides weights that can help identify potentially relevant interactions.
Table 2 compares the principal architectural families and their typical requirements, strengths and limitations.
Table 2.
Comparison of the main deep learning architectures used for multi-omics integration.
Each of the commonly used architectures has advantages and limitations. For instance, CNNs are known for their computational efficiency and are often used because they can handle high-dimensional data. Very high-dimensional sequential data can be reshaped into a 2-D shape and treated as images. CNNs also assume that adjacency between features is meaningful and are strong in modeling local relationships. But that can also be a limitation since the order of features can be random and connecting long-distance features that are co-dependent is limited. Variational autoencoders are known for their ability to learn probabilistic distributions of the data rather than deterministic representations. When combined with omics-specific encoders or PoE, they can also be used to handle missing omics layers, but require high amounts of data to learn generalizable distributions. Graph neural networks are capable of modeling prior knowledge and learning similarities between nodes. However, they heavily rely on graph construction and may also miss important relations that are not present in the graph. Transformers are well-established architectures when it comes to representation learning. The concept of attention allows the modeling of long-range relationships and cross-attention is very useful for multimodal learning. Nevertheless, it is computationally expensive and requires high amounts of data.
6. Study Selection Methodology
This work is conducted as a comprehensive narrative review. The literature search was conducted based on the main steps of PRISMA 2020 to make the identification and selection of the studies more transparent. PRISMA is therefore mainly used to describe how the studies were identified and selected, and this work should not be considered as an exhaustive systematic review containing all the studies that may satisfy the inclusion criteria.
A targeted search mainly focusing on the most relevant terms was conducted on PubMed, Scopus and ScienceDirect. The databases were first filtered based on the publication dates, mainly considering works published between 2021 and 2026. The studies were then identified using search terms such as “deep multi-omics integration”, “deep learning multi-omics”, “multi-omics integration”, “multi-omics”, “transcriptomics deep learning”, and “spatial transcriptomics”. The final search was conducted on 12 September 2026. Only studies written in English were considered.
A high emphasis was placed on recent works, mainly from 2025 and 2026, in order to capture the recent tendencies of the field. Earlier works were also retained when they introduced an important architecture or integration strategy that helps show the methodological evolution of deep learning for multi-omics integration.
The resulting papers were first filtered based on their accessibility. From the 909 initially identified records, 317 were accessible, while 592 could not be accessed in sufficient detail. After applying these filters, the retained studies were exported in BibTeX format. Duplicates between the different databases were then removed by merging the exported files and applying a Python 3.12 script to filter similar papers, resulting in 191 unique papers.
The remaining papers were manually filtered in three main steps. First, the titles were checked to remove works that were clearly outside the scope of the review. The abstracts of the remaining papers were then read to further verify their relevance. Finally, the full papers were read to ensure that the proposed works satisfied the defined inclusion criteria. References of the retrieved papers were also checked to identify other relevant works.
The entire screening process was performed by Author K.H. No dedicated screening software was used, and the selection was purely based on manually reading the titles, abstracts and full papers. Since the screening was performed by one author, no disagreement-resolution step was required.
The following criteria were used to guide the selection of the studies:
- IC1—Publication period. Priority was given to studies published in 2025 and 2026. Earlier studies published from 2021 onward were considered when they introduced an important architecture or integration strategy required to display the changes and the methodological evolution of the field;
- IC2—Data modality. The study used molecular omics data through the integration of multiple omics layers, the combination of omics with imaging or clinical information or the analysis of spatial-omics data;
- IC3—Methodology. The proposed framework included a deep learning component, such as an autoencoder, variational autoencoder, convolutional neural network, graph neural network, Transformer, attention-based model, quantum neural network or a hybrid architecture;
- IC4—Application. The study addressed at least one relevant objective, including diagnosis and classification, prognosis and survival prediction, clustering and subtype discovery, biomarker identification, drug response prediction, spatial-omics analysis or missing-modality prediction and imputation;
- IC5—Evaluation. The study provided sufficient methodological details and reported quantitative or biological evaluation of the proposed approach;
- IC6—Comparative evaluation. The study reported the quantitative results of previous works or relevant baseline methods, allowing a direct comparison and a clear demonstration of the contribution and achieved improvements of the proposed approach;
- IC7—Methodological contribution. When multiple works applied the same or a very similar methodological idea and mainly differed in the dataset or application domain, only one representative work was retained to avoid repeating the same idea.
Studies were generally excluded according to the following criteria:
- EC1. Earlier studies that did not contribute an important architecture or integration strategy to the evolution discussed in this review;
- EC2. Studies based only on a single molecular omic without an additional integrated modality, or studies where omics were used only for downstream association analysis;
- EC3. Studies relying exclusively on classical machine-learning or statistical methods without a deep learning component;
- EC4. Studies focusing mainly on the biological aspect;
- EC5. Studies that did not provide sufficient methodological details or evaluation results to properly describe the proposed approach.
The considered works were therefore mainly limited to three integration settings: true multi-omics integration using multiple molecular layers, molecular omics combined with clinical or pathomics/imaging information, and spatial multi-omics integration.
Following the title, abstract and full-paper filtering, 149 studies were not retained from the 191 unique papers. Among them, 63 had more emphasis on the biological aspect, while 44 did not represent a multi-omics or considered multimodal integration setting. The remaining excluded 42 works either did not include a deep learning component or did not report sufficient methodological or evaluation details.
The resulting corpus contained 42 representative studies. Among them, 35 were published in 2025–2026, while 7 earlier works published between 2021 and 2024 were retained to show the methodological evolution of the field.
Since this work is a comprehensive narrative review, there is no guarantee that every existing paper satisfying the broader inclusion criteria is included in the final corpus. The main objective was to provide a representative overview of the main methodological directions while avoiding the repetition of works that apply the same idea on different datasets or application domains. The high number of inaccessible studies and the manual screening by a single author may also introduce some selection bias, which should be considered when interpreting the identified trends.
Figure 7 summarizes the identification, screening and inclusion steps for the 42-study corpus.
Figure 7.
PRISMA-inspired flow diagram of the study-selection process. A total of 909 records were initially identified from the considered databases. After accessibility filtering, 317 records were retained. Removing 126 duplicates resulted in 191 unique papers, which were manually filtered based on their titles, abstracts and full papers. After applying the defined inclusion and exclusion criteria, 149 works were not retained, resulting in a final corpus of 42 representative studies.
7. Applications of Deep Learning for Multi-Omics Integration
In this section, we report the identified studies that were eligible and satisfied the inclusion criteria. The studies are grouped based on their final downstream objective. The main identified use cases are diagnosis and classification, prognosis and survival prediction, clustering and subtype discovery, biomarker identification, drug response prediction and missing-modality prediction.
For each study, we follow the same protocol by presenting the main molecular layers used, the integration strategy, the deep learning architecture and the reported results.
Note: The following task-specific tables present the results reported by the included studies. The reported metrics and results should not be interpreted as a ranking of the proposed methods and architectures, since the datasets and evaluation protocols are study-dependent and differ from one work to another.
7.1. Diagnosis
As a starting point for Transformer-based biomedical classification, [33] introduced a Transformer-based architecture that dedicated specialized Transformer encoders for each of the omics, and with self-attention mechanism, omics embeddings are updated to include intra-information. After extracting the representations, they concatenate them. A final Transformer encoder is utilized with combined embeddings to introduce global attention and modeling inter-dependencies. This approach allows the intra- and inter-omics connections, enabling the representations to capture local and global interactions. The architecture proposed by Dong et al. puts emphasis on the relationships within and between different omics layers, facilitating a more comprehensive understanding of complex biological systems. The model was evaluated over ten independent runs using accuracy, F1-score and outperformed the second-best baseline by 8.3% and 6.0%, respectively.
In contrast to [33], ref. [34] trained a Multi-Omics Transformer (MOT) capable of mitigating missing omics issues. Their model was trained on five sequential omics datasets. They concatenated transcriptomics (mRNA and miRNA), epigenomics (DNA methylation), genomics (CNVs), and proteomics vectors for each of the patients. They also included samples where 1–4 omics were missing in order to improve model robustness to missing values. The MOT model achieved an F1-score of 98.37% on the test set without missing omics layers and a 96.74% F1-score on the test set with missing omics.
Unlike [33,34], ref. [35] proposed DEPLOY (Deep lEarning from histoPathoLOgy and methYlation), a three-branche deep learning model that predicts central nervous system (CNS) tumor types. A direct branch is dedicated to predict cancer type directly from histopathology slides. An indirect branch was utilized to predict DNA methylation beta values and then classify the tumor type based on these inferred methylation profiles. An extra branch uses clinical variables to achieve the same goal. DEPLOY reaches overall accuracy and balanced accuracy on high-confidence predictions, suggesting it can approximate methylation-based diagnostic information from histopathology. Moving from the multimodal histopathology-assisted diagnosis of [35], ref. [36] proposed FESCA, a multimodal framework for breast cancer pathological stage classification. The used dataset integrates two modalities: whole-slide histopathology images (WSIs) and tabular mRNA expression data. The work tries to address the semantic gap between visual and tabular data by proposing a hierarchical alignment approach. FESCA includes three phases, starting with feature extraction and enhancement within each modality, a cross semantic alignment step and a final aligned features classification phase. In the first phase, WSI are cropped into overlapping patches allowing adjacent crops to have shared context. They are then encoded with a ViT pre-trained on ImageNet. To filter non-tumor crops within the slide, multiple instance learning (MIL) is employed. The remaining cancer relevant patches are then embedded and the resulting vectors are averaged to generate the slide level embedding. In the mRNA branch, DESeq2 is used to identify signature genes for each of the three cancer stages allowing a more compact and informative genomic representation. The second phase is a semantic cross modal alignment that projects the embedding into a lower dimension with a bidirectional contrastive learning loss, forcing the same patient pairs to be mapped near each other. The enhanced and aligned embeddings are then passed to a classification head that return the diagnosis class. The obtained results outperforms previous works with an AUC-PR of 82.9%, a precision of 85.6%, a recall of 83.3% and an F1-score of 82.2%.
Ref. [37] proposed MQML-LungSC, a hybrid classical-quantum framework for LUAD/LUSC lung cancer subtype classification using TCGA multi-omics data. The method integrates DNA methylation, RNA-seq, and miRNA-seq data. A classical feature selection pipeline based on t-test p-values, mutual information (MI), Chi-square, PCA, Random Forest, ROC-AUC filtering, and hierarchical clustering is first used to reduce the high-dimensional omics into a 256-feature representation. These features are encoded into a QNN using amplitude encoding, parameterized rotation gates, CZ entanglement, quantum measurement, and a classical dense layer for classification. Encoding data into quantum states introduces useful concepts such as superposition and entanglement, and allows the data to be represented in a Hilbert space whose dimension grows exponentially with the number of qubits. This means that quantum encoding can act like a kernel and map the original data into a high dimensional feature space where separation and classification is easier. QNN-256 achieved 90% testing accuracy, outperforming LR, MLP, and SVM baselines. The QNN weights identified potential biomarkers differentiating LUAD and LUSC.
Unlike the fixed multi-omics integration strategy of [37], ref. [38] proposed an uncertainty-aware dynamic framework for progressive multi-omics classification. Instead of integrating all omics layers from the beginning, the method starts with a single omics layer and estimates the prediction uncertainty using evidential deep learning. Each omic is encoded with an independent MLP, which outputs evidence values converted into Dirichlet parameters to compute class belief and uncertainty. If the uncertainty is high, additional omics layers are progressively introduced and fused at the belief level using Dempster–Shafer theory. The framework was evaluated on ROSMAP, LGG, BRCA, and KIPAN using mRNA, DNA methylation, and miRNA data. The findings of the paper show that many patients received a correct diagnosis using the least required number of omics layers. The practicality of the suggested method lies in reducing unnecessary omics testing and utilizing the available omics layers while maintaining relatively high performance.
In the same disease-classification direction as [38], ref. [39] proposed Epistatic-Quantile Fusion Transformer, a model designed to predict the presence or the absence of Systemic Lupus Erythematosus, an auto-immune disease where the immune system attacks the body’s own tissues. The model consists of three blocks: a data processing block called Beta-VARQA, which uses a VAE to clean, normalize, and denoise the data. The innovation is the usage of an adaptive error function that come with a parameter responsible for controlling sensitivity to outliers and data scale. The second block contains the representation learning model, EQFT, which learns inner and inter relationships between omics layers using self and cross attention. EQFT’s extracted fused representations are then passed to SLE-Net, an end-to-end deep neural network for final SLE classification and biomarker-related prediction. The proposed model achieved high predictive performance: 99.82% accuracy, 99.78% precision, 99.76% recall, 99.77% F1-score, and 99.8% AUC.
Moving from attention-based classifiers to graph-based biological modeling, ref. [40] proposed MoAGNN, a biologically informed hierarchical graph neural network for multi-omics integration for LUAD subtype classification, stage prediction, and survival risk stratification. The framework integrates transcriptomics, genomics, and epigenomics through mRNA, miRNA, DNA methylation, and CNVs. The innovation is that, unlike previous work that builds patient-centered graph models where patients are the nodes, MoAGNN adopts a gene-centric representation where genes are modeled as nodes and gene–gene co-expression relationships are constructed using WGCNA. This approach makes the graph convolution automatically incorporates intra-omics information from adjacent genes. The inter-relationships between the omics layers are guided using prior biological domain knowledge, with miRNA and methylation modeled as negative regulators of gene expression and CNV as a positive contributor. The model integrates graph convolution for learning hierarchical representations, with self-attention graph pooling utilized to learn scores of genes and how they contribute to the final prediction for interpretability reasons. The model was evaluated against baseline models and achieved the highest performance in subtype classification, with an accuracy of 89.1%. Using the self-attention pooling score, the model identified 74 key genes for subtype categorization.
In contrast to the gene-centric graph representation of [40], ref. [41] proposed MOGOLA, a graph-based deep learning framework for multi-omics integration and biomarker discovery. The utilized omics are transcriptomics, through mRNA and miRNA expression, and epigenomics, through DNA methylation. The framework integrates these omics by constructing patient-centric graphs for each of the three datasets using cosine similarity and K-nearest neighbours. The obtained graphs are then passed to an architecture that incorporates GCN and GAT layers to capture intra-relationships within each omics layer. A sigmoid-based gating filter is used to reduce noisy learned representations, while a confidence mechanism is employed to adaptively select informative and reliable omics representations. Cross-omics knowledge is then captured using cross-attention between the three learned representations. The model was evaluated on four datasets and outperformed several baseline methods, including MOGONET, CLCLSA, MMDynamics, and MOSGAT. The authors also attempted to discover influential biomarkers using feature masking and identified genes that were further validated through pathway enrichment.
Unlike the gene-centric and patient-centric graph formulations of [40,41], ref. [42] proposed an interpretable Reactome-guided deep learning framework for multi-omics integration in lung cancer called AttentioFuse. The model employs three encoders for mRNA, CNV, and SNV data to learn a 29-D embedding vector for each omics layer. The contribution lies in guiding which genes each node of the first deep layer is associated with. Only genes related according to the Reactome database are allowed to be connected, allowing genes to contribute only to their biologically annotated pathways. This guidance is achieved using a binary mask. After learning the representations, hierarchical attention, including cross-omics, feature-level, and fusion-layer attention, is used to estimate the contribution of each omics layer and pathway for tumor staging prediction. The model was evaluated on TCGA LUAD and LUSC cohorts for stage classification and compared with several baseline models. AttentioFuse achieved competitive performance for the stage prediction task. For interpretability, the authors combined DeepSHAP with attention weights to generate gene-to-pathway-to-omics explanations, identifying relevant mechanisms.
Following the patient-centric graph strategy of [41], Li et al. [43] proposed MCgnn, a multi view cooperation framework for combining multi-omics layers using graph neural networks. Each of the three omics is treated individually. A patient-centric graph is associated with each of the omics-layers and created using where patients are represented as nodes and edges describe patient similarity. The main contribution lies in the graph construction strategy, where Mahalanobis distance combined with a density-based threshold is used to build more informative and less noisy adjacency matrices. Each omics-specific graph is then passed through stacked graph convolutional layers to learn intra-omics patient representations. An inter-view attention mechanism is used to capture complementary information across omics layers, while a VCDN-based multi-task learning module combines the predictions from different views through a cross-omics tensor for final subtype classification. The model was evaluated on BRCA, LGG, KIPAN and ROSMAP datasets and outperformed most classical machine learning, deep learning and multi-omics GNN baselines. For interpretability, the authors used feature masking to identify important mRNA, DNA methylation and miRNA biomarkers associated with BRCA and LGG.
Unlike the graph-based methods [40,41,43], Yinghua et al. [44] proposed CAEncoder, a contrastive adversarial framework for multi-omics cancer classification. The model concatenates multiple omics layers, depending on the dataset, into one high-dimensional vector. The concatenated representation is then fed into a ViT-based encoder to learn a compact latent representation. The novelty lies in the use of contrastive triplet loss, which pulls instances from similar classes closer to each other in a Euclidean space while pushing dissimilar instances apart. The framework also employs a CycleGAN [45] to map the resulting latent space back to the original omics space. This step ensures that relevant information is preserved and encoded into the compact learned representation. The learned embeddings are then classified using a Random Forest classifier. The model showed high performance on TCGA and ROSMAP datasets, outperforming several baseline models such as MOGONET [46], DeepKEGG [47], HyperTMO [48] and MOCAT [49]. However, the paper does not mention how the 1-D omics vector was patched and tokenized to match the required input shape of a ViT encoder.
Returning to patient-centric graph-based integration, and similarly to [41,43], Wu et al. proposed MOGANet [50], a graph-based deep learning framework for multi-omics cancer classification and biomarker identification. The model integrates mRNA, DNA methylation and miRNA by constructing a patient-similarity graph for each omics layer using Pearson correlation. Each graph is processed by an omics-specific GCN encoder with intra-view attention to learn informative omics-specific representations. The main novelty lies in the Hierarchical Attention-based Fusion Mechanism (HAFM), which uses intra-omics and cross-omics attention to dynamically fuse the different omics predictions before final classification. MOGANet was evaluated on TCGA BRCA, LGG, and KIPAN datasets and outperformed traditional ML and deep learning baselines such as MOGONET [46], DeepKEGG [47], PathCNN [51], Moanna [52] and CustOmics [53]. For interpretability, attention scores were used to rank important biomarkers, followed by enrichment analysis that revealed cancer-related pathways.
In the context of prior knowledge integration, Rehman et al. [54] propose an explainable attention-based framework for chronic myeloid leukemia classification and biomarker discovery. It integrates gene expression with protein sequence embeddings generated using protein language models, mutation-related biological priors, and pathway-level features derived from gene expression. Dedicated encoders are first used to learn the representation of each source, which are then adaptively integrated using an attention mechanism before predicting CML-positive and control samples. The model achieved 98.14% accuracy, 98.14% F1-score, and 99.1% AUC. Explainability using SHAP, Integrated Gradients, and attention attribution further identified relevant biomarkers. Gene expression provided the main patient-level molecular signal, while protein and mutation information were mainly used as biological priors.
Table 3 shows the evaluation settings of the diagnosis and classification studies. Transcriptomics is the most used omic, followed by epigenomics, while graph-based and attention-based models are the most common architectures. Intermediate integration is also dominant, showing that most studies first learn each omic representation separately before integrating them. External validation remains limited.
Table 3.
Evaluation context and quality indicators for the reviewed diagnosis and classification studies.
7.2. Biomarkers Identification
Moving from diagnosis-oriented prediction to biomarker identification, and in order to replace manual scoring of glymphatic function, ref. [55] introduced a deep learning-enhanced Diffusion Tensor Imaging–Analysis along the Perivascular Space (DTI-ALPS) framework to automate the operator-dependent workflow and enable large-scale estimation of a diffusion-derived proxy of glymphatic function, a measure of how the brain clears metabolic waste. They start by preprocessing the images using the FMRIB Software Library (FSL), then they follow a hierarchical approach where a lightweight VGG architecture is employed to detect slices that contain liquid diffusion vessels. The selected slices are then passed to a YOLOv5 to detect the regions of interest, followed by region segmentation and direct computation of the preserved Analysis along the Perivascular Space formula, which serves to compute the DTI-ALPS index, a proxy of how the brain clears waste.
Their pipeline was trained on a dataset of 1000 subjects of Chinese and European participants and deployed across seven cohorts, which produced automated measures for more than individuals. Compared to the manual scoring, which produces low inter-expert agreement (intra-class correlation coefficient 29–), their proposed method achieves strong agreement with expert references (intra-class correlation coefficient on a United Kingdom Biobank test subset) and consistent cross-cohort behavior. Beyond automation, they report a positive correlation between a healthy lifestyle index and the automated score and a negative correlation across multiple central nervous system disorders such as depression and anxiety. They also found that lower DTI-ALPS values predict a higher future risk of Alzheimer’s disease and cerebrovascular outcomes. Finally, they conducted a large genome-wide association study (combined ) where they identified significant genetic variants, estimated single-nucleotide polymorphism heritability using linkage disequilibrium score regression and genome-wide complex trait analysis genome-based restricted maximum likelihood, and extended the analysis with transcriptome-wide and proteome-wide association to propose candidate genes and molecular mechanisms linked to inter-individual variation in this imaging-derived proxy.
Unlike [56], which directly identifies spatial domains, ref. [57] used multi-omics analysis mainly to interpret the histological features learned from H&E whole-slide images. The authors used three cohorts to train a multiple instance learning Transformer GEM-Net. A sparse canonical correlation analysis (SCCA) was then applied to study the relationship between the learned morphological features of WSI images and transcriptomic/proteomic pathways. This analysis showed that the visual patterns captured by the model were associated with biologically meaningful molecular mechanisms, such as cell cycle dysregulation in TP53-mutant tumors and tight junction disruption in FAT1-mutant tumors.
Similarly to [57], ref. [58] combined transcriptomic, proteomic and metabolomic data across molecular layers using a unified gene–protein–metabolite mapping framework. Differential expression and pathway enrichment analyses were performed to identify deep vein thrombosis-related factors and pathways. Multimodal inputs from CT, MRI and ultrasound were used to train a two stage cascaded segmentation model but since the omics and imaging data come from different cohorts, no patient-level imaging–omics correlation was performed. Rather, the identified molecular pathways are compared with the attention patterns highlighted by the imaging model in anatomically high-risk thrombotic regions. The analysis led to identifying molecular biomarkers and inflammation-related pathways.
Table 4 summarizes the biomarker identification studies. Imaging is common in the three studies and is combined with molecular information for biological interpretation. The molecular layers are mainly used to explain or validate the patterns identified by the predictive models.
Table 4.
Evaluation context and quality indicators for the reviewed biomarker identification and biological interpretation studies.
7.3. Prognosis
Moving from biomarker identification to clinical outcome prediction, [59] proposed a multimodal fusion framework (MMF) that integrates whole-slide histopathology images and copy-number variation (CNV) and RNA-seq expression to improve pan-cancer prognosis prediction across 14 TCGA cancer types. Their architecture contains two branches, one that learns representations from WSI images. They split each slide into patches, then a pre-trained ResNet-50 encoder turns each of them into a 1024-dim vector. The produced embeddings are then concatenated to form an matrix per patient. Another branch is dedicated to molecular profiles of patients with a self-normalizing network (SNN) that encodes mutation status, copy-number variation and RNA-seq expression. They also utilize a Kronecker-product fusion layer that explicitly models pairwise interactions between image and omics features. Trained in a weakly supervised survival setting on 6592 WSIs from 5720 patients with 5-fold cross-validation, MMF consistently outperforms unimodal histology-only and genomics-only baselines in terms of C-index and survival AUC for 12 out of 14 cancer types. In contrast to the histology–omics fusion of [59], ref. [60] proposes a Stacked Supervised Auto-Encoder (SSAE) for hepatocellular carcinoma (HCC) prognosis. They stack multiple autoencoders and at the level of the bottleneck of each of them, they add a separate regression node that predicts the prognosis index using a Cox proportional hazards (survival) model. The data includes transcriptomics (miRNA, mRNA) and epigenomics (DNA methylation). During training, the prognosis node’s gradient backpropagates in the encoder so that the latent vector not only contains information for the subsequent reconstruction task but also for the prognosis index prediction. Using TCGA-LIHC (405 samples), the authors compare early integration, where they concatenate omics before input against intermediate integration, where separate branches learn each omic embedding then concatenates these representations. They show that intermediate integration clearly performs best, achieving a concordance index of 0.969 (vs. 0.663 for early integration), a Brier score of 0.077 and strong risk-group separation (log-rank ), while also identifying possible prognostic biomarkers such as FBXW10 and TRIP13.
Unlike the purely omics-based prognosis model in [60], ref. [61] introduced M3Surv, a multimodal survival prediction framework that predicts the prognosis of a patient by jointly modeling two types of pathology images: fresh frozen (FF) and formalin-fixed paraffin-embedded (FFPE) and genetic layers such as transcriptomics, genomics, and proteomics. Initially, the whole slide images (WSI) are tiled into patches, where FFPE is randomly sampled to patches for efficiency (FF slides are smaller and can be processed more fully). Each patch is encoded using a pre-trained CNN, such as ResNet 50 into a fixed dimension embedding . Their spatial coordinates are also preserved for the subsequent hypergraph learning approach that captures both intra-slide higher-order cellular structures and inter-slide relationships. For the intra-slide feature learning, topological graphs that weight the connection between nodes based on their Euclidean distance (closer nodes have more weight on their connections) and structural graphs that emphasize edges between similar patches. Inter-slide hypergraph links FF and FFPE patches to capture patient-level consistency, with adaptive weighting to balance slide contributions. To introduce mutual consensus, a cross-attention alignment step is employed to produce a unified pathology representation .
On the omics side, they build by embedding genomics as six functional gene groups, transcriptomics as 331 curated pathways, and proteomics as the top 100 proteins encoded with ESM sequence embeddings combined with expression values.
Pathology images and omics information are fused via mutual cross-attention. To predict the survival rate, a feed-forward network is trained on the concatenated omics and pathology embeddings with a survival negative log-likelihood objective.
To address the issue of missing modalities during inference, M3Surv introduces a prototype-based memory bank (K-means centroids with momentum updates) that imputes missing modalities via similarity-weighted prototype retrieval, allowing the replacement of missing omics with a combination of the closest top k saved embeddings. For instance, if a patient is missing pathology, omics embeddings will be utilized to retrieve the most similar pairs in the knowledge bank to impute the missing modality.
Experiments on five TCGA cohorts and an in-house liver cohort report improved C-index (about ∼2.2% gain over advanced baselines) and stable performance under diverse missing-modality scenarios.
Similarly to [61], ref. [62] introduced MCAT, a multimodal framework for cancer survival prediction from paired whole-slide histopathology images (WSIs) and genomic data. WSIs are tiled into non-overlapping tissue patches and encoded with a ResNet-50 backbone. The genomic data are grouped into six biological functional categories and embedded separately. The main contribution of this work is a genomic guided WSI patches embeddings. A co-attention matrix is first calculated by using the genomic categories embeddings as queries and patches embeddings as keys and values. The resulting matrix is used to compute the reweighted pathology features resulting in a genomic guided pathology embeddings. These pathology and genomic embeddings are then processed by separate set-based Transformers, pooled, concatenated, and used for final survival risk prediction. Evaluated on five TCGA cohorts using 5-fold cross-validation, MCAT outperforms unimodal and late-fusion multimodal baselines while also providing interpretable co-attention heatmaps. The issue with this approach is that patch embedding attend independently to the genomic groups embeddings and vice versa leading to a potential collapse of the attention into the same genomic group or the same patch.
Building directly on the WSI–genomic survival setting of [62], ref. [63] introduced MOTCat, a multimodal framework for cancer survival prediction from paired whole-slide histopathology images (WSIs) and genomic data. The WSI is represented as a bag of tissue crops which are patched into non overlapping patches. Tissues are then detected using Otsu’s threshold which is a simple filter that remove empty slide background. Following this, the filtered patches are encoded using a ResNet-50 backbone. The genomic data are organized into six predefined biological functional groups and encoded separately. The main contribution of the work is an optimal transport (OT)-based co-attention module that computes a global matching flow between pathology patches and genomic-group embeddings. This is achieved by computing a cost matrix that represent distance between the biological functional categories and the pathology patches embeddings. OT-based co-attention is applied to derive a global matching flow that identifies the pathology regions most consistent with the genomic structure. The learned global matching matrix is used to guide the new embeddings of the pathology patches, making them more consistent with the functional genomic categories. The two modalities embeddings are then fed into two separate Transformers to calculate the modality level embedding before concatenating them for final survival risk prediction. The model is evaluated on five TCGA datasets: BLCA, BRCA, UCEC, GBMLGG, and LUAD, using 5-fold cross-validation and the C-index. MOTCat is compared against unimodal baselines and multimodal methods such as MCAT. The results show that MOTCat outperforms MCAT on all five datasets, achieving 68.3%, 67.3%, 67.5%, 84.9%, and 67.0% C-indexes on BLCA, BRCA, UCEC, GBMLGG, and LUAD, respectively.
Similarly to [62,63], ref. [64] introduced SURVPATH, a multimodal framework for cancer survival prediction from whole-slide histopathology images (WSIs) and transcriptomics. A similar approach was followed for the pathology images where WSIs were first segmented to remove background, tiled into non-overlapping patches, and encoded with a self-supervised Swin Transformer.
On the transcriptomic side, genes were first grouped into 331 biological pathways from Reactome and MSigDB Hallmarks, then encoded with a sparse pathway-aware MLP to obtain pathway tokens. The main contribution of this work is a memory-efficient multimodal Transformer that performs early fusion by modeling pathway-to-pathway, pathway-to-patch, and patch-to-pathway interactions, while ignoring patch-to-patch attention to reduce memory cost. The pathway-to-pathway and pathway-to-patch resulting attention matrices are combined by block-concatenation inside the same multimodal attention while a separate block integrate patch-to-pathway interactions. The resulting embeddings are averaged along pathways and patches to obtain the instance level embedding. Following this, they are concatenated and used for disease-specific survival prediction. Evaluated on five TCGA cohorts using 5-fold cross-validation, SURVPATH outperforms unimodal and multimodal baselines including MCAT and MOTCat.
In contrast to the WSI–omics fusion strategies in [62,63,64], ref. [65] proposed MOFRCDLANet, an attention-based multi-omics integration framework. MOFRCDLANet utilizes Pearson correlation for ordering features based on a cumulative correlation score with other columns. Then it employs self-attention within omics layers. Maximum Mean Discrepancy is then applied to reduce distribution mismatch between omics types; instances with similar prediction outcomes are further aligned using contrastive regularization. Cox-based feature selection and XGBoost are then used for the classification of cancer subtype and recurrence prediction. The model was evaluated on ten TCGA cancer datasets and an external CLL cohort, achieving strong predictive performance and identifying biologically relevant biomarkers through GO and KEGG enrichment analysis.
Unlike the recurrence-oriented classification of [65], and to investigate the survival chances of patients, [66] proposed CoFormerSurv, a collaborative Transformer framework for multi-omics survival analysis. In their approach, they associate two modules for two tasks: an inter-omics Transformer, which captures high-order interactions between different omics layers using multi-head self-attention, and a second Transformer is associated with an inter-sample similarity graph constructed using patients’ gene similarities to model neighbourhood relationships among patients. The learned representations are then used in a Cox proportional hazards model for survival prediction. The model was evaluated on multiple TCGA cancer cohorts and PCAWG datasets and achieved superior C-index and AUC values compared with existing single-omics and multi-omics survival models. An ablation study was then conducted to evaluate the contribution of each of the two modules to the predicted outcome. The authors also performed feature analysis and identified survival-associated genes in breast cancer, suggesting potential interpretability for biomarker discovery.
Unlike [66], Qin et al. [67] proposed QTMPN, a quantum-Transformer multimodal framework for bladder cancer survival prediction using TCGA-BLCA. The model integrates clinical/EHR data, WSI pathology images and multi-omics genomic data including mutation, DNA methylation, RNA-Seq and miRNA. Tabular features are normalized and relevant variables are selected. WSI images are split into 1000 patches, each encoded with ResNet-101 into a 1-D 1000-feature vector. The resulting features are then passed through a 16-qubit quantum circuit that produces 16 features per patch. Each WSI is then embedded into a 1000-feature vector. The resulting clinical, omics and pathology representations are fused using the TCF module, where multi-head attention generates patient-to-patient weights used to build an adaptive graph for GNN-based alive/dead prediction. QTMPN achieved 76.1% accuracy and outperformed baselines such as CMTA and PARADIGM. However, the task is closer to binary survival-status classification than true time-to-event survival analysis. Also, there is ambiguity regarding how the 1000-feature vector is passed to a 16-qubit circuit that employs angle encoding, which is known for associating one feature per qubit. The output of the circuit using Pauli-Z measurement is supposed to be a 16-feature vector, meaning 16,000 features per WSI. The passage to a 1000-feature vector per WSI is therefore not clear. The quantum feature encoding is also unclear, as later in the article they state using amplitude encoding. The graph also appears dense since all patients are connected even with weak attention weights, making even opposite-class instances influence an instance representation when graph convolution is employed. The model is validated only on TCGA-BLCA without an external cohort.
Table 5 shows the evaluation settings of the prognosis studies. Pathomics is the most used modality, followed by transcriptomics and genomics. Transformer and attention-based models are also frequently used, mainly to learn interactions between WSI and molecular representations. Interestingly, all the reviewed studies use intermediate integration.
Table 5.
Evaluation context and quality indicators for the reviewed prognosis and survival studies.
7.4. Drug Response Prediction
Drug response prediction is among the main use cases of integrative multi-omics. Rather than applying similar treatment regimens and dosages to all patients, drug response prediction aims to personalize therapeutic prescriptions based on the specific molecular profiles of individual patients.
Starting with Zhang et al. [68], they propose GraphTCDR, a heterogeneous graph Transformer framework for cancer drug response prediction. It integrates drug molecular fingerprints with gene expression, CNV, and miRNA. These molecular profiles are first compressed with an autoencoder. DNA methylation was used as biological prior knowledge by constructing a cell-line similarity network. Heterogeneous graphs are built connecting cell-to-cell, drug-to-drug, and cell-to-drug profiles. The cell-to-cell and drug-to-drug graphs are built based on correlation similarity, while the cell-to-drug graph is built using known drug responses from the IC50 matrix which refers to the minimum drug concentration required to inhibit cellular activity. Multi-head attention is subsequently used to predict the IC50 values.
Evaluated on the PRISM drug-repurposing dataset [69], GraphTCDR achieved an RMSE of 0.097, PCC of 0.911, SCC of 0.885, and of 0.829 [68]. Ablation analysis further indicated gene expression as the most influential omics layer. Gradient-based saliency is used to identify cancer-related genes contributing to model predictions [68].
Similarly, Gudadhe et al. [70] proposed HyDRP-LG, an interpretable hybrid deep learning framework for cancer drug response prediction that integrates drug representations with multi-omics profiles. Drug molecular structures represented as SMILES strings were encoded using Word2Vec, while gene expression, mutation, and DNA methylation data from the GDSC and CCLE datasets [24,71] were used to characterize cancer cell lines. To address the high dimensionality of transcriptomic data, gene expression features were reduced from 17,736 to 500 components using PCA. The resulting drug and multi-omics features were integrated and processed through a hybrid Bi-LSTM–GRU architecture to predict normalized IC50 values. The integration of all three omics achieved the best performance, with an RMSE of 0.0584, of 0.7886, Pearson correlation of 88.81%, and Spearman correlation of 84.68%. In addition, SHAP-based interpretability identified several genes associated with drug response followed by KEGG pathway enrichment analysis to provide biological interpretation of the predictions.
Other works utilize prior knowledge. For instance, Mandal and Bandyopadhyay propose BKDRP, a biological knowledge-driven deep learning framework for cancer drug response prediction [72]. It integrates gene expression, CNV, mutation and protein expression from the GDSC dataset [71] together with molecular fingerprints of the drugs. The main contribution lies in the integration scheme of the different omics layers. Instead of concatenating the values into a large vector and then passing it to an FCN, they hierarchically integrate the different omics, each following the biological stages from genes to proteins, pathways and drugs. The resulting network connections are obtained from STRING protein interactions [31] and KEGG pathways [29].
The drug fingerprints are subsequently concatenated with the learned drug representation to predict whether a cell line is sensitive or resistant to a given drug. BKDRP was evaluated under unknown drug–cell line pairs, unseen drugs, unseen cell lines and unseen cancer types, achieving its best generalization across cancer types with an AUC of 88.45% and AUC-PR of 80.28%. The biological interpretation further identified known LUAD biomarkers, demonstrating the interpretability of the framework [72].
In the same context, Alpsoy and Sezerman [73] propose a DNN-based transfer learning framework for cancer drug response prediction. It integrates gene expression, somatic mutation and CNA from GDSC. Using dedicated autoencoders, they compress the layer representations. The resulting embeddings of the omics are then concatenated using three settings: expression + mutation, expression + CNA and expression + mutation + CNA. Drugs targeting the same pathway are grouped into pan-drug models, which are then transferred to PDX and TCGA datasets. The models outperformed MOLI [74], while further analysis identified several biological processes potentially associated with resistance to paclitaxel and 5-FU. Interestingly, the full EMC combination was not always the best, showing that adding more omics does not necessarily improve performance.
On the same context of prior biological knowledge, Wu et al. [75] propose PASO, a pathway-based deep learning framework for anticancer drug response prediction. It integrates gene expression, CNV and mutation data from CCLE [24] together with the SMILES representation of the drugs. Instead of directly using gene-level values, each omics layer is converted into 619 KEGG_MEDICUS pathway-level difference features. This is achieved by calculating how each pathway differs from the remaining genes within each molecular profile. Instead of representing instances by molecular abundance alone, they are represented by the abnormality and alterations of pathways.
The resulting 619 pathway features from each omics layer are then integrated with drug representations extracted using multi-scale CNNs and a Transformer encoder. An attention mechanism learns the interactions between the omics and drug features before predicting LN IC50, achieving a PCC of 94.25% and of 88.38% on GDSC2 [71], while also highlighting relevant cancer pathways and drug structures.
On the synergy of multiple drugs, Wang et al. [76] propose MCMTSYN, a cross-modal multi-task learning framework for anticancer drug synergy prediction. It integrates gene expression, gene mutation and copy number profiles of cancer cell lines together with fingerprints and molecular descriptors of the drugs. Autoencoders are first used to compress the high-dimensional cell-line and drug representations, after which cross-attention captures interactions between each drug and the molecular profile of the cell line. The resulting representations are jointly optimized using four tasks involving synergy and drug sensitivity prediction in both regression and classification settings. MCMTSYN achieved an MSE of 218.20, PCC of 76% and AUC of 91%. The multi-omics analysis showed that the full-layer setting integrating expression, mutation and copy number produced the best overall performance, with gene expression remaining the most informative individual omic.
Table 6 summarizes the drug response studies. Transcriptomics and genomics are the most used omics, mainly due to their availability together with drug response data in datasets such as GDSC, CCLE, and PRISM. Intermediate integration is the most common strategy, while only a few studies evaluate their models on patient-level external cohorts.
Table 6.
Evaluation context and quality indicators for the reviewed drug response and treatment prediction studies.
7.5. Clustering
Moving from supervised prognosis prediction to unsupervised multi-omics subtyping, ref. [77] proposed a model that classifies instances into 12 cancer types, and they named their model ProgCAE. For each of the patients, it takes RNA-seq, DNA methylation, CNV and miRNA. Each of the omics is first filtered using their standard deviation and normalized using min–max normalization. Before passing the preprocessed omics to the model, they reordered features using Pearson correlation, then fed them into a dedicated 1-D convolutional autoencoder whose 30-dimensional latent representation captures compact, omics-specific structure. These latent vectors are concatenated into a shared multi-omics feature vector, where Cox proportional hazards models are applied feature-wise to retain only survival-associated factors (). As labels are missing, the authors utilize K-means clustering on these features. They discover 2–3 prognostic subgroups per cancer, which show significantly different Kaplan–Meier survival curves. The resulting cluster IDs serve as “survival subtype” labels. The new data where labels are cluster IDs are then fed to an SVM classifier for subtype prediction from the selected features. Across several cohorts, ProgCAE consistently gives better C-index and log-rank p-values than competing methods.
Similarly to [77], ref. [78] introduced Subtype-DCC, an unsupervised deep clustering framework that discovers cancer subtypes directly from multi-omics data. For each patient, they concatenate copy number alterations, mRNA, miRNA and DNA methylation into a single feature vector, which is then passed through a shared MLP encoder to obtain a compact latent representation. On top of this encoder, they attach two projection heads: an instance-level contrastive head that brings augmented omics layers of the same patient closer while pushing different patients apart using a decoupled contrastive loss, and a cluster-level contrastive head that operates on soft cluster assignment vectors to explicitly encourage well-separated and confident clusters. Both heads are trained jointly so that the embedding space becomes both instance-discriminative and cluster-friendly, and final subtypes are obtained simply by taking the over the cluster head outputs. The resulting clusters show significantly different survival curves and stronger enrichment of clinical variables compared to existing multi-omics clustering approaches such as SNF, iCluster, NEMO and Subtype-GAN, highlighting the benefit of contrastive learning for cancer subtype discovery.
Unlike the fully unsupervised subtype-discovery framework of [78], ref. [79] introduced SSD-MO, a semi-supervised deep non-negative matrix factorization (Deep NMF) framework for multi-omics integration and patient subtyping.
For each omics view v, SSD-MO learns a deep factorization of into view-specific latent factors and a top-layer sample embedding . To enforce cross-omics consensus, they aggregate the per-view embeddings by averaging , yielding a unified multi-omics representation. To make the latent space cluster-discriminative, SSD-MO leverages partially labeled samples through a semi-supervised reshaping loss that aligns labeled instances with their ground-truth subtypes within each view. This guides the embeddings to partially match the subtype structure while still exploiting unlabeled data. They further introduce an optimal manifold constraint to keep the embeddings biologically consistent by preserving shared neighbourhood geometry from the original space in the latent space. In addition, a diversity regularization term is used to maintain complementarity across omics layers and prevent different embeddings from collapsing to the same factors. Overall, SSD-MO improves multi-omics clustering on TCGA-style benchmarks, reporting F-score gains of 9– over unsupervised baselines and 7– over semi-supervised benchmarks.
In contrast to the semi-supervised formulation of [79], to detect cancer subtypes, [80] suggest a deep learning based framework they name CA-CAE. The omics genes are first selected using high variance threshold. The selected feature vectors are reshaped into 2-D matrices. The model learns representations for mRNA, miRNA and DNA methylation matrices by employing convolutional autoencoders enhanced with channel attention. Survival-related latent features are then selected using LASSO and Cox proportional hazards analysis and combined for K-means clustering to identify prognostic cancer subtypes. The suggested approach was applied on 15 TCGA cancer datasets and showed significant survival stratification across multiple cancer types, outperforming ProgCAE, DeepProg, PCA, and NMF in several settings. The authors further validated the biological relevance of the identified subtypes through clinical association analysis, WGD association, LUAD biomarker ranking, GO/KEGG enrichment, and external CPTAC proteogenomic validation.
Moving from patient-level cancer subtyping to spatial-domain clustering, ref. [56] introduced SpaMICS, an unsupervised framework for spatial domain identification from spatial multi-omics data. For each omic, the method employs two graphs: a spatial graph that models neighbouring spots and a feature graph that captures biological feature similarity. The spatial graph is further refined using the feature graph to better preserve biologically meaningful local structure. Following this, SpaMICS employs dual GCN encoders followed by an adaptive weighted fusion to learn omic-specific high-level representations. The main contribution of the work is a consistent-and-specific deep subspace learning module that decomposes these representations into a shared low-rank self-expression matrix capturing cross-omics consistent information and omic-specific self-expression matrices capturing complementary signals, further enhanced by a discriminative constraint to reduce redundancy across modalities. Evaluated on five real-world datasets covering eight tissue sections and including both RNA-ADT and RNA-ATAC data, SpaMICS outperforms existing spatial transcriptomics, single-cell multi-omics, and spatial multi-omics baselines, showing more accurate and biologically interpretable spatial domain identification.
Moving toward spatial multi-omics integration, Han et al. [81] propose SpaMOCA, a deep learning framework for spatial multi-omics integration and spatial domain clustering. It integrates RNA with protein or ATAC data together with the spatial coordinates of the cells. The different omics are first encoded using dedicated GCNs based on a KNN spatial graph. A local cross-attention mechanism is then used to capture the interactions between the omics while restricting the attention to spatially neighbouring cells. The resulting representations are dynamically fused by assigning different weights to each omic depending on its local relevance. Contrastive learning with hard negative samples and spatial regularization are further used to better separate similar cell populations while preserving the tissue structure. SpaMOCA outperformed several existing integration methods, achieving an adjusted Rand index of 86% and normalized mutual information of 87% on the simulated STARmap dataset, while also identifying biologically meaningful spatial domains in real RNA–protein and RNA–ATAC datasets.
Table 7 shows the evaluation settings of the clustering studies. Transcriptomics and epigenomics are the most used omics, while autoencoders and graph-based models are commonly used to learn shared representations. Intermediate integration remains the dominant approach.
Table 7.
Evaluation context and quality indicators for the reviewed clustering and subtyping studies.
7.6. Missing-Omics Imputation
Moving from subtype discovery to omic-layer prediction and imputation, ref. [82] introduced PH2ST, a prompt-guided framework for predicting spatial transcriptomics from H&E whole-slide images. Unlike previous methods that predict spatial transcriptomics directly from WSIs alone, ref. [82] argue that the heterogeneous morphology-gene relationship and inter-slide variability make this task particularly challenging. They therefore introduce a prompt-guided setting in which a small subset of spots with known spatial transcriptomics is used to guide the prediction of gene expression in the remaining regions of the same WSI. Each slide is represented by spot-centered image patches and their surrounding neighbourhoods, encoded with a pre-trained encoder backbone. The main contribution of this work is a dual-scale hypergraph architecture that models both global spot-level and local neighbourhood-level tissue relationships, followed by a cross-attention module that uses the ST prompts to guide histology embeddings for final gene expression prediction. Evaluated on HER2+ breast cancer and cSCC datasets, PH2ST outperforms prior ST prediction methods and shows potential for missing-spot imputation, super-resolution, and local-to-global ST prediction.
Unlike [82], which predicts unmeasured spatial transcriptomics from histology, ref. [83] proposed CLUE (Cross-Linked Unified Embedding), a semi-supervised multimodal VAE framework designed to integrate incomplete single-cell multi-omics data. Instead of using a single encoder per modality that maps everything into one shared latent space, they define a matrix of encoders where diagonal encoders () are the intra-encoders that map an omic into the corresponding modality, and cross encoders elsewhere () that learn inter-dependencies between omics, meaning that specialized encoders are trained to encode an omic data into another omic latent space. To achieve that, their loss combines four parts. An MSE is computed between the sample data and the reconstruction from the decoder. A KL-divergence is utilized to force the model to learn the probability distribution over the latent space of data. For the cross-representation learning they add two other parts. One is an MSE computed between latent spaces of all the modalities generated by one omic; the intuition for that is that if different omics are inferred to generate the total latent space of the sample, they should be “close” to each other. To put more emphasis on the similarity of the learned representations, they employ an adversarial loss where a discriminator is trained to tell which data modality a latent representation z is inferred from. The encoders are trained adversarially to fool the discriminator so that it pushes the latent space learned from different omics to be aligned. The final latent representation of a sample is computed using the average of the cross-encoders embeddings. Evaluated on the NeurIPS 2021 multimodal single-cell integration challenge datasets (RNA + ATAC and RNA + protein), CLUE achieves better cell matching scores than competing methods.
Similarly to [83], ref. [84] introduced DeepIMV, a deep variational information bottleneck framework designed to integrate incomplete multi-omics data where each omic is treated as a separate “view”. For each view (e.g., mRNA, DNA methylation, miRNA, RPPA), a view-specific encoder maps the input into a Gaussian latent representation, and a corresponding view-specific predictor tries to predict the label from this marginal latent space. To mitigate the issue of missing omics, they employ the product-of-experts technique. It multiplies the individual Gaussians called marginal posteriors into a joint posterior. This is written as:
where is the set of observed views and denotes their collection. This formulation naturally ignores missing views (their term is simply absent in the product) and yields a sharper, task-focused joint representation. A final multi-view predictor then operates on this joint latent space to produce a label prediction from the joint distribution.
To optimize the encoders, they utilize the information bottleneck loss that combines two components: a cross-entropy loss to maximize prediction accuracy, and a KL-divergence loss to force the latent distribution to only keep essential information and drop raw input information. A typical IB-style objective can be written as:
Their proposed architecture showed flexibility when handling arbitrary view-missing patterns during training and testing. It was experimented with on TCGA (four omics) and CCLE (six omics) and the results show that DeepIMV consistently benefits from integrating more omics layers and remains robust when the proportion of samples with missing omics increases.
Extending the missing-view direction of [84], ref. [85] proposed MultiGrate, an unsupervised generative framework for single-cell multi-omics integration that focuses on learning a shared latent space for RNA, ATAC and protein while handling missing modalities. Similarly to [84], MultiGrate learns individual posteriors from each omics and combines the joint distribution utilizing the product-of-experts, which naturally ignores missing omics layers:
In contrast to [84], MultiGrate tackles two problems. As multiple studies use different technologies and metrics, the same cell types from different datasets tend to live in different regions of the latent space. Most multi-omics datasets suffer from samples missing one or multiple omics. To address these issues, MultiGrate tries to generate missing modalities from the available omics and to correct the batch shift and align technologies and studies in a common space.
They employ decoders that try to reconstruct missing omics from the available latent view. This allows to map existing and new datasets with missing omics into a multimodal space with all the specified omics in the study. They also consider the issue with RNA-seq where the distribution tends to be over-dispersed and not well modeled with Gaussian or Poisson distributions. Therefore, they employ a Negative Binomial (NB) likelihood to capture the over-dispersed count nature of gene expression, for example:
where is the gene-wise mean predicted from the latent vector and is a dispersion parameter.
On top of the standard VAE reconstruction and KL-divergence terms, they add a Maximum Mean Discrepancy (MMD) loss between latent distributions of different datasets to correct batch effects and align studies in a common space:
with ϕ induced by an RBF kernel.
Table 8 summarizes the omics imputation studies. Transcriptomics is used in all the reviewed works, while autoencoder-based models are the most common architectures. All the studies use intermediate integration, which allows the model to learn a shared representation of the available omics before predicting the missing modality. External validation remains absent in this group.
Table 8.
Evaluation context and quality indicators for the reviewed omics imputation and cross-modal prediction studies.
8. Overview of the Reviewed Studies
This section provides an overview of the included studies, highlighting the main omics layers and complementary modalities, integration strategies, deep learning architectures, and downstream applications.
Reported performance values are study-specific and should not be interpreted as a direct ranking of techniques or methods. The included studies address different downstream objectives and use different datasets, validation settings, and evaluation metrics.
The quantitative distributions in Figure 8 reflect only the targeted, non-exhaustive corpus of 42 representative studies included in this review and should not be interpreted as prevalence estimates for the entire literature.
Figure 8.
Overview of the reviewed studies according to the adopted omics and modalities, integration strategies, applications, and deep learning architecture families. (a) Distribution of the omics and modalities used across the reviewed studies. Counts are non-exclusive since a study may integrate several modalities. (b) Distribution of the integration strategies used across the reviewed studies. (c) Distribution of the main applications addressed by the reviewed studies. (d) Distribution of the main architecture families. Counts are non-exclusive and reflect the main components of the proposed frameworks.
Figure 8 summarizes the main characteristics of the reviewed studies. Figure 8a shows that transcriptomics is the most represented omics layer, appearing in 33 studies, followed by epigenomics (20), genomics (18), proteomics (12) and pathomics/imaging (12). Gene expression remains the main molecular source used for multi-omics integration, while omics such as metabolomics are less explored. This does not necessarily mean that gene expression is more informative, but may reflect its wider availability in accessible cohorts.
Regarding integration strategies, Figure 8b shows that intermediate integration is the most represented with 30 studies, compared with 6 using early, 5 using late and 1 using hybrid integration. This suggests a tendency toward learning objective-guided representations for each omics layer before integrating them. For applications, Figure 8c shows that diagnosis and classification are the most represented use case, followed by prognosis and survival, while clustering and drug response prediction are also frequently studied. One possible interpretation is the wider availability of diagnosis labels in datasets, while ground-truth labels for other use cases are less abundant. Finally, Figure 8d shows that attention and Transformer-based architectures are the most represented family in the reviewed corpus with 26 studies, followed by graph-based models (11), autoencoders/VAEs (9) and CNNs (7). This tendency shows the increasing use of architectures that can learn dependencies both within each omics layer and across modalities. Table 9 summarizes the included studies by downstream objective, input data, approach and reported outcome.
Table 9.
Summary of the reviewed deep-learning and multi-omics studies grouped by downstream objective.
Figure 9 organizes the reviewed approaches by input modality, integration strategy, cross-omics representation, architectural family and downstream use case.
Figure 9.
Taxonomy of deep learning for multi-omics integration.
9. Discussion and Challenges
9.1. Data Availability, Missing Modalities, and Clinical Generalizability
Considering recent work on the integration of multi-omics layers for medical downstream objectives, several important trends appear to be emerging. Earlier studies frequently attempted to mitigate the problem of missing modalities during inference. Their standpoint was that, although a model may be trained using multiple molecular omics layers, some of these views may be unavailable for new patients, making the model difficult to apply in practice [84,85].
One of the main techniques used to address this problem is the product of experts (PoE). In this approach, modality-specific latent distributions, also called Gaussian experts, are learned using dedicated encoders or variational autoencoders and multiplied to obtain a joint posterior distribution [1,84]. This relies on the mathematical property that the normalized product of Gaussian probability densities is also Gaussian. Consequently, when one modality is missing, the model can still approximate a joint posterior using the available experts. This makes PoE-based models more flexible and practical during inference. When combined with modality-specific decoders, the joint latent representation can also be used to reconstruct or generate missing omics layers from the available ones [85].
However, the main limitation lies in accurately learning these modality-specific distributions. Because multi-omics datasets generally contain a limited number of samples, it can be difficult for VAEs to learn latent distributions that generalize well to unseen patients. The same property that makes PoE attractive can therefore become a limitation. In particular, because Gaussian experts are combined according to their precision, an inaccurate but overconfident expert can strongly influence the joint posterior and degrade the resulting representation.
This leads to one of the major challenges in deep learning applications for multi-omics integration: the limited number of available samples. Deep learning models generally require sufficient data to estimate their parameters and avoid overfitting. To mitigate this problem, several studies reduce the number of trainable parameters, constrain their architectures, or perform dimensionality reduction before integration [49,53,77,86]. However, excessively reducing model capacity can also limit predictive performance.
This problem is directly related to data availability. As the number of integrated omics modalities increases, the number of patients for whom all measurements are available usually decreases, often forcing researchers to reduce the number of modalities included in their analyses. Patients with complete measurements across several omics layers remain relatively rare. Large-scale initiatives such as TCGA and CPTAC have considerably increased the availability of genomic, transcriptomic, proteomic, and clinical measurements [19,20,21]. Nevertheless, obtaining sufficiently large cohorts with complete and consistently measured multi-omics profiles remains difficult. Future studies may benefit from the continued development and harmonization of such resources, although missingness, cohort heterogeneity, batch effects, and measurement costs will likely remain important challenges.
One of the long-term objectives of multi-omics integration and analysis studies is to include the proposed solutions in daily medical routines. However, this goal encounters multiple challenges. One of the major obstacles is the generalizability and fairness of the obtained results on routine clinical data.
Available studies rely on publicly available large cohorts such as TCGA. These sources provide valuable molecular profiles but do not necessarily represent patients encountered in routine clinical practice. Differences in ethnicity, age distribution, disease stage, treatment history and sample collection can introduce important population biases. Another issue comes from batch effects, where different sequencing technologies, profiling platforms and experimental protocols can produce systematic differences in the obtained molecular profiles. Models may therefore achieve high performance on TCGA while showing lower performance when applied to real clinical cohorts [87].
Another obstacle for generalizability is the absence of omics during inference. The majority of the studies include multiple layers during the training of their models that are not necessarily available in clinical routines. Some studies try to overcome this issue by randomly masking modalities during training, producing omics similarity banks or imputing missing omics, but these strategies remain largely untested in real-world scenarios.
An important consideration for the generalizability of missing omics imputation frameworks is the mechanism behind the missing modalities. Missing completely at random (MCAR) assumes that the absence of a modality is independent of the patient characteristics and the available data. Missing at random (MAR) means that the missingness can depend on observed information, while missing not at random (MNAR) means that the absence itself can depend on unobserved information or on the missing modality. In clinical practice, missing modalities are not necessarily random. This is because the measured molecular profiles can depend closely on the disease diagnosis, severity, treatment, patient characteristics and the clinical workflow.
Therefore, randomly masking modalities during training mainly simulates an MCAR setting and may not simulate real clinical missingness scenarios. A model that performs well when modalities are randomly removed may not necessarily perform similarly when the missingness is rooted in an underlying clinical pattern. Similarity bank approaches also assume that patients with similar available omics will have similar missing molecular profiles. This is not necessarily true due to the complex nature of biological behaviours. Generative approaches are also affected by the small size of cohorts containing complete multi-omics measurements, which can limit their ability to generalize to particular or underrepresented cases.
This issue also raises fairness concerns since underrepresented patient groups may receive less reliable predictions because they are less represented in publicly available datasets. For this reason, more emphasis should be placed on external validation in future studies using independent and more diverse cohorts [87]. When possible, model performance on less represented subgroups should also be independently reported.
9.2. Representation Learning and Multi-Omics Integration
Despite these limitations, deep learning offers several advantages for multi-omics integration when compared with established non-deep approaches. Established non-deep models generally have more limited tools for performing advanced multi-omics integration. Most classical machine-learning methods rely on predefined features or on early integration, where the different omics are concatenated into a single feature vector before applying the prediction model. In contrast, deep models can learn omics-specific representations, reduce the dimensionality of each omic and model the interactions between the different layers before the final prediction. Classical models often serve as baselines to demonstrate how more sophisticated deep integration strategies based on representation learning perform. Therefore, deep learning architectures are more commonly adopted when dealing with intermediate, late or more adaptive multi-omics integration strategies.
Another challenge arises from the impracticality of concatenating all omics layers into one extremely large feature vector and then computing relationships across all original features. Under these circumstances, mid-level integration has become a prominent strategy. In this approach, each view is first processed independently using an omics-specific encoder, usually resulting in a lower-dimensional representation. These representations can then be integrated before the downstream prediction stage.
The main advantage of mid-level integration lies in its ability to integrate heterogeneous modalities while respecting their individual characteristics. Each omics layer can be processed by a tailored encoder that produces a compact latent representation. Several frameworks have adopted hierarchical or omics-specific encoding before integrating the resulting representations [49,53,77,83].
Most of the reviewed studies employ end-to-end training pipelines in which the learned function directly maps the available inputs to the desired downstream output. Semi-supervised, self-supervised, and multi-objective learning strategies are also used to pre-train or regularize the encoders. The objective function frequently contains several components to encourage the latent representation to preserve different properties. For example, an encoder may combine a reconstruction loss with a contrastive loss, allowing it to retain information from the original modality while bringing samples from similar classes closer together and increasing the separation between samples from different classes [44,78]. Autoencoder-based frameworks may similarly combine reconstruction objectives with auxiliary classification losses to preserve both input information and task-relevant patterns [49,52,53].
Representation learning has therefore become a central concern in multi-omics integration. The focus has progressively shifted from directly using omics data in their raw high-dimensional form toward improving how these modalities are represented and provided to the final prediction layer.
9.3. Attention and Transformer-Based Integration
Transformers face important limitations when applied to multi-omics integration. Their difficulty arises not only from the limited number of samples but also from the high-dimensional nature of multi-omics datasets. Many omics modalities contain thousands or even tens of thousands of molecular features. The mechanism that made Transformers successful is attention, which allows the model to capture long-range dependencies and update each representation according to its relationships with other features [2]. However, computing full self-attention between a very large number of molecular features has a high computational and memory cost, often making it impractical for early integration. Despite these challenges, several Transformer-based architectures have been proposed for multi-omics classification, survival analysis, and clinical prediction [33,34,39,66].
Another challenge is feature ordering. Many models like CNNs assume that adjacent features carry meaningful local relationships. This introduces noise from the random order into the learned representations. Self- and cross-attention can help reduce dependence on local adjacency assumptions since each feature can interact with other features instead of depending only on neighbouring features. However, full attention is computationally expensive and it does not completely resolve the issue since positional encoding may still introduce information about feature ordering before the attention layer. Therefore, evaluating models under different feature orderings can help verify their generalizability and ensure that the obtained performance does not depend on a specific arrangement of the features.
In mid-level integration, omics-specific representations may be updated using self-attention to model intra-omic relationships. Cross-attention is subsequently applied, allowing the queries from one modality to attend to the keys and values of another modality and thereby introducing inter-omic information into the learned representations [41,66].
Cross-attention has consequently become a widely adopted technique for connecting heterogeneous views and introducing cross-modal dependencies before the prediction stage. Co-attention and cross-attention mechanisms have been applied to connect histological and molecular representations in survival analysis and other clinical objectives [61,62,63,64]. Treating each modality independently and then modeling intra- and inter-modal relationships using self-attention and cross-attention is generally more computationally efficient than applying full attention directly to all raw molecular features.
In this framework, attention is computed in the latent space, where the dimensionality of each modality has already been reduced. These latent representations may also be more compact and informative because their corresponding encoders are trained to suppress noise and retain patterns that are useful for the downstream objective. As a result, attention is applied to higher-level representations rather than to every original molecular measurement. Collaborative and omics-linked attention mechanisms have recently been used to refine such latent representations before final prediction [41,66].
Several approaches can also be used to sparsify or constrain the attention matrix. For example, prior biological knowledge from pathway databases such as KEGG and Reactome can be used to retain or prioritize known biological relationships [29,30]. Pathway-guided models such as DeepKEGG and AttentioFuse demonstrate how biological annotations can be incorporated into deep learning architectures to constrain connectivity and improve interpretability [42,47].
Nevertheless, this strategy introduces an important trade-off. One of the main advantages of unconstrained attention is its ability to learn relationships directly from the data without requiring all interactions to be specified in advance. Restricting attention exclusively to known pathways may improve computational efficiency and biological plausibility, but modeling data with restricted biological links and forcing models to only learn from prior knowledge-based graphs may prevent the model from learning new interactions or relationships that are not already represented in the biological knowledge bases and from discovering new pathways. This is important since these databases remain incomplete and are often more enriched for well-studied genes and pathways. Therefore, prior biological knowledge may be more useful when it guides the model rather than completely fixing its connections, allowing known relationships to be combined with learnable or data-driven ones.
Moreover, although attention may highlight potentially relevant feature relationships, attention weights should not be considered as an explainability method by themselves [50,54]. The magnitude of the attention weights indicates feature interactions during inference, but it does not imply that two features with high co-attention are cofactors, causal variables or biological reasons for the prediction. Nevertheless, attention-based feature importance can uncover potential interactions that can be considered as candidate biomarkers. Therefore, further stability analysis or biological validation is required to support the validity of the hypotheses highlighted by attention.
9.4. Underrepresented Integration Strategies and Non-Deep Approaches
Although intermediate integration based on omics-specific encoders is the most represented strategy in the reviewed works, other integration approaches remain less explored. Late or decision-level integration is less represented, where each omic is modeled independently before combining the final predictions. This strategy can be useful when some modalities are missing, but it limits the direct learning of interactions between the different molecular layers. More adaptive approaches such as dynamic weighting and mixture-of-experts are also still underrepresented. These methods allow the omics to contribute adaptively to the prediction depending on their availability instead of using the same fusion mechanism for all samples.
Another aspect that is worth considering is data privacy. There are cases where data cannot be shared and assembled into a single cohort and therefore require local analysis. Federated learning addresses this challenge by allowing models to be trained locally while sharing and aggregating model updates instead of directly sharing patient data. Depending on how the modalities and local models are combined, this approach can be applied with different integration strategies and is particularly important when clinical application is considered.
Another relatively underrepresented direction in recent works is the comparison with established non-deep integration approaches. Classical methods based on regularized regression, kernel learning, matrix factorization, similarity-based integration or other machine-learning models can still be useful, especially when the number of samples is limited. These approaches generally require fewer computational resources and may provide more directly interpretable relationships, but they offer fewer tools to address intermediate integration and objective-oriented representation learning. Machine learning is mainly dominated by predefined transformations, in contrast to deep learning, which offers a larger toolset for deep integration and adaptive combination of data. It can jointly learn omics-specific representations, reduce the dimensionality of each omic and capture nonlinear interactions between the different layers.
9.5. Graph-Based Multi-Omics Integration
Many recent studies employ graph neural networks for representation learning and multi-omics integration [40,41,43,46,48]. The motivation comes from the interconnected nature of biological systems. Genomic, epigenomic, transcriptomic, and proteomic processes influence one another through complex regulatory mechanisms. Rather than representing molecular measurements as completely independent variables, GNNs can explicitly model relationships between patients, genes, proteins, pathways, or other biological entities.
The main challenge associated with graph-based architectures is determining how the graph should be constructed and which perspective it should adopt. One common approach models patients as nodes and defines edges according to their molecular similarity. The intuition is that patients with similar molecular profiles may share related phenotypes or clinical outcomes. Aggregating information from similar patients may reinforce common patterns and improve the model’s predictions. MOGONET, for example, constructs an individual patient-similarity graph for each omics layer and integrates the resulting graph representations for patient classification and biomarker identification [46]. Similar patient-centric graph constructions have been combined with graph convolution, graph attention, gating, and cross-omics attention mechanisms [41,43].
Distance-based approaches, including cosine similarity, correlation measures, and Euclidean distance, remain frequently used to construct patient graphs. Attention scores and learnable edge weights have also been introduced to allow the model to adapt graph relationships during training. However, patient-similarity graphs depend heavily on the selected similarity measure and may be sensitive to noise, scaling, and the high dimensionality of the original molecular features.
Another perspective is gene-centric graph construction, in which molecular features are represented as nodes and edges describe known or inferred biological relationships. The motivation is that genes and other molecular entities are not independent but participate in pathways, regulatory interactions, co-expression modules, and protein–protein interaction networks. MoAGNN, for example, adopts a gene-centric representation and uses gene co-expression relationships to guide graph-based multi-omics learning [40]. Gene co-expression networks can be constructed using methods such as WGCNA, while protein associations and pathway relationships may be obtained from STRING, KEGG, and Reactome [29,30,31,32].
An important advantage of gene-centric graph construction is that prior biological knowledge can be used to construct or guide the graph. Sources such as pathway databases, protein–protein interaction networks, gene regulatory networks, and co-expression networks can provide biologically plausible edges between molecular features [29,30,31,32]. DeepKEGG and AttentioFuse illustrate how known pathway relationships can be incorporated into deep learning models to constrain feature interactions and produce pathway-level interpretations [42,47]. However, these knowledge bases remain incomplete and may introduce biases toward well-studied genes and pathways. Hybrid approaches that combine prior biological connections with data-driven or learnable edges may therefore provide a useful compromise.
To avoid extremely dense or fully connected graphs, sparsification techniques are frequently applied. Thresholding the adjacency matrix and retaining only the K-nearest neighbours are among the most common strategies in patient-centric multi-omics graphs [41,46]. These operations reduce computational complexity and may remove weak or noisy relationships. Nevertheless, the selected threshold or number of neighbours can substantially influence graph topology and model performance, meaning that graph construction should be carefully validated rather than treated as a purely preprocessing-related decision. Hypergraph-based approaches have also been proposed to represent higher-order relationships that cannot be adequately captured using pairwise edges alone [48].
9.6. Reliability, Validation, and Reproducibility
The absence of a harmonized comparative framework across studies is another observed limitation. The majority of the included works use different datasets, preprocessing steps, data splits, and evaluation metrics. This makes direct comparison between the reported performances difficult.
We notice that external validation remains very limited, as many studies mainly use internal cross-validation or train-test splits. This can be explained by the absence of a standard common comparative environment where feature measures and scales are consistent between training data and external cohorts. This makes it difficult to know if low performance is due to differences in data specifications or is rooted in the integration strategy itself.
Reproducibility is another challenge. The preprocessing pipeline, feature selection, model settings, and hyperparameters are not always reported in enough detail.
One way to facilitate clinical translation is the evaluation of the proposed models on standardized common cohorts, together with the consideration of regulatory requirements related to model validation, documentation, risk management, and monitoring [88]. Such benchmarking datasets should follow a common choice of modalities and feature scales to ensure that the evaluated models respect the enforced standards of medical routines. This can ensure that the comparison between integration strategies is reliable.
Another important quantitative measure of model performance is the prediction probability. A model can have strong discrimination between classes, yet the predicted probabilities may not match the observed outcome frequencies. An important post-processing technique used to address this issue is calibration. It adjusts the predicted probabilities to better match the observed outcomes. This is particularly important when model outputs are used to support patient-level clinical decisions [87,89]. Predictive uncertainty is also important in real clinical settings, as it can help identify low-confidence predictions that may require additional clinical review [90].
Data leakage is another important risk in multi-omics studies, especially due to the high dimensionality of the data and the large number of preprocessing steps. Feature selection, normalization and batch correction should be fitted only using the training data inside each fold [91]. When preprocessing steps are applied to the entire data, information from validation and test samples may leak when being applied to the training set. When the model is trained, residual information coming from validation samples may be learned and lead to overestimated results.
This problem is particularly important for graph-based models. Graph construction is usually data-driven and relies primarily on similarity measurements. When Euclidean distance, correlation, Mahalanobis distance, etc. are used to build graphs, extracting edges from the entire dataset will lead to leaking knowledge from the test and validation cohorts to the trained model via the built network. To avoid this, graph construction should be restricted to the training data within each fold, while validation and test samples should remain unseen during training. The same applies to gene-centric graphs when correlations or co-expression links are estimated from the studied cohort. In contrast, graphs constructed based on prior biological knowledge sources such as STRING or KEGG minimize this issue since connecting nodes is not necessarily data-specific and does not depend on the evaluated cohort.
Across the reviewed studies, leakage safety measures were not always explicitly reported. We noticed that the majority of works report preprocessing steps, but the exact order of data splitting, normalization, batch correction and other preprocessing steps is missing. This means that the reported results should be interpreted with caution when it is not clear whether the test and validation sets were isolated or not [91]. Future studies should explicitly report the taken measures to prevent data leakage [92]. Further emphasis on external validation cohorts may help ensure that the obtained results can generalize to unseen data.
Some studies also examine biological relevance by determining whether the features, genes, pathways, or interactions highlighted by the interpretation method correspond to mechanisms reported in biological databases or previous studies. KEGG, Reactome, STRING, and gene co-expression networks are among the resources that can support this type of validation [29,30,31,32]. Several multi-omics frameworks have used pathway enrichment, attention scores, feature importance, or graph-based interpretation to identify potential biomarkers and biologically relevant mechanisms [41,42,46,47]. Although this type of validation does not prove that the model has identified a causal mechanism, it can provide evidence that the learned representations are biologically meaningful.
9.7. Foundation Models and Large-Scale Pre-Training
Despite the standardization limitations and challenges, some studies have proposed foundation models. This emerging direction in representation learning has also been explored in multi-omics integration. Instead of training models from scratch for a specific task, foundation models pre-trained on large and heterogeneous biological datasets can be customized and fine-tuned for specific use cases while providing pre-trained representations that can be reused across different downstream objectives. Such foundation models are usually trained in a self-supervised framework to make the learned embeddings less dependent on a specific downstream task.
Some of the known foundation models include Geneformer, scGPT and scFoundation, which learn representations from large collections of single-cell transcriptomic profiles [93,94,95]. UCE follows a similar direction by learning a common cell representation from millions of cells across different tissues and species [96].
A related direction is the use of biological language models, where DNA, RNA or protein sequences are processed as biological sequences from which contextual representations can be learned. The Nucleotide Transformer is one example where large-scale genomic pre-training is used to produce representations that can later be transferred to genomic prediction tasks [97]. Foundation models are also progressively moving toward multimodal learning. For example, mSTAR jointly uses whole-slide images, pathology reports and gene expression during pre-training [98], while recent work has also highlighted the potential of foundation models combining several molecular, spatial, imaging and clinical modalities [99].
However, foundation models do not completely solve the limitations of multi-omics integration. Their performance still depends on the quality and diversity of the pre-training data, and biases or batch effects can also be learned during pre-training. In addition, most current omics foundation models still focus on single-cell transcriptomics or a limited number of modalities. Nevertheless, large-scale foundation models can provide a better starting point for multi-omics integration, especially in cases where the size of available cohorts is very limited due to a rare disease or a specific clinical downstream objective.
9.8. Emerging Multimodal and Spatial Directions
Under the mid-level integration framework, histopathological whole-slide images can also be processed in parallel with molecular measurements, allowing tissue morphology and molecular information to be jointly considered during prediction [59,62,63,64]. Strictly speaking, these approaches extend multi-omics integration toward broader multimodal integration because they combine molecular profiles with medical imaging data.
Another emerging direction is the inclusion of whole-slide images together with molecular profiles, allowing models to produce predictions informed by both tissue morphology and molecular characteristics. These approaches generally attempt to align or interactively fuse visual representations with molecular features [59,61,62,63,64]. The inclusion of histopathological images may provide complementary information because tissue morphology reflects phenotypic consequences of underlying molecular alterations. Recent studies have also investigated the prediction of molecular properties, including mutations and DNA methylation-based tumor types, directly from histopathological images [35,57].
Predicting spatial gene expression or molecular signatures directly from pathology slides has also become an important application. Approaches such as PH2ST use graph-based representations of whole-slide images to predict spatial transcriptomic information [82]. Such methods may help identify morphological patterns associated with specific molecular processes and may eventually reduce dependence on expensive molecular assays. However, aligning image regions with molecular measurements remains difficult because the two modalities often differ in their spatial scale, resolution, sampling procedures, and biological variability.
9.9. Research Questions and Main Findings
Based on the reviewed works and the trends discussed above, the research questions can be addressed as follows.
RQ1: The main molecular layers that are integrated are transcriptomics, genomics, epigenomics and proteomics. More recent works also increasingly combine these layers with clinical information, pathomics/imaging and spatial data.
RQ2: Intermediate integration is one of the most used strategies, where each modality is first encoded independently before integrating the learned representations. Autoencoders and VAEs remain widely used, while more recent works increasingly rely on attention, Transformers and GNNs.
RQ3: The major challenges remain the small number of samples, missing modalities and high dimensionality in the majority of cohorts that contain multi-omics records. Differences in measurement scales and technical characteristics across cohorts also limit generalizability to independent studies and the transfer of learned weights. These limitations become more important when the number of integrated modalities increases.
RQ4: Prior biological knowledge is mainly incorporated using pathways, protein–protein interaction networks and gene co-expression networks. These resources are used to guide the attention mechanism, graph construction or the connections between features. However, strongly constraining the model to known relationships can limit the discovery of new interactions.
RQ5: Recent works show a clear shift from directly concatenating raw features toward learning omics-specific representations before integration. Cross-attention, Transformers, GNNs, biological priors, pathomics and spatial information are becoming more present in recent multi-omics frameworks.
10. Conclusions
Overall, based on the current state of multi-omics integration, the major challenge remains the low-sample, high-dimensional nature of the available datasets. Existing approaches mitigate this problem to some extent by carefully extracting information from each modality and compressing it into more informative representations. Mid-level integration combined with attention-based fusion represents a prominent strategy for integrating multiple molecular profiles, particularly when heterogeneous modalities require different preprocessing and encoding mechanisms [41,53,66].
In this framework, each modality is first encoded into a lower-dimensional latent space. Graph-based representations are also increasingly used, with graphs constructed from either patient-centric or gene-centric perspectives [40,43,46]. Distance-based measures, prior biological relationships, attention mechanisms, or learnable weights are used to connect nodes and assign importance to their edges. The resulting adjacency matrices are often sparsified using K-nearest-neighbour selection or thresholding, while hypergraph approaches may be used to capture higher-order relationships [41,46,48].
Compact representations can then be learned using graph encoders, in which graph convolution or graph attention aggregates information from connected nodes and progressively transforms the original high-dimensional features. Cross-attention or other fusion mechanisms are subsequently employed to introduce inter-omic or cross-modal dependencies into these representations before they are used for classification, survival analysis, response prediction, biomarker identification, or other downstream clinical objectives [46,47,62,63,66]. Future advances will therefore depend not only on developing more sophisticated architectures but also on improving cohort sizes, handling missing modalities, validating graph-construction strategies, incorporating biological knowledge without preventing new discoveries, and ensuring that learned representations are biologically meaningful and clinically generalizable.
Author Contributions
Conceptualization, K.H. and M.A.A.; methodology, K.H. and M.A.A.; validation, K.H. and M.A.A.; formal analysis, K.H. and M.A.A.; writing—original draft preparation, K.H.; writing—review and editing, M.A.A.; funding acquisition, M.A.A. All authors have read and agreed to the published version of the manuscript.
Funding
This research was enabled in part by support provided by the Natural Sciences and Engineering Research Council of Canada (NSERC), funding reference number RGPIN-2024-05287, and by the AI in Health Research Chair at the Université de Moncton.
Institutional Review Board Statement
Not applicable.
Informed Consent Statement
Not applicable.
Data Availability Statement
No new data were created or analyzed in this study. Data sharing is not applicable to this article.
Acknowledgments
During the preparation of this manuscript, the authors used ChatGPT (GPT-5.6 Sol, OpenAI) to clarify biological concepts discussed in selected studies and to assist in generating TikZ code for illustrative diagrams. The authors have reviewed and edited the outputs and take full responsibility for the content of this publication.
Conflicts of Interest
The authors declare no conflicts of interest.
Abbreviations
The following abbreviations are used in this manuscript:
| ADNI | Alzheimer’s Disease Neuroimaging Initiative | AMP-AD | Accelerating Medicines Partnership–Alzheimer’s Disease |
| ARI | Adjusted Rand Index | ATAC | Assay for Transposase-Accessiblen Chromati |
| AUC | Area Under the Curve | AUC-PR | Area Under the Precision–Recall Curve |
| BLCA | Bladder Urothelial Carcinoma | BRCA | Breast Invasive Carcinoma |
| CCLE | Cancer Cell Line Encyclopedia | ChIP-seq | Chromatin Immunoprecipitation Sequencing |
| CLL | Chronic Lymphocytic Leukemia | CML | Chronic Myeloid Leukemia |
| CNA | Copy-Number Alteration | CNN | Convolutional Neural Network |
| CNV | Copy-Number Variation | COAD | Colon Adenocarcinoma |
| CNS | Central Nervous System | CPTAC | Clinical Proteomic Tumor Analysis Consortium |
| CSV | Comma-Separated Values | CT | Computed Tomography |
| DNN | Deep Neural Network | DNA | Deoxyribonucleic Acid |
| DTI | Diffusion Tensor Imaging | DVT | Deep Vein Thrombosis |
| EHR | Electronic Health Record | F1 | Harmonic Mean of Precision and Recall |
| FF | Fresh Frozen | FFPE | Formalin-Fixed Paraffin-Embedded |
| GAT | Graph Attention Network | GCN | Graph Convolutional Network |
| GDSC | Genomics of Drug Sensitivity in Cancer | GEO | Gene Expression Omnibus |
| GNN | Graph Neural Network | GRU | Gated Recurrent Unit |
| GWAS | Genome-Wide Association Study | HCC | Hepatocellular Carcinoma |
| HNSC | Head and Neck Squamous Cell Carcinoma | ICC | Intraclass Correlation Coefficient |
| IC50 | Half-Maximal Inhibitory Concentration | IoU | Intersection over Union |
| KEGG | Kyoto Encyclopedia of Genes and Genomes | KIPAN | Pan-Kidney Cohort |
| KIRC | Kidney Renal Clear Cell Carcinoma | KNN | k-Nearest Neighbours |
| KL | Kullback–Leibler | LASSO | Least Absolute Shrinkage and Selection Operator |
| LC–MS/MS | Liquid Chromato-graphy–Tandem Mass Spectrometry | LGG | Lower-Grade Glioma |
| LIHC | Liver Hepatocellular Carcinoma | LR | Logistic Regression |
| LSTM | Long Short-Term Memory | LUAD | Lung Adenocarcinoma |
| LUSC | Lung Squamous Cell Carcinoma | MAR | Missing at Random |
| MCAR | Missing Completely at Random | MCC | Matthews Correlation Coefficient |
| METABRIC | Molecular Taxonomy of Breast Cancer International Consortium | MI | Mutual Information |
| MIL | Multiple Instance Learning | MLP | Multilayer Perceptron |
| MMD | Maximum Mean Discrepancy | MNAR | Missing Not at Random |
| MRI | Magnetic Resonance Imaging | mRNA | Messenger RNA |
| MSE | Mean Squared Error | miRNA | microRNA |
| NB | Negative Binomial | NCBI | National Center for Biotechnology Information |
| NCI | National Cancer Institute | NMF | Non-negative Matrix Factorization |
| NMI | Normalized Mutual Information | NMR | Nuclear Magnetic Resonance |
| OT | Optimal Transport | PAAD | Pancreatic Adenocarcinoma |
| PBMC | Peripheral Blood Mononuclear Cell | PCA | Principal Component Analysis |
| PCAWG | Pan-Cancer Analysis of Whole Genomes | PCC | Pearson Correlation Coefficient |
| PDAC | Pancreatic Ductal Adenocarcinoma | PDX | Patient-Derived Xenograft |
| PoE | Product of Experts | PPI | Protein–Protein Interaction |
| PSN | Patient Similarity Network | SNF | Similarity Network Fusion |
| PRAD | Prostate Adenocarcinoma | PRISMA | Preferred Reporting Items for Systematic Reviews and Meta-Analyses |
| PWAS | Proteome-Wide Association Study | QNN | Quantum Neural Network |
| RBF | Radial Basis Function | RMSE | Root Mean Squared Error |
| RNA | Ribonucleic Acid | RNA-seq | RNA Sequencing |
| ROC-AUC | Area Under the Receiver Operating Characteristic Curve | ROSMAP | Religious Orders Study and Memory and Aging Project |
| RPPA | Reverse-Phase Protein Array | SAM | Sequence Alignment/Map |
| SARC | Sarcoma | SCCA | Sparse Canonical Correlation Analysis |
| SCC | Spearman Correlation Coefficient | SHAP | SHapley Additive exPlanations |
| SKCM | Skin Cutaneous Melanoma | SLE | Systemic Lupus Erythematosus |
| SMILES | Simplified Molecular Input Line Entry System | SNV | Single-Nucleotide Variant |
| SOTA | State of the Art | STAD | Stomach Adenocarcinoma |
| STRING | Search Tool for the Retrieval of Interacting Genes/Proteins | SVM | Support Vector Machine |
| TARGET | Therapeutically Applicable Research to Generate Effective Treatments | TCGA | The Cancer Genome Atlas |
| THCA | Thyroid Carcinoma | tNGS | Targeted Next-Generation Sequencing |
| TWAS | Transcriptome-Wide Association Study | UCEC | Uterine Corpus Endometrial Carcinoma |
| UVM | Uveal Melanoma | VAE | Variational Autoencoder |
| VCF | Variant Call Format | ViT | Vision Transformer |
| WES | Whole-Exome Sequencing | WGCNA | Weighted Gene Co-expression Network Analysis |
| WGD | Whole-Genome Doubling | WGS | Whole-Genome Sequencing |
| WSI | Whole-Slide Image | XGBoost | Extreme Gradient Boosting |
References
- Kingma, D.P.; Welling, M. An introduction to variational autoencoders. Found. Trends Mach. Learn. 2019, 12, 307–392. [Google Scholar] [CrossRef] [Scilit]
- Vaswani, A.; Shazeer, N.; Parmar, N.; Uszkoreit, J.; Jones, L.; Gomez, A.N.; Kaiser, Ł.; Polosukhin, I. Attention is all you need. In Proceedings of the Advances in Neural Information Processing Systems, Long Beach, CA, USA, 4–9 December 2017; Volume 30, pp. 5998–6008. [Google Scholar]
- Dhillon, A.; Singh, A.; Bhalla, V.K. A Systematic Review on Biomarker Identification for Cancer Diagnosis and Prognosis in Multi-omics: From Computational Needs to Machine Learning and Deep Learning. Arch. Comput. Methods Eng. 2023, 30, 917–949. [Google Scholar] [CrossRef] [Scilit]
- Acharya, D.; Mukhopadhyay, A. A Comprehensive Review of Machine Learning Techniques for Multi-omics Data Integration: Challenges and Applications in Precision Oncology. Brief. Funct. Genom. 2024, 23, 549–560. [Google Scholar] [CrossRef] [Scilit] [PubMed]
- Sartori, F.; Codicè, F.; Caranzano, I.; Rollo, C.; Birolo, G.; Fariselli, P.; Pancotti, C. A Comprehensive Review of Deep Learning Applications with Multi-Omics Data in Cancer Research. Genes 2025, 16, 648. [Google Scholar] [CrossRef] [Scilit] [PubMed]
- Zhang, J.; Che, Y.; Liu, R.; Wang, Z.; Liu, W. Deep Learning-Driven Multi-Omics Analysis: Enhancing Cancer Diagnostics and Therapeutics. Brief. Bioinform. 2025, 26, bbaf440. [Google Scholar] [CrossRef] [Scilit] [PubMed]
- Benabbou, N.; Abik, M.; Baichoo, S. Integrative Multi-Omics and Machine Learning/Deep Learning Approaches in Cancer Knowledge Discovery: A Scoping Review. Cancer Treat. Res. Commun. 2026, 47, 101136. [Google Scholar] [CrossRef] [Scilit] [PubMed]
- Ballard, J.L.; Wang, Z.; Li, W.; Shen, L.; Long, Q. Deep Learning-Based Approaches for Multi-Omics Data Integration and Analysis. Biodata Min. 2024, 17, 38. [Google Scholar] [CrossRef] [Scilit] [PubMed]
- Park, P.J. ChIP–seq: Advantages and challenges of a maturing technology. Nat. Rev. Genet. 2009, 10, 669–680. [Google Scholar] [CrossRef] [Scilit] [PubMed]
- Krueger, F.; Kreck, B.; Franke, A.; Andrews, S.R. DNA methylome analysis using short bisulfite sequencing data. Nat. Methods 2012, 9, 145–151. [Google Scholar] [CrossRef] [Scilit] [PubMed]
- Buenrostro, J.D.; Wu, B.; Chang, H.Y.; Greenleaf, W.J. ATAC-seq: A method for assaying chromatin accessibility genome-wide. Curr. Protoc. Mol. Biol. 2015, 109, 21–29. [Google Scholar] [CrossRef] [Scilit] [PubMed]
- Ozsolak, F.; Milos, P.M. RNA sequencing: Advances, challenges and opportunities. Nat. Rev. Genet. 2011, 12, 87–98. [Google Scholar] [CrossRef] [Scilit] [PubMed]
- Chen, G.; Ning, B.; Shi, T. Single-cell RNA-seq technologies and related computational data analysis. Front. Genet. 2019, 10, 317. [Google Scholar] [CrossRef] [Scilit] [PubMed]
- Atkinson, S.R.; Marguerat, S.; Bähler, J. Exploring long non-coding RNAs through sequencing. Semin. Cell Dev. Biol. 2012, 23, 200–205. [Google Scholar] [CrossRef] [Scilit] [PubMed]
- Ameres, S.L.; Zamore, P.D. Diversifying microRNA sequence and function. Nat. Rev. Mol. Cell Biol. 2013, 14, 475–488. [Google Scholar] [CrossRef] [Scilit] [PubMed]
- Karpievitch, Y.V.; Polpitiya, A.D.; Anderson, G.A.; Smith, R.D.; Dabney, A.R. Liquid chromatography mass spectrometry-based proteomics: Biological and technological aspects. Ann. Appl. Stat. 2010, 4, 1797–1823. [Google Scholar] [CrossRef] [Scilit] [PubMed]
- McLafferty, F.W. Tandem mass spectrometry. Science 1981, 214, 280–287. [Google Scholar] [CrossRef] [Scilit] [PubMed]
- Markley, J.L.; Brüschweiler, R.; Edison, A.S.; Eghbalnia, H.R.; Powers, R.; Raftery, D.; Wishart, D.S. The future of NMR-based metabolomics. Curr. Opin. Biotechnol. 2017, 43, 34–40. [Google Scholar] [CrossRef] [Scilit] [PubMed]
- Weinstein, J.N.; Collisson, E.A.; Mills, G.B.; Shaw, K.R.M.; Ozenberger, B.A.; Ellrott, K.; Shmulevich, I.; Sander, C.; Stuart, J.M.; The Cancer Genome Atlas Research Network. The Cancer Genome Atlas Pan-Cancer analysis project. Nat. Genet. 2013, 45, 1113–1120. [Google Scholar] [CrossRef] [Scilit] [PubMed]
- Ellis, M.J.; Gillette, M.; Carr, S.A.; Paulovich, A.G.; Smith, R.D.; Rodland, K.K.; Townsend, R.R.; Kinsinger, C.; Mesri, M.; Rodriguez, H.; et al. Connecting genomic alterations to cancer biology with proteomics: The NCI Clinical Proteomic Tumor Analysis Consortium. Cancer Discov. 2013, 3, 1108–1112. [Google Scholar] [CrossRef] [Scilit] [PubMed]
- Li, Y.; Dou, Y.; Da Veiga Leprevost, F.; Geffen, Y.; Calinawan, A.P.; Aguet, F.; Akiyama, Y.; Anand, S.; Birger, C.; Cao, S.; et al. Proteogenomic data and resources for pan-cancer analysis. Cancer Cell 2023, 41, 1397–1406. [Google Scholar] [CrossRef] [Scilit] [PubMed]
- Curtis, C.; Shah, S.P.; Chin, S.F.; Turashvili, G.; Rueda, O.M.; Dunning, M.J.; Speed, D.; Lynch, A.G.; Samarajiwa, S.; Yuan, Y.; et al. The genomic and transcriptomic architecture of 2,000 breast tumours reveals novel subgroups. Nature 2012, 486, 346–352. [Google Scholar] [CrossRef] [Scilit] [PubMed]
- National Cancer Institute. Therapeutically Applicable Research to Generate Effective Treatments (TARGET). Available online: https://www.cancer.gov/ccg/research/genome-sequencing/target (accessed on 25 October 2026).
- Barretina, J.; Caponigro, G.; Stransky, N.; Venkatesan, K.; Margolin, A.A.; Kim, S.; Wilson, C.J.; Lehar, J.; Kryukov, G.V.; Sonkin, D.; et al. The Cancer Cell Line Encyclopedia enables predictive modelling of anticancer drug sensitivity. Nature 2012, 483, 603–607. [Google Scholar] [CrossRef] [Scilit] [PubMed]
- Garnett, M.J.; Edelman, E.J.; Heidorn, S.J.; Greenman, C.D.; Dastur, A.; Lau, K.W.; Greninger, P.; Thompson, I.R.; Luo, X.; Soares, J.; et al. Systematic identification of genomic markers of drug sensitivity in cancer cells. Nature 2012, 483, 570–575. [Google Scholar] [CrossRef] [Scilit] [PubMed]
- De Jager, P.L.; Ma, Y.; McCabe, C.; Xu, J.; Vardarajan, B.N.; Felsky, D.; Klein, H.U.; White, C.C.; Peters, M.A.; Lodgson, B.; et al. A multi-omic atlas of the human frontal cortex for aging and Alzheimer’s disease research. Sci. Data 2018, 5, 180142. [Google Scholar] [CrossRef] [Scilit] [PubMed]
- Petersen, R.C.; Aisen, P.S.; Beckett, L.A.; Donohue, M.C.; Gamst, A.C.; Harvey, D.J.; Jack, C.R.; Jagust, W.J.; Shaw, L.M.; Toga, A.W.; et al. Alzheimer’s Disease Neuroimaging Initiative (ADNI): Clinical characterization. Neurology 2010, 74, 201–209. [Google Scholar] [CrossRef] [Scilit] [PubMed]
- Barrett, T.; Wilhite, S.E.; Ledoux, P.; Evangelista, C.; Kim, I.F.; Tomashevsky, M.; Marshall, K.A.; Phillippy, K.H.; Sherman, P.M.; Holko, M.; et al. NCBI GEO: Archive for functional genomics data sets—Update. Nucleic Acids Res. 2013, 41, D991–D995. [Google Scholar] [CrossRef] [Scilit] [PubMed]
- Kanehisa, M.; Sato, Y.; Kawashima, M.; Furumichi, M.; Tanabe, M. KEGG as a reference resource for gene and protein annotation. Nucleic Acids Res. 2016, 44, D457–D462. [Google Scholar] [CrossRef] [Scilit] [PubMed]
- Croft, D.; O’Kelly, G.; Wu, G.; Haw, R.; Gillespie, M.; Matthews, L.; Caudy, M.; Garapati, P.; Gopinath, G.; Jassal, B.; et al. Reactome: A database of reactions, pathways and biological processes. Nucleic Acids Res. 2011, 39, D691–D697. [Google Scholar] [CrossRef] [Scilit] [PubMed]
- Szklarczyk, D.; Kirsch, R.; Koutrouli, M.; Nastou, K.; Mehryary, F.; Hachilif, R.; Gable, A.L.; Fang, T.; Doncheva, N.T.; Pyysalo, S.; et al. The STRING database in 2023: Protein–protein association networks and functional enrichment analyses for any sequenced genome of interest. Nucleic Acids Res. 2023, 51, D638–D646. [Google Scholar] [CrossRef] [Scilit] [PubMed]
- Langfelder, P.; Horvath, S. WGCNA: An R package for weighted correlation network analysis. BMC Bioinform. 2008, 9, 559. [Google Scholar] [CrossRef] [Scilit] [PubMed]
- Dong, Z.; Li, P.; Jiang, Y.; Wang, Z.; Fu, S.; Che, H.; Liu, M.; Zhao, X.; Liu, C.; Zhao, C.; et al. Integrative Multi-Omics and Routine Blood Analysis Using Deep Learning: Cost-Effective Early Prediction of Chronic Disease Risks. Adv. Sci. 2025, 12, e2412775. [Google Scholar] [CrossRef] [Scilit] [PubMed]
- Osseni, M.; Tossou, P.; Laviolette, F.; Corbeil, J. MOT: A Multi-Omics Transformer for multiclass classification tumour types predictions. bioRxiv 2022. bioRxiv:2022.11.14.516459. [Google Scholar] [CrossRef] [Scilit]
- Hoang, D.T.; Shulman, E.D.; Turakulov, R.; Abdullaev, Z.; Singh, O.; Campagnolo, E.M.; Lalchungnunga, H.; Stone, E.A.; Nasrallah, M.P.; Ruppin, E.; et al. Prediction of DNA methylation-based tumor types from histopathology in central nervous system tumors with deep learning. Nat. Med. 2024, 30, 1952–1961. [Google Scholar] [CrossRef] [Scilit] [PubMed]
- Wang, H.; Wei, L.; Li, J.; Liu, B.; Fang, J.; Mooney, C. A multimodal data-based model for breast cancer diagnosis. Comput. Methods Programs Biomed. 2026, 279, 109288. [Google Scholar] [CrossRef] [Scilit] [PubMed]
- Saggi, M.K.; Bhatia, A.S.; Mensah, I.K.; Gowher, H.; Kais, S. Multi-Omic and quantum machine learning integration for lung subtypes classification. Future Gener. Comput. Syst. 2026, 174, 107905. [Google Scholar] [CrossRef] [Scilit]
- Mu, N.; Yang, H.; Zhao, C. An uncertainty-aware dynamic decision framework for progressive multi-omics integration in classification tasks. Comput. Methods Programs Biomed. 2026, 275, 109179. [Google Scholar] [CrossRef] [Scilit] [PubMed]
- Chandak, M.B.; Raipurkar, A.R.; Rawat, S.G. Systemic Lupus Erythematosus prediction using Epistatic-Quantile Fusion Transformer network with integrated multi-omics and clinical data. Comput. Biol. Chem. 2026, 120, 108617. [Google Scholar] [CrossRef] [Scilit] [PubMed]
- Lin, C.P.; Ho, Y.J.; Chiu, Y.P.; Tang, Y.; Paik, Y.S.; Chen, G.T.; Huang, W.C.; Lee, T.Y. MoAGNN: A multi-omics hierarchical graph neural network for subtype classification and prognosis prediction in lung adenocarcinoma. Brief. Bioinform. 2026, 27, bbaf735. [Google Scholar] [CrossRef] [Scilit] [PubMed]
- Huang, Z.; Deng, Y.; Liu, J.; Cai, Z. A Graph-Based Deep Learning Framework with Gating and Omics-Linked Attention for Multi-Omics Integration and Biomarker Discovery. Biology 2025, 14, 1764. [Google Scholar] [CrossRef] [Scilit] [PubMed]
- Huang, Y.; He, Y.; Zeng, L.; Liu, L.; Zhong, F. From Black Box to Biological Insight: AttentioFuse Unlocks Multi-Omics Dynamics in Lung Cancer. Cancers 2026, 18, 878. [Google Scholar] [CrossRef] [Scilit] [PubMed]
- Li, M.; Jin, M.; Lou, M.; Deng, S.; Wang, L.; Rao, H. Multiview-cooperated graph neural network enables novel multi-omics cancer subtype classification. Comput. Biol. Chem. 2026, 120, 108665. [Google Scholar] [CrossRef] [Scilit] [PubMed]
- Yinghua, M.; Khan, A.; Heng, Y.; Gul Khan, F.; Aldhahri, A.; Ahmed Khan, I. A contrastive adversarial encoder for multi-omics data integration. PLoS ONE 2025, 20, e0333134. [Google Scholar] [CrossRef] [Scilit] [PubMed]
- Zhu, J.Y.; Park, T.; Isola, P.; Efros, A.A. Unpaired Image-to-Image Translation Using Cycle-Consistent Adversarial Networks. In Proceedings of the IEEE International Conference on Computer Vision, Venice, Italy, 22–29 October 2017; pp. 2223–2232. [Google Scholar] [CrossRef] [Scilit]
- Wang, T.; Shao, W.; Huang, Z.; Tang, H.; Zhang, J.; Ding, Z.; Huang, K. MOGONET integrates multi-omics data using graph convolutional networks allowing patient classification and biomarker identification. Nat. Commun. 2021, 12, 3445. [Google Scholar] [CrossRef] [Scilit] [PubMed]
- Lan, W.; Liao, H.; Chen, Q.; Zhu, L.; Pan, Y.; Chen, Y.P.P. DeepKEGG: A multi-omics data integration framework with biological insights for cancer recurrence prediction and biomarker discovery. Brief. Bioinform. 2024, 25, bbae185. [Google Scholar] [CrossRef] [Scilit] [PubMed]
- Wang, H.; Lin, K.; Zhang, Q.; Shi, J.; Song, X.; Wu, J.; Zhao, C.; He, K. HyperTMO: A trusted multi-omics integration framework based on hypergraph convolutional network for patient classification. Bioinformatics 2024, 40, btae159. [Google Scholar] [CrossRef] [Scilit] [PubMed]
- Yao, X.; Jiang, X.; Luo, H.; Liang, H.; Ye, X.; Wei, Y.; Cong, S. MOCAT: Multi-omics integration with auxiliary classifiers enhanced autoencoder. Biodata Min. 2024, 17, 9. [Google Scholar] [CrossRef] [Scilit] [PubMed]
- Wu, H.; Wu, H.; Xin, X.; Liu, J. MOGANet: A Multi-omics Graph Attention Network for Cancer Diagnosis and Biomarker Identification. Interdiscip. Sci. Comput. Life Sci. 2026. advance online publication. [Google Scholar] [CrossRef] [Scilit] [PubMed]
- Oh, J.H.; Choi, W.; Ko, E.; Kang, M. PathCNN: Interpretable convolutional neural networks for survival prediction and pathway analysis applied to glioblastoma. Bioinformatics 2021, 37, i443–i450. [Google Scholar] [CrossRef] [Scilit] [PubMed]
- Lupat, R.; Perera, R.; Loi, S.; Li, J. Moanna: Multi-Omics Autoencoder-Based Neural Network Algorithm for Predicting Breast Cancer Subtypes. IEEE Access 2023, 11, 10912–10924. [Google Scholar] [CrossRef] [Scilit]
- Benkirane, H.; Pradat, Y.; Michiels, S.; Cournède, P.H. CustOmics: A versatile deep-learning based strategy for multi-omics integration. PLoS Comput. Biol. 2023, 19, e1010921. [Google Scholar] [CrossRef] [Scilit] [PubMed]
- Rehman, A.U.; Sayyed, A.; Mohmand, M.I.; Rathore, S.A.; Khan, M.M.; Iqbal, A. Explainable attention-based multi-omics fusion with protein language models for CML-versus-control classification and biomarker discovery. Sci. Rep. 2026. advance online publication. [Google Scholar] [CrossRef] [Scilit]
- Lin, C.; Wu, H.; Xian, W.; Zheng, Y.; Du, W.; Chen, X.; Li, J.; Chen, W.; Lin, L.; Su, F.; et al. Deep learning enhanced ALPS reveals genetic and environmental factors of brain glymphatic function. eBioMedicine 2026, 124, 106133, Correction in eBioMedicine 2026, 125, 106180. https://doi.org/10.1016/j.ebiom.2026.106180. [Google Scholar] [CrossRef] [Scilit] [PubMed]
- Cai, G.; Chen, F.; Wen, K.; Li, Y.; Ou-Yang, L. Identifying spatial domains from spatial multi-omics data using consistent and specific deep subspace learning. Inf. Fusion 2026, 125, 103428. [Google Scholar] [CrossRef] [Scilit]
- Shao, S.; Shen, W.; Han, C.; Li, G.; Wang, J.; Zhang, X.; Fang, Q.; Wu, J.; Luo, R.; Liu, Y.; et al. Deep learning bridges histopathology and molecular profiling: An integrated framework for improved mutation prediction and biological interpretation: A multi-cohort study. Biomed. Signal Process. Control 2026, 120, 110215. [Google Scholar] [CrossRef] [Scilit]
- Wang, H.; Jing, Y.; Li, H.; Zhang, Y.; Chang, C.; Shi, G. Multimodal deep learning with attention mechanisms for automated detection of lower extremity deep vein thrombosis: Integrating ultrasound, CT, and MRI. Biomed. Signal Process. Control 2026, 119, 109749. [Google Scholar] [CrossRef] [Scilit]
- Chen, R.J.; Lu, M.Y.; Williamson, D.F.; Chen, T.Y.; Lipkova, J.; Noor, Z.; Shaban, M.; Shady, M.; Williams, M.; Joo, B.; et al. Pan-cancer integrative histology-genomic analysis via multimodal deep learning. Cancer Cell 2022, 40, 865–878.e6. [Google Scholar] [CrossRef] [Scilit] [PubMed]
- Li, P.; Chen, X.; Wang, H.; Xu, T.; Li, Y.; Ye, W.; Chen, J.; Li, F.; Yao, N.; Wu, Y. Research on a multi-omics prognostic model of liver cancer based on stacked supervised deep learning. Array 2026, 29, 100646. [Google Scholar] [CrossRef] [Scilit]
- Qu, M.; Yang, G.; Di, D.; Gao, Y.; Song, Y.; Fan, L. M3Surv: Fusing Multi-slide and Multi-omics for Memory-augmented robust Survival prediction. Med. Image Anal. 2026, 107, 103846. [Google Scholar] [CrossRef] [Scilit] [PubMed]
- Chen, R.J.; Lu, M.Y.; Weng, W.H.; Chen, T.Y.; Williamson, D.F.; Manz, T.; Shady, M.; Mahmood, F. Multimodal co-attention transformer for survival prediction in gigapixel whole slide images. In Proceedings of the IEEE/CVF International Conference on Computer Vision, Virtual, 11–17 October 2021; pp. 4015–4025. [Google Scholar] [CrossRef] [Scilit]
- Xu, Y.; Chen, H. Multimodal optimal transport-based co-attention transformer with global structure consistency for survival prediction. In Proceedings of the IEEE/CVF International Conference on Computer Vision, Paris, France, 2–6 October 2023; pp. 21241–21251. [Google Scholar] [CrossRef] [Scilit]
- Jaume, G.; Vaidya, A.; Chen, R.J.; Williamson, D.F.; Liang, P.P.; Mahmood, F. Modeling dense multimodal interactions between biological pathways and histology for survival prediction. In Proceedings of the IEEE/CVF Conference on Computer Vision and Pattern Recognition, Seattle, WA, USA, 17–21 June 2024; pp. 11579–11590. [Google Scholar] [CrossRef] [Scilit]
- Liu, T.; Hounye, A.H.; Yin, X.; Jiang, X.; Wu, J. Enhanced multi-omics integration analysis utilising an attention-based deep learning network with maximum mean discrepancy for prediction of cancer subtypes. IRBM 2026, 47, 100944. [Google Scholar] [CrossRef] [Scilit]
- Wen, G.; Li, L. CoFormerSurv: Collaborative transformer for multi-omics survival analysis. PLoS Comput. Biol. 2026, 22, e1013875. [Google Scholar] [CrossRef] [Scilit] [PubMed]
- Qin, Z.; Zhou, H.; Hu, Y.; Xiong, X.; Lu, J.; Su, H.; He, J. Survival prediction for bladder cancer using multimodal data with quantum neural networks and transformer architectures. Sci. Rep. 2026, 16, 12545. [Google Scholar] [CrossRef] [Scilit] [PubMed]
- Zhang, J.; Xiong, S.; Xu, Y.; Zhang, Y. Prediction of cancer drug response based on heterogeneous graph neural networks and multi-omics data. Neural Netw. 2026, 193, 108001. [Google Scholar] [CrossRef] [Scilit] [PubMed]
- Corsello, S.M.; Nagari, R.T.; Spangler, R.D.; Rossen, J.; Kocak, M.; Bryan, J.G.; Humeidi, R.; Peck, D.; Wu, X.; Tang, A.A.; et al. Discovering the anticancer potential of non-oncology drugs by systematic viability profiling. Nat. Cancer 2020, 1, 235–248. [Google Scholar] [CrossRef] [Scilit] [PubMed]
- Gudadhe, P.; Makhijani, R.; Goel, C. An interpretable framework for cancer drug response prediction using integrated drug and multi-omics data with a hybrid Bi-LSTM-GRU network. Comput. Biol. Chem. 2026, 124, 109216. [Google Scholar] [CrossRef] [Scilit] [PubMed]
- Yang, W.; Soares, J.; Greninger, P.; Edelman, E.J.; Lightfoot, H.; Forbes, S.; Bindal, N.; Beare, D.; Smith, J.A.; Thompson, I.R.; et al. Genomics of Drug Sensitivity in Cancer (GDSC): A resource for therapeutic biomarker discovery in cancer cells. Nucleic Acids Res. 2013, 41, D955–D961. [Google Scholar] [CrossRef] [Scilit] [PubMed]
- Mandal, K.; Bandyopadhyay, S. BKDRP: A biological knowledge-driven approach for drug response prediction using multi-omics data in cancer cell lines. BMC Bioinform. 2026, 27, 119. [Google Scholar] [CrossRef] [Scilit] [PubMed]
- Alpsoy, S.; Sezerman, O.U. Transfer learning with multiomics integration and deep neural networks reveals drug resistance mechanisms in cancer. Sci. Rep. 2025, 15, 42295. [Google Scholar] [CrossRef] [Scilit] [PubMed]
- Sharifi-Noghabi, H.; Zolotareva, O.; Collins, C.C.; Ester, M. MOLI: Multi-omics late integration with deep neural networks for drug response prediction. Bioinformatics 2019, 35, i501–i509. [Google Scholar] [CrossRef] [Scilit] [PubMed]
- Wu, Y.; Chen, M.; Qin, Y. Anticancer drug response prediction integrating multi-omics pathway-based difference features and multiple deep learning techniques. PLoS Comput. Biol. 2025, 21, e1012905. [Google Scholar] [CrossRef] [Scilit] [PubMed]
- Wang, W.; Yuan, G.; Sun, B.; Liu, D.; Zhang, H.; Wu, G.; Zhou, Y.; Wang, X. MCMTSYN: Predicting anticancer drug synergy via cross-modal feature fusion and multi-task learning. Pattern Recognit. 2026, 176, 113222. [Google Scholar] [CrossRef] [Scilit]
- Liu, Q.; Song, K. ProgCAE: A deep learning-based method that integrates multi-omics data to predict cancer subtypes. Brief. Bioinform. 2023, 24, bbad196. [Google Scholar] [CrossRef] [Scilit] [PubMed]
- Zhao, J.; Zhao, B.; Song, X.; Lyu, C.; Chen, W.; Xiong, Y.; Wei, D.Q. Subtype-DCC: Decoupled contrastive clustering method for cancer subtype identification based on multi-omics data. Brief. Bioinform. 2023, 24, bbad025. [Google Scholar] [CrossRef] [Scilit] [PubMed]
- Luong, K.; Joshi, N.; Nayak, R. Semi-supervised deep matrix factorization model for clustering multi-omics data. Comput. Methods Programs Biomed. 2026, 273, 109094. [Google Scholar] [CrossRef] [Scilit] [PubMed]
- Zhang, S.; Lu, Y.; Li, P.; Wu, J.; Wang, G.; Yang, W. CA-CAE: A deep learning-based multi-omics model for pan-cancer subtype classification and prognosis prediction. PLoS Comput. Biol. 2026, 22, e1014015. [Google Scholar] [CrossRef] [Scilit] [PubMed]
- Han, Y.; Shang, J.; Fan, A.; Su, W.; Qiu, D.; Wang, H. SpaMOCA: Spatial multi-omics integration with local cross-attention and contrastive learning. Knowl. Based Syst. 2026, 352, 116938. [Google Scholar] [CrossRef] [Scilit]
- Niu, Y.; Liu, J.; Zhan, Y.; Shi, J.; Zhang, D.; Reinius, M.; Machado, I.; Crispin-Ortuzar, M.; Wu, J.; Li, C.; et al. PH2ST: Prompt-guided hypergraph learning for spatial transcriptomics prediction in whole slide images. Med. Image Anal. 2026, 110, 104008. [Google Scholar] [CrossRef] [Scilit] [PubMed]
- Tu, X.; Cao, Z.J.; Xia, C.R.; Mostafavi, S.; Gao, G. Cross-linked unified embedding for cross-modality representation learning. In Proceedings of the Advances in Neural Information Processing Systems, New Orleans, LA, USA, 28 November–9 December 2022; Volume 35, pp. 15942–15955. [Google Scholar] [CrossRef] [Scilit]
- Lee, C.; van der Schaar, M. A variational information bottleneck approach to multi-omics data integration. In Proceedings of the 24th International Conference on Artificial Intelligence and Statistics, Virtual conference, 13–15 April 2021; PMLR: Windsor, UK, 2021; Volume 130, pp. 1513–1521. Available online: https://proceedings.mlr.press/v130/lee21a.html (accessed on 25 October 2026).
- Lotfollahi, M.; Litinetskaya, A.; Theis, F.J. Multigrate: Single-cell multi-omic data integration. bioRxiv 2022. bioRxiv:2022.03.16.484643. [Google Scholar] [CrossRef] [Scilit]
- Zhao, L.; Dong, Q.; Luo, C.; Wu, Y.; Bu, D.; Qi, X.; Luo, Y.; Zhao, Y. DeepOmix: A scalable and interpretable multi-omics deep learning framework and application in cancer survival analysis. Comput. Struct. Biotechnol. J. 2021, 19, 2719–2725. [Google Scholar] [CrossRef] [Scilit] [PubMed]
- de Hond, A.A.H.; Shah, V.B.; Kant, I.M.J.; Van Calster, B.; Steyerberg, E.W.; Hernandez-Boussard, T. Perspectives on validation of clinical predictive algorithms. npj Digit. Med. 2023, 6, 86. [Google Scholar] [CrossRef] [Scilit] [PubMed]
- U.S. Food and Drug Administration. Artificial Intelligence-Enabled Device Software Functions: Lifecycle Management and Marketing Submission Recommendations. Draft Guidance for Industry and Food and Drug Administration Staff; Docket FDA-2024-D-4488; 7 January 2025. Available online: https://www.fda.gov/regulatory-information/search-fda-guidance-documents/artificial-intelligence-enabled-device-software-functions-lifecycle-management-and-marketing (accessed on 25 October 2026).
- Huang, Y.; Li, W.; Macheret, F.; Gabriel, R.A.; Ohno-Machado, L. A tutorial on calibration measurements and calibration models for clinical prediction models. J. Am. Med. Inform. Assoc. 2020, 27, 621–633. [Google Scholar] [CrossRef] [Scilit] [PubMed]
- Loftus, T.J.; Shickel, B.; Ruppert, M.M.; Balch, J.A.; Ozrazgat-Baslanti, T.; Tighe, P.J.; Efron, P.A.; Hogan, W.R.; Rashidi, P.; Upchurch, G.R.J.; et al. Uncertainty-aware deep learning in healthcare: A scoping review. PLoS Digit. Health 2022, 1, e0000085. [Google Scholar] [CrossRef] [Scilit] [PubMed]
- Diaz-Uriarte, R.; Gómez de Lope, E.; Giugno, R.; Fröhlich, H.; Nazarov, P.V.; Nepomuceno-Chamorro, I.A.; Rauschenberger, A.; Glaab, E. Ten Quick Tips for Biomarker Discovery and Validation Analyses Using Machine Learning. PLoS Comput. Biol. 2022, 18, e1010357. [Google Scholar] [CrossRef] [Scilit] [PubMed]
- Collins, G.S.; Moons, K.G.M.; Dhiman, P.; Riley, R.D.; Beam, A.L.; Van Calster, B.; Ghassemi, M.; Liu, X.; Reitsma, J.B.; van Smeden, M.; et al. TRIPOD+AI statement: Updated guidance for reporting clinical prediction models that use regression or machine learning methods. BMJ 2024, 385, e078378, Correction in BMJ 2024, 385, q902. https://doi.org/10.1136/bmj.q902. [Google Scholar] [CrossRef] [Scilit] [PubMed]
- Theodoris, C.V.; Xiao, L.; Chopra, A.; Chaffin, M.D.; Al Sayed, Z.R.; Hill, M.C.; Mantineo, H.; Brydon, E.M.; Zeng, Z.; Liu, X.S.; et al. Transfer learning enables predictions in network biology. Nature 2023, 618, 616–624. [Google Scholar] [CrossRef] [Scilit] [PubMed]
- Cui, H.; Wang, C.; Maan, H.; Pang, K.; Luo, F.; Duan, N.; Wang, B. scGPT: Toward building a foundation model for single-cell multi-omics using generative AI. Nat. Methods 2024, 21, 1470–1480. [Google Scholar] [CrossRef] [Scilit] [PubMed]
- Hao, M.; Gong, J.; Zeng, X.; Liu, C.; Guo, Y.; Cheng, X.; Wang, T.; Ma, J.; Zhang, X.; Song, L. Large-scale foundation model on single-cell transcriptomics. Nat. Methods 2024, 21, 1481–1491. [Google Scholar] [CrossRef] [Scilit] [PubMed]
- Rosen, Y.; Roohani, Y.; Agrawal, A.; Samotorčan, L.; Tabula Sapiens Consortium; Quake, S.R.; Leskovec, J. Universal cell embedding provides a foundation model for cell biology. Nature 2026, 656, 183–191. [Google Scholar] [CrossRef] [Scilit] [PubMed]
- Dalla-Torre, H.; Gonzalez, L.; Mendoza-Revilla, J.; Lopez Carranza, N.; Grzywaczewski, A.H.; Oteri, F.; Dallago, C.; Trop, E.; de Almeida, B.P.; Sirelkhatim, H.; et al. Nucleotide Transformer: Building and evaluating robust foundation models for human genomics. Nat. Methods 2025, 22, 287–297. [Google Scholar] [CrossRef] [Scilit] [PubMed]
- Xu, Y.; Wang, Y.; Zhou, F.; Ma, J.; Jin, C.; Yang, S.; Li, J.; Zhang, Z.; Zhao, C.; Zhou, H.; et al. A multimodal knowledge-enhanced whole-slide pathology foundation model. Nat. Commun. 2025, 16, 11406. [Google Scholar] [CrossRef] [Scilit] [PubMed]
- Cui, H.; Tejada-Lapuerta, A.; Brbić, M.; Saez-Rodriguez, J.; Cristea, S.; Goodarzi, H.; Lotfollahi, M.; Theis, F.J.; Wang, B. Towards multimodal foundation models in molecular cell biology. Nature 2025, 640, 623–633. [Google Scholar] [CrossRef] [Scilit] [PubMed]
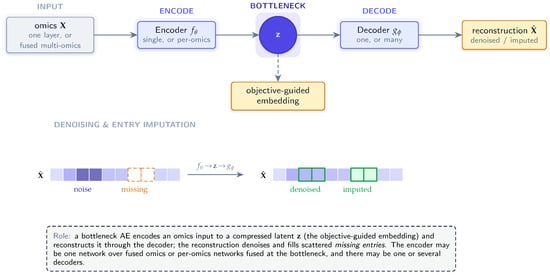
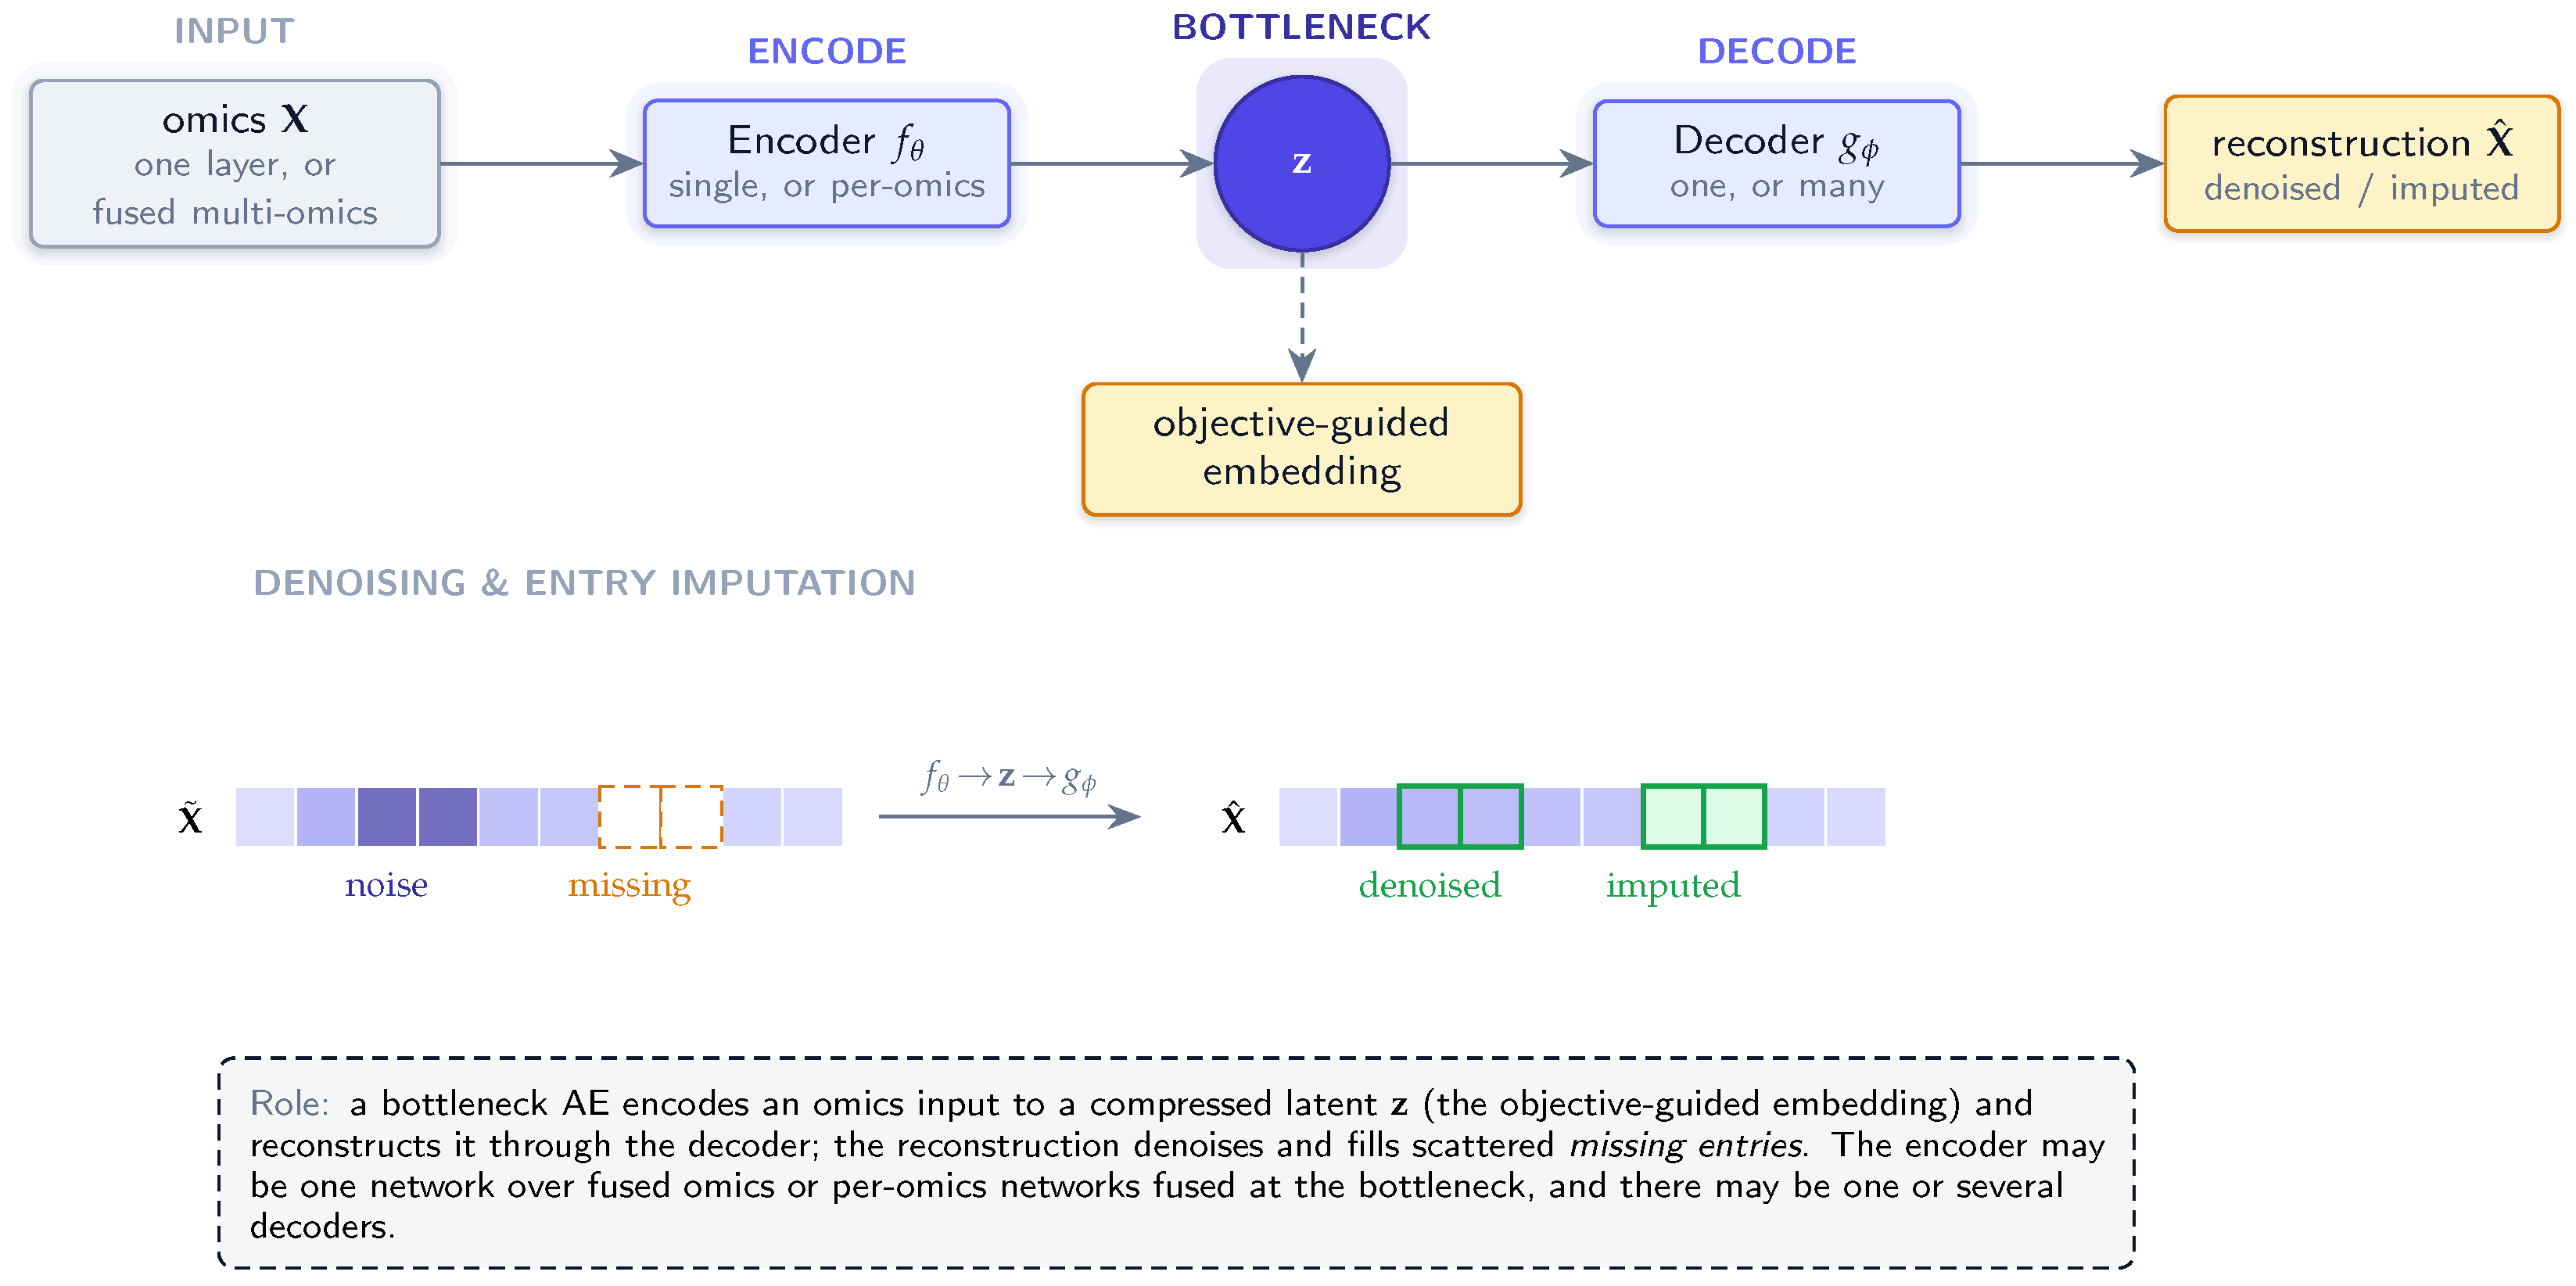
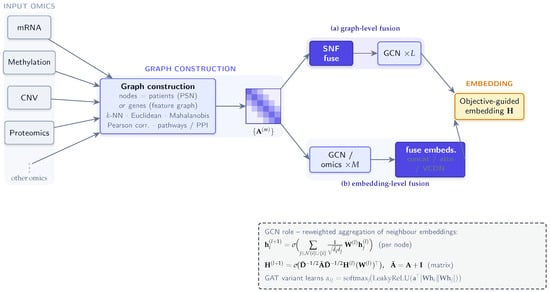
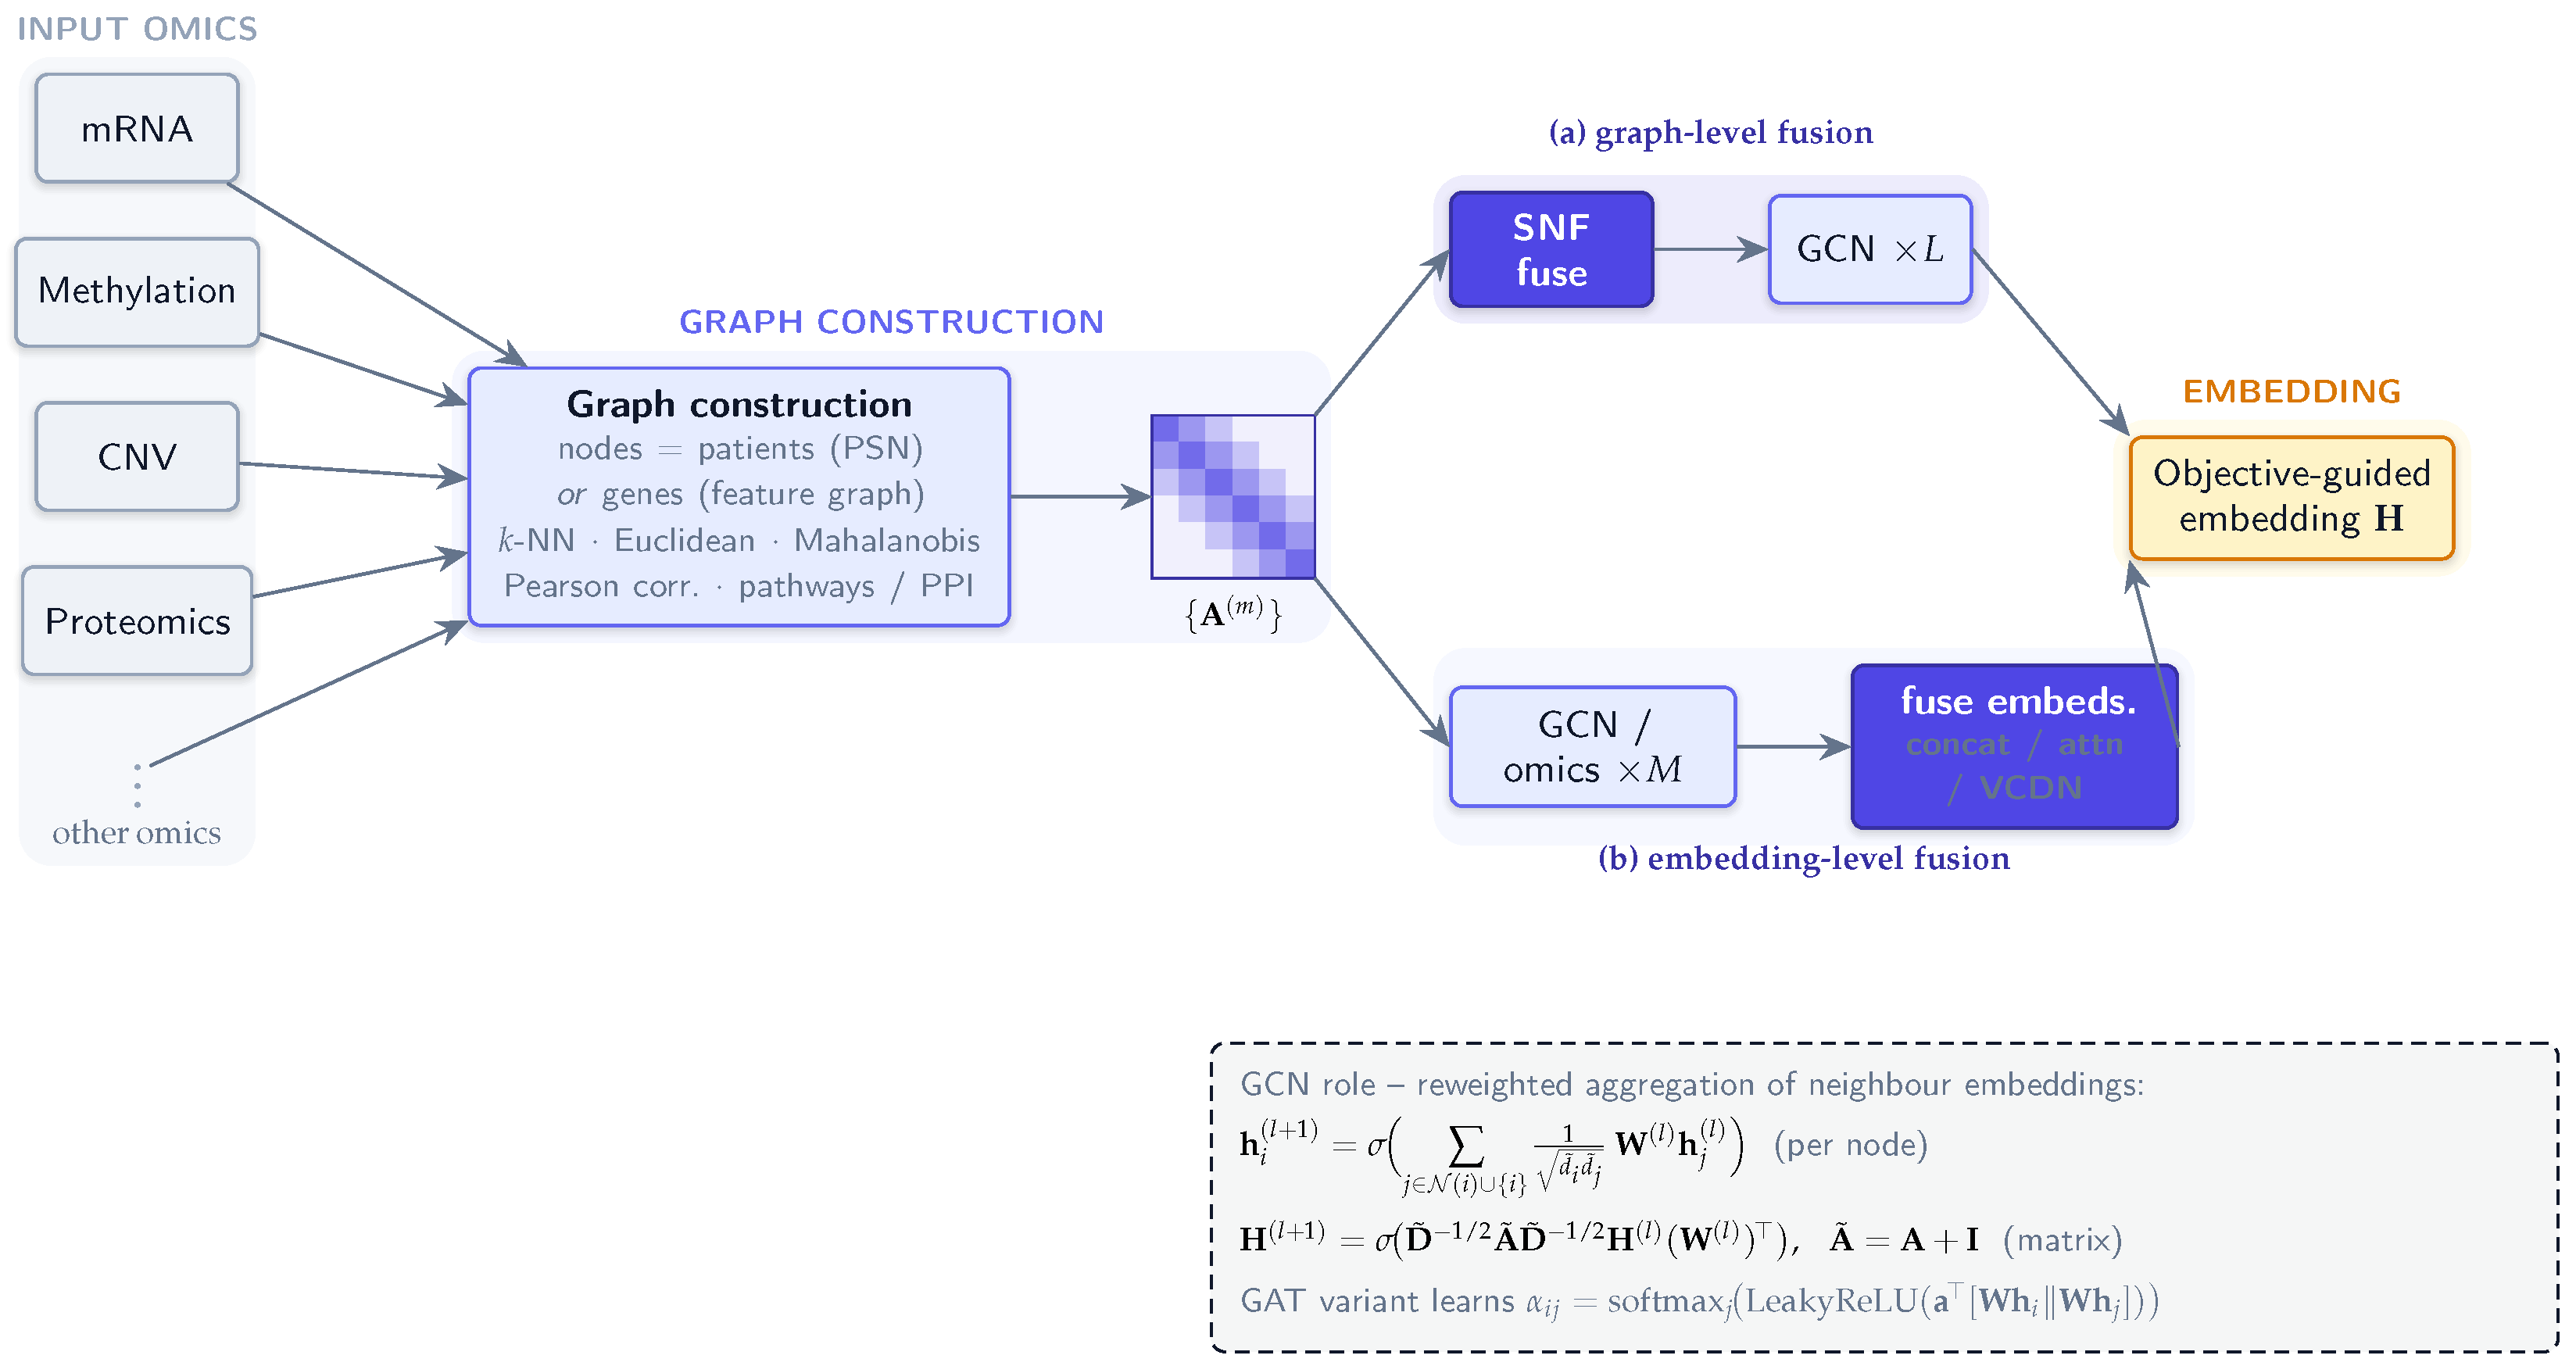
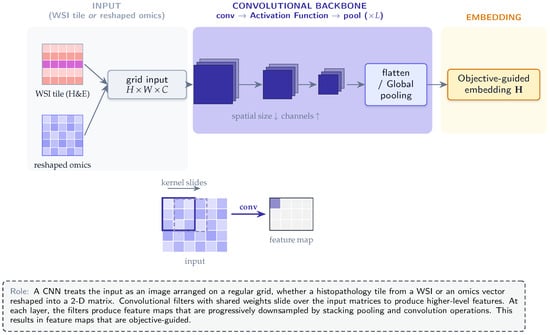
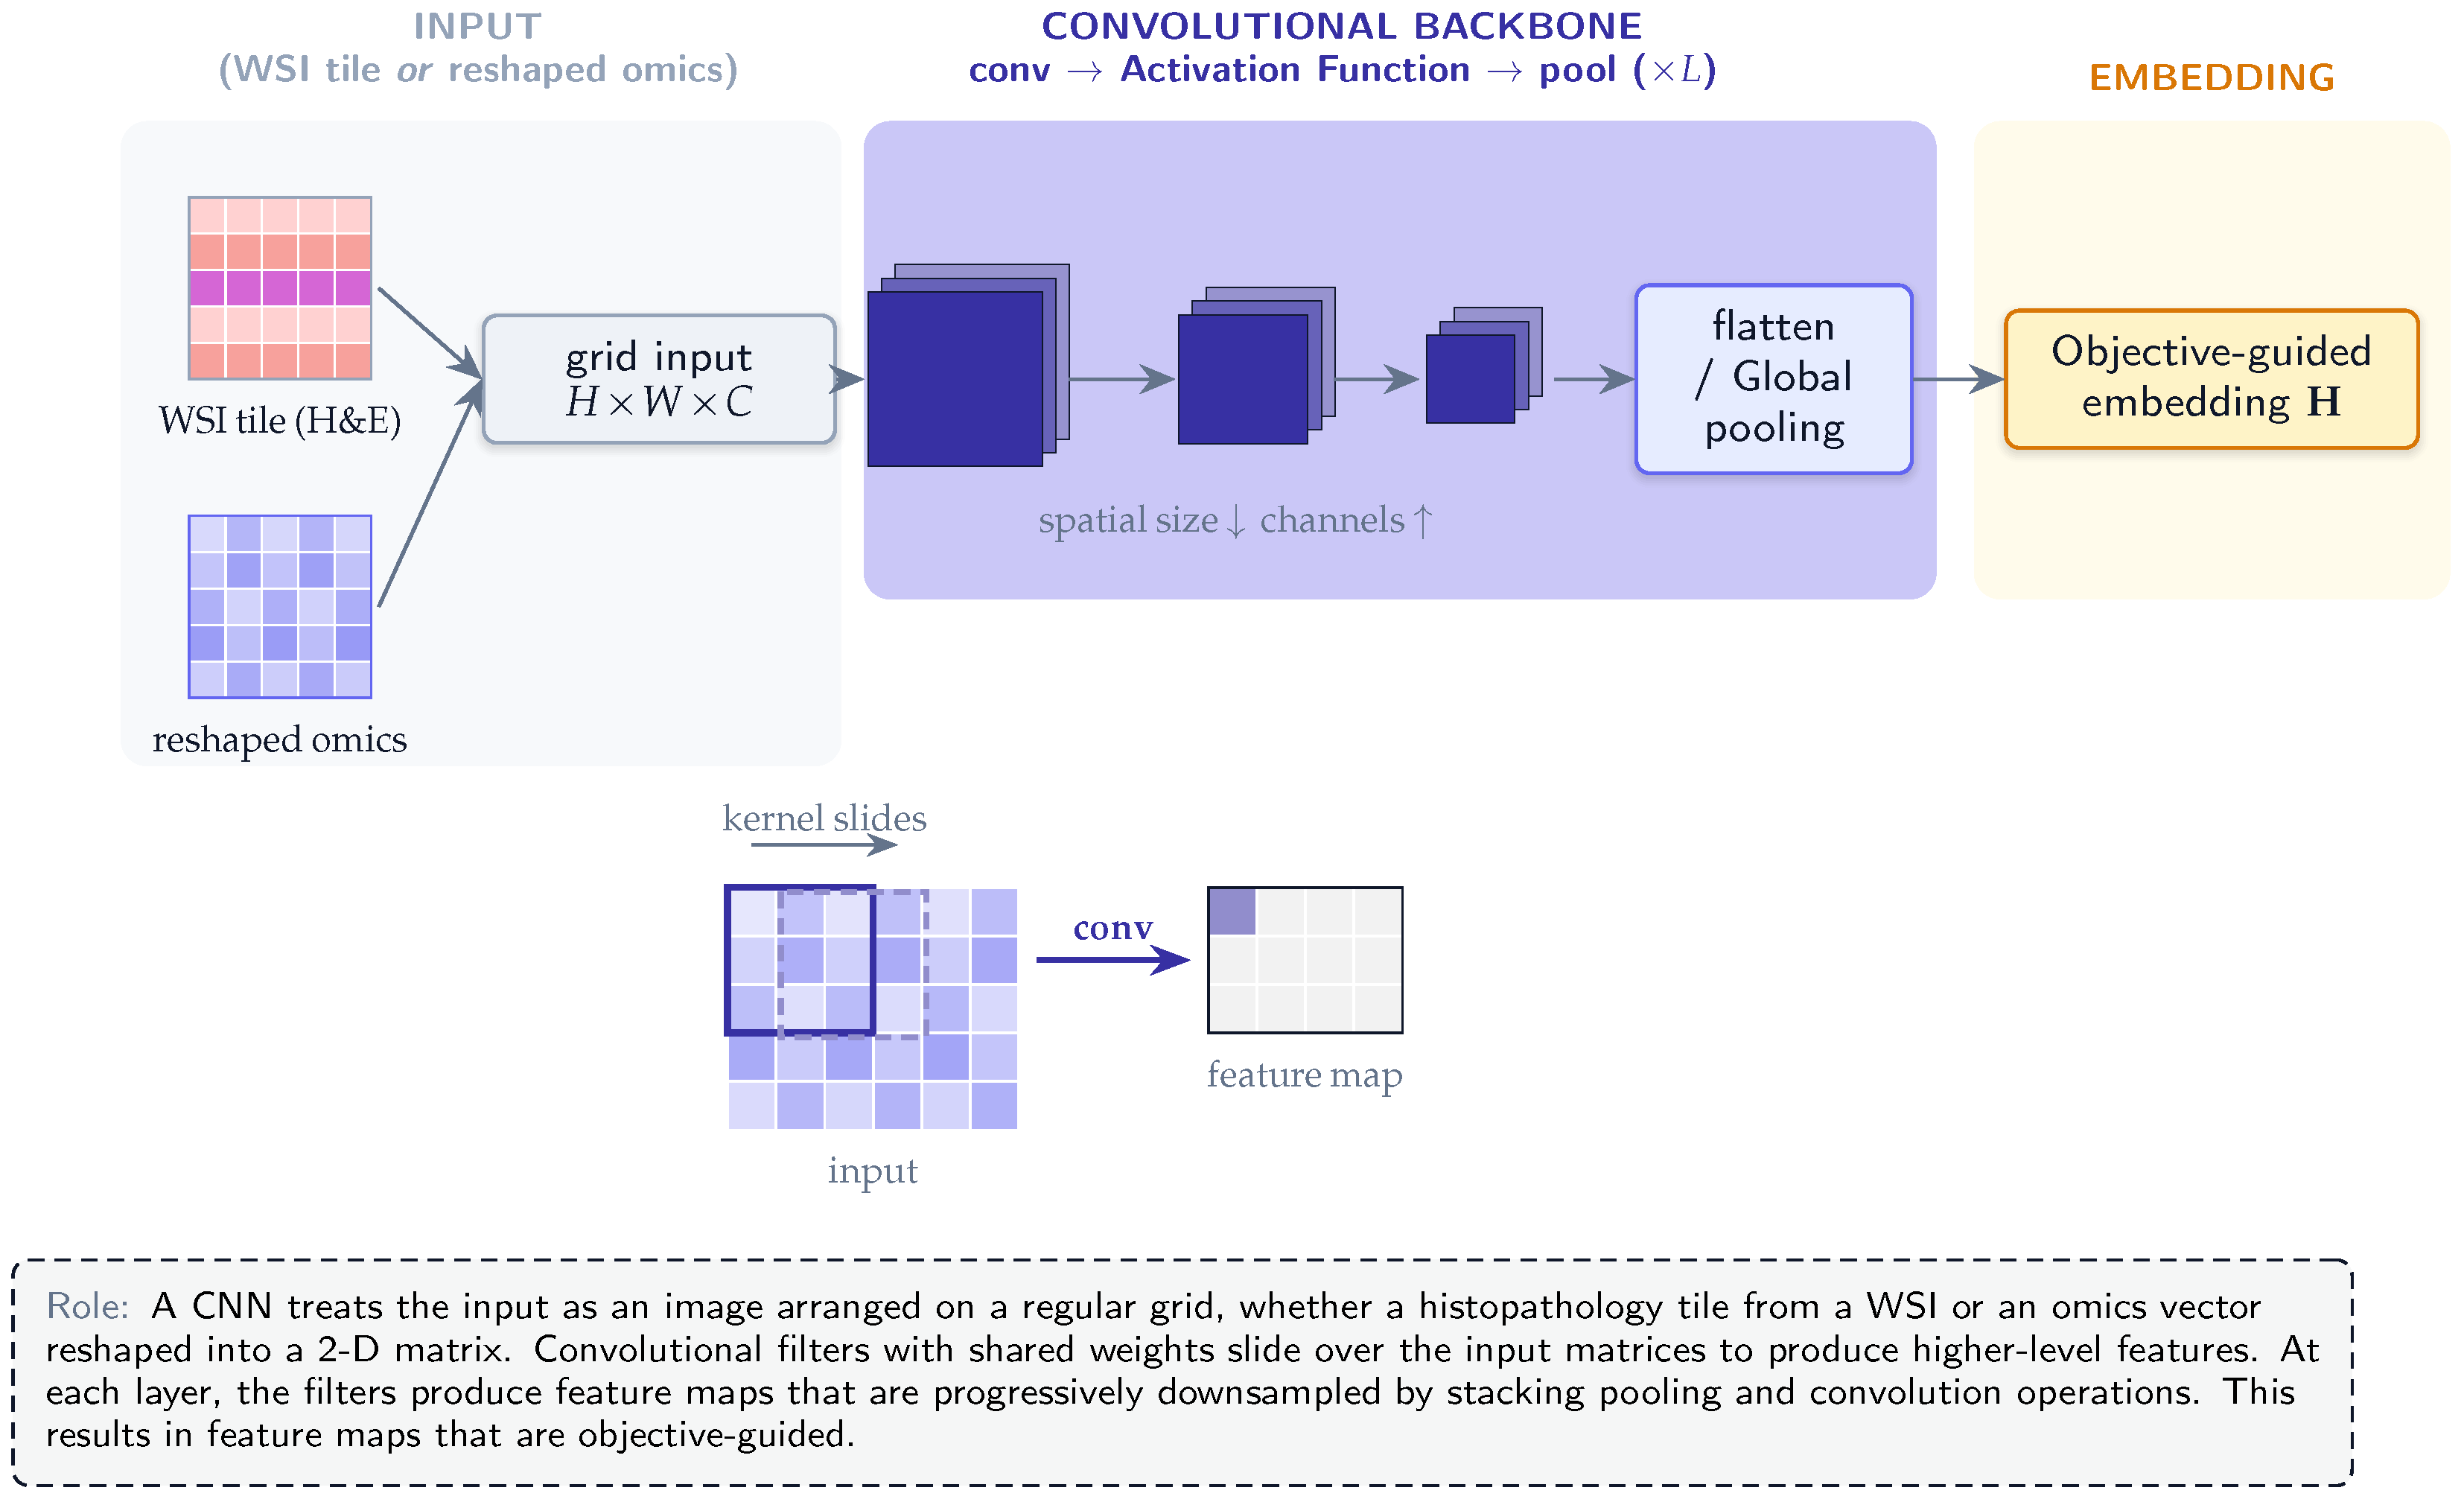
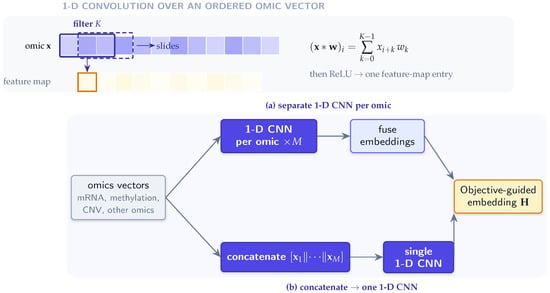
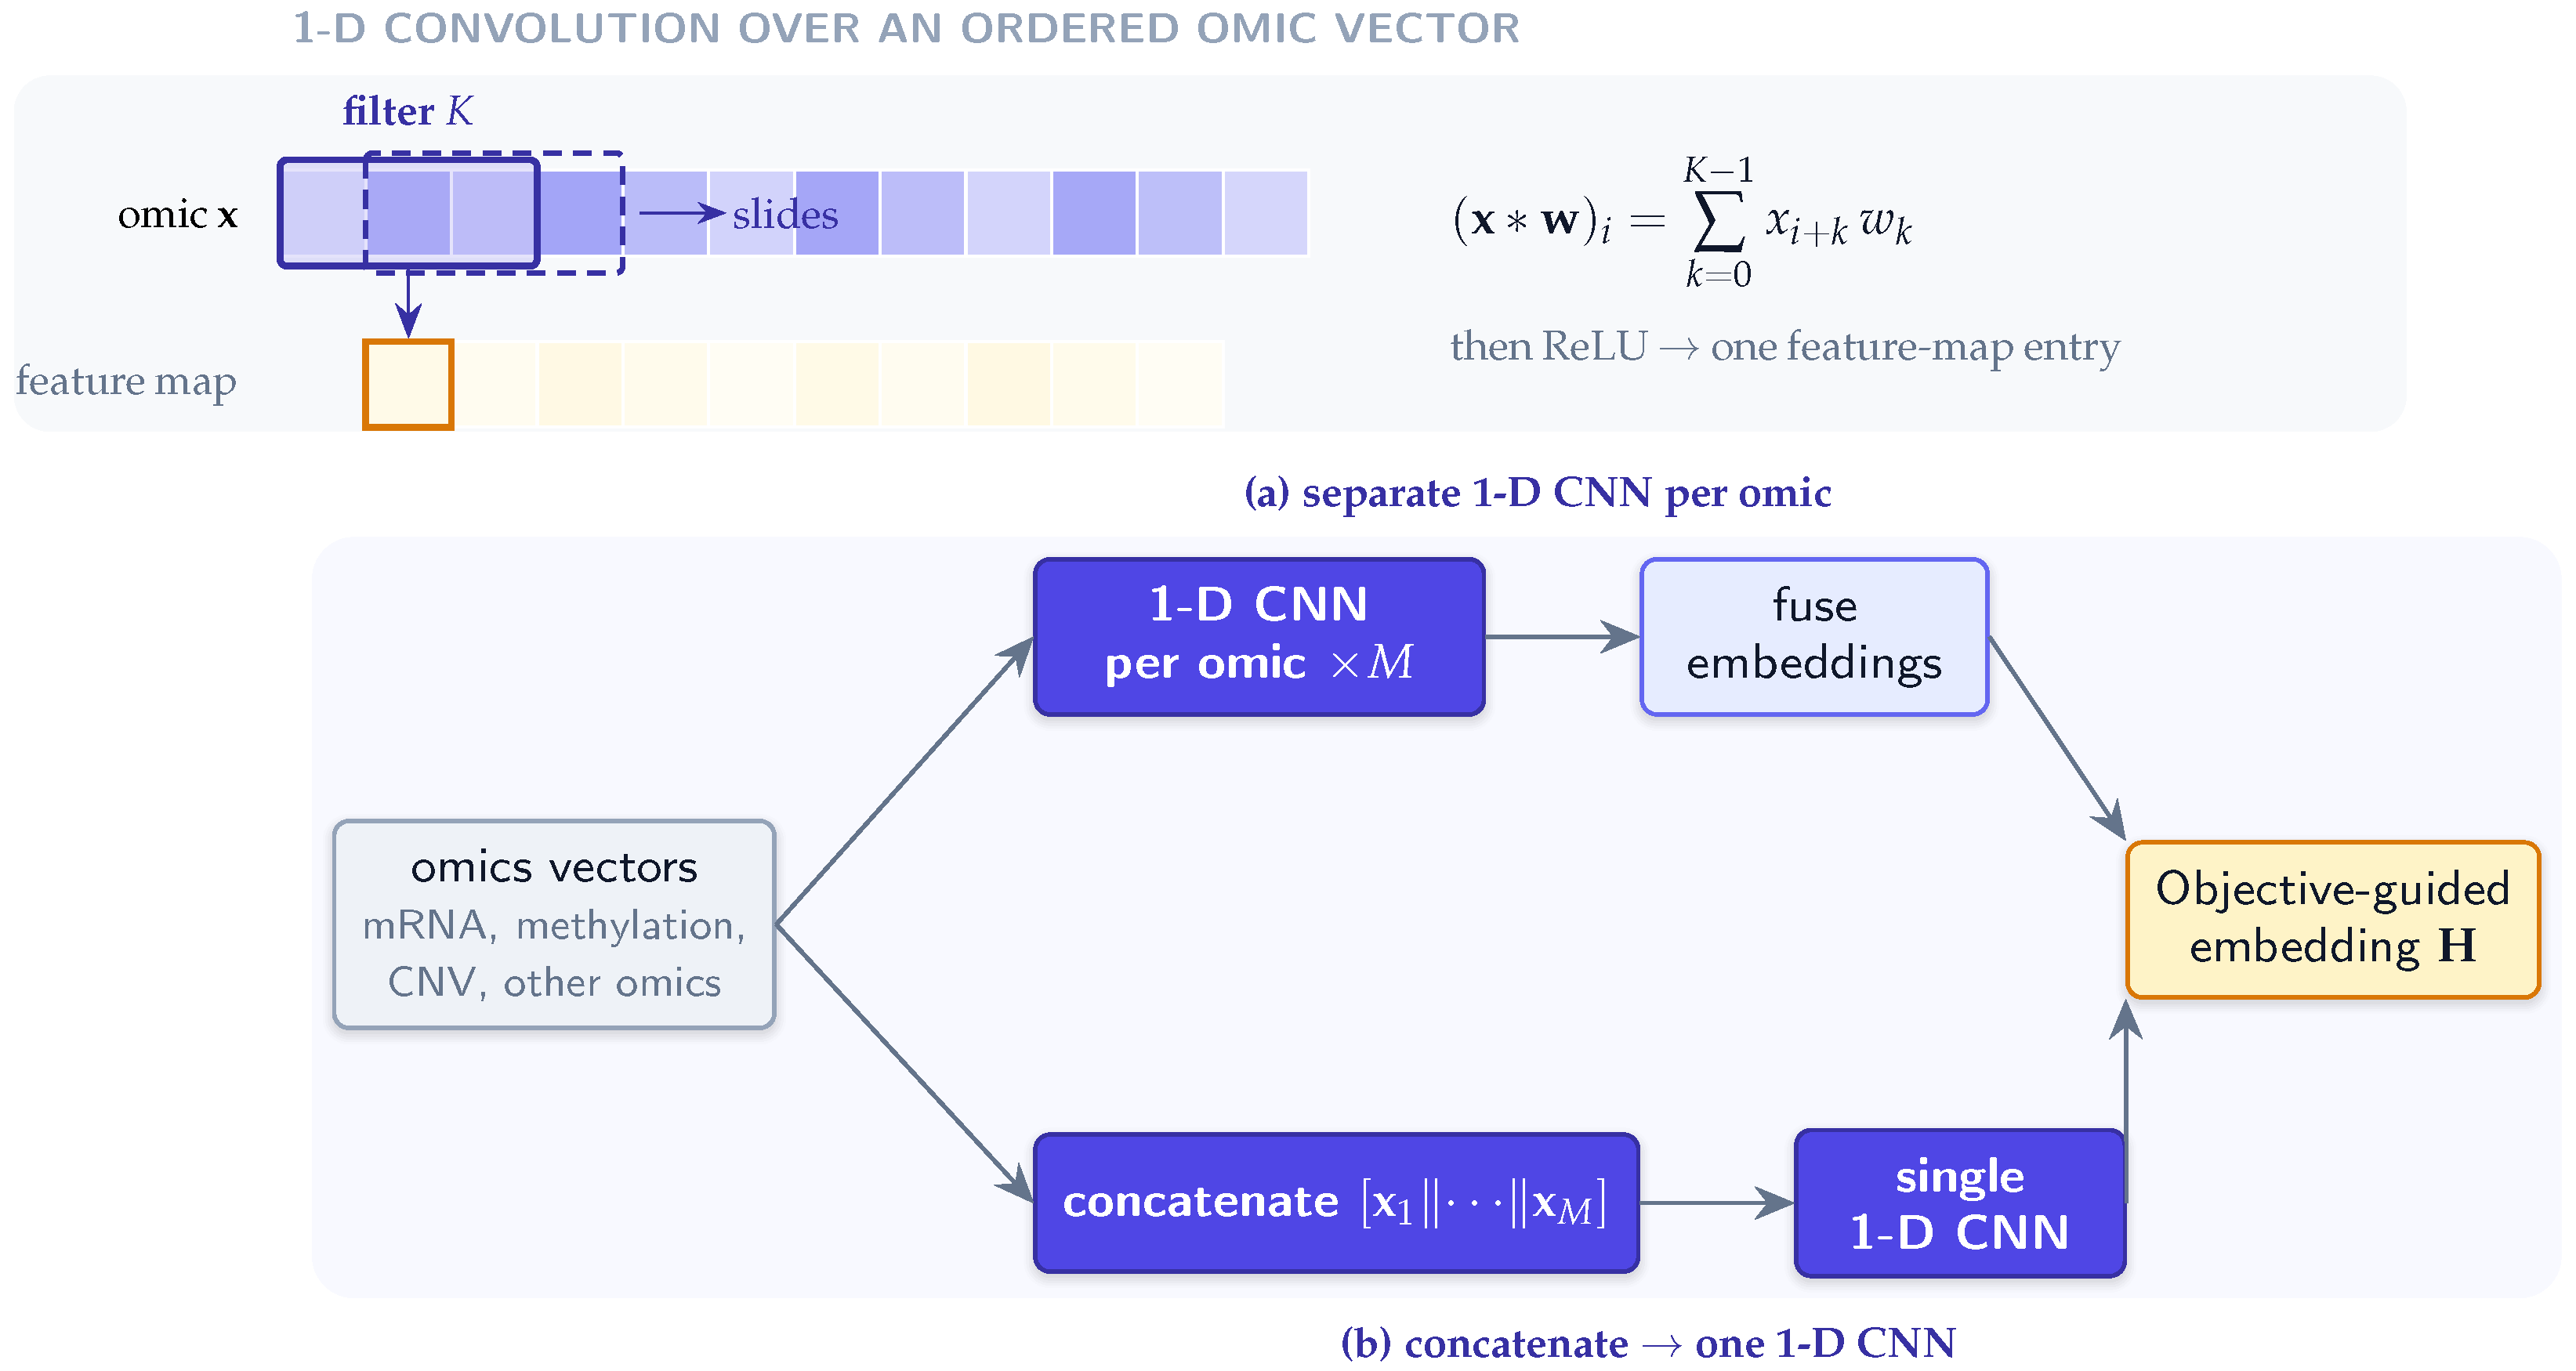
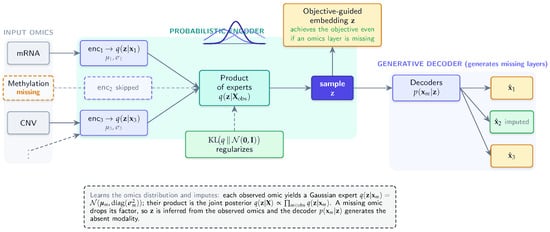
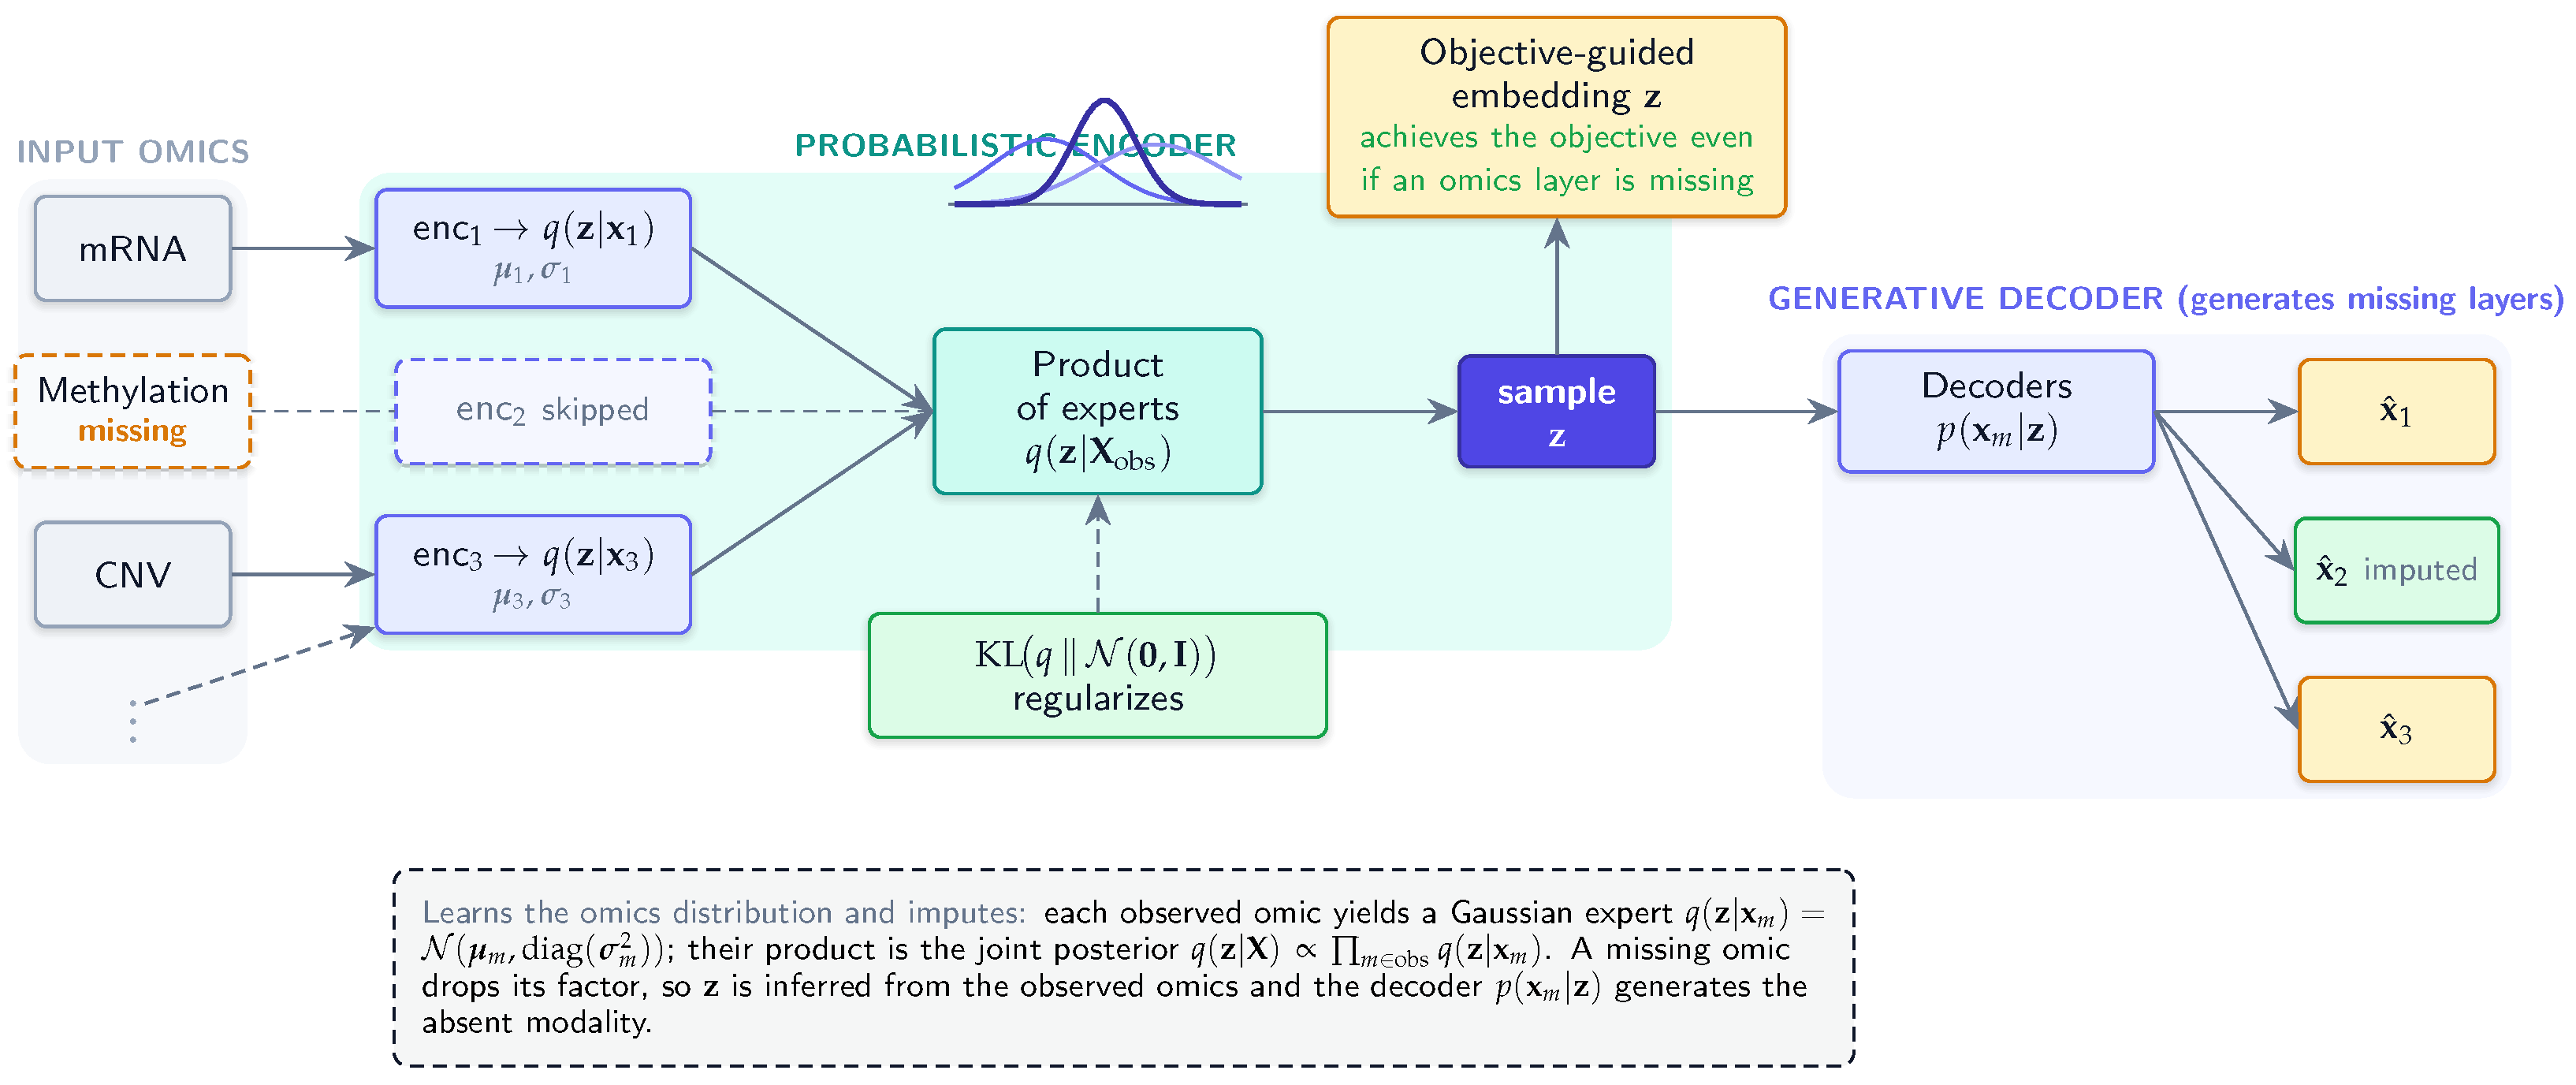
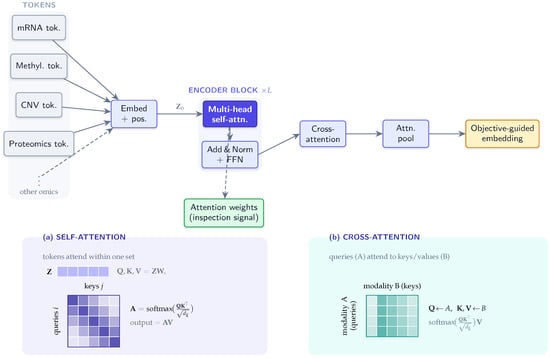
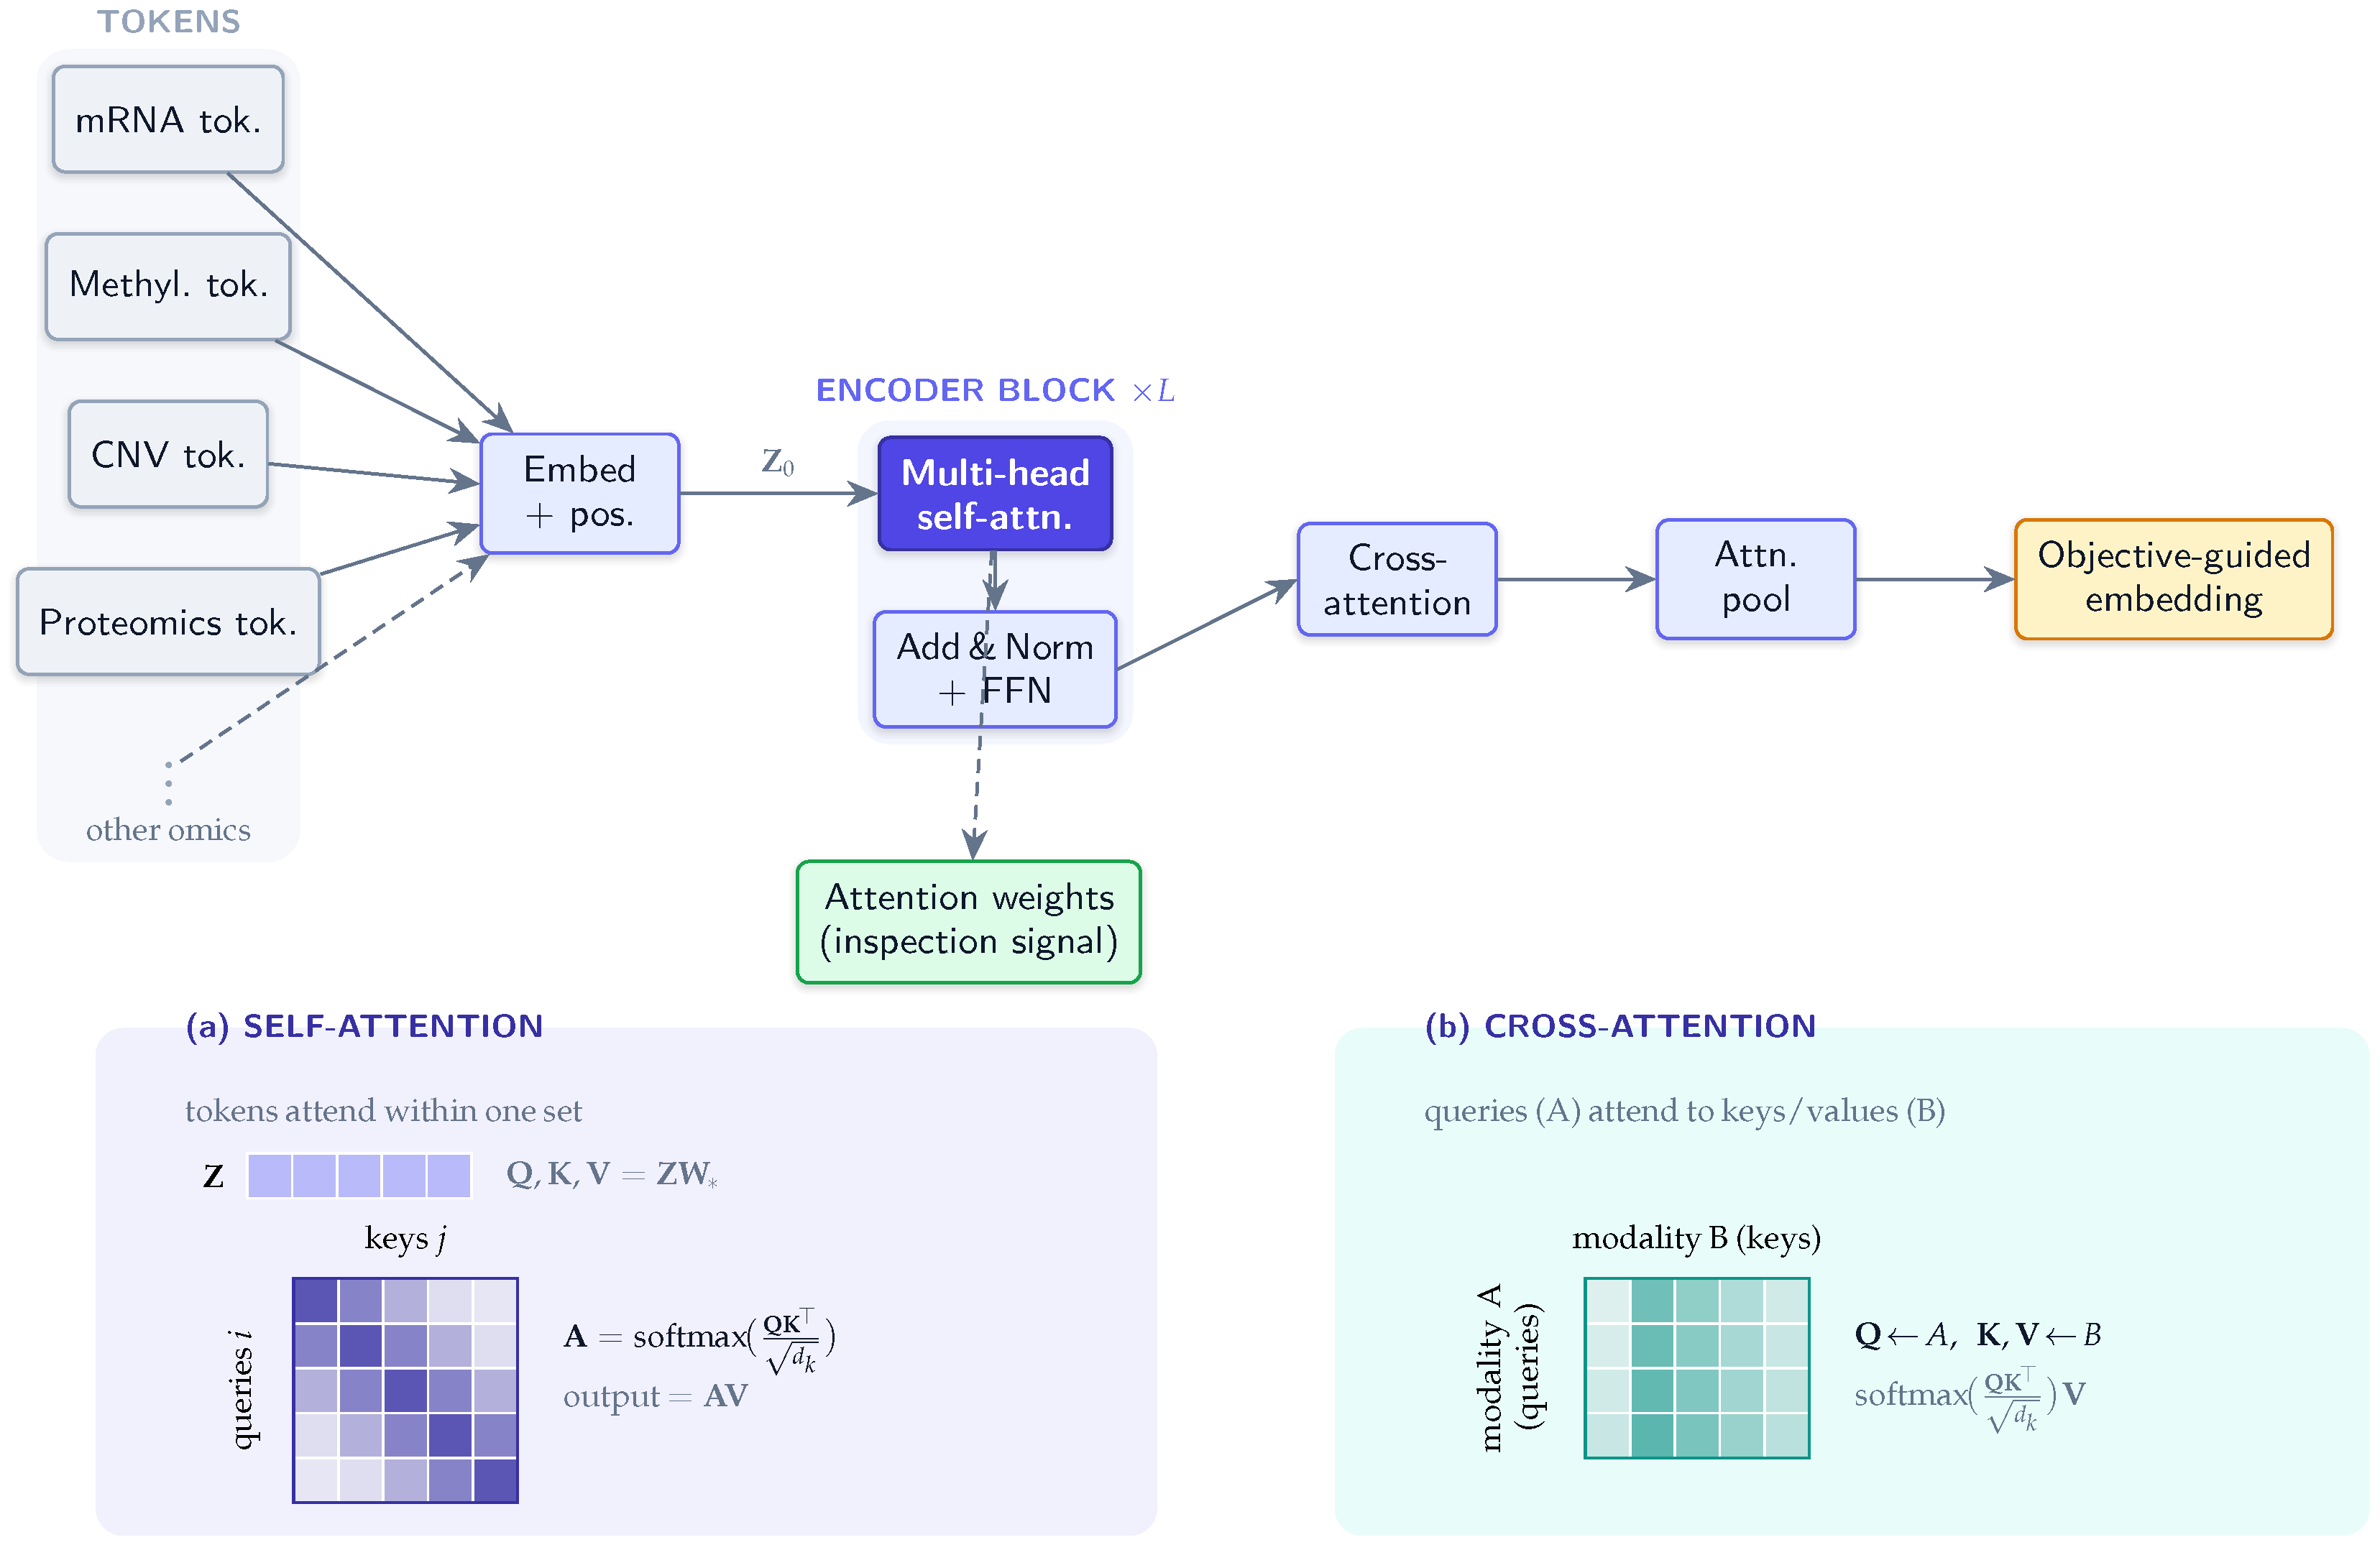
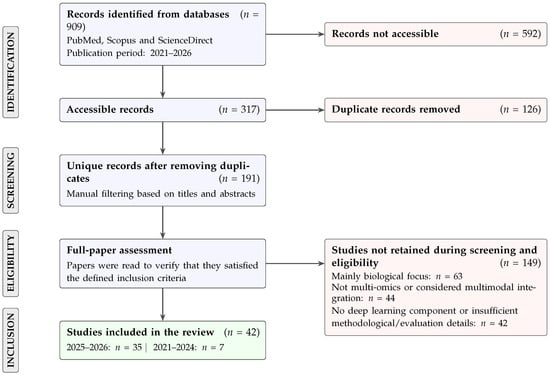
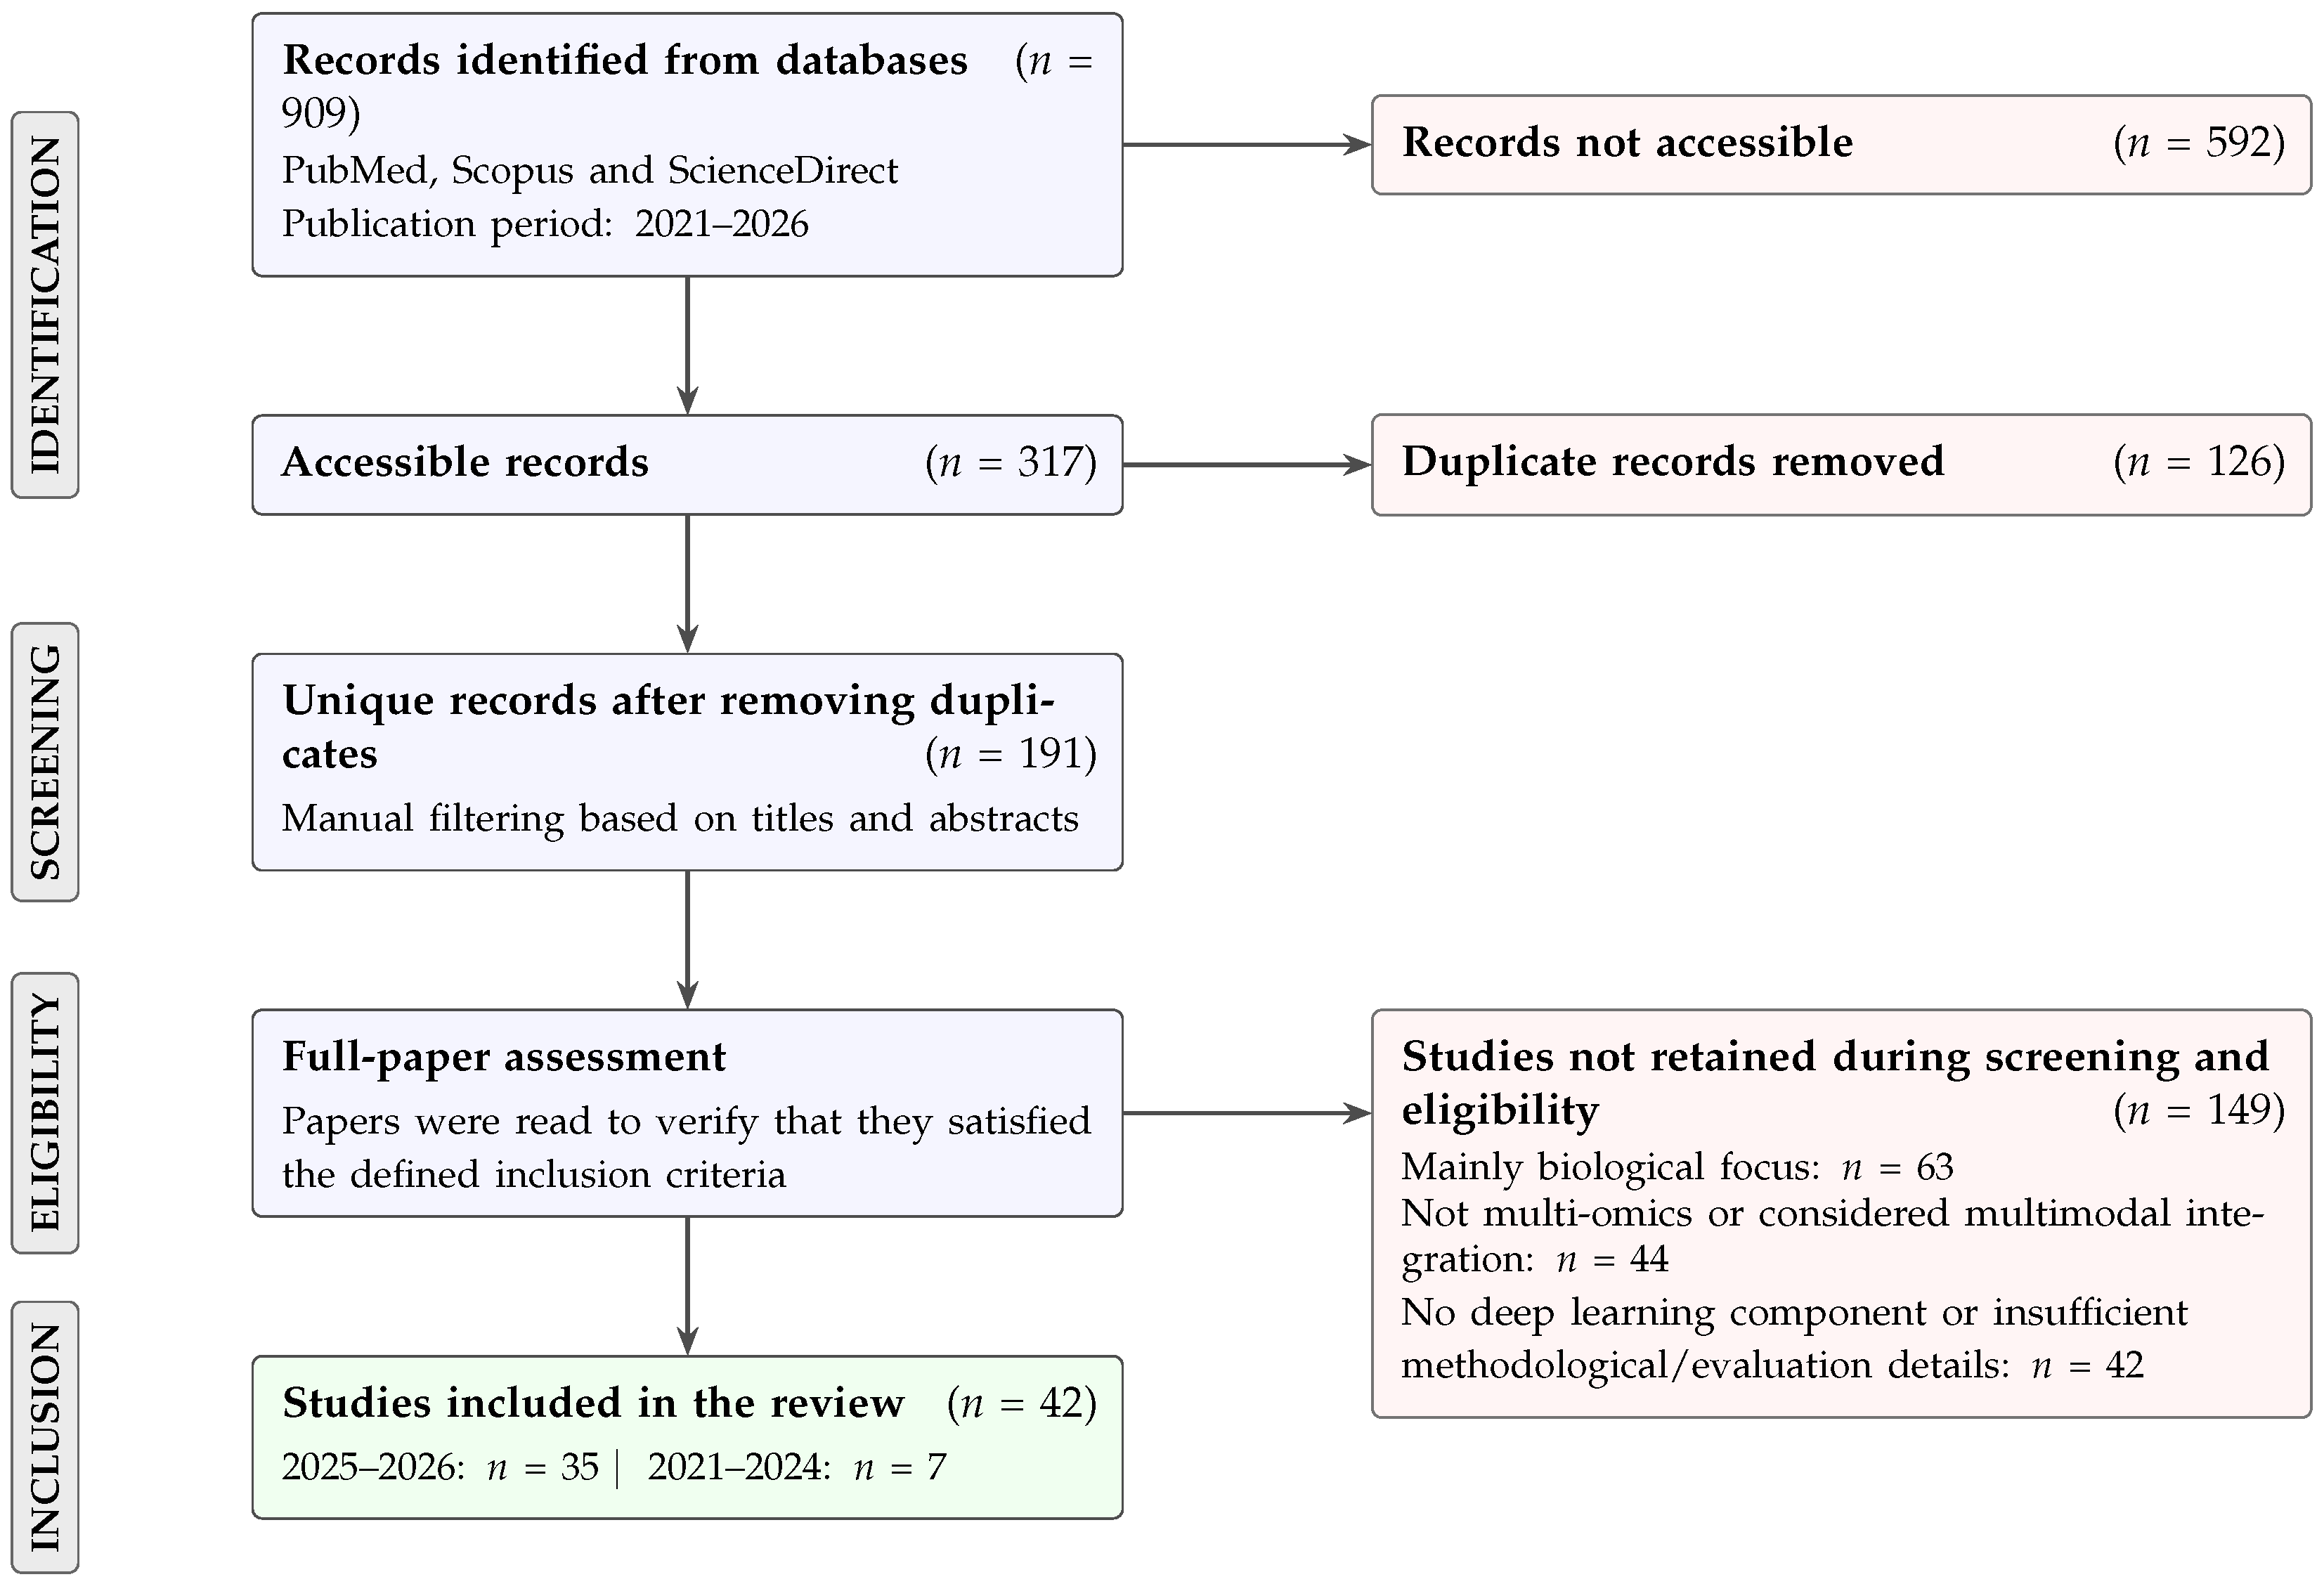
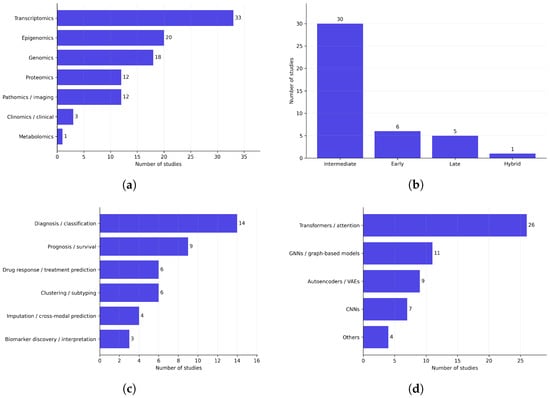
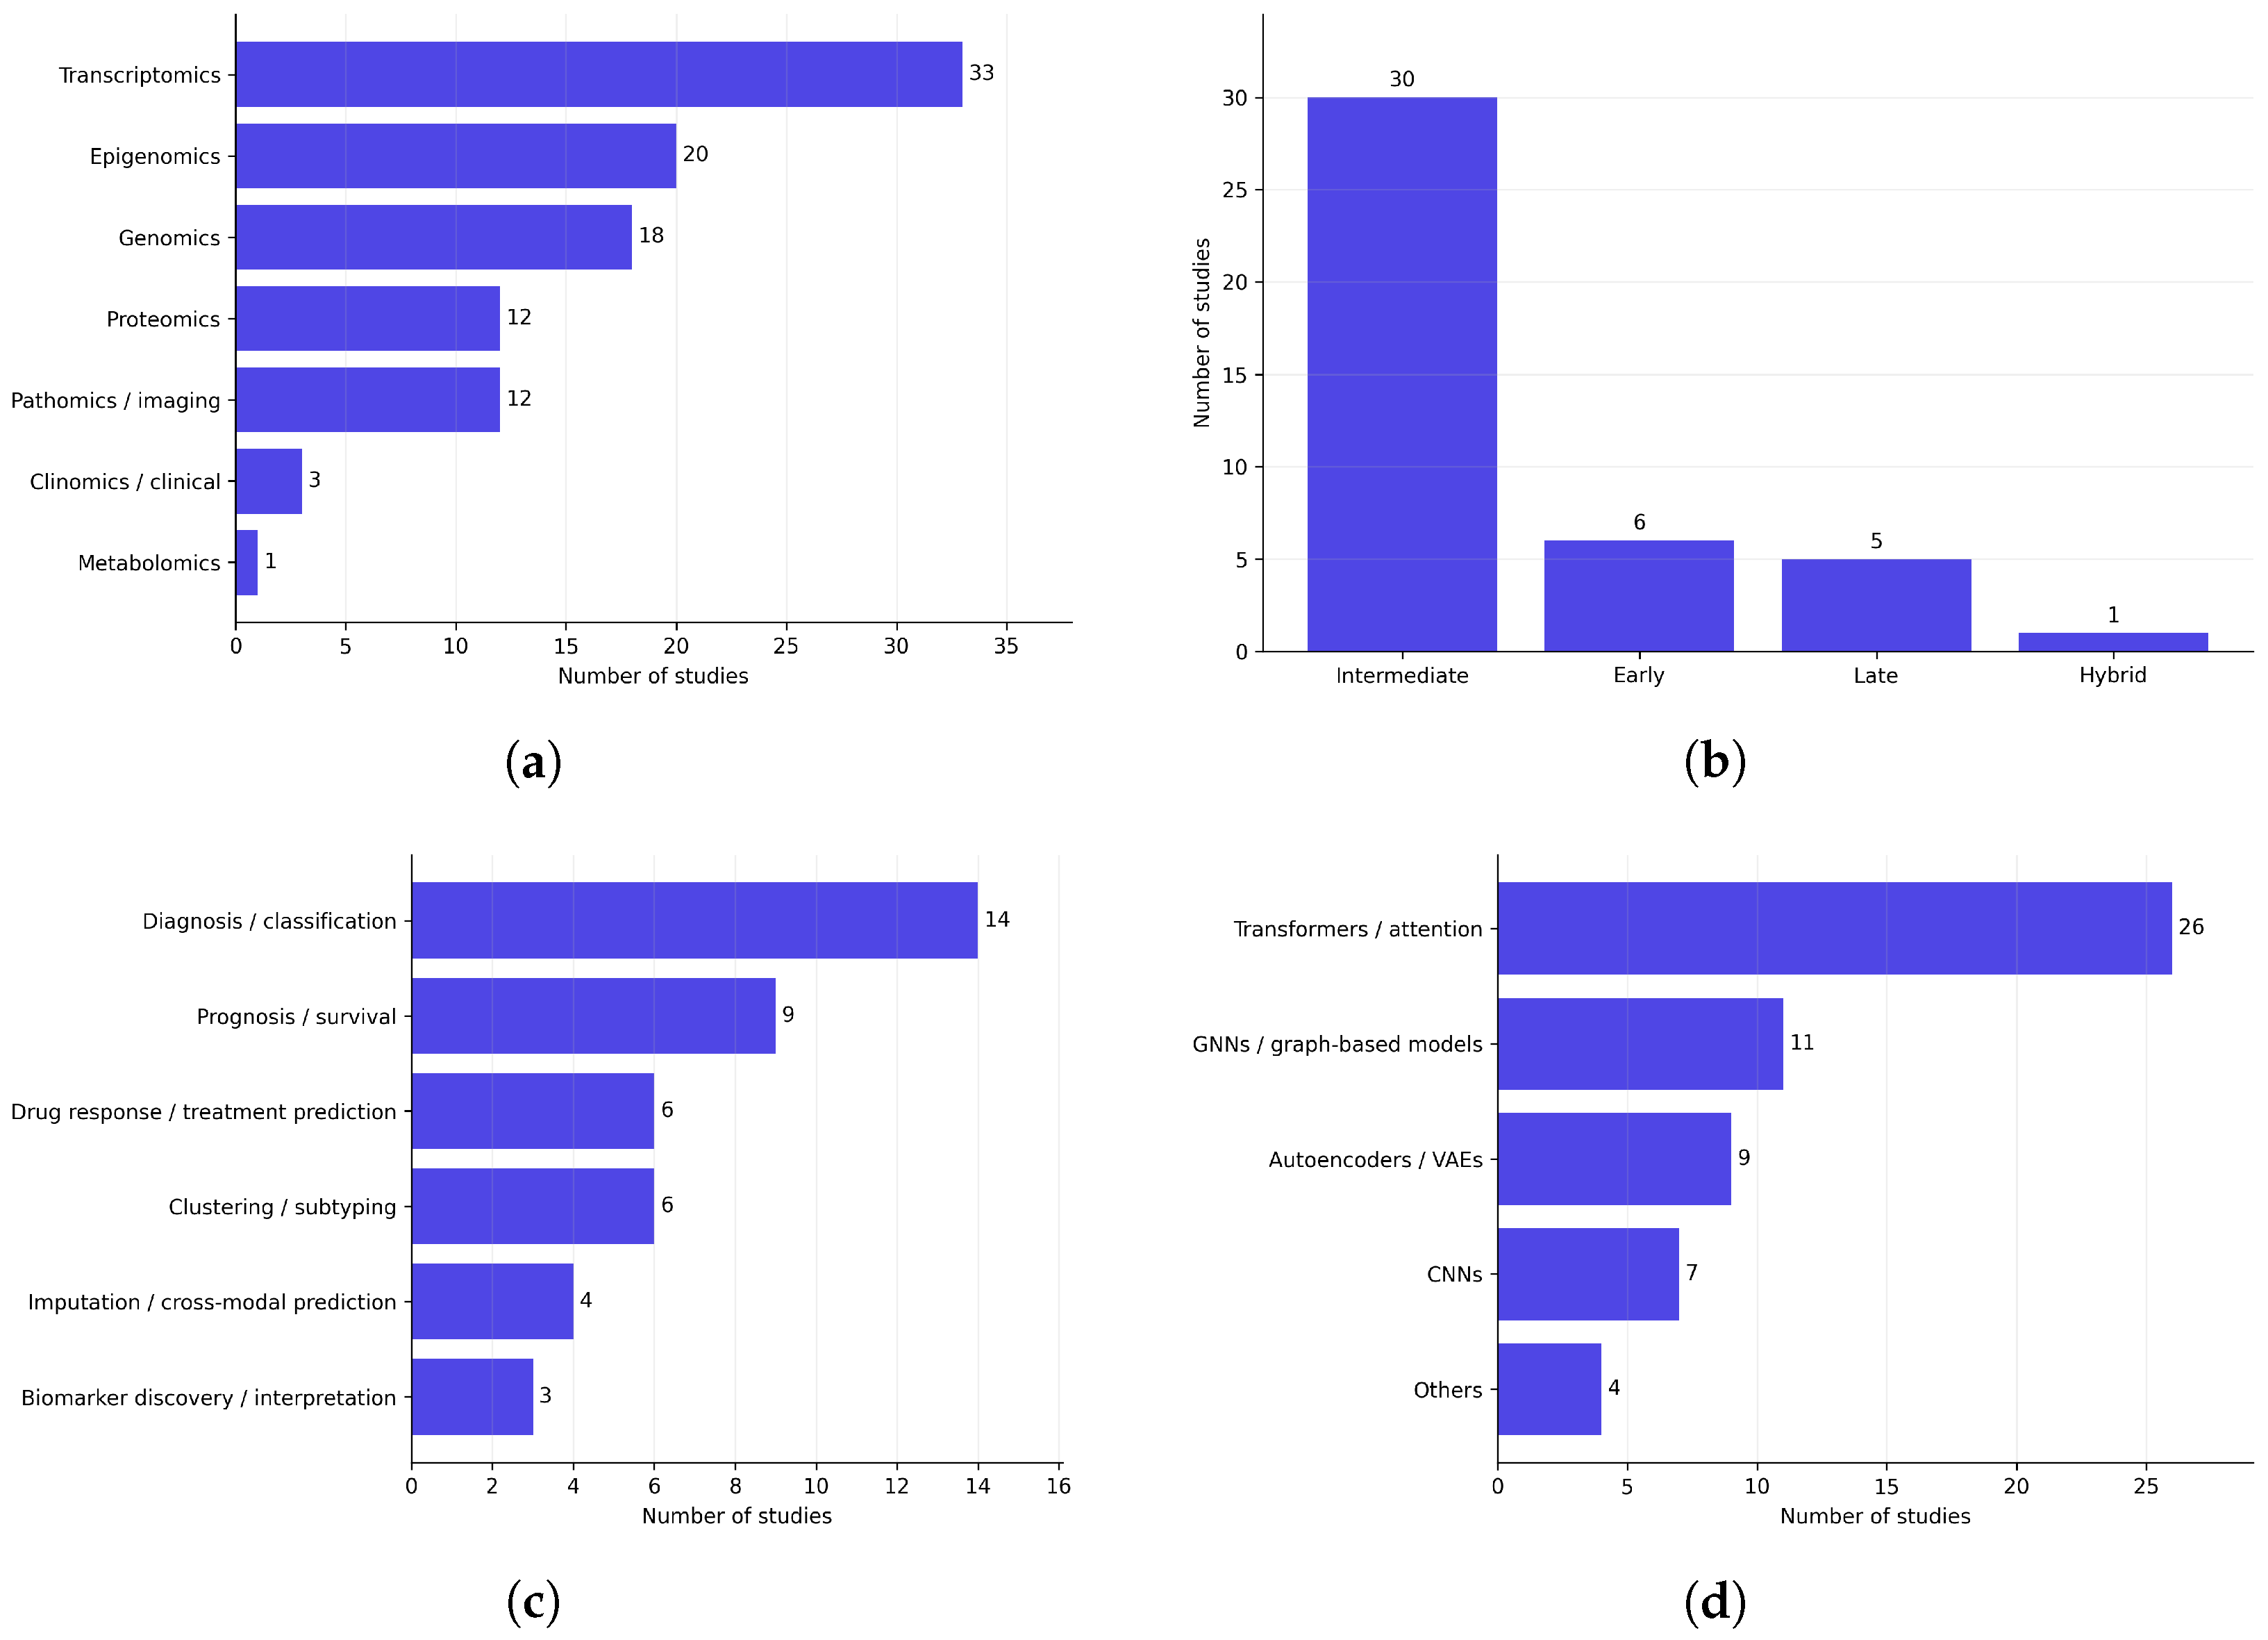
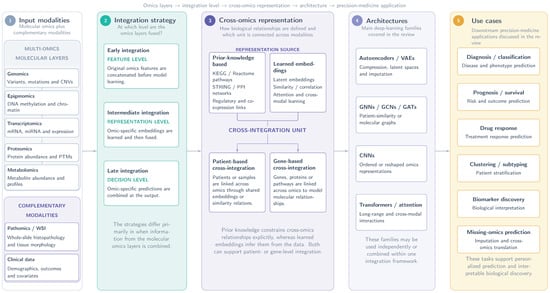
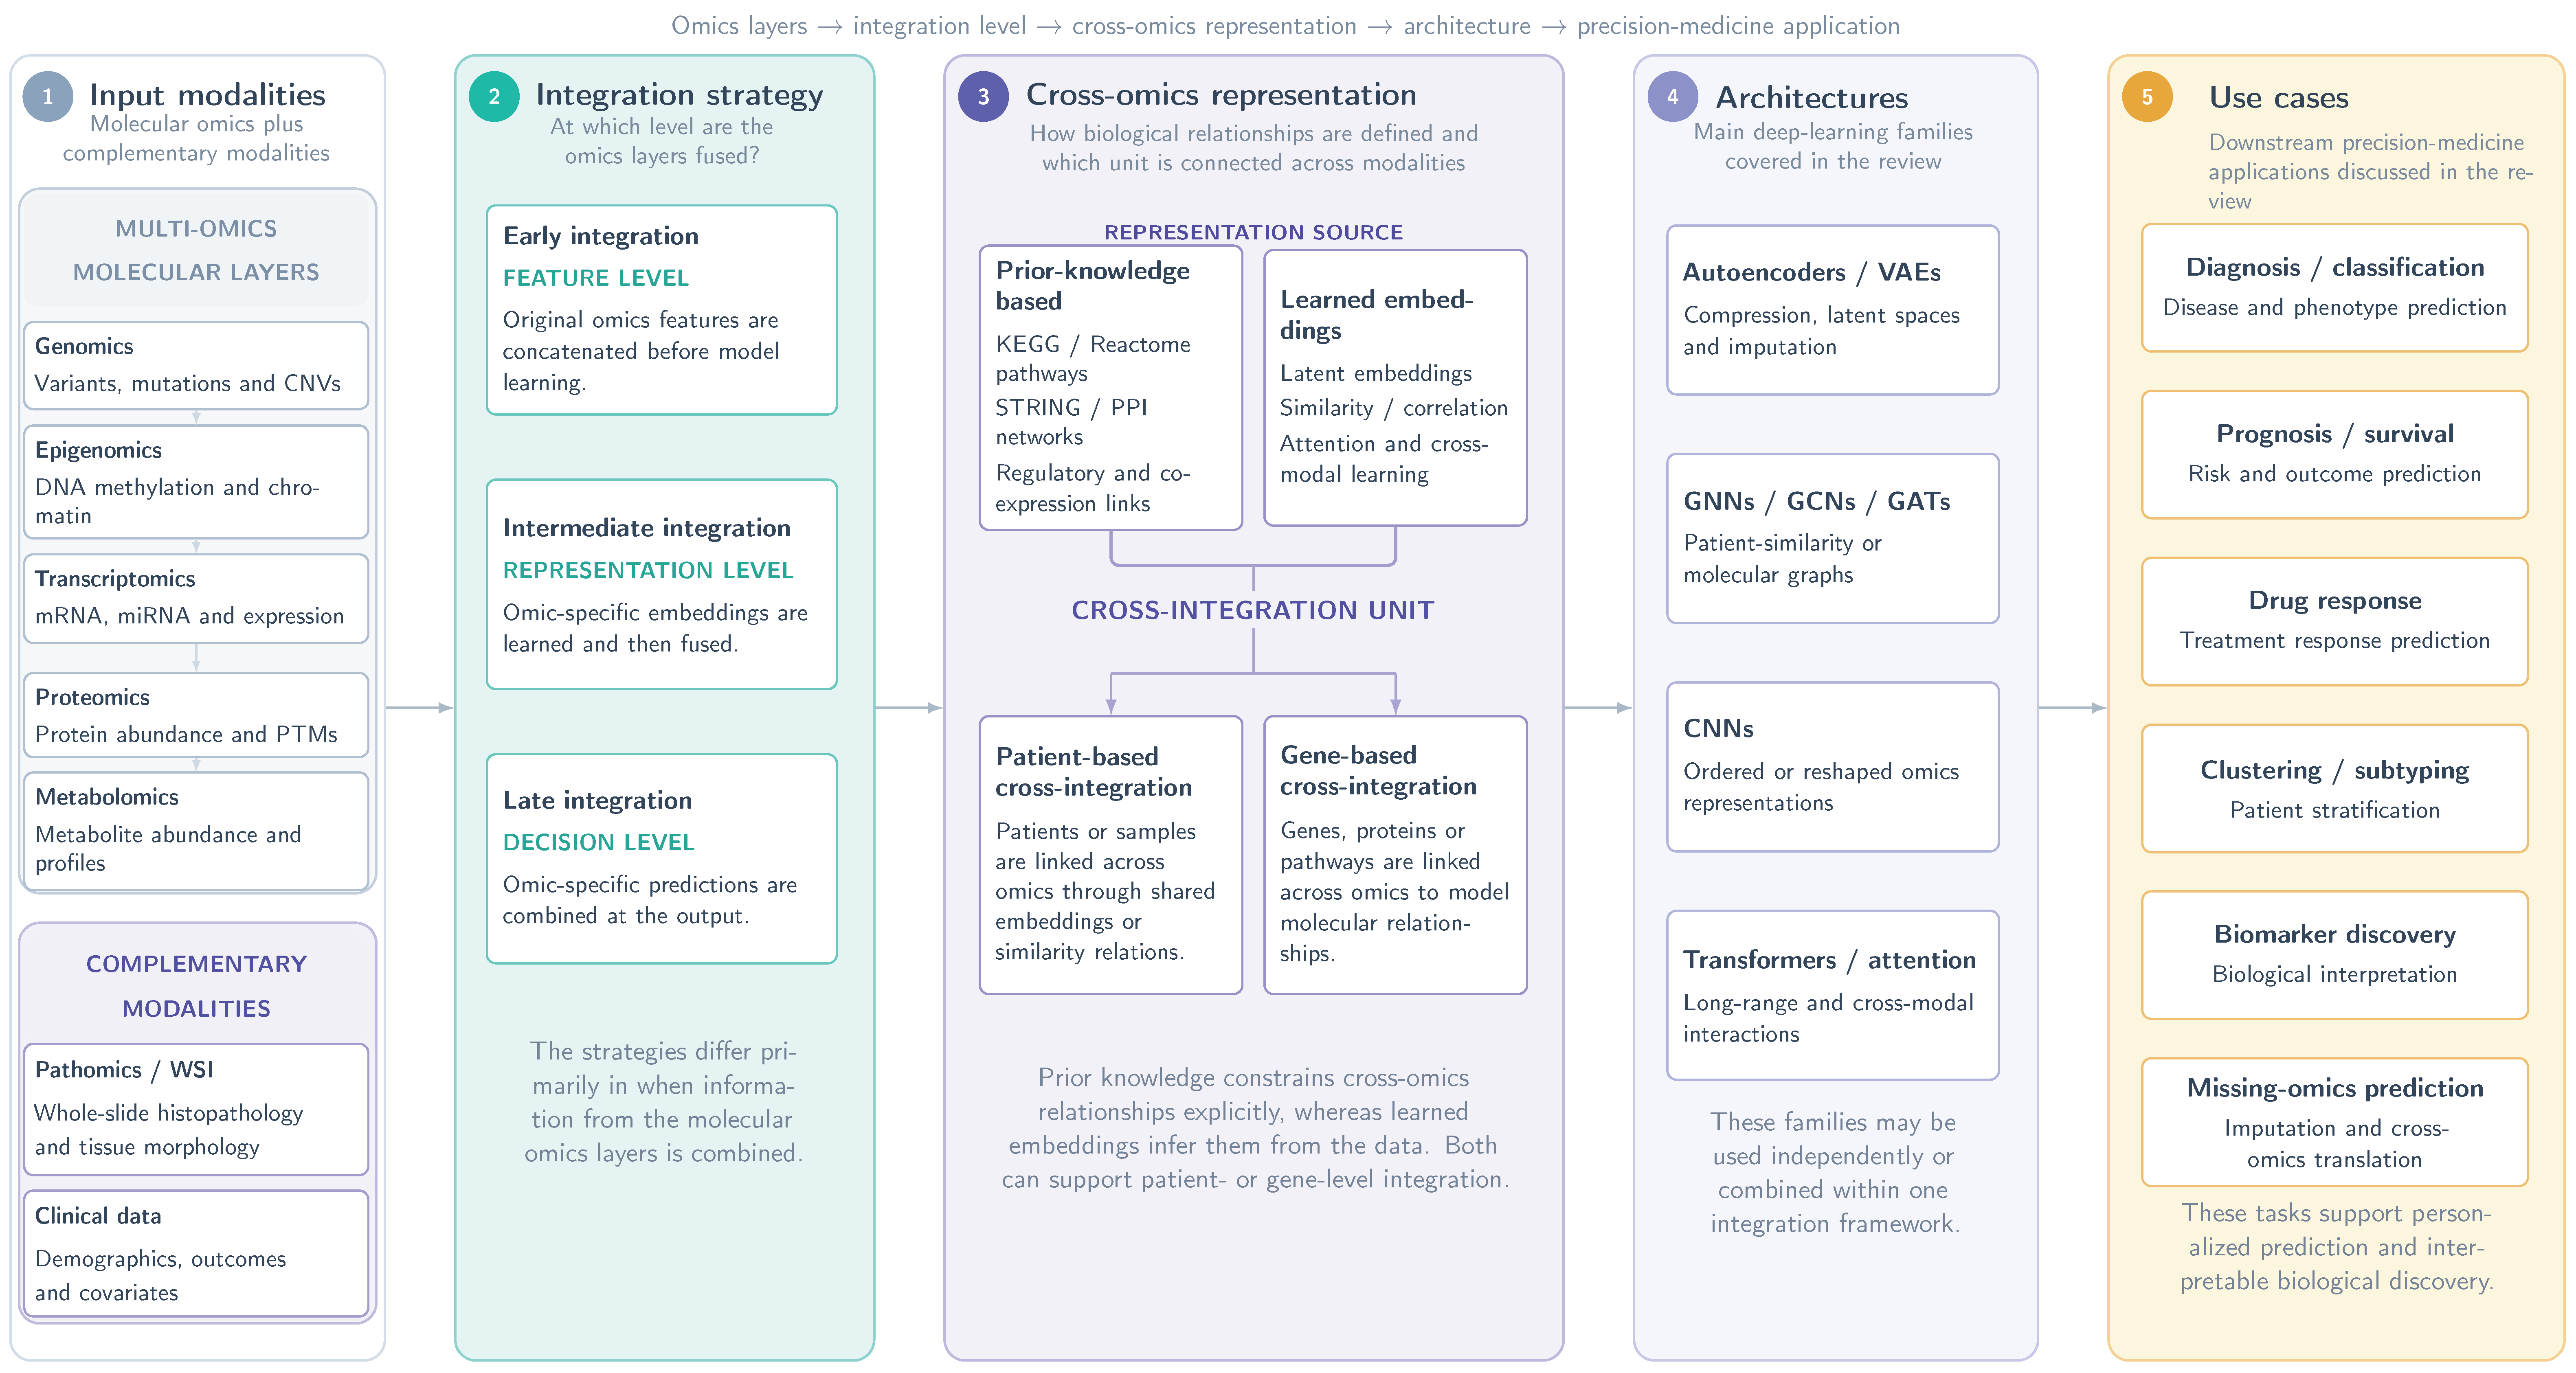

Disclaimer/Publisher’s Note: The statements, opinions and data contained in all publications are solely those of the individual author(s) and contributor(s) and not of MDPI and/or the editor(s). MDPI and/or the editor(s) disclaim responsibility for any injury to people or property resulting from any ideas, methods, instructions or products referred to in the content. |
© 2026 by the authors. Licensee MDPI, Basel, Switzerland. This article is an open access article distributed under the terms and conditions of the Creative Commons Attribution (CC BY) license.