


Abstract
An analysis of the distribution and co-occurrence patterns of targeted virulence determinants in Streptococcus agalactiae (Group B Streptococcus; GBS) was conducted. This study employed a cost-efficient methodology that integrates PCR with statistical evaluation to examine the prevalence of virulence genes responsible for adhesion, immune evasion, and toxin activity across 407 GBS isolates. The virulence genes were characterized based on their distribution across various specimen sources, capsular serotypes, and two time periods. A statistical analysis of the virulence patterns was conducted using pairwise odds ratio matrices, facet bar charts, and a multi-annotated matrix, with Benjamini–Hochberg false discovery rate correction, the cophenetic correlation coefficient, and the Davies–Bouldin index applied throughout the process. As a result, we demonstrated the genotypic co-occurrence of genes associated with invasiveness (hvgA, hylB, and PI-2b) and biofilm formation (PI-2a and fbsB), and presented the prevalence of potential vaccine candidates (pilus variants and scpB) alongside specific genes utilized in phenotypic laboratory tests (cfb and cylE). We identified distribution differences across the studied periods and correlations between virulence genes and serotypes. In conclusion, our research demonstrated that the integration of accessible PCR-based screening with advanced statistical analyses offers an approach for virulence surveillance in resource-limited settings.
1. Introduction
Streptococcus agalactiae (Group B Streptococcus; GBS) is a Gram-positive, facultative anaerobe that primary resides the gastrointestinal and genitourinary tract of human and some animals. Culturally, it is fastidious, exhibiting a narrow zone of beta-hemolysis on blood agar; however, non-hemolytic strains are also present posing diagnostic challenges [1,2]. In individuals with a compromised immune system, colonizing microorganisms have the potential to cause various invasive diseases. The infection-causing ability of GBS is linked to their adhesion, colonization, biofilm formation, evasion of the host’s immune response, and crossing of tissue barriers. The expression of multiple virulence factors promotes the survival, tissue damage, and dissemination of the bacteria within the macroorganism [3]. The virulence factors of GBS can be categorized according to their functions: adhesion-associated, related to bacterial immune evasion, and involved in bacterial invasion. Additionally, they can be divided according to their location, as associated with the cell wall or as released from the cell, including a wide range of enzymes and toxins [4,5].
The capsule polysaccharide, which defines ten distinct GBS serotypes, is an essential structure that helps in evading the immune system through antigen mimicry, prevents opsonization and activation of the complement system, and contributes to biofilm formation [6,7,8]. However, variations in the capsule structure alone do not fully explain the complex tissue tropism and the diverse clinical outcomes observed in GBS disease. In order to enhance adhesion to the extracellular matrix and basement membranes of cells, GBS expresses several families of surface-associated proteins and lipoproteins [9]. This includes fibrinogen-binding proteins (FbsA and FbsB), a laminin-binding protein (Lmb), hypervirulent adhesin (HvgA), alpha-like proteins, streptococcal C5a peptidase (ScpB), and pili. The pili consist of subunits that are encoded by specific genomic regions known as pilus islands (PI). Among GBS isolates, three variants have been identified: PI-1, PI-2a, and PI-2b [5]. The streptococcal C5a peptidase (ScpB) inactivates the C5a component of the complement system and facilitates bacterial adhesion to fibronectin, while the hypervirulent adhesin favors the spread of bacteria into the bloodstream and central nervous system [10,11]. An additional factor that contributes to invasion and dissemination is the enzyme hyaluronidase, which is encoded by the hylB gene. The beta-hemolysin/cytolysin, which is encoded by the cylE gene, along with the Christie–Atkinson–Munch-Peterson (CAMP) factor, encoded by the cfb gene, are toxins responsible for beta-hemolysis and the diagnostic CAMP test, respectively [2,12]. The aforementioned factors establish GBS as an opportunistic pathogen and the leading causative agent associated with severe neonatal infections, including sepsis, meningitis, and pneumonia, as well as significant morbidity among pregnant women and immunocompromised adults [13,14].
In modern microbiology, the examination of the pathogenic characteristics of GBS requires the application of accessible screening tools alongside biostatistical analysis. The Polymerase Chain Reaction (PCR) is a fundamental molecular technique, enabling the cost-effective, highly sensitive, and accurate detection of specific gene targets. When paired with reliable statistical methods, PCR data can accurately delineate virulence and resistance co-occurrence patterns [15,16,17]. Detailed analysis of PCR data requires the application of statistical analysis paired with computational visualizations. Heatmaps provide a strong two-dimensional visual matrix that connects individual bacterial isolates to their associated genes. By using distinct color gradients to represent the presence, absence, or co-carriage patterns of genes, heatmaps facilitate the immediate identification of trends and tissue tropism [18,19,20]. In addition, mathematical partitioning is integrated with these heatmaps to organize individual strains into distinct groups by calculating statistical distances based on shared matrix configurations. This alignment facilitates the identification of co-occurrence patterns among the studied isolates [21,22].
The aim of this study is to develop a detailed strategy for monitoring virulence factors through PCR screening, combined with applied biostatistical methods. Our research evaluated the virulence determinants of GBS, tracking their prevalence and associations using heatmaps and adjusted odds ratio analysis to identify co-occurrence patterns and facilitate the descriptive characterization of these genetic targets.
2. Materials and Methods
2.1. Specimen Collection
During routine diagnostics, 407 non-duplicate strains of GBS were isolated. The specimens were obtained from two university hospitals located in Sofia city (University Multiprofile Hospital for Active Treatment (UMHAT) “Acibadem City Clinic Tokuda” and UMHAT “Aleksandrovska”) and one hospital in Pleven city (UMHAT “Georgi Stranski”), Bulgaria, between September 2021 and April 2026. In accordance with our ethical statements, all personal identifiers were removed, allowing only information regarding patient age (reported as age range and mean age) to be extracted. Isolates were collected through a sampling approach, where the eligibility criteria were established at the discretion of the attending physicians during routine examinations, ensuring that only specimens from verified symptomatic infections were included.
The samples were classified into two groups based on their source. The first group comprised vaginal specimens (n = 277, 68.1%) obtained from patients with genital infections, in which GBS was isolated as a leading pathogen in aerobic vaginitis or as a co-infectious agent in bacterial vaginosis. The second group consisted of extra-vaginal specimens (n = 130, 31.9%) divided into two sub-groups: invasive specimens (n = 66, 50.8%) collected from typically sterile locations, including soft tissue wound aspirates, blood cultures, tracheal aspirates, and ear fluid aspirates, and non-invasive samples (n = 64, 49.2%), encompassing urine, sperm fluid, and eye discharge.
In order to analyze the variation in co-occurrence patterns over time, the entire bacterial collection was divided into two distinct periods: Period 1, which includes the first two years and four months from September 2021 to December 2023 (n = 218, 53.6%), and Period 2, which includes the subsequent two years and four months from January 2024 to April 2026 (n = 189, 46.4%). To address the potential statistical instability that could result from the uneven temporal distribution of isolates, especially considering the partial calendar years of 2021 and 2026, a year-by-year analysis was avoided. To ensure that distribution differences were not confounded by variations in specimen type, a Chi-square test was performed: the difference in the proportions of vaginal versus extra-vaginal isolates between Period 1 and Period 2 exhibited no statistical significance (p > 0.05). Consequently, the distribution of specimen types demonstrated consistency across both temporal intervals, confirming temporal variations in gene combinations reflect authentic alternations rather than sample-type interference. From a public health surveillance perspective, the utilization of multi-year timeframes rather than individual calendar years minimized the influence of temporary annual anomalies, including epidemic and pandemic events or localized diagnostic fluctuations.
2.2. Identification of GBS Strains and DNA Extraction
GBS was presumptively identified through Gram-stain morphology and conventional microbiological tests. Serological verification was conducted using the latex-agglutination test (PathoDxtra Strep Grouping Kit ThermoScientific, Oxoid, Basingstoke, UK). When required, automated biochemical systems Phoenix™ M50 (Becton Dickinson, Franklin Lakes, NJ, USA) or Crystal GP (Beckton Dickinson, Kelberg, Germany) were used for further biochemical confirmation.
Extraction of DNA from pure cultures of GBS was performed with the DNA-Sorb A DNA Extraction Kit (Sacace Biotechnologies Srl, Como, Italy), in accordance with manufacturer’s protocols. All DNA extracts were subsequently stored at −70 °C.
2.3. PCR Amplification of the Examined Genes Determinants
The identification through PCR and the determination of GBS serotypes were conducted using primers and reactions conditions as previously described in the literature [23,24,25].
The selection of the GBS virulence genes was based on two criteria: functional diversity and their relevance in global epidemiological trends. To address the potential for selection bias toward a specific specimen type, we included genes representing distinct functional groups, including surface pili variants (PI-1, PI-2a, and PI-2b), additional surface adhesins (hvgA, fbsA, fbsB, and lmb), virulence genes that facilitate immune evasion (scpB and bac), and toxins or enzymes (cylE, cfb, scpB, and hylB) [5]. This ensures that genes involved in adhesion, invasion, and dissemination were represented.
The detection of virulence gene determinants was performed by PCR using primers listed in Table S1 [26,27,28,29,30]. Initial denaturation was carried out at 95 °C for 5 min, followed by 30–35 cycles consisting of denaturation at 95 °C for 30 s, annealing at 52 °C (bac), 55 °C (fbsA and fbsB), 56 °C (cylE), 59 °C (hvgA and cfb), 60 °C (lmb and scpB), 61 °C (PI-2b), 64 °C (PI-1 and PI-2a), and 65 °C (hylB) for 30 s, elongation at 72 °C for 1 min, and final elongation at 72 °C for 5–10 min.
All PCR amplifications were performed using prime Taq premix 2× (Genetbio Co. Ltd., Daejeon, Republic of Korea), followed by gel electrophoresis with GelRed® Nucleic Acid Gel Stain (Biotium, Inc., Fremont, CA, USA). Negative and positive controls included no-template mixtures and S. agalactiae ATCC® 27956™, respectively. The sizes of the PCR products were determined using molecular weight markers: 100–5000 bp DNA Ladder Extended (Carl Roth GmbH, Karlsruhe, Germany) or 100–1000 bp DNA Ladder (Meridian Bioscience, Cincinnati, OH, USA). Visualization of the PCR products was achieved using the InGenius 3 (Syngene, Cambridge, UK) documentation system. To ensure the validity of the data, the expected amplicon band was consistently observed in its designed position throughout independent experiments, while the negative control lacked any artifacts or contamination.
2.4. Statistical Analysis
2.4.1. Hypothesis Testing and Association Analyses
Statistical analyses were performed using R Statistical Software for Windows v4.6.1 (R Foundation for Statistical Computing, Vienna, Austria) within RStudio (v2026.06.0; Posit Software, PBC, Boston, MA, USA). Statistical comparisons were performed using the Chi-square test or Fisher’s exact test (applied when the expected frequency was less than 10). A p-value indicates the unadjusted significance levels related to an individual test. The correction of multiple comparisons was applied using the Benjamini–Hochberg procedure (BH) to control for the false discovery rate (FDR) [31]. A q-value represents a p-value that has been adjusted. Results were considered significant if q ≤ 0.05. To evaluate the strength of association between specific virulence gene combinations, pilus island variants, and the capsular serotypes, odds ratios (OR) along with their corresponding 95% confidence intervals (95% CI) were calculated. For OR, a 95% CI that did not include the null value of 1.0 was considered statistically significant. BH correction was applied independently across seven distinct families of multiple comparisons. Separate corrections were executed to examine the distribution patterns of the 13 targeted virulence genes and pilus combinations in vaginal/extra-vaginal sources (13 hypotheses), invasive/non-invasive specimens (13 hypotheses), and study periods (13 hypothesis). In addition, independent test families examined the total pilus islands gene determinants (derived from the sum of the respective PI genes, which are presented separately or in combinations) within the aforementioned categories (3 hypotheses each) were conducted. For the virulence determinants and serotype associations, a single family of 72 hypotheses was executed.
2.4.2. Gene Association Matrices
In order to visualize the gene distribution patterns, the binary presence/absence matrices of bacterial species were log-transformed into pairwise OR matrices. Subsequently, a heatmap was automatically generated within the RStudio environment using the pheatmap package. As a result, 13 × 13 square matrices (vaginal, extra-vaginal, Period 1, and Period 2) were generated by computing the paired OR for each target locus. To stabilize variance estimates and to avoid computational artifacts during calculations involving high-frequency genes, the Haldane–Anscombe correction was applied to each matrix [32,33]. The log-transformed OR values were subjected to unsupervised grouping based on Euclidean distance and complete-linkage method. Furthermore, the cophenetic correlation coefficient (CCC) was calculated to evaluate the preservation of pairwise distances. The stability of partitions across both axes was assessed using the Davies–Bouldin index (DBI) to determine the mathematically optimal number of virulence gene groups (k). It should be noted that although a high CCC demonstrates that the partitioning maintains the pairwise distances from the original binary data matrix, this metric does not validate the biological meaning or statistical significance of the isolated groups. As a result, the DBI was used to ensure objective structural assessment [34]. The validity testing was performed using the clusterSim package in the RStudio software.
2.4.3. Statistical Analysis of Virulence Determinants and Serotype Associations
In order to evaluate the statistical significance of the distribution of virulence genes across the GBS serotypes, pairwise comparisons were systematically performed for each individual serotype against the pooled reference group formed by the remaining serotypes, using Fisher’s exact test. Prior to hypothesis testing, the analytical matrix was restricted to the predominant serotypes. This approach effectively excluded minor serotypes (those with a prevalence of less than 5) to ensure statistical power and avoid model inflation. The prevalence rates of virulence genes within each distinct serotype were calculated separately and visualized through formatted facet bar charts, using the ggplot2 package in RStudio. The cfb gene was excluded because it exhibited no variance. The Benjamini–Hochberg procedure and q-value were used to determine the threshold for statistical significance [31].
2.4.4. Multi-Annotated Matrix Visualization of GBS Isolates
In order to evaluate the multivariate distribution features of GBS isolates, co-occurrence patterns were established based on the binary data of the examined virulence genes. The interaction of virulence genes was visualized using a multi-annotated matrix. For this multivariate overview, unsupervised grouping was performed using binary distance metrics along with the complete linkage method. In order to link genetic diversity with clinical applications, the resulting isolate-level grouping configuration was cross-referenced with metadata annotation sidebars that monitored three parameters: capsular serotype, specimen source (vaginal and extra-vaginal; invasive or non-invasive isolates), and the temporal isolation frame (Period 1 and Period 2). Statistical computing, mathematical analysis, graphics generation, and validity testing were performed using RStudio and the pheatmap, tidyverse, and clusterSim packages.
3. Results
3.1. Studied Population
During routine diagnostics, 407 non-duplicate GBS isolates were obtained. The collected specimens were derived from patients ranging in age from 0 to 93 years, with a mean age of 41.0 years. The mean age of patients in the vaginal and extra-vaginal groups was 36.8 years and 50.1 years, respectively.
3.2. Analysis of the Distribution Patterns of GBS Virulence Genes
All GBS isolates possessed cfb and at least one gene which encodes pilus island. The most prevalent genes identified in the examined strains were: hylB (97.1%), lmb (96.1%), fbsA (95.6%), scpB (93.1%), cylE (90.7%), and fbsB (50.6%). The remaining genes were found in less than 20% of the strains: bac (17.2%) and hvgA (12.5%). Regarding pili, all strains harbored either a combination of pilus islands (PI-1+PI-2a or PI-1+PI-2b) or contained only one pilus variant (PI-2a or PI-2b). PI-1 was detected only in combinations, while PI-2a and PI-2b were not observed simultaneously in any of the strains. The most frequent was PI-1+PI-2a (36.4%), followed by PI-2a (32.2%), PI-1+PI-2b (20.4%), and PI-2b (11.1%). Table 1 provides a detailed summary of the frequencies of the studied genes and their categorization based on the specimen source. A statistically significant prevalence was observed for fbsB and PI-2a in vaginal samples, as well as for PI-2b in extra-vaginal samples (q < 0.05). However, no significant differences were found when comparing virulence genes between invasive and non-invasive groups (q > 0.05).
Table 1.
Distribution of virulence gene determinants according to the specimen source.
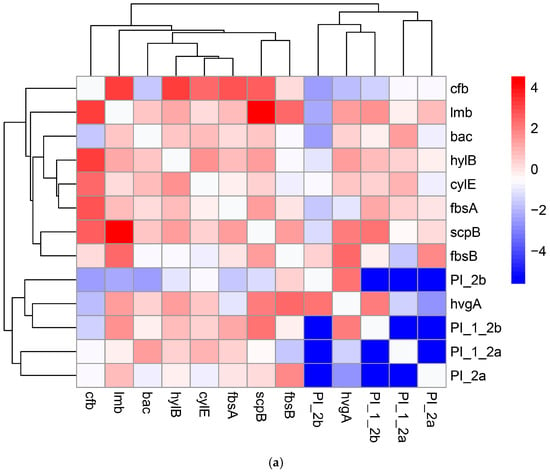
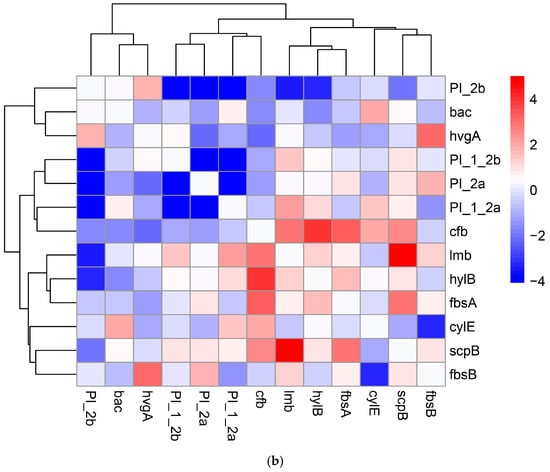
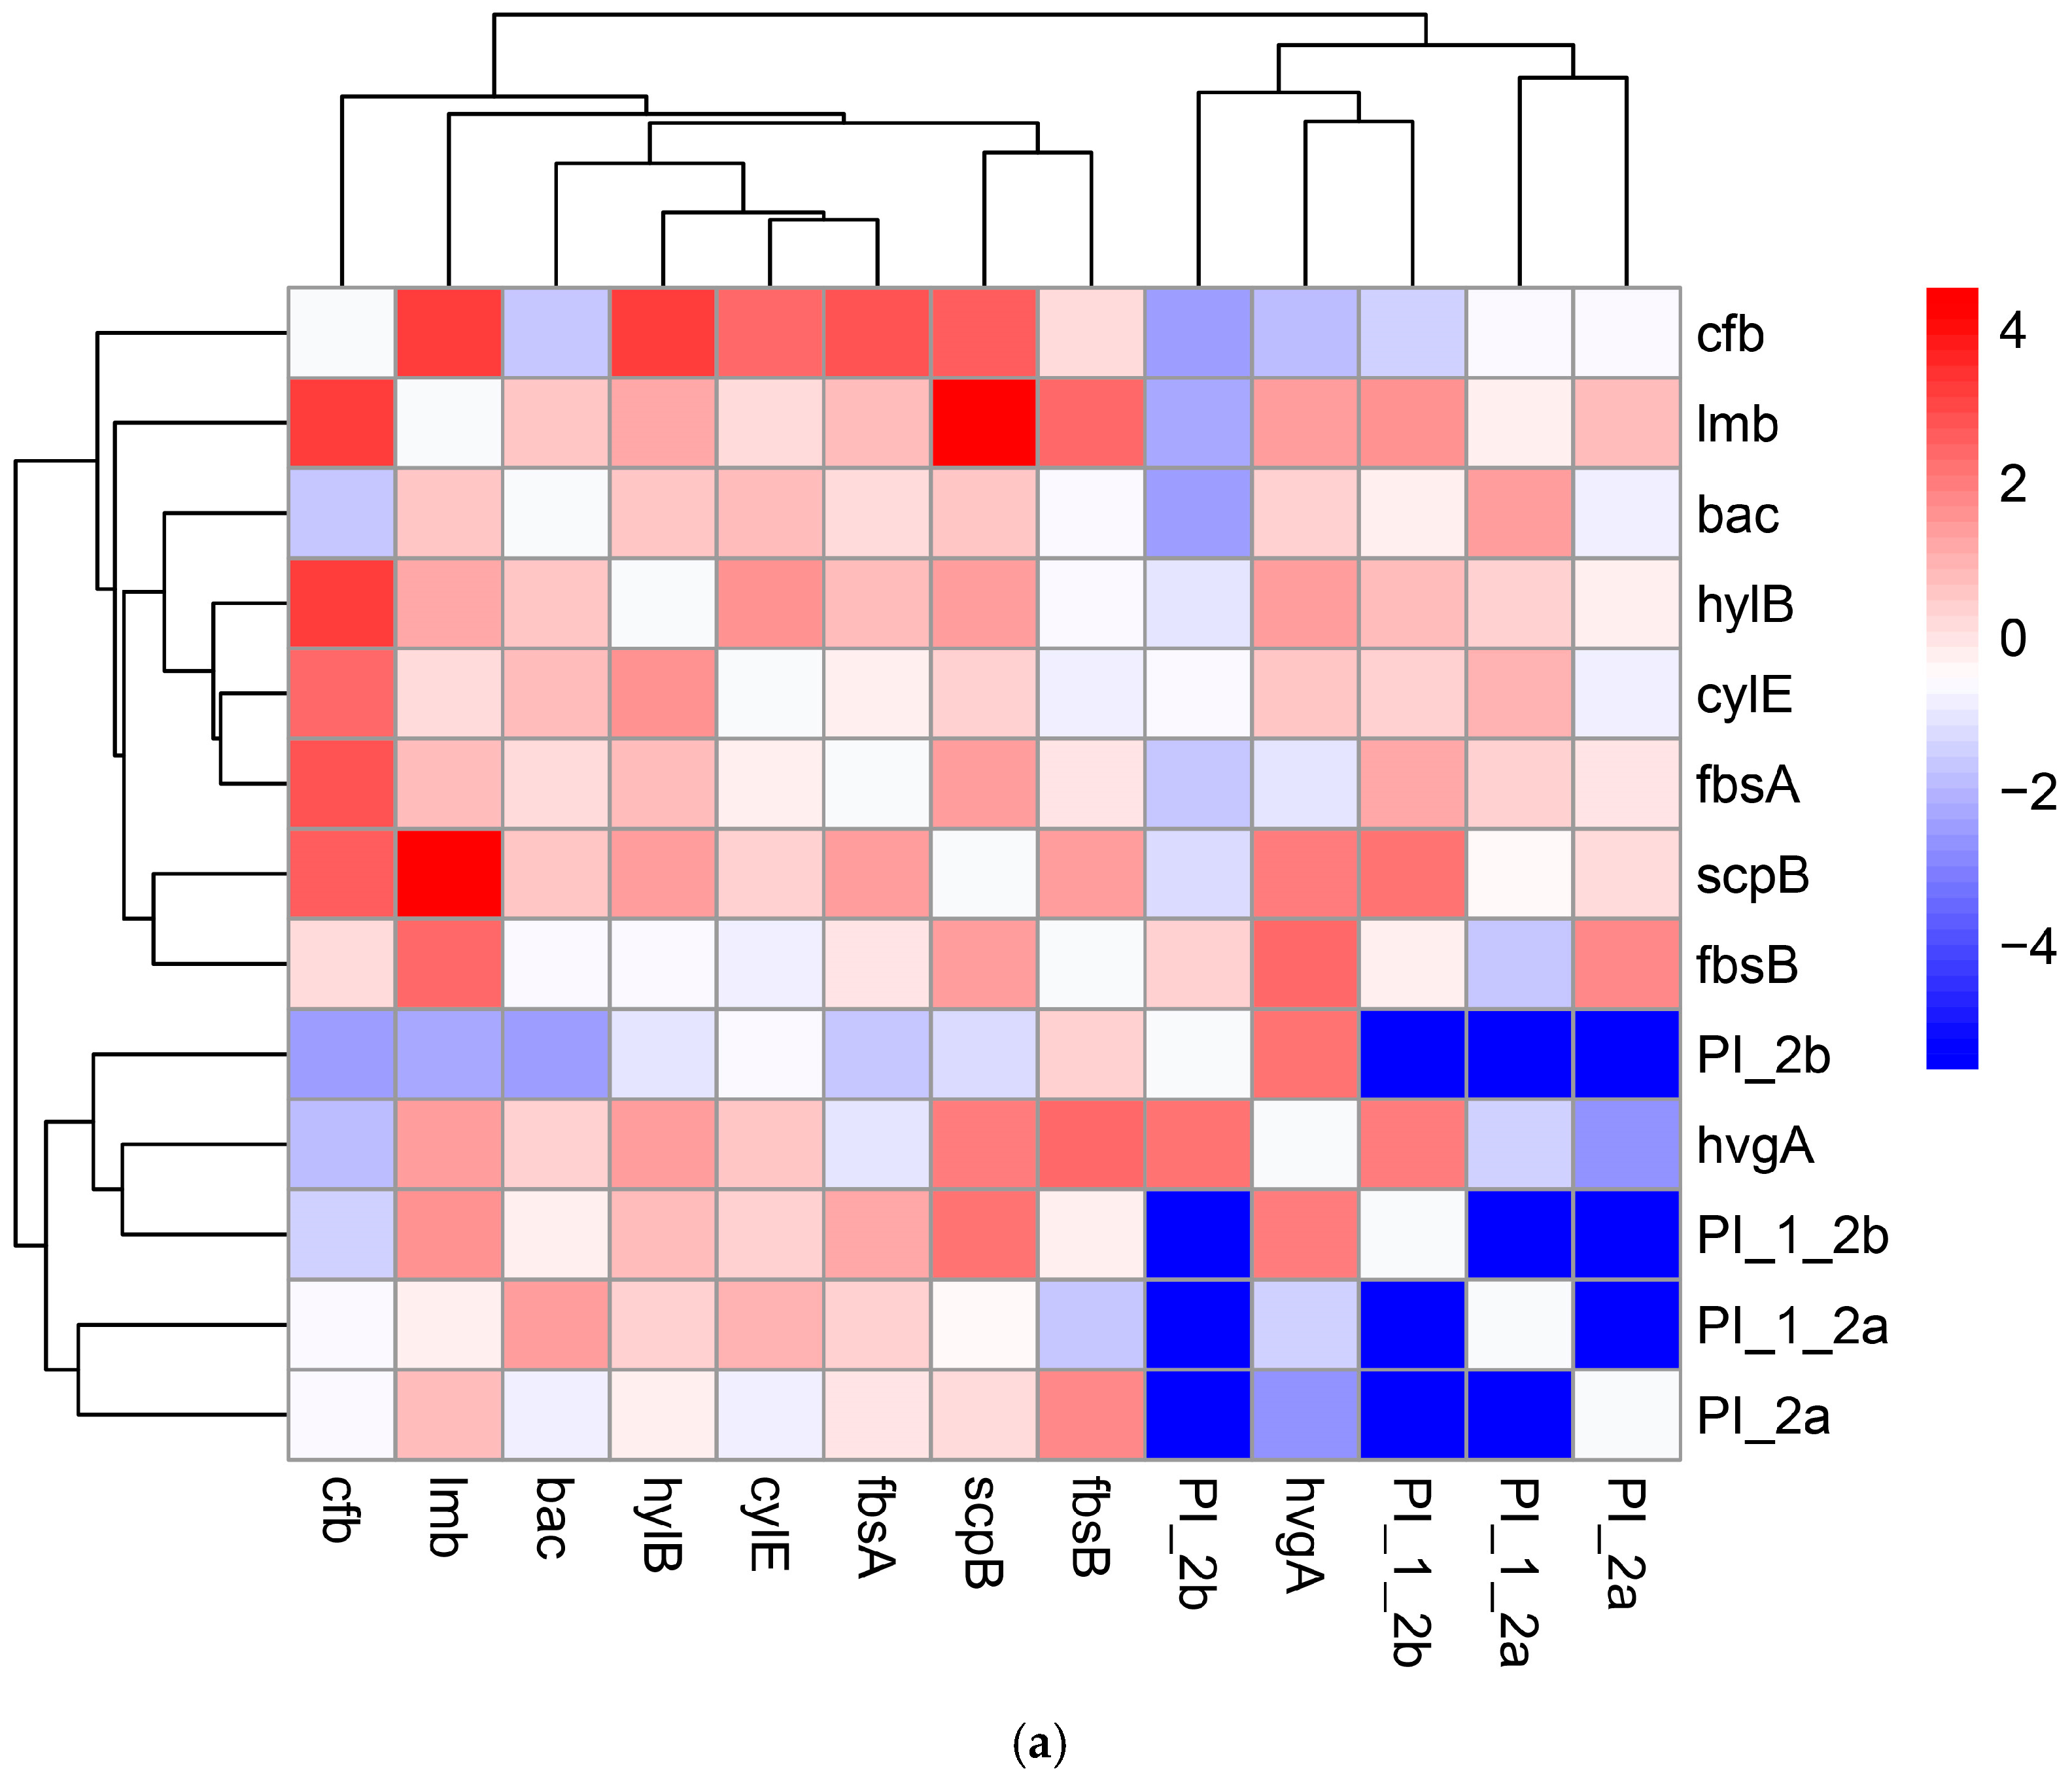
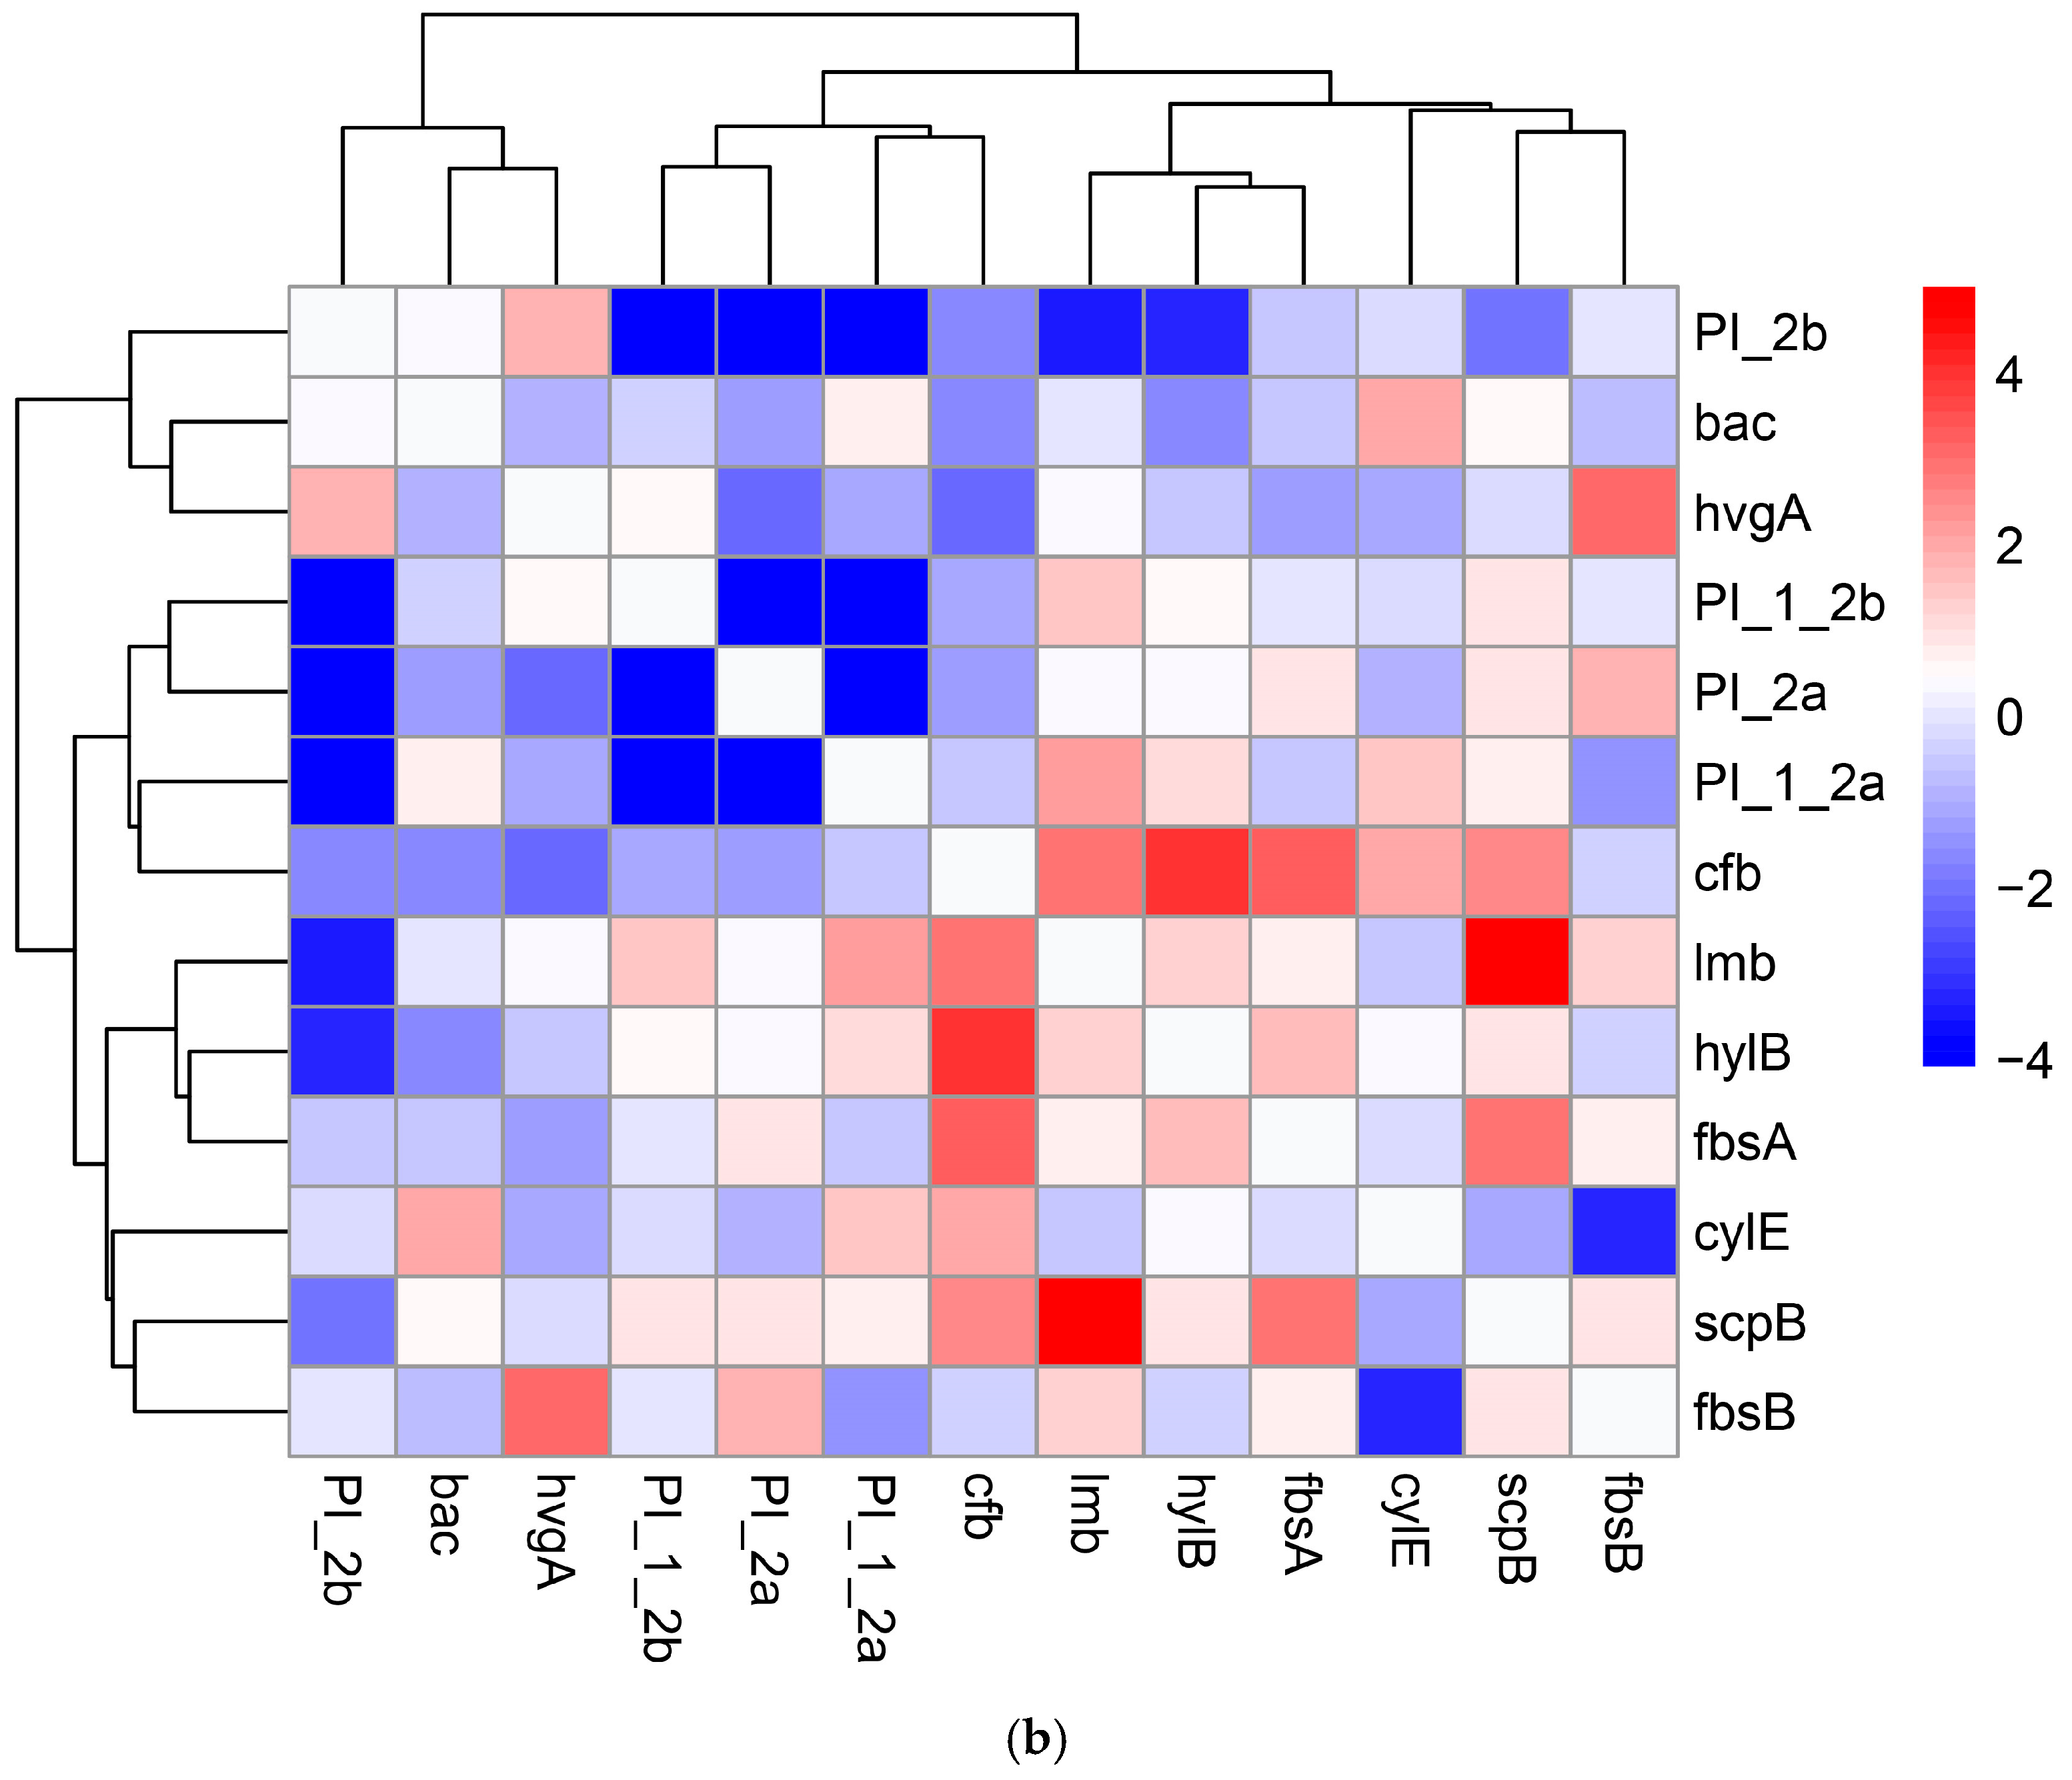
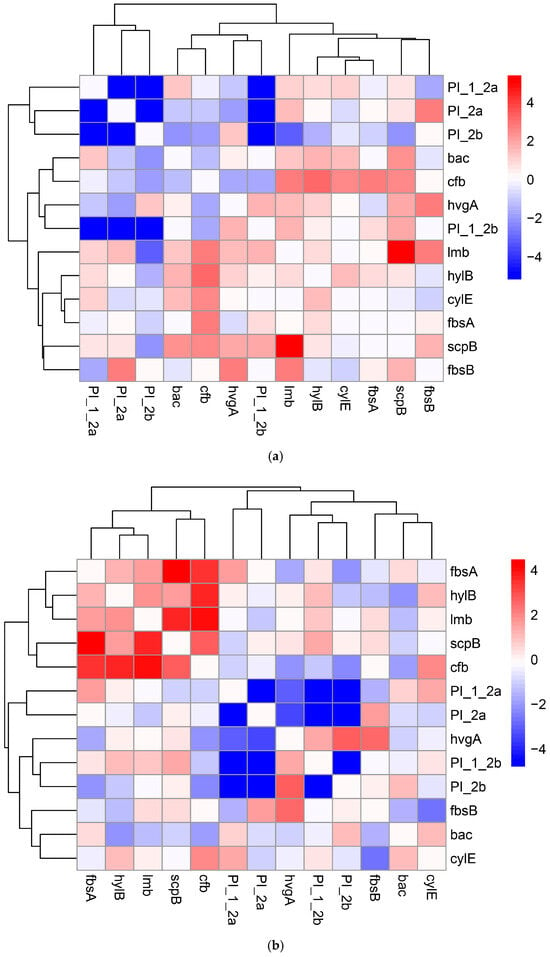
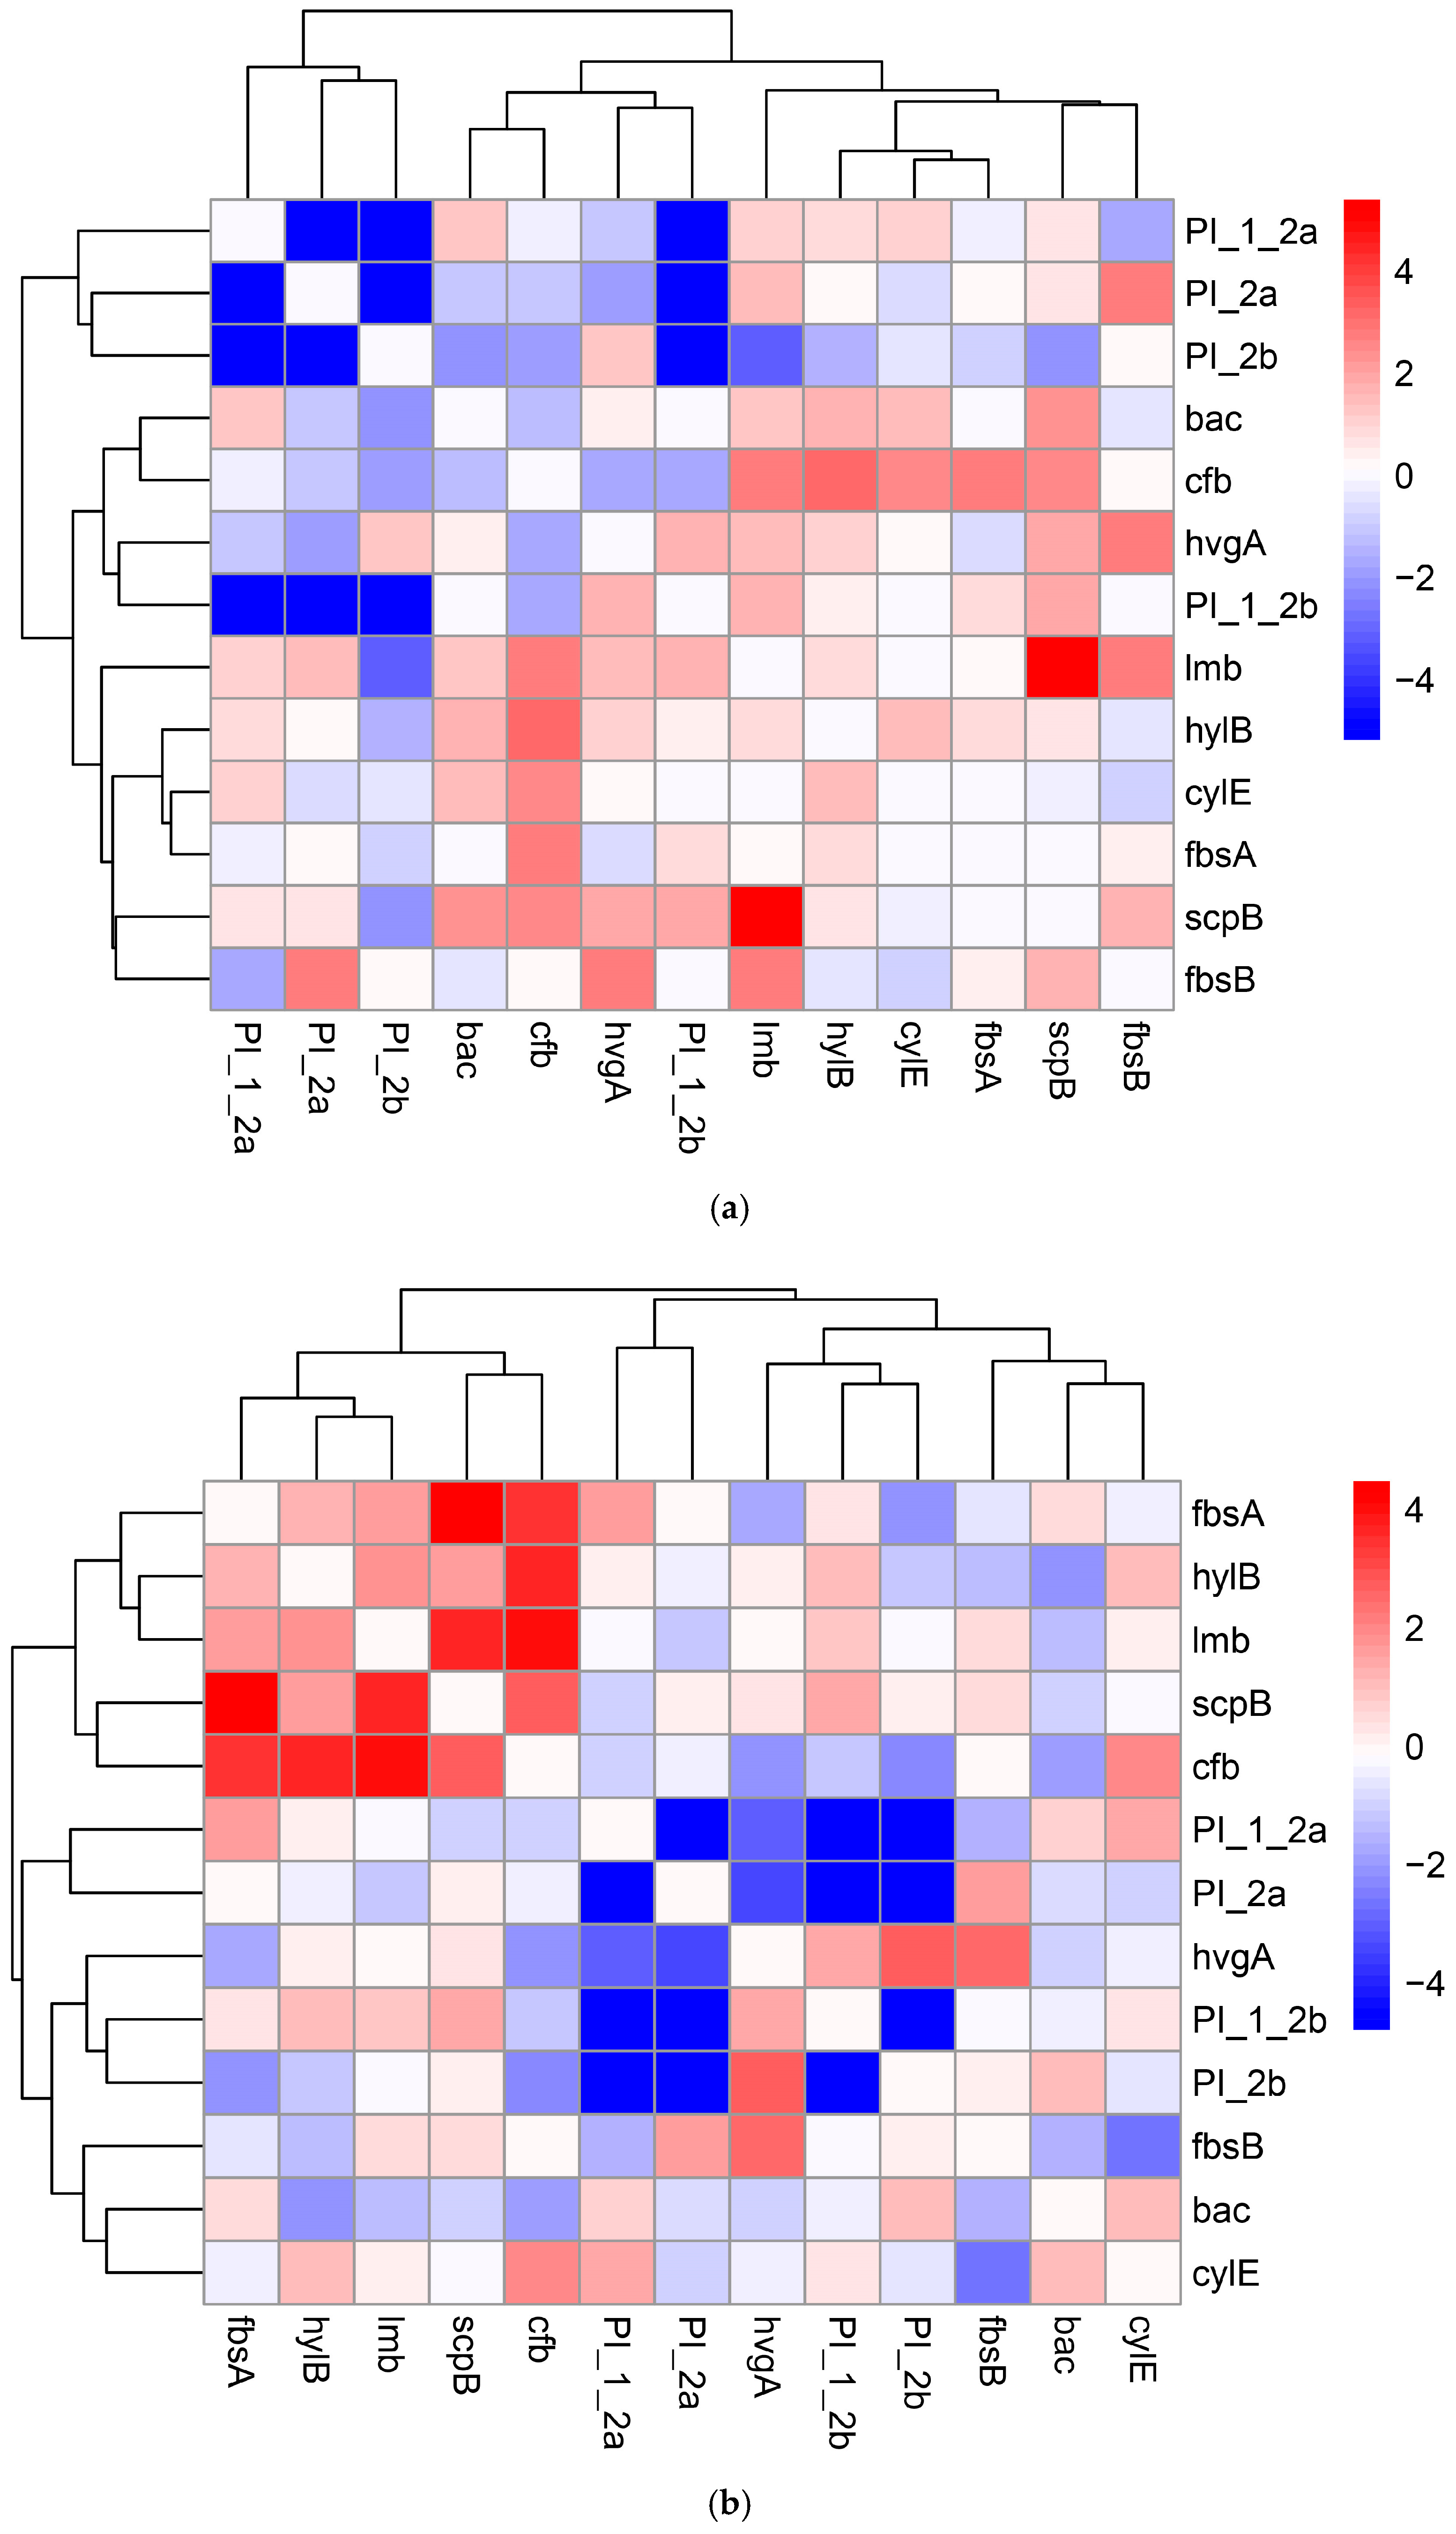
The two-dimensional unsupervised grouping of the 13 × 13 gene co-occurrence matrices revealed distinct patterns, suggesting that the configuration of the virulence determinants is affected by the site of isolation. In the vaginal isolates, the arrangement of virulence genes exhibited a clear pattern of unsupervised partitioning, effectively segregating the genes into four co-occurrence modules. This configuration was mathematically optimized at k = 4, as validated by a DBI of 0.51 and a CCC of 0.88 (Figure 1a). The unsupervised grouping of the extra-vaginal isolates revealed a more unified macro-level partitioning among the examined virulence genes. This configuration was mathematically optimized at a k = 2, a DBI of 0.55, and a CCC of 0.71 (Figure 1b).
Figure 1.
Unsupervised two-dimensional grouping and validation of co-occurrence patterns of virulence genes across the examined specimen sources. Dual-axis symmetric heatmaps, accompanied by complementary partition configurations, depict the mathematically optimized distribution of the analyzed virulence genes, which are represented on both the X and Y axes. (a) The vaginal isolates matrix illustrates a distinct distribution pattern, mathematically optimized into four co-occurrence modules (k = 4). In this matrix, the mutually exclusive pilus island variants (PI-1+PI-2a, PI-1+PI-2b, PI-2a, and PI-2b) are positioned close together within the same distribution group. (b) Extra-vaginal isolates matrix: The distribution configuration is mathematically optimized into two distinct groups (k = 2), where the bac gene, pilus variant PI-2b and hvgA assemble into a compact co-carriage module. The visual blocks represent the log-transformed pairwise OR (log-OR) on a linear scale ranging from −4 to 4. The color gradient defines the strength of statistical associations: an intense red indicates a strong positive correlation and synergy (log-OR = 4), whereas white represents neutrality (Log-OR = 0), and dark blue signifies a strong negative correlation and mutual exclusion (Log-OR = −4). Lighter, desaturated shades correspond to intermediate values. PI_1_2a, PI_1_2b, PI_2a, and PI_2b correspond respectively to PI-1+PI-2a, PI-1+PI-2b, PI-2a, and PI-2b.
The comparative analysis of the vaginal and extra-vaginal samples demonstrated variations in the distribution patterns of the examined virulence determinants. Although some paired gene associations were preserved at both sites (scpB and fbsB; PI-1+PI-2a and PI-2a), the configuration exhibited distinct variations. A major alteration was observed in the distribution of bac and hvgA/PI-2b, which transitioned from separate groups in the vaginal strains to a well-defined compact co-occurrence module in the extra-vaginal samples.
The comparative analysis of the strength of statistical associations between genes, illustrated through color gradient coding in the two heatmaps, reveals a chromatic divergence. Vaginal isolates demonstrated a predominantly positive co-occurrence, while extra-vaginal strains exhibited a transition towards blue color, which was mathematically driven by a higher density of negative log-odds ratios (log-OR < 0).
3.3. Distribution Differences Across the Studied Periods
In order to elucidate the variations in virulence genes co-occurrence patterns between studied periods, a comparative analysis was conducted by dividing the dataset into two consecutive study periods: Period 1 (September 2021–December 2023) and Period 2 (January 2024–April 2026).
Table 2 presents the distribution of the isolates according to the examined periods. The genes bac and the combination PI-1+PI-2a were significantly prevalent during the first period, while the combination PI-1+PI-2b and PI-2a were predominant in the following period (q < 0.05).
Table 2.
Distribution of virulence gene determinants based on the study periods.
For Period 1, the unsupervised arrangement of the genes exhibited stable partitioning, mathematically optimized into four distinct modules (k = 4), supported by a DBI of 0.57 and a CCC of 0.79 (Figure 2a). In Period 2, the distribution configuration maintained its four-module optimization (k = 4), achieving a DBI of 0.81 and a CCC of 0.79 (Figure 2b). However, a comparative analysis revealed a distinct variation in gene association patterns. The most notable alteration was related to the pilus island variants. In Period 1, PI-1+PI-2a, PI-2a, and PI-2b shared a common distribution group, completely separated from PI-1+PI-2b. In Period 2, the association pattern was altered: PI-2b separated from its initial group to assemble into a new co-occurrence module with PI-1+PI-2b and hvgA, while PI-1+PI-2a and PI-2a maintained their close association in a distinct part of the distribution matrix.
Figure 2.
Distribution differences in virulence gene co-occurrence patterns between the studied periods. Comparative two-dimensional unsupervised heatmaps track the configuration stability and variation in co-occurrence patterns over two consecutive study periods, with identical virulence genes displayed on both the X and Y axes. (a) Study Period 1 (September 2021–December 2023) matrix: The configuration demonstrates a statistically optimized partitioning at k = 4, characterized by a unified module that groups the mutually exclusive pilus island variants PI-2a, PI-2b, and PI-1+PI-2a, while the alternative variant PI-1+PI-2b is separated within a different distribution group. (b) Study Period 2 (January 2024–April 2026) matrix: The distribution configuration undergoes a notable alteration, maintaining mathematical optimization (k = 4). In this process, PI-2b separates from its initial group to establish a new module with PI-1+PI-2b and hvgA. The data heatmaps use a log-OR scale ranging from −4 to 4, where positive synergy is indicated by progressively darker shades of red, neutral is represented by white, and negative correlation is depicted by deeper shades of blue. PI_1_2a, PI_1_2b, PI_2a, and PI_2b correspond respectively to PI-1+PI-2a, PI-1+PI-2b, PI-2a, and PI-2b.
3.4. Distribution and Statistical Correlations of Virulence Genes and GBS Serotypes
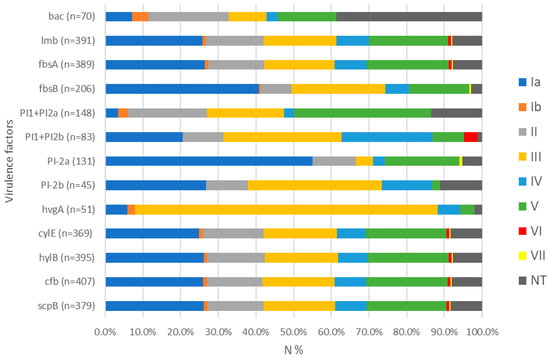
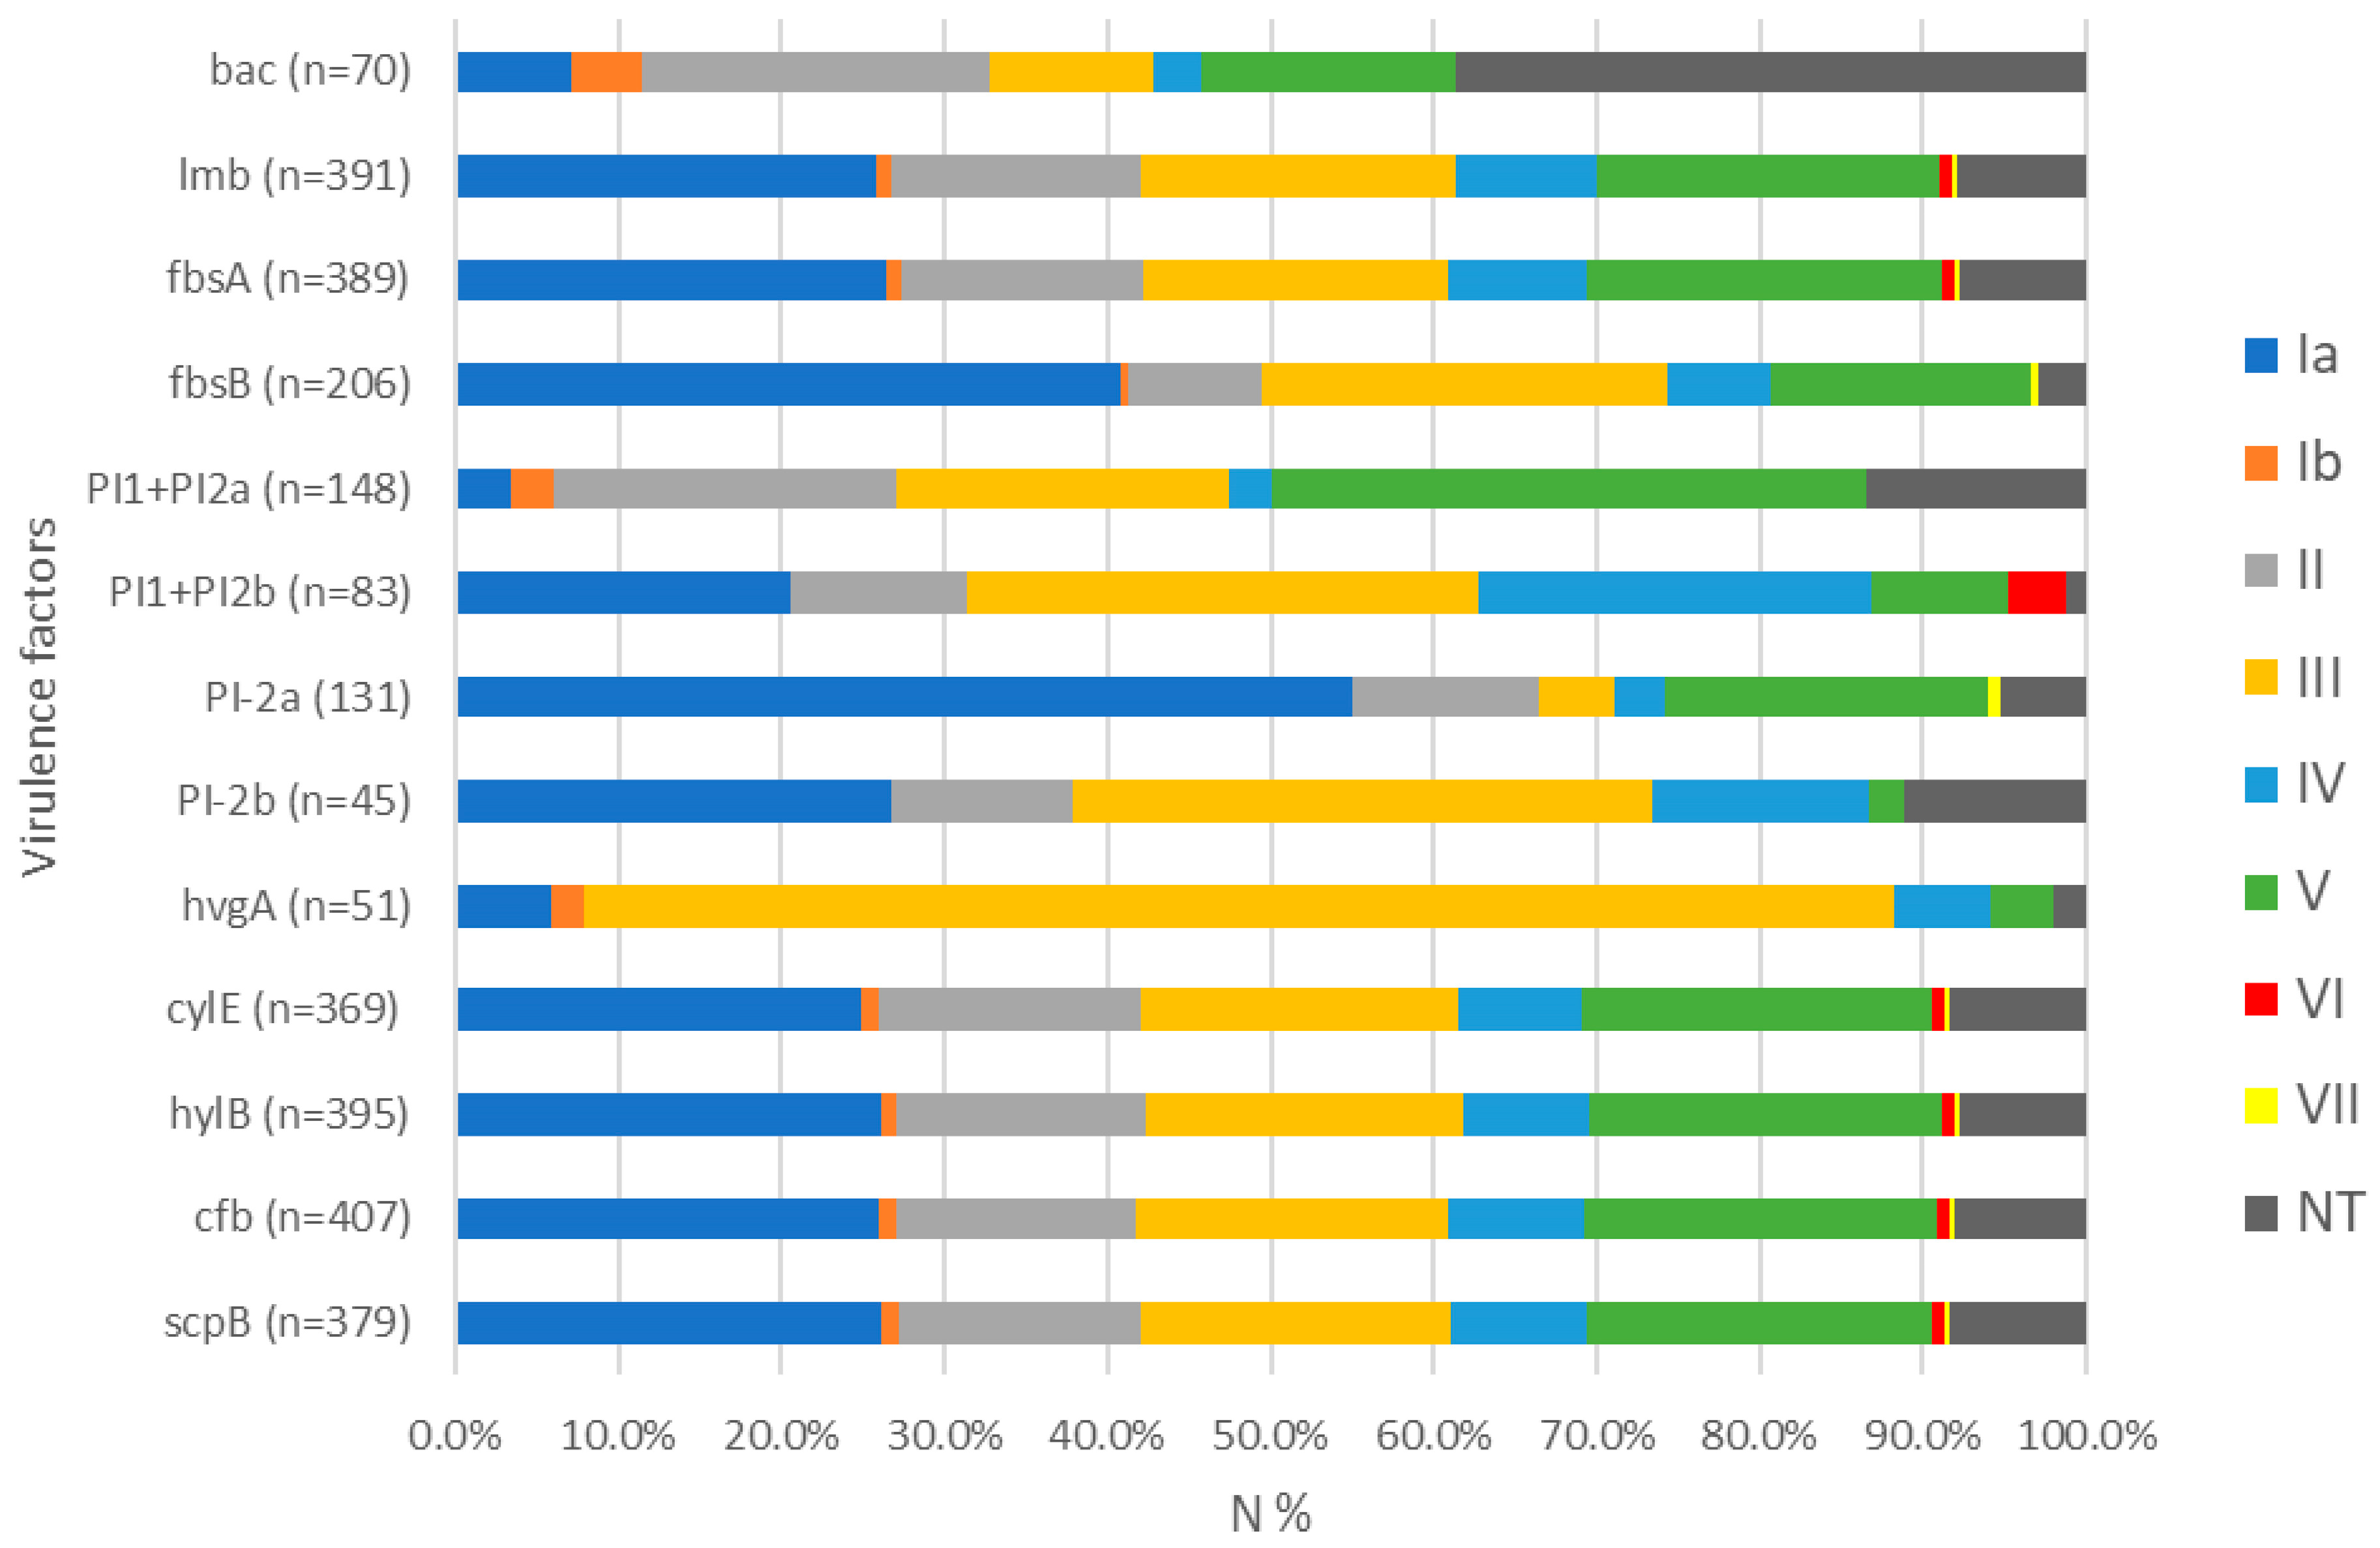
Among all the isolates examined, the most prevalent serotypes were Ia (26.0%), V (21.6%), and III (19.2%), followed by II (14.7%), IV (8.4%), Ib (1.1%), VI (0.8%), and VII (0.3%). The non-typeable were 33 (8.4%). Serotypes VIII and IX were not identified. The serotypes most commonly identified among the tested genes were as follows: serotype Ia, as expected, exhibited the highest frequency among genes with a total prevalence exceeding 90% among isolates, including lmb, fbsA, cylE, hylB, cfb, and scpB. Additionally, 40.8% of fbsB and 55.0% of PI-2a tested positive for this serotype. Serotype III was the most prevalent in PI-1+PI-2b (31.3%), PI-2b (35.6%), and hvgA (80.3%); serotype V was detected in 36.4% of PI-1+PI-2a, while NT were predominant in bac (Figure 3).
Figure 3.
A bar chart illustrating the relative proportional contribution of serotypes within the sub-group of isolates that tested positive for each respective virulence gene. Each horizontal stack totals 100%, representing the entire positive isolate pool for the specific genetic determinant, with internal color-coded segments delineating the percentage contribution of each serotype. The distribution of the universally present virulence gene cfb reflects the overall prevalence of serotypes within the entire bacterial collection. Ia, Ib, II–VII—serotypes identified in GBS. NT—non-typeable. N%—percentage of identified serotypes in isolates that tested positive or negative for the examined gene determinants. PI1+PI2a and PI1+PI2b correspond respectively to PI-1+PI-2a and PI-1+PI-2b.
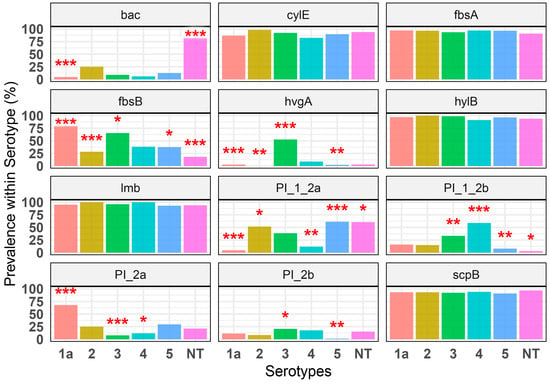
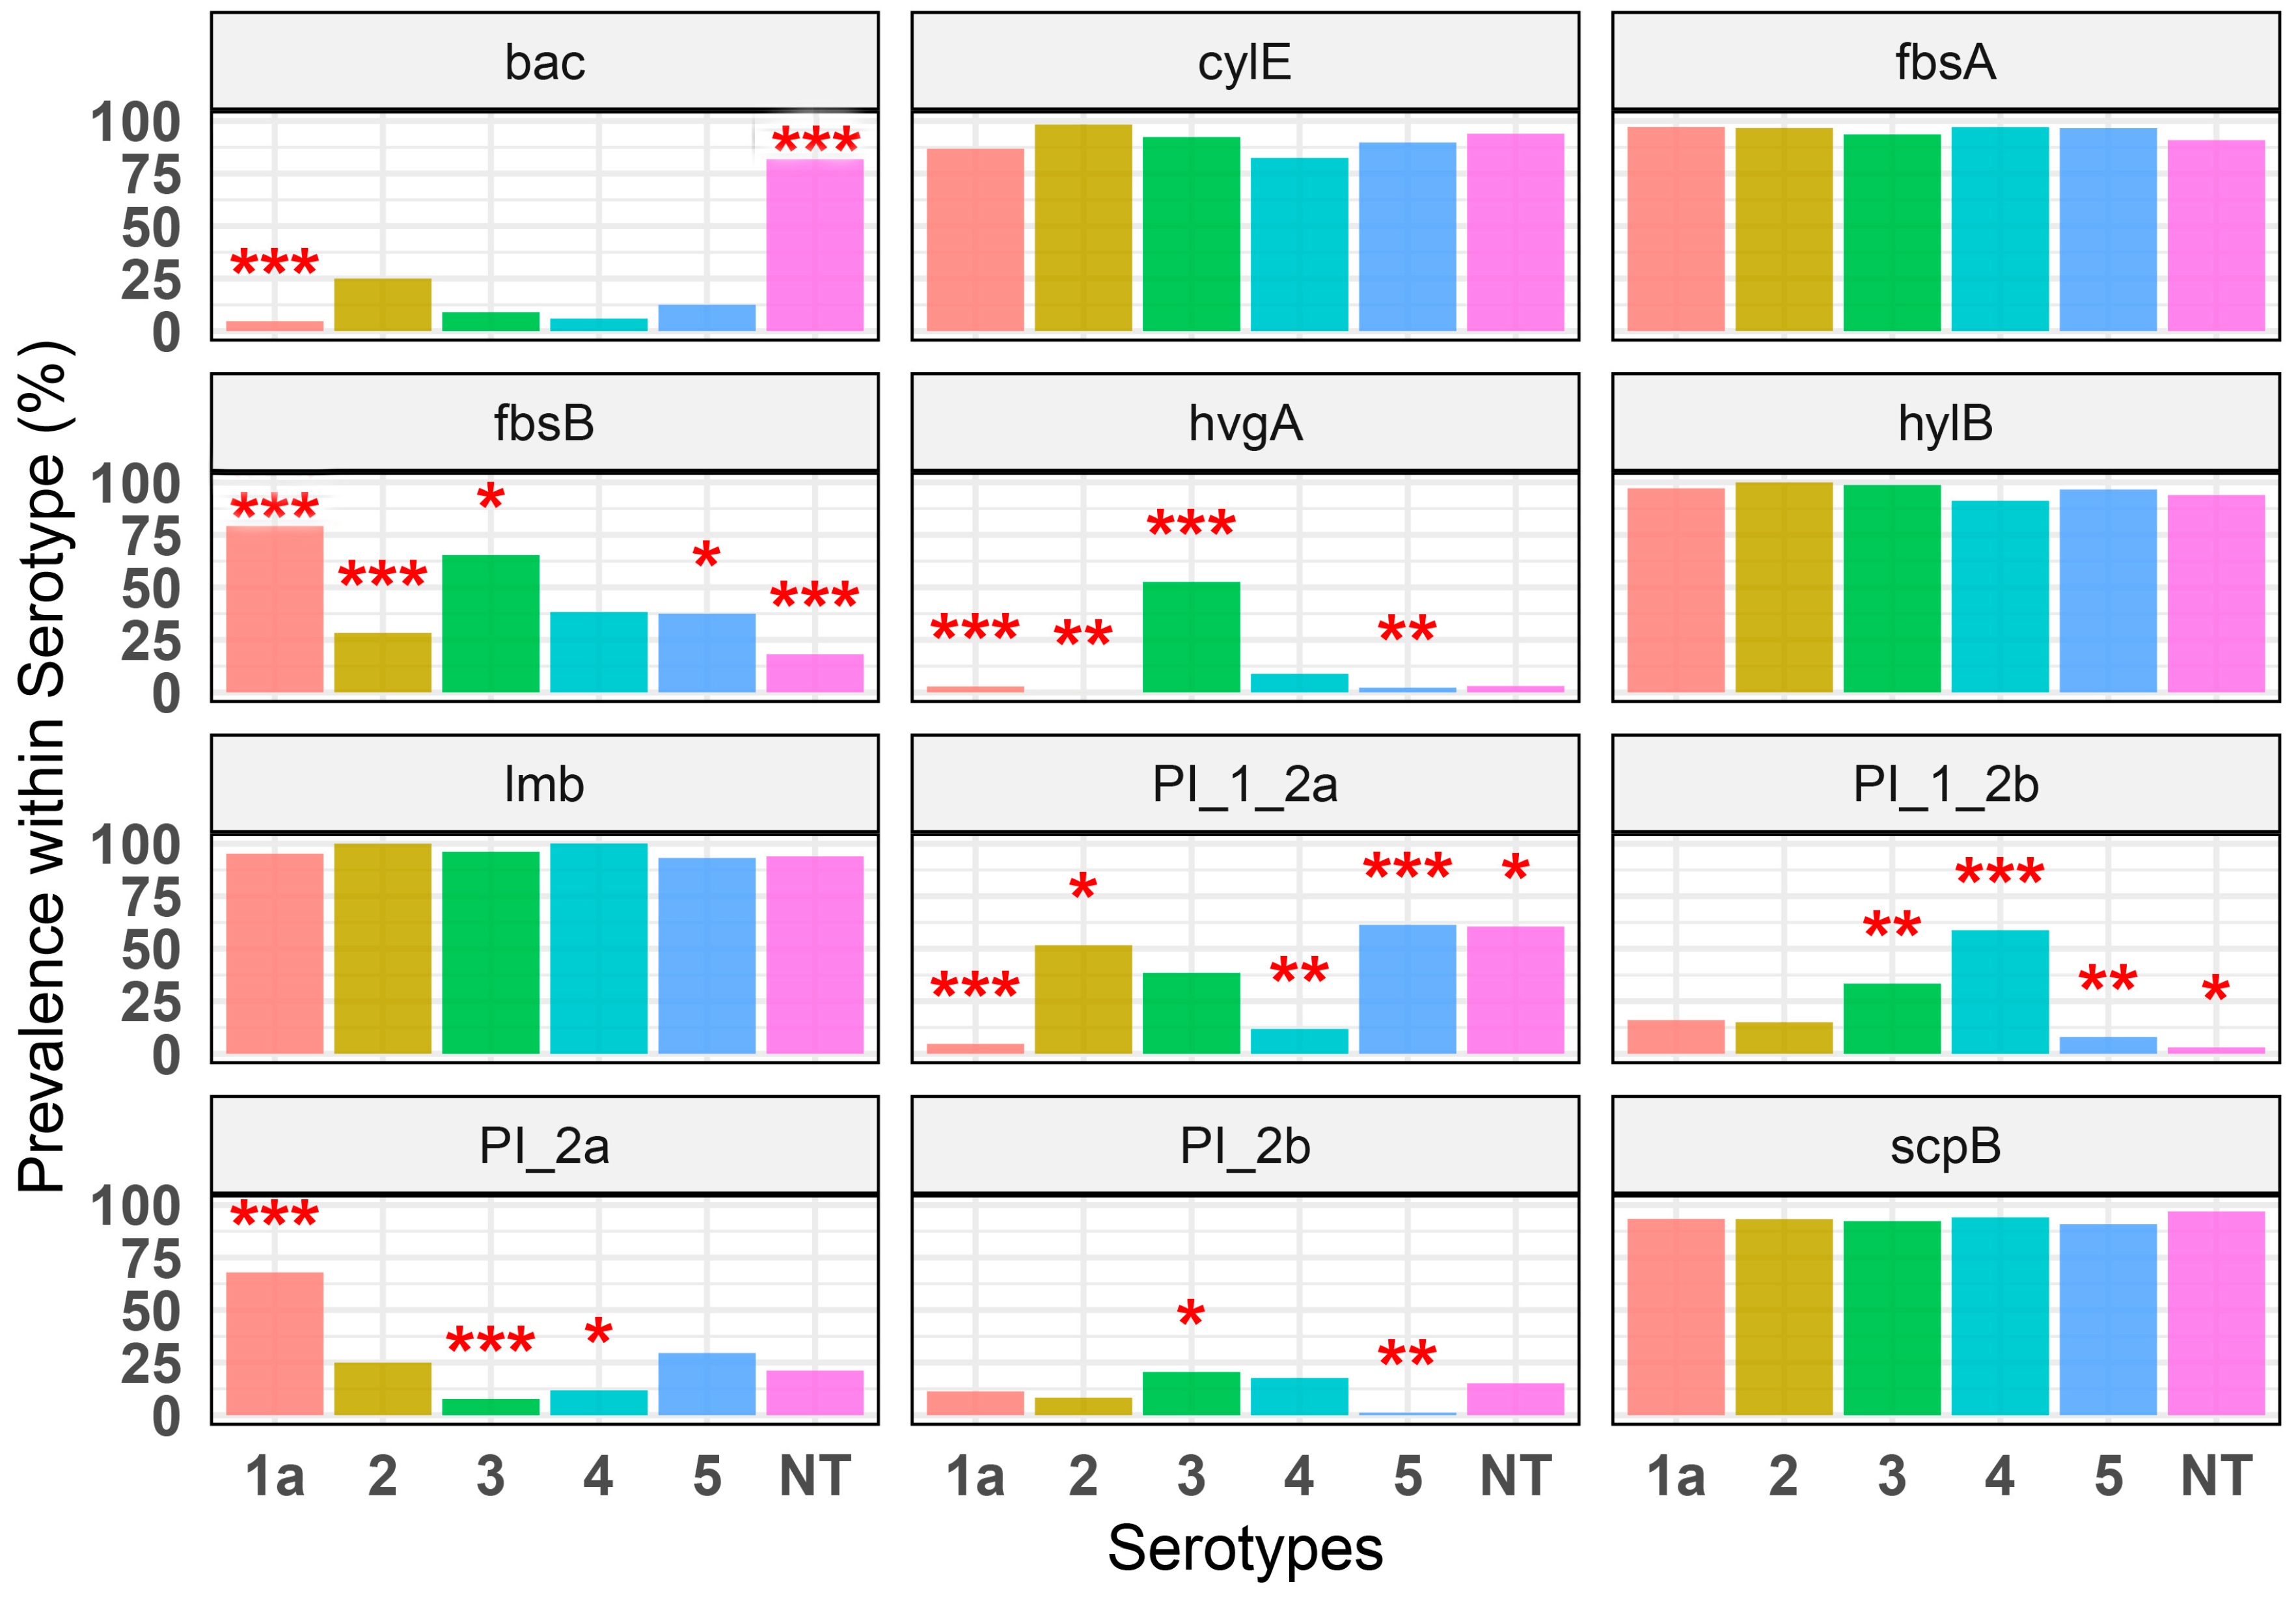
The prevalence association of virulence genes among the major serotypes (Ia, II, III, IV, V, and NT) was assessed using formatted facet bar charts (Figure 4). The comparative prevalence analysis highlighted the variations in dual-directional partitioning. On one hand, certain virulence genes showed significant associations with specific serotypes, resulting in prominent intra-serotype enrichments (indicated by high bars with three asterisks, adjusted for q < 0.001). Gene fbsB exhibited a prevalence rate of 79.2% within the isolates of Serotype Ia, while PI-1+PI-2a was found in 61.4% of serotype V, PI-1+PI-2b in 58.8% of serotype IV, PI-2a in 67.9% of serotype Ia, hvg in 52.5% of serotype III, and bac in 81.8% of NT. On the other hand, the analysis effectively identified cases of substantial statistical depletion or total absence (indicated by low or 0% bars accompanied by three asterisks, adjusted for q < 0.001), where genes that are generally common were consistently reduced or entirely absent in particular serotype. This includes genes bac, PI-1+PI-2a, and hvgA in serotype Ia, PI-2a in serotype III, and fbsB in serotypes II and NT.
Figure 4.
Comparative prevalence analysis and statistical significance of the distribution of virulence gene across the predominant serotypes. Facet bar charts illustrate the percentage prevalence of the variable virulence genes, calculated for each individual serotype. Statistically significant associations, when compared to the pooled reference group that included the remaining serotypes, are marked with red asterisks based on FDR control: “*” indicates adjusted q < 0.05, “**” is adjusted q < 0.01, and “***” is adjusted q < 0.001 as determined by the Benjamini–Hochberg procedure [31]. Notably, asterisks positioned above high bars indicate significant enrichment, while asterisks positioned above very low or 0% bars denote significant statistical depletion or total absence. 1a, 2, 3, 4, and 5 correspond respectively to Ia, II, III, IV, and V—serotypes identified in GBS. NT—non-typeable. PI_1_2a, PI_1_2b, PI_2a, and PI_2b correspond respectively to PI-1+PI-2a, PI-1+PI-2b, PI-2a, and PI-2b.
3.5. Multi-Annotated Matrix Visualization of Virulence Genes in GBS Isolates
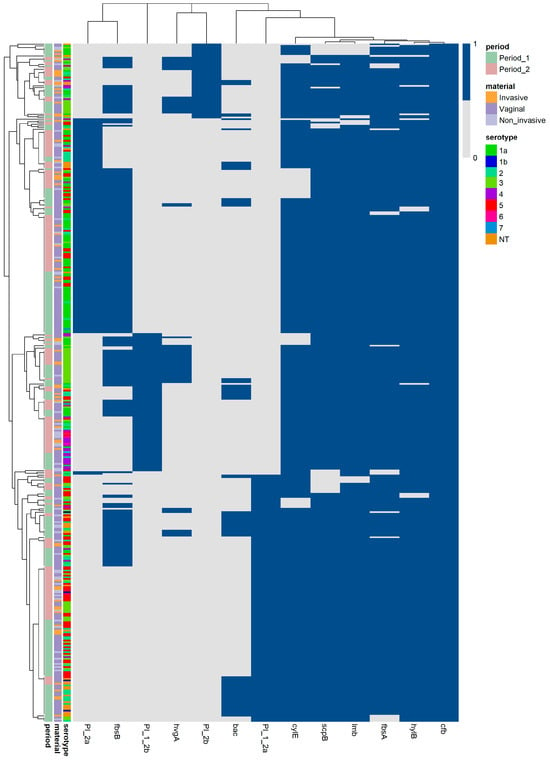
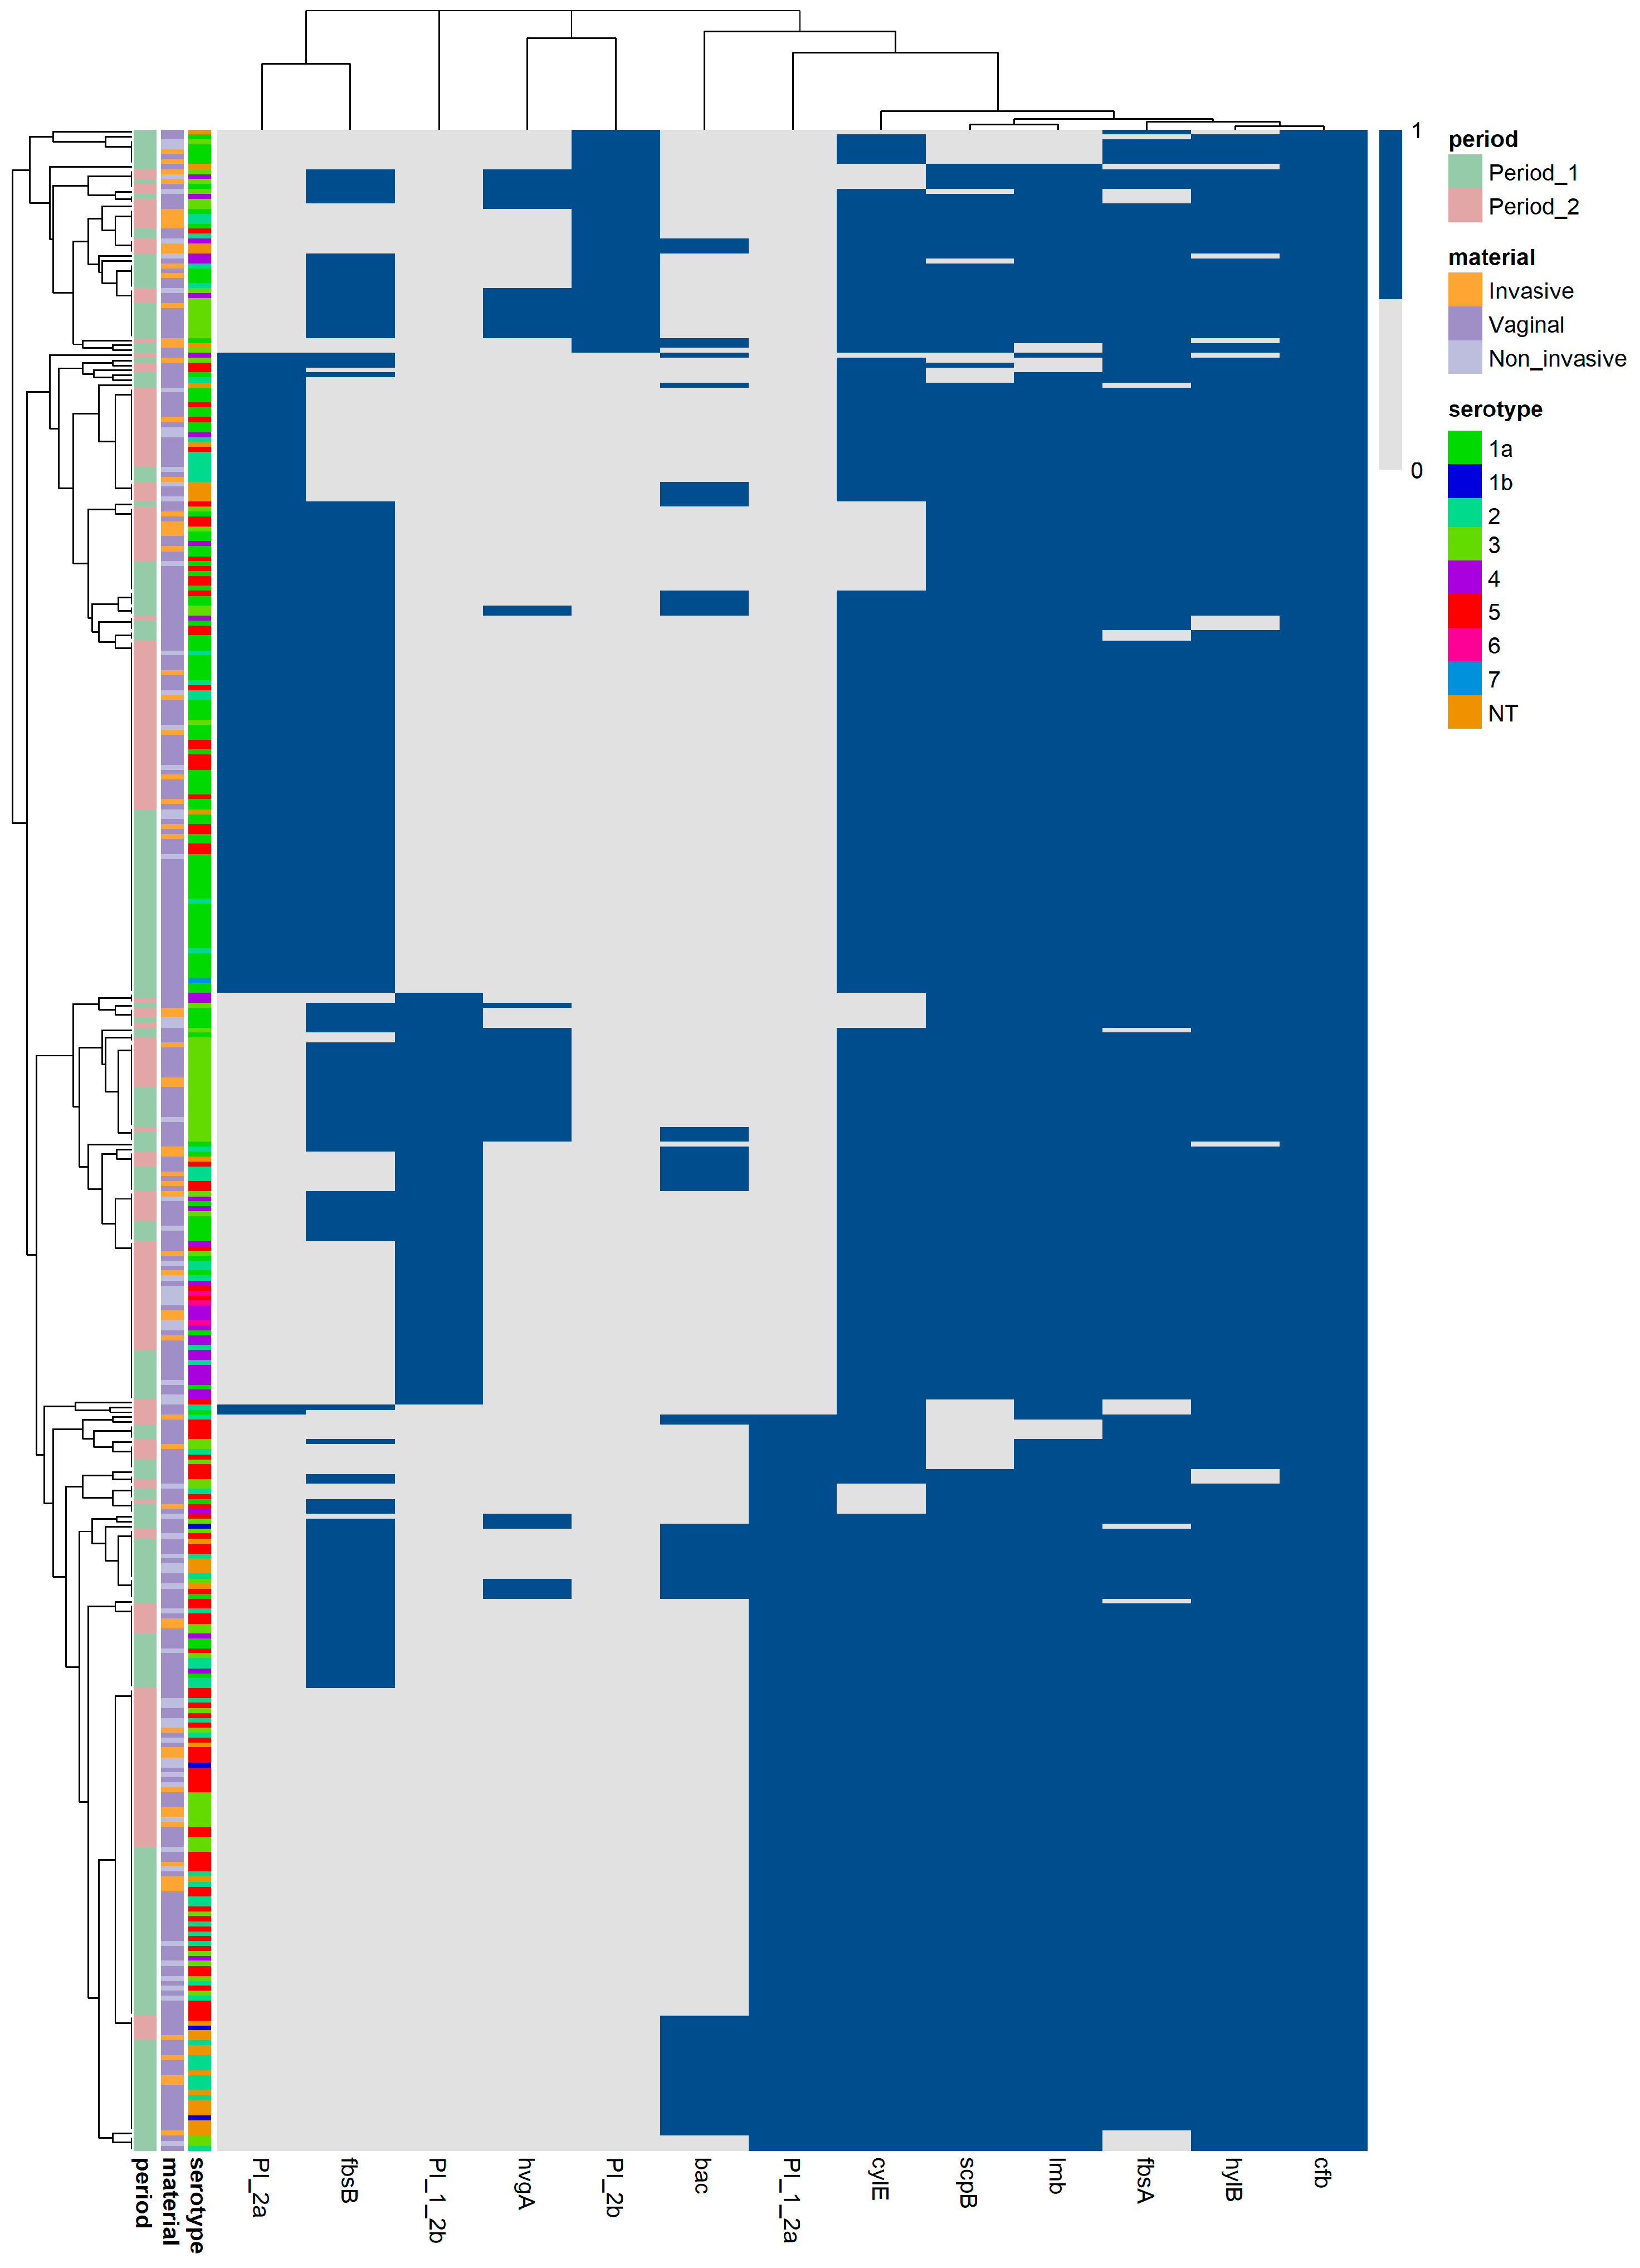
In order to obtain a detailed overview, a multivariate grouping analysis was conducted on all 407 isolates (Figure 5). The distribution configuration demonstrated an optimal mathematical fit, as indicated by the vertical isolate partitioning achieving a CCC of 0.79, while the horizontal gene partitioning yielded a CCC of 0.91. The partition optimization conducted through the DBI revealed a highly structured distribution pattern. The bacterial isolates were categorized along the vertical axis into nine groups (k = 9, DBI = 0.86). Along the horizontal axis, the virulence genes were organized into eight modules k = 8 (DBI = 0.07): the PI-2a/fbsB pair, the standalone PI-1+PI-2a, the hvgA/PI-2b pair, the bac/PI-1+PI-2a pair, the standalone cylE, the scpB/lmb pair, the standalone fbsA, and the hylB/cfb pair. The alignment of the three vertical metadata annotation sidebars (serotypes, periods, and materials) adjacent to the optimized isolate groups demonstrated stratifications; however, an absence of sub-grouping was noticeable in some isolates. This stems from the mathematical consequence of zero binary distance within distinct sub-groups, where isolates exhibited identical virulence patterns.
Figure 5.
Multi-annotated matrix of the analyzed isolates. Two-dimensional unsupervised grouping analysis demonstrates the co-occurrence patterns of virulence genes among all examined GBS strains. The vertical partitioning segregates the isolates into nine distinct groups, while the horizontal partitioning groups the virulence genes into eight modules, which are mathematically balanced to optimize interpretability. The resulting isolate-level grouping configuration was cross-referenced with metadata annotation sidebars: capsular serotype, specimen source (vaginal, invasive, or non-invasive extra-vaginal isolates), and temporal isolation frame (Period 1 and Period 2). The shading of the central matrix cell reflects the binary presence of gene carriage, with blue denoting presence and grey indicating absence. The last virulence factor (cfb), which is universally present, serves as a solid vertical reference column. 1a, 1b, 2–7 correspond respectively to Ia, Ib, II-VII—serotypes identified in GBS. PI_1_2a, PI_1_2b, PI_2a, and PI_2b correspond respectively to PI-1+PI-2a, PI-1+PI-2b, PI-2a, and PI-2b.
4. Discussion
GBS possesses important virulence factors with different functions, such as adhesion, evasion of the immune response, and toxin activity [5]. The distribution of adhesion genes in our study varied; some were present with a frequency exceeding 90%, while others, such as hvgA, were primarily associated with specific strains exhibiting hypervirulent characteristics. Fibrinogen and laminin binding proteins, which are encoded by the genes fbsA, fbsB, and lmb, are essential for the colonization of GBS. They were found with a high frequency (exceeding 95%) in studies conducted in Argentina, Brazil, Egypt, and Poland [35,36,37,38]. However, research in Europe, specifically in Spain, Germany, France, and Switzerland, indicated that the prevalence of fbsB ranged between 32% and 38% [26,39,40]. The prevalence of fbsA and lmb in our research corresponded with the presented data, while fbsB exceeded the average frequency for Europe. Furthermore, fbsB was significantly prevalent in vaginal samples, establishing it as a potential determinant for colonization and biofilm formation in this specific location (q < 0.05). The fbsB gene exhibited a strong positive co-occurrence (log-OR > 0) with PI-2a, a pilus variant associated with biofilm formation [41]. Both genes were significantly prevalent in serotype Ia, indicating a strong correlation between this serotype and strains that could potentially demonstrate enhanced biofilm formation.
The surface-associated adhesin HvgA, encoded by the hvgA gene, promotes efficient adhesion and invasion of the intestinal and blood–brain barriers. This mechanism allows GBS to migrate into the bloodstream and central nervous system, leading to invasive infections such as neonatal meningitis. It is predominantly found in hypervirulent CC17 associated with serotype III, and negatively regulated by CovR/S two component system [42,43,44]. HvgA differs across studies, with Poland, France, Brazil and the USA reported rates below 10%, while in Egypt and in the analysis of 1201 strains from the NCBI Reference Sequence Database, it was detected in more than 10% of the isolates [26,36,37,38,45,46]. In our study, the prevalence of hvgA was 12.5%, with a slightly higher frequency in vaginal isolates compared to extra-vaginal ones, although the difference was not statistically significant (q > 0.05). The comparative analysis of vaginal and extra-vaginal samples revealed that the hvgA/PI-2b pair remained consistently associated, while a change in the distribution configuration was observed due to the transition of bac and PI-1+PI-2b. This resulted in a potential phenotypic optimization of adhesion in hvgA positive vaginal isolates, while extra-vaginal strains demonstrated a better capability to evade the host immune response. The overall comparative analysis of the strength of statistical associations between hvgA and other virulence determinants in extra-vaginal isolates indicated a transition to a negative log-OR, including with hylB; however, fbsB and PI-2b retained their positive correlation. According to the literature, hylB exhibits up-regulation in CC17, thereby identifying it as a significant genomic marker for the invasiveness of GBS [43]. In general, this discrepancy could be attributed to large insertions in the hylB gene or regulatory mechanisms associated with CovR/S [43,47,48]. In our study, however, hylB is almost universally present (97.1%), suggesting that the mathematical model alone does not fully explain the results and should be applied with caution within a microbiological and genetic context. This also highlights the significance of integrating both approaches for interpretation of the results. Regarding vaginal isolates, we observed a concentration of positive correlations of hvgA with most of the genes studied, underscoring the potential risks associated with the transmission of these strains during pregnancy and the significance of virulence surveillance [49].
Regarding the evaluation of variations in virulence genes between the studied periods, no significant differences were found in the distribution or in the strength of associations of hvgA. However, during Period 2 (January 2024–April 2026), grouping analysis revealed that PI-2b assembled into a new module with PI-1+PI-2b and hvgA. In addition, the multi-annotated matrix organized the hvgA/PI-2b pair within distinct distribution group, completely separated from the standalone PI-1+PI-2b. Recent data demonstrated that the loss of PI-1 in particular hypervirulent isolates and the presence of PI-2b is associated with the invasion of the host cell [50]. While the current study did not include clonal characterization and phenotypic antimicrobial susceptibility testing, tracking these specific pili gene combinations serve as a valuable descriptive indicator for regional epidemiological surveillance.
HvgA was initially described as an adhesin exclusively found in serotype III by Tazi et al. (2010); however, multiple publications following its discovery indicate that other serotypes may also possess it as a result of recombination or capsular switching [28,42,51,52]. In our study, serotype III is the most common among hvgA positive isolates (80.3%), although other serotypes are also present as follows: serotype Ia (5.9%), IV (5.9%), V (3.9%), Ib (2.0%), and NT (2.0%). Further analysis indicated that the distribution of the gene among serotype III positive isolates was statistically significant (q < 0.001). This corresponds with aforementioned data and genotypically validated the association of Hvg with the most virulent serotype, while also suggesting the potential presence of this protein among other serotypes.
Pili are involved in colonization, biofilm formation, and crossing of the blood–brain barrier. In general, GBS strains have at least one or a combination of two variants of pilus islands; however, PI-2a and PI-2b cannot coexist simultaneously. Therefore, they can be presented as PI-1, PI-2a or PI-2b, as well as the combinations PI-1+PI-2a and PI-1+PI-2b [5]. The heatmap analysis confirmed this distribution, indicating that each isolate possesses only one variant or a combination of pilus islands, as evidenced by a strong negative correlation and mutual exclusion (Log-OR = −4) between them. Among the overall collection of GBS isolates, the combination PI-1+PI-2a was the most prevalent, followed by PI-2a, PI-1+PI-2b, and PI-2b. Similar distributions were observed in studies conducted in Poland, France, South Korea, and the USA [26,29,45,53]. Additionally, in the USA, 0.3% of the strains were solely presented by PI-1, a rare possibility that was not observed in our study [45]. According to data, isolates characterized by the PI-2a variant produce significantly more biofilm compared to those of the PI-1 and PI-2b variants. Furthermore, as previously mentioned, PI-2b is frequently transmitted in hypervirulent invasive strains [6,41]. In our research, when comparing pilus islands based on the source of material, PI-2a was significantly more common in vaginal samples, while PI-2b was more prevalent in extra-vaginal materials (q < 0.05). Moreover, the evaluation of GBS isolates during the study periods revealed a significant decrease in PI-1+PI-2a, while PI-1+PI-2b and PI-2a exhibited a marked increase (q < 0.05). This determines the genetical capacity of these pilus variants to serve as additional factors associated with colonization and biofilm formation or invasiveness. PI-1 was detected in more than a half or the isolates, which can be attributed to its role in protecting GBS from phagocytosis [50].
Pili were considered as potential candidate vaccines, as preclinical studies demonstrated that a trivalent pilus-based vaccine could induce immune responses and potentially provide broad serotype-independent protection. However, not all protective pilin subunits can be included in the vaccine due to antigenic variations. In addition, attempts to develop a combination involving pili antigens from various streptococcal species could potentially impact the normal microbiota [54,55,56,57]. Despite this, analyzing the distribution of pili and their associations with serotypes is important for the development of future vaccines, as the six-component conjugated polysaccharide vaccine does not include all rare serotypes, while pili are present universally [49,54]. In our research, the distribution of pilus variants across serotypes revealed significant correlations: PI-1+PI-2a was associated with serotype V, PI-1+PI-2b with serotypes III and IV, and PI-2a with serotype Ia. This demonstrates the relation between various pilus islands and certain serotypes, which are associated with particular clinical manifestations. Consequently, pilus islands could potentially serve as supplementary predictive indicators in virulence surveillance.
The virulence factors, which contribute to the evasion of the immune response are hyaluronidase, C5b protease, and beta-C protein encoded by hylB, scpB, and bac, respectively. Hyaluronidase is associated with the pathogenesis of ascending infections during pregnancy and the development of complications, including premature birth. According to data, it is detected in more than 95% of isolates, reaching 100% in some studies. The importance of this gene in the development of GBS infection is also described by the reduced pathogenicity of strains with inactivated hylB [46,53,58,59]. In the current study, hylB was genotypically identified in 97.1% of the strains, confirming its widespread occurrence and importance in the pathogenesis of diseases caused by GBS. Despite the lack of statistical significance in the distribution of hylB, we noted an increase of 2.1% in extra-vaginal isolates and 1.6% in Period 2, indicating a potential tendency for universal presence in these groups. These findings suggest that hylB could be considered a promising target for the treatment of invasive GBS infections [5]. The streptococcal protease C5a is a serine protease. The data indicates that the frequency of this gene ranges from 90% to 100%. Furthermore, it is regarded as a potential vaccine candidate or could function as a carrier for the capsule polysaccharide [35,38,46,56,60,61,62]. This aligns with our findings, emphasizing the importance of this factor. Beta-C protein suppresses immune responses, the alternative complement pathway, and phagocytosis by attaching to IgA, factor H, and immunoglobulin-like lectin 5 [11]. A low incidence (up to 22%) was noted in the majority of data, with the exceptions being reported from Argentina (58.7%) and Egypt (71.7%) [35,37,53,63]. In our research, this gene was identified in 17.2% of the isolates, and a significant decrease was observed during Period 2 (q < 0.05). In extra-vaginal isolates and during Period 2, bac underwent transitions that resulted in the formation of co-carriage modules with PI-2b/hvgA and fbsB/cylE, respectively. In addition, bac gene was significantly associated with non-typable isolates (q < 0.001). Therefore, this gene can potentially facilitate the genotypic tracking of non-typable GBS isolates.
GBS produces CAMP factor and beta-hemolysin/cytolysin. These toxins are used in diagnostics procedures known as the CAMP test and Granada agar. The literature indicates that the cfb gene is found in nearly 100% of isolates, while the prevalence of cylE ranges from 90% to 100%. Due to absence of cfb gene, mutations, or low gene expression (CAMP-negative phenotype) along with non-hemolytic strains (cylE-negative strains), both tests are employed primary for screening and they should be used alongside additional tests to achieve a definitive diagnosis [2,16,46,53,62,64,65,66,67]. In our research, cfb was universally present and served as a reference during the comparative analysis of the variable genes. Concerning cylE, 9.3% of isolates were negative. Moreover, there was a 5.3% decrease in the frequency of cylE during Period 2, which suggested a possible emergence of non-hemolytic strains in the future.
Limitation statement: Several limitations of this research should be acknowledged in relation to its scope, methodology approach, and presentation of the results. The molecular characterization is limited to well-known GBS virulence factors screened via PCR, rather than utilizing whole-genome sequencing (WGS) or multilocus sequence typing (MLST). Our methodology focuses on evaluating the distribution, co-occurrence patterns, and correlations, presenting findings through statistical analysis and visualizations produced via R-software. PCR exclusively detect specific, pre-targeted genetic sequences. Consequently, it cannot identify all virulence factors, their variations, regulatory mechanisms, or how exactly they are transmitted. Despite this, the biostatistical analyses using the limited data available, can create a reproducible, cost-effective approach for characterizing the main virulence patterns.
Our methodology demonstrates the integration of biostatistical approaches to characterize the observed patterns, rather than simply reporting virulence prevalence in isolation without supplementary descriptive evaluation. It provides a sensitive, and rapid option for monitoring of known target sequences without discovering sequence variations. Since our statistical methodology relies on association analysis and adjustments for multiple comparisons to evaluate targeted virulence genes, this study does not provide risk-prediction or clinical treatment evaluations. This screening evaluation established only the presence or absence of these sequences within the genome, the functional expression characteristics of the identified targets remained unexamined. The identified factors reflect the genetic potential for virulence in the isolates rather than demonstrating an established virulence phenotype, and all findings discussed in this study should be interpreted exclusively within the context of these descriptive boundaries.
Samples were collected from three university hospitals situated in two cities in Bulgaria. While this geographical area may appear limited, these hospitals serve large regional cities and their surrounding areas. Comparative statistical analyses across different cities and hospitals were not performed. Due to the complete anonymization of the dataset, patient residential locations were unavailable. Since these hospitals serve patients from extensive surrounding areas, analyzing data by location without confirmed residential demographic information would introduce bias.
Regarding the collection of patient data, only baseline metrics were included in accordance with our ethical boundaries. Furthermore, the clinical significance and eligibility criteria were established at the discretion of the attending physicians. This data limitation restricts the evaluation in depth of the comparison and variations across different anatomical sites.
Regarding to temporal time-trend observations, the dataset was evaluated by partitioning samples into two distinct periods (September 2021–December 2023 and January 2024–April 2026) rather than examining each year separately. This configuration was selected due to the inconsistent sampling periods in 2021 and 2026, with a reduced number of isolates and statistical bias on an annual basis. Although this multi-year configuration ensures data stability and is free from sample-type confounding, it demonstrates insufficient capacity to detect minor annual fluctuation trends over time.
5. Conclusions
The analysis of the prevalence and co-occurrence patterns of virulence genes in GBS, considering factors such as specimen source, time periods, and serotypes, provides a thorough understanding of their associations and prevalence. It further emphasizes possible applications in the surveillance of hypervirulent strains, along with characterizing the key factors that enable the pathogen to survive and cause infections. The integration of biostatistical analyses allowed us to recognize these variations and potentially evaluate the patterns of virulence gene distribution patterns. This can be accomplished by merging this analysis with microbiological data to critically evaluate the outcomes. In a broader context, the proposed approach can be used to analyze virulence, resistance, and other patterns within the genome, which are determined by genes and can be detected through PCR.
Supplementary Materials
The following supporting information can be downloaded at https://www.mdpi.com/article/10.3390/applbiosci5040105/s1, Table S1: Primer sequences and amplification conditions for the detection of virulence determinants in GBS.
Author Contributions
Conceptualization, V.S.B., A.S.A. and R.T.G.; methodology, V.S.B., A.S.A. and R.T.G.; software, V.S.B.; validation, V.S.B., A.S.A., L.B., H.Y.H. and R.T.G.; formal analysis, V.S.B.; investigation, V.S.B. and A.S.A.; resources, A.S.A., H.Y.H. and R.T.G.; data curation, V.S.B., A.S.A., L.B. and R.T.G.; writing—original draft preparation, V.S.B., A.S.A. and R.T.G.; writing—review and editing, R.T.G., A.S.A. and V.S.B.; visualization, V.S.B.; supervision, R.T.G. and A.S.A.; project administration, A.S.A., R.T.G. and V.S.B.; funding acquisition, A.S.A., R.T.G. and V.S.B. All authors have read and agreed to the published version of the manuscript.
Funding
This research was funded by Grant Contract No. D-122/2026 of Medical University-Sofia, Bulgaria.
Institutional Review Board Statement
Ethical review and approval were waived for this study since the project focused solely on bacterial isolates. The isolates were obtained during routine diagnostic procedures and analyzed as anonymized laboratory samples. The work did not involve direct contact, procedures, or interventions with patients, posing zero risk to their health. All personal data identifiers were removed.
Informed Consent Statement
Not applicable. In our study, we only investigated bacterial pathogens and their genotypic characteristics. There were no studies conducted on humans and their genomes. All patient materials were collected after a physical examination at the discretion of the attending physician and were intended for routine microbiological examination.
Data Availability Statement
All datasets generated or analyzed during the study are included in the manuscript.
Conflicts of Interest
The authors declare no conflicts of interest.
References
- Mejia, M.E.; Robertson, C.M.; Patras, K.A. Interspecies interactions within the host: The social network of group B Streptococcus. Infect. Immun. 2023, 91, e0044022. [Google Scholar] [CrossRef] [Scilit] [PubMed]
- Boyanov, V.S.; Alexandrova, A.S.; Gergova, R.T. Diagnostic challenges and genotypic characteristics of CAMP-negative phenotype GBS isolates. J. Pure Appl. Microbiol. 2025, 19, 2779–2787. [Google Scholar] [CrossRef] [Scilit]
- Silvestre, I.; Borrego, M.J.; Jordão, L. Biofilm formation by ST17 and ST19 strains of Streptococcus agalactiae. Res. Microbiol. 2020, 171, 311–318. [Google Scholar] [CrossRef] [Scilit] [PubMed]
- Jin, Z.; Li, J.; Zhou, H.; Wang, Z.; Yi, L.; Liu, N.; Du, J.; Chang, C.-Y.; Ji, W. Serotype Distribution, Virulence Determinants and Antimicrobial Susceptibility of Streptococcus agalactiae Isolated from Young Infants. Pathogens 2022, 11, 1355. [Google Scholar] [CrossRef] [Scilit] [PubMed]
- Liu, Y.; Liu, J. Group B Streptococcus: Virulence factors and pathogenic mechanism. Microorganisms 2022, 10, 2483. [Google Scholar] [CrossRef] [Scilit] [PubMed]
- Shabayek, S.; Spellerberg, B. Group B Streptococcal colonization, molecular characteristics, and epidemiology. Front. Microbiol. 2018, 9, 437. [Google Scholar] [CrossRef] [Scilit] [PubMed]
- Chacko, A.; Delbaz, A.; Choudhury, I.N.; Eindorf, T.; Shah, M.; Godfrey, C.; Sullivan, M.J.; St John, J.A.; Ulett, G.C.; Ekberg, J.A.K. Streptococcus agalactiae infects glial cells and invades the central nervous system via the olfactory and trigeminal nerves. Front. Cell. Infect. Microbiol. 2022, 12, 793416. [Google Scholar] [CrossRef] [Scilit] [PubMed]
- Megli, C.J.; Carlin, S.M.; Giacobe, E.J.; Hillebrand, G.H.; Hooven, T.A. Virulence and pathogenicity of group B Streptococcus: Virulence factors and their roles in perinatal infection. Virulence 2025, 16, 2451173. [Google Scholar] [CrossRef] [Scilit] [PubMed]
- Pietrocola, G.; Arciola, C.R.; Rindi, S.; Montanaro, L.; Speziale, P. Streptococcus agalactiae non-pilus, cell wall-anchored proteins: Involvement in colonization and pathogenesis and potential as vaccine candidates. Front. Immunol. 2018, 9, 602. [Google Scholar] [CrossRef] [Scilit] [PubMed]
- Gleich-Theurer, U.; Aymanns, S.; Haas, G.; Mauerer, S.; Vogt, J.; Spellerberg, B. Human serum induces streptococcal C5a peptidase expression. Infect. Immun. 2009, 77, 3817–3825. [Google Scholar] [CrossRef] [Scilit] [PubMed]
- Dobrut, A.; Brzychczy-Włoch, M. Immunogenic proteins of group B Streptococcus—Potential antigens in immunodiagnostic assay for GBS detection. Pathogens 2022, 11, 43. [Google Scholar] [CrossRef] [Scilit] [PubMed]
- Kolar, S.L.; Kyme, P.; Tseng, C.W.; Soliman, A.; Kaplan, A.; Liang, J.; Nizet, V.; Jiang, D.; Murali, R.; Arditi, M.; et al. Group B Streptococcus evades host immunity by degrading hyaluronan. Cell Host Microbe 2015, 18, 694–704. [Google Scholar] [CrossRef] [Scilit] [PubMed]
- Manuel, G.; Twentyman, J.; Noble, K.; Eastman, A.J.; Aronoff, D.M.; Seepersaud, R.; Rajagopal, L.; Waldorf, K.M.A. Group B streptococcal infections in pregnancy and early life. Clin. Microbiol. Rev. 2025, 38, e0015422. [Google Scholar] [CrossRef] [Scilit] [PubMed]
- Gergova, R.; Boyanov, V.; Muhtarova, A.; Alexandrova, A. A Review of the impact of streptococcal infections and antimicrobial resistance on human health. Antibiotics 2024, 13, 360. [Google Scholar] [CrossRef] [Scilit] [PubMed]
- Yang, S.; Rothman, R.E. PCR-based diagnostics for infectious diseases: Uses, limitations, and future applications in acute-care settings. Lancet Infect. Dis. 2004, 4, 337–348. [Google Scholar] [CrossRef] [Scilit] [PubMed]
- Rosa-Fraile, M.; Spellerberg, B. Reliable detection of group B Streptococcus in the clinical laboratory. J. Clin. Microbiol. 2017, 55, 2590–2598. [Google Scholar] [CrossRef] [Scilit] [PubMed]
- Tahir, M.F.; Ishtiaq, S.M.; Anas, M.; Irfan, A.; Jaremko, M.; Ercişli, S.; Almahasheer, H.; Abdelsalam, N.R. Integrating biotechnology into diagnostic labs: Innovations in PCR and molecular procedures. Curr. Res. Biotechnol. 2025, 10, 100325. [Google Scholar] [CrossRef] [Scilit]
- Haarman, B.C.; Riemersma-Van der Lek, R.F.; Nolen, W.A.; Mendes, R.; Drexhage, H.A.; Burger, H. Feature-expression heat maps—A new visual method to explore complex associations between two variable sets. J. Biomed. Inform. 2015, 53, 156–161. [Google Scholar] [CrossRef] [Scilit] [PubMed]
- Gu, Z.; Eils, R.; Schlesner, M. Complex heatmaps reveal patterns and correlations in multidimensional genomic data. Bioinformatics 2016, 32, 2847–2849. [Google Scholar] [CrossRef] [Scilit] [PubMed]
- Gu, Z.; Hübschmann, D. Make interactive complex heatmaps in R. Bioinformatics 2022, 38, 1460–1462. [Google Scholar] [CrossRef] [Scilit] [PubMed]
- Chen, J.; MacEachren, A.M.; Peuquet, D.J. Constructing overview+detail dendrogram-matrix views. IEEE Trans. Vis. Comput. Graph. 2009, 15, 889–896. [Google Scholar] [CrossRef] [Scilit] [PubMed]
- Carroll, L.N.; Au, A.P.; Detwiler, L.T.; Fu, T.C.; Painter, I.S.; Abernethy, N.F. Visualization and analytics tools for infectious disease epidemiology: A systematic review. J. Biomed. Inform. 2014, 51, 287–298. [Google Scholar] [CrossRef] [Scilit] [PubMed]
- Poyart, C.; Tazi, A.; Réglier-Poupet, H.; Billoët, A.; Tavares, N.; Raymond, J.; Trieu-Cuot, P. Multiplex PCR assay for rapid and accurate capsular typing of group B streptococci. J. Clin. Microbiol. 2007, 45, 1985–1988. [Google Scholar] [CrossRef] [Scilit] [PubMed]
- Imperi, M.; Pataracchia, M.; Alfarone, G.; Baldassarri, L.; Orefici, G.; Creti, R. A multiplex PCR assay for the direct identification of the capsular type (Ia to IX) of Streptococcus agalactiae. J. Microbiol. Methods 2010, 80, 212–214. [Google Scholar] [CrossRef] [Scilit] [PubMed]
- Delannoy, C.M.; Crumlish, M.; Fontaine, M.C.; Pollock, J.; Foster, G.; Dagleish, M.P.; Turnbull, J.F.; Zadoks, R.N. Human Streptococcus agalactiae strains in aquatic mammals and fish. BMC Microbiol. 2013, 13, 41. [Google Scholar] [CrossRef] [Scilit] [PubMed]
- Lacasse, M.; Valentin, A.S.; Corvec, S.; Bémer, P.; Jolivet-Gougeon, A.; Plouzeau, C.; Tandé, D.; Mereghetti, L.; Bernard, L.; Lartigue, M.F.; et al. Genotypic characterization and biofilm production of group B Streptococcus strains isolated from bone and joint infections. Microbiol. Spectr. 2022, 10, e0232921. [Google Scholar] [CrossRef] [Scilit] [PubMed]
- López, Y.; Parra, E.; Cepas, V.; Sanfeliú, I.; Juncosa, T.; Andreu, A.; Xercavins, M.; Pérez, J.; Sanz, S.; Vergara, A.; et al. Serotype, virulence profile, antimicrobial resistance and macrolide-resistance determinants in Streptococcus agalactiae isolates in pregnant women and neonates in Catalonia, Spain. Enferm. Infecc. Microbiol. Clin. 2018, 36, 472–477. [Google Scholar] [CrossRef] [Scilit] [PubMed]
- Teatero, S.; McGeer, A.; Low, D.E.; Li, A.; Demczuk, W.; Martin, I.; Fittipaldi, N. Characterization of invasive group B Streptococcus strains from the greater Toronto area, Canada. J. Clin. Microbiol. 2014, 52, 1441–1447. [Google Scholar] [CrossRef] [Scilit] [PubMed]
- Kaminska, D.; Ratajczak, M.; Szumała-Kąkol, A.; Dlugaszewska, J.; Nowak-Malczewska, D.M.; Gajecka, M. Increasing resistance and changes in distribution of serotypes of Streptococcus agalactiae in Poland. Pathogens 2020, 9, 526. [Google Scholar] [CrossRef] [Scilit] [PubMed]
- Otaguiri, E.S.; Morguette, A.E.; Tavares, E.R.; dos Santos, P.M.; Morey, A.T.; Cardoso, J.D.; Perugini, M.R.; Yamauchi, L.M.; Yamada-Ogatta, S.F. Commensal Streptococcus agalactiae isolated from patients seen at University Hospital of Londrina, Paraná, Brazil: Capsular types, genotyping, antimicrobial susceptibility and virulence determinants. BMC Microbiol. 2013, 13, 297. [Google Scholar] [CrossRef] [Scilit] [PubMed]
- Benjamini, Y.; Hochberg, Y. Controlling the false discovery rate: A practical and powerful approach to multiple testing. J. R. Stat. Soc. Ser. B 1995, 57, 289–300. [Google Scholar] [CrossRef] [Scilit]
- Haldane, J.B.S. The estimation and significance of the logarithm of a ratio of frequencies. Ann. Hum. Genet. 1956, 20, 309–311. [Google Scholar] [CrossRef] [Scilit] [PubMed]
- Anscombe, F.J. On estimating binomial response relations. Biometrika 1956, 43, 461–464. [Google Scholar] [CrossRef] [Scilit]
- Davies, D.L.; Bouldin, D.W. A cluster separation measure. IEEE Trans. Pattern Anal. Mach. Intell. 1979, PAMI-1, 224–227. [Google Scholar] [CrossRef] [Scilit]
- Bobadilla, F.J.; Novosak, M.G.; Cortese, I.J.; Delgado, O.D.; Laczeski, M.E. Prevalence, serotypes and virulence genes of Streptococcus agalactiae isolated from pregnant women with 35–37 weeks of gestation. BMC Infect. Dis. 2021, 21, 73. [Google Scholar] [CrossRef] [Scilit] [PubMed]
- de Figueiredo, S.G.; Lannes-Costa, P.S.; Cristoforêto, M.C.; Doran, K.S.; Mattos-Guaraldi, A.L.; Nagao, P.E. Streptococcus agalactiae strains isolated from cancer patients in Rio de Janeiro, Brazil. Braz. J. Microbiol. 2021, 52, 303–310. [Google Scholar] [CrossRef] [Scilit] [PubMed]
- El-Lakany, R.R.; Abdelmaged, E.S.; Shams, M.; Hassan, R.; Rizk, D.E. Incidence of virulence determinants among Streptococcus agalactiae isolated from pregnant women and association with their serotypes. Egypt. J. Basic Appl. Sci. 2023, 10, 650–670. [Google Scholar] [CrossRef] [Scilit]
- Kamińska, D.; Ratajczak, M.; Nowak-Malczewska, D.M.; Karolak, J.A.; Kwaśniewski, M.; Szumala-Kakol, A.; Dlugaszewska, J.; Gajecka, M. Macrolide and lincosamide resistance of Streptococcus agalactiae in pregnant women in Poland. Sci. Rep. 2024, 14, 3877. [Google Scholar] [CrossRef] [Scilit] [PubMed]
- Lopes, E.; Fernandes, T.; Machado, M.P.; Carriço, J.A.; Melo-Cristino, J.; Ramirez, M.; Martins, E.R.; Portuguese Group for the Study of Streptococcal Infections. Increasing macrolide resistance among Streptococcus agalactiae causing invasive disease in non-pregnant adults was driven by a single capsular-transformed lineage, Portugal, 2009 to 2015. Eurosurveillance 2018, 23, 1700473. [Google Scholar] [CrossRef] [Scilit] [PubMed]
- Morach, M.; Stephan, R.; Schmitt, S.; Ewers, C.; Zschöck, M.; Reyes-Velez, J.; Gilli, U.; Del Pilar Crespo-Ortiz, M.; Crumlish, M.; Gunturu, R.; et al. Population structure and virulence gene profiles of Streptococcus agalactiae collected from different hosts worldwide. Eur. J. Clin. Microbiol. Infect. Dis. 2018, 37, 527–536. [Google Scholar] [CrossRef] [Scilit] [PubMed]
- Rinaudo, C.D.; Rosini, R.; Galeotti, C.L.; Berti, F.; Necchi, F.; Reguzzi, V.; Ghezzo, C.; Telford, J.L.; Grandi, G.; Maione, D. Specific involvement of pilus type 2a in biofilm formation in group B Streptococcus. PLoS ONE 2010, 5, e9216. [Google Scholar] [CrossRef] [Scilit] [PubMed]
- Tazi, A.; Disson, O.; Bellais, S.; Bouaboud, A.; Dmytruk, N.; Dramsi, S.; Mistou, M.Y.; Khun, H.; Mechler, C.; Tardieux, I.; et al. The surface protein HvgA mediates group B streptococcus hypervirulence and meningeal tropism in neonates. J. Exp. Med. 2010, 207, 2313–2322. [Google Scholar] [CrossRef] [Scilit] [PubMed]
- Armistead, B.; Oler, E.; Waldorf, K.A.; Rajagopal, L. The double life of group B Streptococcus: Asymptomatic colonizer and potent pathogen. J. Mol. Biol. 2019, 431, 2914–2931. [Google Scholar] [CrossRef] [Scilit] [PubMed]
- Li, J.; Ji, W.; Gao, K.; Zhou, H.; Zhang, L.; Mu, X.; Yuan, C.; Guan, X.; Deng, Q.; Zhang, L.; et al. Molecular characteristics of group B Streptococcus isolates from infants in southern mainland China. BMC Infect. Dis. 2019, 19, 812. [Google Scholar] [CrossRef] [Scilit] [PubMed]
- McGee, L.; Chochua, S.; Li, Z.; Mathis, S.; Rivers, J.; Metcalf, B.; Ryan, A.; Alden, N.; Farley, M.M.; Harrison, L.H.; et al. Multistate, population-based distributions of candidate vaccine targets, clonal complexes, and resistance features of invasive group B Streptococci within the United States, 2015–2017. Clin. Infect. Dis. 2021, 72, 1004–1013. [Google Scholar] [CrossRef] [Scilit] [PubMed]
- Zeng, Z.; Li, M.; Zhu, S.; Zhang, K.; Wu, Y.; Zheng, M.; Cao, Y.; Huang, Z.; Liao, Q.; Zhang, L. Strain-level genomic analysis of serotype, genotype and virulence gene composition of group B Streptococcus. Front. Cell. Infect. Microbiol. 2024, 14, 1396762. [Google Scholar] [CrossRef] [Scilit] [PubMed]
- Gendrin, C.; Vornhagen, J.; Armistead, B.; Singh, P.; Whidbey, C.; Merillat, S.; Knupp, D.; Parker, R.; Rogers, L.M.; Quach, P.; et al. A Nonhemolytic group B Streptococcus strain exhibits hypervirulence. J. Infect. Dis. 2018, 217, 983–987. [Google Scholar] [CrossRef] [Scilit] [PubMed]
- Khazaal, S.; Al Safadi, R.; Osman, D.; Hiron, A.; Gilot, P. Dual and divergent transcriptional impact of IS1548 insertion upstream of the peptidoglycan biosynthesis gene murB of Streptococcus agalactiae. Gene 2019, 720, 144094. [Google Scholar] [CrossRef] [Scilit] [PubMed]
- Boyanov, V.S.; Alexandrova, A.S.; Gergova, R.T. Gene Factors and Serotypes Related to Polysaccharide and Protein-Based Candidate Vaccines Among Streptococcus agalactiae Isolates. Curr. Issues Mol. Biol. 2026, 48, 399. [Google Scholar] [CrossRef] [Scilit] [PubMed]
- Kaminska, D.; Ratajczak, M.; Nowicka, W.; Dlugaszewska, J.; Gajecka, M. New Strategies for Preventing Perinatal Group B Streptococcus (GBS) Infections. Pathogens 2026, 15, 22. [Google Scholar] [CrossRef] [Scilit] [PubMed]
- Bianchi-Jassir, F.; Paul, P.; To, K.N.; Carreras-Abad, C.; Seale, A.C.; Jauneikaite, E.; Madhi, S.A.; Russell, N.J.; Hall, J.; Madrid, L.; et al. Systematic review of group B Streptococcal capsular types, sequence types and surface proteins as potential vaccine candidates. Vaccine 2020, 38, 6682–6694. [Google Scholar] [CrossRef] [Scilit] [PubMed]
- Perme, T.; Golparian, D.; Ihan, M.B.; Rojnik, A.; Lučovnik, M.; Cerar, L.K.; Fister, P.; Krivec, J.L.; Grosek, Š.; Ihan, A.; et al. Genomic and phenotypic characterisation of invasive neonatal and colonising group B Streptococcus isolates from Slovenia, 2001–2018. BMC Infect. Dis. 2020, 20, 958. [Google Scholar] [CrossRef] [Scilit] [PubMed]
- Choi, J.H.; Kim, T.H.; Kim, E.T.; Kim, Y.R.; Lee, H. Molecular epidemiology and virulence factors of group B Streptococcus in South Korea according to the invasiveness. BMC Infect. Dis. 2024, 24, 740. [Google Scholar] [CrossRef] [Scilit] [PubMed]
- Margarit, I.; Rinaudo, C.D.; Galeotti, C.L.; Maione, D.; Ghezzo, C.; Buttazzoni, E.; Rosini, R.; Runci, Y.; Mora, M.; Buccato, S.; et al. Preventing bacterial infections with pilus-based vaccines: The group B streptococcus paradigm. J. Infect. Dis. 2009, 199, 108–115. [Google Scholar] [CrossRef] [Scilit] [PubMed]
- Nuccitelli, A.; Rinaudo, C.D.; Maione, D. Group B Streptococcus vaccine: State of the art. Ther. Adv. Vaccines. 2015, 3, 76–90. [Google Scholar] [CrossRef] [Scilit] [PubMed]
- Carreras-Abad, C.; Ramkhelawon, L.; Heath, P.T.; Le Doare, K. A vaccine against group B Streptococcus: Recent advances. Infect. Drug Resist. 2020, 13, 1263–1272. [Google Scholar] [CrossRef] [Scilit] [PubMed]
- Bedeley, E.; Gori, A.; Yeboah-Manu, D.; Diallo, K. Control of streptococcal infections: Is a common vaccine target achievable against Streptococcus agalactiae and Streptococcus pneumoniae. Front. Microbiol. 2021, 12, 658824. [Google Scholar] [CrossRef] [Scilit] [PubMed]
- Wang, Z.; Guo, C.; Xu, Y.; Liu, G.; Lu, C.; Liu, Y. Two novel functions of hyaluronidase from Streptococcus agalactiae are enhanced intracellular survival and inhibition of proinflammatory cytokine expression. Infect. Immun. 2014, 82, 2615–2625. [Google Scholar] [CrossRef] [Scilit] [PubMed]
- Coleman, M.; Armistead, B.; Orvis, A.; Quach, P.; Brokaw, A.; Gendrin, C.; Sharma, K.; Ogle, J.; Merillat, S.; Dacanay, M.; et al. Hyaluronidase impairs neutrophil function and promotes group B Streptococcus invasion and preterm labor in nonhuman primates. mBio 2021, 12, e03115-20. [Google Scholar] [CrossRef] [Scilit] [PubMed]
- Dutra, V.G.; Alves, V.M.; Olendzki, A.N.; Dias, C.A.; de Bastos, A.F.; Santos, G.O.; de Amorin, E.L.; Sousa, M.Â.; Santos, R.; Ribeiro, P.C.; et al. Streptococcus agalactiae in Brazil: Serotype distribution, virulence determinants and antimicrobial susceptibility. BMC Infect. Dis. 2014, 14, 323. [Google Scholar] [CrossRef] [Scilit] [PubMed]
- Huang, J.; Lin, X.Z.; Zhu, Y.; Chen, C. Epidemiology of group B streptococcal infection in pregnant women and diseased infants in mainland China. Pediatr. Neonatol. 2019, 60, 487–495. [Google Scholar] [CrossRef] [Scilit] [PubMed]
- Schindler, Y.; Rahav, G.; Nissan, I.; Treygerman, O.; Prajgrod, G.; Attia, B.Z.; Raz, R.; Valenci, G.Z.; Tekes-Manova, D.; Maor, Y. Group B streptococcus virulence factors associated with different clinical syndromes: Asymptomatic carriage in pregnant women and early-onset disease in the newborn. Front. Microbiol. 2023, 14, 1093288. [Google Scholar] [CrossRef] [Scilit] [PubMed]
- Eskandarian, N.; Ismail, Z.; Neela, V.; van Belkum, A.; Desa, M.N.; Nordin, S.A. Antimicrobial susceptibility profiles, serotype distribution and virulence determinants among invasive, non-invasive and colonizing Streptococcus agalactiae (group B Streptococcus) from Malaysian patients. Eur. J. Clin. Microbiol. Infect. Dis. 2015, 34, 579–584. [Google Scholar] [CrossRef] [Scilit] [PubMed]
- Tickler, I.A.; Tenover, F.C.; Dewell, S.; Le, V.M.; Blackman, R.N.; Goering, R.V.; Rogers, A.E.; Piwonka, H.; Jung-Hynes, B.D.; Chen, D.J.; et al. Streptococcus agalactiae strains with chromosomal deletions evade detection with molecular methods. J. Clin. Microbiol. 2019, 57, e02040-18. [Google Scholar] [CrossRef] [Scilit] [PubMed]
- Jones, S.; Newton, P.; Payne, M.; Furfaro, L. Epidemiology, antimicrobial resistance, and virulence determinants of group B Streptococcus in an Australian setting. Front. Microbiol. 2022, 13, 839079. [Google Scholar] [CrossRef] [Scilit] [PubMed]
- Creti, R.; Imperi, M.; Stanziale, A.; Giuliani, G.; Fazii, P.; Savini, V. Group B streptococci (GBS) strains evading molecular diagnostics showed novel chromosomal deletions encompassing the CAMP-factor (cfb) encoding gene. Eur. J. Clin. Microbiol. Infect. Dis. 2023, 42, 913–916. [Google Scholar] [CrossRef] [Scilit] [PubMed]
- Zhou, J.; Zhang, L.; Zhang, Y.; Liu, H.; Xu, K.; Zhang, B.; Feng, T.; Yang, S. Analysis of molecular characteristics of CAMP-negative Streptococcus agalactiae strains. Front. Microbiol. 2023, 14, 1189093. [Google Scholar] [CrossRef] [Scilit] [PubMed]

Disclaimer/Publisher’s Note: The statements, opinions and data contained in all publications are solely those of the individual author(s) and contributor(s) and not of MDPI and/or the editor(s). MDPI and/or the editor(s) disclaim responsibility for any injury to people or property resulting from any ideas, methods, instructions or products referred to in the content. |
© 2026 by the authors. Licensee MDPI, Basel, Switzerland. This article is an open access article distributed under the terms and conditions of the Creative Commons Attribution (CC BY) license.