


Abstract
Crude oil tank bottoms, a mix of oil, sediment, and water from crude oil collection tanks, are a significant waste stream associated with global oil production. In benchtop testing, as an intermediate evaluative step in progressive scaling toward industrial-scale treatment to recover oil from tank bottoms and to reduce waste, sonication was applied to samples from three California oilfields using only added water and mechanical mixing. The 2.2 kg sample size, over 40 times that used in most of the testing found in literature, utilized no chemicals during treatment. The tests employed a 1:4 ratio of sludge to added water in an acrylic tank with two 500-watt drop-in plate sonicators. Trial variables included sonication frequencies of 28 or 40 kilohertz, mixing speed, treatment duration, and oil collection methods. Oil recoveries up to 98.2% with mean recoveries of 27.4% were achieved using 0.2 kilowatt-hours per kilogram sample. This study indicated sonication treatment of crude oil tank bottoms with only added water and mixing was a potentially viable approach for waste oil recovery and waste minimization and warrants further investigation at even larger scale.
Keywords:
sonication; tank bottoms; oil recovery; hydrocarbon recovery; oil sludge; sludge treatment 1. Introduction
A considerable amount of petroleum sludge is generated during upstream oil production operations, with an estimated five tons of oily sludge for every 1000 tons of oil produced [1]. Four main types of petroleum sludges include landing, drilling waste, refinery, and tank bottom sludges [2]. Of interest to this study was the later, defined by Wang et al. [3] as that which accumulates at the bottom of crude oil tanks, refinery product tanks, de-salters, and other oil storage facilities.
Petroleum sludge is characterized by a crude oil content in excess of 30% by mass [4,5]. Due to hazardous constituents including benzene and polycyclic aromatic hydrocarbons (PAH), up to 550 mg (milligram) per kg (kilogram) according to Bojes and Pope [6], proper management of petroleum sludges is necessary to minimize adverse impacts to human health, ground water resources, and the environment. Literature indicated three primary methods for management: (1) prevention or reduction in petroleum sludge generation; (2) oil recovery from the oily sludge; and (3) disposal of the unrecoverable petroleum sludge. Oil recovery and/or disposal methods are more complex and may frequently involve one or more technologies. Oil recovery methods include solvent extraction, centrifugation treatment, frost and melt treatment, sludge pyrolysis, microwave radiation, electromagnetic methods, froth flotation, surfactant-free microemulsion (SFME) [7], and ultrasonic irradiation (sonication) [8]. Disposal includes incineration, solidification/stabilization, oxidation, land-farming/landfilling, chemical handling, solvent extraction, pyrolysis, photo-catalysis, biodegradation, and ultrasonic treatment [9,10,11,12].
Due to the high cost of sludge treatment/disposal and since petroleum sludge can have a high recycling value due to its crude oil content [13,14,15], methods for recovering crude oil from oil bearing waste streams with a corresponding reduction in waste become more economically feasible. While a variety of extraction procedures have been used, recovery rates are reportedly low and energy costs high. While simplistic in composition (crude oil, sediment, and water), the nature of the mix is usually thick and viscous, and the sediment consists of sand to clay size fractions with a high surface area that is likely completely wetted by hydrocarbon. This complexity makes it difficult to extract hydrocarbon.
As indicated, sonication was one method of recovering crude oil from sludges. Sonication involves high frequency sound waves > 18 kHz (kilohertz) [16] that propagate through a treatment medium, typically water or a water-based mixture. Each wave generates a compression phase, exerting a positive pressure, followed by rarefaction, or negative pressure phase [17]. The result of these alternating positive and negative waves is the formation of micron-sized bubbles which form on the substrate surface and grow until they reach resonant or unstable levels and implode [16]. Energy released during bubble implosion and the dynamics of that release frees contaminants from their bond with the substrate.
Advantages of sonication include its speed and efficiency, it occupies a relatively small footprint, it can be used simultaneously with other technologies, and it has a wide range of applications [18,19]. Its use and efficacy for hydrocarbon removal from solid substrates has been studied and documented by many [20,21,22,23,24,25,26,27,28,29,30,31,32,33,34]. Applications included oil removal and/or recovery; soil treatment/washing; dehydrating, demulsification, and/or desalting crude oil; and contaminant extraction for laboratory analysis. While all articles provided insight, of particular interest were those that utilized oily sludge from refinery tank bottoms, production plants, or water treatment plants [10,29,30,31,32,34]. Of note was that most of those applications used additives, including but not limited to surfactants and/or solvents, and with the exception of one 7500 gal (gallon) pilot scale test which used added chemicals, all tests were performed using <100 gm (gram) samples and typically <50 gm.
Since the scale of testing found in the gross majority of literature was much less than the 2.2 kg sample size intended for this study, nor were solvents, surfactants, or any other chemicals other than water to be used for the testing, literature was used as a guide to identify potentially relevant variables and optimal ranges for them. Variables of interest included sludge:added water mass ratio; pretreatment stirring; sonication frequency; power; sonication treatment time; and stirring during treatment. Relevant findings for each were as follows:
Sludge-to-Added Water Mass Ratio: Most research utilized additional water for treatment. The optimal sludge:added water ratio was in the 1:3 to 1:4 range.
Sonication Delivery: Most applications used probe- or bath-type sonicators. Results suggested probe-type sonicators were marginally more effective, delivering energy directly to the sample. Abramov et al. [26] found both probe- and bath-type sonicators achieved similar results, yet treatment times for the probe-type sonicator were about 1/3 that of the bath-type, and Hu et al. [31] tested bath- and probe-type sonicators and found the probe-type to be somewhat more efficient (68% vs. 63%, respectively).
Sonication Frequency: Lower sonication frequencies deliver more energy and were believed to be more suitable for sonication treatment of oil sludges since the desired cavitation was less likely to happen with higher frequencies [10]. Most literature reviewed supported the efficacy of lower frequencies with optimal frequencies ranging from 20–40 kHz.
Applied Power: Literature indicated a range of 20 W (watts) to 500 W for lab-scale testing. Due to variations in scale and type of application, it was difficult to determine effective ranges for applied power, although within any package of research, the trend was increasing efficacy with increasing power. Zhao et al. [32], however, indicated that if sonication treatment parameters were not well controlled, it could have the detrimental effect of promoting emulsification, resulting in a reduction in treatment efficacy.
Sonication Treatment Time and Treatment Cycling: Sonication treatment time ranged from 10 s (sec) to 360 min (min). In general, treatment times varied depending on the treatment scenario. Na et al. [25] indicated removal efficiency generally increased with sonication time, higher power intensity, and larger particle size, but that the optimal operating conditions should consider both power intensity and irradiation time. Zhang et al. [34] indicated better treatment performance with high power and shorter treatment times versus lower power, longer treatment time scenarios. Overall, while no clear pattern could be defined, literature generally suggested longer treatment times could be beneficial. Feng and Aldrich [20], however, found that excessive treatment time could be detrimental, resulting in emulsification and a reduction in recovered product.
Treatment Cycling: Treatment cycling was investigated by a few authors [20,23,28,31], and while most found it beneficial in product recovery, Banjoo and Nelson [23] found that cycling up to four times was beneficial while five times was a detriment. It is also important to note that all those who investigated cycling used chemical additives which could have played into the results.
Stirring—Pretreatment: Only Na et al. [25] addressed pretreatment stirring and indicated a pretreatment stirring time of 2 h (hr) was beneficial.
Stirring—During Treatment: Zhao et al. [32] looked at sonication performance with and without stirring and indicated that mixing at 200 rpm (rotations per min) provided a 92.8% oil removal vs. 84.1% without, and a 78.0% removal at 600 rpm. Zhao et al. also indicated that high intensity stirring could lead to emulsification. Observations by this team during preliminary testing for this work indicated that stirring during treatment agitated the sludge and released free oil trapped by the sediment matrix.
This report details the findings of application-focused research at an intermediate step in a scale-progressive evaluation of the use of ultrasonics for the treatment of crude oil tank bottoms using only added water and stirring for oil recovery and waste minimization. Considered novel for its use of 2.2 kg samples with no added solvents, surfactants, or other chemicals during treatment, testing utilized samples that were over 40 times larger than most of those found in literature for the treatment of crude oil sludges. Previous testing performed by this research team at the 400-gm scale indicated that sample:added water mass ratios of 1:4, pretreatment stirring, stirring at 200 rpm during sonication treatment, and treatment times of 40 to 180 min were determined by the team to be effective for testing at this larger scale. Tank bottom samples from three California (USA) oilfields were used, and the above-mentioned sludge:added water mass ratio of 1:4 was used for all testing. Sonicators were submersible plates with 500 W generators. Variables for treatment optimization included pre-treatment stirring/mixing, sonication frequencies of 28 kHz or 40 kHz, stirring/mixing speed during sonication, duration of sonication treatment, and collection of free oil during treatment vs. post-treatment. Note that this research was simply focused on the efficacy of bulk treatment (oil recovery and sediment production) of oilfield tank bottoms to determine whether pursuit of larger scale applications would make sense: it does not focus intently on the chemistry of those individual samples to determine the suitability of one vs. another since such an approach would not be feasible in an oilfield setting, nor was it designed as a mechanistic study or a study to determine statistically significant optimal sets of variables for treatment. This document provides the experiences of sonication treatment using nothing but added water to those who might be seeking alternatives to the management of tank bottoms.
2. Equipment, Materials, and Methods
2.1. Equipment
2.1.1. Sonicators
Testing was performed using two Beijing Ultrasonic model 500 W ultrasonic generators (Beijing Ultrasonics, Tongzhou, District, Beijing, China), each with its own power supply, and a pair of 24 × 24 × 10 cm (centimeter) sealed, stainless steel sonicator plates, each with 15 transducers. One sonicator was configured for 28 kHz operation, the other 40 kHz, two standard design frequencies within the optimal frequency range of 20–40 kHz found in literature and discussed above. Sonicators were simple in operation with only an on/off switch and no variable power or other user selectable options. The power supplies were 120 V and 500 W, and per the manufacturer, typical operation for a single sonicator was 1.5 A to 2.0 A (amps) which was displayed on the unit during operation. While variable power and/or variable frequency sonicators might have been valuable, the addition of either or both of these attributes was beyond the scope for the project.
2.1.2. Treatment Vessels/Tanks
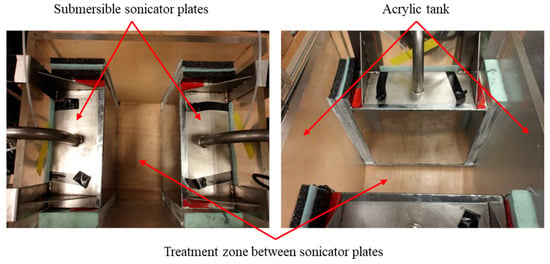
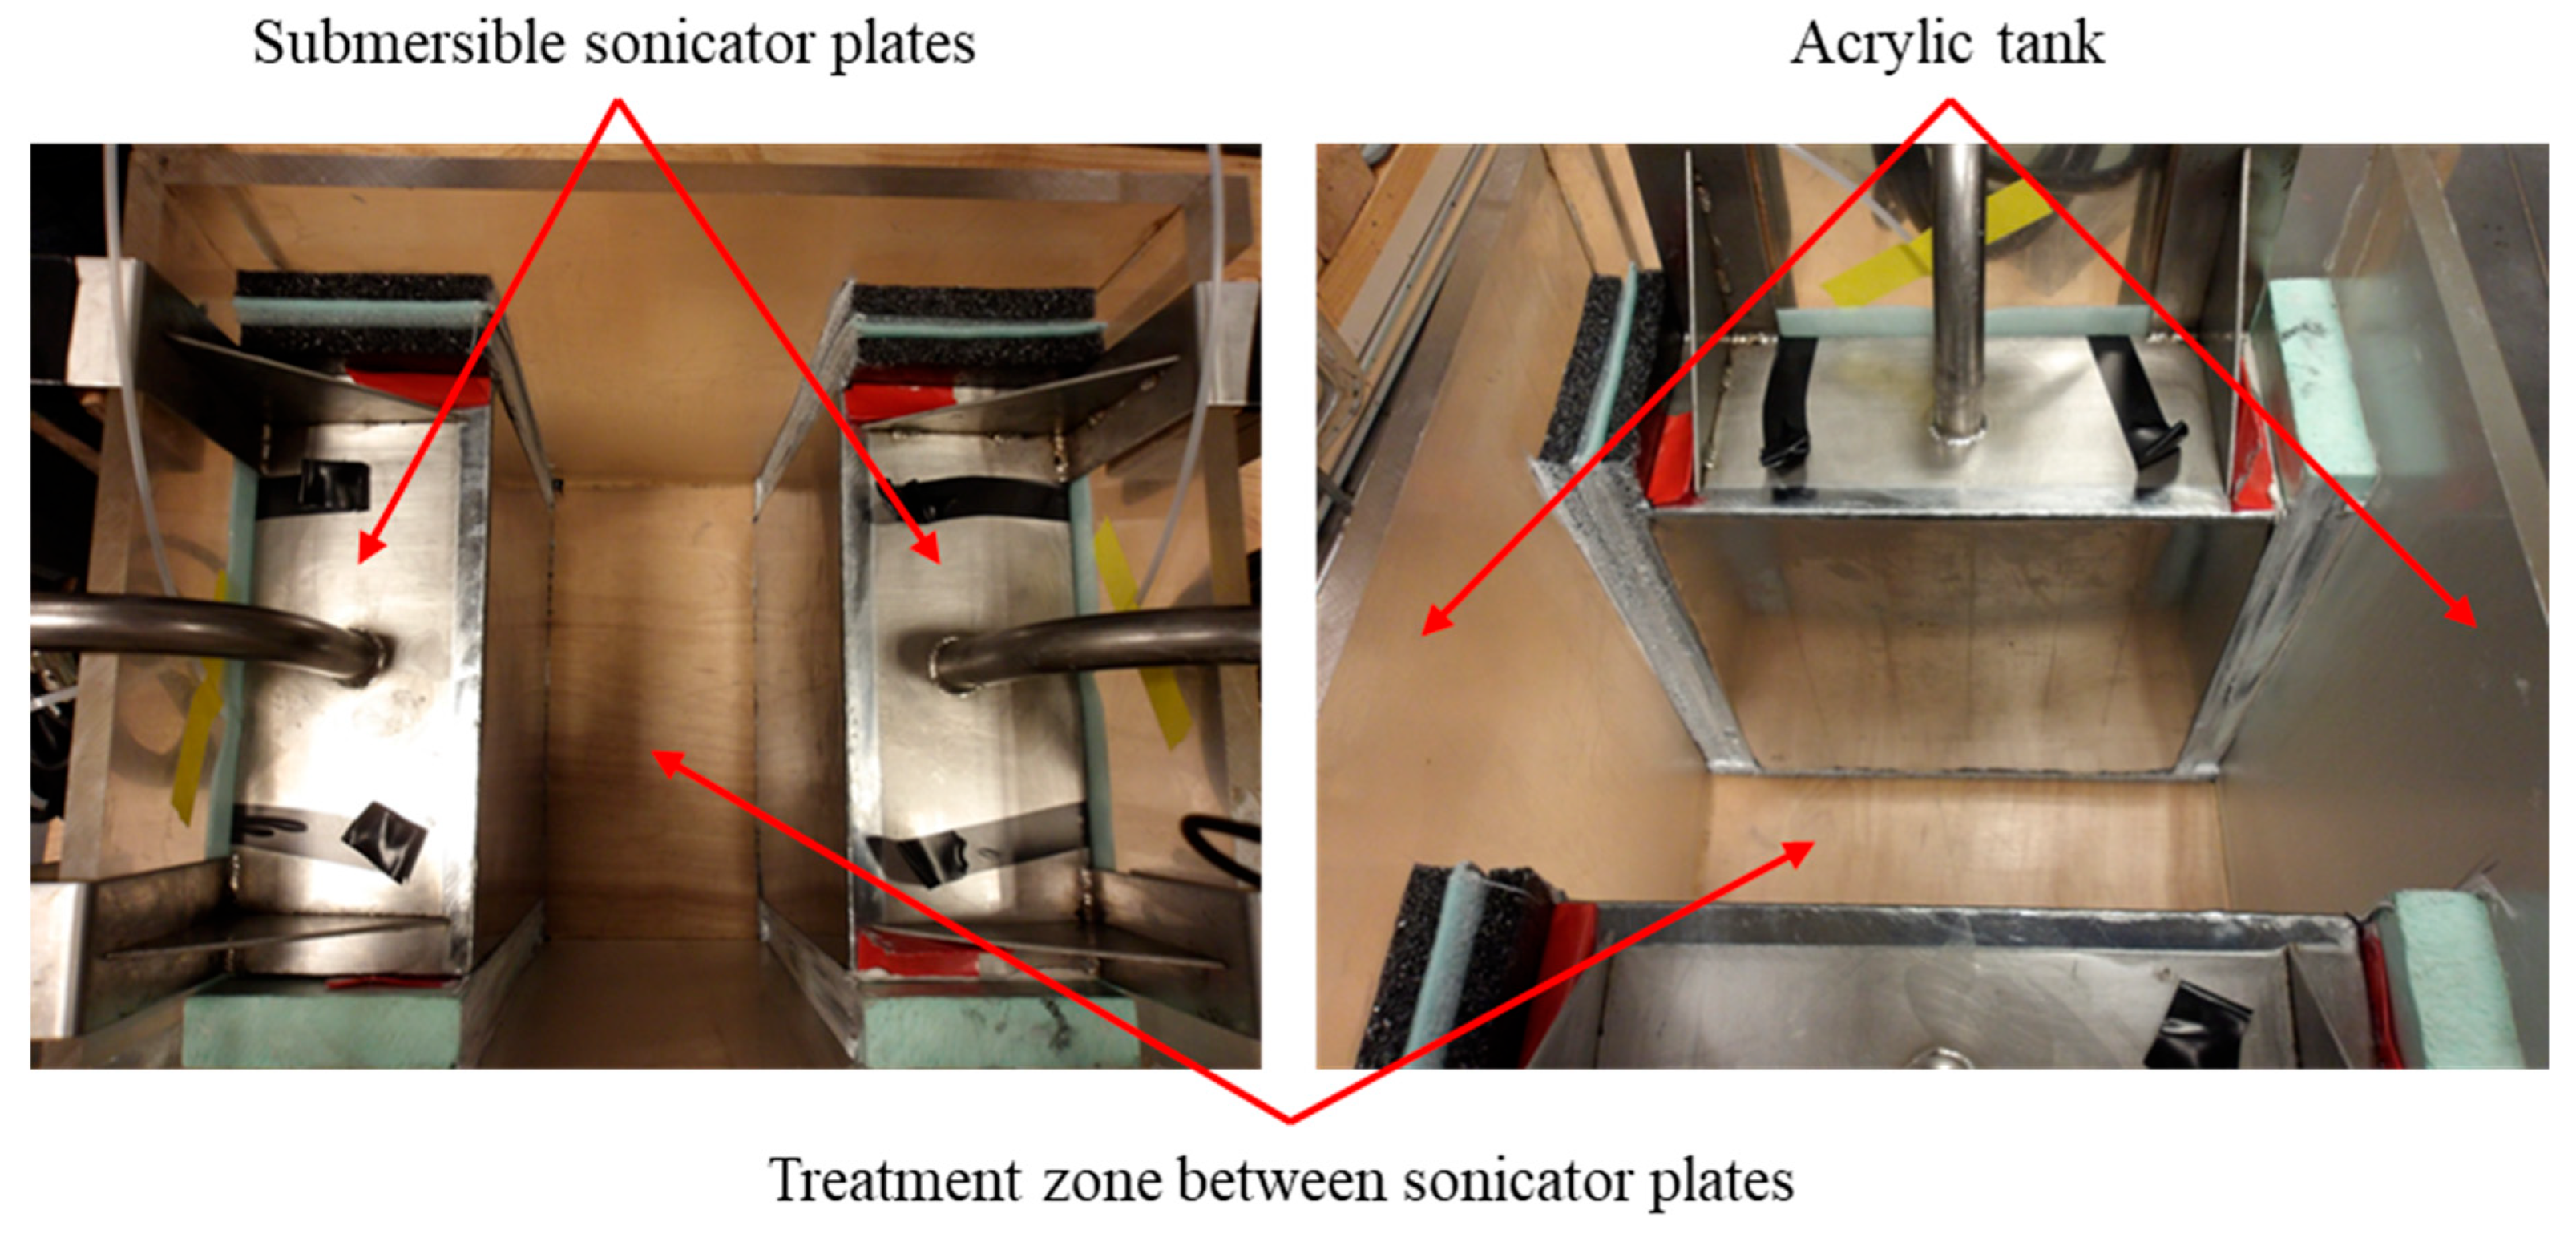
Testing was performed in custom made 30.5 × 35.5 × 35.5 cm (internal dimensions) acrylic tanks, capable of holding the two sonicator plates described above. Acrylic plates 1.25 cm thick were custom cut by a plastic supplier (Professional Plastics, Tempe, AZ, USA), and tanks were assembled by the research team. The two sonicator plates hung from the opposing 30.5 cm tank walls, approximately 1.25 cm off the tank floor, with the active sides facing into the center of the tank. Sonicator plates were shimmed beneath and on both sides with rigid, closed-cell foam and sealed to prevent water and sample from migrating around, beneath, or behind the sonicator plates. The finished product created a treatment zone of 30.5 × 15.5 × 25.5 cm with a volume of 11.5 L (liter). Figure 1 provides top views of the assembled tank.
Figure 1.
Top views of large treatment tank with sonicators and treatment cavity.
2.1.3. Stirring
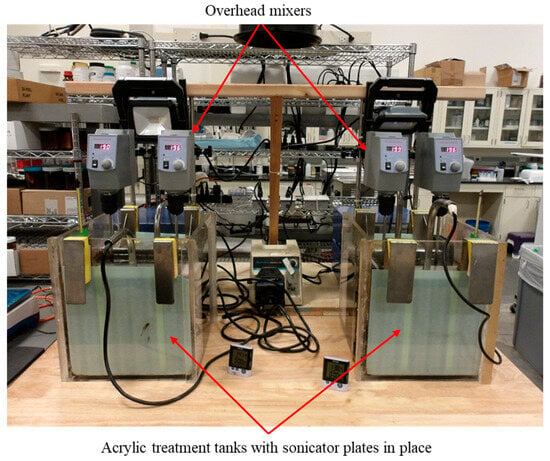
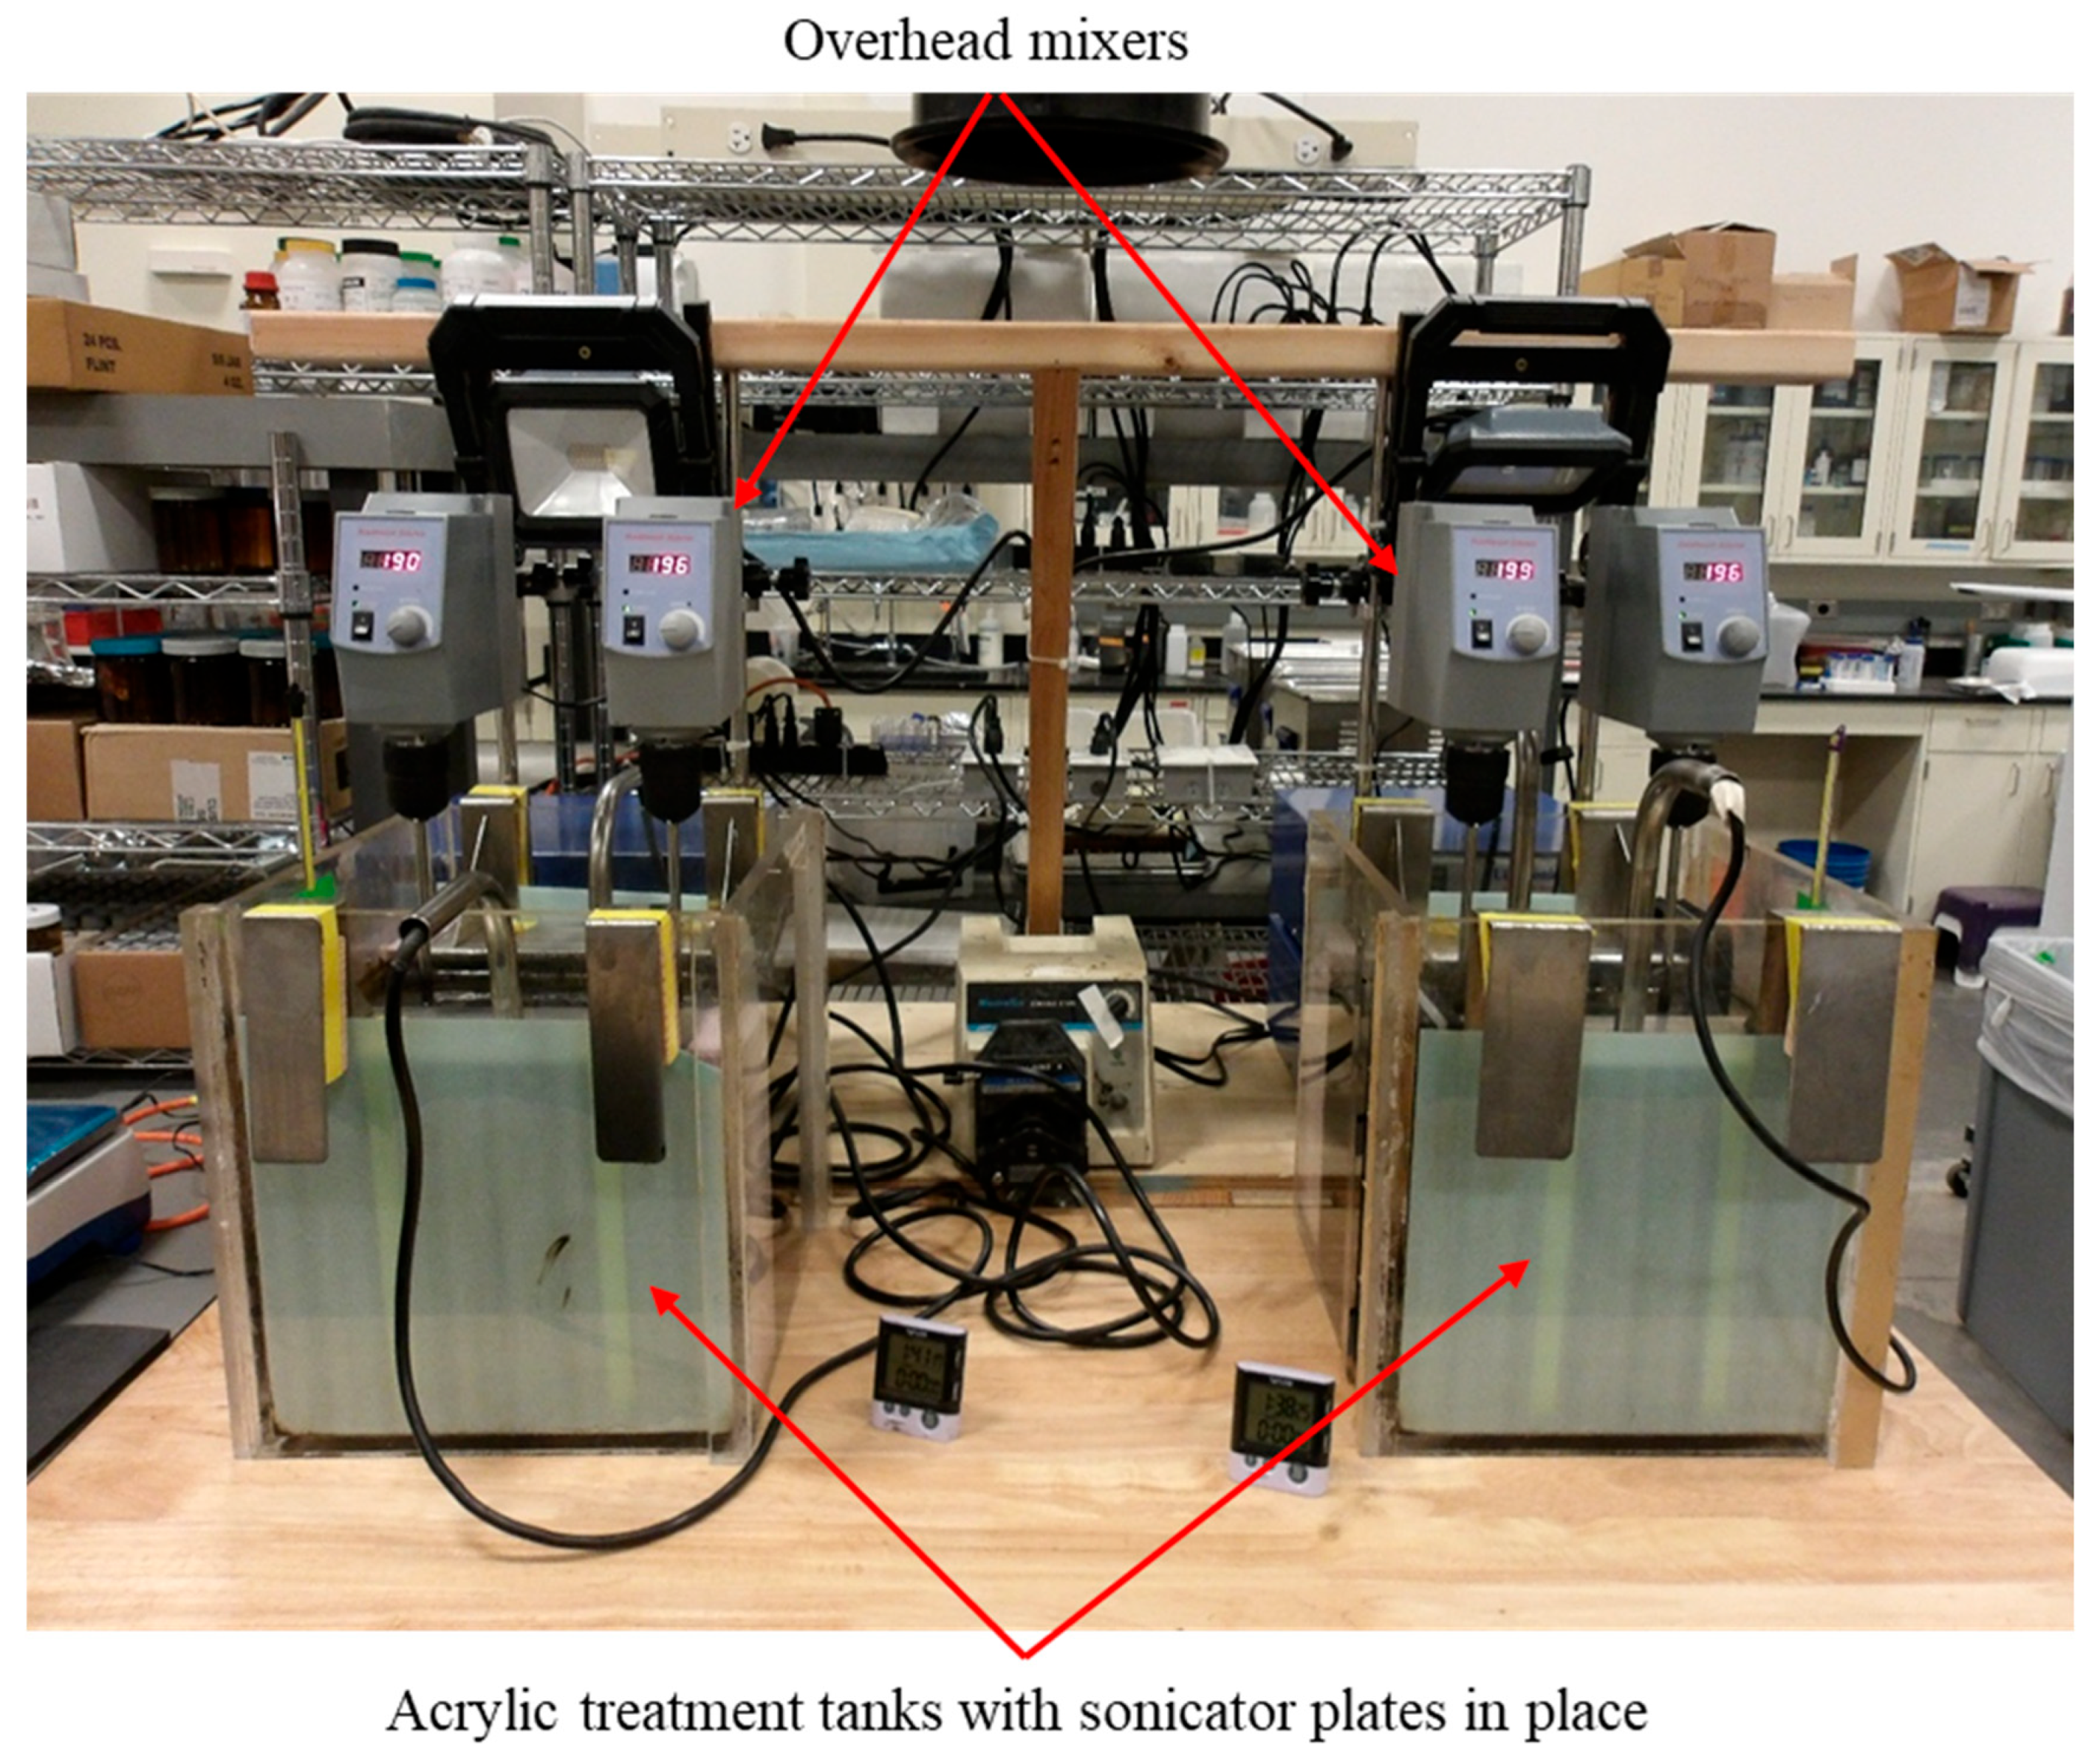
Sample mixing was facilitated using two Southwest Science SOS20 20 L digital variable speed overhead stirrers with center up mixing bars (Southwest Science, Trenton, NJ, USA). The mixing bars were placed approximately 0.64 cm off the tank floor to agitate and lift the sludge during treatment. Figure 2 provides a photo of the experimental setup.
Figure 2.
Experimental setup.
2.1.4. Analytical
Pre- and post-treatment sample water, oil/hydrocarbon (HC; note that when discussing analytical, oil and HC may be used interchangeably herein), and sediment content analyses were performed using a gravimetric method with mass tracking. Mass was determined using either an Adam CKT 48UH check scale (0.5 gm resolution; Adam Equipment, Inc., Oxford, CT, USA) for samples (with container) greater than 1 kg or a Veritas M6202i Precision Balance (0.01 gm resolution; Veritas, Santa Clara, CA, USA) for smaller samples. Sample drying used either a Binder Model ED115 gravity oven (Binder GmbH, Tuttlingen, Germany) or a Breville Model BOV900BSS oven (Breville USA; Breville Group Limited, Sydney, Australia). Ashing was performed using a Yamato FO810CR programmable muffle furnace (Yamato Scientific America, Santa Clara, CA, USA; Yamato Scientific, Yamato Scientific Co., Ltd., Tokyo, Japan). Note that analyses to differentiate petroleum vs. non-petroleum HC for this project was not undertaken, and as such, it was assumed that all combustible material in the samples was petroleum HC. Also, no chemical analyses beyond those mentioned were performed: the goal of this study was treatability, not, as indicated previously, a mechanistic study including sample chemistry and its effects on treatability.
2.1.5. Power Assessment
To estimate energy use, AC (alternating current) power assessments were performed for both sonicators using the following methods: (1) instantaneous voltage, amperage, and power factor (PF) readings were taken using a Kill-A-Watt meter (P3 International, Sanford, NC, USA); and (2) independent voltage and amperage data were continuously logged using an SV300 AC voltage sensor (0–300 V (volts)), an SC220A AC amperage sensor (1–200 A), and an XR5-SE datalogger, all manufactured by Pace Scientific, Boone, NC, USA.
2.2. Materials/Samples
Tank bottom samples from three California oilfields (A, B, and C), each producing heavy crude oil, were obtained for sonication testing. Samples were received in bulk 20 L containers. Upon receipt, the bulk sample (contents of all 20 L buckets) was homogenized and decanted into 4 L containers. Due to the tendency for water to immediately separate from the sample, excess freestanding water was poured from each 4 L container after opening and the remaining sample in the bucket was homogenized prior to each use. Pre-treatment gravimetric analyses were performed for each sample tested to determine oil, sediment, and water content. A statistical summary of that data is shown in Table 1.
Table 1.
Statistical summary of sample constituency for pre-treatment analyses performed for samples collected for testing (% by weight).
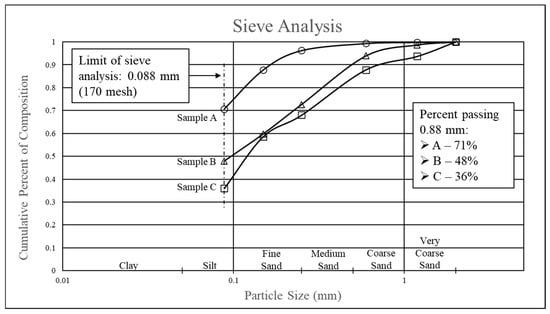
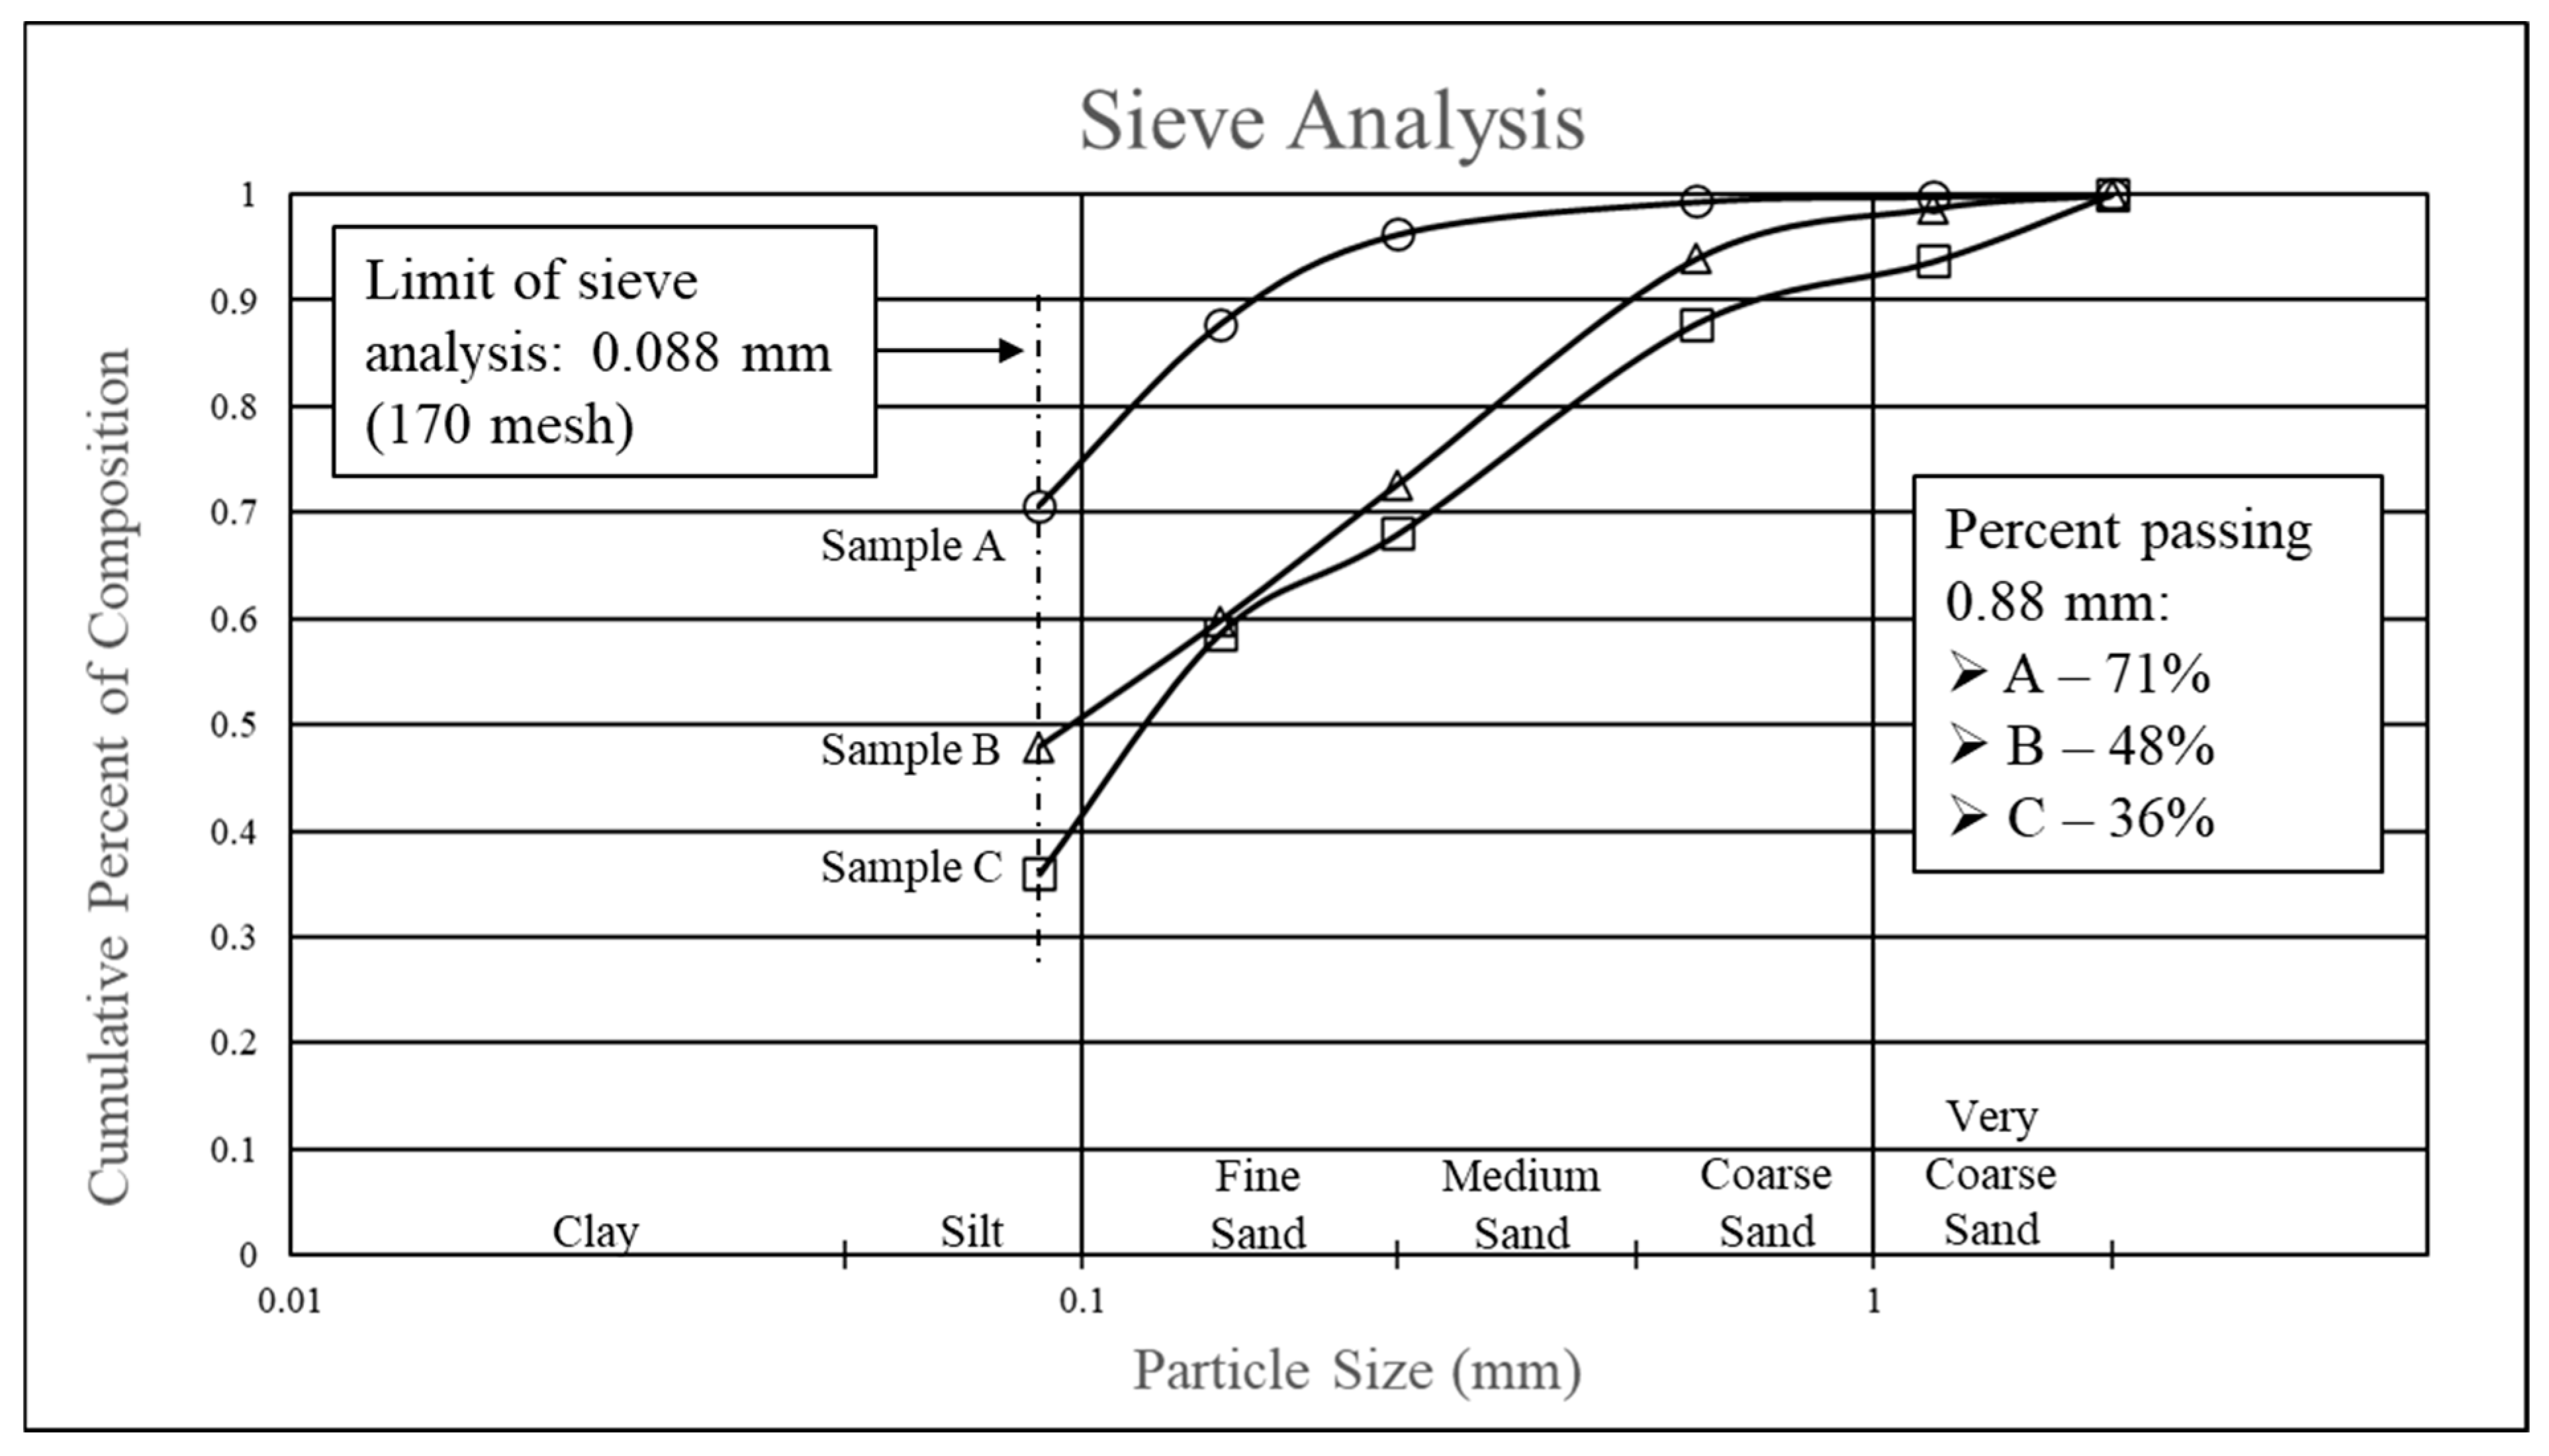
Sieve analyses were also performed on bulk samples using 6, 30, 60, 100, 130, and 170 mesh screens. In preparation for sieving, samples were washed multiple times with toluene to remove hydrocarbon, centrifuging each time to separate the fines, and then dried. While both samples A and B could be dry sieved, due to the aggregation of fines with sample C, wet sieving was used. Results of sieve analyses are shown in Figure 3.
Figure 3.
Sieve analyses for tank bottom samples A, B, and C.
2.3. Methods
2.3.1. Sonication Treatment
Sonication treatment included sample preparation, pretreatment stirring, and sonication treatment (as applicable). Sample collection will be discussed as a separate section.
For sample addition, the tank was placed on a scale, the mass of the tank logged, the scale tared for sample addition, and 2.2 kg of sample was added. The applicable mass ratio of reverse osmosis (RO) water was then added. RO water was chosen due to the high salinity of municipal tap water available.
Following sample addition, the treatment vessel was placed beneath the overhead mixer(s), and the stirring rods were set in place. Pretreatment involved stirring the sample at the specified rpm for 60 min.
For sonication treatment, overhead mixers were adjusted to the specified rpm and the sonicators were powered on for the prescribed treatment time. Treatment times of 40, 120, and 180 min were used and were loosely based on experience at smaller scale and treatment times from the literature. No treatment cycling was investigated due to the limited scope of the project. Following treatment, the stirring rods were removed, and the samples were covered and allowed to sit overnight (~17 h) before sample collection.
2.3.2. Sample Collection
Prior to sonication treatment, the prepared sample consisted of two stratified phases: water and the underlying tank bottom sample. Following treatment, which included settling overnight, the following stratified phases could be present, listed in order from top to bottom within the tank: free oil (always present), water (always present), oily sludge (predominantly oil that separated and settled back to the bottom; might be present), sludge (a mix of water/oil/sediment; might be present), and bottom sediment.
To understand recoverable oil, testing focused on the free oil and water phases, both were identified as phases which could be processed by the plant for oil recovery. Free oil and water phases were readily differentiable from other underlying phases and could be independently collected. Other phases, while sometimes visibly separate, were difficult to separate. As such, those phases were extracted and analyzed together for mass balance purposes only. Regarding recoverable oil, while free oil is easily understood, oil recovery from the water phase was not as clear, and analytical determination of available oil in this research could well differ from and be greater than actual recovery by plant/refinery operations.
The primary phase of interest with respect to oil recovery was free oil. Free oil was the relatively clean oil product that separated from the tank bottom sample, floated to the water surface, and could be readily collected. It was not uncommon that a portion of that phase would also stick to the treatment vessel walls. Although not readily collectable, free oil that adhered to vessel walls was also considered recoverable: since the tank was thoroughly cleaned between tests, the free oil that adhered was in fact oil that had separated during that test. Also, if one considers pilot or larger scale testing, it may not be possible to clean the tank after each test and there would be an inherent limitation to how much oil could adhere to the vessel walls, so all free oil would then be collectable. Note that while free oil was relatively clean, it did contain sediment (~5%) and a small amount of water that was not possible to quantify.
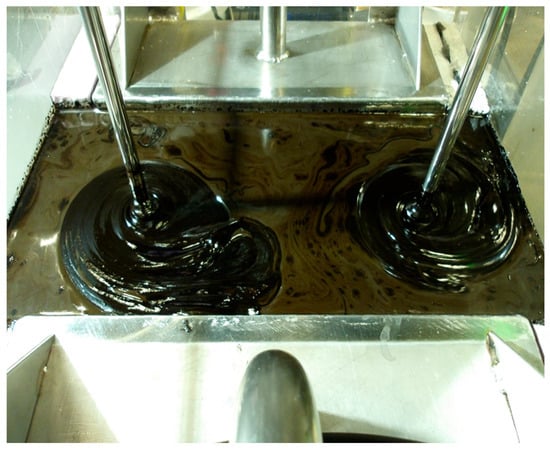
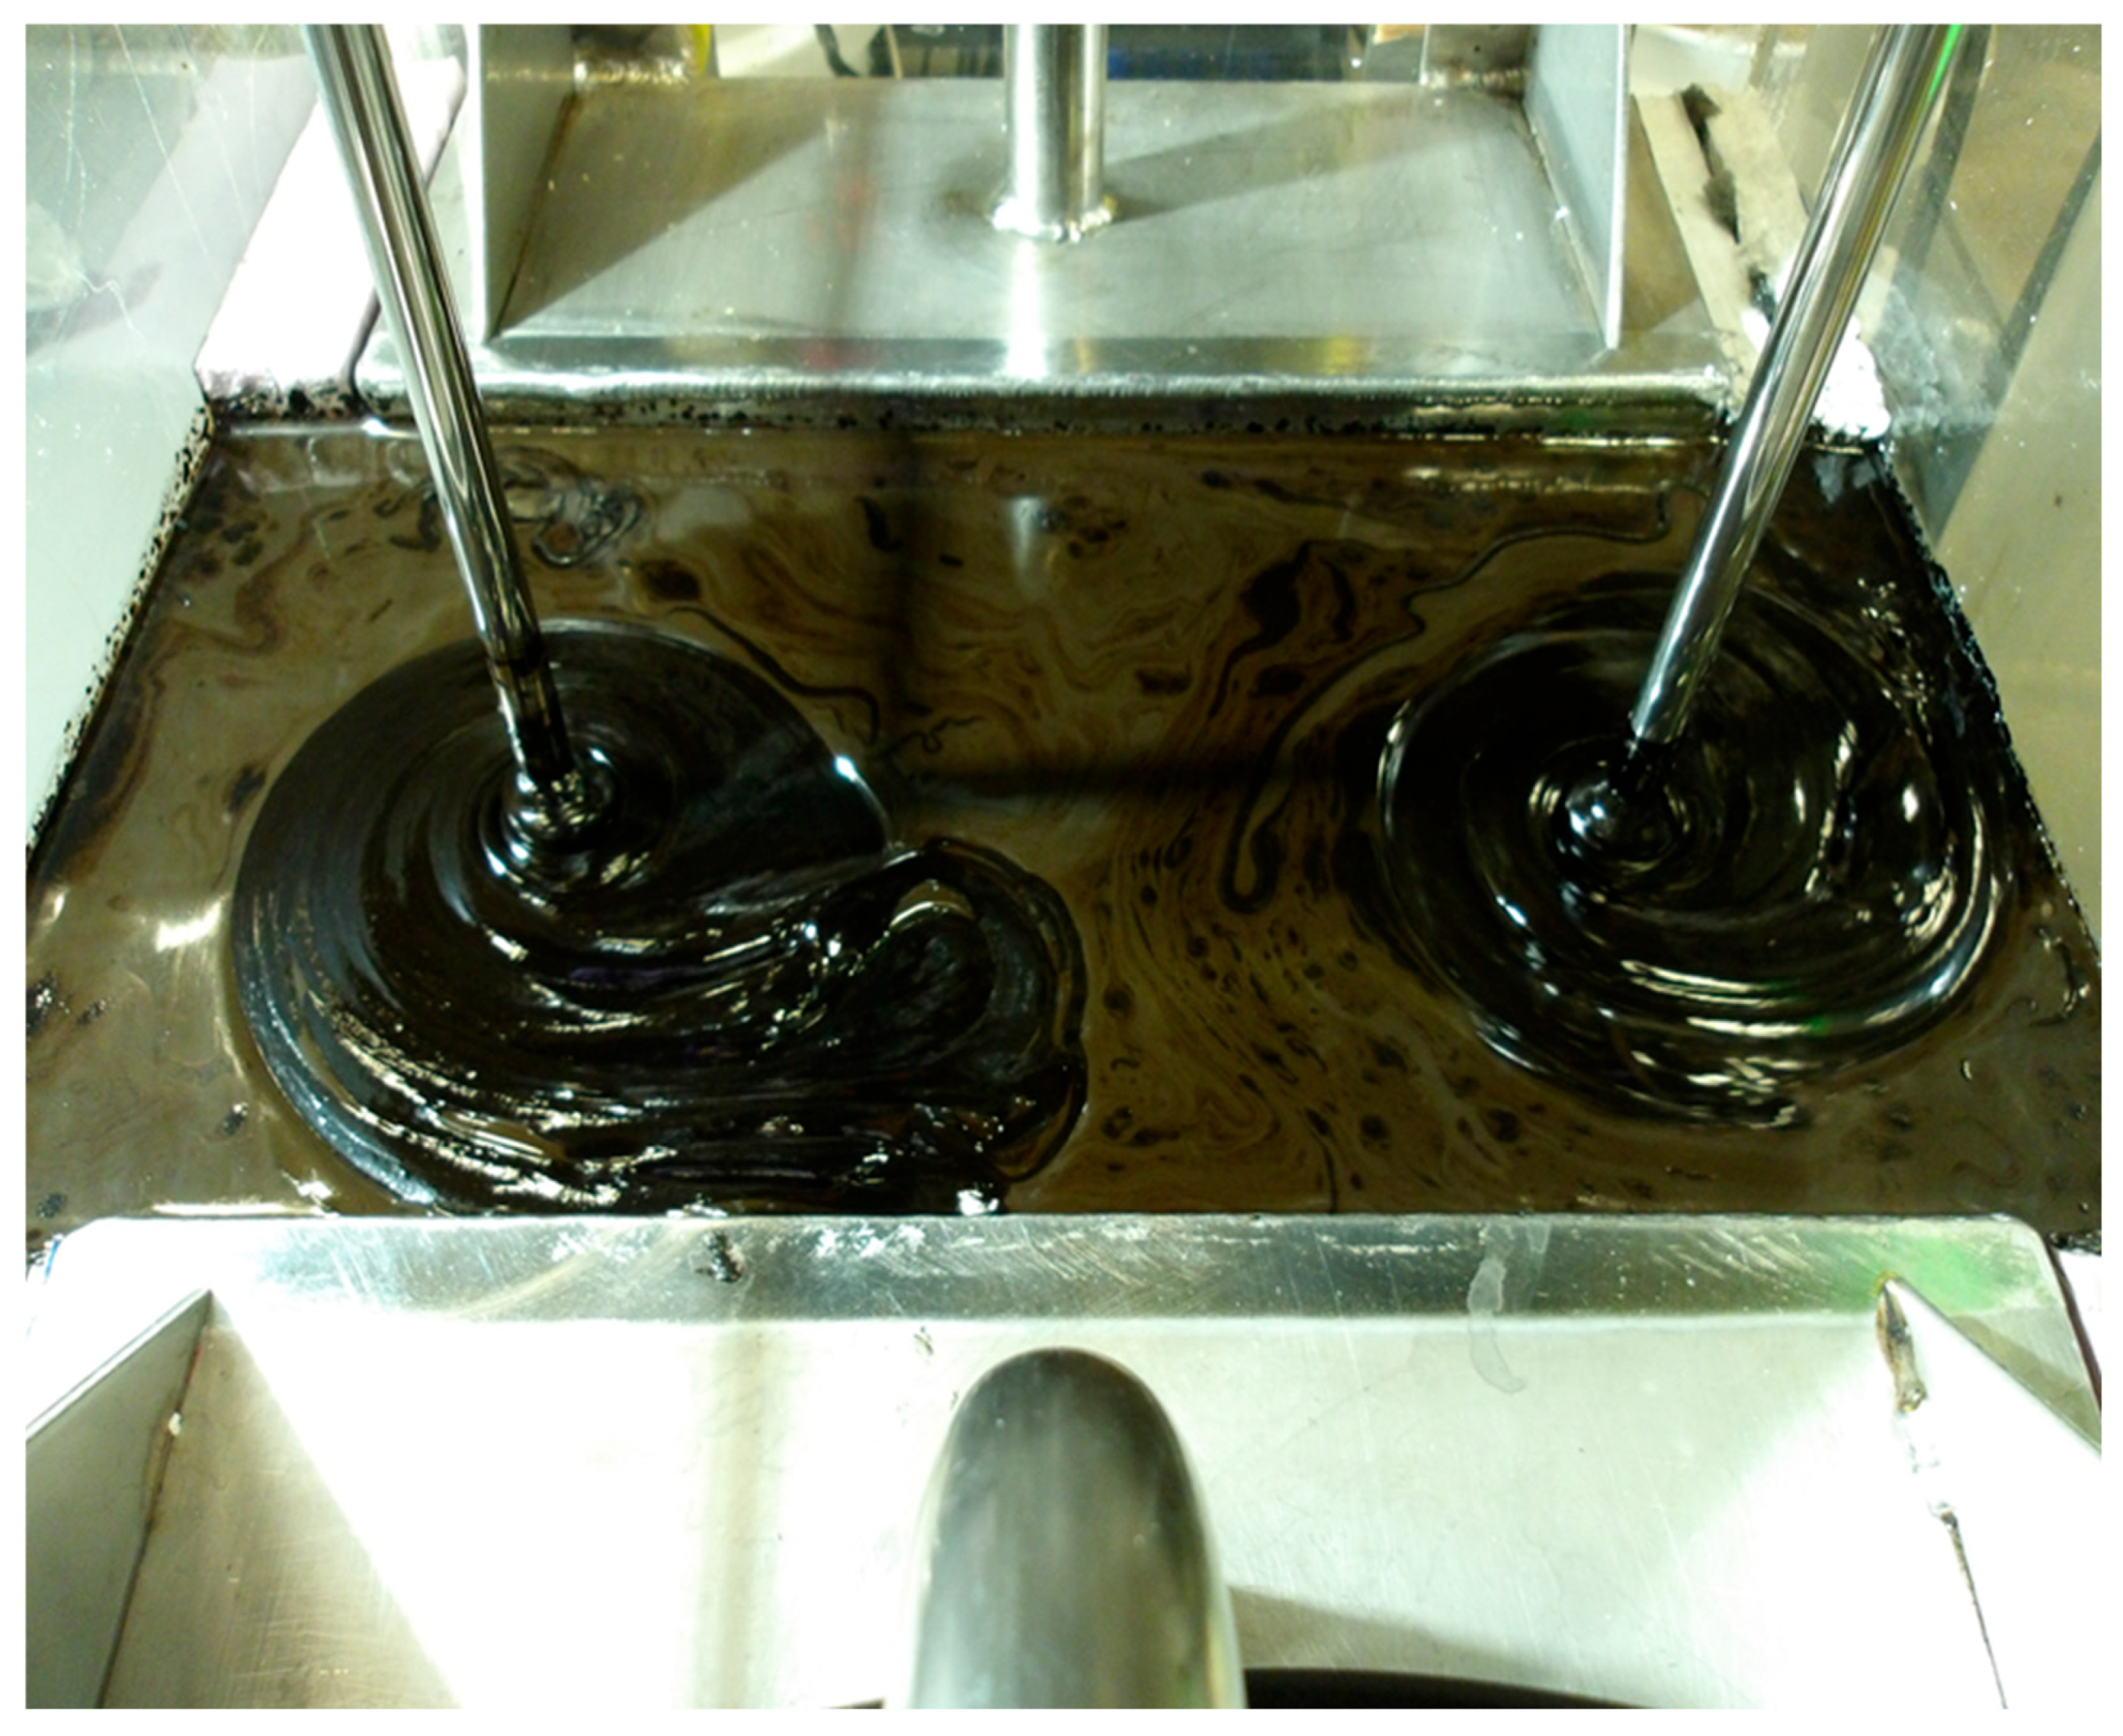
Regarding free oil collection, during the progression of research, it was noted that for some samples, clean, floating oil was present during the sonication process (see Figure 4). However, after sitting overnight as per protocol, that oil was no longer present and was found at the bottom of the tank. This led to the collection of oil during the treatment, which improved oil recovery. Based on those findings, even though late in the research process, free oil collection during the treatment process was undertaken. Samples which underwent that process were noted in the results.
Figure 4.
Free oil produced during the sonication process.
The water phase, which was the readily pumpable liquid below the oil/HC phase using a peristaltic pump with ¼ in polyethylene tubing, was also considered a phase in which there was recoverable oil. Hydrocarbon in this phase could be both soluble and/or suspended as particulate, although, due to the limited water solubility of the heavy hydrocarbon fractions in crude oil and since soluble fractions were likely to volatilize during sample drying at 105 °C (degrees centigrade), it was likely that the suspended particulate fraction was the dominant portion that was accounted for.
The remaining observable phases for testing, which were analyzed as a whole for mass balance purposes, included the following:
Submerged Oil: In some cases, there was a submerged oil phase. It was a relatively clean hydrocarbon that appeared to have settled on the sludge phase below. It was believed to be a result of HC that separated from the original sample during treatment, was floating, and then sank following treatment as the sample cooled.
Sludge: This phase bridged a gap between the water phase and the thick sludge phase. This phase was not pumpable as described above; however, it was somewhat liquid in nature. In some cases, a thick sludge was present, which was functionally the remains of a minimally treated tank bottom sample. For some treatments, this could account for a relatively large part of the total hydrocarbon, although the amount was quite variable. In only a few cases was this phase not present, possibly a result of sludge emulsification or liquification into a pumpable phase, although there was never any clear evidence that emulsification was occurring.
Sediment: The sediment phase was only apparent in some treatments and was characterized by relatively clean sediments.
2.3.3. Gravimetric Analysis
Pre- and post-treatment hydrocarbon, sediment, and moisture/water concentrations were determined using a gravimetric method based on the following equation:
MassHydrocarbon = MassTotal − MassSediment − MassWater
To reduce the mass of hydrocarbon to be burned off in the furnace, gravimetry was performed on small samples limited to ~20 gm or on 10–20 gm sub-samples. For larger samples, bulk sample masses were determined, and a small sub-sample was used for analysis, the data for which was used to calculate bulk sample fractions. For analysis, the initial mass of the empty sample tin was determined, the sample was added, then dried at 105 °C for 4 h in the desiccating oven and ashed in the furnace using a timed program. Tin + sample mass was measured at each step, and the tin + sample mass from the previous step was subtracted, sequentially providing the original wet mass of the sample (after sample was added to the weigh tin), the dry mass of sample (after sample desiccation), and the mass of HC (after sample ashing). The mass of sediment was determined as the mass difference between the ashed sample and the original tin.
Samples involving the post-treatment water phase were typically in excess of 90% water. As such, sample drying during the analytical process typically took more than four hours and continued until they showed no evidence of water.
Due to the elevated hydrocarbon content in many of the samples and the number of samples that were processed simultaneously in the furnace, ashing was managed under a timed program to allow the hydrocarbons to burn off slowly. That program was as follows: ambient to 150 °C in 90 min, 150 to 350 °C in 840 min, 350 to 575 °C in 90 min, and a final 30 min hold at 575 °C.
2.3.4. Energy Use
To estimate energy use, AC power assessments were performed for both the 28 and 40 kHz sonicators using two methods as follows: (1) instantaneous voltage, amperage, and power factor readings were taken using a Kill-A-Watt meter, and (2) independent voltage and amperage measurements were collected continuously using sensors and a datalogger. Energy use for both 28 and 40 kHz treatments were estimated using instantaneous voltage (V), amperage (I), and power factor (PF) measurements based on the following formula:
where PF was determined from the Kill-A-Watt meter. Power divided by the mass of sample provided the power as a function of mass of treated sample.
Power (W) = I × V × PowerFactor (PF)
3. Results and Discussion
Testing followed the detail shown in Table 2, Treatment Specification, and was based on a matrix of variable combinations. For each sample type, baseline testing was performed using no sonication. Associated with baseline testing were tests which used the same treatment specifications as baseline tests but included sonication at both 28 and 40 kHz. Those tests were considered focal and received multiple tests. Tests of other variable combinations only received a single test. Note that research was simply focused on the efficacy of bulk treatment (oil recovery and sediment production) of oilfield tank bottoms to determine whether pursuit of larger scale applications would make sense: It did not focus intently on the chemistry of samples nor was it designed as a mechanistic study or to determine statistically significant optimal sets of variables for treatment. While multiple tests for each matrix combination would have provided a more rigorous basis for analysis/comparison, time and resources were limited. While this is limiting in regard to any determination of an optimal set of treatment variables, it does not necessarily hinder interpretation of the data in regard to the suitability for scale-up. Also, as previously indicated, some testing included oil collection during the sonication process. This technique was developed late in the testing process and was not employed for most samples. However, once its benefits were realized, it was utilized for all subsequent testing and is noted in the results.
Table 2.
Treatment specifications, percent recoverable oil, and mass balance data. All tests were performed using a sludge:water ratio of 1:4 with 60 min of pretreatment stirring at 1400 rpm.
Table 2 also shows the results of testing, summarized as the mean and standard deviation for the percent total recoverable oil (free oil + water phases), the percent recoverable oil in the water phase, and the hydrocarbon mass balance as the percent difference in the total post-treatment vs. pre-treatment hydrocarbon. Mass balance numbers are provided as a relative gauge for oil/HC recovery and analytical error. Results for total recoverable oil in the water phase are provided to indicate significant portions of recoverable oil can exist in that phase. While the mean percentage for total recoverable oil was 27.4% with sonication, the mean percentage for total recoverable oil in the water phase was 11.7%, although as indicated previously, analysis for oil in the water phase did not necessarily indicate recoverable oil by field operations.
Table 3 indicates the overall percent recoverable oil as a function of a specific variable, while Table 4 provides the response to operational variables for each sample. Total oil recovery for samples A, B, and C using sonication was 30.5%, 15.2%, and 36.5%, respectively. However, it is not clear why such differences might exist with available data. Although testing was limited in scope and not statistically significant based on the limited number of tests, operational variables suggested the following:
Table 3.
Variable specific statistics for % recoverable oil for all tests that included the variable shown.
Table 4.
Sample-specific means for % recoverable oil for all tests for the variable shown.
Sonication frequency: As found in the literature, sonication was a benefit. Mean recoveries were 27.4% with sonication vs. 2.7% without. Overall, a frequency of 40 kHz was more beneficial with a mean recovery of 30.6% vs. 24.1% at 28 kHz. That, however, was sample specific: samples A and C realized better recoveries at 40 kHz, while Sample B realized marginally better performance at 28 kHz.
Sonication time: Increasing sonication treatment time appeared to benefit oil recovery. All three samples realized increasingly higher recoveries with increasing sonication times, up to the maximum treatment time of 180 min. This finding was consistent with much of that found in literature.
Stirring speed during treatment: Stirring during treatment appeared to have a positive impact on oil recovery (27.4%) vs. no stirring (9.1%), although results in Table 3 and Table 4 do not elucidate a clear pattern as to whether 200 rpm or 1400 rpm may be most beneficial. It should be noted that while no emulsification was ever apparent in testing, Zhao et. al. [32] indicated that such was a possibility at higher mixing speeds.
Free oil collection during treatment: Free oil collection during treatment was a benefit, with mean and maximum recoveries of 40.7% and 98.2%, respectively, vs. 21.8% and 56.4%, respectively, with no oil collection. Sample A realized a marginally better mean recovery of 31.6% vs. 29.9% without, while Samples B and C showed significantly better mean recoveries of 25.1% vs. 10.3% without and 71.5% vs. 23.8% without, respectively. It is believed that the while the sample was allowed to sit overnight, the overall sample cooled causing a shift in relative density between the oil (plus entrained sediment) and water, allowing the oil to sink.
While beyond the scope of this project, oil characteristics (e.g., weight, viscosity, and chemistry), degree of wetting, sediment characteristics, and post-treatment grain size distribution, among others, could all be relevant in terms of treatment performance. However, data were only collected and evaluated for HC/water/sediment content and grain size distribution. For HC content, while one might assume the sample with the highest HC content might realize the greatest recovery, yet this was not the case. In addition, literature suggests that samples with the coarser sediments respond most effectively to sonication [20,25], but this was also not the case.
Energy use per unit mass of sample for both 28 and 40 kHz treatments were estimated using voltage, amperage, and power factor measurements as described earlier. Table 5 summarizes data for power estimates. Note the power for 40 kHz (292 Wh/kg) was roughly 1.5 times that of 28 kHz (202 Wh/kg), although both were considered relatively low for oil recovery. However, those estimates are unique to this experimental design (submersible ultrasonic plates and acrylic tank). Increases in efficiency could be realized using a variable power sonicator and a stainless-steel tank. The variable power option would provide the opportunity for more efficient ultrasonic delivery, and a stainless-steel tank is typically used because of its efficiency at reflecting ultrasonic waves which would further increase system efficiency.
Table 5.
Power estimates for sample treatment.
4. Conclusions
Sonication tests were performed using crude oil tank bottom samples from three California oilfields using 2.2 kg sample per test with only water (no added chemicals) and stirring. Testing was part of an application-specific, scaled progression to determine the efficacy of sonication for oil recovery and waste minimization toward treatment at the industrial scale. As stated previously, this was not a mechanistic study but one focused on simple treatability to determine if larger-scale testing under this format was warranted. Testing was performed in acrylic tanks using two 500 W sonicator plates, sludge:added water mass ratios of 1:4, pretreatment stirring, and stirring during treatment.
Testing demonstrated the efficacy of sonication with oil recoveries ranging to 98.2% relative to pre-treatment oil content with a mean recovery of 27.4%. Oil recovery included both free oil and that contained in the water phase, with the water phase accounting for a substantive portion of recovery. With focus on a specific variable, data suggested that increases in sonication time, lower mixing speeds (200 rpm) during treatment, and the collection of free oil during treatment were generally a benefit. It is not clear, however, how combinations of those variables may have played into those results.
Regarding waste reduction/minimization, a successful sonication treatment provided a substantial reduction in waste. At a minimum, waste was reduced by the amount of oil removed. However, the removal of sample water further aided that reduction. In short, sonication resulted in cleaner, drier sediments for disposal. While it is not likely that sediments would be clean enough to discharge on a site, reductions in both volume and mass would result in significant savings associated with landfill disposal.
Energy use associated with sonication treatment at this scale was considered low at 200–300 Wh/kg depending on frequency, although energy use would be scale-dependent, and energy use at this scale should not be construed as representative of larger scales. However, when viewed in conjunction with oil recovery and waste minimization, sonication with only added water and stirring appears a viable consideration for additional study. Regarding energy use relative to other technologies, the only consideration for comparison would have been centrifugation, yet data for centrifugation including energy use, efficacy of treatment using similar product (efficacy of oil recovery and cleanliness of produced sediment), and at a scale similar to tests in this research were not available.
Based on the transition from 400 gm to 2.2 kg, lessons learned at the smaller scale were used as a guide but were not specifically applicable to the larger. It was not possible to duplicate many test conditions, including but not limited to tank characteristics, the type and configuration of the sonicator, the behavior of ultrasonics within a tank and with the materials treated, and mixing dynamics. Regarding further increases in scale, there would be many considerations including ultrasonic frequency, sonic density, type of transducer to use, the throw of ultrasonic waves (distance traveled) in the medium treated, size and shape of vessel, types of materials used in tank construction, method of mixing, how mixing might affect ultrasonics, the need for supplemental heat, etc. However, a detailed discussion of these considerations is beyond the scope of this document. In addition, without an a priori knowledge of climate, type of material to be treated, site constraints, etc., it would be difficult to address specifics. For scale-up, it would be necessary to identify needs/constraints and engage an ultrasonic equipment manufacturer for assistance with design details. From a simplistic standpoint, equipment (i.e., sonicators and treatment vessel material and design) and stirring considerations would be as follows: (1) tank shape could include anything from quadrangular to cylindrical; (2) tank construction should ideally be stainless steel for optimum reflection of ultrasonic waves; (3) tank size/shape needs to consider the throw of ultrasonic waves, limited to approximately three feet (W. Burken, Blue Wave Ultrasonics, personal communication, September, 2023); and (4) sonicator transducer type preferred by this team is magnetostrictive due to its durability and very limited incidence of failure, although this type of transducer is limiting in terms of frequency, typically in the 30 kHz range. Stirring is difficult to address since there are numerous ways to approach this and each might be specific to the type of tank, how the stirring mechanism might affect loading and cleaning of the tank and goals of a project, and energy efficiency at larger scales is unknown since it would depend largely on sonicator design, although, under typical ultrasonic applications using water, ultrasonic watt-density requirements decrease as tank size increases for the same treatment efficacy (R. Schwan, Blue Wave Ultrasonics, personal communication, 10 October 2023). It is, however, unclear how ultrasonics behave (throw and watt density needs) in a medium of water, crude oil, and sediment.
This study indicated sonication treatment of crude oil tank bottoms with only added water and mixing holds potential for oil recovery and waste minimization and was determined by this team to warrant further investigation at a larger scale. Tests for stepwise increases in scale have been planned, the next at the 20 kg scale using a 100 L custom made sonicator.
Author Contributions
Conceptualization—P.D., Y.G., C.L. and H.L.; Methodology—P.D. and Y.G.; Validation—P.D.; Formal Analysis—P.D. and D.C.S.; Investigation—P.D., T.N. and E.P.; Resources—P.D., Y.G., C.L. and H.L.; Data Curation—P.D., T.N. and E.P.; Writing—P.D. and T.N.; Writing (Review & Editing)—Y.G., C.L., H.L., T.N. and D.C.S.; Supervision—P.D.; Project Administration—P.D., C.L. and H.L.; Funding Acquisition—P.D., Y.G., C.L. and H.L. All authors have read and agreed to the published version of the manuscript.
Funding
This work was funded both by a grant from Chevron Energy and Technology Company, San Ramon, CA, USA and internal funding through Arizona State University, Ira A. Fulton Schools of Engineering, School of Sustainable Engineering and the Built Environment, Tempe, AZ USA.
Data Availability Statement
All data was generated by this project.
Conflicts of Interest
Authors Hong Luo and Daniel C. Segal are employed by the company Chev-ron, which is also the funding agency. The authors declare that this research was funded by Chev-ron, and by necessity Chevron had input into the design, interpretation of data, and the writing and publication of this article.
References
- da Silva, L.J.; Alves, F.C.; de França, F.P. A review of the technological solutions for the treatment of oily sludges from petroleum refineries. Waste Manag. Res. 2012, 30, 1016–1030. [Google Scholar] [CrossRef] [Scilit]
- Teng, Q.; Zhang, D.; Yang, C. A review of the application of different treatment processes for oily sludge. Environ. Sci. Pollut. Res. 2020, 28, 121–132. [Google Scholar] [CrossRef] [Scilit]
- Wang, Y.; Zhang, X.; Pan, Y.; Chen, Y. Analysis of oil content in drying petroleum sludge of tank bottom. Int. J. Hydrogen Energy 2017, 42, 18681–18684. [Google Scholar] [CrossRef] [Scilit]
- Islam, B. Petroleum sludge, its treatment and disposal: A review. Int. J. Chem. Sci. 2015, 13, 1584–1602. [Google Scholar]
- Nikkhah, M.; Tohidian, T.; Rahimpour, M.R.; Jahanmiri, A. Efficient demulsification of water-in-oil emulsion by a novel nano-titania modified chemical demulsifier. Chem. Eng. Res. Des. 2015, 94, 164–172. [Google Scholar] [CrossRef] [Scilit]
- Bojes, H.K.; Pope, P.G. Characterization of EPA’s 16 priority pollutant polycyclic aromatic hydrocarbons (PAHs) in tank bottom solids and associated contaminated soils at oil exploration and production sites in Texas. Regul. Toxicol. Pharmacol. 2007, 47, 288–295. [Google Scholar] [CrossRef] [Scilit] [PubMed]
- Song, L.; Jia, H.; Zhang, F.; Jia, H.; Wang, Y.; Xie, Q.; Fan, F.; Wang, Q.; Wen, S. Sustainable utilization of surfactant-free microemulsion regulated by CO2 for treating oily wastes: An interpretation of the response mechanism. Langmuir 2024, 40, 960–967. [Google Scholar] [CrossRef] [Scilit] [PubMed]
- Tavassoli, T.; Mousavi, S.M.; Shojaosadati, S.A.; Salehizadeh, H. Asphaltene biodegradation using microorganisms isolated from oil samples. Fuel 2012, 93, 142–148. [Google Scholar] [CrossRef] [Scilit]
- Mater, L.; Sperb, R.M.; Madureira, L.A.S.; Rosin, A.P.; Correa, A.X.R.; Radetski, C.M. Proposal of a sequential treatment methodology for the safe reuse of oil sludge-contaminated soil. J. Hazard. Mater. 2006, 136, 967–971. [Google Scholar] [CrossRef] [Scilit]
- Xu, N.; Wang, W.; Han, P.; Lu, X. Effects of ultrasound on oily sludge deoiling. J. Hazard. Mater. 2009, 171, 914–917. [Google Scholar] [CrossRef] [Scilit]
- Zubaidy, E.A.; Abouelnasr, D.M. Fuel recovery from waste oily sludge using solvent extraction. Process Saf. Environ. Prot. 2010, 88, 318–326. [Google Scholar] [CrossRef] [Scilit]
- Yan, P.; Lu, M.; Yang, Q.; Zhang, H.L.; Zhang, Z.Z.; Chen, R. Oil recovery from refinery oily sludge using a rhamnolipid biosurfactant-producing Pseudomonas. Bioresour. Technol. 2012, 116, 24–28. [Google Scholar] [CrossRef] [Scilit] [PubMed]
- Huang, Q.; Han, X.; Mao, F.; Chi, Y.; Yan, J. Effect of the particle surface on oil recovery from petroleum sludge. Energy Fuels 2014, 28, 4480–4485. [Google Scholar] [CrossRef] [Scilit]
- Zhang, Z.Y.; Li, L.H.; Zhang, J.S.; Ma, C.; Wu, X. Solidification of oily sludge. Pet. Sci. Technol. 2018, 36, 273–279. [Google Scholar] [CrossRef] [Scilit]
- Lin, J.; Sun, S.; Ma, R.; Fang, L.; Zhang, P.; Qu, J.; Zhang, X.; Geng, H.; Huang, X. Characteristics and reaction mechanisms of sludge-derived bio-oil produced through microwave pyrolysis at different temperatures. Energy Conserv. Manag. 2018, 160, 403–410. [Google Scholar] [CrossRef] [Scilit]
- Blue Wave Ultrasonics, Davenport, IA, USA. 2022. Available online: https://www.bluewaveinc.com (accessed on 10 May 2022).
- Chung, H.I.; Kamon, M. Ultrasonically enhanced electrokinetic remediation for removal of Pb and phenanthrene in contaminated soils. Eng. Geol. 2005, 77, 233–242. [Google Scholar] [CrossRef] [Scilit]
- Qiu, S.; Xia, M.; Li, Z. Ultrasonic irradiation as pretreatment for the reduction of excess sludge by Fenton-acclimation treatment. Water Sci. Technol. 2013, 67, 1701–1707. [Google Scholar] [CrossRef] [Scilit]
- Gao, Y.; Ding, R.; Wu, S.; Wu, Y.; Zhang, Y.; Yang, M. Influence of ultrasonic waves on the removal of different oil components from oily sludge. Environ. Technol. 2015, 36, 1771–1775. [Google Scholar] [CrossRef] [Scilit] [PubMed]
- Feng, D.; Aldrich, C. Sonochemical treatment of simulated soil contaminated with diesel. Adv. Environ. Res. 2000, 4, 103–112. [Google Scholar] [CrossRef] [Scilit]
- Kim, Y.U.; Wang, M.C. Effect of ultrasound on oil removal from soils. Ultrasonics 2003, 41, 539–542. [Google Scholar] [CrossRef] [Scilit]
- Priego-López, E.; de Castro, M.L. Ultrasound-assisted extraction of nitropolycyclic aromatic hydrocarbons from oil prior to gas chromatography-mass detection. J. Chromatogr. A 2003, 1018, 1–6. [Google Scholar] [CrossRef] [Scilit] [PubMed]
- Banjoo, D.R.; Nelson, P.K. Improved ultrasonic extraction procedure for the determination of polycyclic aromatic hydrocarbons in sediments. J. Chromatogr. A 2005, 1066, 9–18. [Google Scholar] [CrossRef] [Scilit]
- Collings, A.F.; Farmer, A.D.; Gwan, P.B.; Pintos, A.S.; Leo, C.J. Processing contaminated soils and sediments by high power ultrasound. Miner. Eng. 2005, 19, 450–453. [Google Scholar] [CrossRef] [Scilit]
- Na, S.; Park, Y.; Hwang, A.; Ha, J.; Kim, Y.; Khim, J. Effect of ultrasound on surfactant-aided soil washing. Jpn. J. Appl. Phys. 2007, 46, 4775. [Google Scholar] [CrossRef] [Scilit]
- Abramov, O.V.; Abramov, V.O.; Myasnikov, S.K.; Mullakaev, M.S. Extraction of bitumen, crude oil and its products from tar sand and contaminated sandy soil under effect of ultrasound. Ultrason. Sonochem 2009, 16, 408–416. [Google Scholar] [CrossRef] [Scilit]
- Shrestha, R.A.; Pham, T.D.; Sillanpää, M. Effect of ultrasound on removal of persistent organic pollutants (POPs) from different types of soils. J. Hazard. Mater. 2009, 170, 871–875. [Google Scholar] [CrossRef] [Scilit]
- Son, Y.; Cha, J.; Lim, M.; Ashokkumar, M.; Khim, J. Comparison of ultrasonic and conventional mechanical soil-washing processes for diesel-contaminated sand. Ind. Eng. Chem. Res. 2011, 50, 2400–2407. [Google Scholar] [CrossRef] [Scilit]
- Jin, Y.; Zheng, X.; Chu, X.; Chi, Y.; Yan, J.; Cen, K. Oil recovery from oil sludge through combined ultrasound and thermochemical cleaning treatment. Ind. Eng. Chem. Res. 2012, 51, 9213–9217. [Google Scholar] [CrossRef] [Scilit]
- Hu, G.; Li, J.; Thring, R.W.; Arocena, J. Ultrasonic oil recovery and salt removal from refinery tank bottom sludge. J. Environ. Sci. Health Part A 2014, 49, 1425–1435. [Google Scholar] [CrossRef] [Scilit] [PubMed]
- Hu, G.; Li, J.; Huang, S.; Li, Y. Oil recovery from petroleum sludge through ultrasonic assisted solvent extraction. J. Environ. Sci. Health Part A 2016, 51, 921–929. [Google Scholar] [CrossRef] [Scilit]
- Zhao, X.; Zhang, X.; Liu, L.; Fan, L.; Ge, D. Effect of ultrasonic reactor and auxiliary stirring on oil removal from oily sludge. Environ. Technol. 2017, 38, 3109–3114. [Google Scholar] [CrossRef] [Scilit] [PubMed]
- He, S.; Tan, X.; Hu, X.; Gao, Y. Effect of ultrasound on oil recovery from crude oil containing sludge. Environ. Technol. 2018, 40, 1401–1407. [Google Scholar] [CrossRef] [Scilit] [PubMed]
- Zhang, J.; Li, J.; Thring, R.W.; Hu, X.; Song, X. Oil recovery from refinery oily sludge via ultrasound and freeze/thaw. J. Hazard. Mater. 2012, 203, 195–203. [Google Scholar] [CrossRef] [Scilit] [PubMed]

Disclaimer/Publisher’s Note: The statements, opinions and data contained in all publications are solely those of the individual author(s) and contributor(s) and not of MDPI and/or the editor(s). MDPI and/or the editor(s) disclaim responsibility for any injury to people or property resulting from any ideas, methods, instructions or products referred to in the content. |
© 2026 by the authors. Licensee MDPI, Basel, Switzerland. This article is an open access article distributed under the terms and conditions of the Creative Commons Attribution (CC BY) license.