


Abstract
In cross-project defect prediction (CPDP), divergence in feature distribution between the source and target often fails when predicting defects across unrelated projects. Such a mismatch is typical rather than exceptional in real deployment scenarios. To address this, the Transfer Component Analysis (TCA) technique projects the source and target into a shared subspace, where Maximum Mean Discrepancy is minimized. However, combining fixed ensemble classifiers with TCA on NASA datasets is yet to be explored. Previous studies either searched ensemble compositions adaptively or conflated alignment with source selection. In this study, we trained a two-layer hybrid ensemble of Bagging and AdaBoost classifiers, alongside a Logistic Regression meta-learner, on TCA-aligned features across 20 directed source–target pairs. We used five PROMISE datasets, each having 21 McCabe and Halstead features. Experiments were conducted, and the findings show that, against an unaligned baseline using the same ensemble, TCA alignment increased mean AUC by 0.131 (0.625 to 0.755), mean F1 by 0.155, and mean MCC by 0.125. Wilcoxon signed-rank tests confirmed significance across all three metrics (p < 0.003, rank-biserial r = 0.714, Cliff’s Delta d ≥ 0.545). A full ablation showed that alignment was the dominant contributor to performance, with TCA improving AUC by +0.131 over the unaligned baseline. In contrast, SMOTE traded a small AUC reduction (−0.014) for substantial F1 gains (+0.134), while the stacking layer provided modest improvements in F1 and MCC. TCA reduced MMD across all 20 source–target pairs by a mean of 83.3%. Sensitivity analysis further showed that the TCA subspace dimensionality parameter, k, exhibited non-monotone, pair-specific AUC sensitivity, with optimal values ranging from 5 to 30. These findings indicate that alignment parameter selection substantially influences CPDP performance and that a fixed global default is inadequate.
1. Introduction
Predicting defects across projects and transferring the learned patterns to a target project is the goal of cross-project defect prediction (CPDP) [1,2]. This is due to the lack of its own defect history in a new system. Consequently, effective models can direct testing resources toward modules most likely to fail, with reported savings between 49% and 68% and early detection that prevents severe failures [1,2]. Yet, models trained on one project often degrade when applied elsewhere. A study by Grattan et al. [1] reviewed 117 studies, revealing that cross-project transfer remains unresolved. Accordingly, poor generalisation surfaces when the source and target differ in context, practices, or codebase structure. The underlying process is covariate shift because the source and target occupy different regions of the metric space even when measured on identical features. Liu et al. [2] attributed this to programming conventions, architectural patterns, and team scale. The challenge arises not because features disappear, but because their distributions shift, constituting a central obstacle.
Transfer learning (TL) addresses this by measuring and reducing the distributional gap before training. Pan et al. [3] formalised this mechanism for the kernel setting through Transfer Component Analysis (TCA). Given labelled source data and unlabelled target data, TCA identifies a K-dimensional projection in a reproducing kernel Hilbert space that minimises the Maximum Mean Discrepancy (MMD) between source and target marginal distributions. Similarly, Nam et al. [4] applied TCA to defect prediction in TCA+, reporting improved cross-project F-measure over eight open-source projects. Liu et al. [2] later showed that TCA+’s performance fluctuates with source project choice and proposed a two-phase model that first estimates source–target similarity before applying TCA+. Xia et al. [5] further incorporated TCA-based alignment into HYDRA, a genetic algorithm (GA) ensemble search procedure. HYDRA reported the highest published Area Under the Curve (AUC) on PROMISE benchmark data at the time. However, this performance came at the cost of a computationally intensive search phase that is difficult to reproduce.
More recent cross-project defect prediction (CPDP) work has moved toward adversarial alignment and multi-source ensembles. Song et al. [6] trained a domain adversarial network on PROMISE data and reported AUC gains over TCA+ on most source–target pairs. Likewise, Tong et al. [7] proposed MASTER, which weights multiple source projects through KL divergence and mutual information, reporting MCC gains of 49.1% over single-source baselines on 30 datasets. Zhang et al. [8] proposed Adan, an autoencoder with dynamic adversarial adaptation that aligns both global and local distributions simultaneously, while Zou and Wang [9] combined CodeT5+ semantic features, GraphSAGE structural embeddings, and Locality Preserving Projection alignment into a three-stage pipeline. In expressiveness, these approaches go beyond MMD-based alignment but require either source code access or multiple source projects.
A direct question separates TCA from adversarial approaches in this study. That is, when TCA is paired with a fixed ensemble like Bagging and AdaBoost with a Logistic Regression (LR) stack [10], does alignment alone drive most of the gain? The Xia et al. [5] HYDRA’s genetic search conflates alignment with classifier selection within a single optimisation loop, which makes it impossible to attribute performance to either factor independently. Adversarial methods add a third variable, which is discriminator training. A fixed classifier removes both confounds and leaves distribution alignment as the sole experimental factor, a design choice supported by Li et al. [11], who found across 62 CPDP technique combinations that alignment parameter choice outweighs classifier choice.
Therefore, in this paper, we evaluated all 20 directed source–target pairs on five NASA PROMISE datasets (CM1, KC1, PC1, JM1, KC2) and made four contributions. The primary contribution is a controlled quantification of the TCA alignment contribution under a fixed ensemble, isolating alignment from the classifier composition effects that confound prior work such as HYDRA [5] and the adversarial approaches in Refs. [6,8]. A complementary ablation across six conditions, varying alignment, rebalancing, and ensemble composition independently, establishes the relative magnitude of each component. A third contribution is the quantitative characterisation of the CM1-as-target failure through pre- and post-alignment MMD measurement across all 20 pairs, showing the failure is source-specific rather than a universal property of CM1. Finally, an extended sensitivity analysis across k in {5, 10, 15, 20, 25, 30} for all five source datasets establishes that per-pair k tuning recovers substantial performance losses hidden by aggregate statistics.
The remainder of the paper is organised as follows: Section 1.1 presents the background and related works, Section 2 presents the process applied, Section 3 presents the results, and Section 4 discusses the findings. Section 5 concludes the paper.
1.1. Related Works
1.1.1. Cross-Project Defect Prediction
CPDP builds a defect model for a target project using labelled data from a different source project, a necessity when the target lacks sufficient fault history to support within-project training. Grattan et al. [1] identified cross-project generalisation as one of three unresolved weaknesses in current SDP practice, alongside binary-only outputs and low model transparency. The central obstacle is covariate shift: P(X) differs between source and target, while P(y|X) is assumed stable, so a model trained on source data encounters a shifted input distribution at test time.
Three method families address the mismatch. Instance weighting adjusts the influence of individual source records before training. TrAdaBoost [12] reduces the weight of source instances that produce high target error across successive boosting rounds; Nikravesh and Keyvanpour [13] extended this idea with gravitational similarity weighting and a Rare-Transfer boosting step that actively suppresses negative transfer, reporting gains over HYDRA and DTB across 15 datasets. Feature transformation attacks the problem at the representational level by aligning source and target before a classifier is trained. Bala et al. [14] achieved a mean F1 of 0.80 on AEEEM through mean/mode adjustment combined with statistical feature ranking, though the evaluation was limited to that single dataset. A more principled alignment route is kernel-based MMD minimisation, as in TCA [3] and TCA+ [4], which projects both domains into a shared latent subspace. Xu et al. [15] extended this with Balanced Distribution Adaptation (BDA), introducing a learnable factor that weights marginal and conditional MMD terms jointly; BDA outperformed TCA, JDA, and data-filtering baselines across 18 projects. Omondiagbe et al. [16] added a target-to-source ratio term (W-BDA+) that prevents performance degradation as more target data become available. Song et al. [6] abandoned distribution matching entirely, training a domain adversarial network that outperformed TCA+ on PROMISE and AEEEM. TCA is selected over these alternatives on three grounds. It operates on pre-computed module-level metrics without source code access: DANN, Deep CORAL, and GCN-based methods such as Zou and Wang [9] require AST or token-level features unavailable in the NASA PROMISE benchmark. Its kernel subspace is interpretable and its MMD reduction directly quantifiable, unlike adversarial discriminator objectives whose convergence cannot be measured in the same terms. Both TCA and TCA+ remain the standard alignment baselines in metric-based CPDP [3,4], making results here comparable with the widest range of prior work. BDA [15] and W-BDA+ [16] address TCA’s marginal-only constraint and are identified as natural extensions for the failure cases documented.
Multi-source methods occupy a distinct position. Tong et al. [7] weighed multiple source projects simultaneously at the dataset, instance, and feature levels, achieving MCC gains of 49.1% and IFA reductions of 48.1% over single-source baselines on 30 projects. Wu et al. [17] extracted latent representations via autoencoders across heterogeneous projects, reaching accuracy competitive with within-project models. Both multi-source approaches are orthogonal to the single-source alignment setting examined here. Deep methods bypass hand-crafted metrics by operating on source code. Qiu et al. [18] embedded an MMD matching layer inside a convolutional network (TCNN), fusing TCA-aligned metrics with CNN-extracted code features. Tao et al. [19] placed an LSTM semantic layer on top of TCA metric alignment, reporting AUC gains over TCA+ on PROMISE. Zou and Wang [9] combined CodeT5+ embeddings, GraphSAGE structural features, and LPP alignment in a three-stage pipeline. Each of these three requires direct source code access. The present work uses pre-computed module-level McCabe/Halstead features [20,21], applying them where source code is unavailable, a constraint that the deep methods cannot satisfy.
1.1.2. Ensemble Methods and Class Imbalance in CPDP
Ensembles reduce prediction variance on imbalanced defect datasets by combining classifiers with diverse error profiles. Kanaujiya and Verma [22] evaluated ensemble configurations on NASA PROMISE data with Synthetic Minority Oversampling Technique (SMOTE) balancing and found that stacking outperformed bagging and boosting individually across all tested datasets. HYDRA [5] applied a GA search over ensemble composition, reporting AUC improvements over single classifiers on 29 PROMISE datasets, at high computational cost. Also, MASTER [7] fixes the classifier architecture and searches source weighting via KL divergence and mutual information, achieving strong gains at lower per-prediction cost. Li et al. [11] showed empirically that across 62 CPDP technique combinations, the TL parameter choice dominates classifier choice, which justifies using a fixed ensemble here. However, the ensemble in this paper is structurally fixed. As a two-stage architecture, Layer 1 trains BaggingClassifier and AdaBoostClassifier in parallel on TCA-aligned source features. In the same vein, Layer 2 trains LR on the concatenated base-learner outputs and the aligned feature vector, following Wolpert’s stacking framework [23].
Class imbalance is a persistent issue in CPDP: defective modules make up fewer than 20% of instances across all five datasets, which pushes classifiers toward the majority class. Jalil et al. [24] addressed this with CTGAN-based synthetic sampling combined with hybrid feature selection and DNN classification, achieving an AUC of 75.98% on a multi-class CPDP task. Nikravesh and Keyvanpour [13] applied SMOTE before the gravitational weighting step and attributed stable minority-class recall to that ordering. The present study applies SMOTE to the combined source–target training pool after TCA alignment, following Bennin et al. [25], who found that resampling after transfer alignment reduces false negatives without a systematic AUC cost.
Despite these advances, three gaps remain unaddressed in the literature. No prior study has isolated the TCA alignment contribution from classifier composition effects under a controlled fixed-ensemble design. Existing work either searches both simultaneously [5] or conflates them with adversarial discriminator training [6,8]. The conditions under which kernel MMD alignment degrades have not been characterised quantitatively through pre- and post-alignment MMD measurement across a full benchmark evaluation. The TCA subspace dimensionality parameter, k, has generally been treated as a fixed hyperparameter in CPDP studies, with little systematic analysis of its pair-specific sensitivity. As a result, its contribution to performance has remained largely unquantified. This paper addresses all three limitations.
2. Materials and Methods
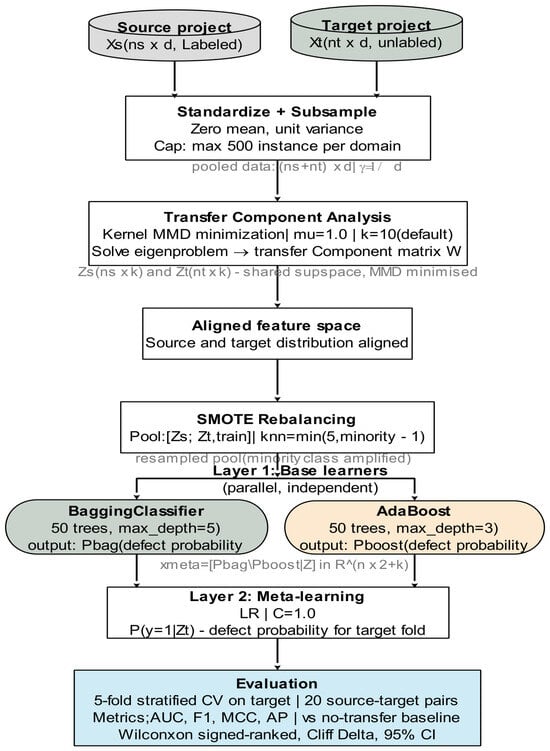
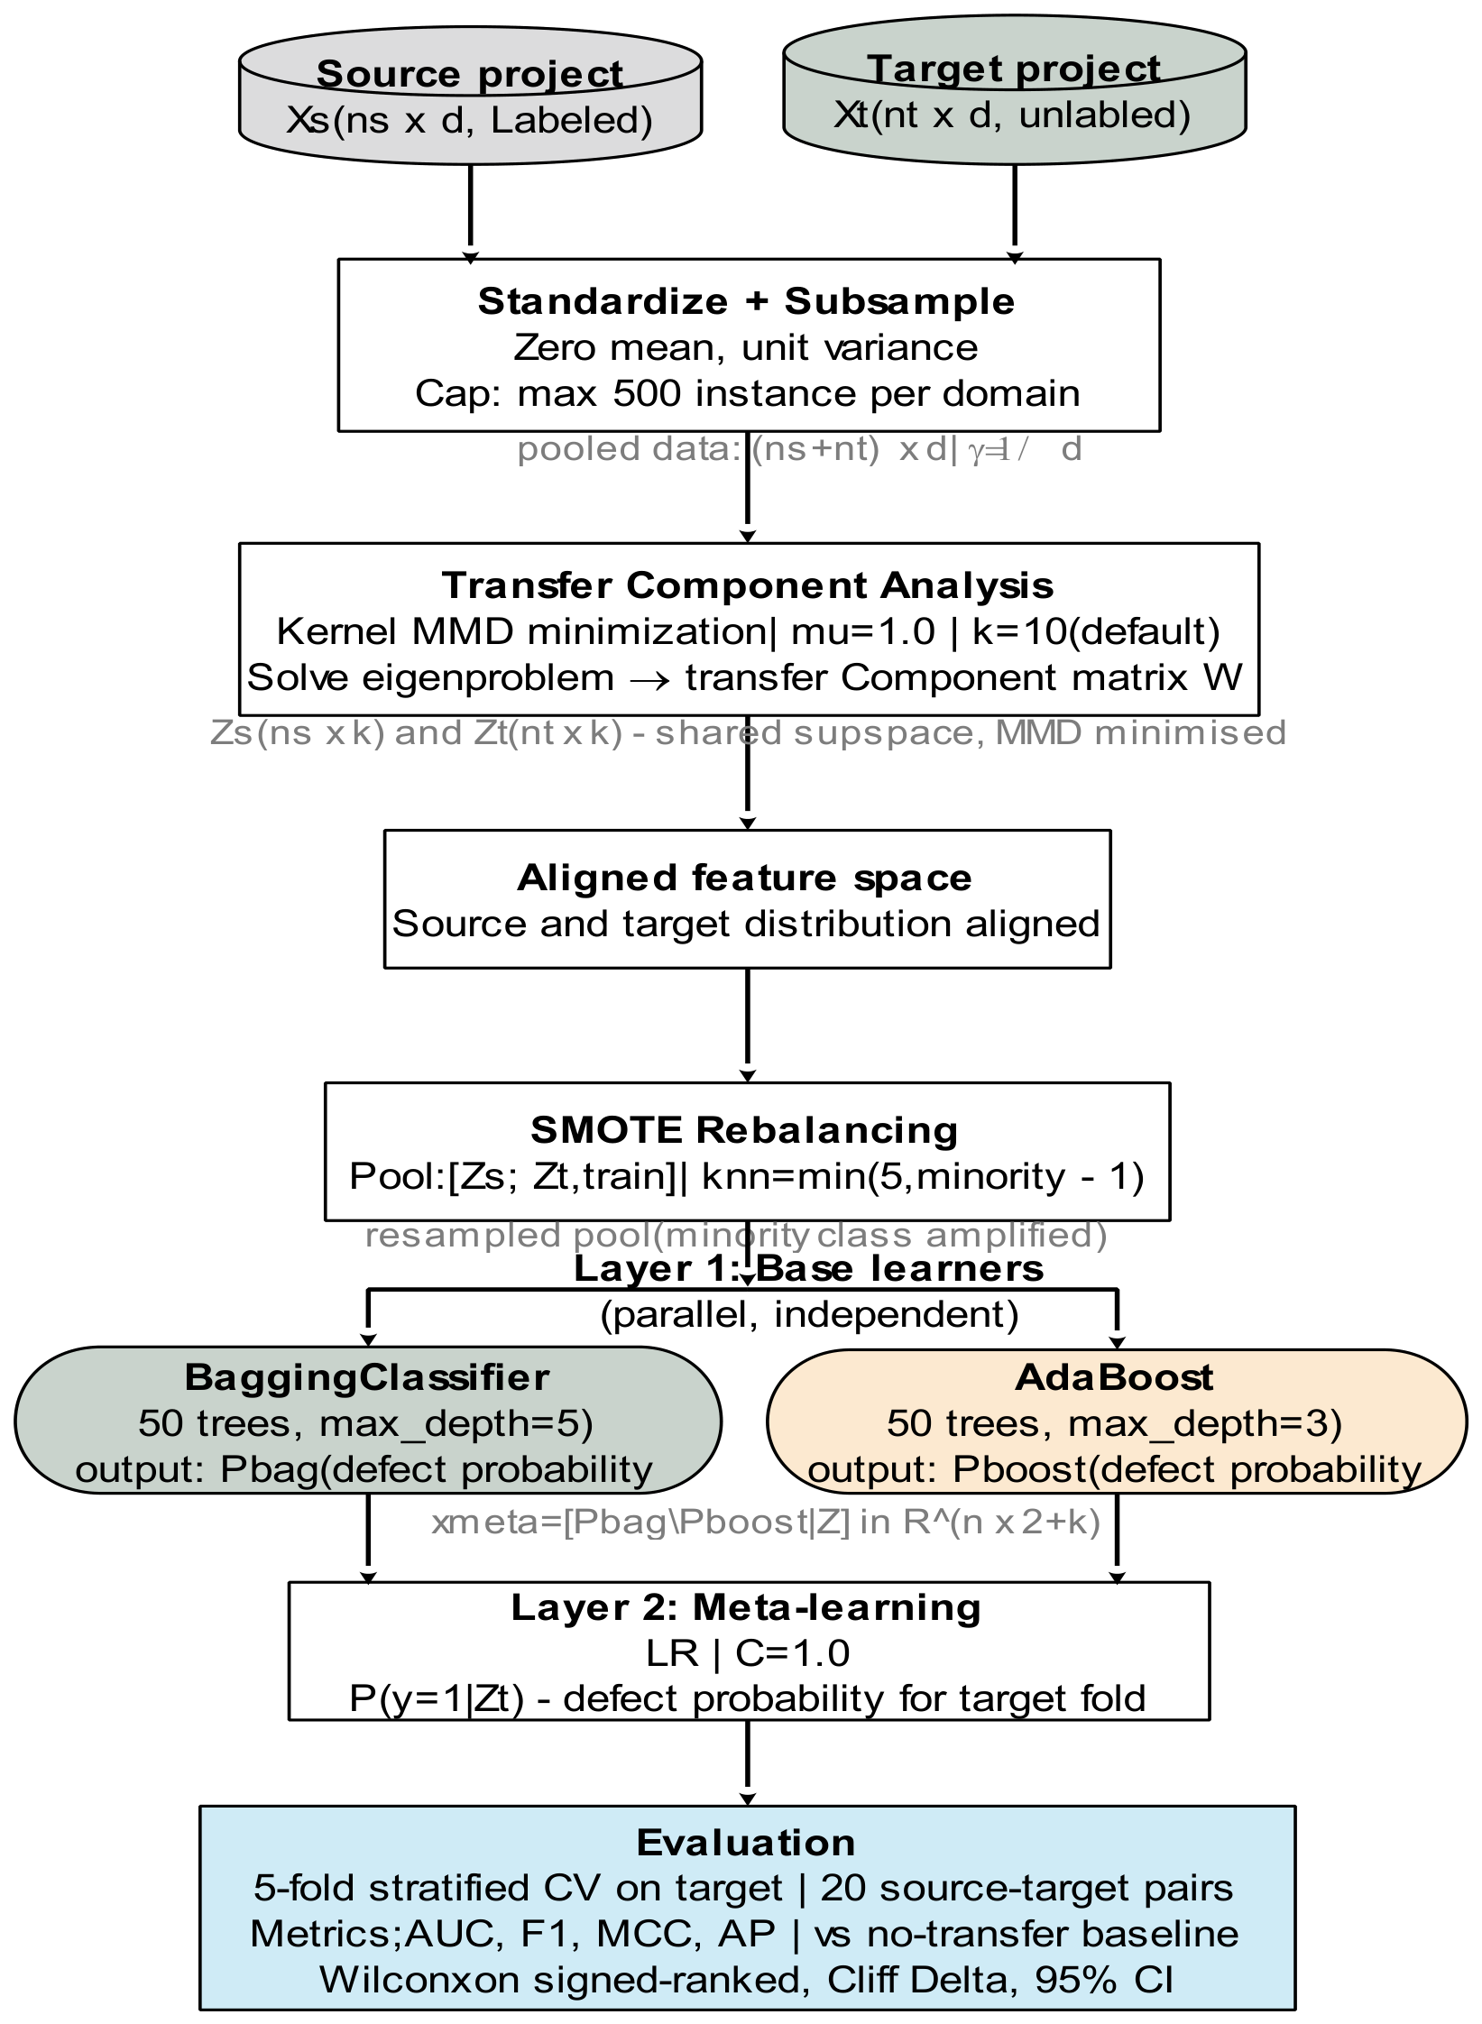
The methodology rests on two decisions held fixed across all experiments, which involve the dataset corpus and the classifier architecture. Fixing both allows the results to point to alignment alone, which is the question this paper is designed to answer. Whether alignment produces measurable gains over unaligned training is tested directly by comparing TCA-aligned and unaligned versions of the same ensemble across all 20 source–target pairs. A secondary question concerns the ensemble itself, specifically, whether the stacking layer contributes over its base classifiers when all components operate on the same aligned features. Source behaviour matters because transfer performance is not uniform across projects: some source datasets consistently reach higher AUC across their four targets than others, and knowing which is useful when a practitioner must pick a source without seeing target labels. The sensitivity of subspace dimensionality k comes last, asking whether a single fixed value holds across all source–target pairs or whether the optimum shifts enough to warrant tuning. Figure 1 shows the complete pipeline.
Figure 1.
Study design flow.
2.1. Datasets
Five of the publicly available NASA MDP datasets, such as CM1, KC1, PC1, JM1, and KC2, were used in this study. All are redistributed through the PROMISE repository with 21 McCabe/Halstead features [20,21] and a binary defect label. Shepperd et al. [26] documented quality problems in NASA MDP releases, including duplicate rows, impossible metric values, and version inconsistencies. The PROMISE versions are used throughout, with exact row counts reported. Particularly, the JM1 file contains 13,204 rows (defect rate 0.159) rather than the canonical 10,885 (defect rate 0.193), consistent with the known concatenation of NASA MDP and PROMISE versions. This is acknowledged as a weakness in our study. Accordingly, Table 1 summarises the five datasets that share the 21-feature McCabe/Halstead schema with a binary defect label. Among them, PC1 is the most class-imbalanced (defect rate 6.9%), KC2 has the highest defect prevalence, and CM1 is the smallest dataset (442 instances).
Table 1.
Dataset characteristics.
2.2. TCA Feature Alignment
Given source instances Xs in and target instances Xt in , TCA [3] finds a projection W in Rn*k by solving the generalised eigenvalue problem:
where K is the combined (ns + nt) x (ns + nt) RBF kernel matrix, L is the MMD matrix constructed from source/target indicator vectors, H is the centring matrix, and u is the regularisation weight. The RBF kernel is
The top-k eigenvectors give the transfer components. Aligned representations are
Because K scales as O(), each domain is capped at 500 instances for TCA fitting (stratified subsample when n > 500). Here, the complete target set is projected by calculating its kernel row against the subsampled reference set and multiplying by W. All features are standardised before kernel computation, and γ = 1/d follows TCA+ [4]. The regularisation parameter mu is set to 1.0, following the default in Pan et al. [3], which equally weights the MMD minimisation term and the within-domain variance preservation objective in the TCA eigenproblem. To ensure consistency with the fixed-parameter design rationale described in Section 3.3, no cross-validated tuning of mu was performed.
Furthermore, the subspace dimensionality was fixed at k = 10 by default, and a sensitivity sweep over k ∈ {5, 10, 15, 20, 25, 30} was carried out on two representative source–target pairs. This choice is motivated by Li et al. [11], who found that TCA alignment parameters influence CPDP performance more strongly than classifier parameters.
2.3. Hybrid Ensemble Classifier
In this study, we designed our ensemble using a two-layer stacking architecture [23], as shown in Figure 1. Here, Layer 1 consisted of parallel base learners, having a BaggingClassifier with 50 decision trees (maximum depth = 5) and an AdaBoostClassifier with 50 decision trees (maximum depth = 3). Both were trained on aligned source data, with rebalanced labels using SMOTE. The design ensured that Bagging reduced variance, while AdaBoost reduced bias through sequential instance reweighting.
On the other hand, Layer 2 is the meta-learner, where LR is trained on the concatenated input as follows:
where and are Layer 1 defect probability outputs. At inference, target predictions use , , ] as meta-learner input.
The ensemble hyperparameters were fixed a priori rather than tuned for each source–target pair (BaggingClassifier: n_estimators = 50, max_depth = 5; AdaBoostClassifier: n_estimators = 50, max_depth = 3; Logistic Regression: C = 1.0, solver = lbfgs). This was an intentional design choice to isolate the contribution of TCA alignment in RQ1. Li et al. [11] showed across 62 CPDP technique combinations that transfer learning parameter selection has a greater influence on prediction performance than classifier hyperparameter tuning. Consequently, tuning the ensemble hyperparameters would confound the effects of classifier optimisation and alignment, preventing a controlled evaluation of the latter. The selected values correspond to stable, widely used scikit-learn settings that have also been adopted in the SDP literature [22,27]. The TCA alignment parameter, k, is investigated systematically in RQ4.
2.4. Experimental Protocol
For each of the twenty directed source–target pairs, TCA was fitted on subsampled source and target data, and the full target set was subsequently projected through the fitted kernel. Evaluation followed a five-fold stratified cross-validation protocol on the target dataset. Within each fold, we constructed the training pool by concatenating the aligned source instances with the aligned target training fold. SMOTE was then applied to the combined pool, the hybrid ensemble was trained on the resampled data, and performance was assessed on the aligned target test fold. AUC, F1-score, and MCC were recorded as mean and standard deviation across the five folds.
The TCA kernel matrix, W, was computed once using the full source set and the full unlabelled target set before cross-validation. It remained fixed throughout all cross-validation folds. Within each fold, only the target training slice augments the aligned source pool; the target test slice contributes neither to kernel estimation, SMOTE resampling, nor classifier training. No data leakage occurs: the test fold is isolated at the point of StratifiedKFold partitioning and accessed solely for metric evaluation in step 6.7 of Algorithm 1.
The no-transfer baseline followed the same cross-validation protocol but replaced TCA alignment with StandardScaler normalisation fitted on source distribution moments. Three individual classifier baselines: BaggingClassifier, AdaBoostClassifier, and LR, were trained on TCA-aligned features under the same procedure. This design isolates the contribution of ensemble composition from alignment effects (RQ2). All random operations used seed 42. Algorithm 1 presents the algorithm used in this study.
| Algorithm 1. TCA-Aligned Hybrid Ensemble for CPDP |
| Input: Source data (Xs, ys); unlabelled target Xt; TCA dimension k; CV folds n; seed s = 42 Output: Mean and standard deviation of AUC, F1, MCC, and AP over n folds Steps: 1. Subsample each domain to at most 500 instances using stratified sampling, preserving the class distribution. 2. Standardise the pooled source and target features to zero mean and unit variance. 3. Compute the RBF kernel matrix K over the standardised data (bandwidth γ = 1/d). 4. Solve the TCA generalised eigenproblem K(μL + I)K W = λ KHK W with μ = 1.0 to obtain the k-dimensional transfer component matrix W. 5. Project: Zs ← K [1:ns, :] · W and Zt ← K[ns + 1:n, :] · W. Note: W is fixed before cross-validation and does not change between folds. 6. Partition Zt into n stratified folds (seed s). For each fold:
|
As shown in Algorithm 1, steps one to five perform distribution alignment. The source and target feature spaces are jointly standardised, after which an RBF kernel matrix is computed over the pooled data. The TCA eigenproblem, with the regularisation parameter (mu = 1.0) set following Pan et al. [3], then produces a shared k-dimensional subspace. The transfer component matrix W is computed once before cross-validation and held fixed across all folds, ensuring no data leakage from the target test slice. Steps 6 and 7 evaluate performance through a stratified cross-validation loop over the target data. In each fold, aligned source instances augment the target training slice to form a combined pool; SMOTE corrects class imbalance before training the ensemble. BaggingClassifier and AdaBoostClassifier are fitted in parallel as base learners, and an LR meta-learner is trained on their probability outputs concatenated with the aligned feature vector. Predictions on the held-out fold follow the same meta-feature construction. Averaging across folds yields the reported AUC, F1, MCC, and AP values. The no-transfer baseline follows the same loop but substitutes a StandardScaler for Steps 1 to 5, leaving the feature distributions unaligned. All stochastic operations are conditioned on a fixed random seed of 42.
Moreover, the experiments were run on a Windows 11 64-bit system with an AMD Ryzen eight-core processor (4.10 GHz), 32 GB RAM, and a 466 GB hard drive. The implementation used Python 3.14.6 in a dedicated virtual environment. Core packages were scikit-learn for ensemble construction, normalisation, and evaluation metrics; imbalanced-learn for SMOTE oversampling; scipy for Wilcoxon signed-rank tests; and numpy, pandas, and matplotlib for data handling and figure generation. Ensemble hyperparameters were fixed a priori: (BaggingClassifier: 50 estimators, max_depth = 5; AdaBoostClassifier: 50 estimators, max_depth = 3; LR: C = 1.0, solver = lbfgs, max_iter = 1000). No hyperparameter search was carried out. The complete experiment, which involves 20 source–target pairs each evaluated under 5-fold stratified cross-validation, completed in 321 s (~16 s per pair). TCA kernel construction is the dominant cost; the 500-instance subsampling cap bounds this to at most 250,000 matrix entries per domain pair.
2.5. Evaluation Metrics and Statistical Tests
To evaluate the performance of the model, we used AUC as the primary metric, because it is threshold-independent and standard in CPDP literature [4,5]. F1-score and MCC are secondary metrics; however, MCC is preferable to F1 under severe class imbalance [28]. Average Precision (AP), which is the area under the Precision–Recall curve, is also reported, as it aggregates precision across all recall thresholds and is more informative than F1 under the class ratios present in these datasets. Pairwise comparison across 20 source–target pairs uses the one-sided Wilcoxon signed-rank test (H1: TCA > baseline) with two complementary effect size measures. Rank-biserial r is computed as follows:
where W+ and W− are the sums of positive and negative signed ranks, respectively, and n is the number of non-zero differences. Cliff’s Delta d is reported alongside r as a second effect size, with |d| > 0.5 indicating a large effect. We use α = 0.05 with no multiple-testing correction across four comparisons, following the precedent in Ref. [4]. Both |r| > 0.5 and |d| > 0.5 are the conventional thresholds for a large effect.
3. Results
This section presents the findings from the study. We present the results based on the RQs answered.
3.1. RQ 1: Does TCA Alignment Improve CPDP over Unaligned Training?
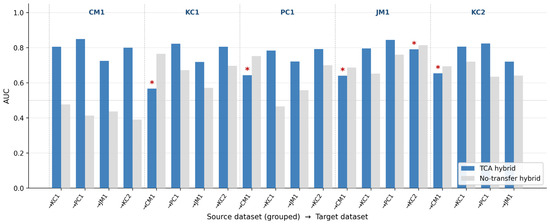
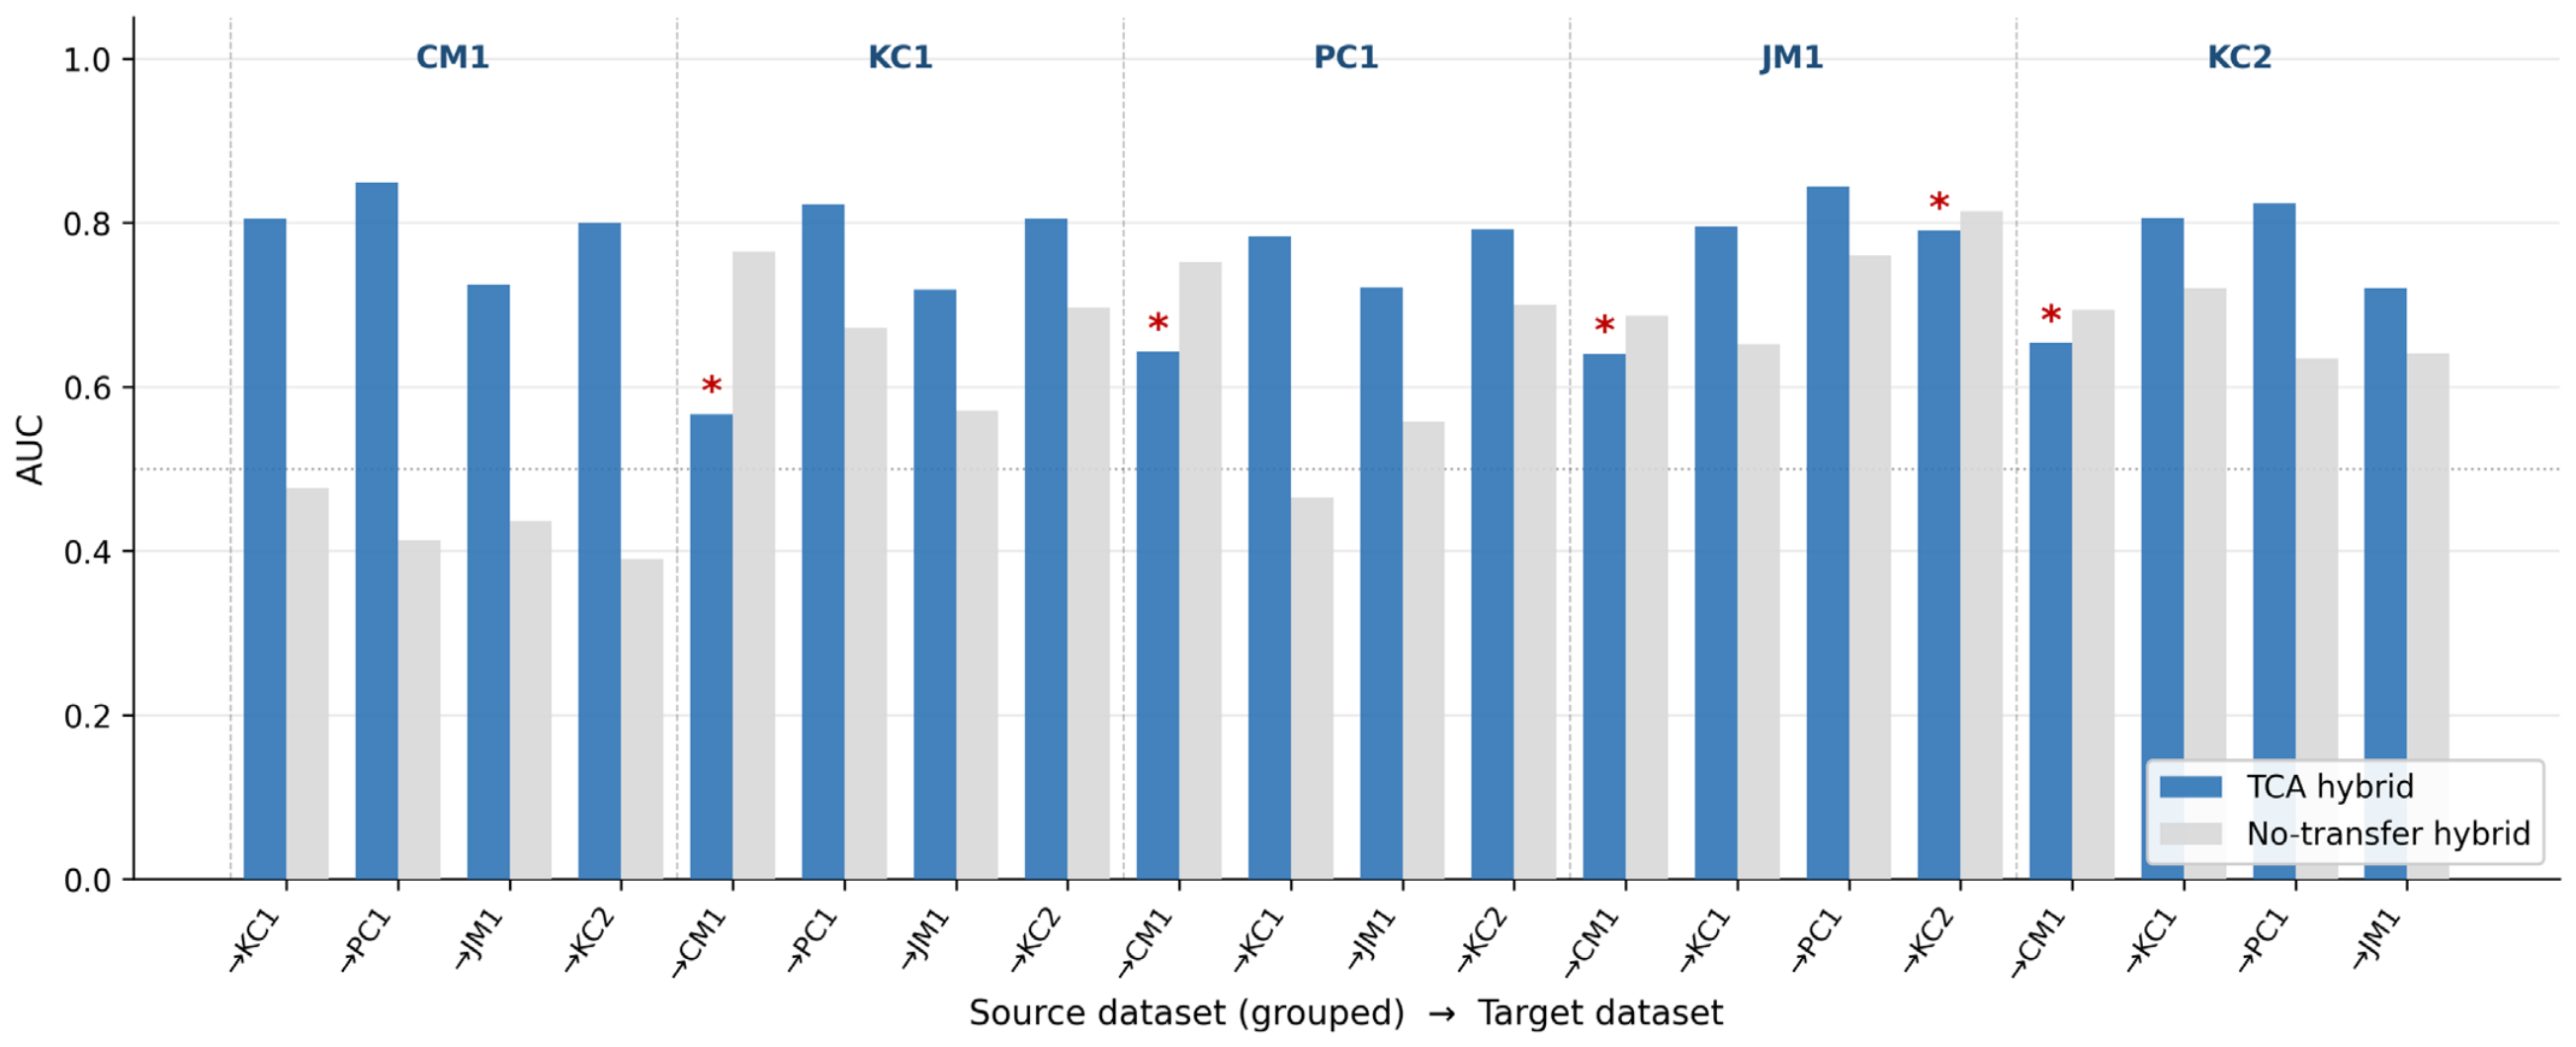
To answer RQ1, Table 2a reports the AUC for all 20 source–target pairs, while Figure 2 visualises it in terms of TCA hybrid vs. no-transfer baselines (* = pairs where TCA underperforms no-transfer, where (→) indicates transfer to. TCA raises mean AUC from 0.625 to 0.755 (Δ = +0.131), with Wilcoxon signed-rank significance on all three metrics: AUC (W = 180, p = 0.0018, r = 0.714), F1 (W = 184, p = 0.0010, r = 0.752), and MCC (W = 178, p = 0.0024, r = 0.695). All three rank-biserial values exceed the conventional large-effect threshold of |r| > 0.5. Cliff’s Delta confirms the following magnitude: AUC d = 0.640, F1 d = 0.615, MCC d = 0.545, all large by the |d| > 0.5 criterion. A 95% confidence interval for the TCA mean AUC of [0.719, 0.792] does not overlap with the no-transfer mean (0.625), confirming that the gain is both statistically significant and practically substantial. Table 2b presents the summary of the statistics.
Table 2.
(a) TCA hybrid ensemble vs. no-transfer baseline AUC. (b) Statistical summary.
Figure 2.
AUC for all source–target pairs: TCA hybrid vs. no-transfer baselines. (* = pairs where TCA underperforms no-transfer).
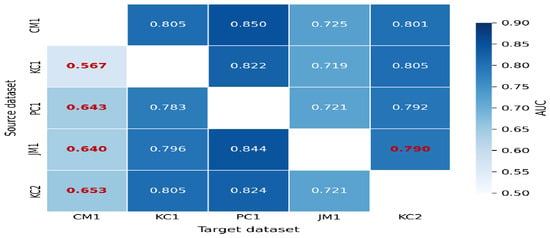
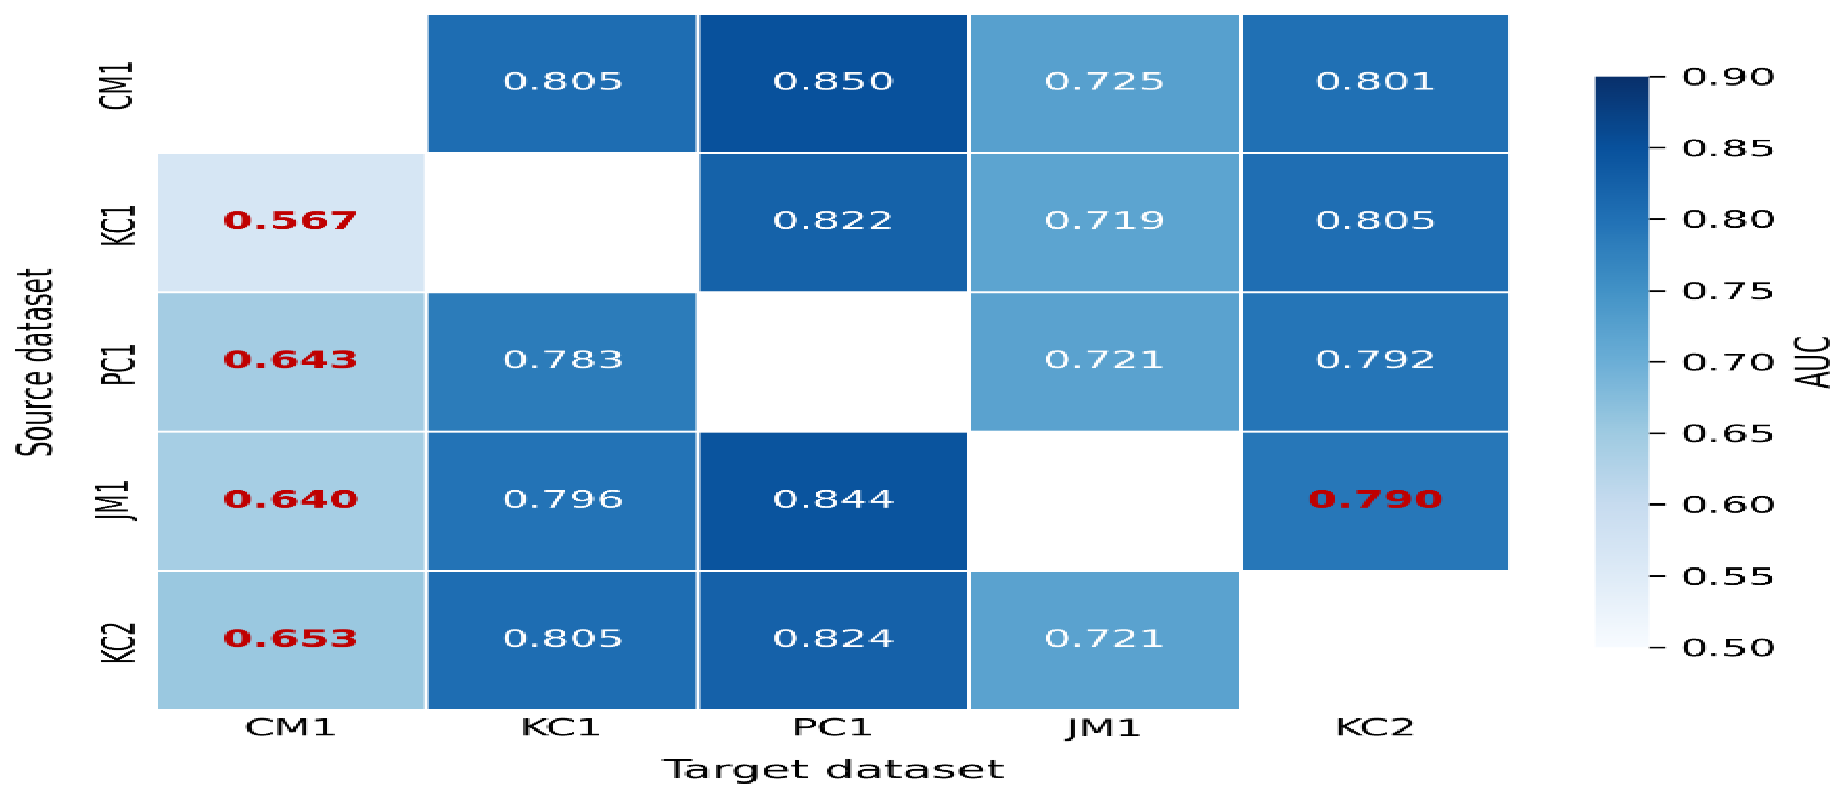
The largest AUC gains occurred when CM1 was the source: CM1 → PC1 gained 0.437, CM1 → KC2 gained 0.411, and CM1 → KC1 gained 0.329. However, Transfer Component Analysis (TCA) underperformed relative to no-transfer on five pairs. Four of these involved CM1 as the target, the smallest dataset with 442 instances. The fifth case (JM1 → KC2, Δ = −0.024) fell within the standard deviation of either condition. Accordingly, Figure 3 visualises the source–target AUC heatmap. Here, the CM1 target column is visually distinct, with red bold numbers marking the failure cluster. The diagonal is masked since self-transfer was not evaluated.
Figure 3.
TCA hybrid ensemble AUC of source–target heatmap.
3.2. RQ2: Does the Hybrid Ensemble Outperform Individual Classifiers?
Table 3 reports mean AUC, F1, and MCC across 20 pairs under six conditions: four classifier configurations trained on TCA-aligned, SMOTE-resampled features, a no-SMOTE ablation retaining TCA alignment, and the unaligned no-transfer baseline.
Table 3.
Complete ablation-mean performance across 20 pairs.
As shown in Table 3, alignment is the dominant contributor to performance. TCA alone improves AUC by +0.131 and F1 by +0.155 over the unaligned baseline. SMOTE provides a further +0.134 improvement in F1 and +0.060 in MCC, at the cost of a marginal AUC reduction (−0.014). This trade-off is appropriate for class-imbalanced defect prediction, where improving minority-class recall is the primary objective. Stacking adds marginal but consistent gains on F1 (+0.005) and MCC (+0.003) over the best single classifier (Bagging). Taken together, these findings are consistent with Li et al.’s [11] empirical conclusion that alignment parameters dominate classifier parameters in CPDP: the largest performance gains are attributable to the transfer component, not the ensemble architecture.
3.3. RQ3: Which Source Dataset Generalises Best After Alignment?
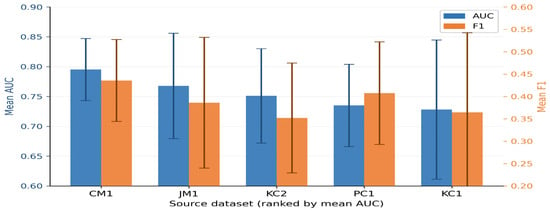
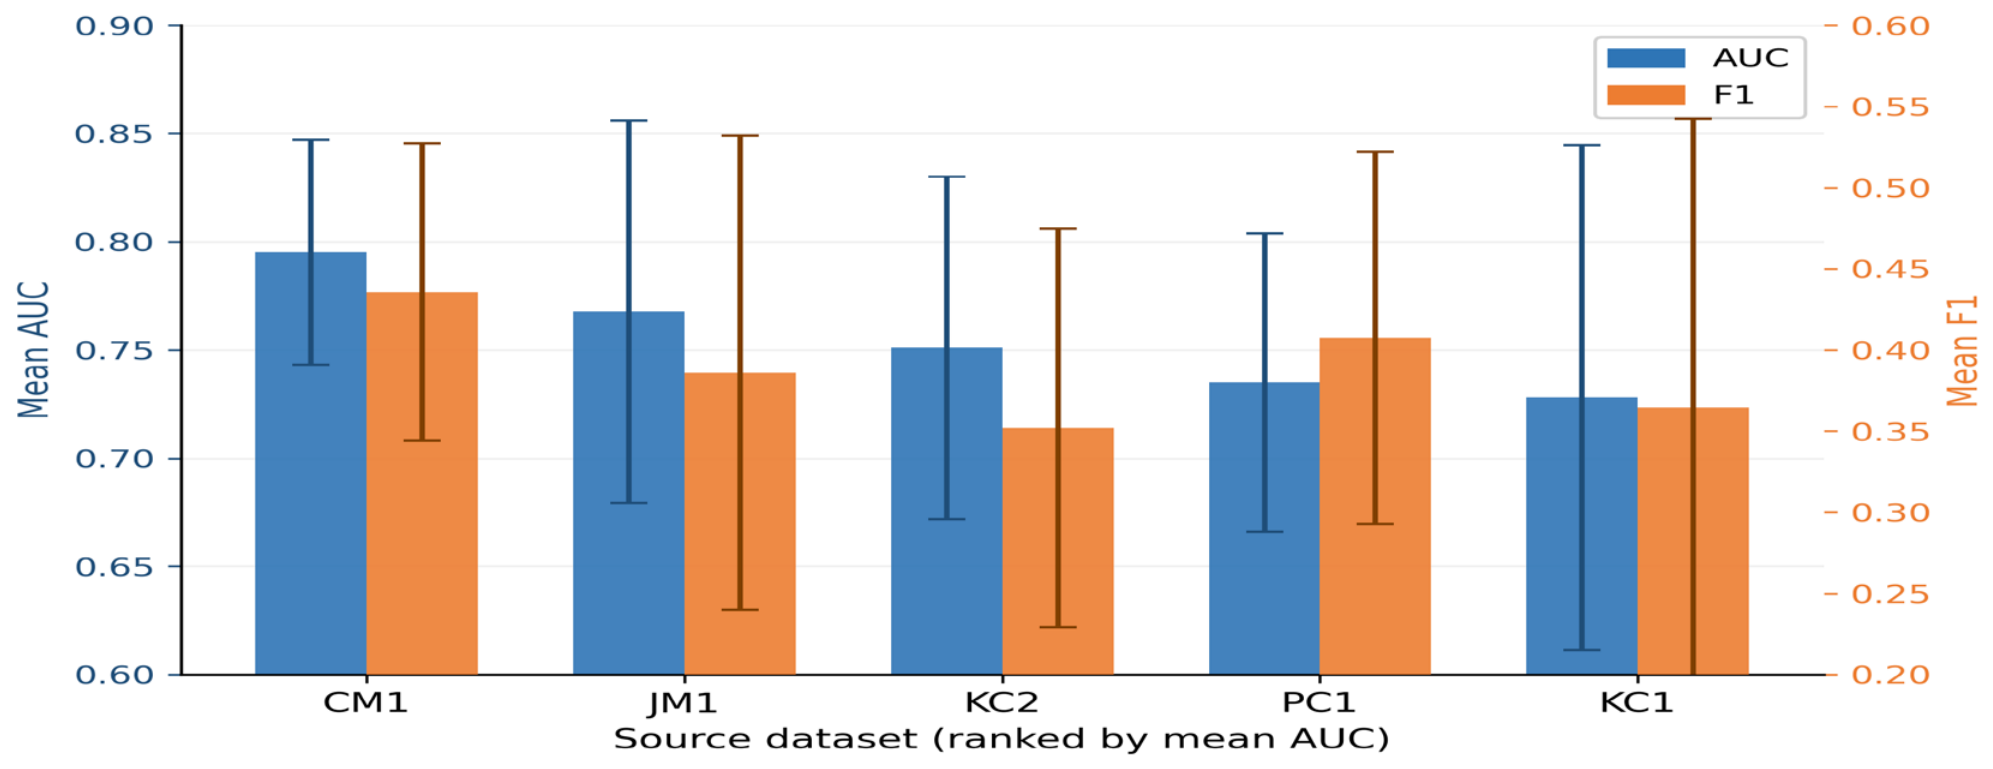
Table 4 reports per-source TCA generalisation ranked by mean AUC over four target pairs. CM1 ranks first as a source (mean AUC 0.795) despite being the smallest dataset. This contrasts with Isong and Dladlu [10], where JM1 as source achieved near-target conformal coverage while CM1 produced the largest coverage gaps. The reversal suggests that TCA alignment compensates for CM1’s small size when it is the source, but not when it is the target. KC1 ranks last (0.728) with the highest standard deviation (0.117), driven entirely by the KC1 → CM1 failure. Excluding CM1 as a target, KC1 reaches a mean AUC of 0.782, comparable to other sources. This is consistent with Liu et al.’s [2] finding that TCA+ instability is source–target pair specific rather than a global property of any source dataset.
Table 4.
Per-source TCA generalisation (ranked by mean AUC over four target pairs).
Figure 4 also illustrates a dual-axis bar chart ranked by AUC, with AUC values on the left axis and F1 scores on the right. As shown, CM1 leads on AUC but not on F1, and the crossing of the two metrics indicates that source rank depends on prioritised criteria.
Figure 4.
Per-source TCA generalisation with mean AUC and F1 over four target pairs.
3.4. RQ4: How Sensitive Is TCA to Subspace Dimensionality k?
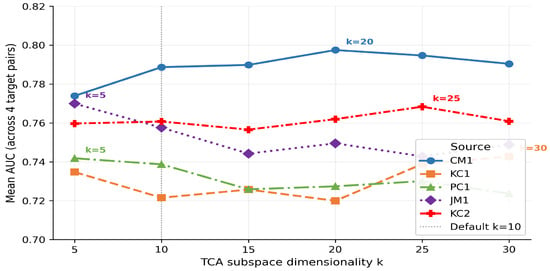
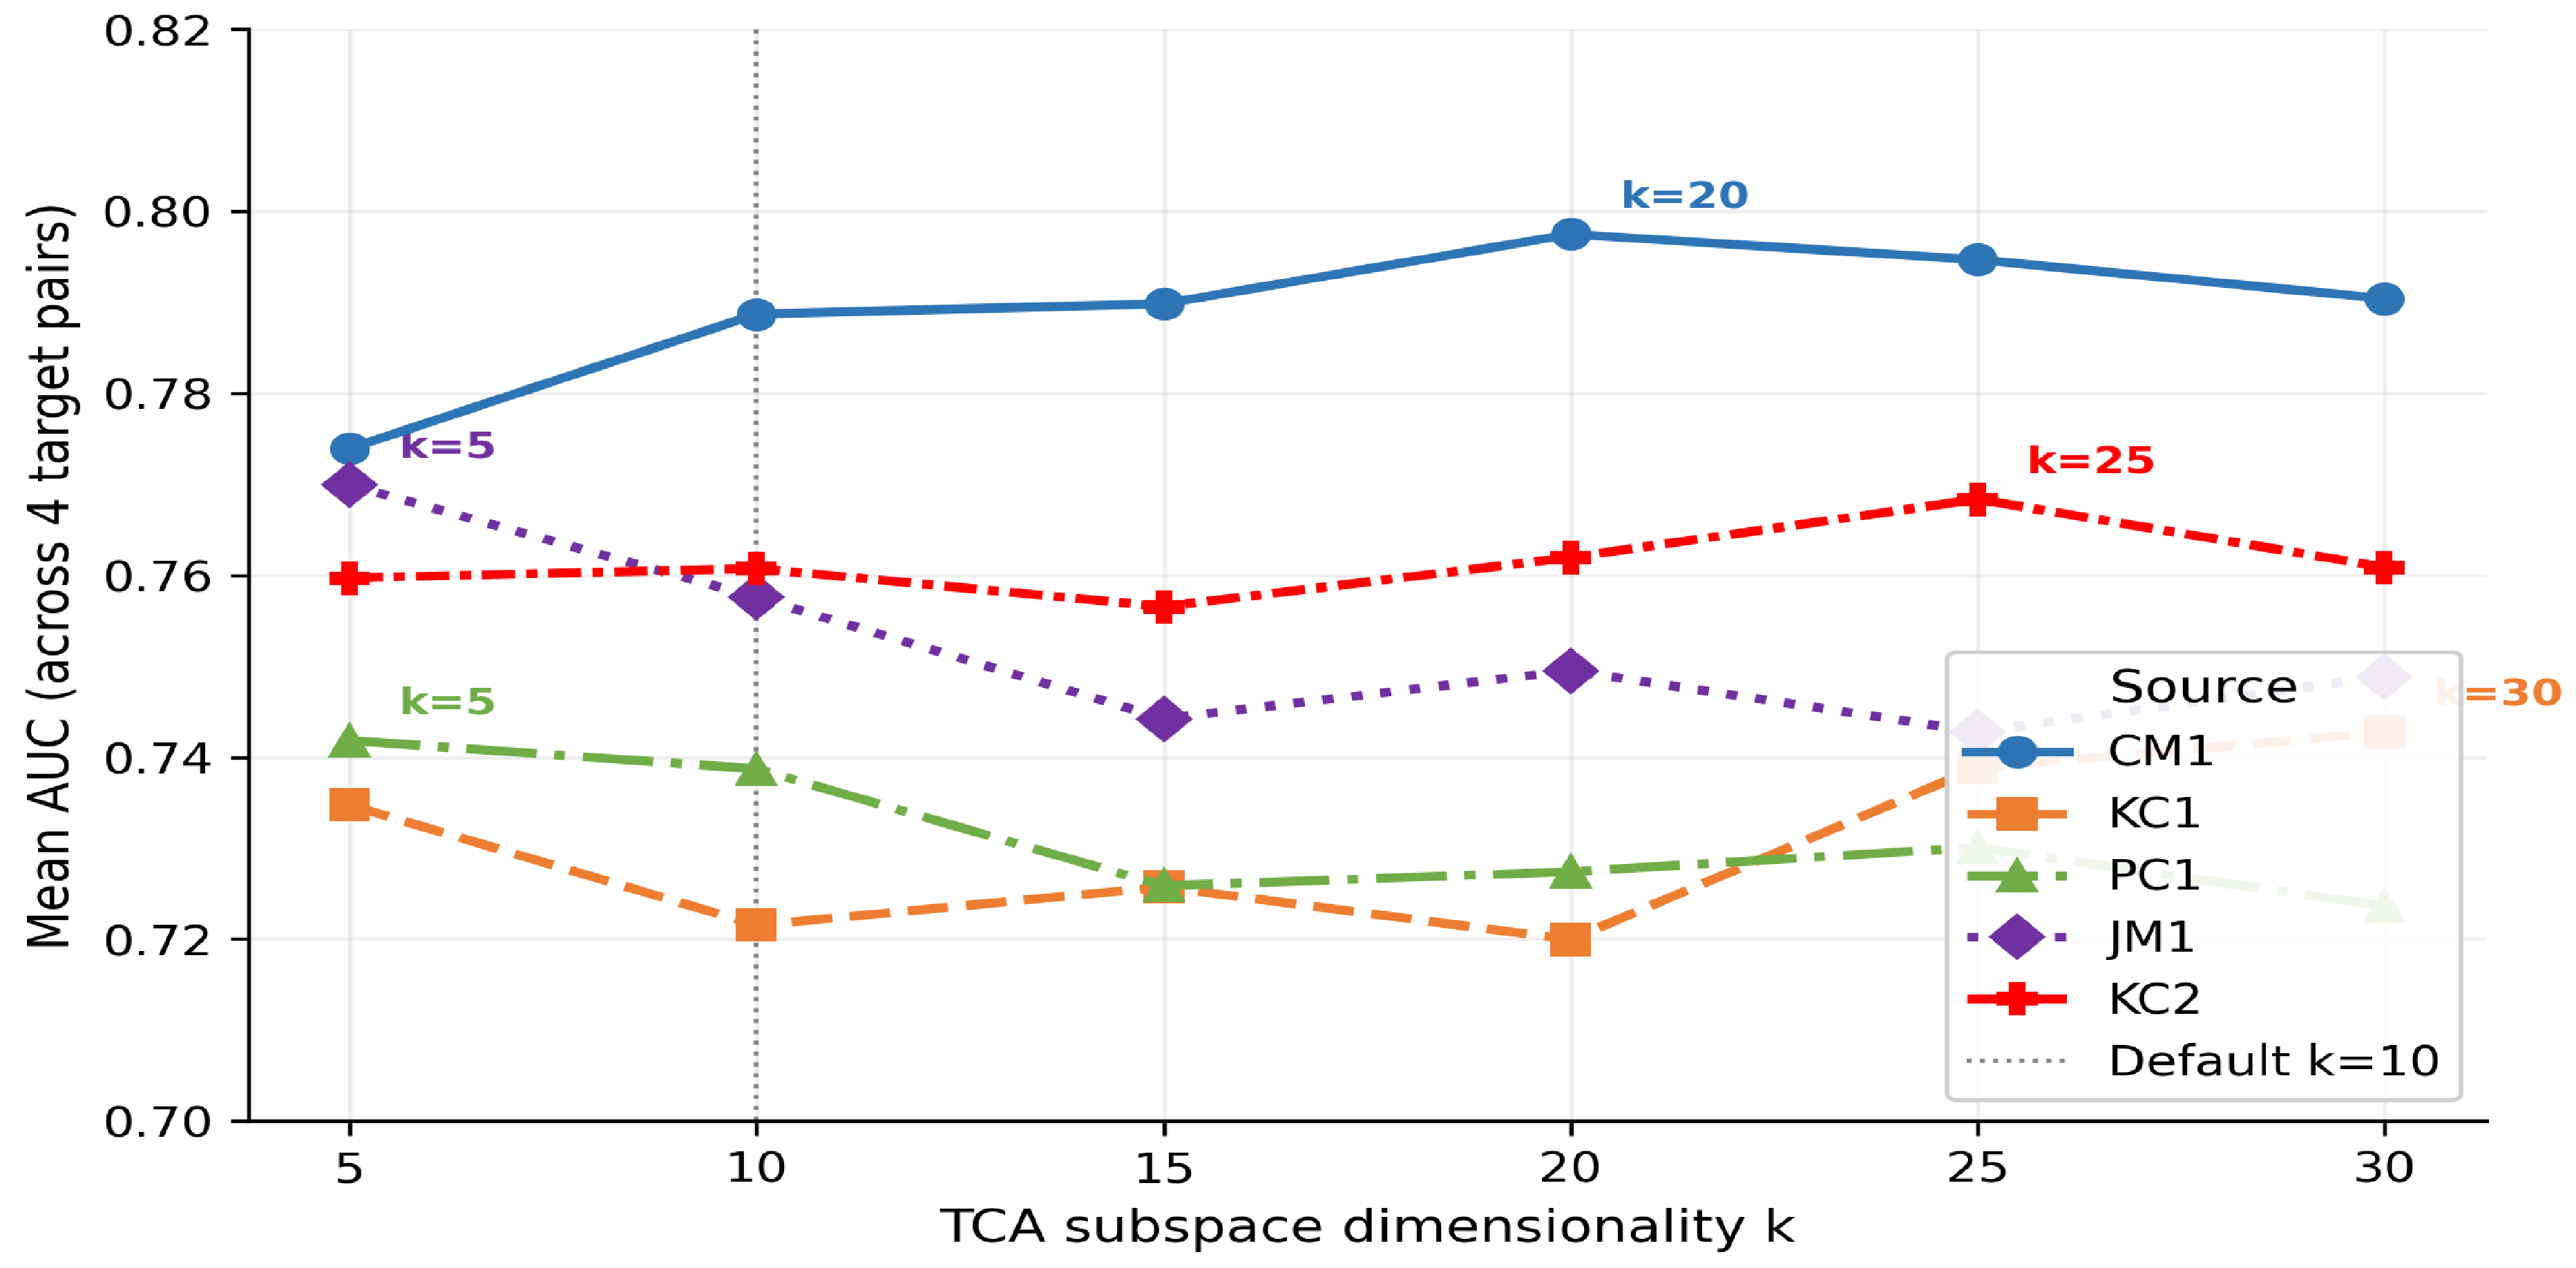
Per-source mean AUC across four targets at each k is reported in Table 5a. Optimal k ranges from 5 (PC1, JM1) to 30 (KC1), with no single value performing best across all sources. JM1 and PC1 peak at k = 5, indicating that a low-dimensional subspace captures the transferable signal for these sources. KC1 requires k = 30, reflecting a larger distributional gap that benefits from more transfer components. Mean AUC cost of using the fixed default k = 10 versus the per-source optimum is −0.011, small at the aggregate level but concealing pair-specific penalties up to −0.12 AUC for KC1→CM1 (k = 10: 0.559 vs. k = 5: 0.634).
Table 5.
(a) Per-source mean AUC across 4 targets at each k value; (b) CM1-as-target pairs: TCA AUC at each k vs. no-transfer baseline.
Table 5b examines the four CM1-as-target pairs across the same k range. At their respective optimal k values, JM1→CM1 (k = 5, AUC = 0.710) and KC2→CM1 (k = 25, AUC = 0.721) both exceeded their no-transfer baselines (0.686 and 0.694), whereas KC1→CM1 and PC1→CM1 remained below baseline across all tested k values. The unchanged AUC gap between JM1→CM1 and KC1→CM1 at k = 10 and k = 30 confirms that k influences performance within each source–target pair but cannot eliminate differences between pairs sharing the same target. However, source size is the separating factor: JM1 provides 13,204 instances versus KC1’s 2109, which affects kernel coverage in TCA subspace construction independently of k. These results clarify the findings reported in Section 4 by showing that the CM1-target failure is source-specific rather than an inherent property of CM1. Figure 5 visualises the per-source k response; the non-monotone curves and differing pair-specific optima supply the visual evidence for per-pair tuning over a global default. Each line represents one source dataset; the dotted vertical line marks the default k = 10 used in the main experiment. Per-source optimal k ranges from 5 (PC1, JM1) to 30 (KC1), confirming that no single global value is universally optimal. Both findings are consistent with Li et al.’s [4] conclusion that TCA alignment parameters matter more than classifier parameters in CPDP, and with Pan et al.’s [3] observation that optimal transfer dimensionality depends on the intrinsic dimensionality of the cross-domain manifold, which is pair-specific.
Figure 5.
Per-source mean AUC across four source–target pairs as a function of TCA subspace dimensionality k.
4. Discussion
4.1. Summary of Findings
This paper enhances CPDP with TCA-aligned hybrid ensemble learning. To achieve this, four RQs were addressed as follows. In terms of when TCA alignment helps, TCA produces the largest gains when the no-transfer baseline performs near chance, when CM1 serves as the source with no-transfer AUC below 0.50. In this case, kernel MMD minimisation maps the source into a subspace where the target is represented, giving the meta-learner a discriminative signal it otherwise lacks. The findings align with the strongest cases of Transfer Component Analysis Plus (TCA+) reported by Nam et al. [4]. They also support Pan et al.’s [3] theoretical guarantee that alignment is most effective when distributions are distinct in the original feature space but overlap in a lower-dimensional projection. The gains on CM1-as-source pairs also reflect the interaction between alignment and SMOTE rebalancing. CM1’s 10.9% defect rate means the unaligned source distribution is strongly skewed; TCA projects it into a space where the target’s class structure is better represented, and SMOTE then amplifies the minority class in that aligned space. This is consistent with Bennin et al. [25]. They found that performing alignment before resampling reduced false negatives without incurring an AUC cost, a result consistent with the CM1-source findings reported here.
The ablation study (Table 3) provides further insight into these results. SMOTE rebalancing traded a marginal reduction in AUC (−0.014) for substantial gains in F1 (+0.134) and MCC (+0.060), consistent with Bennin et al. [25]. This means the CM1-as-source gains in AUC are attributable to alignment alone, while the F1 gains also reflect SMOTE’s minority-class amplification in the aligned space, a compound benefit of the two-stage pipeline.
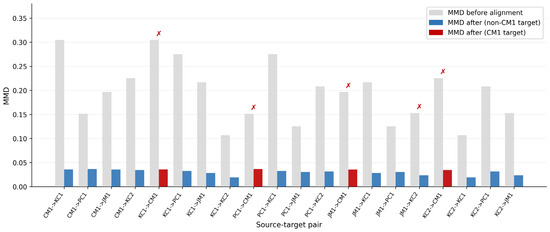
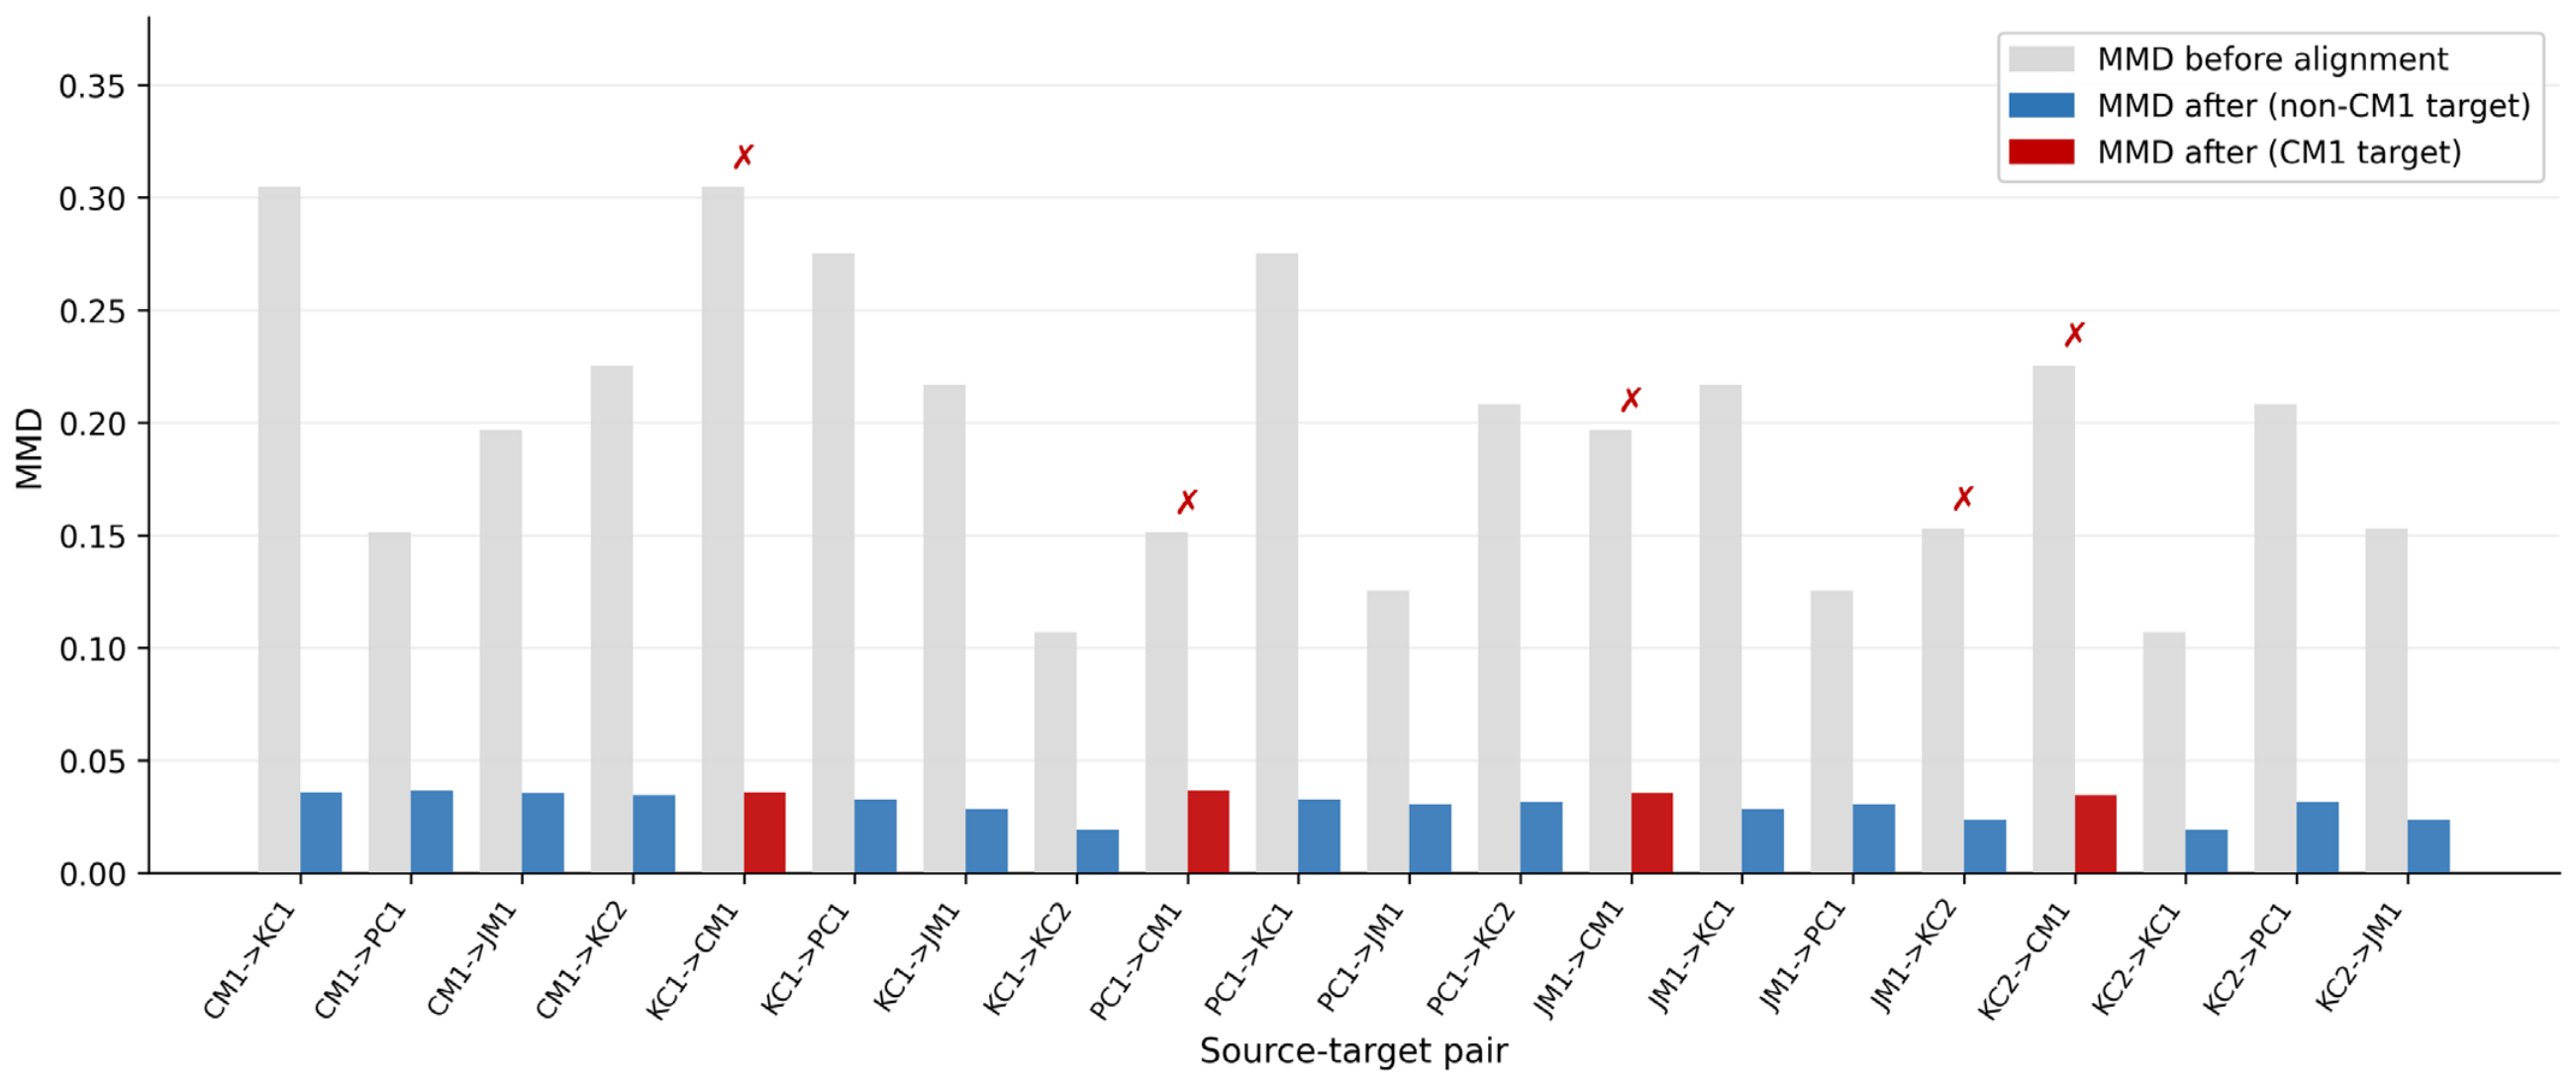
TCA reduces MMD in all 20/20 source–target pairs (mean reduction 83.3%), confirming that the kernel alignment procedure succeeds distributionally without exception (See Table 6). CM1-as-target pairs achieve 82.7% MMD reduction, nearly identical to the 83.4% achieved on non-CM1 targets; thus, the failure cannot be attributed to alignment breakdown at the marginal distribution level. The key difference lies in the residual distribution mismatch after alignment. CM1-as-target pairs retained a mean residual MMD of 0.0357, which was 1.21× higher than the mean residual for the other target datasets (0.0296). This difference reflects the higher pre-alignment MMD for CM1 (0.2195 versus 0.1906). Pearson correlation between residual MMD and TCA AUC across all 20 pairs is weak and non-significant (r = −0.322, p = 0.166), indicating that residual marginal MMD alone is insufficient to predict alignment success. Figure 6 further visualises the findings, showing MMD before and after TCA alignment, where ✗ indicates that TCA underperforms the no-transfer baseline. The red bar represents CM1 as a target.
Table 6.
MMD before and after TCA alignment for all 20 source–target pairs.
Figure 6.
MMD before and after TCA alignment for all 20 pairs.
The extended k sensitivity analysis (Table 5b) reveals that the CM1-as-target failure observed at the default k = 10 is source-specific rather than a universal property of CM1 as target. At their respective optimal k values, JM1→CM1 (k = 5, AUC = 0.710) and KC2→CM1 (k = 25, AUC = 0.721) both exceed their no-transfer baselines (0.686 and 0.694). KC1→CM1 and PC1→CM1 remain below their no-transfer baselines at all k values tested. This distinction is important because the failure is not that CM1 is inherently unalignable, but that KC1 and PC1 lack the structural compatibility with CM1 necessary for TCA to identify transferable components, regardless of subspace dimensionality.
In the same vein, JM1→KC2 provides independent evidence of a second failure mode distinct from the CM1 case. This pair achieves 84.5% MMD reduction, and the lowest residual MMD among all TCA-loss pairs (0.0237), yet TCA underperforms no-transfer by 0.024 AUC. Successful marginal distribution alignment does not guarantee prediction improvement when class-conditional distributions P(X|y) also diverge between source and target—a pattern consistent with the weak overall correlation (r = −0.322). JM1 is a real-time predictive ground system, whereas KC2 is a storage management system. The difference in their functional domains is sufficient for the class-conditional structure of defective modules to diverge, even after successful marginal alignment. BDA [15] and W-BDA+ [16] address this failure mode directly via adaptive balance factor weighting of marginal and conditional MMD jointly and are identified as priority extensions for the JM1→KC2 and KC1→CM1/PC1→CM1 failure cases.
4.2. Comparison with Related Methods
To position this study against prior studies, Liu et al. [2] reported that source project selection, not the alignment procedure itself, drives TCA+ instability. The per-source results here are consistent. That is, excluding CM1-as-target pairs, all five sources achieve AUC in the range 0.728–0.795, with variance driven by target characteristics rather than source choice. A source estimator of the type proposed in Ref. [2], applied on top of the fixed TCA alignment used here, could reduce this remaining variance. Song et al. [6] and Zhang et al. [8] (Adan) represent the current performance ceiling for metric-based CPDP through adversarial alignment; MASTER [7] reports MCC gains of 49.1% over single-source TCA baselines by integrating multiple source projects. The single-source TCA hybrid achieved competitive AUC through a substantially simpler pipeline. This tends to resolve practical constraints, including reliance on a single source project, absence of source code access, and lack of adversarial training infrastructure.
Also, in the findings from RQ2, the BaggingClassifier achieved a marginally higher mean AUC than the hybrid (0.7585 vs. 0.7553, p = 0.133). This supported Li et al. [11]’s findings, where classifier choice is secondary to alignment in cross-project defect prediction. The hybrid’s advantage in F1 and MCC reflected stronger handling of class imbalance through the stacking layer, which calibrated ensemble output toward minority-class sensitivity. Nikravesh and Keyvanpour [13] observed similar patterns. Here, SMOTE-weighted ensemble approaches improved F-measure beyond AUC-only gains, supporting the interpretation that the hybrid’s design is well-suited to imbalanced data.
4.3. Limitations and Validity Threats
A few validity threats limit the study and its findings. One concern is the 500-instance subsampling cap, which introduces approximation error for large sources. For JM1 (13,204 instances), alignment is computed on approximately 4% of available data. Stratified subsampling preserves class ratios across cap sizes, consistent with the fixed kernel bandwidth used throughout. The TCA kernel matrix was bounded to a maximum of 250,000 entries per domain pair. This constraint kept the complete experiment, comprising 20 domain pairs evaluated under five-fold stratified cross-validation, within 321 s (approximately 16 s per pair) on the specified hardware. The TCA kernel W is held fixed across folds, appropriate for transductive alignment but precluding fold-specific adaptation.
Another weakness found is that AUC measures ranking ability but not calibration. Average Precision and MCC are reported alongside AUC to address F1’s known instability under class imbalance [28]. Calibration evaluation is the focus of our future work. Also, all five datasets are NASA C/C++ procedural systems from the 1990s–2000s. Whether results extend to modern Java, Python, or JavaScript projects, as evaluated by deep methods [9,19], remains unverified. In terms of the quality of the datasets, JM1 contains 13,204 instances rather than the 10,885 in the canonical PROMISE release (defect rate 0.159 vs. 0.193), consistent with MDP+PROMISE concatenation as documented by Shepperd et al. [26]. All other dataset counts matched the PROMISE versions exactly.
Moreover, TCA minimises marginal distribution divergence P(X) but does not address class-conditional divergence P(X|y). The transfer of JM1 to KC2, with low residual MMD yet TCA loses, points to conditional shift as a factor that marginal alignment cannot resolve. BDA [15] and W-BDA+ [16] address this directly. For temporal validation, the stratified 5-fold CV is consistent with the majority of comparable CPDP studies [3,4,14,16] but does not enforce chronological ordering. The absence of project-level commit timestamps in the NASA PROMISE dataset prevents time-series validation and remains a direction for future work. Finally, SMOTE is the sole resampling method evaluated. Borderline-SMOTE, ADASYN, and CTGAN may offer complementary benefits under different class ratio conditions; their comparison in CPDP is identified as future work.
5. Conclusions
TCA-aligned hybrid ensemble learning for CPDP is examined in this paper, with the goal of ensuring that failure is prevented when the source and target diverge in feature distribution. This, in turn, helps direct quality assurance efforts toward modules most likely to contain defects effectively. We designed a two-layer stacking ensemble architecture, and the performance was assessed using metrics with statistical tests via experiments on five NASA MDP datasets. Findings showed TCA alignment enhanced performance when combined with a fixed two-layer hybrid ensemble. Specifically, mean AUC increased by 0.131 compared with an unaligned baseline, with large-effect statistical significance across all three metrics: AUC (r = 0.714), F1 (r = 0.752), MCC (r = 0.695), and Cliff’s d = 0.640 over 20 source–target pairs. A full ablation identified alignment as the dominant contributor to performance. TCA improved AUC by +0.131, whereas SMOTE traded −0.014 AUC for +0.134 F1. The stacking layer added +0.005 F1 over Bagging alone. The method is applicable when only a single labelled source project is available, source code is inaccessible, and computational resources are limited. Under these conditions, TCA-aligned hybrid ensemble learning provides a reproducible, interpretable, and statistically significant improvement over unaligned transfer. TCA reduces TCA substantially reduced MMD, supporting Pan et al.’s finding that kernel MMD minimisation reduces distributional divergence. The sensitivity analysis also showed that the TCA subspace dimensionality parameter, k, exhibits source-specific behaviour, reinforcing the importance of alignment parameter selection in CPDP.
The findings also identify four priorities for future research. The first two focus on conformal prediction for coverage-guaranteed uncertainty quantification and mRMR feature selection to identify project-invariant features. The remaining directions investigate conditional distribution alignment using BDA or W-BDA+ to address the CM1 and JM1 transfer to KC2 failure cases, and cost-sensitive learning with asymmetric misclassification costs. The study focuses on the contribution of TCA alignment while keeping the classifier configuration fixed to provide a controlled evaluation.
Funding
This research received no external funding.
Institutional Review Board Statement
Not applicable.
Informed Consent Statement
Not applicable.
Data Availability Statement
The dataset used in this study is publicly available at https://github.com/ApoorvaKrisna/NASA-promise-dataset-repository [accessed on 27 April 2026].
Conflicts of Interest
The author declares no conflicts of interest.
References
- Grattan, N.; da Costa, D.A.; Stanger, N. The need for more informative defect prediction: A systematic literature review. Inf. Softw. Technol. 2024, 171, 107456. [Google Scholar] [CrossRef] [Scilit]
- Liu, C.; Yang, D.; Xia, X.; Yan, M.; Zhang, X. A two-phase transfer learning model for cross-project defect prediction. Inf. Softw. Technol. 2019, 107, 125–136. [Google Scholar] [CrossRef] [Scilit]
- Pan, S.J.; Tsang, I.W.; Kwok, J.T.; Yang, Q. Domain adaptation via transfer component analysis. IEEE Trans. Neural Netw. 2011, 22, 199–210. [Google Scholar] [CrossRef] [Scilit] [PubMed]
- Nam, J.; Pan, S.J.; Kim, S. Transfer defect learning. In Proceedings of the 2013 35th International Conference on Software Engineering (ICSE); IEEE: New York, NY, USA, 2013; pp. 382–391. [Google Scholar]
- Xia, X.; Lo, D.; Pan, S.J.; Nagappan, N.; Wang, X. HYDRA: Massively compositional model for cross-project defect prediction. IEEE Trans. Softw. Eng. 2016, 42, 977–998. [Google Scholar] [CrossRef] [Scilit]
- Song, H.; Wu, G.; Ma, L.; Pan, Y.; Huang, Q.; Jiang, S. Adversarial domain adaptation for cross-project defect prediction. Empir. Softw. Eng. 2023, 28, 127. [Google Scholar] [CrossRef] [Scilit]
- Tong, H.; Zhang, D.; Liu, J.; Xing, W.; Lu, L.; Lu, W.; Wu, Y. MASTER: Multi-source transfer weighted ensemble learning for multiple sources cross-project defect prediction. IEEE Trans. Softw. Eng. 2024, 50, 1281–1305. [Google Scholar] [CrossRef] [Scilit]
- Zhang, W.; Zhao, J.; Qin, G.; Wang, S. Cross-project defect prediction based on autoencoder with dynamic adversarial adaptation. Appl. Intell. 2025, 55, 324. [Google Scholar] [CrossRef] [Scilit]
- Zou, Y.; Wang, H. A three-stage cross-project defect prediction framework based on feature representation and knowledge transfer. Complex Intell. Syst. 2025, 11, 459. [Google Scholar] [CrossRef] [Scilit]
- Isong, B.; Dladlu, N. Uncertainty-aware software defect prediction via conformal prediction: A hybrid ensemble approach. Int. J. Inform. Commun. Technol. (IJ-ICT) 2026. under review. [Google Scholar]
- Li, K.; Xiang, Z.; Chen, T.; Wang, S.; Tan, K.C. Understanding the automated parameter optimisation on transfer learning for cross-project defect prediction: An empirical study. In ICSE ’20: Proceedings of the ACM/IEEE 42nd International Conference on Software Engineering; ACM: New York, NY, USA, 2020; pp. 566–577. [Google Scholar]
- Dai, W.; Yang, Q.; Xue, G.-R.; Yu, Y. Boosting for transfer learning. In ICML ’07: Proceedings of the 24th International Conference on Machine Learning; ACM: New York, NY, USA, 2007; pp. 193–200. [Google Scholar]
- Nikravesh, N.; Keyvanpour, M.R. Cross-project defect prediction with an enhanced transfer boosting algorithm. In Proceedings of the 2022 12th International Conference on Computer and Knowledge Engineering (ICCKE); IEEE: New York, NY, USA, 2022; pp. 157–162. [Google Scholar]
- Bala, Y.Z.; Abdul Samat, P.; Sharif, K.Y.; Manshor, N. Improving cross-project software defect prediction method through transformation and feature selection approach. IEEE Access 2023, 11, 2318–2326. [Google Scholar] [CrossRef] [Scilit]
- Xu, Z.; Pang, S.; Zhang, T.; Luo, X.; Liu, P.; Yu, H.; Guo, Y.; Xie, T. Cross-project defect prediction via balanced distribution adaptation based transfer learning. J. Comput. Sci. Technol. 2019, 34, 1039–1062. [Google Scholar] [CrossRef] [Scilit]
- Omondiagbe, O.P.; Licorish, S.A.; MacDonell, S.G. Improving transfer learning for software cross-project defect prediction. Appl. Intell. 2024, 54, 5593–5616. [Google Scholar] [CrossRef] [Scilit]
- Wu, J.; Wu, Y.; Niu, N.; Zhou, M. MHCPDP: Multi-source heterogeneous cross-project defect prediction via multi-source transfer learning and autoencoder. Softw. Qual. J. 2021, 29, 405–430. [Google Scholar] [CrossRef] [Scilit]
- Qiu, S.; Xu, H.; Deng, J.; Jiang, S.; Lu, L. Transfer convolutional neural network for cross-project defect prediction. Appl. Sci. 2019, 9, 2660. [Google Scholar] [CrossRef] [Scilit]
- Tao, H.; Fu, L.; Cao, Q.; Niu, X.; Chen, H.; Shang, S.; Xian, Y. Cross-project defect prediction using transfer learning with long short-term memory networks. IET Softw. 2024, 2024, 5550801. [Google Scholar] [CrossRef] [Scilit]
- McCabe, T.J. A complexity measure. IEEE Trans. Softw. Eng. 1976, SE-2, 308–320. [Google Scholar] [CrossRef] [Scilit]
- Halstead, M.H. Elements of Software Science; Elsevier: New York, NY, USA, 1977. [Google Scholar]
- Kanaujiya, G.K.; Verma, P. Ensemble-based feature selection and machine learning models for software defect prediction. Knowl. Inf. Syst. 2025, 67, 10325–10353. [Google Scholar] [CrossRef] [Scilit]
- Wolpert, D.H. Stacked generalisation. Neural Netw. 1992, 5, 241–259. [Google Scholar]
- Jalil, A.; Faiz, R.B.; Alyahya, S.; Maddeh, M. Impact of optimal feature selection using a hybrid method for a multiclass problem in cross-project defect prediction. Appl. Sci. 2022, 12, 12167. [Google Scholar] [CrossRef] [Scilit]
- Bennin, K.E.; Tahir, A.; MacDonell, S.G.; Borstler, J. An empirical study on the effectiveness of data resampling approaches for cross-project software defect prediction. IET Softw. 2022, 16, 185–199. [Google Scholar] [CrossRef] [Scilit]
- Shepperd, M.; Song, Q.; Sun, Z.; Mair, C. Data quality: Some comments on the NASA software defect datasets. IEEE Trans. Softw. Eng. 2013, 39, 1208–1215. [Google Scholar] [CrossRef] [Scilit]
- Pan, S.J.; Yang, Q. A survey on transfer learning. IEEE Trans. Knowl. Data Eng. 2010, 22, 1345–1359. [Google Scholar] [CrossRef] [Scilit]
- Chicco, D.; Jurman, G. The advantages of the Matthews correlation coefficient (MCC) over F1 score and accuracy in binary classification evaluation. BMC Genom. 2020, 21, 6. [Google Scholar] [CrossRef] [Scilit] [PubMed]

Disclaimer/Publisher’s Note: The statements, opinions and data contained in all publications are solely those of the individual author(s) and contributor(s) and not of MDPI and/or the editor(s). MDPI and/or the editor(s) disclaim responsibility for any injury to people or property resulting from any ideas, methods, instructions or products referred to in the content. |
© 2026 by the author. Licensee MDPI, Basel, Switzerland. This article is an open access article distributed under the terms and conditions of the Creative Commons Attribution (CC BY) license.