


Abstract
Public statements about artificial intelligence (AI) give outsiders uneven information about what an application does, how it is controlled and who supplies it. This study codes the public statements of a purposive frame of 37 US regional banks, large national banks and digital lenders into 194 AI applications. Performance figures accompany 55 applications; 8 report a baseline or control group, and 1 states costs. Oversight or testing is mentioned for 20, and neither internal work nor an external provider is named for 109. Only 24 applications appear in an SEC filing; 138 appear only outside filings. Applications in use (136) and those stating internal work more often state a performance figure, but not a baseline or control group; claim origin and, within organizations, channel show no detectable difference. Of nine comparisons among institution types, only the stating of model class survives correction for multiple testing. None of the US federal securities and consumer credit rules examined requires application-level public disclosure of AI use by these institutions, and most of the retrieved statements appear outside SEC filings. The study argues for a targeted public record for consequential applications and proposes an internal evidence check; both remain untested.
Keywords:
artificial intelligence; banking; fintech; AI disclosure; voluntary disclosure; model risk; third-party risk; technology sourcing JEL Classification:
G21; G23; G28; M41; O33
1. Introduction
JPMorgan Chase released LLM Suite to eligible employees across the firm in summer 2024, providing access to large language models in a secure environment [1]. Affirm announced in September 2026 that its transformer-based underwriting model was live at US checkouts and reported 3.4% more completed purchases against a control group [2]. Both announcements describe an application in use. Affirm also supplies a comparison against which to interpret its claimed result, although the announcement does not state the observation period or the number of customers. The difference illustrates this study’s question: what can an outsider assess from an institution’s public description of an AI application, and where does that description appear?
1.1. Why Public AI Disclosure Matters in Banking
AI applications can affect access to credit, customer service and employees’ work. Public descriptions give people outside the institution some information about these systems, although they cannot substitute for individual explanations, supervisory access or internal evaluation. Regulation B requires creditors to give specific principal reasons for adverse credit decisions [3]. The Consumer Financial Protection Bureau’s 2022 statement that this requirement applies to complex algorithms was withdrawn in May 2025, while the regulation itself is unchanged [4,5]; the Bureau has also documented inaccurate answers from bank chatbots [6]. Survey studies link trust to fintech adoption intention in Greece [7] and to neobank users’ retention intention [8], but do not show that publishing evaluation details creates that trust. A synthesis of nine studies finds disclosure cues underexamined relative to explanation and platform transparency, mainly in robo-advice [9], and experiments outside banking find that disclosing AI use can reduce trust [10]. This study examines the information institutions publish, not its effect on customer trust.
AI-related failures can have financial consequences. A study of five banks and financial services firms associates AI incidents with negative short-term cumulative abnormal returns [11], and an analysis of systemic risk argues that AI in finance can amplify tail risks through procyclicality, unknown unknowns, the need for trust and optimization against the system [12]. These studies motivate attention to evaluation and control; they do not show that a public record would prevent incidents or reduce systemic risk. Public claims also matter for accountability. The Securities and Exchange Commission sanctioned two investment advisers in 2024 and a listed company in 2025 for misleading statements about their use of AI [13,14]. For banks, naming suppliers helps readers identify dependencies: third-party guidance states that using a third party does not diminish a bank’s responsibility for safe, sound and lawful operation [15], and research in this journal argues that shared foundation models and cloud providers may create common exposures [16]. The 2026 model risk guidance places generative and agentic AI outside its scope while directing banks to determine appropriate controls through broader risk management and governance practices [17] (attachment, footnote 3).
Employees have a further reason to ask how a tool’s effects were measured. A study of 5172 customer support agents reports higher resolution rates with a generative assistant [18], while Danish administrative data find no earnings or hours effects larger than 2% two years after the launch of ChatGPT [19]. These findings concern different populations and outcomes. With research into how algorithms direct and evaluate work [20], they show why a claim about task performance should be read against the workflow and outcome it describes.
1.2. Adoption and Complementary Investment
Adoption is uneven, and acquiring a tool does not establish its value in use. US surveys have reported limited AI use across firms and greater use among large firms: one measured an increase from 3.7% to 5.4% between September 2023 and February 2024 [21], and another found fewer than 6% using any of five AI technologies in 2018 [22]. These surveys describe their own periods and measures, not the current stage of banking adoption. One model of general-purpose technologies predicts that measured gains lag adoption while firms build complementary processes and skills [23]. For public disclosure, the relevant distinction is between access to an AI tool and evidence of what changes when it is used.
1.3. Prior Research and Expectations
Research into fintech has examined efficiency and distributional outcomes [24,25]. Digital footprints carry predictive information about default [26], fintech mortgage lenders process applications faster without higher default [27], machine learning credit models can widen rate differences between borrower groups [28], and lending disparities vary by lender type and mortgage product [29]. Such studies evaluate financial technologies with outcome data. They do not tell a reader what evidence accompanies an institution’s public claim about a particular application.
Disclosure research explains why that evidence may be missing. Unravelling arguments predict full voluntary disclosure when disclosure is costless and receivers are skeptical of silence [30,31], and managers may withhold information when those conditions fail [32]. Empirical reviews and executive surveys find disclosure choices shaped by capital market incentives, litigation risk and proprietary costs [33,34,35]. Publicity differs from mandated reporting. Investor relations firms generate more media coverage of positive news [36], bidders originate more news during merger negotiations [37], and associating a firm with a fashionable technology has moved prices, from dotcom name changes [38] to speculative blockchain filings [39]; actionable AI narratives in annual reports are associated with subsequent valuation changes [40]. If liability and scrutiny raise the evidence content of a statement, applications described in a filing should carry more evidence than applications described only outside filings. Research into AI disclosure in banking works with filings and annual reports. Studies of Jordanian and US banks count AI-related terms in annual reports and relate the counts to financial performance [41,42].
A study of more than 30,000 Form 10-K filings from 2020 to 2024 measures how many companies mention AI and codes the types of risk in a sample of risk sentences [43]. Lioliou et al. code the governance framing of AI passages in the risk disclosures of 73 financial firms listed on the S&P 500 for 2022 to 2024 [44]. Odinet analyzes the financial risk of AI credit underwriting using public securities filings of the largest US bank holding companies and fintech lenders [45]. A 2026 study of 500 US finance sector firms per year flags agentic AI references in annual filings and quantifies controls density in the surrounding text, by firm-year from 2021 to 2025 [46]. Each of these studies draws on filings or annual reports, and its unit is the firm, the firm-year, the filing or the passage.
Research into AI transparency assesses foundation model developers [47] and proposes model cards, dataset documentation and internal audits [48,49,50]. Here the unit is an AI application as described by a financial institution; the coded fields are the evidence reported for the application, its safeguards and its sourcing, and the channel in which the description appears, whether or not that channel is a filing.
Prior work suggests three further patterns to examine. Together with the channel prediction above, these expectations organize exploratory comparisons; they do not establish why institutions disclose. Research into US banks documents rising IT spending concentrated among the largest institutions [51], and work on six large UK banks associates software and digital skill investment with productivity [52]. Greater technical resources could support internal work and evaluation; whether that capacity appears in the disclosures of the largest national banks is an empirical question, and the size classes in these studies differ from those used here. Research into smaller banks describes concentrated core processing markets [53], technology searches that begin with existing core providers [54] and limited bargaining power with AI vendors [55] (pp. 25–27). Regional banks are larger than the institutions in much of this work, and the comparison here asks only whether their disclosures name external providers more often; naming a provider does not measure dependence on it. Studies of fintech lending emphasize measurable outcomes such as processing speed [27] and default prediction [26]. Such an emphasis could lead digital lenders to publish performance figures; the analysis examines whether that pattern appears, not the mechanism behind it.
1.4. Evaluation, Safeguards, Sourcing and Channel
The study separates four kinds of information. Evaluation statements report the outcomes used to support a claim that an application works; the NIST framework emphasizes measurement across the AI life cycle [56]. Safeguard statements describe reported controls, such as human review, testing and monitoring; a mention does not establish that a control is effective. Sourcing statements name internal work and external providers; they identify some dependencies without measuring their extent. The channel records where a statement appears, from a filing with the Securities and Exchange Commission to a press release, a company web page or a third party’s account.
Sourcing also connects disclosure to the evidence an institution needs internally. Transaction cost economics examines choices between making and buying under uncertainty [57], absorptive capacity explains why a purchaser needs relevant knowledge to judge outside technology [58], and dynamic capabilities concern the ability to change an arrangement as conditions change [59].
The central question is whether an institution’s public description of an AI application allows an outsider to assess the claim made for it. Four questions follow. What do US banks and fintech lenders disclose about evaluation, safeguards and sourcing? In which channels do the descriptions appear, inside or outside SEC filings? How does reporting differ among regional banks, large national banks and digital lenders? Is the evidence attached to an application associated with its deployment stage, the origin of the claim, its sourcing or its channel? Disclosure theory offers two readings of a gap between an announced application and its reported evidence, selective withholding and the absence of evidence (Section 4.2); the design records the gap and does not identify its cause. The observed omissions, the regulatory setting and existing guidance then support a proposed public disclosure record and an internal evidence check. The comparisons concern disclosed information, not underlying system quality.
Four explanations of the gap yield comparisons. If evaluation lags deployment, applications described as in use should state more evidence than those announced, planned or in a pilot. If suppliers and third parties publicize applications without the institution’s evaluation, claims made by the institution should carry more evidence than claims made only by others. If internal work gives an institution the data and the capability to evaluate [57,58], applications that state internal work should carry more evidence than those that do not. If scrutiny raises content, an organization’s filing records should state more than its other records. These expectations were formalized after coding began; they are exploratory, and Section 3.8 reports every comparison made. The descriptive results of Section 3.1, Section 3.2, Section 3.3, Section 3.4 and Section 3.5 are the primary findings; the comparisons of Section 3.8 are secondary and do not identify causes.
2. Materials and Methods
2.1. Frame
The study compares 37 organizations in 3 strata (Table 1): 22 regional banks, 8 large national banks and 7 digital or card-led banking groups and consumer lenders. The regional stratum holds the US-controlled relationship banking organizations with USD 50–500 billion in insured charter assets and offices in at least two states in the FDIC snapshot of 18 September 2026 [60]; the large bank stratum applies the same rules above USD 500 billion. The digital stratum combines the digital and card-led banking groups excluded from the regional screen with US-listed consumer lenders and neobanks with at least USD 1 billion in annual revenue; it spans several business models. The frame is purposive: comparisons describe these organizations, not the prevalence of AI disclosure across US banking. The Organizations sheet of Supplementary Material S1 gives every inclusion and exclusion.
Table 1.
Organizations, documents and applications by stratum.
2.2. Search and Verification
Every organization was searched with eight required query families: general AI terms, customer service, lending, operations and employee knowledge, fraud and compliance, human resources, technology partners and annual reports. The protocol permitted one additional query per organization, and execution included some repeated queries under alternative organization names; the Queries sheet of S1 and Supplementary Material S2 record these differences. Searches ran between 28 September and 2 October 2026 and admitted dated sources published on or before 23 September 2026; undated pages were admitted and flagged. Every returned result received a screening disposition, and at most 15 records were admitted per organization, primary sources first. Separate language model reviewers checked each submitted record against its source. Of 410 submitted records, 375 were admitted. After a full reading of one source, one further record was separated from an admitted record, so the dataset holds 411 records found and 376 admitted (Supplementary Material S2, Sections S2.4 and S2.16). A second check attempted all 223 documents: 219 opened directly, 2 through alternate copies and 2 could not be opened. It covered the 375 records admitted when it ran and found 368 claims supported, 3 partly supported and 4 not assessable; the record separated later was checked in the session that created it. Of the admitted records, 49 have a missing or uncertain publication date. These checks establish correspondence between a coded claim and the retrieved source text; the performance a record reports remains the organization’s claim.
2.3. Units and Coding
A disclosure record is one claim, in one document, about the organization’s own AI activity. An application is a distinguishable AI tool or workflow with one function. Records are linked to one application when they share organization, function and primary user and describe the same tool or workflow; the Crosswalk sheet of Supplementary Material S1 gives the decision for every admitted record. Records that name a platform, a portfolio or several workflows without distinguishing them stay at record level. The unit is therefore a function as the institution describes it, and it covers in-house models, commercial software configured by the institution and enterprise assistants alike. A model is a statistical or machine learning component of an application, a platform is an environment that hosts several applications, and a workflow is the business process in which an application is used. An unpartitioned platform stays at record level, whereas an enterprise assistant used by employees counts as one application.
An earlier blind second coding of 40 applications, drawn at random within strata with 2 contested cases added, agreed on the unit for 30; the disagreements were adjudicated, and the rules applied to all records (S2). That check preceded the final unit set and was not repeated on it. Table S2.38 repeats the main shares for general-purpose assistants and platforms and for all other applications.
An element counts as stated for an application if at least one linked record states it, and evaluation is coded at the strongest comparison level attributed to the application. Table 2 gives the coded fields.
Table 2.
Coded fields.
Function, user group and output recipient are separate dimensions. An underwriting model belongs to the first functional group and may decide or inform a credit outcome even when no operator is named; an employee assistant that drafts responses for service staff belongs to the second group, names employees as users and need not determine a customer outcome. The functional groups describe what an application does. They are not risk tiers in the sense of the EU AI Act, which classifies by intended use and treats creditworthiness assessment as high risk while excluding fraud detection from that category [61].
Each document was assigned to one channel by rules applied to its address, title and source type, and each record took the channel of its document, except six records that a locator check placed in a shareholder letter or press release text inside an annual report PDF hosted by the organization outside EDGAR; these are coded as investor communications at record level (S1, Crosswalk sheet; S2, Section S2.16.1). An SEC filing is a document filed with or furnished to the Commission: Form 10-K, 10-Q, a proxy statement, an 8-K exhibit or an annual report on EDGAR. Investor communications are earnings calls, investor days and shareholder letters outside EDGAR. A second coder, blind to the rule output, coded the 223 documents from the same title and address information; agreement was 209 of 223 (Cohen’s kappa 0.92), and 222 of 223 on whether a document is an SEC filing. The 14 disagreements were adjudicated individually (S2).
2.4. Coding Reliability
Search, verification and coding were carried out by language model agents working to fixed written protocols under the author’s supervision; no human coder took part. A total of 2 blind coders reviewed 100 applications, and 2 reviewed all 193 applications coded before the final check, which added the 194th application by splitting 1 chatbot application from a mobile app search; the latter applied a clarified user rule, so user agreement with the original codes includes the effect of that clarification. Cohen’s kappa between the original codes and each blind coder was 0.54–0.68 for the user group, 0.51–0.73 for internal work, 0.89–0.92 for the evaluation level and 0.95–0.97 for the comparator. A code was replaced when every blind coder agreed on a different value and no passage in the source supported the original; the rule, fixed before the full recoding was read, replaced 61 codes and kept 15 on a quoted passage.
A further 3 blind coders, all instances of 1 model family, coded oversight and testing from the case material of the 193 applications present at that stage; Fleiss’ kappa was 1.00 and 0.88. The 194th application was coded for both from its source passage by the adjudicating session. The majority code was used, and a code on which all three coders differed was coded as not stated.
Three other blind coders of the same family coded the output recipient of all 194 applications from the same case material, with a codebook that does not refer to human review; Fleiss’ kappa was 0.91. An earlier definition of the decision role included the condition that no human review is stated; it made the role depend on the oversight code, and the recipient coding replaces it (S2). The earlier and revised codes agree for 140 of the 194 applications (Table S2.40); the construct changed, so the differences are not coding errors. These statistics measure consistency between models reading shared material. They do not establish coding accuracy, the correctness of the organizations’ claims or the completeness of retrieval. Supplementary Material S2 names the models and gives every agreement table and replaced code. Additional checks of the reported figures, the text and the references used OpenAI GPT-6.1 Sol Medium and Anthropic Claude Sonnet 5.5; neither model served as a coder.
2.5. Analysis
Shares are reported with their denominators. Differences between the three types of institutions are tested by permuting type labels across the 34 organizations with applications, keeping the number of each type fixed, with 5000 permutations of a chi-square statistic, which keeps each organization’s applications together. Differences between the first functional group and the rest use Fisher’s exact test, which treats applications as independent; the two tests of Section 3.3 and Section 3.4 form a third family of two. Logistic regressions estimate whether an application states a performance figure, a safeguard, its sourcing or its user group, with the type of institution, the functional group and a generative AI indicator as covariates; the indicator distinguishes applications whose disclosures state a generative or agentic class from all others, including those with an unstated class. The estimand is the average difference in predicted probability between categories, computed by setting every application to each category in turn, with delta method intervals from standard errors clustered by organization. The false discovery rate is controlled with the Benjamini–Hochberg procedure across the nine comparisons of Section 3.1 and, separately, across the twenty contrasts of Section 3.6 and across the ten tests of Section 3.8; q-values accompany the unadjusted p-values, and a difference is called supported only if its q-value is below 0.05. Bonferroni-adjusted values are in S2. The four explanations of Section 1.4 are compared on disjoint groups of applications with Fisher’s exact tests of three outcomes (a performance figure, a reference value or control group, oversight or testing): reported use against all other stages, claims made by the institution against claims made only by suppliers or third parties among applications outside filings, and stated internal work against none. A linear probability model regresses whether a record states a numerical figure on a filing indicator, with organization fixed effects and errors clustered by organization, and compares channels within organizations. The share of variation in performance reporting that lies among organizations is the one-way intraclass correlation. Logistic models that add the stage and internal work indicators to the covariates of Section 3.6 test whether the associations persist after adjustment. The analyses describe associations in the retrieved disclosures, not causal effects.
3. Results
3.1. What Is Disclosed
The 194 applications come from 34 of the 37 organizations. Customer service is the most frequent function (49 applications), followed by customer insight and sales (27), fraud and financial crime (20) and software engineering (18); by functional group, 46 concern credit, fraud, risk or security, 76 customer service or insight and 72 other functions. Employees are named as users of 84 (43%) applications. The central gap concerns the evidence attached to an application. A performance figure is stated for 55 of 194 applications, a reference value or control group for 8 and a safeguard for 20; neither internal work nor a provider is named for 109 (Table 3; Figure 1). The model class is stated for 100 applications, 70 of them generative or agentic.
Table 3.
Disclosure content by functional group and type of institution (% of applications).
Figure 1.
Share of applications whose disclosures state each element, by type of institution. Markers are application-level shares in the retrieved corpus; provider and control mentions do not establish dependence or effectiveness. Only the stating of model class differs among institution types at q < 0.05 (Table 3); the other differences are exploratory.
The retrieved material is recent. Of 335 records with a publication date, including dates flagged as uncertain, 263 (79%) were published in 2025 or 2026 and 28 before 2023. These are publication dates in this corpus, not dates of adoption, and search engines may favor recent material. The disclosures describe 136 applications as in use, 27 as available, 18 as planned, 9 as pilots and 4 as announced.
3.2. Where Disclosure Appears
Most application-level statements appear outside SEC filings. Of the 223 documents, 24 are SEC filings, 18 investor communications, 55 press releases or newsroom items, 46 corporate web content, 79 third-party accounts and 1 public comment letter (Table 4). Only 24 of the 194 applications (12%) appear in any SEC filing, and 138 (71%) appear only in press releases, company web content or third-party accounts. The large national banks place 3 of their 64 applications in a filing, against 14 of 81 for regional banks and 7 of 49 for digital lenders.
Table 4.
Disclosure channels: documents, records with a figure and applications.
Filings are a mandatory channel, but no rule examined makes their AI content mandatory (Section 4.3). Table 5 separates the applications by filing presence and by the origin of the claim. Its evidence rows pool every linked record of an application, whatever its channel, and describe the cohort, not what a filing states. The 24 applications in a filing report a performance figure in 7 (29%), a reference value or control group in 1 and oversight or testing in 1. Outside filings, the 150 applications with at least 1 claim made by the organization itself account for 7 of the 8 reference values or control groups and 19 of the 20 safeguards; the 20 applications known only from supplier or third-party claims report a performance figure in 6 (30%) and no reference value, oversight or testing.
Table 5.
Evidence pooled across linked records, by filing presence and origin of the claim, applications.
Evidence stated in the filing itself is narrower. A filing record states a numerical figure for 7 of the 24 applications in a filing; 2 of the 9 filing cohort applications with a numerical figure in any linked record state it only outside a filing. The one filing cohort application with a control group, Affirm’s, states it in a trade press interview, not in the filing.
At record level, a figure appears in 7 of 46 (15%) filing records, 25 of 75 (33%) press release records and 35 of 135 (26%) third-party records, so filing records do not state figures more often than other records. Of the 8 applications with a reference value or control group, 1 is also described in a filing; of the 20 with a safeguard, 1 is. A separate census of the most recent Form 10-K of each organization, using a full-text search of EDGAR, found that 36 of 37 mention AI. In the parts read (Item 1, part of Item 1A and Item 1C), 7 filers name at least 1 specific AI application (19 in all), and 1, Upstart’s, reports a performance figure against a stated comparison. The census read most filings only in part, so these application counts are minimums (S2).
3.3. Evaluation
Table 6 orders the applications by the comparison information their disclosures report. Of the 194 applications, 81 come with a figure, and for 26 of these, the figure reports only adoption or volume. Of the 55 applications reporting performance, 36 state a change without the value it was measured against, 11 state a level with no reference, and 8 give a reference value or a control group. Five applications report a performance figure with a denominator, a period and a comparator, and costs are stated for one application. In the credit, fraud, risk and security group, performance figures are reported for 16 of 46 applications (35%), against 39 (26%) of the 148 in the other groups (p = 0.27, q = 0.27, application-level Fisher test), and 2 of the 46 report a reference value or control group.
Table 6.
Comparison information reported, applications by type of institution.
3.4. Safeguards
Human oversight is stated for 8 applications and testing or monitoring for 14; 20 state at least 1. In the credit, fraud, risk and security group, 9 of 46 applications state a safeguard, against 11 (7%) of the others (p = 0.03, q = 0.052 across the 2 Fisher tests, which do not allow for dependence within organizations); the difference does not meet the q < 0.05 criterion. The clustered regression, which compares the first group with other functions, estimates +13 points (95% CI −3 to +29).
Of the 89 applications whose output goes to a customer or applicant, or to staff as input to a decision about customers, 4 state human oversight and 8 state testing. Oversight is stated for 0 of the 45 applications whose output reaches the customer or applicant directly and for 4 of the 44 whose output goes to staff; testing is stated for 5 and 3 (S2). The recipient is coded independently of oversight (Section 2.4). A count of zero means that no statement was found; it does not show that no review took place. Of the 37 customer service and insight applications whose output goes to the customer, 4 describe any testing.
Of the 18 credit and underwriting applications, 3 mention human oversight and 3 mention testing. A bounded check of every page linked to these 18 applications found 1 statement of fairness testing, in Upstart’s 10-K and for its models in general; for 14 applications all linked pages were read in full without such a statement, and for 3 a filing was read only in part (S2). An example of a statement coded as testing is JPMorgan Chase’s description of a framework that identifies, tests and mitigates hallucinations, topic drift and prompt injection for each use case [62]. The corpus also contains 29 organizational governance records from 20 organizations, describing policies, committees or principles, while 12 of the 34 organizations with an application state oversight or testing for at least 1 tool. The two counts capture different kinds of reporting; an organizational policy cannot be assigned to an application without an explicit link.
3.5. Sourcing and Dependency
Neither internal work nor an external provider is stated for 109 (56%) applications; internal work alone is reported for 36, a provider alone for 36 and both for 13. A named supplier is often only 1 layer: of the 49 applications with a provider, 25 name only an application vendor and leave the model or cloud service unstated. Across all records, Microsoft is named by 8 organizations, Amazon Web Services by 7, Anthropic, OpenAI and Google by 5 each and IBM by 3. Ally describes a platform built by its in-house technology team and powered by Microsoft Azure OpenAI Service [63], an account that names both internal work and an external dependency.
3.6. Differences by Institution
The largest descriptive contrasts concern provider naming and performance reporting. Regional banks name an external provider for 32 of 81 applications (40%), against 14% for large national banks and 16% for digital lenders (p = 0.03, q = 0.09). Counting only records produced by the organizations themselves gives 21, 7 and 5 applications, respectively. Digital lenders report a performance figure for 23 of 49 applications (47%), against 20% for regional and 25% for large banks (p = 0.04, q = 0.09), and describe testing for 9 of 49 (18%), against 2% and 5% (p = 0.03, q = 0.09). The model class is stated for 36%, 59% and 67% of applications (p = 0.003, q = 0.03). Of the nine comparisons, only the stating of model class remains below q = 0.05; the other contrasts are hypotheses for a larger sample. Large national banks report 8.0 applications per organization with at least 1 application, against 4.3 for regional banks, and a reference value or control group for 1 of 64 applications; the types do not differ clearly on human oversight (p = 0.95), internal work (p = 0.36) or reference values (p = 0.44).
After adjustment for functional group and the generative AI indicator (Table 7), digital lender disclosures report a performance figure +29 points (95% CI +6 to +51) more often than regional bank disclosures (p = 0.01, q = 0.11), a difference that does not meet the q < 0.05 criterion; the large bank difference is +7 points (95% CI −8 to +22), and the digital lender safeguard contrast is +15 points (95% CI −4 to +34). Across the twenty contrasts of Table 7, only the user group contrast for the credit, fraud, risk and security group has a q-value below 0.05 (marked † in Table 7). Applications whose disclosures state a generative or agentic class more often state a sourcing element, by +15 points (95% CI +1 to +29) (p = 0.04, q = 0.17).
Table 7.
Differences in the probability that a disclosure states each element (percentage points; 95% confidence interval).
3.7. Robustness
Restricted to the 136 applications described as in use, a performance figure is stated for 50 (37%), a reference value or control group for 6 (4%), oversight or testing for 15 (11%), and neither internal work nor a provider is named for 73 (54%), against 28%, 4%, 10% and 56% for all applications. Performance figures are more frequent among applications in use; reference values, controls and safeguards remain equally sparse. Adding the 27 applications described as available gives 33%, 4%, 10% and 54%, and 18 of the 163 appear in an SEC filing. The digital lender lead in performance figures persists (21 of 37 against 29 of 99 for the two bank strata combined; Table S2.34).
The main descriptive directions also remain under five restrictions: applications with at least one record with a confirmed publication date; excluding organizations affected by the record cap; applications whose records all come from the organization; excluding partly supported records; and applications reconfirmed in the second check. Across these, digital lenders report performance figures for 43–51% of applications against 21–23% for the two bank strata combined, and the safeguard share in the credit, fraud, risk and security group stays at 16–24% against 7–8%. Omitting one digital lender at a time, the raw digital lender lead in performance figures ranges from 20 to 37 points and the adjusted contrast from 22 to 38.
The 31 applications described as planned, announced or in a pilot rarely state evidence (1 states a performance figure); their status is the one in the retrieved statement and does not establish non-use.
Weighting the 34 organizations with an application equally raises the share with a reference value or control group to 10%, because 2 of the 8 organizations reporting one have a single application. Two runs of the same protocol for 8 organizations retrieved 54 and 38 documents, with 21 in common; the results describe one bounded search.
3.8. Four Explanations Compared
The comparisons in this section are exploratory and secondary to the descriptive results of Section 3.1, Section 3.2, Section 3.3, Section 3.4 and Section 3.5. Table 8 compares the explanations of Section 1.4 on disjoint groups. The stage, origin and sourcing rows use the performance figure; the channel row compares records and uses a numerical figure of any kind, activity or performance (Table 8 note). A difference that is not statistically significant is reported as not detected; it does not show that the groups are equal, and several groups are small. Applications in reported use state a performance figure more often than the other applications (37% against 9%; q < 0.001), but not a reference value or control group (4% against 3%) or oversight or testing (11% against 9%). Deployment stage is therefore associated with how often a figure is stated, but not with whether a comparison or a safeguard is stated.
Table 8.
Explanations of the gap between visibility and evidence compared on disjoint groups (share of applications in the first/second group; Fisher’s exact test).
Among applications outside filings, no difference was detected in the stating of a performance figure between claims made by the institution and claims made only by suppliers or third parties (28% against 30%; 20 applications in the second group). Oversight or testing appears in 19 of 150 applications with an institutional claim and in none of the 20 with a supplier or third-party claim only, a difference that does not meet the q < 0.05 criterion (q = 0.28). Applications that state internal work carry a performance figure more often than those that do not (49% against 21%; q = 0.002); the contrasts for a reference value or control group (q = 0.70) and for oversight or testing (18% against 8%; q = 0.18) do not meet the criterion.
In a logistic model that adds both indicators to the covariates of Table 7, reported use is associated with a performance figure by +31 points (95% confidence interval +17 to +46) and stated internal work by +22 points. Applications with a performance figure have more linked records on average (1.4) than those without (1.1), and an application that states internal work may simply be described at greater length; with the number of linked records held constant, the internal work estimate is +14 points (+2 to +26), and the stage estimate is unchanged (S2, Table S2.45).
Within organizations, no difference was detected between filing records and the organization’s other records in the stating of a numerical figure of any kind: 7 of 46 (15%) filing records against 81 of 327 (25%) other records, a difference of −16 points with organization fixed effects (95% confidence interval −37 to +5; q = 0.28). Among the five applications with both a filing record and another record, a figure appears in both for two, only outside the filing for two, only in the filing for zero and in neither for one. The intraclass correlation of the performance figure is 0.15, so most of its variation lies among the applications of one organization.
4. Discussion
4.1. Principal Findings
The disclosures make applications visible more often than the evidence needed to judge them. Eight of 194 applications report a reference value or control group, 1 reports costs and 20 mention oversight or testing. For most applications, an outsider can identify a tool or workflow but cannot reconstruct how its reported benefit was evaluated. The pattern holds for the 136 applications described as in use: performance figures are more frequent (37%), but reference values or control groups (4%) and oversight or testing (11%) remain rare. An absence of public evidence does not establish that the institution has not evaluated or controlled it, and the findings and proposals below are stated about what outsiders can observe. The statements also sit mostly outside the documents that securities law requires: 138 applications appear only in press releases, company web content or third-party accounts, and filing records are not detectably more likely than other records to state a figure: a figure appears in 15% of filing records, 33% of press release records and 26% of third-party records (Table 4). The channel prediction of Section 1.3 is therefore not supported, although no rule examined prescribes the AI content of a filing (Section 4.3).
In the exploratory comparisons of Section 3.8, two of the four explanations are associated with the evidence attached to an application. Applications in use state performance figures more often, but not reference values, controls or safeguards, so the inclusion of announced and planned applications does not account for the absence of comparison. Applications that state internal work also state performance figures more often, as absorptive capacity would predict, although the association weakens when the number of linked records is held constant. Claim origin and, within organizations, channel show no detectable difference. This is not evidence that the groups are equal: the origin comparison has 20 applications in 1 group and the matched channel comparison 5 applications, so moderate differences cannot be excluded.
Most contrasts between institution types do not meet the q < 0.05 criterion: only the stating of model class does (q = 0.03). The magnitudes of the other contrasts remain descriptive and uncertain. Before correction, digital lenders report performance figures and testing more often, a pattern consistent with the emphasis on measurable lending outcomes in fintech research [26,27] (q = 0.09 and 0.09). Regional banks name providers more often, including in their own records (q = 0.09); this would make vendor relationships more visible, consistent with the importance of core providers in research into smaller banks [53,54], but does not measure dependence. Large national banks disclose more applications per organization and mostly through press releases, with a large bank difference in performance reporting of +7 points (95% CI −8 to +22) relative to regional banks and a comparator for 1 of 64 applications. The breadth of activity they disclose is greater; an advantage in evaluation evidence is not established.
4.2. Comparison with Prior Research
The study shifts attention from AI developers to the institutions deploying their systems. Research into foundation model transparency asks what developers disclose about their models and downstream effects [47]; here the unit is an application described by a bank or lender, with its claimed result, comparison, controls and suppliers. This adds a deployer-level view to documentation such as model cards and internal audits [48,50], which cannot by themselves tell a reader whether a particular banking workflow delivers a reported benefit. Filing text measures such as agentic AI references and controls density by firm-year [46] locate AI language in a firm’s filings; the application-level comparison of evaluation, safeguards, sourcing and channel reported here measures a different unit. Counts of AI terms in bank annual reports have been related to financial performance [41,42]; studies of Form 10-K filings describe the frequency and risk types of AI disclosure [43] and the governance and accountability framing of AI passages [44]; and Odinet examines credit underwriting risk through securities filings [45]. The present study complements these approaches by linking records from several channels to distinguishable applications and coding, for each application, the reported comparison, safeguards, sourcing and channel. Its contribution is this application-level measurement and crosswalk; it does not claim that earlier disclosure research is limited to counting terms. The comparisons of Section 3.8 are secondary to this measurement and do not identify the causes of differences in disclosure.
Selective disclosure offers possible explanations. Managers may announce an application while withholding its evaluation, costs or supplier terms [32,33], and publicity favors good news [36]. The same pattern could also arise when an institution has little evaluation evidence to publish; the data do not distinguish these explanations. The comparisons of Section 3.8 narrow them without separating them. Withholding under liability or scrutiny would leave more evidence in filings and in institutional claims, and the data show no detectable filing advantage or origin advantage in performance figures, in comparisons too small to exclude moderate differences. A lag in evaluation would leave more evidence once applications are in use, and the data show this for performance figures only. Telling withholding from absence would require the institutions’ internal evaluation records or a change in disclosure rules, which this design does not have. Actionable AI narratives in annual reports are associated with subsequent valuation changes [40], but that study does not establish whether investors value the comparison, cost or safeguard information examined here.
Evaluation in the deployment setting matters because task performance may differ once a tool is used within a workflow. In one hospital, tools with high accuracy against expert labels failed to meet expectations in practice [64]; engineers at Google describe continuing maintenance costs of machine learning systems [65]; and in a field experiment with 758 knowledge workers, GPT-4 users were less likely to reach a correct answer on a task outside the model’s capability [66]. These findings do not establish failure in the applications studied here. They explain why a claim about a model or task should be accompanied by evidence about the workflow, including exceptions, review and operating costs.
Credit applications also require evaluation of outcomes across borrower groups. Machine learning credit models can widen rate differences between groups [28], and evidence on fintech mortgage disparities differs between GSE-securitized and FHA loans [29]. In the pages linked to the credit applications retrieved here, only one fairness testing statement appeared, and a filing was read only in part for some of these applications.
4.3. Disclosure, Publicity and Regulation
None of the statements studied here is required by any AI-specific disclosure rule identified in the search documented in S2. Regulation S-K requires public companies to describe their business and material risk factors and, since 2023, their processes for managing material cybersecurity risks, without referring to AI; inclusion turns on materiality [67]. The Securities and Exchange Commission withdrew in June 2025 its 2023 proposal on conflicts of interest from predictive data analytics, the one pending rule addressed to AI-driven tools [68]. Regulation B requires an explanation to the individual applicant, not to the public [3].
Abroad, in other sectors and in state law, mandatory AI transparency exists in narrower forms: the EU AI Act requires providers of high-risk systems, including credit scoring, to register them in a public database and deployers to inform affected persons, with high-risk obligations now applying from December 2027 [61,69]; New York City requires employers using automated hiring tools to publish bias-audit summaries [70]; and Colorado, which enacted in 2024 a requirement for deployers of high-risk systems to publish a statement of the systems they use, repealed and re-enacted its act in May 2026 as SB26-189, which requires deployers to give consumers notice before using automated decision-making technology in consequential decisions, including lending [71]. The disclosure studied here is therefore of two kinds. The 46 records in SEC filings are disclosure in the regulatory sense, made in documents a rule requires and subject to liability for misstatement, although no rule examined prescribes their AI content. The remaining records come from investor communications, press releases, corporate web content and third-party accounts; they are called publicity here as an operational category, not a legal classification, and whether other obligations apply to a particular statement was not coded. Existing materiality requirements may nevertheless call for AI-related information in particular circumstances. The analysis distinguishes filing presence, channel and claim origin; it does not classify the obligation to disclose each statement.
Whether mandated disclosure improves outcomes is contested. Investors valued the 1964 extension of disclosure mandates to over-the-counter firms [72], and European transparency directives raised liquidity mainly where enforcement was strict [73], while reviews find causal evidence on net benefits scarce [74] and consumer-facing mandates often fail to inform [75]. Risk factor sections carry information that markets price [76], but 10-K text has grown longer and more boilerplate [77]. Some of the largest banks also address a research and recruiting audience through AI groups. Capital One describes multi-year partnerships with universities that fund PhD fellowships and faculty research [78], and reported three papers in the main track of NeurIPS 2024 [79]. JPMorgan Chase funds AI research awards for university faculty, among them an annual award for junior faculty at MIT CSAIL [80]. The Evident AI Index scores banks on talent, innovation, leadership and transparency from public information, counts research and patents in its innovation pillar, and in its edition of October 2026 ranked JPMorganChase first and Capital One second among the banks it covers [81]. These sources were not coded as records in S1.
Where an index scores publicly visible research output, a bank’s AI group has an audience that includes candidates, universities and rating bodies as well as its own risk functions. The sources cited do not state the purposes of these groups or separate assurance from reputation, and a statement from an AI research group describes research activity, not the performance of a deployed system. Public statements about such groups are therefore weaker evidence of evaluation and safeguards than the application-level records proposed below. Evidence on the same activity at regional banks was not collected.
The position taken here follows from that evidence and from the findings.
A general requirement to disclose AI use might be met with boilerplate without improving application-level information. A narrow requirement could address what generic disclosure does not: for applications that decide or inform credit, account and fraud actions, or that deliver their output directly to customers, an institution should publish a short application-level record stating the purpose and the recipient of the output, the model class and principal supplier, one performance measure with its baseline, denominator and period, whether a person reviews the output, the testing in place, including distributional testing for credit, and the accountable function. Supervisors should obtain the full dependency map through confidential reporting, where commercial terms and security details can be protected. Voluntary practice may not supply this record: the evaluation and supplier details may be costly or commercially sensitive to publish, and in the retrieved statements they are omitted even by institutions that publicize their tools widely. The proposal is untested, and its costs and effects on readers should be measured before it is adopted.
4.4. A Public Record and an Internal Evidence File
A comparison changes what a reader can learn from a performance claim. Affirm reports a control group [2], and Capital One reports highly relevant search results rising from 84% to 93% against a legacy tool [82]. Valley’s claim of 65% fewer false positives does not state the system it is compared with, or the cases and period covered [83]. A statement that “AI is streamlining underwriting and credit review” identifies an activity but supplies no result (S1, record G3-41).
These proposals concern what institutions publish. The data do not measure adoption, evaluation or governance practices; applications were identified from public pages and classified with language model assistance, and the limits are stated in Section 4.6. The public record proposed in Section 4.3 answers four questions for an application that can materially affect customers, employees or the institution. What does it do, who uses it and whose outcomes can it change? What result is claimed, against which baseline, for which population and period? What testing and human review are reported, and which function is accountable? Which suppliers and model classes are involved? A record should allow “not evaluated” or “not disclosed” where information is unavailable, so that a reporting requirement does not encourage weak figures. The corresponding internal file would retain evaluation protocols and results, subgroup and exception analysis, operating costs, contractual access rights, the vendor, model and cloud dependency map and a fallback plan. The public record adapts model card documentation to the deployer [48], draws on due diligence guidance that asks enterprises to communicate how they address AI impacts [84], and is consistent with the documentation and exit planning duties identified in a comparative analysis of five sandbox regimes [85]. Table 9 assigns the requests to the actors who can supply or obtain the information; each action is an untested proposal.
Table 9.
Proposed changes by actor.
Further studies could test whether the same separation between announcing an application and reporting its evaluation appears in insurance, payments, health care or public administration. The record-to-application design and core fields could be adapted to those settings; function categories, affected parties and the regulatory context would need revision.
4.5. The Ownership Test
The Ownership Test proposes an application-level sequence for assembling and judging internal evidence (Table 10). Ownership means the retained capacity and authority to evaluate the application and to change or end its operating arrangement. A reported benefit is insufficient if the institution cannot assess the evidence behind it or act when the workflow changes. The test is a synthesis of existing practices, not a validated instrument. It is proposed for employees and leaders at several levels of a bank who are responsible for AI, and its steps could also structure industry-wide reviews of best practice. Neither use has been tested.
Table 10.
The Ownership Test: empirical motivation and sources for each proposed step.
First, define the problem, its current baseline and the outcome that would justify a change. Second, assign evaluators with enough time and access to interpret the evidence, test exceptions and identify limitations. Third, assess the complete workflow against acceptance rules written before the pilot: minimum standards for errors and affected outcomes that savings cannot offset, followed by costs including review, exceptions and monitoring. Fourth, establish the rights and practical capacity to inspect, suspend, export and replace the application, and rehearse its fallback. The first three steps decide whether deployment is justified; the fourth begins during procurement and continues through use, and material changes to the model, workflow or supplier should trigger reassessment.
Review intensity should follow the consequences and recoverability of an error. An application that affects credit, employment, fraud investigations or compliance may require independent validation and a defined review of adverse outcomes, whether it faces customers or is used internally. A customer service application requires tests of wrong answers, missed complaints and escalation. A bounded drafting task may justify a simpler review if errors can be detected and corrected before they affect others.
A constructed example shows why the third step needs costs. A team prepares 1000 renewal packs a month at 30 min each. An assistant cuts preparation to 12 min plus 10 min of review, but 20% of packs are exceptions that add 25 min, so an exception pack takes 47 min. Average time per pack falls from 30 to 27 min, and the released 50 h, valued at USD 60 an hour, are worth USD 3000 a month if they are redeployed or replace other spending. Platform, integration and monitoring cost USD 3700, so the workflow loses USD 700 a month; at a 10% exception rate it gains USD 1800, and the break-even rate is 17.2%. The calculation assumes fixed volume and equal output quality.
The test draws on third-party guidance, the NIST framework and model risk practices where applicable; it does not demonstrate compliance or replace supervisory requirements, and the 2026 model risk guidance excludes generative and agentic AI from its scope. It has not been used in an organization. A first evaluation could give matched application dossiers to review teams using the test and to teams using an existing procedure, with an independent assessment of unsupported claims made beforehand, and compare detection, mistaken rejection, agreement and review time. Supplementary Material S2 gives the checklist and work sample.
4.6. Limitations
The counts describe disclosures retrieved from a purposive frame, not the prevalence of AI use or the quality of governance. Search results change, the 15-record cap limits coverage, and institutions differ in business models and communication practices, so more disclosed applications may reflect search exposure or promotion rather than more deployment. Missing or uncertain dates affect 49 records, pages read after the cutoff may have changed, and publication dates do not establish deployment dates. The 10-K census read most filings only in part.
Applications enter the sample only when a description names a distinguishable tool or workflow. Of the 376 admitted records, 149 are not linked to an application; they state a figure in 6 cases, against 82 of 227 linked records, and none of the 37 programme records (platforms, portfolios and counts of use cases, from 21 organizations) states a figure. In this corpus, linked records more often contain a figure than unlinked records, which suggests an upward selection in the numerical evidence attached to the retained applications. The observed gap between visibility and evidence is therefore potentially understated; the comparison does not establish the direction of bias for every field or for all applications an institution operates. Institutions that describe their AI use only at programme level are absent from the application counts by construction. Every performance result remains a source’s claim, and an omitted baseline, safeguard or supplier need not be absent internally or from other sources. Coding used language models and model-processed page text without a human coder; the safeguard coders shared a model family and read selected case material; the additional checks with GPT-6.1 Sol Medium and Claude Sonnet 5.5 were model reviews and not human verification; the channel coders read only titles and addresses; and revised codes have not undergone a further reliability test. The functional groups are not measured risk levels.
The comparisons are exploratory. Organization-level permutations and clustered errors address some within-organization dependence, but not selection. The seven digital lenders provide a small base for comparison. Counts of oversight and testing by output recipient are also small, and a zero means only that no statement was found. Nine comparisons among institution types are tested, and one remains after false discovery rate correction, so the contrasts do not establish an institutional typology. The comparisons of Section 3.8 were formalized after coding, use groups of unequal size, and cannot show that stage or sourcing changes what an institution reports. The regulatory position in Section 4.3 is an argument from the evidence and the regulatory record, and the proposed record and Ownership Test have not been shown to improve decisions, reader understanding or outcomes.
5. Conclusions
The retrieved statements of 37 US banks and fintech lenders make 194 AI applications visible but usually provide little information with which to interpret their reported benefits, controls and sourcing: 8 report a baseline or control, and 20 mention oversight or testing. Most of these statements appear outside SEC filings; 24 applications appear in one. Differences among institution types are exploratory; after correction for multiple testing, only the stating of model class differs. In exploratory comparisons, applications in use and applications that state internal work more often report a performance figure; neither is associated with more baselines or controls, and no difference was detected by claim origin or, within organizations, by channel. No rule examined requires the application-level evidence that would let an outsider judge these claims. The study argues for a narrow public record for consequential applications, backed by confidential supervisory reporting of dependencies, and proposes an internal evidence check. Both proposals require testing; the present evidence establishes what retrieval of public statements from a purposive frame, coded with language models, makes available to outsiders, not what institutions adopt, evaluate, know or do internally.
Supplementary Materials
The following supporting information can be downloaded at: https://www.mdpi.com/article/10.3390/fintech5040110/s1: Supplementary Material S1: RBANK_S1_EvidenceDataset_v7_2.xlsx, the frame, search log, disclosure records with verification results and channel codes, applications with all codes, record-to-application crosswalk, blind-coding records, codebook and editable pilot model; Supplementary Material S2: RBANK_S2_Supplement_v7_2.docx, protocol, verification, coding reliability, channel coding, the 10-K census, the fairness check, supplementary tables and framework materials.
Funding
This research received no external funding.
Institutional Review Board Statement
Not applicable.
Informed Consent Statement
Not applicable.
Data Availability Statement
Every admitted disclosure record, with its source address, excerpt, locator, verification result and codes, is included in the Supplementary Materials. The search logs, verification returns, coding prompts and returns, adjudication rules and the scripts that rebuild every table and figure are in the reproduction archive, which will be deposited in a public repository before publication. The FDIC institution and location data are public-domain data from the BankFind Suite API.
Acknowledgments
Frontier models (Anthropic Claude and OpenAI ChatGPT, GPT-6 Astra) were used for search, verification, coding, construction of the evidence workbook and figure code, review, and drafting and editing prose, as described in Section 2.4 and Supplementary Material S2. OpenAI GPT-6.1 Sol Medium and Anthropic Claude Sonnet 5.5 were used for additional checks of the analyses, text and references. The author read and revised all text and remains responsible for the content of this publication. Part of this paper was written at Stanford University.
Conflicts of Interest
The author declares no conflicts of interest.
References
- JPMorgan Chase & Co. LLM Suite Named 2025 “Innovation of the Year” by American Banker. 3 June 2025. Available online: https://www.jpmorganchase.com/about/technology/blog/llmsuite-ab-award (accessed on 28 September 2026).
- PYMNTS. EXCLUSIVE: Affirm Rebuilds Underwriting to Approve Borrowers a Credit Score Can’t See. 17 September 2026. Available online: https://www.pymnts.com/bnpl/2026/exclusive-affirm-rebuilds-underwriting-to-approve-borrowers-a-credit-score-cant-see/ (accessed on 28 September 2026).
- Regulation B (Equal Credit Opportunity), 12 C.F.R. § 1002.9, Notifications. 2026. Available online: https://www.ecfr.gov/current/title-12/chapter-X/part-1002/subpart-A/section-1002.9 (accessed on 23 September 2026).
- Consumer Financial Protection Bureau. Consumer Financial Protection Circular 2022-03: Adverse Action Notification Requirements in Connection with Credit Decisions Based on Complex Algorithms; 26 May 2022; 87 FR 35864. Withdrawn 12 May 2025 (90 FR 20084). Available online: https://www.consumerfinance.gov/compliance/circulars/circular-2022-03-adverse-action-notification-requirements-in-connection-with-credit-decisions-based-on-complex-algorithms/ (accessed on 7 October 2026).
- Consumer Financial Protection Bureau. Interpretive Rules, Policy Statements, and Advisory Opinions; Withdrawal. Fed. Regist. 2025, 90, 20084. Available online: https://www.federalregister.gov/documents/2025/05/12/2025-08286/interpretive-rules-policy-statements-and-advisory-opinions-withdrawal (accessed on 7 October 2026).
- Consumer Financial Protection Bureau. Chatbots in Consumer Finance; Issue Spotlight; Consumer Financial Protection Bureau: Washington, DC, USA, 2023. Available online: https://files.consumerfinance.gov/f/documents/cfpb_chatbot-issue-spotlight_2023-06.pdf (accessed on 7 October 2026).
- Balaskas, S.; Koutroumani, M.; Komis, K.; Rigou, M. FinTech services adoption in Greece: The roles of trust, government support, and technology acceptance factors. FinTech 2024, 3, 83–101. [Google Scholar] [CrossRef] [Scilit]
- Bhuiyan, I.; Ahmed, H.; Hoque, A.; Bhuiyan, T. Trust, Security, and Nonlinear Retention Dynamics in FinTech Neobanking: An Explainable Machine Learning (XAI) Approach. FinTech 2026, 5, 53. [Google Scholar] [CrossRef] [Scilit]
- Balaskas, S. Transparency by design: A narrative synthesis of AI disclosure, explainability, and trust in consumer-facing FinTech. FinTech 2026, 5, 41. [Google Scholar] [CrossRef] [Scilit]
- Schilke, O.; Reimann, M. The transparency dilemma: How AI disclosure erodes trust. Organ. Behav. Hum. Decis. Process. 2025, 188, 104405. [Google Scholar] [CrossRef] [Scilit]
- Durongkadej, I.; Hu, W.; Wang, H.E. How artificial intelligence incidents affect banks and financial services firms? A study of five firms. Finance Res. Lett. 2024, 70, 106279. [Google Scholar] [CrossRef] [Scilit]
- Daníelsson, J.; Macrae, R.; Uthemann, A. Artificial intelligence and systemic risk. J. Bank. Finance 2022, 140, 106290. [Google Scholar] [CrossRef] [Scilit]
- U.S. Securities and Exchange Commission. SEC Charges Two Investment Advisers with Making False and Misleading Statements About Their Use of Artificial Intelligence; Press Release 2024-36. 18 March 2024. Available online: https://www.sec.gov/newsroom/press-releases/2024-36 (accessed on 7 October 2026).
- U.S. Securities and Exchange Commission. In the Matter of Presto Automation Inc.; Securities Act Release No. 33-11352; Administrative Proceeding File No. 3-22413. 14 January 2025. Available online: https://www.sec.gov/enforcement-litigation/administrative-proceedings/33-11352-s (accessed on 7 October 2026).
- Board of Governors of the Federal Reserve System; Federal Deposit Insurance Corporation; Office of the Comptroller of the Currency. Interagency Guidance on Third-Party Relationships: Risk Management. Fed. Regist. 2023, 88, 37920–37937. Available online: https://www.federalregister.gov/documents/2023/06/09/2023-12340/interagency-guidance-on-third-party-relationships-risk-management (accessed on 28 September 2026).
- Frimpong, V. Model Monoculture Risk: Systemic AI Convergence in Banking and Financial Markets. FinTech 2026, 5, 78. [Google Scholar] [CrossRef] [Scilit]
- Board of Governors of the Federal Reserve System. Revised Guidance on Model Risk Management (SR 26-2, with Attachment); Board of Governors of the Federal Reserve System: Washington, DC, USA, 2026. Available online: https://www.federalreserve.gov/supervisionreg/srletters/SR2602.htm (accessed on 23 September 2026).
- Brynjolfsson, E.; Li, D.; Raymond, L. Generative AI at work. Q. J. Econ. 2025, 140, 889–942. [Google Scholar] [CrossRef] [Scilit]
- Humlum, A.; Vestergaard, E. Still Waters, Rapid Currents: Early Labor Market Transformation Under Generative AI; NBER Working Paper 33777; National Bureau of Economic Research: Cambridge, MA, USA, 2025. [Google Scholar] [CrossRef] [Scilit]
- Kellogg, K.C.; Valentine, M.A.; Christin, A. Algorithms at work: The new contested terrain of control. Acad. Manag. Ann. 2020, 14, 366–410. [Google Scholar] [CrossRef] [Scilit]
- Bonney, K.; Breaux, C.; Buffington, C.; Dinlersoz, E.; Foster, L.S.; Goldschlag, N.; Haltiwanger, J.C.; Kroff, Z.; Savage, K. Tracking Firm Use of AI in Real Time: A Snapshot from the Business Trends and Outlook Survey; NBER Working Paper 32319; National Bureau of Economic Research: Cambridge, MA, USA, 2024. [Google Scholar] [CrossRef] [Scilit]
- McElheran, K.; Li, J.F.; Brynjolfsson, E.; Kroff, Z.; Dinlersoz, E.; Foster, L.; Zolas, N. AI adoption in America: Who, what, and where. J. Econ. Manag. Strategy 2024, 33, 375–415. [Google Scholar] [CrossRef] [Scilit]
- Brynjolfsson, E.; Rock, D.; Syverson, C. The productivity J-curve: How intangibles complement general purpose technologies. Am. Econ. J. Macroecon. 2021, 13, 333–372. [Google Scholar] [CrossRef] [Scilit]
- Thakor, A.V. Fintech and banking: What do we know? J. Finance Intermediation 2020, 41, 100833. [Google Scholar] [CrossRef] [Scilit]
- Goldstein, I.; Jiang, W.; Karolyi, G.A. To FinTech and beyond. Rev. Finance Stud. 2019, 32, 1647–1661. [Google Scholar] [CrossRef] [Scilit]
- Berg, T.; Burg, V.; Gombović, A.; Puri, M. On the rise of FinTechs: Credit scoring using digital footprints. Rev. Finance Stud. 2020, 33, 2845–2897. [Google Scholar] [CrossRef] [Scilit]
- Fuster, A.; Plosser, M.; Schnabl, P.; Vickery, J. The role of technology in mortgage lending. Rev. Finance Stud. 2019, 32, 1854–1899. [Google Scholar] [CrossRef] [Scilit]
- Fuster, A.; Goldsmith-Pinkham, P.; Ramadorai, T.; Walther, A. Predictably unequal? The effects of machine learning on credit markets. J. Finance 2022, 77, 5–47. [Google Scholar] [CrossRef] [Scilit]
- Bartlett, R.; Morse, A.; Stanton, R.; Wallace, N. Consumer-lending discrimination in the FinTech era. J. Finance Econ. 2022, 143, 30–56. [Google Scholar] [CrossRef] [Scilit]
- Grossman, S.J. The informational role of warranties and private disclosure about product quality. J. Law Econ. 1981, 24, 461–483. [Google Scholar] [CrossRef] [Scilit]
- Milgrom, P.R. Good news and bad news: Representation theorems and applications. Bell J. Econ. 1981, 12, 380–391. [Google Scholar] [CrossRef] [Scilit]
- Dye, R.A. Disclosure of nonproprietary information. J. Account. Res. 1985, 23, 123–145. [Google Scholar] [CrossRef] [Scilit]
- Healy, P.M.; Palepu, K.G. Information asymmetry, corporate disclosure, and the capital markets: A review of the empirical disclosure literature. J. Account. Econ. 2001, 31, 405–440. [Google Scholar] [CrossRef] [Scilit]
- Beyer, A.; Cohen, D.A.; Lys, T.Z.; Walther, B.R. The financial reporting environment: Review of the recent literature. J. Account. Econ. 2010, 50, 296–343. [Google Scholar] [CrossRef] [Scilit]
- Graham, J.R.; Harvey, C.R.; Rajgopal, S. The economic implications of corporate financial reporting. J. Account. Econ. 2005, 40, 3–73. [Google Scholar] [CrossRef] [Scilit]
- Solomon, D.H. Selective publicity and stock prices. J. Finance 2012, 67, 599–638. [Google Scholar] [CrossRef] [Scilit]
- Ahern, K.R.; Sosyura, D. Who writes the news? Corporate press releases during merger negotiations. J. Finance 2014, 69, 241–291. [Google Scholar] [CrossRef] [Scilit]
- Cooper, M.J.; Dimitrov, O.; Rau, P.R. A rose.com by any other name. J. Finance 2001, 56, 2371–2388. [Google Scholar] [CrossRef] [Scilit]
- Cheng, S.F.; De Franco, G.; Jiang, H.; Lin, P. Riding the blockchain mania: Public firms’ speculative 8-K disclosures. Manag. Sci. 2019, 65, 5901–5913. [Google Scholar] [CrossRef] [Scilit]
- Basnet, A.; Elias, M.; Salganik-Shoshan, G.; Walker, T.; Zhao, Y. Analyzing the market’s reaction to AI narratives in corporate filings. Int. Rev. Finance Anal. 2025, 105, 104378. [Google Scholar] [CrossRef] [Scilit]
- Shiyyab, F.S.; Alzoubi, A.B.; Obidat, Q.M.; Alshurafat, H. The impact of artificial intelligence disclosure on financial performance. Int. J. Finance Stud. 2023, 11, 115. [Google Scholar] [CrossRef] [Scilit]
- Alzeghoul, A.; Alsharari, N.M. Impact of AI disclosure on the financial reporting and performance as evidence from US banks. J. Risk Finance Manag. 2025, 18, 4. [Google Scholar] [CrossRef] [Scilit]
- Uberti-Bona Marin, L.G.; Rijsbosch, B.; Spanakis, G.; Kollnig, K. Are companies taking AI risks seriously? A systematic analysis of companies’ AI risk disclosures in SEC 10-K forms. In Machine Learning and Principles and Practice of Knowledge Discovery in Databases, ECML PKDD 2025; Communications in Computer and Information Science; Springer: Cham, Switzerland, 2026; Volume 2839, pp. 86–106. [Google Scholar] [CrossRef] [Scilit]
- Lioliou, E.; Seitanidi, M.M.; Stadtler, L. Governance under algorithmic opacity: How financial firms construct accountability and control around AI in risk disclosures. Inf. Syst. Front. 2026. Online First. [Google Scholar] [CrossRef] [Scilit]
- Odinet, C.K. Fintech Credit and the Financial Risk of AI. In Cambridge Handbook of Artificial Intelligence and Law; Johnson, K., Reyes, C., Eds.; forthcoming; U Iowa Legal Studies Research Paper No. 2021-39; Texas A&M University School of Law Legal Studies Research Paper No. 24-55; SSRN: Rochester, NY, USA, 2021; Available online: https://papers.ssrn.com/sol3/papers.cfm?abstract_id=3917638 (accessed on 12 November 2026).
- Mustafa, A.U.; Aysan, A.F. Measuring agentic AI adoption and control frameworks in finance. Mod. Finance 2026, 4, 81–94. [Google Scholar] [CrossRef] [Scilit]
- Bommasani, R.; Klyman, K.; Longpre, S.; Kapoor, S.; Maslej, N.; Xiong, B.; Zhang, D.; Liang, P. The 2023 Foundation Model Transparency Index. Trans. Mach. Learn. Res. 2025. Available online: https://openreview.net/forum?id=x6fXnsM9Ez (accessed on 7 October 2026).
- Mitchell, M.; Wu, S.; Zaldivar, A.; Barnes, P.; Vasserman, L.; Hutchinson, B.; Spitzer, E.; Raji, I.D.; Gebru, T. Model cards for model reporting. In Proceedings of the Conference on Fairness, Accountability, and Transparency (FAT* ‘19); ACM: New York, NY, USA, 2019; pp. 220–229. [Google Scholar] [CrossRef] [Scilit]
- Gebru, T.; Morgenstern, J.; Vecchione, B.; Vaughan, J.W.; Wallach, H.; Daumé, H., III; Crawford, K. Datasheets for datasets. Commun. ACM 2021, 64, 86–92. [Google Scholar] [CrossRef] [Scilit]
- Raji, I.D.; Smart, A.; White, R.N.; Mitchell, M.; Gebru, T.; Hutchinson, B.; Smith-Loud, J.; Theron, D.; Barnes, P. Closing the AI accountability gap: Defining an end-to-end framework for internal algorithmic auditing. In Proceedings of the 2020 Conference on Fairness, Accountability, and Transparency (FAT* ‘20); ACM: New York, NY, USA, 2020; pp. 33–44. [Google Scholar] [CrossRef] [Scilit]
- Modi, K.; Pierri, N.; Timmer, Y.; Martinez Peria, M.S. The Anatomy of Banks’ IT Investments: Drivers and Implications; IMF Working Paper WP/22/244; International Monetary Fund: Washington, DC, USA, 2022; Available online: https://www.imf.org/en/Publications/WP/Issues/2022/12/09/The-Anatomy-of-Banks-IT-Investments-Drivers-and-Implications-526821 (accessed on 7 October 2026).
- Fayad, N.M.; Awdeh, A.; Abou Mrad, J.; El Mokdad, G.; Nassar, M. The impact of technological development on the productivity of UK banks. FinTech 2025, 4, 45. [Google Scholar] [CrossRef] [Scilit]
- Alcazar, J.; Baird, S.; Cronenweth, E.; Hayashi, F.; Isaacson, K. Market Structure of Core Banking Services Providers; Payments System Research Briefing; Federal Reserve Bank of Kansas City: Kansas City, MO, USA, 2024; Available online: https://www.kansascityfed.org/research/payments-system-research-briefings/market-structure-of-core-banking-services-providers/ (accessed on 7 October 2026).
- Board of Governors of the Federal Reserve System. Community Bank Access to Innovation Through Partnerships; Board of Governors of the Federal Reserve System: Washington, DC, USA, 2021. Available online: https://www.federalreserve.gov/publications/community-bank-access-to-innovation-through-partnerships.htm (accessed on 7 October 2026).
- U.S. Department of the Treasury. Artificial Intelligence in Financial Services: Report on the Uses, Opportunities, and Risks of Artificial Intelligence in the Financial Services Sector; U.S. Department of the Treasury: Washington, DC, USA, 2024. Available online: https://home.treasury.gov/system/files/136/Artificial-Intelligence-in-Financial-Services.pdf (accessed on 23 September 2026).
- National Institute of Standards and Technology. Artificial Intelligence Risk Management Framework (AI RMF 1.0); NIST AI 100-1; National Institute of Standards and Technology: Gaithersburg, MD, USA, 2023. [Google Scholar] [CrossRef] [Scilit]
- Williamson, O.E. The Economic Institutions of Capitalism: Firms, Markets, Relational Contracting; Free Press: New York, NY, USA, 1985. [Google Scholar]
- Cohen, W.M.; Levinthal, D.A. Absorptive capacity: A new perspective on learning and innovation. Adm. Sci. Q. 1990, 35, 128–152. [Google Scholar] [CrossRef] [Scilit]
- Teece, D.J. Explicating dynamic capabilities: The nature and microfoundations of (sustainable) enterprise performance. Strateg. Manag. J. 2007, 28, 1319–1350. [Google Scholar] [CrossRef] [Scilit]
- Federal Deposit Insurance Corporation. BankFind Suite: Institutions and Locations. Data Set Retrieved Through the BankFind Suite API on 18 September 2026. Available online: https://api.fdic.gov/banks/docs (accessed on 18 September 2026).
- Regulation (EU) 2024/1689 of the European Parliament and of the Council of 13 June 2024 Laying Down Harmonised Rules on Artificial Intelligence (Artificial Intelligence Act). Off. J. Eur. Union 2024, L 2024/1689. Available online: https://eur-lex.europa.eu/eli/reg/2024/1689/oj/eng (accessed on 7 October 2026).
- Lakara, K.; Shi, R.; Silavong, F. Strengthening LLM Guardrails with Synthetic Data Generation. JPMorgan Chase & Co. Technology Blog. 2 April 2026. Available online: https://www.jpmorganchase.com/about/technology/blog/fence-framework (accessed on 28 September 2026).
- Ally Financial. Ally Launches Proprietary, Enterprise AI Platform. 19 September 2023. Available online: https://media.ally.com/2023-09-19-Ally-launches-proprietary,-enterprise-AI-platform (accessed on 28 September 2026).
- Lebovitz, S.; Levina, N.; Lifshitz-Assaf, H. Is AI ground truth really “true”? The dangers of training and evaluating AI tools based on experts’ know-what. MIS Q. 2021, 45, 1501–1526. [Google Scholar] [CrossRef] [Scilit]
- Sculley, D.; Holt, G.; Golovin, D.; Davydov, E.; Phillips, T.; Ebner, D.; Chaudhary, V.; Young, M.; Crespo, J.-F.; Dennison, D. Hidden technical debt in machine learning systems. In Advances in Neural Information Processing Systems 28 (NIPS 2015); Curran Associates: Red Hook, NY, USA, 2015; Available online: https://proceedings.neurips.cc/paper/2015/file/86df7dcfd896fcaf2674f757a2463eba-Paper.pdf (accessed on 7 October 2026).
- Dell’Acqua, F.; McFowland, E., III; Mollick, E.; Lifshitz, H.; Kellogg, K.C.; Rajendran, S.; Krayer, L.; Candelon, F.; Lakhani, K.R. Navigating the jagged technological frontier: Field experimental evidence of the effects of artificial intelligence on knowledge worker productivity and quality. Organ. Sci. 2026, 37, 403–423. [Google Scholar] [CrossRef] [Scilit]
- Regulation S-K, 17 C.F.R. §§ 229.101 (Description of Business), 229.105 (Risk Factors) and 229.106 (Cybersecurity). Available online: https://www.ecfr.gov/current/title-17/chapter-II/part-229/subpart-229.100 (accessed on 7 October 2026).
- U.S. Securities and Exchange Commission. Withdrawal of Proposed Regulatory Actions. Fed. Regist. 2025, 90, 25531. Available online: https://www.federalregister.gov/documents/2025/06/17/2025-11110/withdrawal-of-proposed-regulatory-actions (accessed on 7 October 2026).
- Regulation (EU) 2026/1744 of the European Parliament and of the Council of 8 July 2026 Amending Regulation (EU) 2024/1689 (Digital Omnibus on AI). Available online: https://eur-lex.europa.eu/eli/reg/2026/1744/oj/eng (accessed on 7 October 2026).
- New York City Department of Consumer and Worker Protection. Automated Employment Decision Tools (Local Law 144 of 2021; 6 RCNY §§ 5-300 to 5-304). Available online: https://www.nyc.gov/site/dca/about/automated-employment-decision-tools.page (accessed on 7 October 2026).
- Colorado General Assembly. SB26-189, Automated Decision-Making Technology (2026), Repealing and Re-Enacting SB24-205, Consumer Protections for Artificial Intelligence (2024). Available online: https://leg.colorado.gov/bills/sb26-189 (accessed on 12 November 2026).
- Greenstone, M.; Oyer, P.; Vissing-Jorgensen, A. Mandated disclosure, stock returns, and the 1964 Securities Acts Amendments. Q. J. Econ. 2006, 121, 399–460. [Google Scholar] [CrossRef] [Scilit]
- Christensen, H.B.; Hail, L.; Leuz, C. Capital-market effects of securities regulation: Prior conditions, implementation, and enforcement. Rev. Finance Stud. 2016, 29, 2885–2924. [Google Scholar] [CrossRef] [Scilit]
- Leuz, C.; Wysocki, P.D. The economics of disclosure and financial reporting regulation: Evidence and suggestions for future research. J. Account. Res. 2016, 54, 525–622. [Google Scholar] [CrossRef] [Scilit]
- Ben-Shahar, O.; Schneider, C.E. The failure of mandated disclosure. Univ. Pa. Law Rev. 2011, 159, 647–749. [Google Scholar]
- Campbell, J.L.; Chen, H.; Dhaliwal, D.S.; Lu, H.-m.; Steele, L.B. The information content of mandatory risk factor disclosures in corporate filings. Rev. Account. Stud. 2014, 19, 396–455. [Google Scholar] [CrossRef] [Scilit]
- Dyer, T.; Lang, M.; Stice-Lawrence, L. The evolution of 10-K textual disclosure: Evidence from Latent Dirichlet Allocation. J. Account. Econ. 2017, 64, 221–245. [Google Scholar] [CrossRef] [Scilit]
- Capital One. Advancing AI Research: Industry & Academia Collaborations. 2 April 2025. Available online: https://www.capitalone.com/tech/ai/ai-research-industry-academia/ (accessed on 20 October 2026).
- Capital One. Advancing AI Research at NeurIPS 2024. 4 December 2024. Available online: https://www.capitalone.com/tech/ai/neurips-2024/ (accessed on 20 October 2026).
- MIT CSAIL. CSAIL Launches Joint AI Research Award with JPMorganChase. Undated Web Page. Available online: https://www.csail.mit.edu/node/13286 (accessed on 10 November 2026).
- Evident. Evident AI Index for Banks, 5th ed.; Evident: London, UK, 2026; Available online: https://evidentinsights.com/ai-index/ (accessed on 20 October 2026).
- CIO. How Capital One Drives Returns on Its AI Investments. 11 July 2025. Available online: https://www.cio.com/article/4019828/how-capital-one-drives-returns-on-its-ai-investments.html (accessed on 28 September 2026).
- Trivedi, V. Valley Bank Cuts AML False Positives 65% Using AI. FinAi News. 2 January 2025. Available online: https://bankautomationnews.com/allposts/risk-security/valley-bank-cuts-aml-false-positives-65-using-ai/ (accessed on 28 September 2026).
- OECD. OECD Due Diligence Guidance for Responsible AI; OECD Publishing: Paris, France, 2026. [Google Scholar] [CrossRef] [Scilit]
- Kálmán, J. Accountability and liability in AI-related financial regulatory sandboxes: A comparative legal analysis. FinTech 2026, 5, 46. [Google Scholar] [CrossRef] [Scilit]
- Ryseff, J.; De Bruhl, B.F.; Newberry, S.J. The Root Causes of Failure for Artificial Intelligence Projects and How They Can Succeed: Avoiding the Anti-Patterns of AI; RR-A2680-1; RAND Corporation: Santa Monica, CA, USA, 2024; Available online: https://www.rand.org/pubs/research_reports/RRA2680-1.html (accessed on 7 October 2026).
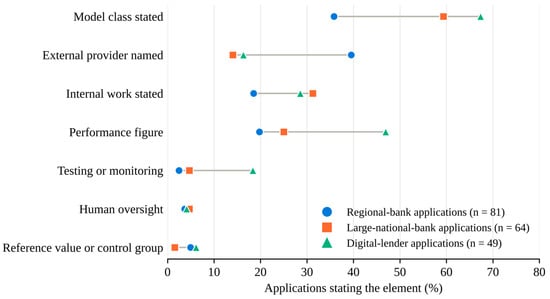
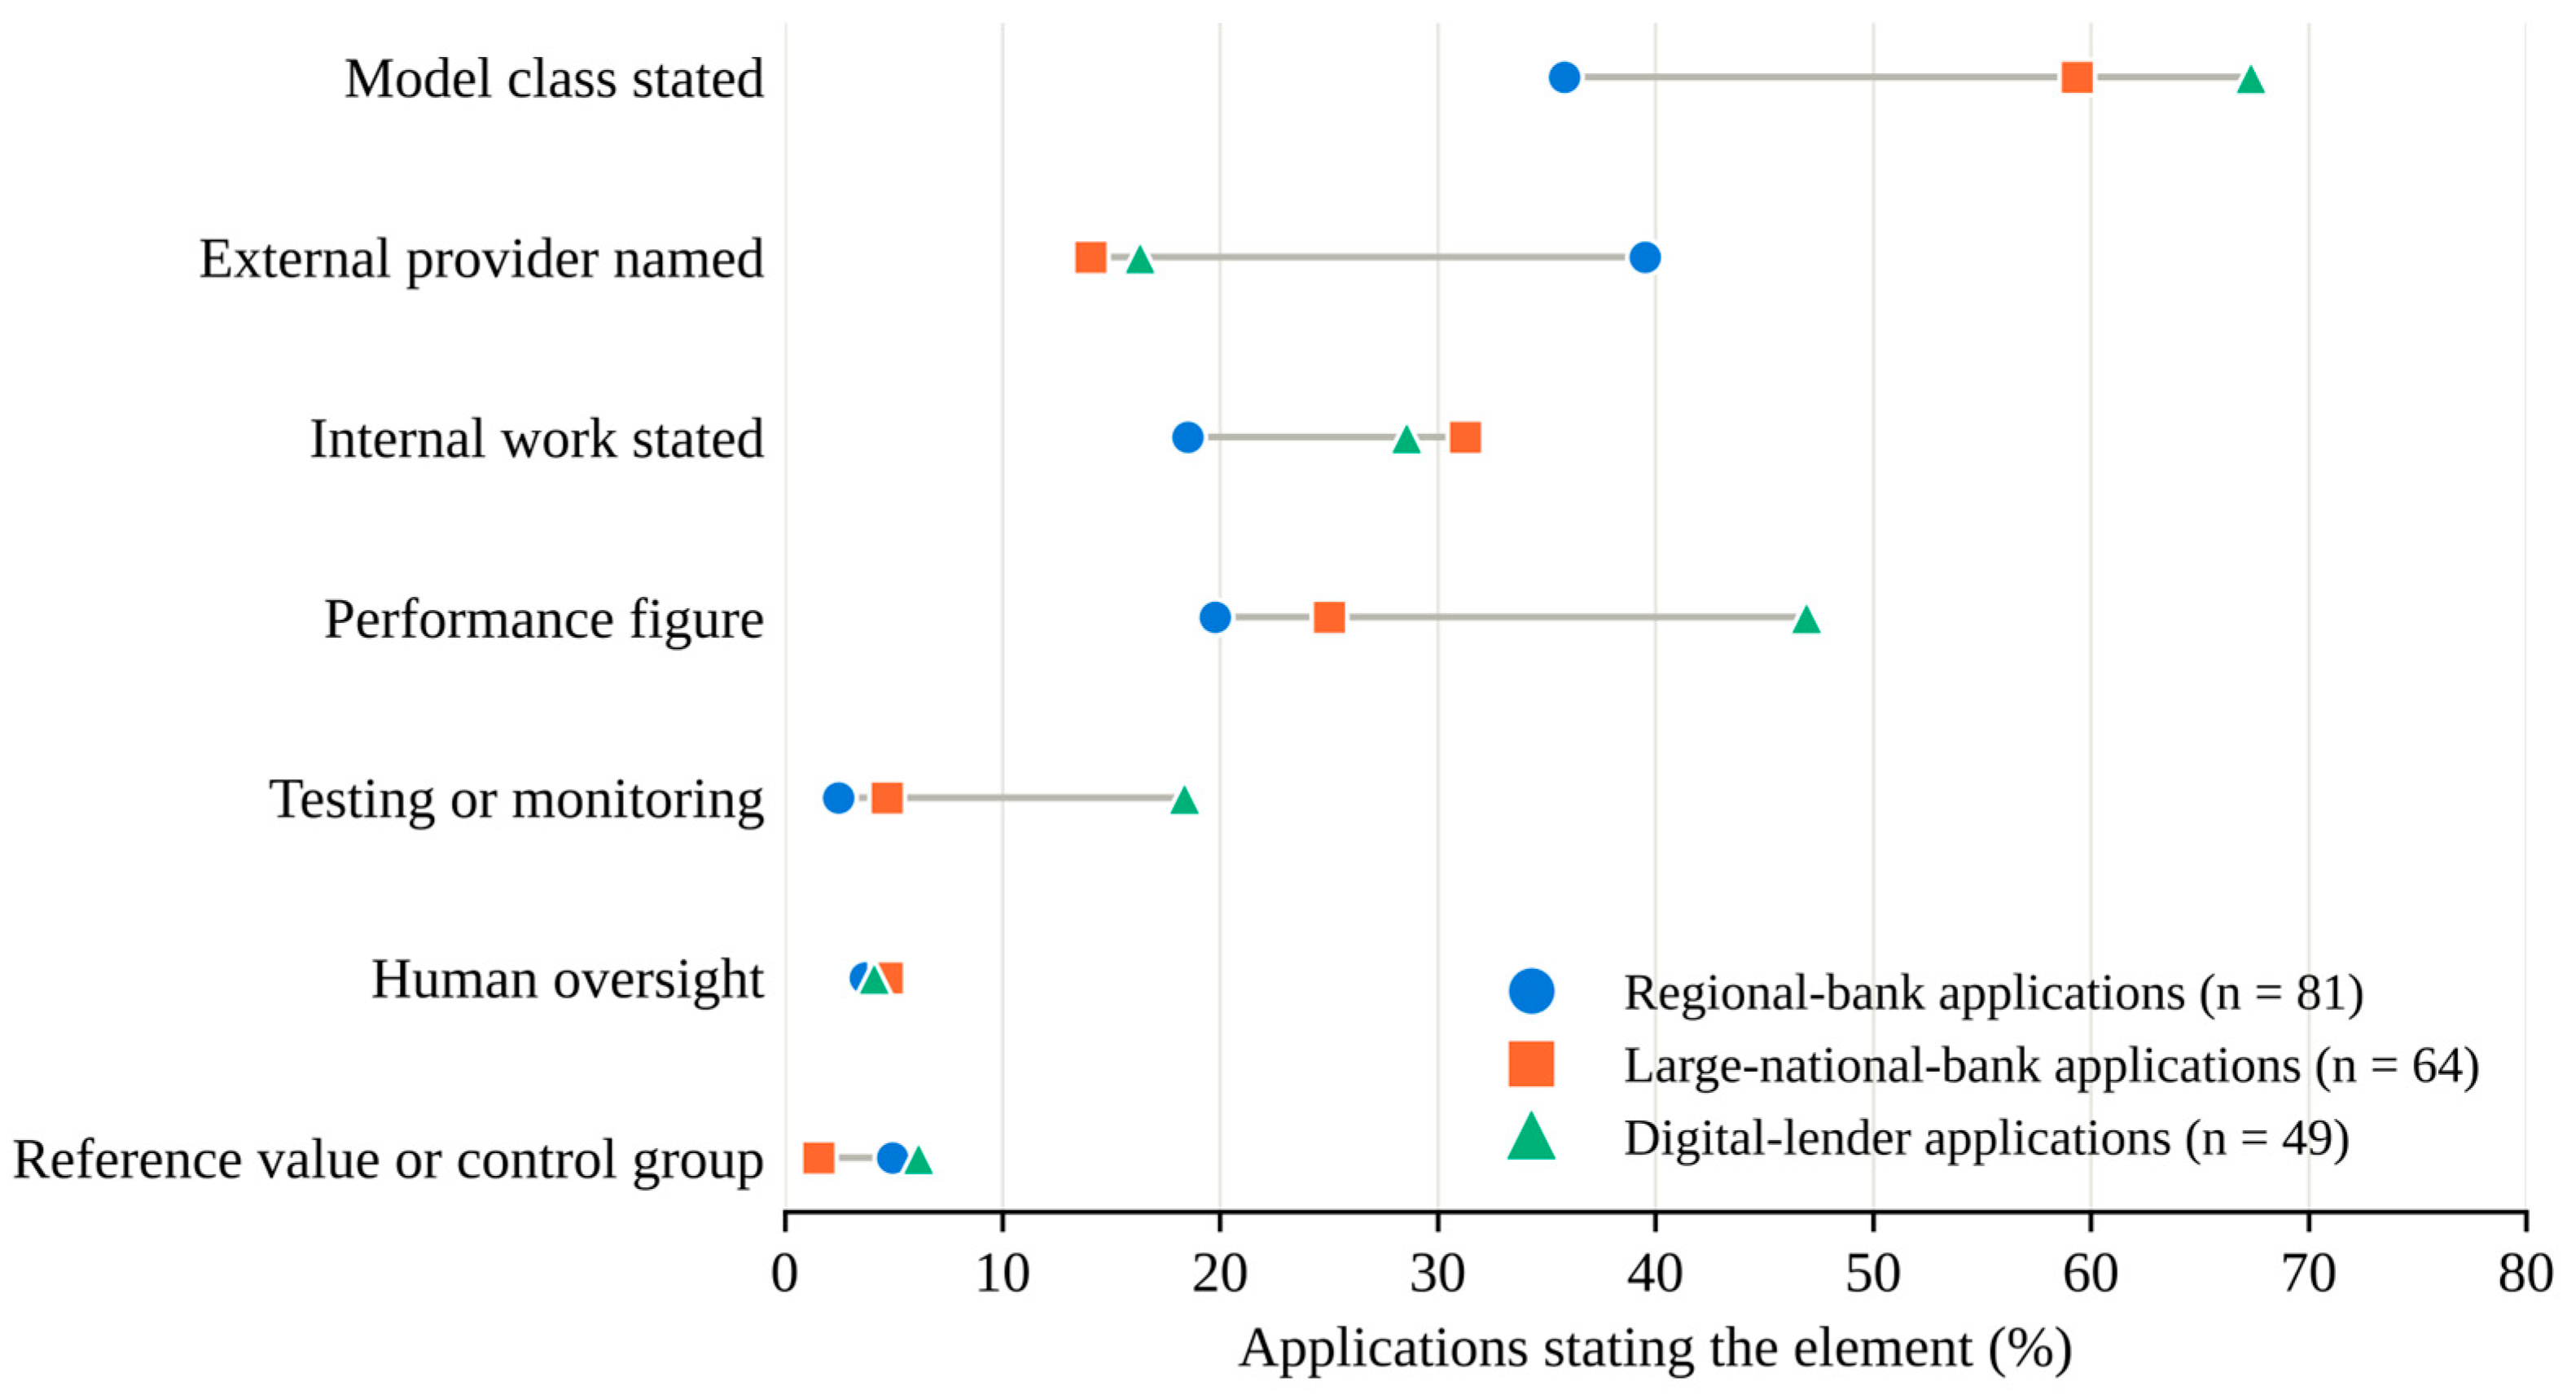

Disclaimer/Publisher’s Note: The statements, opinions and data contained in all publications are solely those of the individual author(s) and contributor(s) and not of MDPI and/or the editor(s). MDPI and/or the editor(s) disclaim responsibility for any injury to people or property resulting from any ideas, methods, instructions or products referred to in the content. |
© 2026 by the author. Licensee MDPI, Basel, Switzerland. This article is an open access article distributed under the terms and conditions of the Creative Commons Attribution (CC BY) license.