


Abstract
AI assistance can change mortgage application incentives and the composition of borrowers reaching a credit decision. We develop a lender-choice and documentation-continuation model with general differentiable documentation and perceived-cost functions. The framework admits privacy concerns and trust improvements, distinguishes participation and funded-volume thresholds, and shows how conditional approval can move in either direction under fixed underwriting. Public HMDA records provide a descriptive application to decision measurement. At a common application mix, Better Mortgage’s 2024–2025 purchase change relative to 30 comparison institutions combines higher recorded administrative resolution and funded conversion with lower conditional approval. Documentation completion and borrower-level AI exposure remain latent. Across 33 selected reporting entities, seven purchase comparisons change sign under a common denominator-classification fraction. Using five- and ten-percentage-point classification-spread benchmarks, chosen for sensitivity rather than calibrated to observed practice, makes 11 and 13 documentation-only comparisons direction-ambiguous. Better’s 32-peer comparison ranges from to percentage points at the classification endpoints. These are sharp measurement ranges conditional on declared restrictions rather than estimates of the correct latent classification or AI effects. The contribution combines general selection mechanisms with transparent measurement sensitivity in recorded lending outcomes.
Keywords:
AI-assisted lending; mortgage applications; documentation costs; borrower selection; credit decisions; measurement sensitivity JEL Classification:
G21; O33; D83
1. Introduction
Artificial intelligence is changing how borrowers interact with financial institutions. An assistant can explain application requirements, collect information and guide applicants through a mortgage file. These services act on the path to a credit decision as well as on the attractiveness of a lender. Their economic significance therefore depends on who applies, who completes the required documentation and which completed applications receive credit. A lower approval rate can accompany more completed applications and more loans when assistance brings additional borrowers into the decision pool.
This paper makes a theoretical and descriptive measurement contribution. Borrowers choose a lender before learning private documentation costs. General documentation and perceived-cost functions separate a completion margin from anticipated privacy concerns or trust improvements at application. At fixed underwriting, conditional approval can fall when lower-approval types expand faster or marginal completers have lower approval chances; it can rise under the reverse conditions. The thresholds for participation and utility differ from the funded-volume threshold. Their ordering depends on the local completion response, while their numerical levels depend on the cost functions.
The empirical objective is to characterize recorded decision stages and their sensitivity to denominator conventions. HMDA does not observe assistance intensity, usage or individual documentation histories, and the Better setting combines technology and distribution developments. Accordingly, the institution-period comparisons are descriptive illustrations of the measurement problem. They do not select an AI mechanism from the alternative processes that can generate the same aggregate outcomes.
The framework also distinguishes substantive credit assessment from administrative resolution. A documentation-related denial enters a recorded decision denominator, whereas an incomplete closure lies outside it. Their relative prevalence can therefore affect recorded resolution and approval while leaving the number of funded loans unchanged. We derive conditional measurement ranges that quantify this dependence under explicit restrictions on the ambiguous-denial pool and on differences in classification fractions across institutions and years. This connects the economic selection problem to the interpretation of public lending records.
Annual Home Mortgage Disclosure Act (HMDA) data for 2018–2025 provide the empirical setting. Better Mortgage’s expansion of its AI assistant offers an institutional application, while 33 selected reporting entities provide a broader measurement comparison. At a common 2024 purchase application mix, Better’s change relative to its original 30 peers is percentage points in administrative resolution, in conditional approval and in funded conversion. Assigning documentation-related denials to the administrative-only category changes the approval comparison to points. The common-fraction approval crossing occurs at 44.5% of the ambiguous-denial pool and at 60.1% after state-and-route adjustment.
The selected-cohort analysis separates the prevalence of sign reversals from their magnitude. Seven of 33 recent purchase comparisons take both signs as a common classification fraction varies. The count remains seven when ambiguity is restricted to denials reporting documentation reasons alone with six entities shared across definitions. The transparent five- and ten-percentage-point sensitivity benchmarks, rather than empirically calibrated spread restrictions, make 11 and 13 of these narrower comparisons direction-ambiguous. At either spread, Better alone permits changes exceeding one percentage point in both directions. Its comparison with the other 32 entities ranges from to points at the classification endpoints. Observed funded conversion remains invariant to this reassignment. These results give a quantitative assessment of how denominator conventions affect comparisons of credit decisions.
The paper contributes to three related studies in the literature. Research on financial technology distinguishes customer interaction from credit screening [1], documents faster mortgage processing [2], and explains the growth of nonbank lending [3]. We add an explicit borrower documentation option to lender choice, linking application frictions to the composition of completed pools. Research on predictive underwriting studies the distributional effects of machine learning [4]; our fixed-rule benchmark identifies a separate route through which conditional approval changes. An insurance experiment similarly connects AI-assisted acquisition to customer selection through information production [5], while workplace evidence documents heterogeneous productivity gains from generative AI assistance [6]. Finally, HMDA studies relate the interpretation of denial rates to applicant populations and recorded categories [7,8]. Our classification analysis jointly addresses co-reported denial reasons, bounded classification dispersion and the magnitude of comparative changes.
The relation to credit-selection theory is complementary. Information-based credit rationing studies selection induced by lending terms [9]; we hold those terms and the within-type decision rule fixed to isolate entry and documentation continuation. Our contribution to the application-friction literature is the distinction between the anticipated option at lender choice and the realized continuation cutoff. On measurement, Yetiş [7] examines lender scale, reason coding, program conditioning and selection into recorded FHA applications. We study a different, explicitly conditional question: how co-reported documentation reasons and bounded differences in denominator classification affect a four-population approval-change contrast. The screening-information result serves as a theoretical comparison channel rather than an empirical interpretation of the rollout.
The theoretical contribution is a documentation option in lender choice with general local cost responses and explicit selection conditions. The empirical contribution is a descriptive analysis of recorded decisions and conditional denominator sensitivity. Section 2 presents the model. Section 3 derives its implications and numerical illustrations. Section 4 reports the data, comparative evidence and discussion. Section 5 concludes. Appendix A contains the proofs; Appendix B, Appendix C and Appendix D provide empirical specifications and supplementary analyses.
2. Model
2.1. Lender Choice, Perceived Costs and the Documentation Option
There are finitely many borrower types g with masses . A focal lender offers an application service with assistance intensity . The parameter describes the service offered and anticipated at lender choice; it is distinct from a realized borrower-level usage measure. Loan terms, rival utilities and funding capacity are fixed in this partial-equilibrium comparison. Approval and funding conditional on approval have fixed probabilities in the benchmark. A funded loan provides net benefit , so the value of reaching the decision stage is . (The separation of application processing from underwriting is motivated by Fuster et al. [2]. Holding the decision rule fixed isolates an application margin alongside the predictive-underwriting mechanism studied by Fuster et al. [4].)
Applying incurs a fixed cost and an anticipated perceived-cost component . We allow to be continuously differentiable with a signed derivative. One interpretation is , where values anticipated data exposure or loss of control and values the confidence, transparency or convenience associated with the service. The two components need not have equal slopes. A negative represents an improvement in perceived service value; it does not represent a negative monetary fee. (Privacy trade-offs depend on context and information flows [10]. Experimental evidence documents both algorithm aversion [11] and algorithm appreciation [12]. These studies motivate allowing either sign; they do not calibrate mortgage borrowers’ perceived costs.)
The timing concerns the anticipated choice of application channel. A borrower can value the expected disclosure, consent and interaction requirements before deciding whether to apply even though the subsequent documentation burden is uncertain. Thus, is an ex ante channel attribute rather than a charge for observed assistant sessions. A separate continuation-stage usage cost is examined in Appendix A.1. Neither component is measured by the institution-year comparisons below.
After applying, the borrower learns a nonnegative documentation cost with continuously differentiable distribution and continuous density . Assistance scales the burden by a positive differentiable function . Define its local proportional reduction as . The cost-reducing region has ; allowing explicitly accommodates a region in which additional service complexity increases burden. Continuation occurs when . At an interior cutoff,
The option includes the loan benefit and documentation effort. Approval and funding shocks are independent of conditional on group in this benchmark. Section 2.3 relaxes this independence for approval chances.
Expected utility at lender choice is . Independent type-I extreme-value taste shocks with normalized scale imply
Here, is the exponentiated rival and outside-option index. (The logit specification follows the random-utility representation in Train [13]; fixed defines the focal lender’s partial-equilibrium margin.) Choice precedes the documentation-cost realization, so its anticipated completion option affects entry. Reported market shares measure the allocation of recorded applications, while the model’s type masses also include potential borrowers who do not apply.
The exponential/linear benchmark, and , is a specialization with and . Nonnegative describes a privacy-concern case. The general results below impose no universal sign on perceived-cost responses and do not require a constant proportional documentation gain.
2.2. Lending Stages and Borrower Utility
Let , , and . Define application weights , completed-pool weights , latent completion , approval conditional on completion , funding conditional on approval , and funded conversion . Positive pools satisfy . Superscript c distinguishes the model’s completion and completed-pool approval from the recorded administrative quantities introduced in Section 2.5. Pooled T responds to composition when fixed differ across types.
Expected maximum choice utility, apart from the taste-distribution constant, is . It values loan benefits, effort, perceived channel attributes and outside opportunities at fixed terms; it is not a measure of total social welfare or lender profits.
2.3. Documentation Cost and Approval Within a Group
Within one borrower group, let be a continuously differentiable approval chance associated with privately learned documentation cost z with acceptance t fixed. The borrower learns this chance when choosing continuation. A fixed credit rule may approve repayment types with probabilities . If , then . This links approval chance to the cost–risk association while keeping the rule fixed.
Assume is positive below a unique interior cutoff and negative above it in a neighborhood of the assistance level considered. At the cutoff, . This single-crossing condition holds for decreasing when the endpoints bracket zero and for the bounded increasing examples used below. It provides a well-defined marginal completer and local comparative statics. The cutoff solves , giving
Choice retains Equation (2) with this group-specific option value.
2.4. A Separate Information Channel
To distinguish documentation assistance from screening technology, consider repayment type with prior among completed applications. The lender observes , where is standard normal and measures signal quality. Application, documentation and acceptance shocks are independent of type conditional on group. A repaying loan returns and a nonrepaying loan loses , giving optimal posterior cutoff at fixed terms.
Write , and . The optimal rule approves when with probability
where and denote the standard normal distribution and density. Assistance intensity a and signal quality are distinct technology margins. This is a theoretical comparison benchmark: the empirical application measures neither signal precision nor lender information value.
2.5. Latent Continuation and Recorded Administrative Outcomes
Theoretical documentation continuation and HMDA administrative resolution are different objects. Let d be the application probability of completing the model’s documentation stage, q approval conditional on that completion, and t funding conditional on approval. To connect the model to a recording system, consider the following bridge assumptions: every completed application reaches substantive assessment and is recorded among action codes 1–3; approvals enter codes 1–2; and non-completers either leave through codes 4–5 or receive a documentation-related action-3 denial. Let h be the application probability of that last, disjoint group with . Under these assumptions only,
The superscript H denotes recorded HMDA outcomes. Increasing h at fixed raises recorded resolution and lowers conditional recorded approval while leaving funded conversion unchanged. This illustrates a recording mechanism distinct from the borrower-selection mechanisms. Equation (5) does not identify d or establish that every reported documentation denial belongs to h.
Institutional rules explain why incomplete documentation can appear in different recorded categories. CFPB’s official interpretation permits denial for incompleteness when information is insufficient for a credit decision while distinguishing denials made on sufficient credit information [14]. This motivates examining reason-defined ambiguity sets. It supplies no estimate of the share that corresponds to h. Table 1 therefore separates observable dispositions from the model’s latent documentation and assessment stages.
Table 1.
Theoretical stages and observable HMDA categories.
3. Analytical Results and Numerical Illustrations
3.1. Completion and Participation
Proposition 1
(General continuation and participation). For an interior cutoff, define and . Then,
where , within-type continuation weakly increases. Participation and choice utility increase exactly when with . These derivatives hold for either sign of .
Formal proofs of all propositions are provided in Appendix A.
Where assistance reduces documentation burden, it expands the costs for which continuation is worthwhile. The anticipated option also attracts entry before the cost realization is known. Participation depends on this gain relative to the marginal perceived channel cost. A trust improvement with reinforces entry, while a sufficiently steep privacy concern can offset the documentation gain. Thus, completion and participation have different determinants even before the borrower composition changes.
3.2. Borrower Composition and Conditional Approval
Let and denote application and decision-pool growth.
Proposition 2
(Completion and approval can diverge). At fixed within-type approval,
For two types with , approval falls exactly when . Completion rises simultaneously if
Under these two inequalities, and without a deterioration in within-type screening.
The intuition is a comparison of growth rates in the completed pool. Each group’s approval rule is fixed, but the weights on those rules change. Faster expansion of the lower-approval group reduces pooled approval; faster expansion of the higher-approval group raises it. Completion combines the direct documentation gain with the effect of entry on applicant composition. The two terms identify when easier documentation dominates sorting toward groups less likely to finish. Opposite approval responses across markets follow from differences in the relative entry and continuation responses.
3.3. Conversion, Funded Volume and Utility
Let .
Proposition 3
(General volume and utility thresholds). At fixed and positive interior pools,
Conversion satisfies . The funded volume increases exactly when
The right side exceeds the participation/utility threshold exactly when . All-group loan growth can coexist with declining aggregate conversion. If and for every group, all group loan volumes weakly increase.
Loan counts combine the number applying with the probability of funding an application. Where continuation rises, funded volume can increase even when the perceived-cost slope is high enough to reduce participation and choice utility. This threshold gap is the continuation gain divided by rather than a consequence of exponential or linear functional forms. A strong expansion of lower-conversion types can also raise every group’s loan count while lowering the aggregate funded share. A larger loan count alone therefore does not determine the sign of borrower utility.
3.4. The Approval Chance of Marginal Completers
Proposition 4
(General marginal completion and approval). For positive density at the cutoff, the stated single crossing and ,
Completion rises and conditional approval falls when the marginal completer’s approval chance is below the existing completed-pool mean; approval rises under the reverse inequality. For any differentiable κ, . With and ,
The intuition is that the newly completing applicants enter at the documentation cutoff. Their approval chance, relative to the average of existing completers, determines the within-group approval response. When marginal applicants have lower chances, the completed pool expands and its mean approval falls. The reverse association raises both completion and approval. Constant recovers the benchmark. With several groups, aggregate approval combines the decision-weighted within-group derivatives with the composition covariance in Proposition 2. This result supplies a formal counterpart to heterogeneity inside measured income and loan-type categories.
3.5. Information Value and the Direction of Approval
Proposition 5
(Information value and approval). Let . Then,
At , approval increases for and falls for . At , approval increases for ; for , it falls at sufficiently low signal quality and can subsequently increase. The expected bank payoff per completed decision,
strictly increases with λ: .
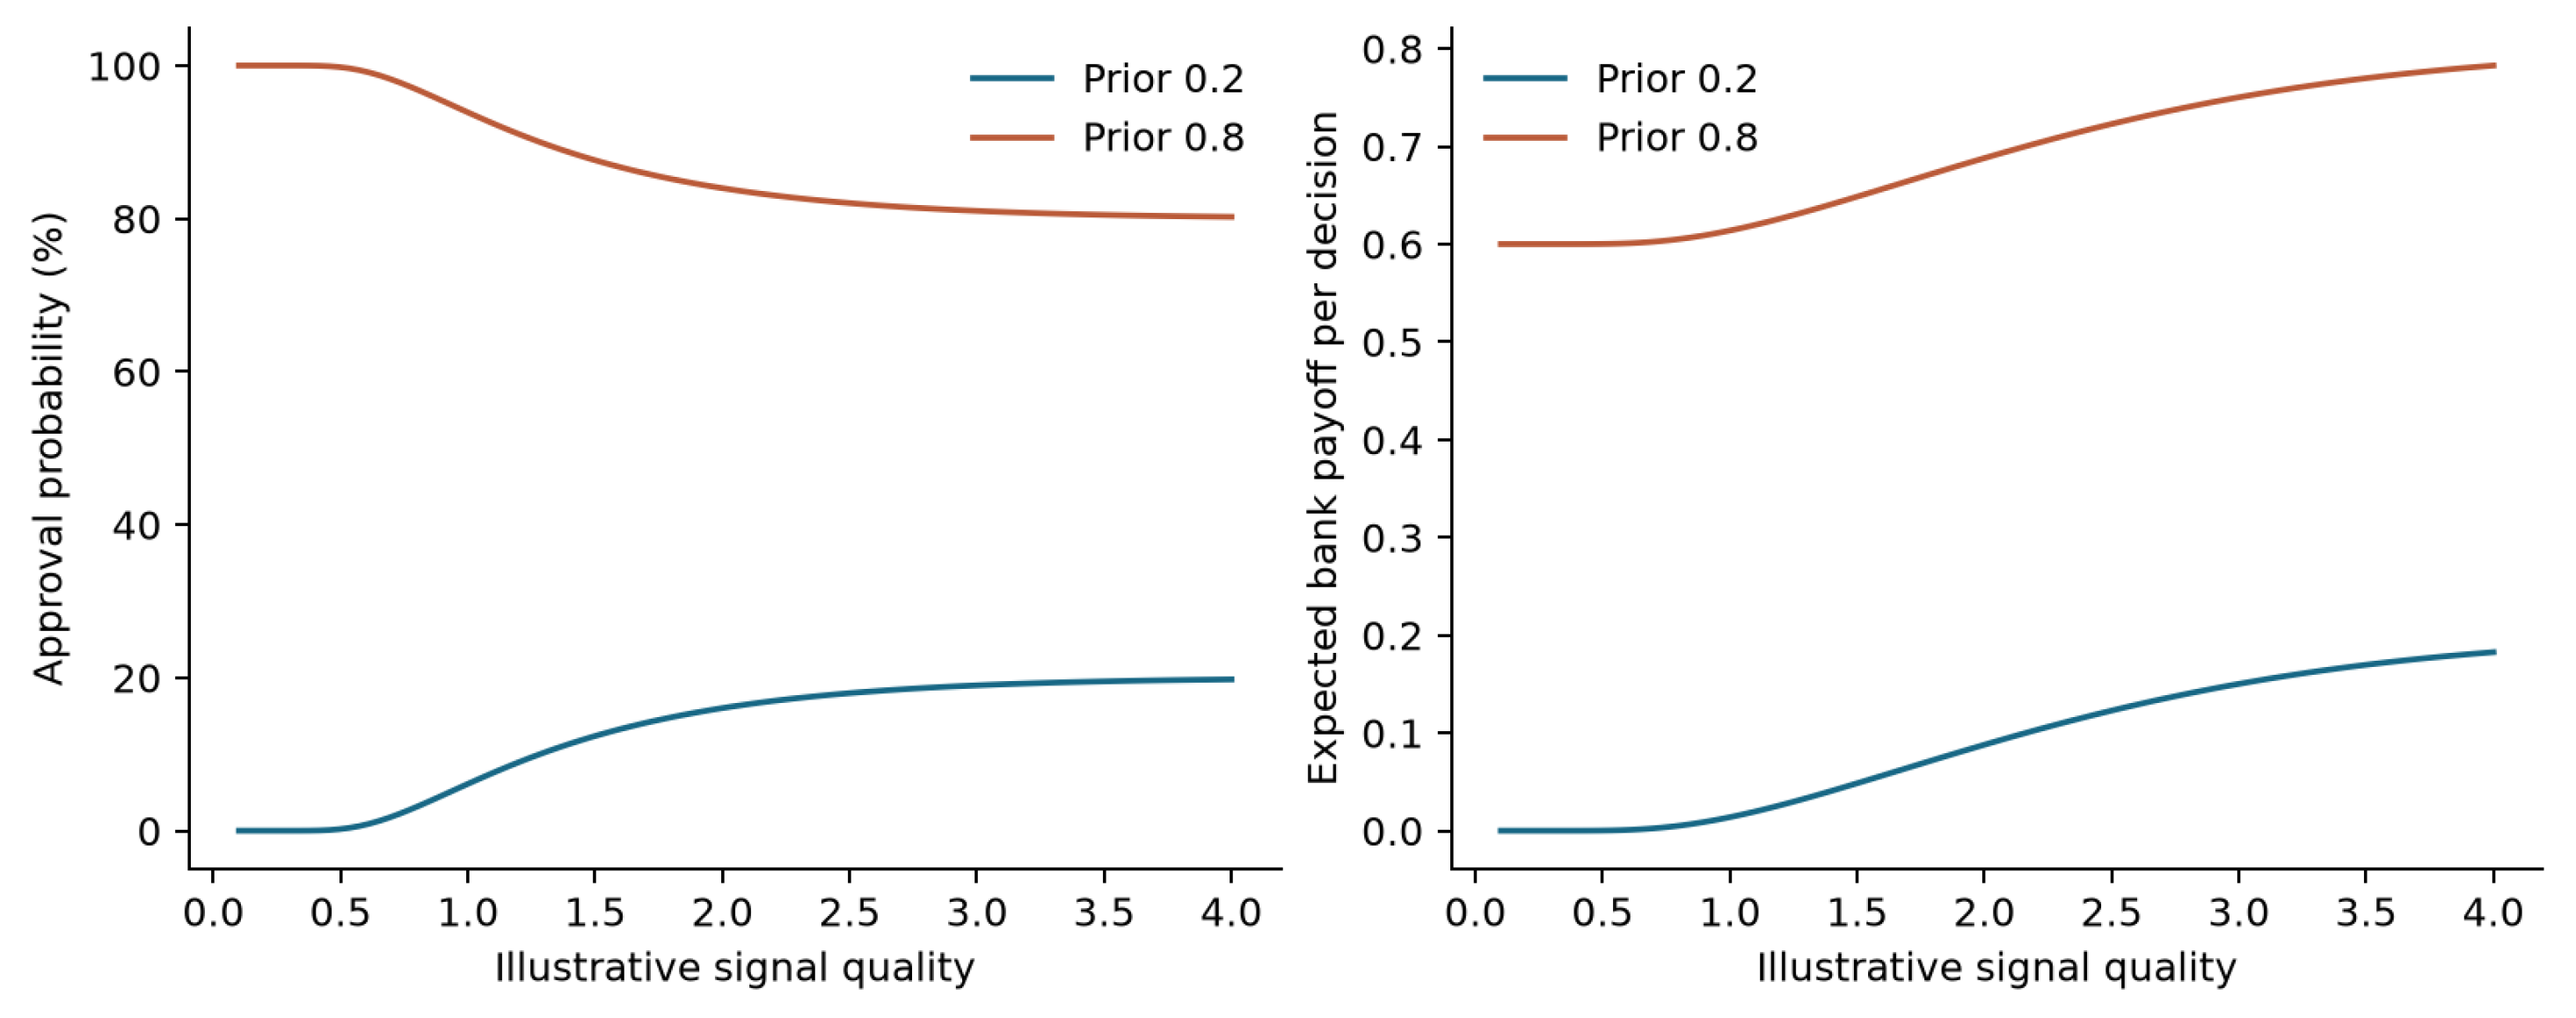
The intuition is that a more precise signal separates applicants on both sides of the lending threshold. With symmetric payoffs, an initially favorable prior leads to more rejections as the signal distinguishes nonrepaying types, while an unfavorable prior leads to more approvals as it reveals repaying types. The conditional expected bank payoff increases in either case. The approval-rate response therefore depends on prior risk and the payoff cutoff, while information value has a positive sign at fixed implementation costs and terms. Figure A2 in Appendix A displays these two cases.
3.6. Observable Implications and Observational Equivalence
The model distinguishes economic mechanisms; the HMDA application illustrates the interpretation of recorded outcomes. Table 2 separates these roles. Changes in , and C are observable. The private documentation distribution, assistance intensity, perceived-cost slopes and approval chances of marginal completers are not observed. Consequently, the completed-pool covariance and the marginal-cutoff effect are observationally equivalent at the level of these aggregate ratios. A change in the recording partition in Equation (5), a change in underwriting, or shifts in other application costs can also produce the same signs.
Table 2.
Theory, recorded quantities and empirical scope.
Within this scope, the empirical contribution is to document stage divergence, define its analytical population, and quantify the denominator restrictions that preserve or change the sign of a recorded approval comparison. The conditional measurement ranges below concern this measurement problem; they are separate from the structural comparative statics in a and from a causal response to technology adoption.
3.7. Functional Forms, Signed Trust Responses and Local Thresholds
The distinction between the participation/utility threshold and the loan-volume threshold holds for every differentiable pair under the stated interior conditions. The gap is positive where documentation burden falls and . Its magnitude varies with the local cost slope, the cost distribution and entry share. If burden rises locally, the completion derivative and threshold ordering can reverse. Thus, the selection identities are general, while numerical thresholds and their movement along the intensity axis depend on functional forms and parameters.
Figure 1 compares exponential, hyperbolic, saturating and non-monotonic documentation burdens. The calculation crosses these with linear, convex, initially trust-building and trust-improving perceived-cost functions. The 16 combinations span 992 group states. Independently computed finite differences and numerical option integrals agree with the formulas to below in model units. The illustrated non-monotonic burden includes 100 group states with , and 408 states have , using a sign-reporting tolerance. These cases explicitly locate the conditions under which the benchmark’s monotonicity conclusions change rather than imposing a nonnegative trust slope. Appendix A.2 specifies every function and parameter.
Figure 1.
Local threshold sensitivity under alternative documentation-cost functions. The higher-approval illustrative type is shown with linear perceived costs. Solid curves are participation/utility thresholds and dashed curves are funded-volume thresholds. The second panel shows the completion derivative; the non-monotonic burden crosses zero where its local documentation gain changes sign. Parameters are illustrative with no empirical calibration or statistical intervals.
3.8. Numerical Illustrations of the Competing Effects
For the exponential-distribution illustration, with , and rate , , and . Table 3 illustrates the thresholds with fixed within-type credit decisions. Moderate and stronger assistance raise completion and reduce pooled approval. Conversion rises in the first case and falls in the second, while funded volume rises in both. In the stronger-assistance case, endogenous entry toward the lower-approval type dominates the direct conversion gain.
Table 3.
Illustrations with endogenous documentation decisions.
The high-trust-cost case raises pooled approval and conversion through a different composition response. The lower type’s log-volume derivative is , compared with for the higher type, while the aggregate volume rises. Figure A1 in Appendix A plots the conversion and approval regions over the full efficiency–trust grid. Its zero-derivative curves locate the boundaries at which the dominant response changes.
Within-group selection produces both approval directions as well. Let , , , , and . Slopes and satisfy single crossing over . Then, and . Figure 2 shows completion and conversion rising in both cases with approval falling under the negative cost–approval association and rising under the positive association. These illustrative parameters describe feasible mechanisms independently of the empirical comparisons.
Figure 2.
Within-group marginal-completer selection under a fixed approval rule. Uniform documentation costs and linear approval chance give opposite conditional-approval changes with higher completion. The figure plots 282 states under the stated illustrative parameters.
4. Data and Empirical Analysis
4.1. Data, Lending Stages and Institutional Setting
We use public annual HMDA Loan/Application Register (LAR) releases and public corporate disclosures. The 2018–2025 archived releases contain 138,174,454 records. Our residential sample retains usable five-digit county identifiers; first-lien, owner-occupied, site-built properties with one to four units; and home purchase, rate/term refinancing or cash-out refinancing. Records coded as reverse mortgages, open-end lines or business-purpose loans, purchased loans and separately reported preapproval dispositions are excluded. For the first three flags, the exclusion applies to affirmative code 1; missing or exempt flags remain eligible when the other criteria hold. Ordinary application action codes 1–5 yield 79,809,983 eligible records. Public schemas specify the reported fields [15,16].
Let count origination (1), approval not accepted (2), denial (3), withdrawal (4) and incompleteness (5). Define , , and . The funded conversion is , administrative resolution is , conditional approval is and acceptance is . Thus, for positive conditioning pools. Withdrawals and incomplete closures remain separate outcomes. Application and origination market shares use the corresponding all-lender county–year–product totals. Administrative resolution is denoted when distinguishing it from latent completion . It includes documentation-related denials and is not a direct measure of successful documentation or substantive assessment. The empirical tables abbreviate the recorded quantity as R.
The selected sample combines three focal entities with 30 comparison entities chosen by 2019 residential application counts and continuous presence in annual Transmittal Sheets. It contains 36,182,598 applications. Annual names are matched by legal entity identifier (LEI). Comparison institutions include banks, credit unions and mortgage companies. The broader measurement exercise uses all 33 identities and 7,845,732 eligible applications from 2023 to 2025. Better’s institutional case retains its original 30 peers; each of the 33 measurement comparisons uses the other 32. These fixed selections define the populations studied; they do not form a representative mortgage-lender sample or an AI-treated versus untreated population. Table 4 consolidates these analytical populations.
Table 4.
Sampling frames and analytical populations.
Better announced Betsy on 17 October 2024 as a voice-based assistant supporting inquiries, information collection and verification through its Tinman platform [17]. Its investor materials date outbound pilot activity to June 2024, commercial operation to July, inbound application-lifecycle integration to 17 February 2025 and complete outbound coverage in one state to 18 March [18]. NEO production began in January 2025, and distribution expanded during the year [19,20]. A September 2025 requirement added Betsy consultation before underwriters declined a loan [21]; later disclosures describe use at scale [22]. This sequence motivates the recent annual comparison and the separation of assistance, distribution and decision review. Appendix B.1 provides additional Rocket and loanDepot technology comparisons. (The Rocket disclosures describe its AI document platform and subsequent acquisitions [23,24,25]; loanDepot describes a digital verification and conditional-approval engine [26]. Each comparison retains its own operating window and task definition.)
The annual windows span several company-reported developments; 2024 is partly exposed under the published rollout account. The setting supplies an institutional illustration of decision measurement rather than a clean adoption contrast. Company disclosures describe announced capabilities and dates; they are distinct from independently measured borrower exposure or workflow changes. The same recorded patterns could reflect distribution expansion, underwriting, applicant composition or reporting practice. Table 2 states the resulting correspondence between the theoretical and empirical objects.
4.2. A Common Application Distribution and Classification Analysis
For endpoint j, let count action in joint income–amount–loan-type cell k, and let . On positive common application support, normalize initial application counts as and define
All five actions share identical weights. The later vector describes recorded dispositions at the earlier application mix. Derive , , and from this single distribution. This preserves and includes application cells with zero decisions. Coverage measures the application mass retained at each endpoint.
Peer comparisons require positive applications in the focal entity and pooled peers at both endpoints. The initial focal mix supplies the same weights to all four populations. We subtract the peer change from the focal change. A fixed-2019-peer-weight variant averages within-cell peer probabilities with original national institution weights among supported peers. Geographic variants add state, state-and-route or county to the joint cells with a national benchmark on the same restricted support. Appendix B details these populations and the complementary geographic regressions.
Principal denial reasons may overlap. We count each application once in the union of code 6 (unverifiable information) and code 7 (credit application incomplete), and we separately analyze reason 7. These are action-3 denials; action 5 records files closed for incompleteness [16]. All such records remain action-3 denials in the source data. We vary the analytical denominator rather than revise their regulatory classification. For their application probability , a full-exclusion sensitivity endpoint gives
Here, combines incomplete closures and the assigned documentation denials, and .
Continuous classification makes the maintained assumptions explicit. Recorded approvals and denials outside the designated ambiguity set are treated as substantive decisions; a hypothetical fraction of the reason-defined ambiguous set is excluded from the decision denominator. Interpreting that fraction as the true administrative-only share additionally requires the bridge assumptions in Section 2.5; reported reasons alone do not establish them. For positive ,
With a common fraction, the relative approval change is
where index the focal entity and its peers and the initial and final years. We evaluate all stationary points, endpoints and zero crossings. The resulting intervals are conditional measurement ranges for the recorded distributions. The fractions index maintained classification scenarios; funded conversion remains constant throughout. They are not estimated latent shares. Mathematical sharpness means that every endpoint is attainable under the stipulated recorded-distribution and fraction restrictions. It does not identify the correct classification or attach a confidence level to the range.
4.3. Co-Reported Reasons and Bounded Classification Dispersion
We partition documentation-related denials into those also reporting codes 1–5 or 8, those reporting code 9 without those codes, those reporting only reasons 6/7, and unresolved entries. Every extracted entry is classified. The documentation-only subset is defined by reported principal reasons. Four ambiguity sets cover the union of reasons 6/7, reason 7 alone, documentation-only reasons 6/7, and strict reason-7-only denials. The strict set excludes files reporting both 6 and 7. Application support and weights remain identical across definitions.
Let bound the spread across four endpoint fractions:
At , one common unknown fraction applies; at , fractions vary freely. Five- and ten-point spreads are transparent sensitivity benchmarks—not estimates or institutionally calibrated bounds. Common fractions posit a shared interpretation of each selected reason set; a positive spread permits departures from that interpretation across lender-year endpoints. Different underwriting and recording practices can generate departures, but their magnitude is unobserved here. A spread of 0.05 permits five percentage points of variation within the selected ambiguous-denial pools. Appendix A derives sharp comparison-specific ranges and their nesting as increases. Each entity has its own initial mix and overlapping peer pool, so these ranges evaluate each comparison separately. Counts of ambiguous comparisons are comparison-wise possibilities; one joint lender-level fraction assignment need not attain every reported endpoint simultaneously.
The schedule covers 33 entities, four products, two windows (2024–2025 and 2023–2025) and four ambiguity definitions: 1056 comparisons and 7392 ranges on . All comparisons are retained, including each direction and coverage level. The numerical tolerance is percentage points. We report sign reversals and ranges extending beyond both and points for , giving separate directional and magnitude summaries. An 80% coverage restriction provides a supplementary support check. These are exploratory descriptive comparisons with complete schedules retained in the research materials and summary tables in Appendix D.
Computations use Python 3.12.14 with NumPy 2.5.3, pandas 3.0.6, SciPy 1.18.1 and PyArrow 25.0.1. The exact archived replication release used here is version 1.0.1 (29 October 2026), DOI https://doi.org/10.5281/zenodo.23750651 [27]. Its README.md and TABLE_COVERAGE.md, together with the record-description reproduction map, link the principal exhibits to executable scripts and aggregate inputs. The release supplies raw-release checksums, exclusion and LEI-selection procedures, aggregate inputs, executable principal-table and classification code, tolerances and validation results. The raw-to-aggregate run independently reconstructs all eight years and the 2019 cohort selection, and it reconciles the recent reason cells and geographic counts. Appendix D.5 specifies release-vintage accounting and the scope of the executable package. (Computational preparation used ChatGPT-6 (OpenAI) to develop and check analysis code, examine derivations, and draft and revise text. Empirical results are computed by the supplied programs from public records; additional documentation appears in Appendix D.5.)
4.4. Completion, Approval and Funding at a Common Mix
Table 5 reports the recent comparison for Better and its original 30 peers. At identical application weights, the Better-minus-peer purchase changes are points for conversion, for administrative resolution and for conditional approval. The table separately reports the Better-specific and peer-specific standardized changes. Fixed baseline peer weights preserve these directions at , and . Across individual peer deletions and four baseline subsets, conversion lies between and , resolution between and , and approval between and . The recorded three-stage pattern displays increased throughput alongside lower conditional approval. The selection and recording mechanisms show why this pattern admits several economic interpretations; the comparison does not distinguish among them.
Table 5.
Better-specific, peer-specific and relative standardized changes.
Refinancing provides a useful comparison. Recorded resolution increases and approval decreases under both peer methods; funded conversion is more sensitive to peer weights. The pooled-refinance conversion comparison changes from to points. Earlier purchase windows also differ: the pooled-peer 2019–2023 comparison has conversion and approval points; the 2023–2025 conversion comparison is . Appendix C.1 places these windows, products and geographic projections together, showing how the measured population and reference period shape the comparative evidence.
Better’s purchase denials increase from 939 in 2024 to 1830 in 2025. Denials citing reasons 6 or 7 increase from 193 (20.55% of denials) to 1070 (58.47%). At the common national mix, documentation-related denials rise by points relative to peers. Assigning that set to administrative-only resolution leaves resolution growth of and changes approval to points (Table 6). Reason 7 alone gives and . The state-and-route comparison gives and under the union definition. These calculations identify the documentation-denial pool as quantitatively central to the recorded approval contrast.
Table 6.
Documentation-denial sensitivity for recent purchases.
The common-fraction approval crossing is 44.5% at the national mix, 63.1% with state adjustment, 60.1% with state-and-route adjustment and 80.1% at the county level. These fractions use the documentation-denial denominator. The corresponding reason-7-only thresholds are 44.8%, 63.2%, 60.3% and 79.5%. Figure A4 in Appendix D traces the full curves. The location-adjusted comparisons quantify how applicant geography changes the classification threshold.
Allowing endpoint fractions to vary freely expands the national approval range to points and the state-and-route range to . The state-and-route resolution range is points, while the national resolution lower endpoint is . These conditional ranges quantify the role of classification consistency across populations. The same observed funded conversion is preserved at every classification assignment.
4.5. Denial Reporting and the Substantive Interpretation of Sensitivity
Table 7 places Better’s rising documentation-denial count on both relevant denominators. From 2024 to 2025, the union rises from 193 to 1070, or 2.06% to 8.69% of purchase applications and 20.6% to 58.5% of denials. Reason reporting is 100% among Better’s denials in both years, so the increase is not a switch from wholly missing reasons to a reported reason. It remains compatible with changes in the actual reasons for denial, the mix of applicants reaching those outcomes, or the allocation of reported reasons. Annual public fields do not reveal an internal coding-policy change. Documentation-only records account for 192 and 1068 of the respective union totals, while the strict reason-7-only counts are 156 and 963. These are observed categories rather than verified administrative-only cases.
Table 7.
Observed purchase-denial composition and reason reporting.
The 44.5% common-fraction crossing for the original 30-peer national comparison is a critical value: the recorded contrast changes sign if the same fraction of each of four endpoint ambiguity pools is excluded. It is not a finding that 44.5% of Better’s denied loans were unassessed. The four pools differ in size and composition, and the geographic comparison has its own 60.1% crossing. The strict reason-7-only set is contained in the other sets, whereas the reason-7 and documentation-only definitions need not be nested. Their classification fractions also have different denominators. None supplies a probability distribution for . Institutional or file-level assessment evidence would be needed to judge which fraction, if any, represents the latent partition. We therefore report critical values and full sensitivity schedules rather than attach an empirical plausibility label to the five- or ten-point scenarios.
4.6. The Prevalence and Magnitude of Classification Reversals
Co-reported reasons account for 17.1%, 11.5% and 14.1% of documentation-related denials in the selected cohort in 2023, 2024 and 2025 (Table A22). At Better, the corresponding recent purchase counts are one of 193 and two of 1070. Restricting the ambiguity pool to documentation-only denials therefore leaves its recent reversal nearly unchanged.
Across 33 recent purchase comparisons, a common fraction produces seven sign reversals under either the union or documentation-only definition. Six entities are shared; Rocket enters and Newrez leaves the narrower reversal set. Better’s comparison with the other 32 entities moves from to points to two decimal places under either definition with a common-fraction crossing of 44.3%. This 32-peer extension complements the separately retained 30-peer institutional case.
Figure 3 shows how the allowed classification spread affects directional and magnitude summaries. At the five-percentage-point sensitivity benchmark, 12 union and 11 documentation-only comparisons take both signs; at ten points, the counts are 16 and 13. These spreads are transparent sensitivity choices—not estimates or institutionally calibrated bounds. Unrestricted fractions give 29 and 28. The upward frontier records the enlargement of the permitted classification set. Under a common fraction, only two union and three documentation-only ranges extend beyond both and points. Better alone extends beyond both and under either definition, including at five- and ten-point spreads. The distinction between sign and magnitude is therefore substantial.
Figure 3.
Classification dispersion and the magnitude of ambiguous purchase comparisons, 2024–2025. Each of 33 focal entities is compared with the pooled other 32 at its initial application mix on four-population common support. The horizontal axis bounds the maximum spread of endpoint classification fractions. Points show the prespecified grid; connecting lines aid reading. Panel (a) counts ranges taking both signs; panel (b) requires changes beyond both and percentage points. “Only reasons 6/7” excludes denials reporting another nonblank reason. Fractions and their dispersion specify maintained classification restrictions. The five- and ten-percentage-point spreads are transparent sensitivity benchmarks rather than empirically calibrated bounds. These focal-minus-32-peer contrasts differ from the original-30-peer institutional case. The panels summarize conditional measurement ranges rather than statistical confidence intervals or causal-effect bounds.
Among comparisons with a strict common-fraction direction, 22 union cases reach zero at a finite spread and four retain their strict direction throughout the domain. Their finite-threshold median is 10.7 percentage points. The documentation-only counts are 21 and five with a finite-threshold median of 17.3 points. These medians apply to the finite-threshold subsets. Appendix D reports the full grid, individual entity comparisons, alternative products, the earlier window and coverage checks.
4.7. Applications and Funded Volume
For actual national counts, . A symmetric exact decomposition assigns the change to application volume and conversion:
Table 8 shows Better’s purchase originations rising from 3425 to 5145 and applications from 9354 to 12,307. Of the additional 1720 loans, 1157.9 are allocated to application growth and 562.1 to conversion, approximately 67.3% and 32.7%. Volume accounts for about 89% of the rate- and pooled-refinance increases. Peers’ purchase originations decline by 22,268, predominantly alongside fewer applications. These arithmetic components use actual national populations, including entry into new counties and products, and complement the common-mix stage comparisons.
Table 8.
Actual national loan-count growth and its arithmetic components.
The arithmetic decomposition separates applicant volume from funded conversion, the two margins appearing in Proposition 3. It does not allocate the observed loan growth to AI, documentation assistance or a utility change. Reported lender shares describe the allocation of applications and loans across institutions.
4.8. Supplementary Evidence and Discussion
Geographic projections hold the 2019 incumbent county footprint fixed with lender–county and county–year effects and observed applicant-pool controls. Recent purchase projections are points for administrative resolution, for conditional approval and for conversion (Table A2). State-and-route common-mix comparisons are , and (Table A4). Both show the same recent stage directions on their defined populations. Appendix B specifies the regression estimands and reports lender-cluster reference uncertainty as a descriptive diagnostic, following the distinction between cluster counts and independent assignment units emphasized by MacKinnon and Webb [28].
The county specification retains 72.2% of Better’s 2024 applications and 64.0% of its 2025 applications [17,19]. Relative to the national approval comparison, points arise from the support restriction and from county adjustment within that restricted population (Table 9). This separates population selection from geographic adjustment.
Table 9.
Support selection and geographic adjustment: recent purchases.
Crossed income and loan-type comparisons exhibit differing approval directions. Within conventional purchases, the recent common-mix changes are points for low income, for middle income and for higher income with resolution rising in all three (Table A5). Government-loan approval rises in each income group. These differences show heterogeneity within measured categories. They do not observe the marginal completers in Proposition 4, and latent between-type sorting, changing within-type rules and other institutional developments remain observationally equivalent. Documentation-denial classification changes these subgroup patterns as well; the supplementary schedules evaluate both dimensions together.
The longer reference windows and annual gap diagnostic provide historical context. With fixed 2019 peer weights, the national 2023–2025 purchase conversion comparison is points. This describes a different window and population from the recent common-mix comparison. Appendix D reports residual ranges under restrictions on annual gap drift, which are motivated by the sensitivity analysis of counterfactual trends [29]. We use these as point-level descriptive ranges conditional on a specified drift restriction.
The reference-period evidence is economically consequential. The fixed-weight national 2023–2025 conversion comparison is points, while the recent common-mix comparison is positive; their weights, supports and reference years differ. The exploratory 2023 pseudo-event and 2019–2023 comparisons also display substantial institutional movements before the recent window (Table A8 and Table A11). The purchase pseudo-event projection is points for conversion and for approval under its stated specification. These are not pre-trend tests validating an AI design. They establish that the measured contrast depends on the period and population and support interpreting the recent exercise as a conditional descriptive comparison. A drift-restricted interval containing zero is not evidence against another economic mechanism.
Taken together, the results document divergence among recorded decision stages and its dependence on population support, reference periods and analytical classification. Single-focal-institution regressions provide descriptive conditional projections; their reported uncertainty is a reference calculation rather than treatment-effect inference. Counts among the 33 selected institutions describe that cohort and the chosen sensitivity schedule. They are not prevalence estimates for AI effects, and the large number of loans or cells does not create independent technology assignments.
5. Conclusions
This paper develops a theory of mortgage application choice and documentation continuation with general local cost responses. Completion, conditional approval, funded volume and borrower utility are distinct economic objects. Their directions depend on entry, marginal-completer selection and the local perceived-cost response. Privacy concerns and trust improvements can work in opposite directions; the threshold expressions depend on their net marginal value. Composition identities and marginal-cutoff formulas hold beyond the exponential/linear illustration, while numerical thresholds vary with functional forms. A separate information benchmark shows why improved screening value also admits either approval direction.
The public-data contribution is descriptive decision measurement. Better’s recent common-mix comparison combines higher recorded administrative resolution and funded conversion with lower conditional approval, and reason-defined denominator scenarios can reverse the approval contrast. The 33-entity exercise quantifies how the magnitude and prevalence of such ambiguity vary with classification dispersion within a selected cohort. Explicit coverage accounting separates sample restrictions from geographic adjustment. These findings concern recorded comparisons rather than direct verification of the assistance mechanisms.
Future work can connect the general theory to borrower-level service exposure, documentation histories, assessment records and lender policy changes. Such information would distinguish continuation from recording, calibrate the classification fractions and perceived-cost responses, and support designs addressing the causal consequences of assistance. Loan pricing, lender costs and repayment outcomes would additionally be needed for a welfare evaluation.
Author Contributions
D.D., Q.D., Y.L., P.L.N. and Z.W. contributed equally to conceptualization, methodology, interpretation of results, writing—original draft preparation, and writing—review and editing. All authors have read and agreed to the published version of the manuscript.
Funding
This research received no external funding.
Institutional Review Board Statement
The study analyzes public, privacy-modified HMDA secondary records and public corporate disclosures. Results are reported in aggregate. No individuals were recruited, contacted or subjected to an intervention.
Informed Consent Statement
No new informed consent was obtained; the analysis uses public secondary data and reports aggregate results.
Data Availability Statement
The processed aggregate data, analysis code, source-acquisition instructions and validation materials supporting this study are available in Zenodo, version 1.0.1, at https://doi.org/10.5281/zenodo.23750651 [27]. The underlying public HMDA Loan/Application Register and Transmittal Sheet releases are available at https://ffiec.cfpb.gov/data-publication/ (accessed on 1 October 2026). Corporate disclosures are cited separately.
Acknowledgments
ChatGPT-6 (OpenAI) assisted with code checking, the validation of analytical proofs, and language polishing. The authors reviewed and verified the material and take full responsibility for the manuscript.
Conflicts of Interest
The authors declare no conflict of interest.
Appendix A. Proofs and Supplementary Theory
Proof of Proposition 1.
Since , differentiability and positive give and . Differentiating the option integral gives ; the boundary term is zero at the indifferent cutoff. Differentiating the logit yields , and differentiating the log-sum utility gives . Since , their strict signs coincide. No sign restriction on enters the derivation. □
Proof of Proposition 2.
Fixed masses imply and . Differentiating and gives Equation (7). With two types, and the application covariance is . These expressions give the stated simultaneous inequalities. □
Proof of Proposition 3.
Log differentiation of gives . Since , rearrangement gives Equation (10). Its threshold minus is with the sign of . Summing with funded-loan weights gives aggregate growth. Differentiating gives the stated covariance identity. Nonnegative continuation and option gains weakly exceeding the perceived-cost slope imply weak growth in every group. The coexistence of all-group loan growth and declining conversion follows constructively from the stronger-assistance specialization in Table 3: , and . This is an existence example rather than invariance of those numbers across functions. □
Proof of Proposition 4.
Differentiate to obtain . The single-crossing denominator and imply a positive cutoff derivative. If , the differentiation of gives . The payoff at the moving boundary is zero, yielding . Finally, the log differentiation of and gives Equation (12). These are local formulas, requiring neither an exponential burden nor a linear perceived-cost function. □
Proof of Proposition 5.
The Gaussian likelihood ratio has logarithm . Posterior odds therefore exceed exactly when . The type-specific approval probabilities are and , proving Equation (4). Moreover,
Thus, the first density term has share of . Since and , differentiation gives Equation (13). At , its sign is that of . For and , both terms in the bracket are nonnegative. For , and the sign changes when . Finally, Bayes indifference gives . Differentiating leaves . □
For positive endpoint pools,
Multiplication cancels the intermediate disposition denominators. The joint-disposition standardization uses a single synthetic application pool, preserving the accounting identity at both endpoints. Separate stage-denominator standardizations and level regressions evaluate their own conditional populations. The logarithmic decomposition applies to ratios derived from the common disposition vector. For the volume identity in Equation (20), expanding the two symmetric products cancels and , leaving .
The numerical illustrations use exponential documentation costs, a 6480-point efficiency–trust grid and 1000 parameter draws with a fixed seed. Analytical derivatives and independently integrated option values determine the plotted regions. Figure A1 separates the regions in which conversion and conditional approval increase or decrease as documentation efficiency and privacy costs vary; the boundary curves identify changes in the sign of each response rather than estimated population thresholds. Figure A2 isolates the distinct information channel: improved signal precision raises expected lender payoff for both illustrated priors even though their approval-rate responses differ. The within-group uniform-cost examples use closed-form cutoffs and numerical payoff quadrature.
Figure A1.
Documentation efficiency, perceived costs and local theoretical lending outcomes. Rival utilities, loan terms and within-type screening are fixed. All 6480 grid points are retained; colors show analytical derivatives at the common initial state. Colors identify the model’s comparative-static regions.
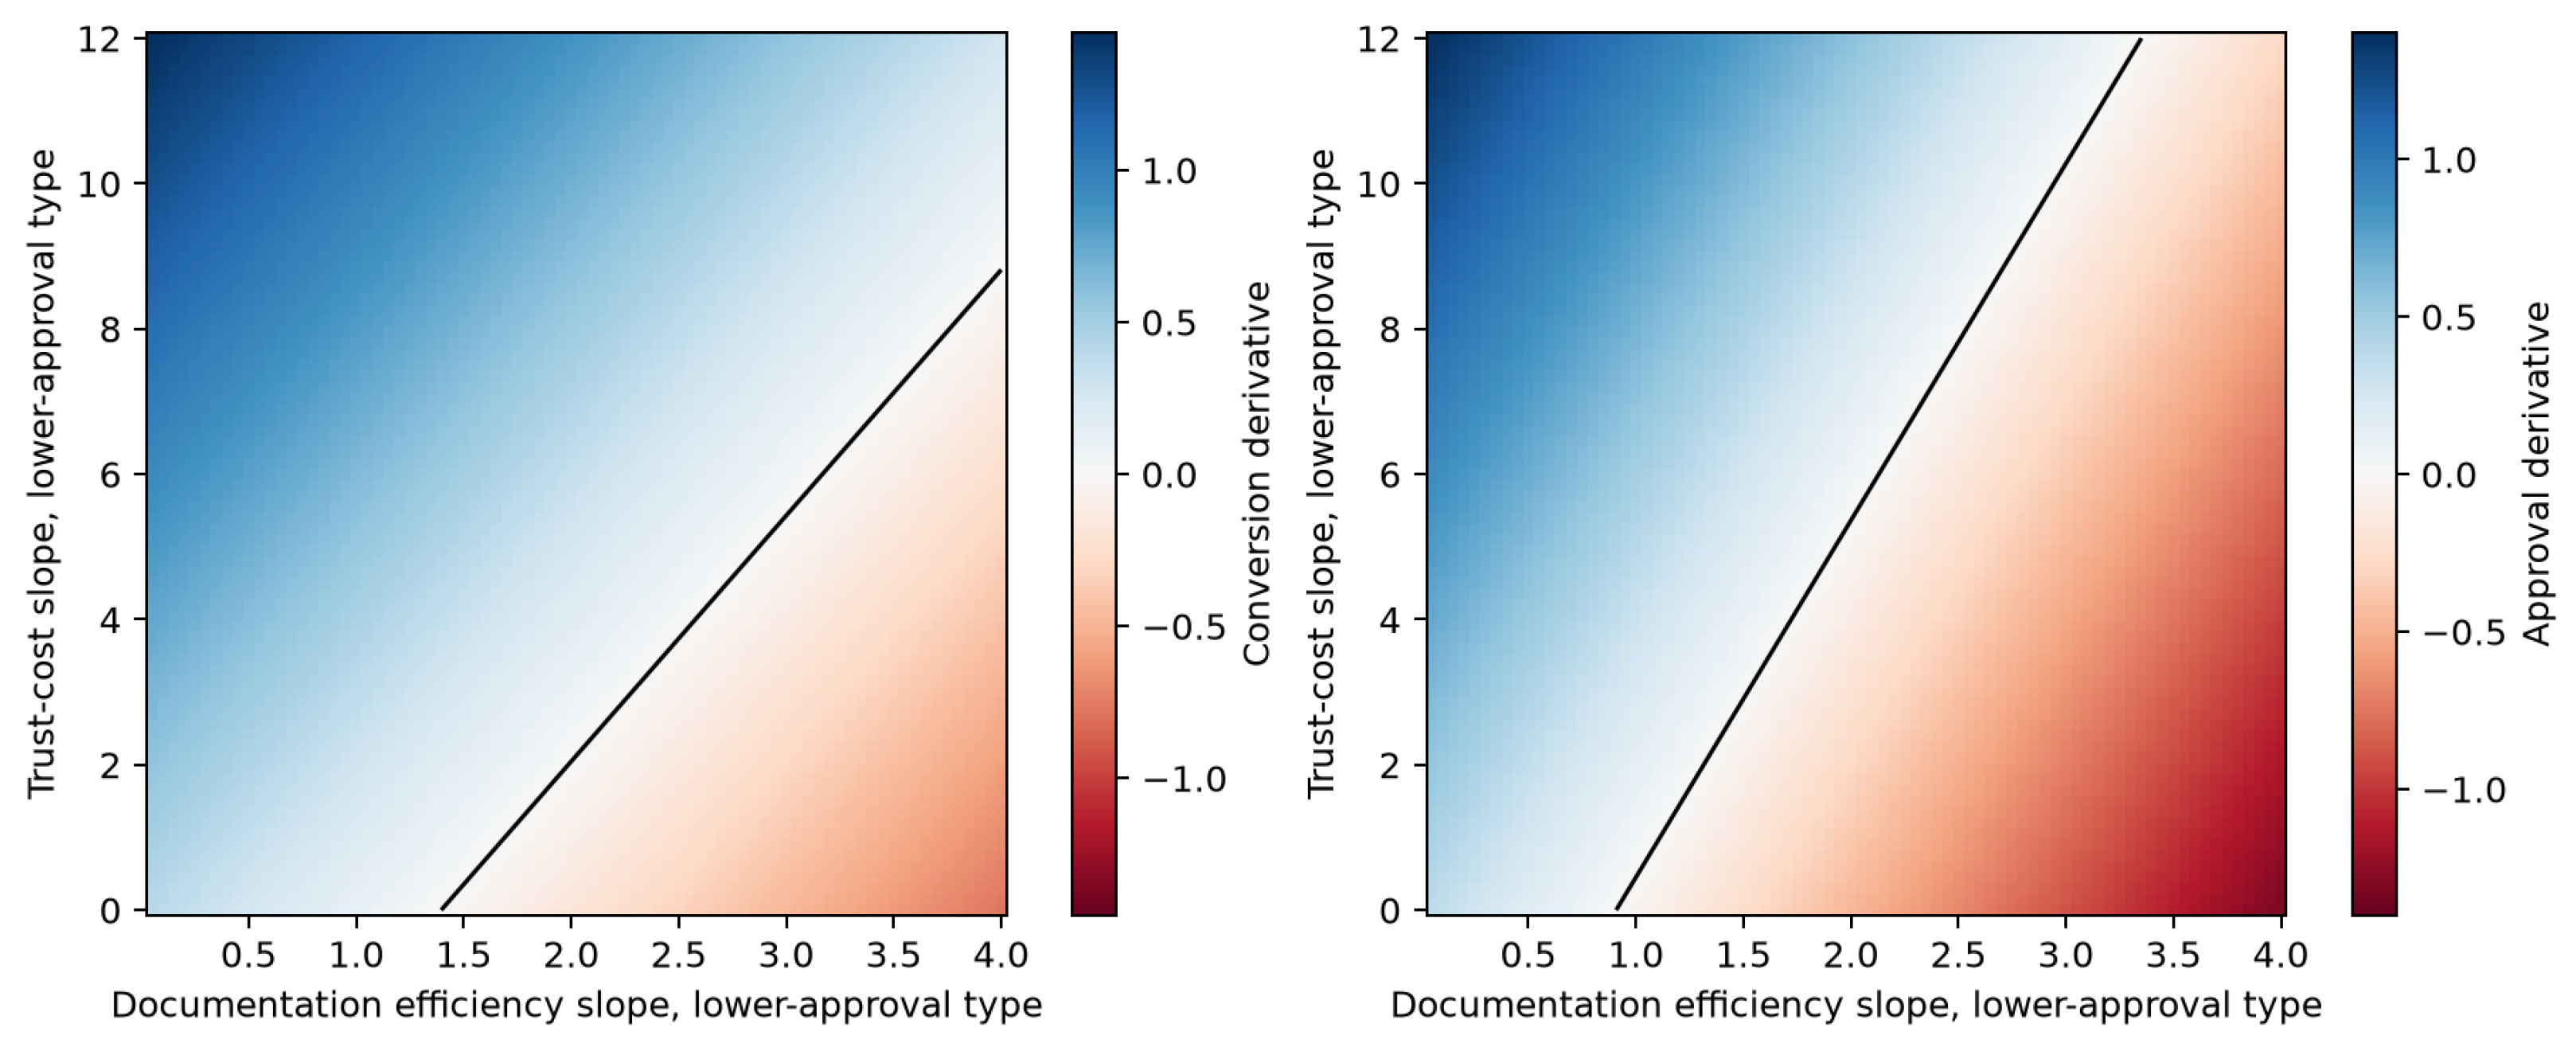
Figure A2.
A separate screening extension. With symmetric payoffs and repayment priors 0.2 and 0.8, better signals change approval in different directions while increasing conditional bank information value. Signal quality is varied separately from documentation assistance.
Appendix A.1. Perceived-Cost Timing and Generality of the Thresholds
The general perceived-cost component is anticipated at application. For a cost incurred only on continuation, instead let enter the documentation payoff with . Then,
The boundary term again vanishes because continuation payoff is zero at . Application growth remains , and funded-volume growth remains that expression plus at fixed approval and funding probabilities. Hence, the general entry/utility and volume thresholds retain their expressions in terms of and , but completion rises only when . A continuation-stage usage burden can offset the documentation saving. This is economically different from the ex ante perceived channel attribute; neither is inferred from recorded HMDA incompleteness. Numerical quadrature checks of Equation (A2) have maximum absolute error below .
Appendix A.2. Functional-Form Specifications and Parameterization
For Figure 1 and its associated sensitivity grid, documentation costs follow an exponential distribution with rate , where . Other parameters are , , , , , and , giving initial application shares 0.2. The documentation-intensity coefficients are . Four functions are crossed with each perceived-cost specification:
Perceived-cost functions are , , , and with , and . All are zero at . We evaluate 31 equally spaced intensities in with centered finite differences of step and separate numerical integration of the positive-part option. Threshold gaps, loan-volume derivatives and utility derivatives are checked directly; the non-monotonic burden’s zero-slope boundaries at and are checked separately. The continuation-stage cost check uses , , and exponential cost rate 0.7 at 40 intensities. These parameters illustrate local responses and are not fitted to HMDA or claimed to preserve numerical thresholds.
Appendix A.3. Classification Bounds
The exercise in Equation (17) requires and . Maintain that only the documented subset is ambiguous and that recorded approvals and other denials represent substantive decisions. With , define
For signs on , the sharp conditional bounds on the approval contrast are
For resolution, apply the sign choices to the ranges . Approval increases with its own fraction, since , whereas resolution decreases. Monotonicity places each minimizing or maximizing endpoint fraction at the appropriate corner. For approval, the corners are those in Equation (A4); resolution uses the reversed fraction assignments. The continuous image of the connected compact fraction rectangle is an interval, so these attained extrema are sharp under the maintained ambiguity restriction. Free fractions describe an allowed classification set.
With a common fraction, multiplying Equation (18) by produces a polynomial of degree at most three. Its real roots in give the zero crossings. Extrema additionally evaluate the roots of the rational derivative and both domain endpoints. Each of the four central purchase curves has one crossing and endpoint extrema. Evaluating stationary points allows the same procedure to handle other, non-monotone comparisons.
Appendix A.4. Sharp Ranges Under Bounded Spread
For a fixed ambiguity set, write with . Its derivative is nonnegative. Under Equation (19), every feasible vector lies in some with . At a fixed interval, monotonicity places each minimizing fraction at its lower endpoint for a positive contrast sign and at its upper endpoint for a negative sign. Maximizing reverses these choices. Hence, the sharp comparison-specific range is
The endpoint assignments attain the extrema and satisfy the spread restriction. The feasible fraction set is convex and compact: it is the intersection of with the inequalities . Its continuous contrast image is an interval. As grows, the feasible sets are nested, making L nonincreasing and U nondecreasing. At , the bounds reproduce the common-fraction extrema; at , they reproduce the unrestricted corner bounds. Sharpness is comparison-specific and conditional on the designated ambiguity set.
For an initially positive range, the smallest spread reaching zero solves ; for an initially negative range, it solves . Already ambiguous ranges have threshold zero. A strict-sign range at is classified as having no threshold in the domain. This threshold is the infimum at which zero is feasible. Numerical evaluation includes stationary points and endpoints over , using the declared tolerance.
Appendix B. Data Definitions and Empirical Specifications
Appendix B.1. Additional Technology Comparisons
Rocket’s 9 April 2024 announcement describes Rocket Logic as an AI document and workflow platform with underwriter oversight, reports February 2024 operational activity, and describes improvements measured from August 2022 [23]. Its supplementary operating-period comparison uses 2023–2024 against 2019–2021, omitting the transition year 2022. Ending the window in 2024 separates this comparison from the 2025 Redfin and Mr. Cooper acquisitions [24,25]. Table A1 summarizes the task and timing evidence for the three institutional cases.
loanDepot announced melloNow on 12 December 2023 following several quarters of beta testing. The issuer describes digital verification and conditional underwriting approval [26]. Its 2024–2025 versus 2019–2022 comparison supplies an automation benchmark. Each institutional comparison retains the task definition and operating window supported by its disclosures. Table A1 makes these distinctions explicit: Better’s application-facing assistance differs from Rocket’s document processing and loanDepot’s verification and conditional-underwriting tools. The dates are disclosure or operating milestones rather than common treatment-onset dates; the cases should not be interpreted as interchangeable exposures.
Table A1.
Documented lending technologies and comparison windows.
Appendix B.2. Relative Geographic Projections
For each product, define an incumbent footprint by positive lender applications in 2019. Within this footprint, we maintain zero-count cells where the reporting entity remains present; conditional ratios are estimated only with positive denominators. For lender l, county c and year t, the main specification is
The main years are 2019–2023 and 2025 with 2024 treated separately as a transition year. Fixed 2019 county-market application counts weight observations; alternative weights use baseline lender applications or equal cells. Lender–county effects absorb fixed local franchises, and county–year effects absorb shared local market movements. The national focal-period coefficient is evaluated on the fixed incumbent geographic footprint.
The coefficient is a relative conditional outcome projection around the documented operating period. Each fit has one focal reporting entity and 30 comparison entities. Lender-cluster CR1 standard errors with finite-sample references summarize residual dispersion in this descriptive projection. The inferential unit remains the institution; interpretation follows the distinction between overall cluster counts and treated-cluster support in MacKinnon and Webb [28]. We report the coefficient schedule as comparative evidence.
The sensitivity schedule varies reference periods, adds lender-specific linear trends, includes 2024 as a transition postperiod, requires 20 or 100 baseline local applications, changes weights, deletes each peer and includes a 2023 pseudo-event. It retains 328 supported coefficients and 140 specifications without baseline support. The latter are Better cash-out refinancing comparisons, reflecting the zero 2019 focal product footprint. National cash-out outcomes are reported separately on their application population.
Appendix B.3. Adjustment for the Composition of Recorded Pools
We extend the public extraction to reported income, loan amount, loan type and applicant age. Categories retain nonpositive or missing income, missing amount and exempt age instead of dropping those applications. The primary adjustment uses category shares: positive income up to USD 50,000, 50,000–100,000, 100,000–200,000, above 200,000, nonpositive and missing; positive loan amounts up to USD 150,000, 150,000–300,000, 300,000–600,000, above 600,000 and missing/nonpositive; conventional, FHA, VA, USDA and other loan types; and age below 35, 35–54, 55 or more and missing. One category per block is omitted. An additional approval adjustment includes reported DTI and combined loan-to-value (CLTV) categories, retaining their missing groups.
Each outcome uses the composition of its own denominator. Conversion and administrative resolution use applications, approval uses recorded decisions, and acceptance uses approvals. The category shares enter Equation (A7) with its sample, weights and fixed effects preserved; matched unadjusted estimates use the identical sample. These conditional projections describe the relationship between recorded-pool composition and outcomes. The empirical analysis is exploratory, and complete schedules preserve all supported specifications and baseline-support categories.
Appendix B.4. Comparison-Set Sensitivity and Observable Groups
Comparison-set checks preserve the original footprint, core shares, weights and geographic effects. For the main and recent windows, each of 30 peers is excluded in turn. Four additional sets divide the original peers at their median 2019 application count and median 2019 product share. These baseline distinctions evaluate sensitivity to scale and product emphasis. All deletion and subset results are retained.
National group projections complement geographic estimates. Income categories are positive income up to USD 50,000, 50,000–100,000, above 100,000, nonpositive and missing; loan types are conventional, government (FHA, VA and USDA), and other or missing. The joint fit stacks 15 crossed groups with separate supported focal-period coefficients and lender–group and year–group effects. Fixed weights use each group’s relevant 2019 stage denominator. Groups with a zero focal baseline denominator are recorded as outside the fit’s support.
The schedule uses 2019–2023 versus 2025, 2022–2023 versus 2025, 2024 versus 2025, and a 2023 pseudo-event based on 2019–2022. Higher-minus-low contrasts within type and government-minus-conventional contrasts within income use covariance from the same lender-clustered joint fit. An additional recent comparison fixes weights at 2024, extending support to government groups with applications in that year. Every group estimate and direct contrast retains its stated reference window and weights.
Annual Gap-Trend Sensitivity
A national diagnostic compares 2025 with 2023 and displays 2024 as the transition year. Its primary design fixes 2019 application weights among original peers with positive application pools in all eight years; purchases retain 29 peers. A secondary design pools all 30 original peers with annual application weights. Five-action probabilities are aggregated before deriving stage ratios. Appendix D reports point-level residual ranges under annual gap-drift restrictions calibrated to 2018–2023 historical changes. This population and window complement the common-2024-mix analysis. Rambachan and Roth [29] provide the formal motivation for distinguishing trend restrictions and statistical inference.
Appendix C. Supplementary Evidence and Robustness Checks
Appendix C.1. Disposition, Geography and Borrower Groups
Appendix C.1.1. Recent Purchases and the Choice of Reference Period
The recent purchase comparison separates recorded administrative resolution from conditional approval. After adjusting for measured applicant-pool shares, administrative resolution changes by percentage points, conditional approval by and conversion by relative to the selected peers (Table A2). The county footprint and weights remain fixed at 2019, so these projections describe incumbent local franchises. They are distinct from national growth that includes new counties and products.
Table A2.
Recent geographic projections with recorded-pool adjustment.
The longer-window purchase projections are points for core-adjusted resolution, for approval and for conversion; the resolution and conversion reference intervals include zero. Table A6, Table A7, Table A8 and Table A9 place these projections alongside the national dispositions and reference-period checks. Table A11 reports the complete adjustment schedule. Comparing these windows locates the recent stage pattern in its historical context.
Appendix C.1.2. The Joint Disposition Distribution
Table A3 compares coherent distributions of all five final outcomes. At the 2024 purchase application mix, origination probability rises by points and denial probability by . Approval not accepted changes by , withdrawal by and incompleteness by . Their sum is zero. Administrative resolution rises by , while approval conditional on administrative resolution falls by and acceptance changes by . Declining incomplete closures can therefore accompany both additional loans and additional denials; the reason partition below gives their documentation context.
Table A3.
Better-specific joint disposition changes at its 2024 application mix.
The purchase comparison retains 99.94% of earlier and 99.80% of later applications. Conversion’s log change splits exactly into resolution, approval and acceptance components (Appendix C.6). These are distributions of applications observed in each year, which are standardized to a common initial mix. The decomposition supplies an internally consistent comparison of the recorded lending stages.
The recent rate- and pooled-refinance distributions likewise combine rising resolution with falling approval. Reference-period comparisons retain their own common-support populations: 77.6% of 2025 purchase applications and 74.7% of 2025 rate-refinance applications lie on 2019 support with the latter retaining 56.7% of the earlier pool. Table A14 reports coverage alongside the stage changes, making each comparison’s target population explicit.
Appendix C.1.3. Geographic and Submission-Route Comparisons
Holding state and submission route fixed preserves the overall recent purchase directions: relative conversion , administrative resolution and approval points (Table A4). Better application coverage is 97.92% in 2024 and 94.34% in 2025. On exactly this restricted population, the national approval comparison is ; holding location and route fixed adds a further points. The county design retains only 72.17/63.96%, so its approval comparison concerns a narrower pool.
Table 9 decomposes the change in the approval comparison when geography is introduced. The state/route restriction changes the national comparison from to points, which is a -point population-support component; fixing state and route adds points. County support changes the national comparison to , which is a -point support component, with a further -point county adjustment. Thus, most of the additional county-level difference reflects the retained population. Coverage loss is reported separately for Better and peers at both endpoints; excluded applications receive no extrapolated outcome.
Table A4.
Location and submission-route purchase comparisons.
All 51,501 eligible Better applications across the selected products in 2023–2025 are directly submitted. State-and-route standardization therefore aligns the peer submission-route distribution with Better’s direct-application pool. This field describes the route of submission at the reporting institution; the institutional disclosures separately describe distribution partnerships.
Appendix C.1.4. Income Patterns Inside Loan Types
Table A5 tests whether an income-only account is sufficient. Within conventional purchase loans, standardized approval changes by points in the low-income pool, in the middle pool and in the higher pool. Administrative resolution rises in all three. Within government loans, approval increases by , and , respectively. Thus, the low–higher income difference remains inside conventional lending, while government-loan approval increases for higher-income applicants. All six conversion changes are positive.
Table A5.
Purchase outcomes within crossed income and loan-type pools.
The low-conventional pool contains 239 applications in 2024 and 305 in 2025; the low-government pool contains 87 and 178. The crossed results refer to these reported income and loan-type populations. Their distinct approval directions are evaluated jointly with administrative resolution, conversion and the documentation-denial sensitivity.
Joint national projections provide direct crossed-group contrasts (Appendix Covariance-Based Crossed Approval Contrasts). With 2019 stage weights, the recent higher-minus-low conventional approval contrast is points alongside a contrast in the 2023 pseudo-event. The separate 2024-weight comparison includes government groups and yields a higher-minus-low contrast of with positive approval projections for both groups. These designs distinguish the effect of the reference mix from the within-type income comparison.
State-and-route standardization gives conventional approval changes of , and points for low, middle and higher income. Assigning documentation-related denials to administrative-only resolution gives , and . The same measured groups therefore have distinct approval comparisons under the two classifications. Low-government state-and-route support retains 81.6/59.6% of applications and has a negative resolution change. Coverage and classification together define the subgroup interpretation.
Appendix C.1.5. What Changes with the Comparison Set?
Individual peer exclusions preserve the all-peer direction in all 18 product–window–stage comparisons (Table A12). The four baseline subsets separately evaluate the scale and product emphasis of the peer population. In the main purchase comparison, conversion ranges from points and administrative resolution from with approval negative throughout. Individual deletions and baseline subsets thus evaluate distinct features of the comparison population.
The recent purchase comparison is more consistent across these choices. Its core-adjusted conversion, completion and approval projections are , and points. Across peer subsets, completion remains in [6.36, 7.97] and approval in [−6.36, −5.28]. Rate-refinance approval and pooled-refinance conversion change sign across some recent subsets. The comparison across products and windows identifies where the recent purchase pattern is most consistent.
After partialling out the controls and geographic effects, Better’s cells account for 94.3–96.1% of the weighted residual focal-contrast variation across the 12 product–window–denominator fits; the largest individual peer share is 0.49%. This concentration characterizes the focal-versus-peer projection. Table A12 reports every peer deletion and baseline subset; Table A13 reports the national income-group projections and direct contrasts.
Appendix C.2. Recorded Outcomes and Reference-Period Comparisons
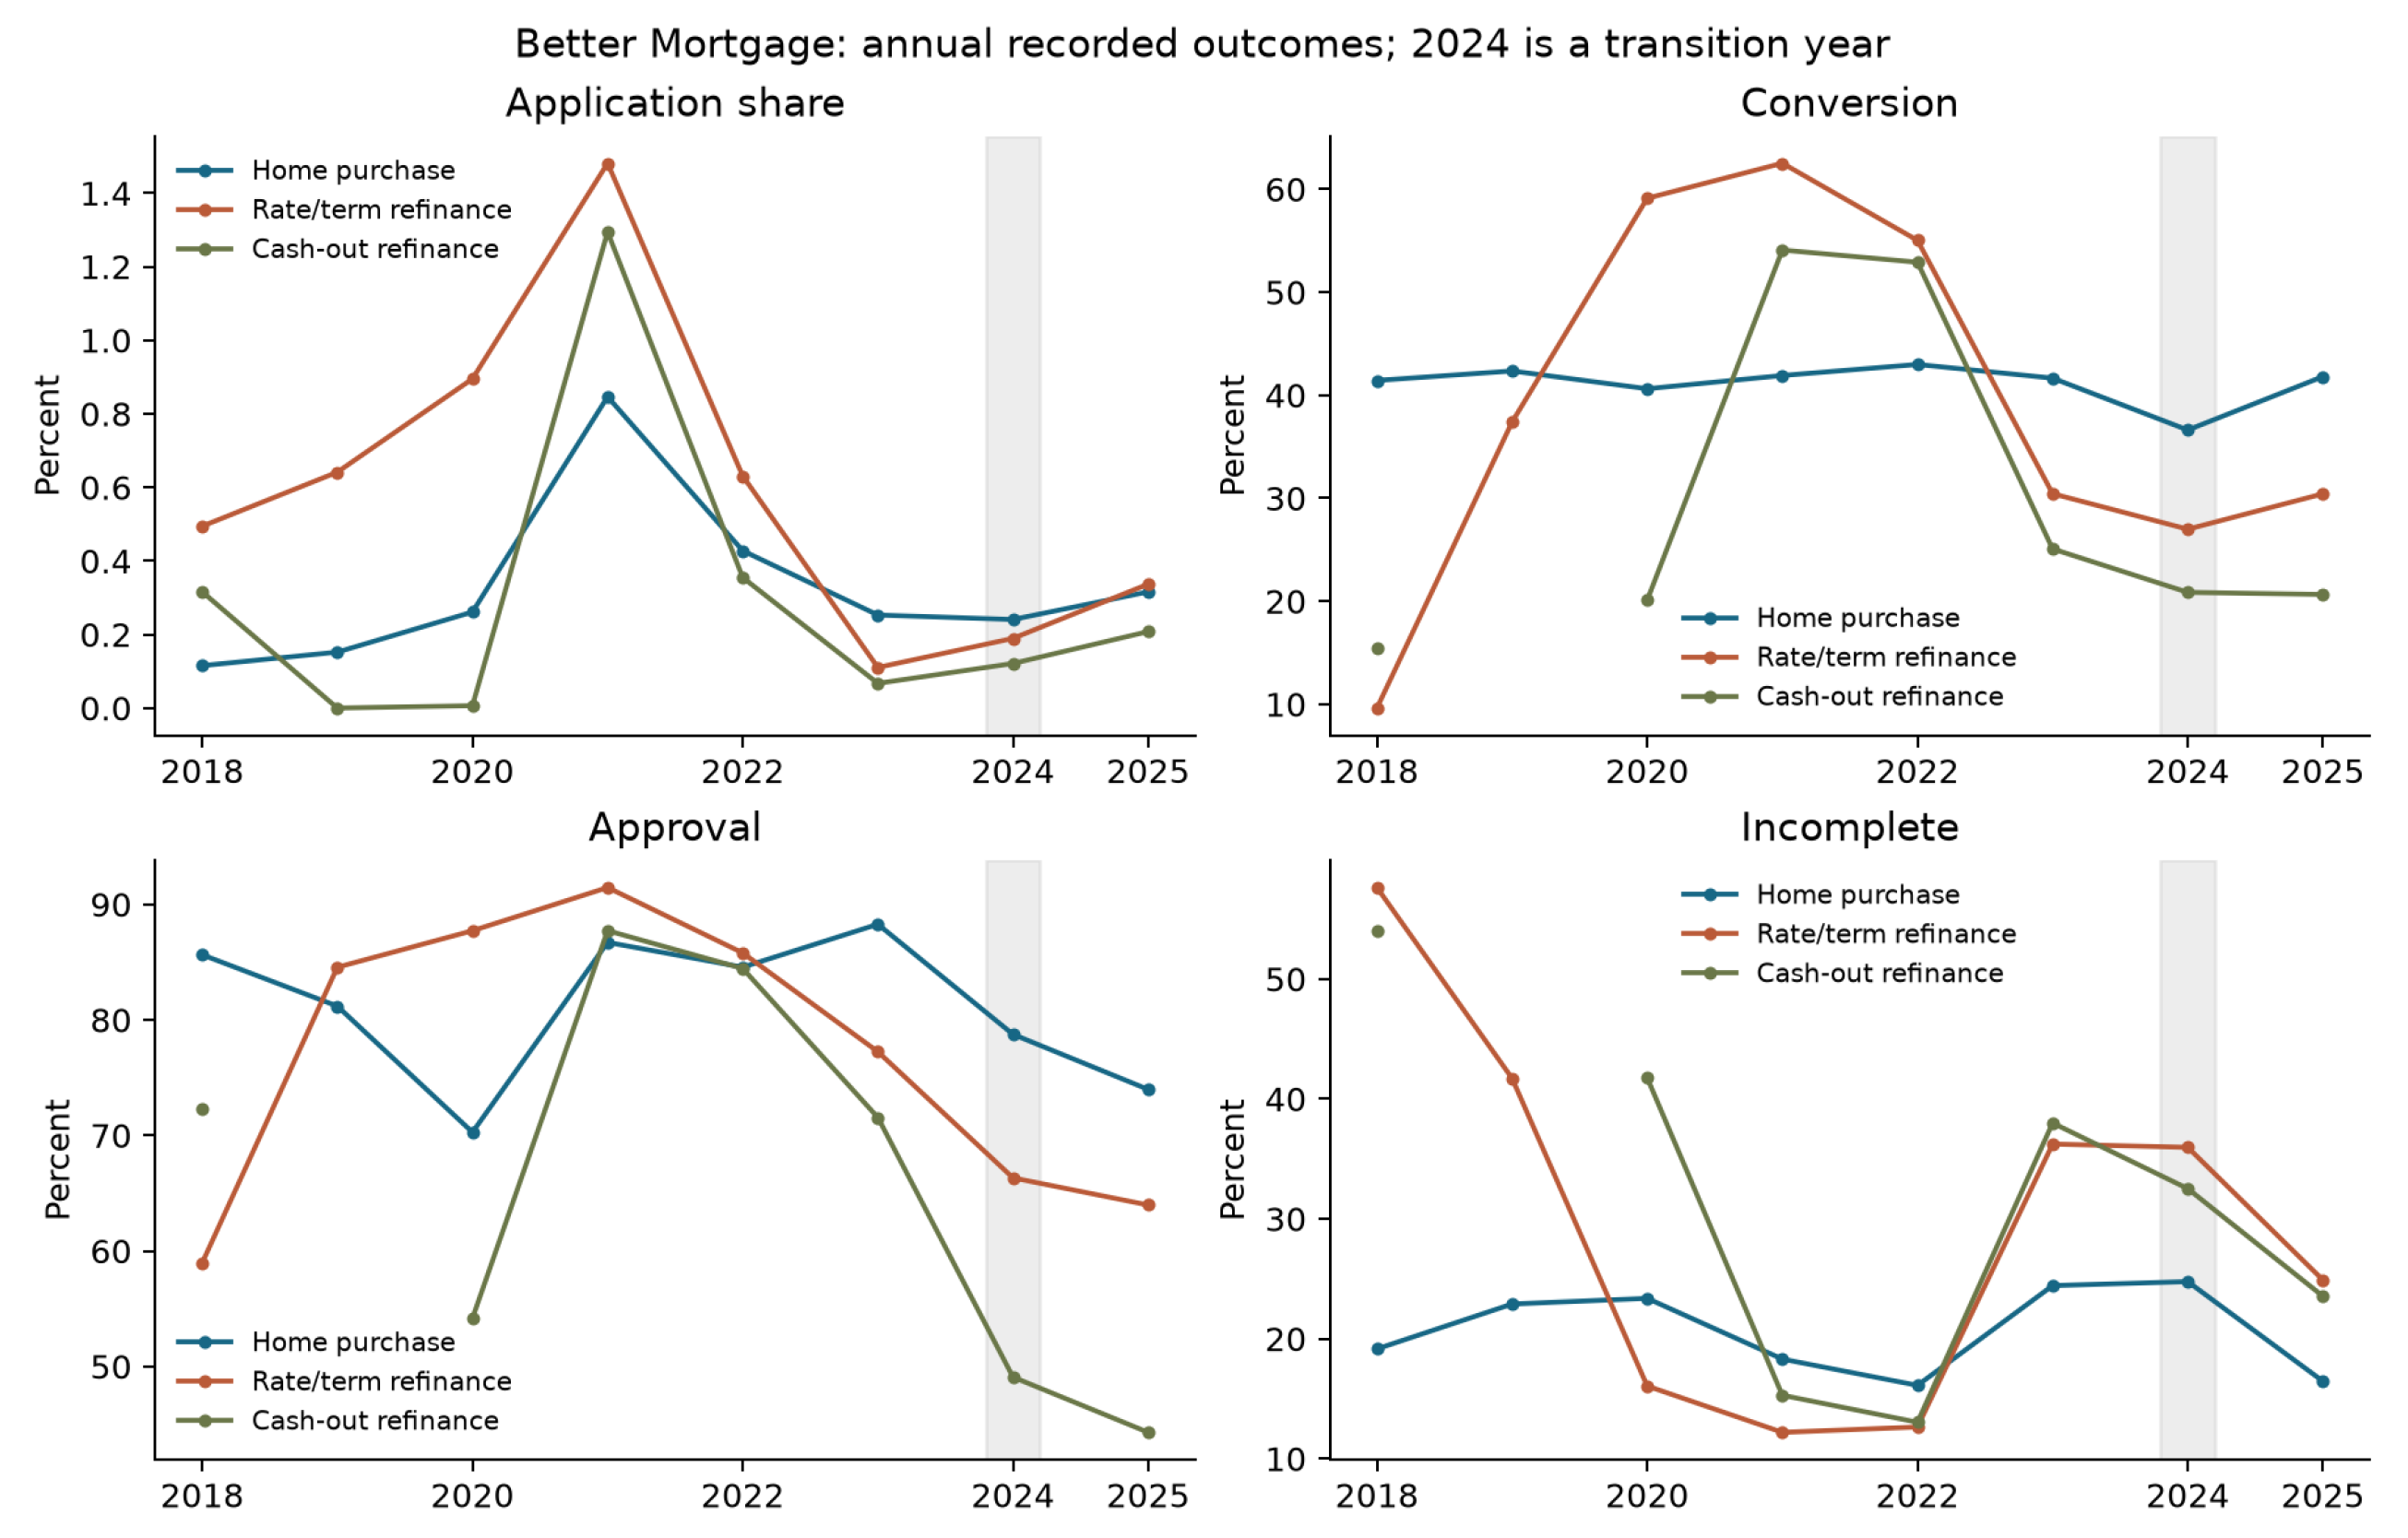
National annual outcomes include new geography and product entry, while geographic projections use the fixed incumbent county footprint. Table A6 shows that the longer-window purchase and rate-refinance coefficients differ in size, particularly for conversion; these coefficients describe incumbent counties rather than national expansion. Table A7 reports the corresponding national stage ratios: in purchases, applications rise from 9354 to 12,307 while conditional approval falls from 78.7% to 74.0% between 2024 and 2025. Table A8 examines how reference windows, trends and weights change the geographic comparisons, including a pseudo-event with no unique AI interpretation. Table A9 holds the samples fixed while controlling for the composition of each outcome’s own conditioning pool; the main purchase approval projection moves from to percentage points under core adjustment. Figure A3 displays annual trajectories over 2018–2025, making the earlier refinancing cycle and the missing 2019 cash-out application pool visible rather than assigning every movement to the later assistant rollout.
Table A6.
Better Mortgage relative outcome projections.
Table A7.
Better Mortgage national disposition ratios.
Table A8.
Scheduled Better Mortgage sensitivity estimates.
Table A9.
Main projections with recorded-pool composition adjustment.
Figure A3.
Better-specific annual recorded outcome ratios without standardizing to a common application mix or subtracting peers. Shading marks 2024 as the announcement transition period. Cash-out applications are zero in 2019; conditional-ratio gaps reflect the empty pool. Earlier refinancing movements and changing product participation are visible.
Appendix C.3. DTI Contrasts and Conditional-Pool Accounting
Product and DTI Contrasts
Purchase–refinance differences are estimated jointly with product-specific fixed effects and lender clustering. Additional exploratory DTI regressions compare reported DTI below 43 with DTI of at least 43, using lender–group and year–group effects and fixed 2019 decision weights. Missing and exempt DTI form separate count categories. Known-DTI fits describe applications with observed DTI.
DTI reporting varies across recorded stages. Better’s 2019 missing-DTI group contains withdrawals and incomplete files with zero administrative resolutions in the two primary products. We evaluate known-DTI groups on positive common decision support and calculate accounting ranges for empty-group approval probabilities in . The ranges partition an observed pooled change between within-group and composition terms.
Table A10 reports the exploratory DTI contrast schedule. For the main purchase window, the approval projection is points for reported DTI below 43 and points for DTI of at least 43; their direct difference is points. This is a within-reported-DTI comparison—not evidence that DTI causes a differential AI effect. Each conditional approval comparison uses applications with decisions and the stated DTI category; the reference year, denominator and product are shown explicitly.
Table A10.
Exploratory DTI approval projections and direct group differences.
For two endpoints, let and denote decision-pool weights and approval rates, with . The symmetric decomposition is
For a zero-decision group, the conditional approval probability ranges over . The within-group component is linear in these probabilities with nonnegative weights. Its minimum sets missing final probabilities to zero and missing initial probabilities to one; its maximum reverses these assignments. The composition range is the observed pooled change minus the within-group range. These attained assignments give sharp accounting ranges. Common-support calculations retain groups with decisions at both endpoints and report the resulting coverage.
Appendix C.4. Composition-Adjustment Sensitivity Schedule
Table A11 places the core-adjusted projections on a common reporting basis while varying the reference window and focal institution. In Better’s recent purchase window, resolution increases by points while conditional approval decreases by points; the older purchase benchmark shows a different conversion response. Rocket and loanDepot rows represent distinct documented technologies and periods rather than a replication of a common intervention.
Table A11.
Core-adjusted projections across periods and cases.
Appendix C.5. Peer and Observable-Group Sensitivity
Table A12 separates individual peer deletions from subsets formed using preperiod scale and product focus. Every deletion preserves the all-peer sign, whereas the main-window purchase conversion subset range includes zero, revealing dependence on which baseline institutions are included. Table A13 examines the separate national income-group projections: the main purchase approval contrast is points for lower-income applicants and for higher-income applicants, which is a -point direct difference within that specification. Neither comparison identifies individual responses to assistance.
Table A12.
Sensitivity to individual peer exclusions and baseline peer subsets.
Table A13.
National income-group projections and direct contrasts, purchases.
Appendix C.6. Joint-Disposition Support and Crossed Comparisons
Table A14 reports conversion, administrative resolution and conditional approval from one standardized five-action distribution for each product and baseline. For purchases, the 2024-to-2025 comparison shows , and percentage points, respectively. Earlier baselines retain different common-support populations; for example, the 2019 rate-refinance row has much lower application coverage and should not be interpreted as an identical-sample time series.
Table A14.
All national common-application endpoint comparisons.
For the recent purchase synthetic application pool, the log changes are C = 0.131325, R = 0.170685, Q = −0.043509, and T = 0.004149. The completion, approval and acceptance components sum to the conversion change at full precision. These are changes in the ratios derived from a single application distribution.
Covariance-Based Crossed Approval Contrasts
Table A15 reports direct higher-minus-low and government-minus-conventional approval contrasts from the joint fit. With 2024 weights, the higher-minus-low contrast is points for conventional loans and for government loans; this difference is conditional on the supported crossed groups rather than a comparison of identical borrowers. The 2019- and 2024-weight rows retain their respective baseline support and covariance calculations, and government-group contrasts without positive 2019 focal support are not supplied.
Table A15.
Purchase approval contrasts within income and loan type.
Appendix C.7. Submission Routes and Principal Denial Reasons
Table A16 distinguishes the frequency of reported principal reasons among denied applications from the application-weighted ambiguity probabilities used in the classification analysis. Among Better purchase denials, the union of codes 6 and 7 rises from 20.55% in 2024 to 58.47% in 2025, while the peer union is 21.56% and 19.29%, respectively. A denial can report multiple reasons, so the code-specific shares are not additive and cannot by themselves establish that the denial was administrative only.
Table A16.
Reported reasons among denied purchase applications.
The 2023–2025 extension contains 37,366,983 raw public records and 7,845,732 eligible applications among the 33 selected identities. County–product–action totals reconcile to the earlier aggregates. Better’s case uses its original 30 peers with Rocket and loanDepot retained as separate institutional comparisons. The full national peer schedule contains 576 comparisons: 284 with positive support and 292 outside common support. Location/route comparisons contain 149 supported and 145 unsupported slots. Two documentation definitions on those comparisons yield 298 supported rows and 290 unsupported slots. Actual loan-count accounting retains all 576 cohort–product–window–group combinations, including zero-denominator categories. The complete schedule provides the context for the displayed comparisons.
Documentation classification is an exploratory supplementary analysis with all products, groups and supported geographic comparisons retained. The replication materials record the definitions, aggregate count inputs and full output schedules.
Appendix D. Supplementary Classification and Reference-Period Analysis
Figure A4 plots the approval contrasts as the fraction of designated documentation-related denials reclassified as administrative-only varies from zero to one. The curves retain each design’s fixed common support: crossing the horizontal zero line signals sensitivity to the classification convention rather than a counterfactual causal treatment effect.
Figure A4.
Better-minus-original-30-peer measurement sensitivity for purchase lending, 2024–2025. The curves are relative changes rather than Better-specific changes or the 32-peer contrasts in the 33-entity exercise. Each curve fixes its previously defined common support and application weights and applies the same administrative-only fraction to documentation denials at all four lender–year endpoints. Dots indicate approval sign crossings. Reclassified resolution rises for all common fractions in these four comparisons; approval direction changes. Different curves describe different supported populations. Curves describe the stated classification scenarios—not statistical confidence intervals or causal effects.
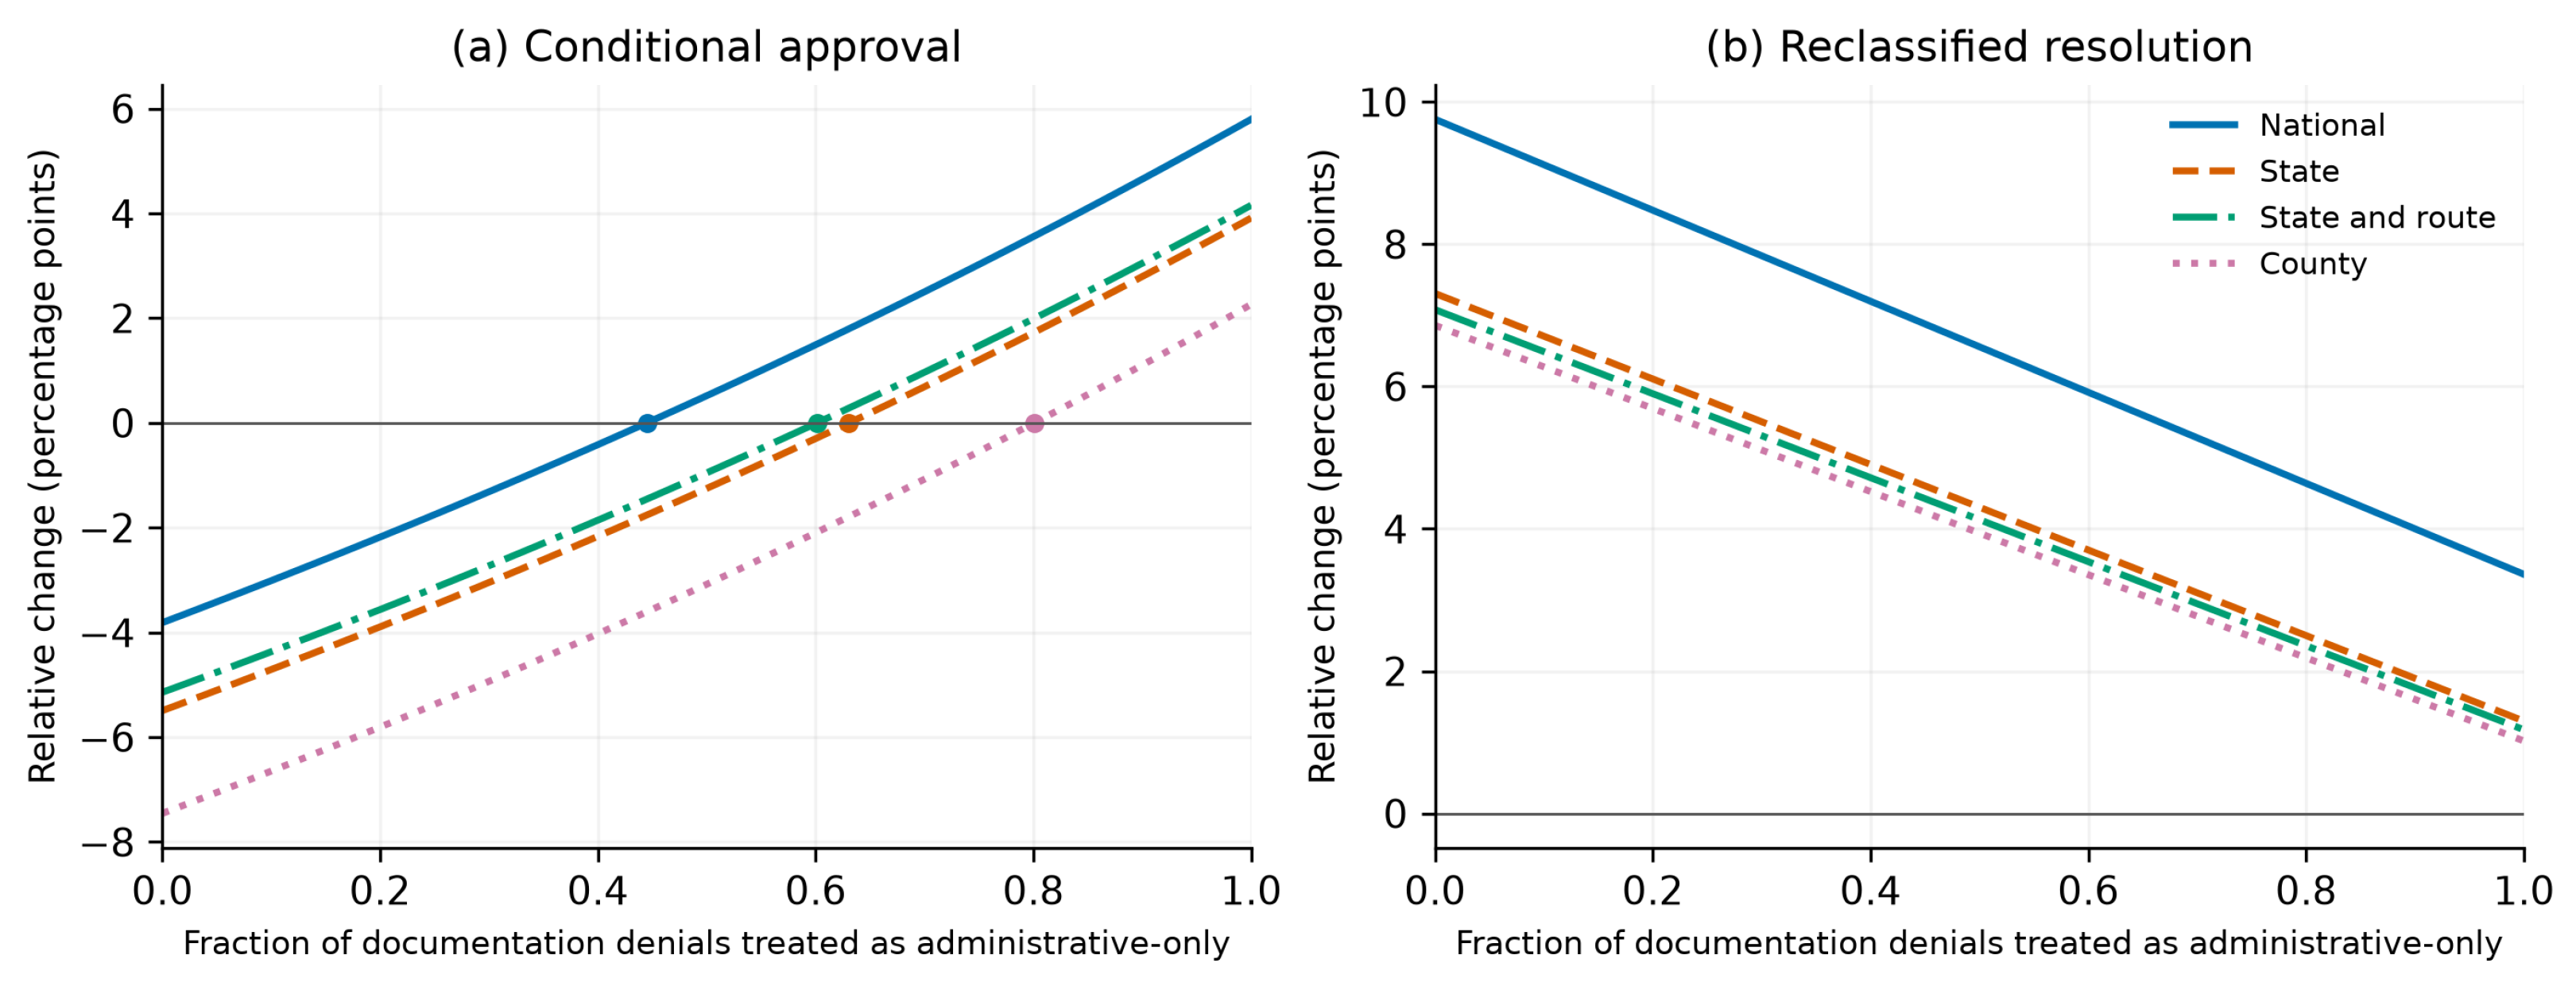
Analytical derivations appear in Appendix A. Table A17 gives the corresponding endpoint-sensitive purchase ranges under less restrictive four-population classifications together with code-7 crossing thresholds. The ranges can be wider than the common-fraction curves because endpoint-specific fractions are permitted; none is a sampling confidence interval.
The original classification schedule contains 298 supported reason-definition rows and 290 slots outside common support. Of the 298 rows, 279 have positive denominators throughout the classification interval; 19 are recorded as undefined at an endpoint. Zero approvals with positive decision denominators yield zero approval. Conditional ratios are computed only for their positive pools. Table A17 summarizes the main purchase ranges with all categories retained in the accompanying schedules.
Table A17.
Purchase sensitivity under less restrictive classification.
Appendix D.1. Annual Counterfactual-Gap Drift
Let denote the national Better-minus-peer outcome gap in percentage points, , and . For a hypothetical no-expansion gap , impose and for . The triangle inequality gives the point-level residual range
At , the residual range touches zero at . The parameter M specifies allowed annual drift relative to historical gaps. The reported intervals are point-level residual ranges under that drift restriction, which are evaluated separately from the classification analysis. They follow from the triangle inequality; additional feasible-probability restrictions can tighten them.
Table A18 evaluates Equation (A9) at specified restrictions on annual no-expansion gap drift. For example, at , the displayed intervals for purchase conversion, resolution and approval each contain zero, so the sign cannot be determined from this trend restriction alone. These are sensitivity ranges conditional on the chosen drift parameter—not estimated causal effects or statistical confidence intervals.
Table A18.
National purchase gaps under annual drift restrictions.
The schedule retains 18 design–product–outcome contrasts and 90 restriction-grid slots. Twelve calibrations have positive baseline support; six cash-out calibrations are recorded as undefined, reflecting the zero 2019 focal application pool. The pooled-original-peer purchase ranges reach zero at , and for conversion, resolution and approval. Table A18 reports the fixed-weight purchase design and its historical calibration.
Appendix D.2. Selected-Cohort Comparisons and Coverage
The 2023–2025 cohort contains 7,845,732 eligible applications collapsed to 16,255 national entity–year–product–income–amount–type cells. Denial reasons cover every denied application in the selected cohort. Each application enters a matching reason set once. Table A19 summarizes the common- and free-fraction results across products and windows. In recent purchases, seven of the 33 entities admit both signs with a common fraction; permitting independent endpoint fractions expands the count to 29. This large difference shows why assumptions about classification consistency must accompany any statement about the direction of the approval contrast.
All 528 original union/reason-7 comparisons have positive approval denominators throughout their classification domains. For recent purchases, the minimum four-population coverage is 65.1%. Table A20 applies an 80% minimum in each population and retains every primary union-definition crossing: 30 purchase comparisons remain in 2024–2025, including all seven common-union sign reversals. Coverage restrictions change the comparison population—not the fractions assigned to the eligible denial sets. The full schedule reports all 33 original entities.
Table A19.
Direction of peer-relative approval changes across selected entities.
Table A20.
Classification sensitivity with at least 80% coverage in every population.
Table A21 reports all individual recent purchase comparisons using 2019 reporting names and fixed LEIs. Each entity has its own initial mix and pooled peers, so magnitudes are not computed on a universal common application population. The endpoint contrasts and crossing fraction should be read alongside the minimum coverage and the independent-fraction extrema. A dash in the crossing column marks a strict-sign comparison over the domain. The six sign reversals other than Better have small endpoint magnitudes, motivating the magnitude grid in Table A23.
Table A21.
Individual purchase comparisons, 2024–2025.
The common-fraction calculations evaluate all stationary points and endpoints; unrestricted calculations evaluate their attaining fraction corners. The replication materials include independent high-precision checks of standardized probabilities, extrema and crossings.
Appendix D.3. Observed Reason Combinations
The documentation-reason categories are disjoint and exhaustive. Strict reason-7-only denials report code 7 and no other reason; the remaining documentation-only subset reports code 6 with or without 7. Mixed documentation denials also report a credit-related or other principal reason. Table A22 gives their actual-count shares, while the approval comparisons use common application weights. In the selected 33-entity all-product cohort, 88.48% of documentation-related denials in 2024 report only codes 6/7 versus 10.44% co-reporting codes 1–5 or 8. This observed distinction motivates the narrower ambiguity set; it does not determine whether any specific denial should be treated as administrative.
Table A22.
Co-reported reasons among documentation-related denials.
Appendix D.4. Classification Spread and Magnitude
For the union definition, 22 of 26 initially strict-sign purchase comparisons reach zero at a finite spread; four retain their strict direction throughout the domain. The median among the finite-threshold cases is 10.7 percentage points. For documentation-only denials, 21 of 26 have finite thresholds and five retain their strict direction; the finite-threshold median is 17.3 points. These conditional medians use the finite-threshold subset. Table A23 reports directional and magnitude summaries over the full spread grid.
Each fraction uses its selected denial-subset denominator. A narrower reason set changes that denominator differently across populations. Within a fixed definition, ranges are nested as the allowed spread grows. Across definitions, unrestricted documentation-only ranges are contained in unrestricted union ranges; common-fraction and intermediate-spread ranges may cross because equal fractions impose different restrictions. In recent purchases, six reversal entities are shared and Rocket replaces Newrez under the narrower set.
Table A23 reports not only whether the feasible approval contrast crosses zero but also whether its range extends beyond specified symmetric magnitude thresholds. For the any-6/7 definition, allowing a five-percentage-point spread raises the recent purchase both-sign count from seven to 12; at a ten-point spread, it rises to 16. Magnitude columns prevent a marginal zero crossing from being mistaken for a large substantive contrast.
Table A23.
Purchase direction and magnitude over the spread grid.
Appendix D.5. Replication Coverage and Release-Vintage Accounting
AI-Assisted Preparation
ChatGPT (OpenAI) was used in developing and checking analysis code, examining theoretical derivations, and drafting and revising text. The underlying model versions were not systematically retained. Empirical observations were obtained from the cited public sources; reported results are computed by the supplied programs from those public records.
The exact archived release is version 1.0.1 (29 October 2026), DOI https://doi.org/10.5281/zenodo.23750651 [27]. The record-description reproduction map and the archived README.md and TABLE_COVERAGE.md distinguish numerical reconstruction from figure rendering and identify executable scripts and aggregate inputs. The versioned replication package contains a master driver, environment requirements, a public-source acquisition guide, exact raw-file hashes, all exclusion rules, the 2019 ranking and continuous-TS selection algorithm, annual LEI/name mappings, aggregate inputs, principal-table estimators and the full classification schedule. The raw rebuild takes LAR and TS CSV files directly rather than requiring a prior lender–county panel. The recent national reason cells and county–route–action counts reconcile independently, and principal common-mix estimates agree to below percentage points. All 7392 conditional measurement ranges and 705 finite nonzero critical spreads have independent numerical validation. Tolerances, optimization checks, synthetic cases and software versions are included.
The eight archived releases contain 138,174,454 records and 79,809,983 eligible residential applications. In the archived 2018 vintages, TS includes five reporting identities with a combined 549 applications absent from that LAR file; none belongs to the selected cohort. The rebuild records this release discrepancy without synthesizing observations or changing the frozen cohort. Later selected-count and TS checks reconcile. Source version identifiers and hashes matter because a subsequently revised public release can differ from an archived one.
The principal replay reconstructs standardized stage comparisons, original-peer classification endpoints, all selected-cohort ranges, coverage decompositions, denial diagnostics and the new functional-form figure. Separate isolated replays reproduce 408 historical geographic-regression rows and the outputs of 17 further analysis modules, including composition, peer, subgroup and denial-classification checks. These replays preserve the original populations and descriptive inference; the coverage inventory documents each calculation. Aggregate files contain no direct borrower identifiers; original public HMDA records remain at the cited source. The package distinguishes original public sources, supplied aggregate inputs and executable analysis code; access is specified in the Data Availability Statement.
The complete schedule retains the standardized populations and positive endpoint denominators for all 1056 comparisons.
References
- Berg, T.; Fuster, A.; Puri, M. FinTech Lending. Annu. Rev. Financ. Econ. 2022, 14, 187–207. [Google Scholar] [CrossRef] [Scilit]
- Fuster, A.; Plosser, M.; Schnabl, P.; Vickery, J. The Role of Technology in Mortgage Lending. Rev. Financ. Stud. 2019, 32, 1854–1899. [Google Scholar] [CrossRef] [Scilit]
- Buchak, G.; Matvos, G.; Piskorski, T.; Seru, A. Fintech, Regulatory Arbitrage, and the Rise of Shadow Banks. J. Financ. Econ. 2018, 130, 453–483. [Google Scholar] [CrossRef] [Scilit]
- Fuster, A.; Goldsmith-Pinkham, P.; Ramadorai, T.; Walther, A. Predictably Unequal? The Effects of Machine Learning on Credit Markets. J. Financ. 2022, 77, 5–47. [Google Scholar] [CrossRef] [Scilit]
- Liu, X. Artificial Intelligence and Customer Acquisition in Retail Financial Services: Experimental Evidence From Insurance Distribution. Working Paper, 2024. Available online: https://www.udel.edu/content/dam/udelImages/star/fintech-innovation-hub/XingLiu_AI_Insurance_20240407.pdf (accessed on 10 October 2026).
- Brynjolfsson, E.; Li, D.; Raymond, L.R. Generative AI at Work. Q. J. Econ. 2025, 140, 889–942. [Google Scholar] [CrossRef] [Scilit]
- Yetiş, Z. What Denial Rates Cannot See: Four Measurement Boundaries in the HMDA Record. SSRN Work. Pap. 2026. [Google Scholar] [CrossRef] [Scilit]
- Bhutta, N.; Hizmo, A.; Ringo, D. How Much Does Racial Bias Affect Mortgage Lending? Evidence from Human and Algorithmic Credit Decisions. In Finance and Economics Discussion Series 2022-067; Board of Governors of the Federal Reserve System: Washington, DC, USA, 2022. [Google Scholar] [CrossRef] [Scilit]
- Stiglitz, J.E.; Weiss, A. Credit Rationing in Markets with Imperfect Information. Am. Econ. Rev. 1981, 71, 393–410. [Google Scholar]
- Acquisti, A.; Taylor, C.; Wagman, L. The Economics of Privacy. J. Econ. Lit. 2016, 54, 442–492. [Google Scholar] [CrossRef] [Scilit]
- Dietvorst, B.J.; Simmons, J.P.; Massey, C. Algorithm Aversion: People Erroneously Avoid Algorithms after Seeing Them Err. J. Exp. Psychol. Gen. 2015, 144, 114–126. [Google Scholar] [CrossRef] [Scilit] [PubMed]
- Logg, J.M.; Minson, J.A.; Moore, D.A. Algorithm Appreciation: People Prefer Algorithmic to Human Judgment. Organ. Behav. Hum. Decis. Process. 2019, 151, 90–103. [Google Scholar] [CrossRef] [Scilit]
- Train, K.E. Discrete Choice Methods with Simulation, 2nd ed.; Cambridge University Press: Cambridge, UK, 2009; Available online: https://eml.berkeley.edu/books/choice2.html (accessed on 10 October 2026).
- Consumer Financial Protection Bureau. Regulation B, Section 1002.9: Notifications; Official Interpretations of 9(a)(1), Comments 3–4. Available online: https://www.consumerfinance.gov/rules-policy/regulations/1002/9/ (accessed on 29 October 2026).
- Consumer Financial Protection Bureau. Public LAR Schema, 2026. Available online: https://ffiec.cfpb.gov/documentation/publications/loan-level-datasets/public-lar-schema (accessed on 10 October 2026).
- Consumer Financial Protection Bureau. Loan/Application Register Data Fields, 2026. Available online: https://ffiec.cfpb.gov/documentation/publications/loan-level-datasets/lar-data-fields (accessed on 10 October 2026).
- Better Home & Finance. Better.com Launches Betsy, the First Voice-Based AI Loan Assistant for the US Mortgage Industry, 2024. 17 October 2024. Available online: https://investors.better.com/2024-10-17-Better-com-launches-Betsy,-the-First-Voice-Based-AI-Loan-Assistant-for-the-US-Mortgage-Industry (accessed on 10 October 2026).
- Better Home & Finance. Q4 2024 Investor Update, 2025. March 2025. Available online: https://s202.q4cdn.com/797572621/files/doc_financials/2024/q4/BETR-Q4-2024-Earnings-Supplement_vFinal.pdf (accessed on 10 October 2026).
- Better Home & Finance. Better Home & Finance Holding Company Announces First Quarter 2025 Results, 2025. 12 May 2025. Available online: https://www.sec.gov/Archives/edgar/data/1835856/000162828025024900/betrearningsrelease_2025-q.htm (accessed on 10 October 2026).
- Better Home & Finance. Better Marks One-Year Partnership with NEO Home Loans, 2026. 22 January 2026. Available online: https://investors.better.com/2026-01-22-Better-Marks-One-Year-Partnership-with-NEO-Home-Loans (accessed on 10 October 2026).
- Better Home & Finance. Third-Quarter 2025 Earnings Call, 2025. 13 November 2025; Company-Hosted Transcript Prepared by S&P Global Market Intelligence. Available online: https://s202.q4cdn.com/797572621/files/doc_financials/2025/q3/Better-3Q2025.pdf (accessed on 10 October 2026).
- Better Home & Finance. ElevenLabs and Better.com Showcase Success of AI Loan Agent, Betsy, at Scale in Financial Services, 2026. 25 February 2026. Available online: https://investors.better.com/2026-02-25-ElevenLabs-and-Better-com-Showcase-Success-of-AI-Loan-Agent,-Betsy,-at-Scale-in-Financial-Services (accessed on 10 October 2026).
- Rocket Companies. Rocket Companies Introduces Rocket Logic AI Platform to Make Homeownership Faster and Easier, 2024. 9 April 2024. Available online: https://ir.rocketcompanies.com/news-and-events/press-releases/press-release-details/2024/Rocket-Companies-Introduces-Rocket-Logic-AI-Platform-to-Make-Homeownership-Faster-and-Easier/default.aspx (accessed on 10 October 2026).
- Rocket Companies. Rocket Companies Completes Acquisition of Redfin, 2025. 1 July 2025. Available online: https://www.rocketcompanies.com/press-release/rocket-companies-completes-acquisition-of-redfin/ (accessed on 10 October 2026).
- Rocket Companies. Rocket Companies Closes Acquisition of Mr. Cooper, 2025. 1 October 2025. Available online: https://www.rocketcompanies.com/press-release/rocket-companies-closes-14-2-billion-acquisition-of-mr-cooper/ (accessed on 10 October 2026).
- loanDepot. loanDepot Introduces New Digital Underwriting Engine That Delivers Conditional Loan Approval in Minutes, 2023. 12 December 2023. Available online: https://media.loandepot.com/news-releases/press-release-details/2023/loanDepot-Introduces-New-Digital-Underwriting-Engine-That-Delivers-Conditional-Loan-Approval-in-Minutes/default.aspx (accessed on 10 October 2026).
- Ding, D.; Ding, Q.; Li, Y.; Neo, P.L.; Wang, Z. Replication Data and Code for AI Assistance in Mortgage Lending: Completion, Selection, and Credit Decisions, Version 1.0.1; Zenodo: Genève, Switzerland, 2026. [Google Scholar] [CrossRef]
- MacKinnon, J.G.; Webb, M.D. The Wild Bootstrap for Few (Treated) Clusters. Econom. J. 2018, 21, 114–135. [Google Scholar] [CrossRef] [Scilit]
- Rambachan, A.; Roth, J. A More Credible Approach to Parallel Trends. Rev. Econ. Stud. 2023, 90, 2555–2591. [Google Scholar] [CrossRef] [Scilit]
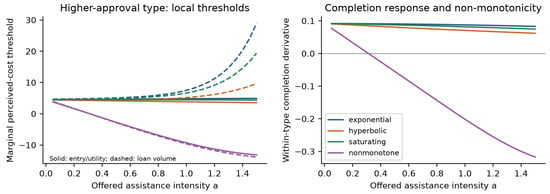
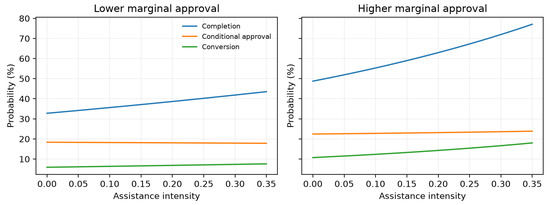
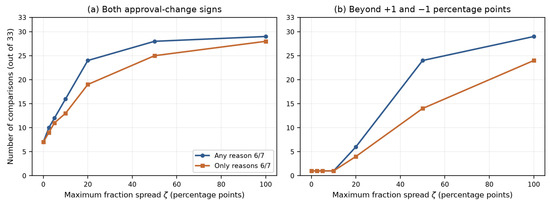
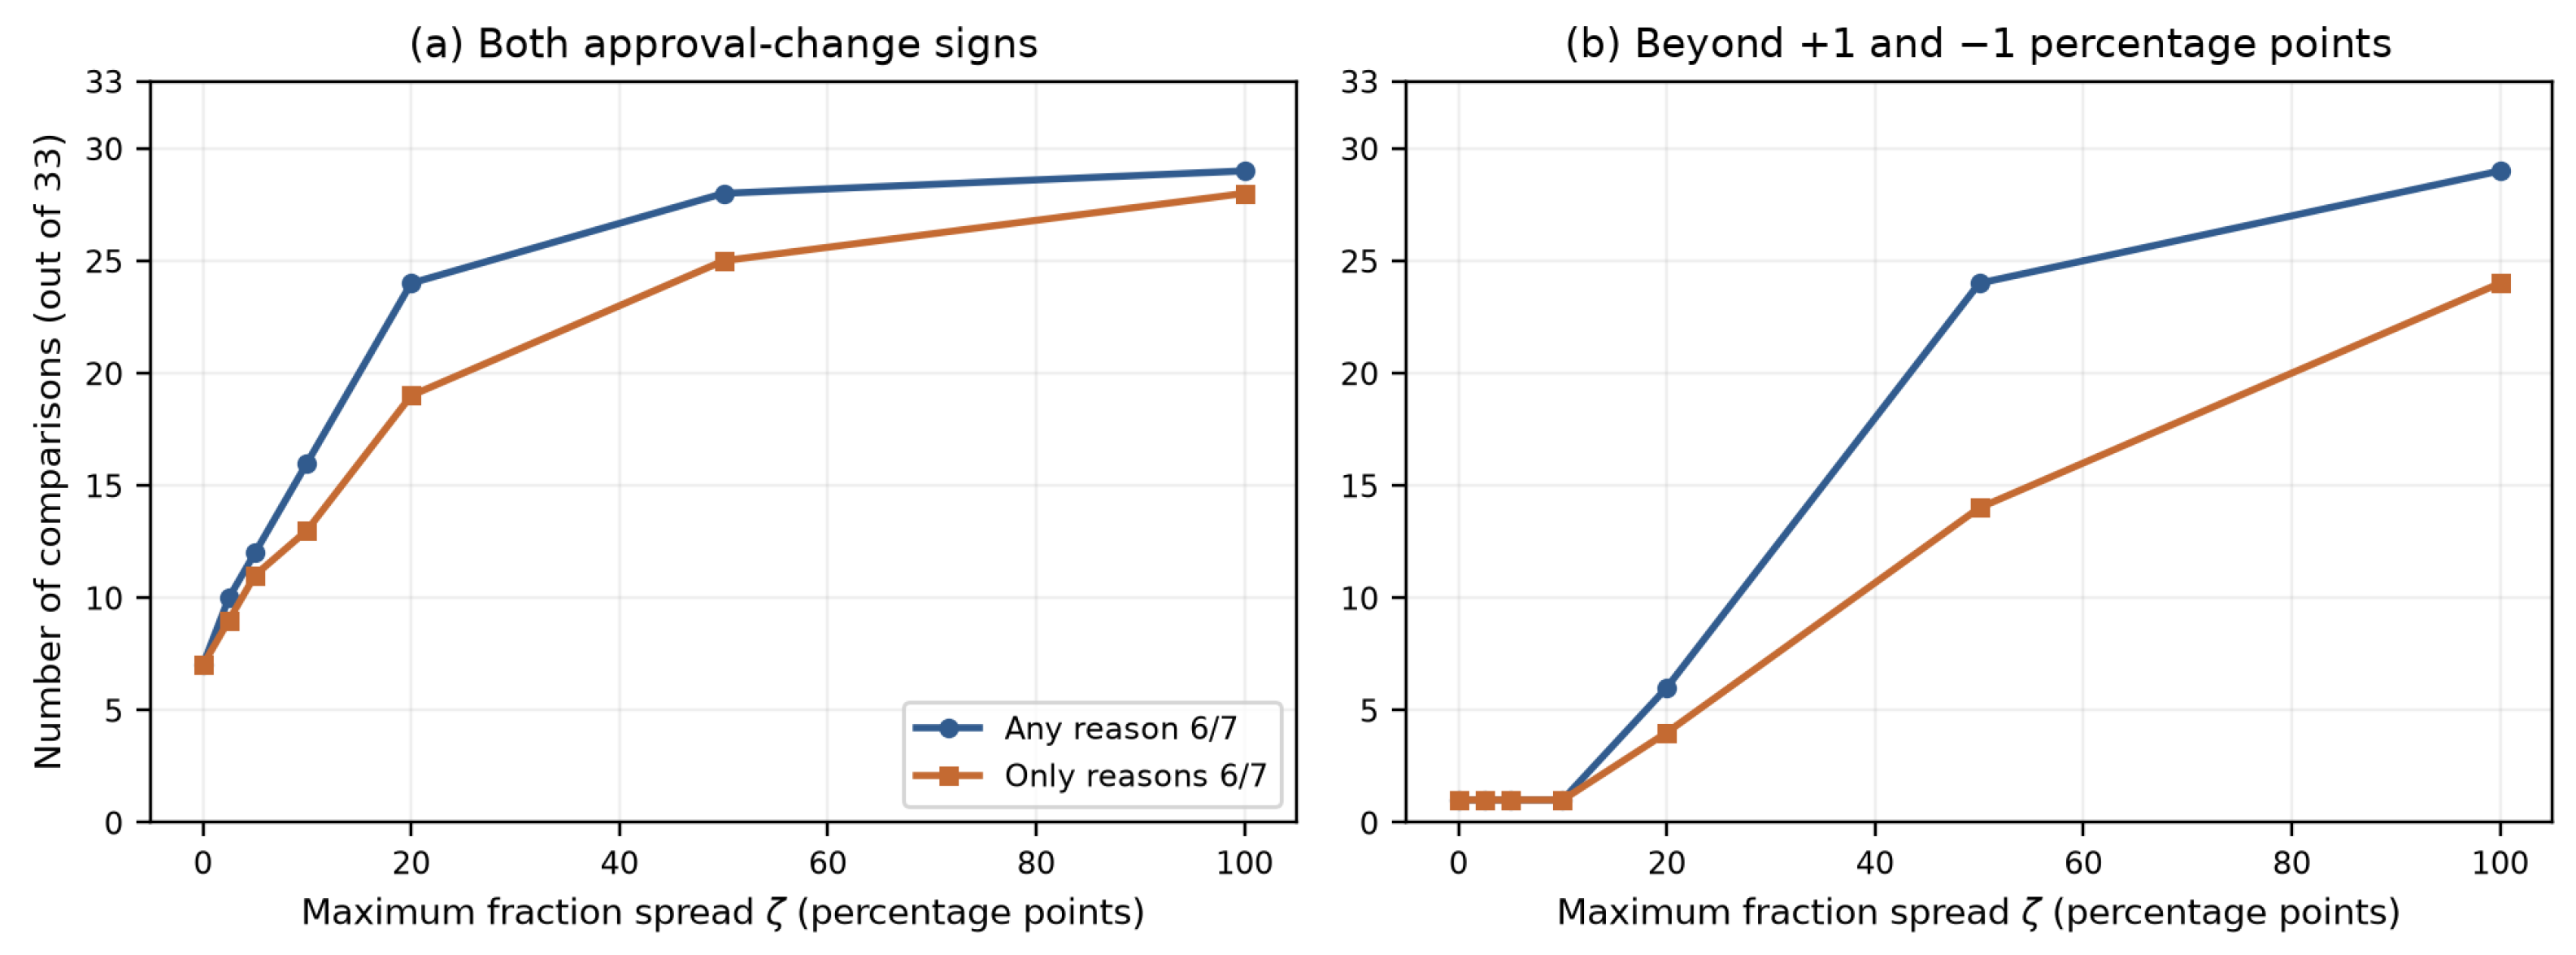

Disclaimer/Publisher’s Note: The statements, opinions and data contained in all publications are solely those of the individual author(s) and contributor(s) and not of MDPI and/or the editor(s). MDPI and/or the editor(s) disclaim responsibility for any injury to people or property resulting from any ideas, methods, instructions or products referred to in the content. |
© 2026 by the authors. Licensee MDPI, Basel, Switzerland. This article is an open access article distributed under the terms and conditions of the Creative Commons Attribution (CC BY) license.