


Abstract
Background: Wheat (Triticum aestivum L.) seedling performance under heat and drought stress is critical for crop establishment. Identifying cultivars with superior seedling vigor under stress conditions helps breeding programs and seed production systems. Methods: We aimed to evaluate the early growth performance of wheat seedlings from 28 Brazilian commercial cultivars under heat and osmotic stress. Seedlings were assessed through shoot and root lengths and dry weight and analyzed using Scott–Knott grouping, heritability estimates, PCA and stress tolerance index. Results: Osmotic stress affected a wider range of traits than heat stress and revealed phenotypic and genetic variability among cultivars. Root length and root dry weight exhibited high broad-sense heritability, indicating a substantial genotypic contribution under the tested conditions and supporting their use for early-stage screening. Multivariate analyses revealed contrasting adaptation strategies, including root elongation and preferential allocation of biomass to roots under stress conditions. Through uni- and multivariate analyses, we suggested cultivars are potentially tolerant to heat and osmotic stresses. Conclusions: Root-related traits proved to be the most informative indicators of adaptation to stress, and the integration of stress tolerance indices and multivariate analyses enabled the identification of promising cultivars for further validation under greenhouse and field conditions.
1. Introduction
Wheat (Triticum spp.) is a cereal of great importance in human nutrition, playing a major role in food security by providing nutrients to more than 35% of the world’s population [1]. Wheat is an important source of dietary protein, containing approximately 13% protein, which is higher than that of most major cereal crops. Wheat has an equally significant socioeconomic impact, with world trade estimated at US$50 billion, thus supporting millions of farmers and strengthening national economies through trade and employment [1]. In Brazil, wheat production represents an important component of national agriculture, with a gross production value estimated at over US$2 billion annually [2]. Wheat is mainly grown in the Brazilian southern region, and more recently in the Cerrado, an area with high temperatures and prolonged drought periods [3].
Given the global importance of wheat, the influence of climatic events affects productivity and impacts food security. The occurrence of heat waves and drought events in wheat-producing regions affects crop establishment and early seedling development, compromising both yield and the harvestable fraction of wheat, reducing productivity by approximately 8% [4]. Current global wheat harvests are already showing a 10% reduction due to current environmental conditions [5]. Projections indicate that yield losses caused by heat stress in wheat will increase by approximately 32% by 2050 and by 77% by 2090 [6]. The greatest impact on wheat productivity caused by drought and heat events is associated with their occurrence during germination and early seedling development, affecting crop establishment and plant stand [7].
In this context, climate is a key factor in wheat development and productivity. Wheat exhibits high resilience to abiotic stresses, with genetic characteristics that make it a versatile crop for different environments and cultivation systems. Key features include adaptability to different temperature ranges, a short development cycle, efficient water use, tolerance to drought and heat, and stable productivity under adverse conditions [1]. However, the magnitude of these responses varies significantly among cultivars, especially during the early stages of development, which are considered critical for plant stand establishment. Thus, planting date, seeding rate, and cultivar selection are the most important factors in determining yield potential in wheat due to their impact on stand establishment [8,9]. Therefore, early seedling-stage screening has been recognized as a rapid and reliable approach for identifying stress-tolerant wheat genotypes, particularly through root- and shoot-related vigor traits [10,11,12].
Consequently, cultivar screening under controlled stress conditions is a valuable approach for identifying genotypes with superior early establishment capacity and improved adaptation to stressful environments [10,11,13]. Seedling vigor traits are considered efficient tools for the early identification of stress-tolerant genotypes, as they provide rapid and sensitive responses to adverse environmental conditions. Morphophysiological characteristics related to root growth, biomass accumulation, and shoot development are strongly associated with stand establishment and the adaptive responses of plants to water and heat stress [14,15]. Therefore, evaluating the initial performance of seedlings can support wheat breeding and selection programs aimed at increasing resilience to climate-related stress conditions.
In this context, the present study aimed to screen commercial wheat cultivars during the initial seedling development under conditions of thermal stress and osmotic stress (simulating drought). Initially, a preliminary experiment was conducted to determine the temperature and PEG 6000 concentration needed to establish simulated stress conditions. Subsequently, twenty-eight Brazilian wheat cultivars were evaluated for characteristics associated with shoot and root development, including length and biomass accumulation, under thermal stress at 35 °C and PEG-induced osmotic stress simulating drought at −1.76 MPa. The performance of the cultivars was evaluated through univariate and multivariate analyses to identify promising cultivars for establishment under heat and drought stresses. Considering that the initial performance of seedlings plays a critical role in crop establishment, these morphophysiological traits can serve as useful indicators of crop establishment potential and adaptive responses to abiotic stress conditions.
2. Materials and Methods
2.1. Plant Material
The experiment was conducted at the Genomics and Plant Breeding Center, Federal University of Pelotas, Capão do Leão, Brazil. The study evaluated 28 commercial wheat cultivars, encompassing a broad range of genotypes currently cultivated in Brazilian wheat production systems (Table 1).
Table 1.
List of 28 commercial Brazilian wheat cultivars (Triticum aestivum L.) used in the experiments.
2.2. Experimental Design and Stress Conditions
2.2.1. Preliminary Assay for Stress Definition
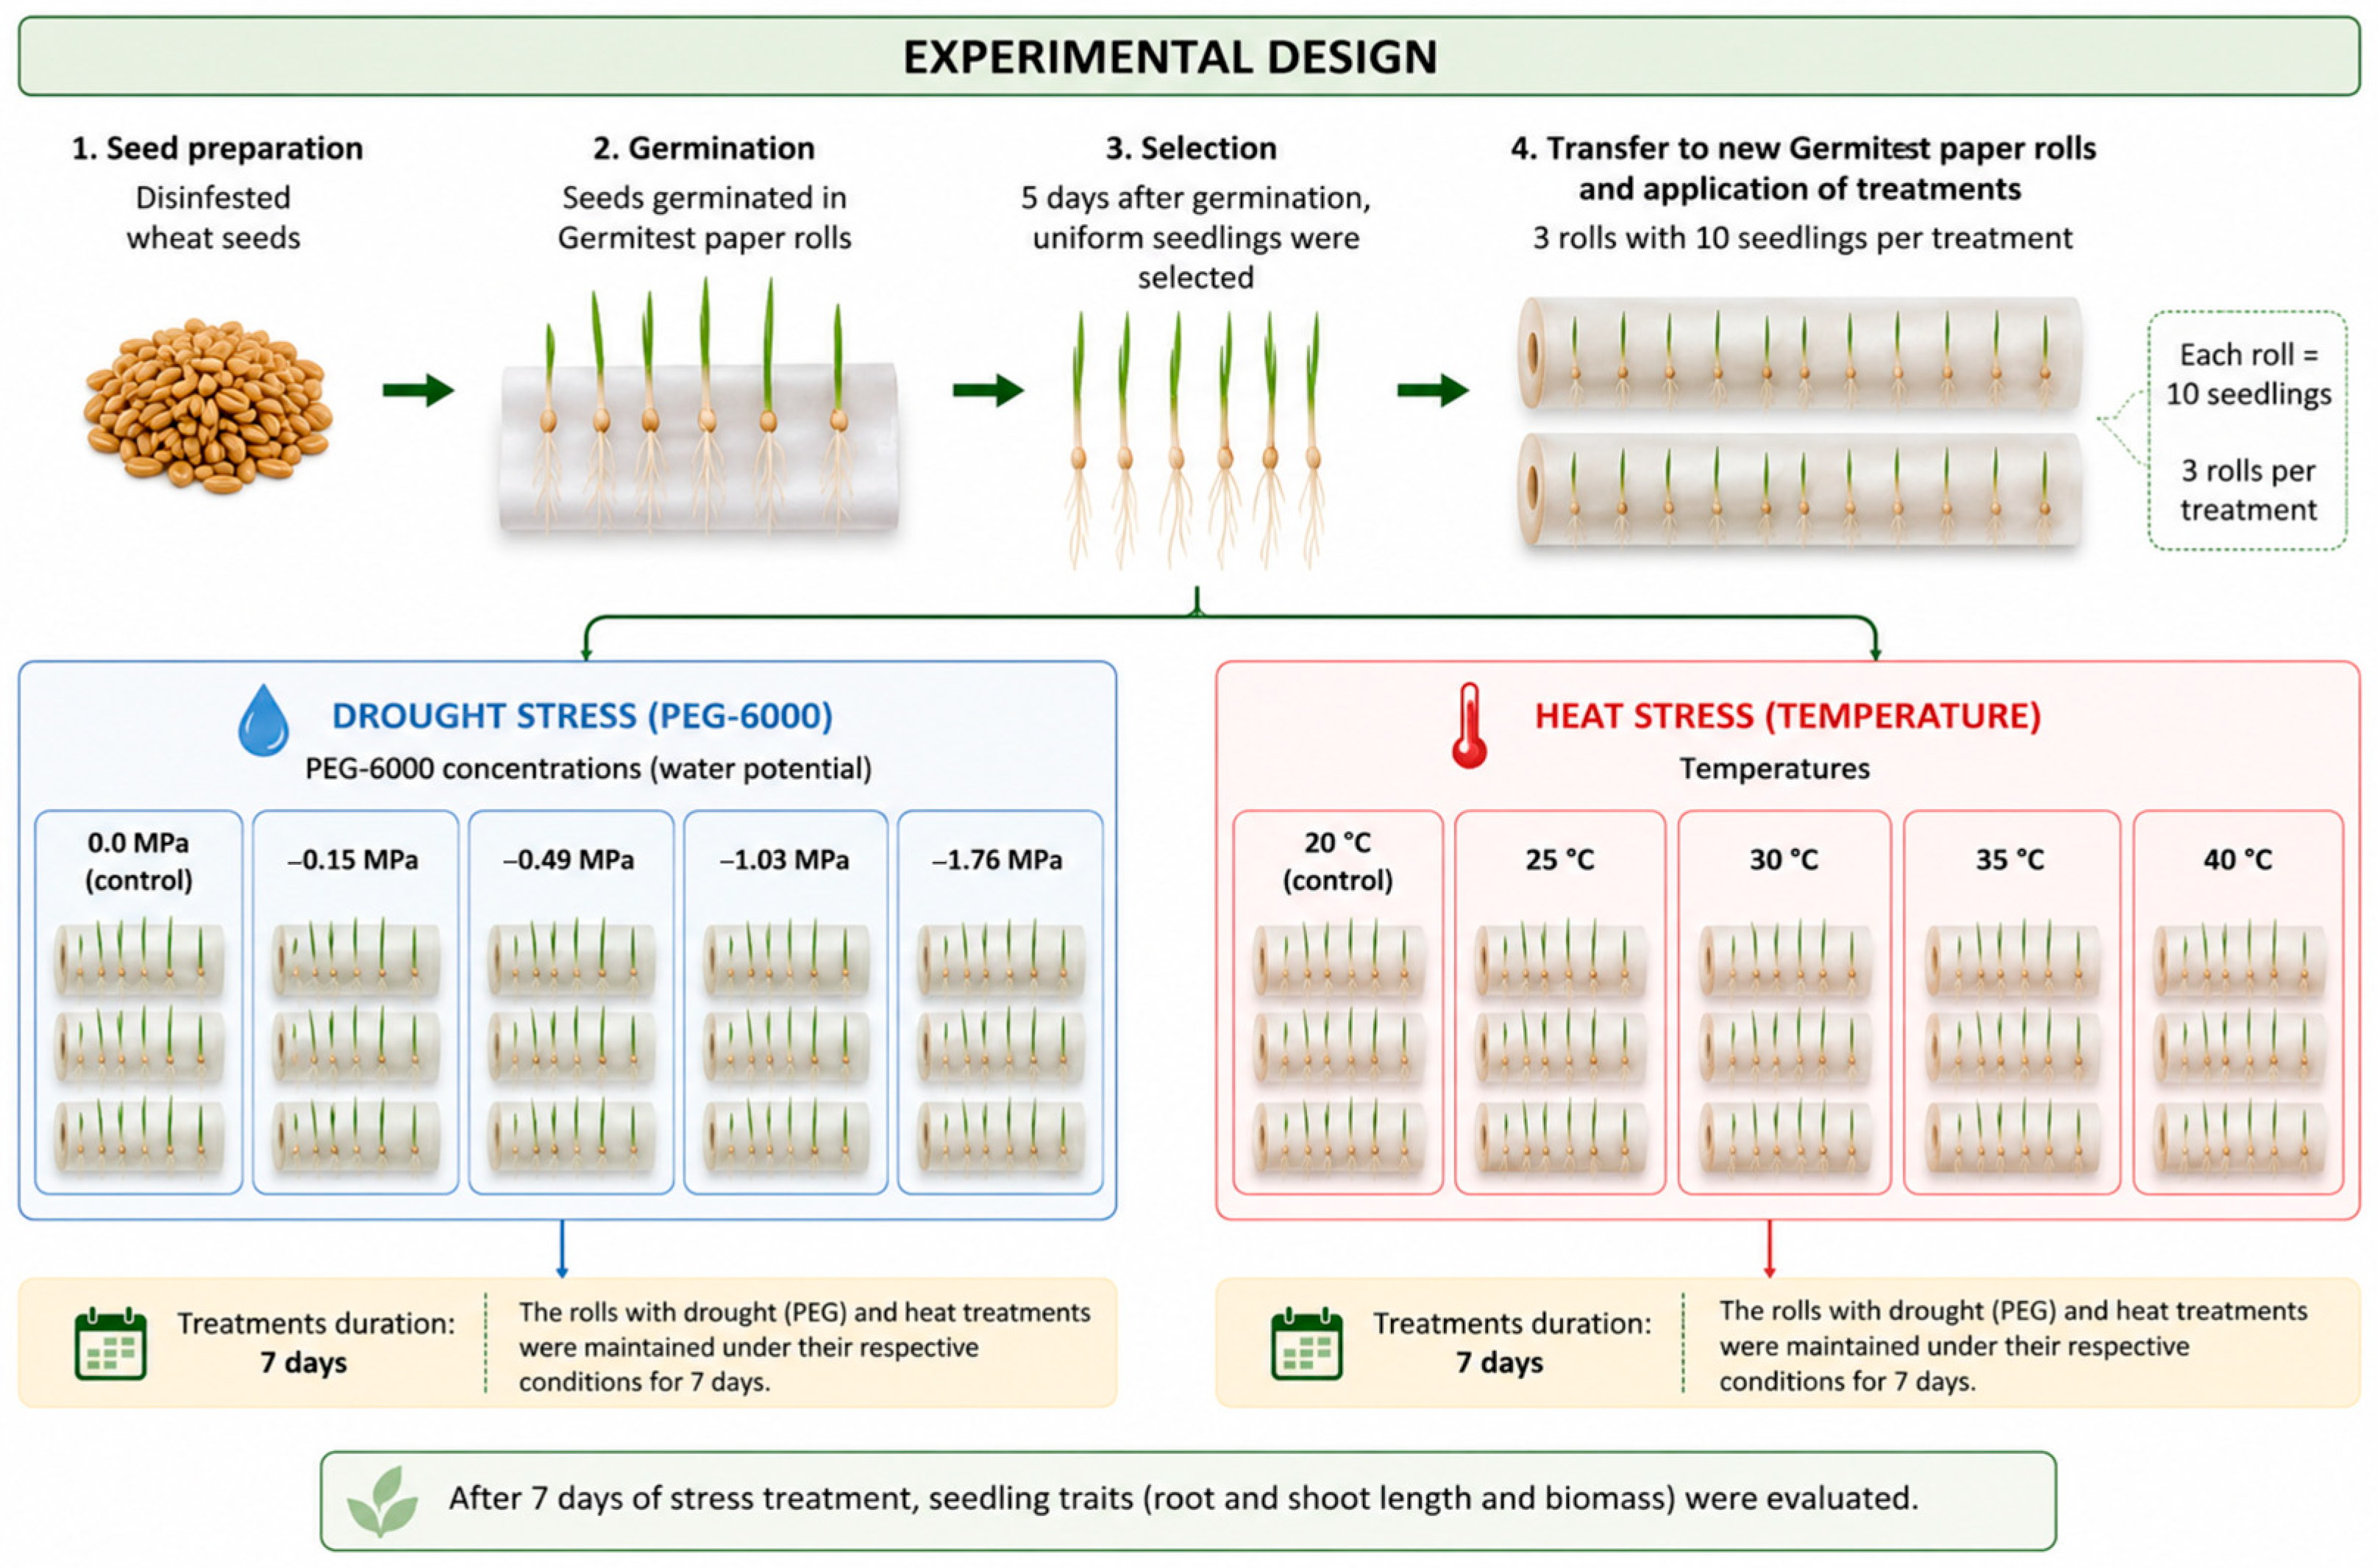
A preliminary assay was performed using the commercial cultivar ORS Feroz to establish stress conditions for the subsequent screening experiment. The objective of this assay was not to characterize cultivar-specific responses but to identify stress levels capable of reducing seedling growth while still allowing the detection of phenotypic differences among cultivars. Different temperature levels and polyethylene glycol (PEG-6000) concentrations were evaluated to establish stress intensities capable of reducing seedling growth without completely inhibiting seedling development. Initially, the seeds were subjected to asepsis in a 1% sodium hypochlorite (NaClO) solution for 15 min, followed by washing in distilled water to remove residues. The germination and standardization stage of the seedlings took place in rolls of Germitest-type paper, moistened with distilled water in a proportion of 2.5 times the weight of the dry paper. The rolls were kept in B.O.D.-type growth chambers for five days, aiming to obtain uniform seedlings to apply the treatments.
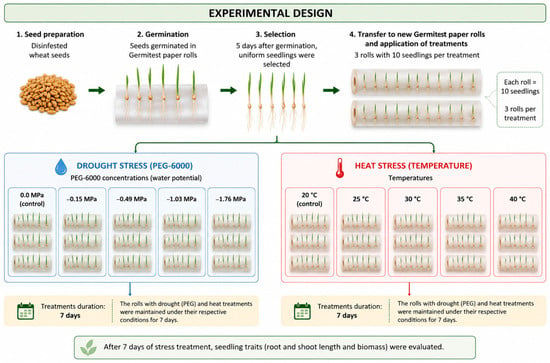
Uniform seedlings were selected to determine the intensity of osmotic and temperature stresses. Drought stress was simulated using polyethylene glycol (PEG-6000) solutions at different osmotic potentials (0.0, −0.15, −0.49, −1.03, and −1.76 MPa), corresponding to PEG concentrations of 0%, 10%, 20%, 30%, and 40%, respectively [16]. Three rolls of germitest paper, each containing 10 seedlings, were used for each osmotic potential. Heat stress was simulated using BOD growing chambers set at 20 °C, 25 °C, 30 °C, 35 °C, and 40 °C. Three rolls of Germitest paper, each containing 10 seedlings, were used for each temperature. The experiment was conducted under a 12/12 h photoperiod (light/dark). The experimental design used was completely randomized, with three replicates, each replicate consisting of a roll containing 10 seedlings. After a seven-day exposure period, a phenotypic evaluation was performed under both conditions, heat and osmotic stresses. A schematic view of the preliminary assay is shown in Figure 1.
Figure 1.
Schematic view of the preliminary assay for simulated heat and drought stress definition. The graphical illustration was generated with the assistance of ChatGPT Go version GPT-5.5 (OpenAI) and subsequently edited by the authors.
At the end of the seven-day period of exposure to different levels of osmotic and heat stress, and under control conditions, phenotypic characterization was performed to quantify the impact of the treatments on early development. The shoot length (SLL) and root length (RL) were measured individually in all seedlings using a graduated ruler (mm). After linear measurements, the seedlings were sectioned for morphological separation between shoots and roots. The tissues were placed in paper bags and transferred to a forced-air circulation oven (60 °C) until they reached constant mass. The determination of shoot dry weight (SDW) and root dry weight (RDW) was performed using a precision analytical balance (0.001 g accuracy, Shimadzu, model auw220d, Kyoto, Japan). Based on these results, the main experiment was established using 35 °C and an osmotic potential of −1.76 MPa.
2.2.2. Main Experiment
The plant material consisted of 28 commercial wheat cultivars (Triticum aestivum L.), from the companies OR Genética and Biotrigo, selected for their representativeness in Brazilian wheat production systems (Table 1). Initially, the seeds were disinfected in a 1% sodium hypochlorite solution for 10 to 15 min, followed by washing with distilled water. For standardization and obtaining seedlings, 20 seeds of each genotype were placed in rolls of Germitest-type paper, moistened with distilled water in a proportion of 2.5 times the weight of the dry paper. The rolls were kept in B.O.D. type germination chambers, under a constant temperature of 25 °C and a photoperiod of 12 h, for a period of five days.
After the fifth day of germination, 10 uniform seedlings per replicate were selected for treatment application. The preliminary calibration assay evaluated different temperature and PEG-6000 levels to identify stress conditions capable of reducing seedling growth while preserving sufficient phenotypic variation for cultivar screening. Based on the preliminary results and supported by previous studies demonstrating that 35 °C is effective for imposing heat stress while maintaining seedling viability in wheat seedlings [17,18], a constant temperature of 35 °C and a PEG-6000 concentration corresponding to an osmotic potential of −1.76 MPa (40%) were selected for the subsequent experiments with the 28 wheat cultivars. The selected osmotic potential represented the most suitable stress level for screening because it promoted measurable reductions in seedling growth while maintaining sufficient phenotypic variation to discriminate genotypic differences among cultivars. The heat treatment was maintained continuously throughout the seven-day experimental period to ensure stress exposure during the early seedling establishment stages.
PEG-induced osmotic stress simulating drought (hereafter referred to as osmotic stress) was induced by transferring the seedlings to new Germitest paper rolls moistened with a 40% polyethylene glycol (PEG 6000) solution, representing a water potential of −1.76 MPa (2.5 times the weight of the paper), and maintained at 25 °C during the stress period. To induce heat stress, another set of seedlings was transferred to Germitest paper rolls moistened with distilled water (2.5 times the weight of the paper) and grown under a temperature of 35 °C. A control group was maintained under ideal conditions (25 °C and rolls moistened with distilled water 2.5 times the weight of the paper). All treatments were conducted for a period of seven days, maintaining the original 12/12 h photoperiod (light/dark) in BOD-type growth chambers. The main experiment was conducted in a completely randomized design with three independent experimental repetitions. Each experimental unit consisted of one Germitest paper roll containing ten seeds of a single cultivar. Accordingly, the Germitest paper roll, rather than the individual seedling, was considered the experimental unit for all statistical analyses. The entire experiment was repeated three times under identical environmental conditions using the same growth chamber.
2.3. Seedling Growth Assessment
At the end of the seven-day period of exposure to osmotic and heat stresses, and under control conditions, phenotypic characterization was performed to quantify the impact of the treatments on early development. The morphological traits of shoot length, root length, and shoot and root dry weights were assessed as described before in the preliminary assay. Biomass data, along with length indices, comprised the set of phenotypic variables used to determine the differential tolerance of the 28 wheat cultivars under osmotic stress and heat stress. Shoot length and root length were measured individually, and the mean value of the ten seedlings was used for statistical analysis. In contrast, shoot and root dry weight were determined using the pooled biomass of the ten seedlings from each experimental unit, yielding one dry weight value per replicate. Thus, the experimental unit for all statistical analyses was the Germitest paper roll rather than the individual seedling.
2.4. Stress Tolerance Indices
Stress tolerance indices traditionally applied to grain yield have increasingly been adopted for seedling-stage screening and vigor-related traits under abiotic stress conditions [10,11,12]. Stress tolerance indices were calculated independently using the original phenotypic values obtained under control (Yp) and stress (Ys) conditions for each experimental replication, including Stress Tolerance Index (STI) [19], Stress Susceptibility Index (SSI) [20], and Geometric Mean Productivity (GMP) [21]. Microsoft Excel was applied for calculation of stress indices using original trait values obtained under control and stress conditions.
The STI was calculated as:
where Yp and Ys correspond to the mean performance of a cultivar under control and stress conditions, respectively, and represents the overall mean of all cultivars under control conditions.
The SSI was calculated as:
where and represent the overall means of all cultivars under stress and control conditions, respectively.
The GMP was calculated as:
Because the original indices were developed for grain yield evaluation, in the present study, Yp and Ys corresponded to seedling growth traits (shoot length, root length, shoot dry weight, and root dry weight) measured under control and stress conditions. Higher STI and GMP values indicate greater stress tolerance and stability of performance under adverse conditions, whereas lower SSI values indicate lower susceptibility to stress.
2.5. Statistical Analysis
Relative performance was calculated independently for each experimental replication by expressing the values obtained under heat or osmotic stress as a percentage of the corresponding control treatment for the same cultivar. The resulting relative performance values were used for all subsequent statistical analyses. Heat and osmotic stress datasets were analyzed independently because relative performance was calculated separately for each stress condition. Analysis of variance (ANOVA) was performed under a completely randomized design with three independent replications, considering cultivar as the fixed effect, using the “proc glm” procedure. Each experimental unit consisted of one Germitest paper roll containing ten seedlings. Shoot length and root length were measured individually, and the mean value of the ten seedlings was used in the analyses, whereas shoot and root dry weight were determined from the pooled biomass of the ten seedlings, yielding one value per experimental unit. When significant differences were detected (p ≤ 0.05), cultivar means were grouped using the Scott–Knott test at the 5% probability level. Principal component analysis (PCA) was performed on the traits that showed significant differences among cultivars to summarize the phenotypic variation, with the analysis being carried out through the “proc princomp” procedure. All statistical analyses were conducted using SAS OnDemand for Academics, version 9.4 (SAS Institute Inc., Cary, NC, USA). Broad-sense heritability (H2), genotypic coefficient of variation (CVg), environmental coefficient of variation (CVe), and the CVg/CVe ratio were estimated from variance components obtained from ANOVA [22].
3. Results
3.1. Determination of Osmotic Potential and Temperature
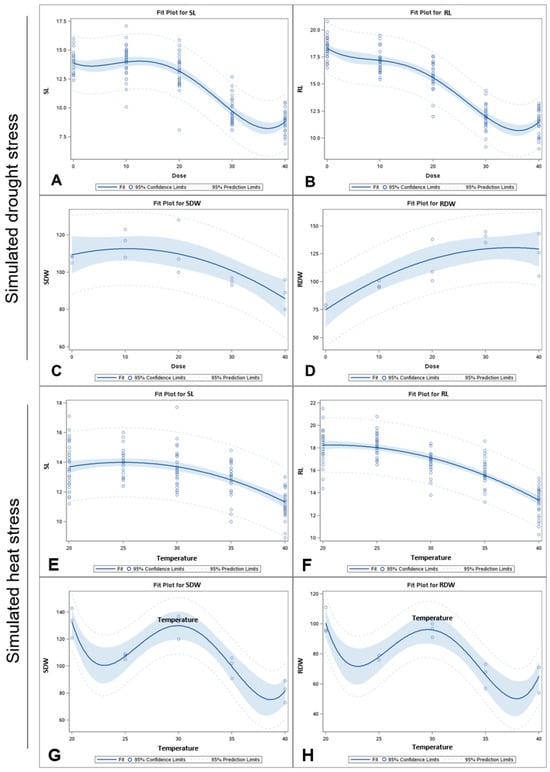
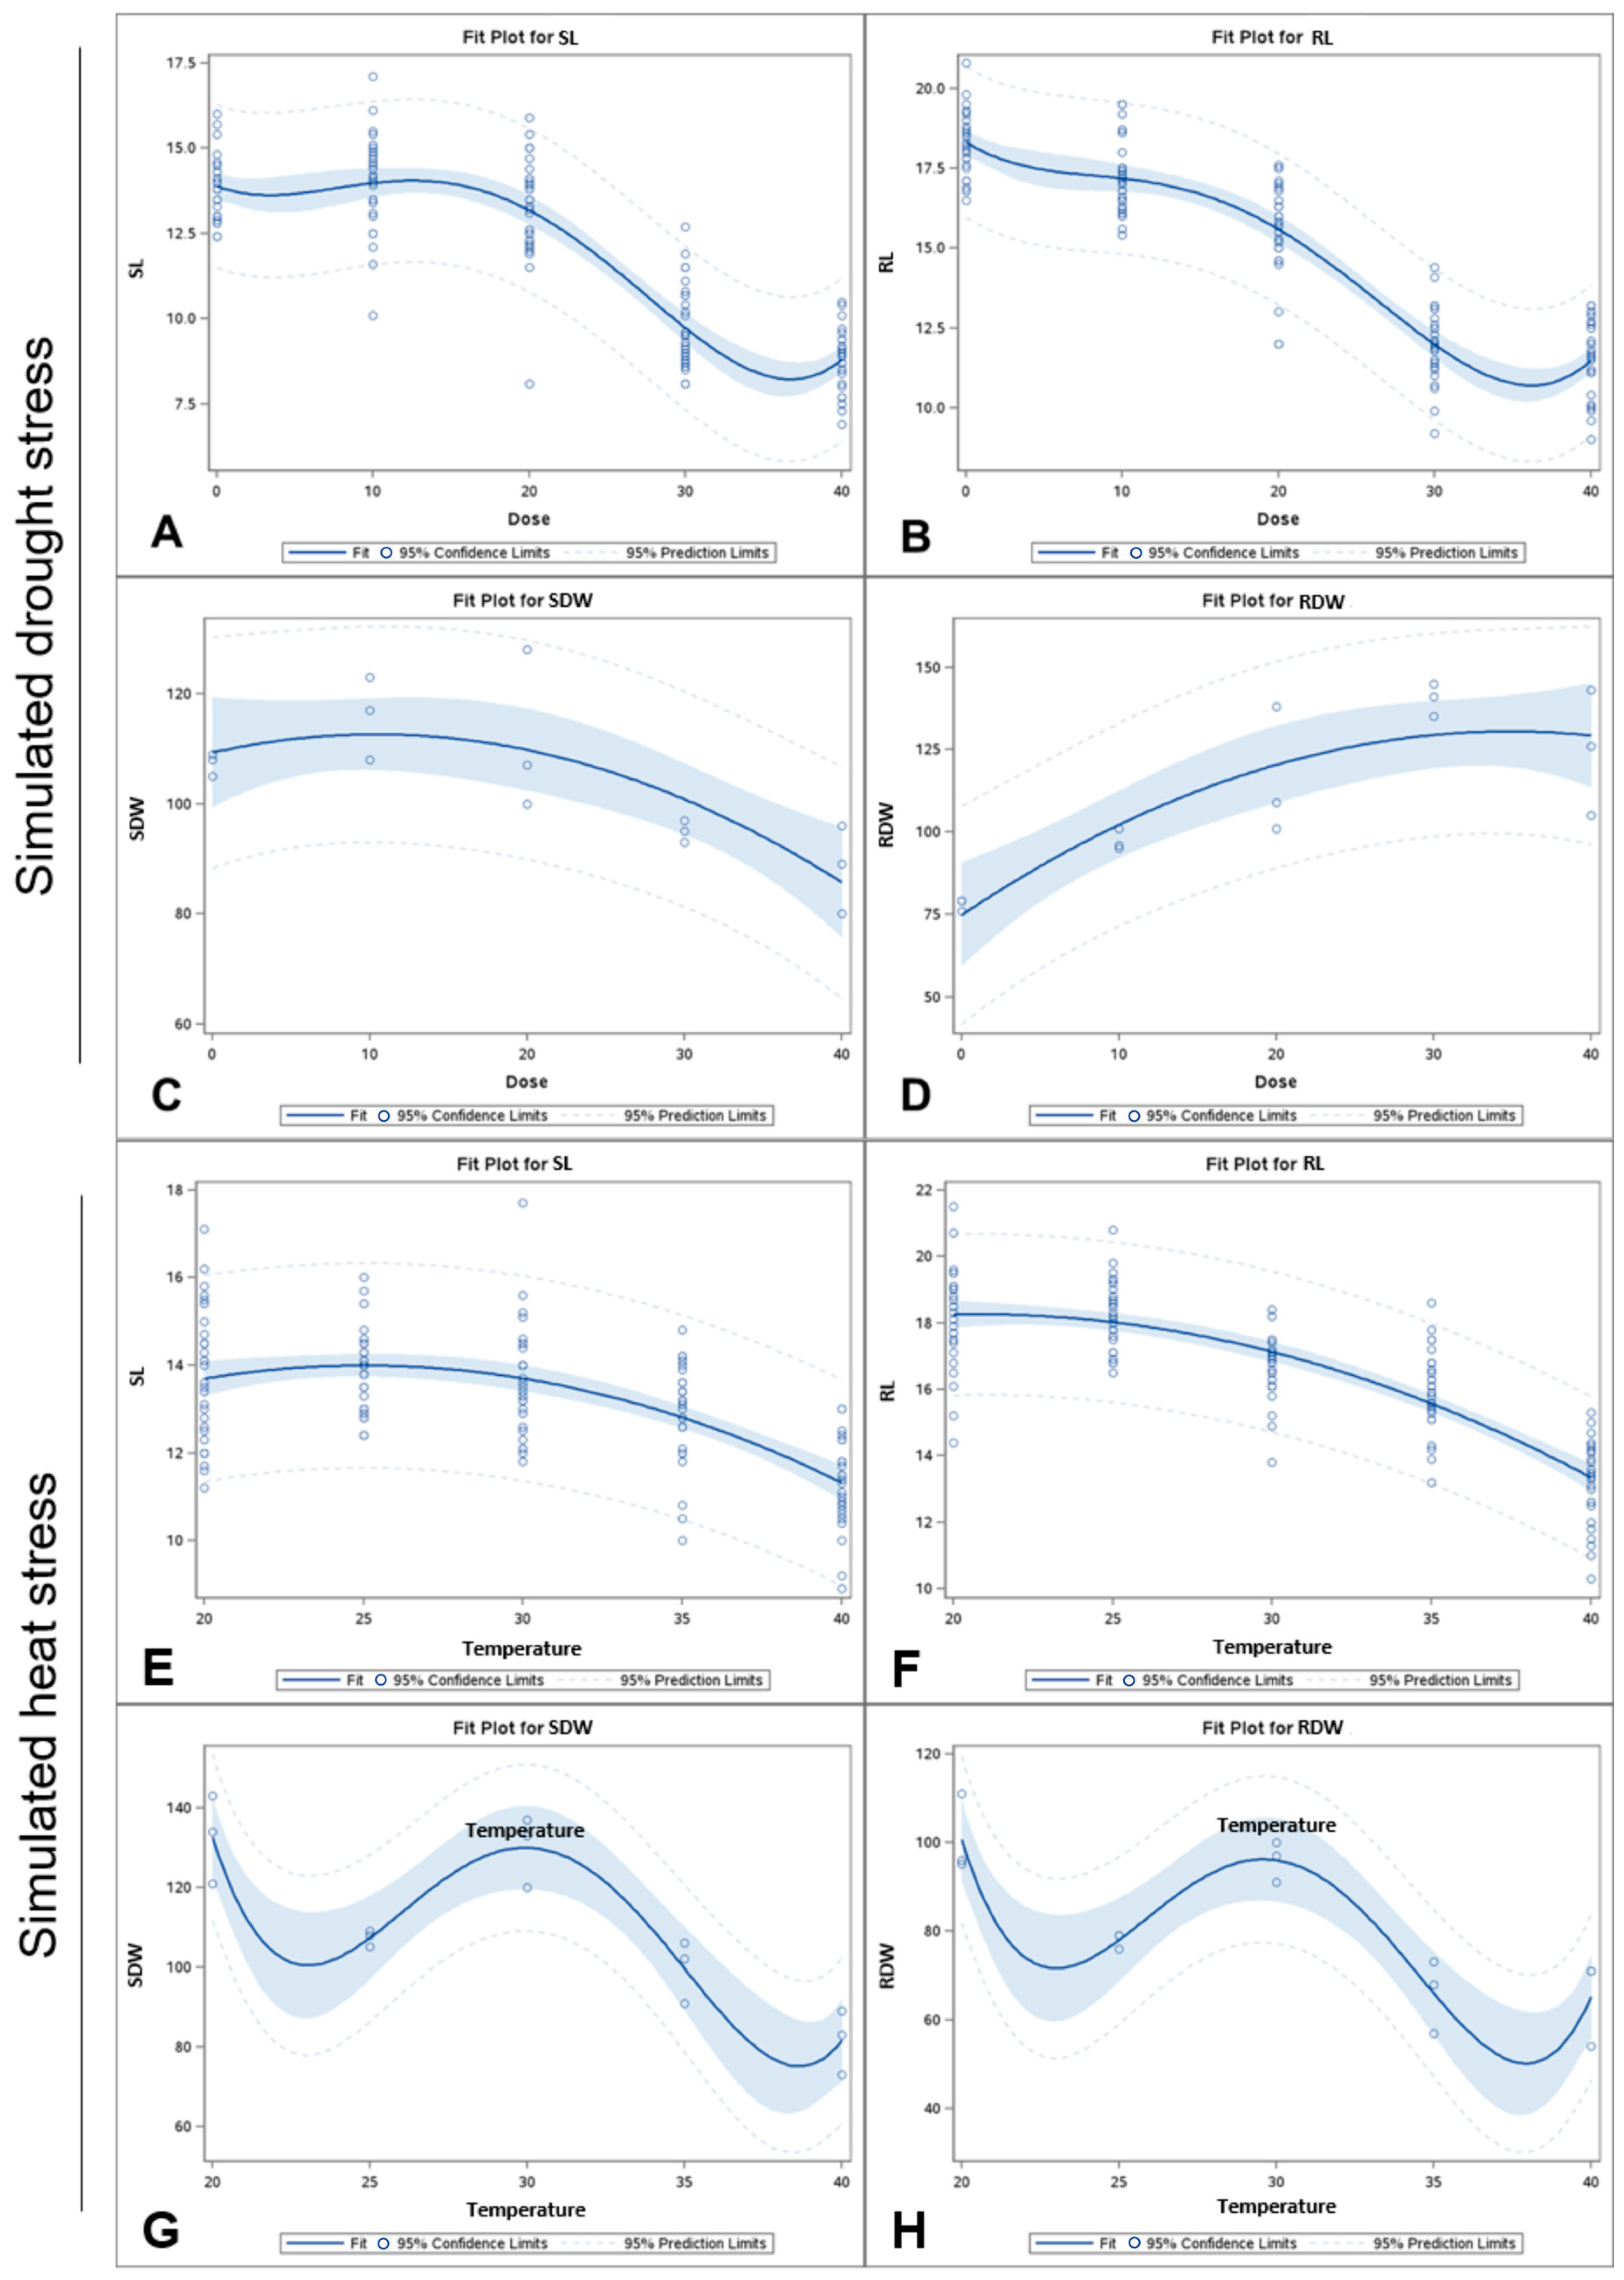
A preliminary assay using the wheat cultivar ORS Feroz was conducted to determine the osmotic potential provided by solutions of different concentrations of PEG-6000 (0% [0.0 MPa], 10% [−0.15 MPa], 20% [−0.49 MPa], 30% [−1.03 MPa], and 40% [−1.76 MPa]) and heat stress through temperatures of 20 °C, 25 °C, 30 °C, 35 °C, and 40 °C. Regression analyses were used to determine the stress conditions capable of inducing substantial reductions in seedling growth without completely suppressing their development (Figure 2). From this assay, 35 °C and −1.76 MPa (40%) were selected as representative conditions of heat and osmotic stress, respectively, since these levels promoted significant effects on shoot and root growth, preserving seedling viability and phenotypic variability among cultivars.
Figure 2.
Polynomial regression of phenotypic traits of wheat (cultivar ORS Feroz) under PEG-induced osmotic stress simulating drought (% PEG-6000) and heat (°C) conditions. Shoot length (SL) under osmotic stress (A) and heat (E), root length (RL) under osmotic stress (B) and heat (F), shoot dry weight (SDW) under osmotic stress (C) and heat (G), and root dry weight (RDW) under osmotic stress (D) and heat (H). The blue shaded region represents the 95% confidence interval of the fitted regression.
3.2. Phenotypic Variability of Wheat Cultivars
Osmotic stress promoted more pronounced changes in plant growth than heat stress, significantly affecting shoot length, root length, and root dry weight. On the other hand, heat stress had a significant effect only on root length. Shoot dry weight was not influenced by any of the stresses evaluated (Table 2).
Table 2.
p-values from the analysis of variance relating to the effect of heat and osmotic stresses on growth traits in seedlings of different wheat cultivars.
There was a significant difference between wheat cultivars for the traits affected by stress (Table 3). Under heat stress, the relative performance of root length ranged from 46.59 (ORS Feroz) to 82.04 (TBIO Valente). The Scott–Knott clustering test grouped the genotypes into two groups, with group A classified by genotypes with superior root length performance compared to the others, ranging from 69.67 (ORS 1403) to 82.04 (TBIO Valente), while group B was classified with inferior root length performance compared to the others, ranging from 46.59 (ORS Feroz) to 66.36 (TBIO Sentinela). Group A comprised 19 cultivars: ORS 1403, ORS 2302, ORS Absoluto, ORS Falcão, ORS Gladiador, ORS Guardião, ORS Madrepérola, ORS Selvagem, ORS Soberano, TBIO Astro, TBIO Aton, TBIO Calibre, TBIO Convicto, TBIO Duque, TBIO Ponteiro, TBIO Talismã, TBIO Titan, TBIO Toruk, and TBIO Valente. Group B comprised 9 cultivars: ORS 2301, ORS Completo, ORS Feroz, ORS Senna, ORS Turbo, TBIO Audaz, TBIO Capaz, TBIO Motriz, and TBIO Sentinela.
Table 3.
Grouping of means by the Scott–Knott clustering test using the relative performance (%) of phenotypic traits evaluated in 28 wheat cultivars subjected to heat and PEG-induced osmotic stress at the early seedling stage.
Under osmotic stress, shoot length performance ranged from 49.94 (TBIO Motriz) to 64.96 (ORS Feroz). Two groups were formed—group A was classified as having superior shoot length performance compared to the others, ranging from 56.75 (ORS Absoluto) to 64.96 (ORS Feroz), while group B comprised cultivars with inferior shoot length performance compared to the others, ranging from 49.94 (TBIO Motriz) to 56.29 (TBIO Astro). Group A compreendeu 14 cultivares, ORS 1403, ORS 2301, ORS 2302, ORS Absoluto, ORS Completo, ORS Falcão, ORS Feroz, ORS Guardião, TBIO Aton, TBIO Audaz, TBIO Calibre, TBIO Capaz, TBIO Convicto, and TBIO Valente. Group B compreendeu 14 cultivares, ORS Gladiador, ORS Madrepérola, ORS Selvagem, ORS Senna, ORS Soberano, ORS Turbo, TBIO Astro, TBIO Duque, TBIO Motriz, TBIO Ponteiro, TBIO Sentinela, TBIO Talismã, TBIO Titan, and TBIO Toruk.
Root length performance under osmotic stress ranged from 41.71 (ORS Turbo) to 71.28 (ORS Absoluto). Three groups were formed, group A showing superior root length performance compared to the others, ranging from 59.50 (TBIO Calibre) to 71.28 (ORS Absoluto), containing 14 cultivars: ORS 1403, ORS 2301, ORS 2302, ORS Absoluto, ORS Completo, ORS Falcão, ORS Feroz, ORS Guardião, ORS Madre-pérola, ORS Selvagem, ORS Senna, TBIO Astro, TBIO Aton, and TBIO Calibre. Group B comprised cultivars with intermediate root length performance compared to the others, ranging from 54.20 (TBIO Sentinela) to 58.07 (ORS Soberano), and included 10 cultivars: ORS Gladiador, ORS Soberano, TBIO Audaz, TBIO Convicto, TBIO Duque, TBIO Ponteiro, TBIO Sentinela, TBIO Titan, TBIO Toruk, and TBIO Valente. The values of Group C, composed of cultivars with shorter root lengths, ranged from 41.71 (ORS Turbo) to 50.60 (TBIO Talismã) and comprised 4 cultivars, ORS Turbo, TBIO Capaz, TBIO Motriz, and TBIO Talismã.
Root dry weight showed wide variation among genotypes subjected to osmotic stress, with values ranging from 117.14 (ORS 1403) to 193.17 (TBIO Valente). The cultivars were divided into two groups, group A consisting of cultivars with higher root dry weight values, ranging from 159.63 (ORS Turbo) to 193.17 (TBIO Valente), comprising 15 cultivars, ORS Turbo, TBIO Astro, TBIO Aton, TBIO Audaz, TBIO Calibre, TBIO Capaz, TBIO Convicto, TBIO Duque, TBIO Motriz, TBIO Ponteiro, TBIO Sentinela, TBIO Talismã, TBIO Titan, TBIO Toruk, and TBIO Valente. On the other hand, group B was composed of cultivars with lower root dry weightweight performance ranging from 117.14 (ORS 1403) to 157.14 (ORS Soberano) and comprised 13 cultivars: ORS 1403, ORS 2301, ORS 2302, ORS Absoluto, ORS Completo, ORS Falcão, ORS Feroz, ORS Gladiador, ORS Guardião, ORS Madrepéro-la, ORS Selvagem, ORS Senna, and ORS Soberano.
3.3. Heritability Estimates
Broad-sense heritability estimates ranged from 0.50 to 0.71 (Table 4). Root length under heat stress showed high heritability (H2 = 0.71). Under osmotic stress, shoot length showed moderate heritability (H2 = 0.50), while root dry weight and root length showed high heritabilities (H2 = 0.69 and 0.70), respectively. As for the magnitude of genetic variability among cultivars, CVg% values < 5 are considered low variability, CVg% between 5 and 10 are considered moderate variability, and CVg% > 10 are considered high variability. We identified that in the panel of cultivars studied, there is high variability for the root length (CVg% = 10.30) and root dry weight (10.24) traits.
Table 4.
Broad-sense heritability and genetic parameters estimated from the relative performance (%) of root length under heat stress (35 °C), and shoot length, root length, and root dry weight under PEG-induced osmotic stress (−1.76 MPa) in 28 commercial wheat cultivars.
3.4. Principal Component Analysis
Principal component analysis (PCA) was performed using root length under heat stress (35 °C), shoot length, root length, and root dry weight under osmotic stress (−1.76 MPa). The first two principal components (PC1 and PC2) explained 80% of the total phenotypic variation among cultivars, with PC1 representing 51% and PC2 representing 29% of the variance (Table 5).
Table 5.
Principal component analysis (PCA) based on relative values of morphological variables in 28 commercial wheat cultivars under control, heat and osmotic stress, indicating the eigenvalues (variance explained by each principal component—PC), variance proportion, cumulative variance by each PC, and eigenvectors (magnitude and direction of each trait).
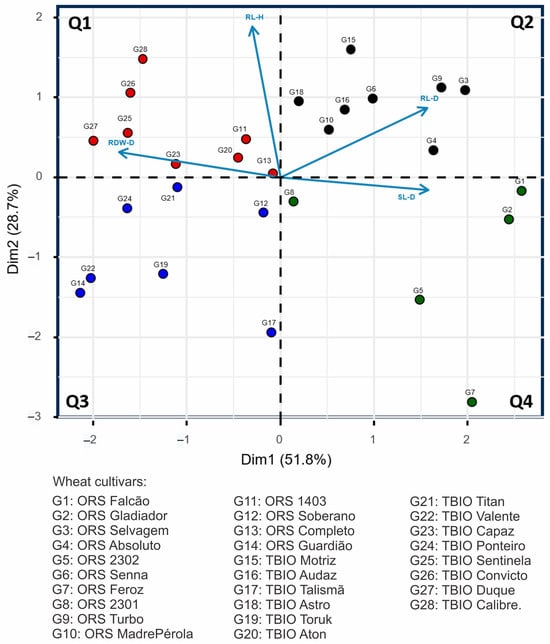
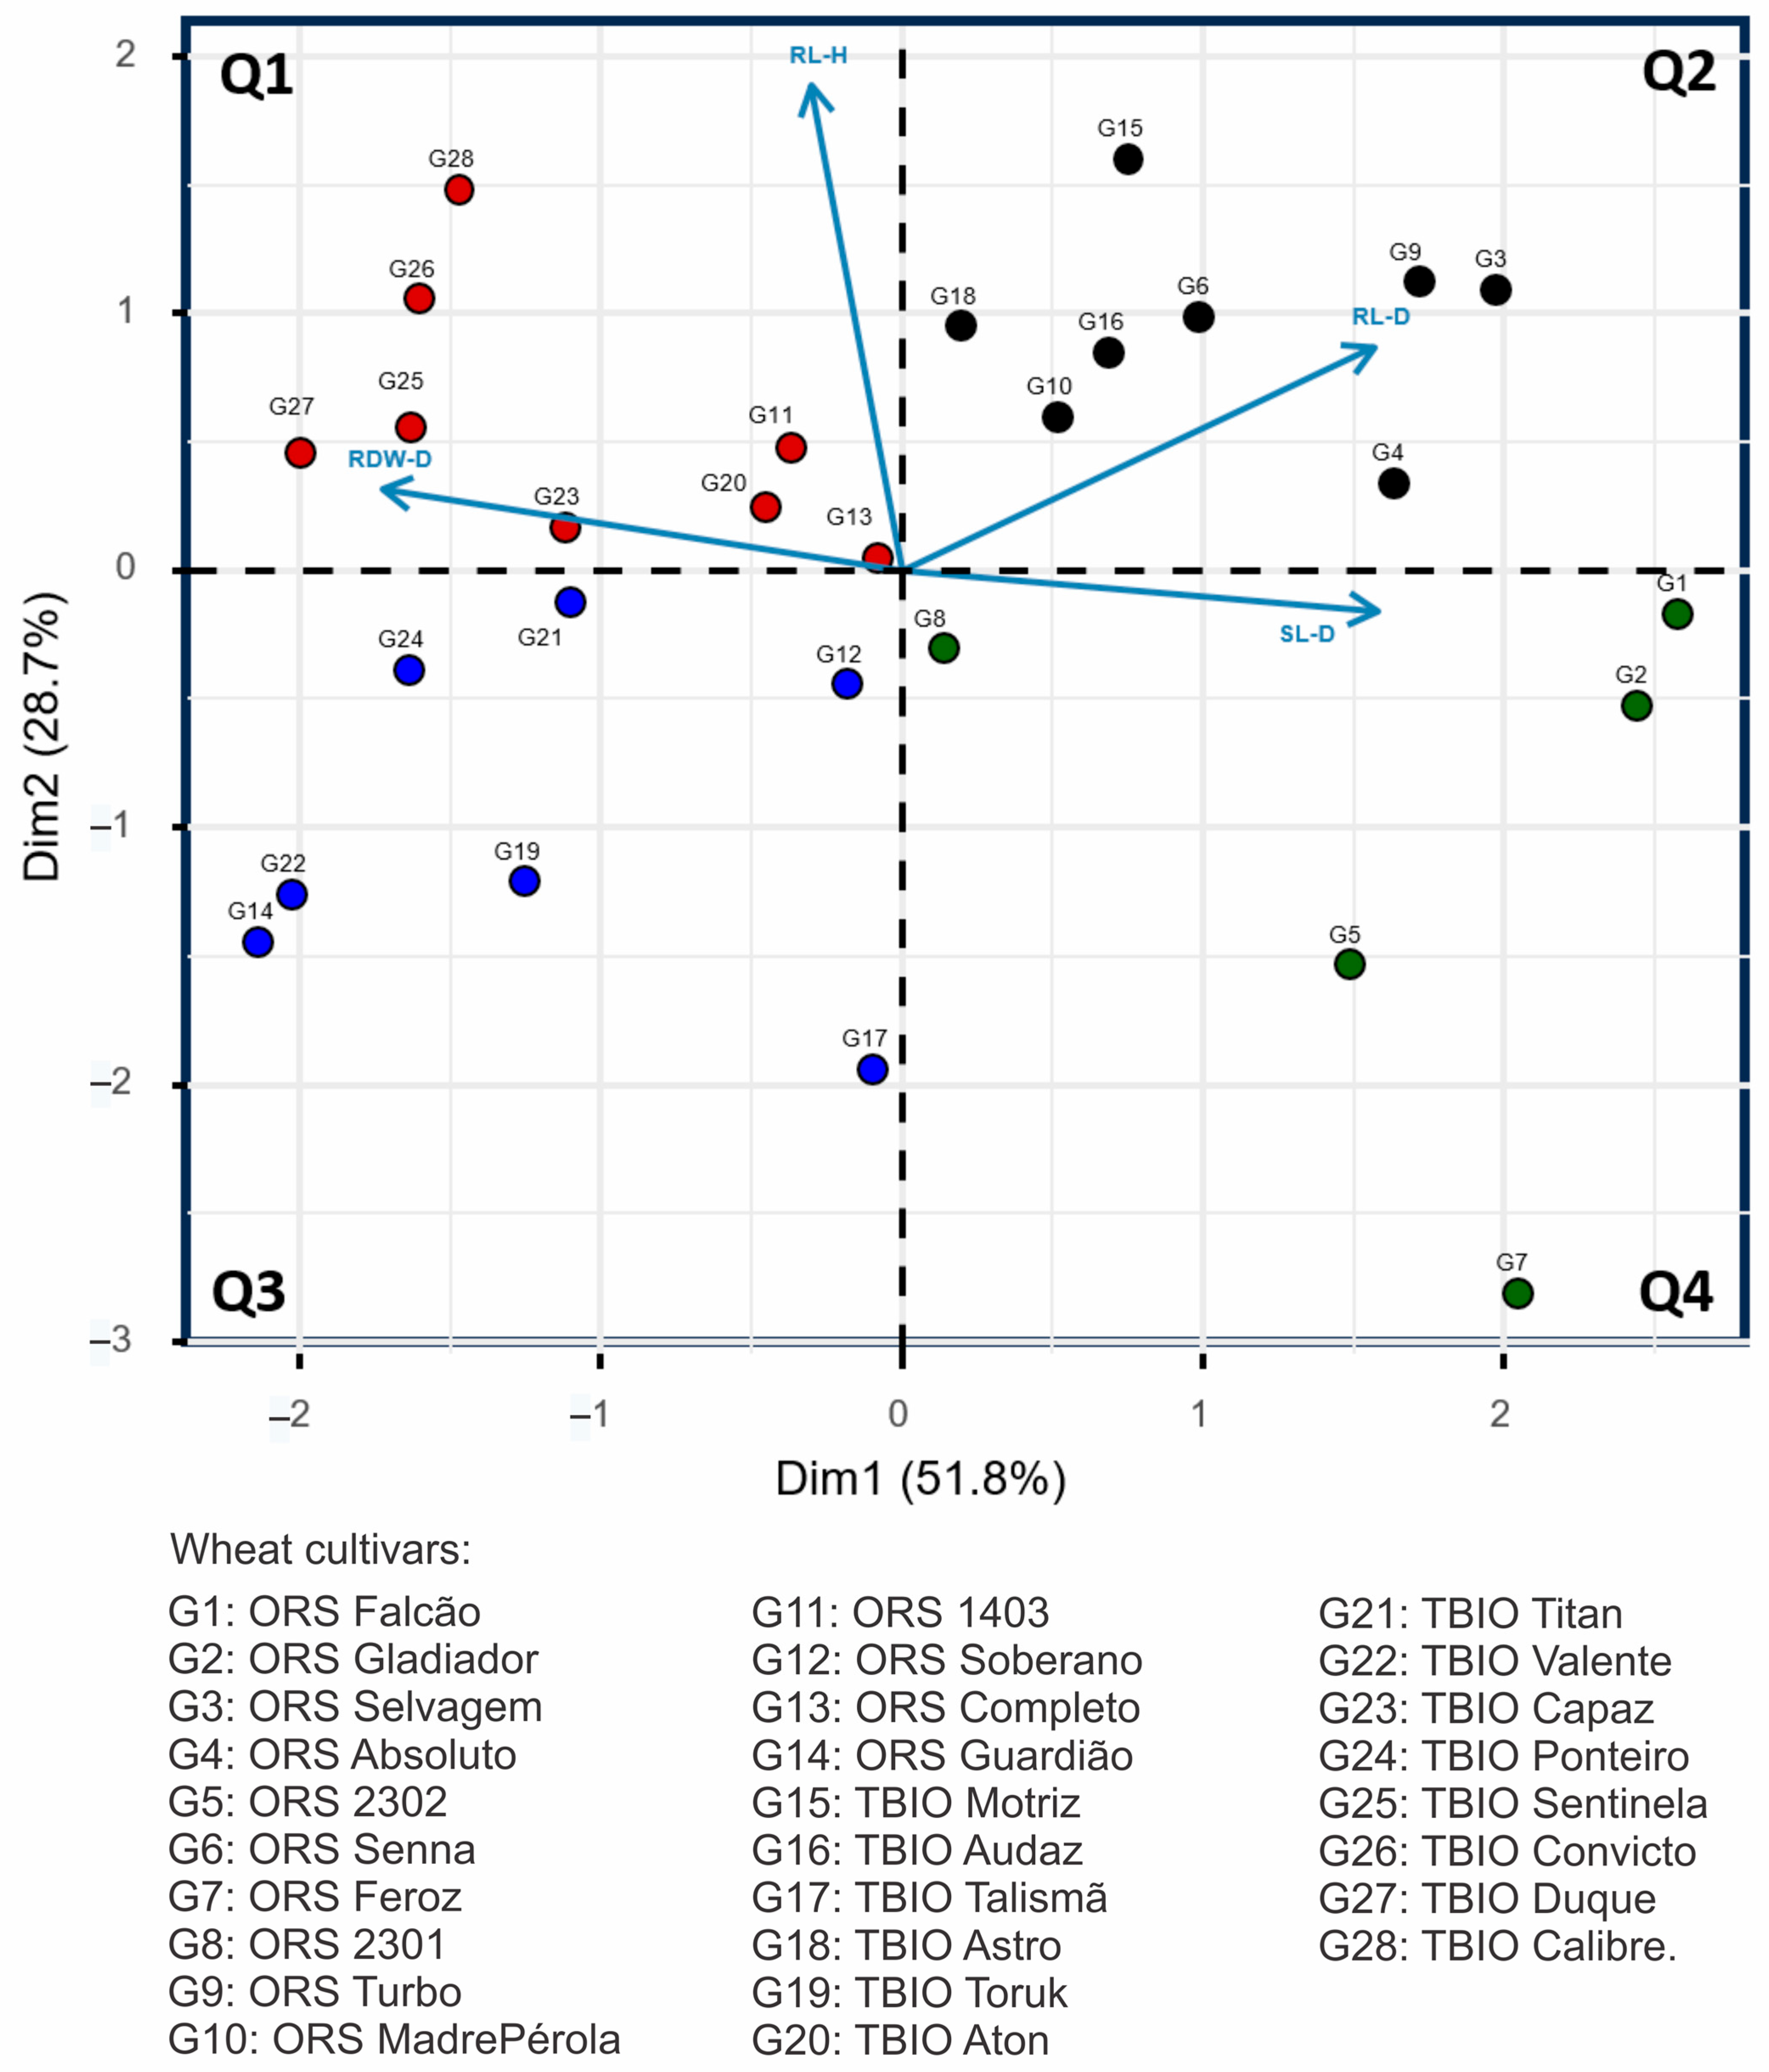
The distribution of cultivars in the PCA biplot revealed distinct response patterns among the evaluated genotypes (Figure 3). Cultivars located in the second quadrant (Q2) were positioned in the positive region of PC1, where shoot length and root length under osmotic stress contributed most strongly to cultivar separation. Cultivars grouped in the first quadrant (Q1) were positioned opposite to PC1 and were associated with root dry weight under osmotic stress. The fourth quadrant (Q4) comprised cultivars located in the positive region of PC1 but with negative PC2 scores, whereas cultivars in the third quadrant (Q3) were distributed away from the major trait vectors, indicating weaker associations with the evaluated variables.
Figure 3.
Principal component analysis based on relative values of morphological variables of 28 wheat cultivars under control, heat and osmotic stress conditions. RL–H: Root length under heat stress (35 °C); SL–D: Shoot length under osmotic stress (osmotic potential −1.76 MPa); RL-D: Root length under osmotic stress (osmotic potential −1.76 MPa); RDW–D: Root dry weight under osmotic stress (osmotic potential −1.76 MPa). The colored circles identify the wheat cultivars according to the PCA quadrant in which they are located (Q1 = red, Q2 = black, Q3 = blue, and Q4 = green).
The mean relative performance of cultivars grouped within each PCA quadrant revealed distinct phenotypic profiles (Table 6). Cultivars located in Q2 exhibited the highest shoot length (60.71%) and root dry weight (178.01%) under osmotic stress, together with high root length values (60.76%). In contrast, cultivars assigned to Q4 showed the greatest root length under both heat (76.70%) and osmotic (66.62%) stress. Cultivars grouped in Q1 exhibited the lowest root length under both stress conditions, whereas Q3 was characterized by the lowest shoot length (52.00%) and root dry weight (141.33%) under osmotic stress. Representative cultivars from each quadrant are shown in Figure 3.
Table 6.
Mean relative performance (%) of the variables root length under heat stress (35 °C), and shoot length, root length and root dry weight under osmotic stress (−1.76 MPa) for the genotypes grouped in the different quadrants of the PCA.
3.5. Tolerance Indices
Tolerance indices were calculated only for the characteristics that showed a significant response to stress (Table 7 and Table 8). Higher STI and GMP values indicate greater tolerance, while lower SSI values indicate lower susceptibility. Considering root length under heat stress, the five cultivars that presented the best values for STI and GMP, indicating a greater capacity to maintain root growth under heat, were TBIO Capaz (STI = 0.911; GMP = 17.403), TBIO Ponteiro (STI = 0.873; GMP = 17.036), TBIO Talismã (STI = 0.849; GMP = 16.800), TBIO Astro (STI = 0.849; GMP = 16.798), and TBIO Audaz (STI = 0.801; GMP = 16.317). On the other hand, TBIO Valente (SSI = 1.694), ORS Soberano (SSI = 1.361), and TBIO Toruk (SSI = 1.355) showed greater relative susceptibility to heat stress (Table 7).
Table 7.
Stress tolerance indices calculated from the original values of root length for 28 wheat cultivars evaluated under control and heat stress (35 °C) at the early seedling stage. STI = Stress Tolerance Index; SSI = Stress Susceptibility Index; GMP = Geometric Mean Productivity.
Table 8.
Stress tolerance indices calculated from the original values of shoot length, root length, and root dry weight for 28 wheat cultivars evaluated under control and PEG-induced osmotic stress (−1.76 MPa) at the early seedling stage. STI = Stress Tolerance Index; SSI = Stress Susceptibility Index; GMP = Geometric Mean Productivity.
The highest STI and GMP values for shoot length under osmotic stress (−1.76 MPa), suggests a greater capacity to maintain growth under this condition, were detected in the cultivars ORS Completo (STI = 0.754; GMP = 12.251), TBIO Talismã (STI = 0.677; GMP = 11.608), ORS Gladiador (STI = 0.660; GMP = 11.458), ORS Absoluto (STI = 0.655; GMP = 11.415), and ORS Guardião (STI = 0.639; GMP = 11.278) (Table 8). The cultivars with the highest susceptibility to stress, with higher SSI values were TBIO Duque (SSI = 1.147), TBIO Valente (SSI = 1.133), TBIO Ponteiro (SSI = 1.130), TBIO Capaz (SSI = 1.103), and TBIO Titan (SSI = 1.097). For root length, the cultivars the highest STI and GMP values were detected in TBIO Capaz (STI = 0.752; GMP = 15.803), TBIO Ta-lismã (STI = 0.732; GMP = 15.592), TBIO Ponteiro (STI = 0.722; GMP = 15.494), ORS Falcão (STI = 0.685; GMP = 15.087), TBIO Audaz (STI = 0.682; GMP = 15.050), and TBIO Astro (STI = 0.674; GMP = 14.966). Higher SSI values, indicating greater susceptibility, were detected in the cultivars TBIO Valente (SSI = 1.410), ORS Soberano (SSI = 1.315), TBIO Duque (SSI = 1.225), TBIO Sentinela (SSI = 1.195), TBIO Ponteiro (SSI = 1.108) and TBIO Titan (SSI = 1.105). For the root dry weight, the cultivars ORS Falcão (STI = 2398; GMP = 120,853), ORS 1403 (STI = 2074; GMP = 112,399), TBIO Talismã (STI = 2040; GMP = 111,473), TBIO Valente (STI = 2005; GMP = 110,517), and ORS 2301 (STI = 1977; GMP = 109,724) showed the highest STI and GMP values. The cultivars with the highest susceptibility index were ORS Turbo (SSI = 1.587), ORS Absoluto (SSI = 1.525), TBIO Convicto (SSI = 1.422), TBIO Capaz (SSI = 1.273), and ORS Senna (SSI = 1.267).
4. Discussion
4.1. Early-Stage Screening of Wheat Cultivars Under Heat and Osmotic Stress
Proper stand establishment promotes suitable wheat growth and grain yield, and both are results of the genotype and the environment [23]. However, many factors can affect wheat stand establishment, including seed quality, sowing location, planting date, sowing density, tillage practices, crop establishment methods, and climatic conditions [7,9,23]. Consequently, not all wheat cultivars are equally adapted to different environmental conditions. Overall, the use of genotypes with superior early-stage performance is particularly interesting because stress-tolerant genotypes at this stage determine successful crop establishment, thereby laying the foundation for achieving their yield potential [24]. Therefore, selecting genotypes at early stages of development is a valuable strategy because it is easy to implement, cost-effective, reduces labor requirements, and enables early elimination of susceptible genotypes [25].
Early seedling screening under controlled conditions provides a more reliable approach for evaluating heat and PEG-induced osmotic stress because stress conditions can be controlled and analyzed independently, unlike field screening, where responses are influenced by complex interactions among environmental factors [10,11,13]. Furthermore, heat tolerance responses at the seedling stage have been shown to be closely related to tolerance responses at the adult stage, indicating that similar mechanisms of stress tolerance operate throughout different stages of plant development [10]. Therefore, early selection at the seedling stage enables the identification of promising genotypes capable of maintaining adequate plant stand under heat and/or osmotic stresses, facilitating their use in breeding programs aimed at improving tolerance to these stresses through crossing. This approach is particularly important in Brazil, where wheat cultivation has expanded into the Cerrado region in recent years. In this region, high temperatures and drought episodes are common during the growing season, unlike in southern Brazil, where wheat is predominantly cultivated during the winter [3]. Although most Brazilian wheat cultivars were originally developed for southern Brazil, many recently released cultivars, including most of the genotypes evaluated in this study, are currently being tested in the Cerrado conditions.
By definition, water stress occurs when soil and atmospheric moisture are low and air temperature is high, resulting from an imbalance between evapotranspiration and root water uptake [26]. Heat stress is defined as an increase in soil and air temperature above a threshold level for a sufficient period to cause irreversible damage to plant growth and development [26]. In our screening of 28 Brazilian wheat cultivars, we evaluated morphological differences in shoot length, root length and root dry weight under heat stress (35 °C) and PEG-induced osmotic stress simulating drought (osmotic potential of −1.76 MPa) during the early-seedling stage. We identified that osmotic stress was more discriminatory than heat stress (p ≤ 0.05) (Table 2). Heat affected only root length, while osmotic stress affected shoot length, root length, and root dry weight. This suggests that osmotic stress caused broader changes in plant growth. Although heat stress significantly affected only root length among the evaluated traits, the relative performance values for this trait ranged from 46.59% to 82.04% among cultivars (Table 3), indicating substantial variation in the magnitude of root growth reduction. This wide range demonstrates that root elongation was sufficiently sensitive to discriminate contrasting genotypic responses under heat stress, which is further supported by the relatively high broad-sense heritability estimated for this trait (H2 = 0.71). Plants exposed to heat stress often develop thinner leaves with a larger leaf area [27], which may explain the lack of significant differences in shoot length. Furthermore, the optimal temperature for root growth is generally lower than that for shoot growth [15]. Consequently, the effects of elevated temperature tend to be more pronounced in the roots. Consistent with this response, the relatively high broad-sense heritability estimates observed for root length under heat (H2 = 0.71) and osmotic stress (H2 = 0.70), together with the high genotypic coefficients of variation (9.3 and 10.3, respectively), indicate a substantial genotypic contribution to the observed phenotypic variation under the evaluated stress conditions (Table 4).
However, because root development plays a key role in water acquisition during the establishment phase, reductions in root length under both stress conditions may compromise plant stand establishment and subsequent performance in adverse environments. The detection of significant differences among cultivars under stress conditions indicates that the selected stress levels were sufficiently severe to reduce seedling growth while maintaining adequate phenotypic variation to discriminate among genotypes.
4.2. Importance of Root Traits in Stress Adaptation
At the whole-plant level, all abiotic stresses induce a cascade of physiological and molecular events that, in some cases, result in similar responses. The physiological responses of plants to drought and heat stress can be classified into two distinct mechanisms [27]: Avoidance mechanisms consist primarily of morphological and physiological adjustments that enable plants to minimize stress exposure, including increased root system, reduced number and conductance of stomata, decreased leaf area, increased leaf thickness, and leaf curling or folding to reduce evapotranspiration. In contrast, tolerance mechanisms maintain cell turgor through cellular and biochemical adjustments, primarily via osmotic adjustment. One of the main drought and heat tolerance strategies in wheat involves morphological modifications of the root system, including greater root dry weight, rooting depth, and root length [10,28]. Therefore, root traits, particularly root length and root dry weight, are especially valuable for screening wheat genotypes for tolerance to heat and drought stress.
Drought reduces cell expansion, tissue elongation, and nutrient absorption [27]. Thus, drought simultaneously compromises shoot and root growth, as identified in this study and in previous reports [14]. In contrast, the heat stress imposed in this study induced more restricted responses, mainly affecting root development. Root growth is frequently one of the first plant processes affected by elevated temperatures because root meristems are highly sensitive to changes in cellular metabolism, respiration, and hormonal regulation [15,27]. Consequently, reductions in root elongation may occur before visible changes in shoot development become apparent.
In our study, the root system represented one of the main adaptive mechanisms under osmotic and heat stress, allowing greater soil exploration and maintenance of water uptake. The importance of root traits was consistently demonstrated by univariate and multivariate analyses. Root length and root dry weight showed the highest heritability estimates under osmotic and heat stress. In addition, root length under both stress conditions contributed most strongly to PC1 and PC2, indicating that these root traits were the main sources of phenotypic differentiation among cultivars (Table 4 and Table 5). Furthermore, the relatively high heritability estimates suggest a substantial genotypic contribution to the observed phenotypic variation, indicating that these traits may be consistently expressed when cultivars are evaluated under similar osmotic and temperature conditions.
In our study, no cultivar consistently exhibited superior performance for root length, whereas all cultivars maintained higher relative performance for root dry weight than for root length (Table 3). Likewise, root traits proved to be critical during the early-stage screening of wheat cultivars under drought and heat stress, highlighting their role as an important adaptive mechanism under stress conditions [10,11]. Root traits are widely recognized as reliable indicators of adaptation to drought and heat because they directly influence soil exploration and water uptake and are considered important predictors of crop productivity [15].
One strategy for mitigating heat stress is canopy cooling, which is achieved through increased stomatal conductance and water uptake from the soil. In this context, a deeper and more extensive root system can enhance the water uptake required to sustain this mechanism. Genotypes with greater canopy cooling capacity have been shown to develop longer root systems under drought stress, allowing them to access water from deeper soil layers. In contrast, under heat stress without water limitation, these genotypes tend to prioritize the development of shallow roots [29].
In our study, even the most osmotic-stress-tolerant genotypes showed reduced root length (relative performance) under stress, although the reduction was smaller than that observed in the more sensitive genotypes. In contrast, relative root dry weight increased in all genotypes under osmotic stress, including the most sensitive ones, which may reflect greater lateral root development or cellular adjustments. Under heat stress, root length was also reduced in all cultivars. However, unlike drought, where greater root elongation represents an adaptive strategy to enhance water acquisition from deeper soil layers, heat stress alone does not impose water limitation. Therefore, root growth under heat stress is more likely constrained by the direct effects of elevated temperature on root meristem activity, cellular metabolism, and respiration than by the need to increase soil exploration. Consequently, genotypic differences in root development reflect distinct adaptive responses to water availability and temperature. Although root length and root dry weight exhibited relatively high heritability estimates under the evaluated conditions, rhizosphere conditions can strongly influence the expression of these traits. Therefore, field evaluations remain essential for validating root traits in wheat [29].
Root plasticity in response to environmental conditions encompasses a wide variety of physiological and morphological adjustments that modify root architecture and function, enabling plants to adapt to unfavorable conditions [15]. Therefore, understanding the genetic variation underlying these traits under different stress conditions provides valuable information for selecting cultivars adapted to specific growing environments.
4.3. Root Traits Exhibit High Heritability and Selection Potential Under Osmotic and Heat Stresses
In general, tolerance to abiotic stress, including heat and drought, is controlled by multiple genes and involves more complex genetic mechanisms than resistance to biotic stresses, which are often characterized by one or a few major genes [27]. Therefore, heritability estimates are particularly interesting for screening genotypes based on morphological traits because they indicate the proportion of the observed phenotypic variation attributable to genetic differences among cultivars [30,31]. Heritability can be expressed as broad-sense heritability (H2), which accounts for the total genetic variance (additive, dominance, and epistatic effects), or narrow-sense heritability (h2), which includes only the additive genetic variance [32]. Because the wheat cultivars evaluated in this study are highly homozygous, H2 was considered the most appropriate parameter to quantify the contribution of genetic effects to the observed phenotypic variation [32]. Consequently, traits exhibiting relatively high H2 estimates under the evaluated stress conditions may represent useful targets for the selection of promising cultivars in early-stage screening programs.
The high heritability estimates identified in this study indicate that much of the variation observed among the cultivars suggests that the performance of these cultivars in another environment under the same stresses is likely to be very similar (Table 4). Furthermore, being a strongly controlled genetic trait, its use in crossing blocks is advantageous since the probability of this trait being passed on to the next generation is high. Generally, H2 values < 0.30 are considered to have low heritability, H2 values between 0.30 and 0.60 to have moderate heritability, and H2 values > 0.60 to have high heritability. The high H2 estimates observed for root length (0.70) and root dry weight (0.70) under osmotic stress and for root length under heat stress (0.71) indicate that a substantial proportion of the phenotypic variation was associated with genetic differences among cultivars (Table 4). High heritability for root traits of wheat seedlings under drought was also previously observed, and it was found that H2 for root traits is greater than H2 for leaf traits of wheat seedlings under drought, as observed in our study [33]. Therefore, root-related traits have the potential to be used as selection criteria for drought-tolerant cultivars, thus enabling stability in maintaining plant stand establishment under these conditions. Similarly, cultivars selected based on this morphological marker can be used in breeding programs for drought tolerance. The wheat cultivars evaluated in this study originated from different breeding programs and likely represent a broad genetic background. However, pedigree information was not incorporated into the analyses; therefore, the heritability estimates reflect the overall genotypic contribution to phenotypic variation among the evaluated cultivars rather than the contribution of specific genetic relationships. Future studies integrating pedigree or genomic relationship information could provide further insight into the genetic basis of stress tolerance at the seedling stage.
Together with H2, the coefficients of variation (CVe and CVg) provide complementary information for evaluating the selection potential of traits under stress conditions. The environmental coefficient of variation (CVe) expresses the relationship between the residual variation among experimental replicates and the trait mean, providing an estimate of experimental variability and, consequently, the reliability of the experiment. Lower CVe values indicate greater experimental precision. In contrast, the genotypic coefficient of variation (CVg) expresses the relationship between the genetic variance among the evaluated cultivars and the trait mean, reflecting the amount of genetic variability available for selection. Higher CVg values indicate greater genetic variability among cultivars, whereas lower values indicate a more homogeneous population. Therefore, CVg is commonly interpreted together with H2 to assess the potential response to selection. In the present study, the relatively high CVg values observed for root-related traits under osmotic stress indicate substantial genetic variability among the evaluated Brazilian wheat cultivars, reinforcing the suitability of these traits for early-stage screening (Table 4). Root length and root dry weight showed genetic coefficient of variation (CVg) values close to those of the environmental coefficient of variation (CVe), evidencing a greater contribution of genetic variability to phenotypic expression and greater potential for selecting genotypes tolerant to osmotic stress (Table 4).
The CVg/CVe ratio is particularly interesting in screening genotypes for abiotic stresses since it expresses the relationship between the variability of the cultivar panel and the effects of experimental error. When a CVg/CVe ratio > 1 is observed, there is a strong predominance of genetic variability, and CVg/CVe values ~ 1 indicate that selection is considered quite promising. Thus, high CVg/CVe ratio values of root length and root dry weight under osmotic stress highlight the suitability of these traits for the selection of wheat cultivars at the seedling stage. Consequently, root traits measured under osmotic and heat stress, which showed substantially high heritability estimates, appear to be reliable indicators for the initial screening of stress-tolerant wheat cultivars.
4.4. Distinct Root-Based Response Patterns Under Heat and Osmotic Stress
Scott–Knott test revealed that wheat cultivars differed in their morphological responses to stress, indicating that adaptation was achieved through distinct response strategies rather than a single adaptive pattern. Instead, distinct groups of cultivars were identified, suggesting the existence of alternative adaptive strategies during early seedling development. Interestingly, three distinct root response profiles were identified in relation to osmotic and heat stress conditions. The first profile was characterized by the maintenance of root length under heat and osmotic stress. Cultivars exhibiting the highest relative root length under heat stress were also among those showing the best performance under osmotic stress (Table 3). Specifically, ORS 1403, ORS 2302, ORS Absoluto, ORS Falcão, and ORS Guardião were classified within the highest performing group under both heat and osmotic stress. Previous studies have shown that heat-tolerant wheat genotypes at the seedling stage tend to maintain root length under stress, which is considered adaptive because it increases root surface area and improves soil exploration [10,15].
The second response profile comprised cultivars that exhibited superior root length together with higher relative root dry weight under osmotic stress, including TBIO Astro, TBIO Aton, and TBIO Calibre (Table 3). These results suggest that these cultivars were able to maintain root growth and biomass under water-limited conditions, reflecting a potentially more efficient adaptation strategy. The third response profile comprised cultivars that showed the greatest reduction in root length and the highest relative root dry weight under osmotic stress, including TBIO Sentinela, TBIO Talismã, TBIO Titan, TBIO Toruk, and TBIO Valente. Principal component analysis (PCA) corroborated these contrasting response patterns, as PC1 separated cultivars associated with greater root and shoot elongation from those associated with greater root dry weight, while PC2 was mainly influenced by root length under heat stress. (Figure 3). These results suggest that these cultivars may reflect increased root diameter, greater tissue density, or other anatomical adjustments, which could enhance root persistence and hydraulic conductance under stress conditions, although it potentially limits soil exploration compared with cultivars prioritizing root elongation [27].
It is interesting to note that the response patterns identified by Scott–Knott clustering were not fully reproduced by PCA, which is expected, since the two approaches capture different aspects of the data. While Scott–Knott clustering classified cultivars according to the performance of individual traits, PCA summarized the combined variation among multiple traits simultaneously. Therefore, both analyses should be considered complementary for understanding cultivar responses to heat and osmotic stress.
The results suggest the existence of different adaptive strategies among the evaluated cultivars. While some genotypes invest in development (greater root dry weight), others invest in exploitation (less reduction in root development). This diversity of responses highlights the complexity of stress adaptation in wheat and reinforces the importance of combining multiple traits when selecting cultivars for better establishment in adverse environments.
4.5. Complementary Approaches for Identifying Promising Wheat Cultivars Under Heat and Osmotic Stress
The use of indices in the early stages of plant development is considered a robust and precise phenotyping tool in breeding programs and seed technology research [34]. Stress tolerance indices have been used to evaluate the performance and stability of elite wheat genotypes under optimal and stress conditions [12]. Several indices have been proposed to help identify wheat cultivars tolerant to drought and heat stress, such as the Stress Tolerance Index (STI), Stress Susceptibility Index (SSI), and Geometric Mean Productivity (GMP) [35,36]. High STI values indicate cultivars capable of maintaining superior performance under stress conditions [19] while high GMP values reflect stable performance across favorable and stressful conditions, indicating greater adaptability to variable environments [21]. On the other hand, lower SSI values indicate reduced susceptibility to stress and a greater capacity to maintain growth under adverse conditions [20]. Thus, STI, SSI and GMP provide complementary information on stress adaptation, allowing the identification of cultivars that combine high performance, stability, and reduced susceptibility under adverse conditions. Because stress adaptation is a multidimensional trait, no single analytical approach is sufficient to fully characterize cultivar performance. Therefore, cultivar responses were interpreted based on three complementary criteria: (i) maintenance of relative performance under stress (Scott–Knott analysis), (ii) superior performance according to stress tolerance indices (STI, SSI, and GMP), and (iii) integrated multivariate phenotypic responses revealed by principal component analysis (PCA). Together, these approaches provide a more comprehensive assessment of stress adaptation during early-seedling development.
Following the characterization of root response patterns based on relative performance, stress tolerance indices and PCA were jointly applied to identify cultivars that consistently exhibited superior performance across multiple complementary analytical approaches.
As diferenças entre as cultivares evidenciadas pela PCA e pelo STI eram esperadas, uma vez que esses métodos avaliam aspectos distintos da adaptação ao estresse (Figure 4). Enquanto o STI identifica cultivares capazes de manter um desempenho relativo superior sob estresse em comparação com a testemunha, a PCA sintetiza as relações multivariadas globais entre as características morfológicas. Consequentemente, não se espera uma concordância total entre as duas abordagens, e a interpretação conjunta delas fornece uma base mais robusta para a seleção de cultivares.
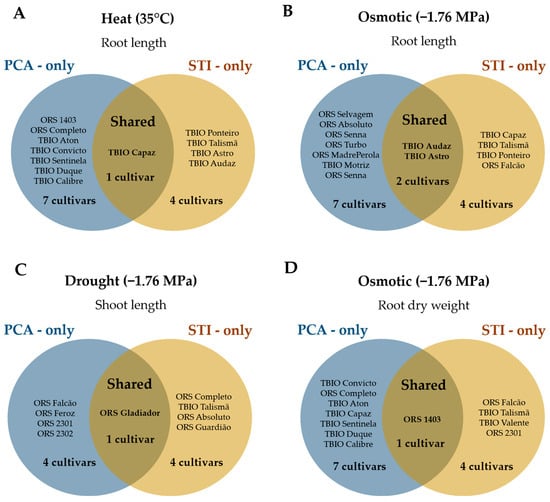
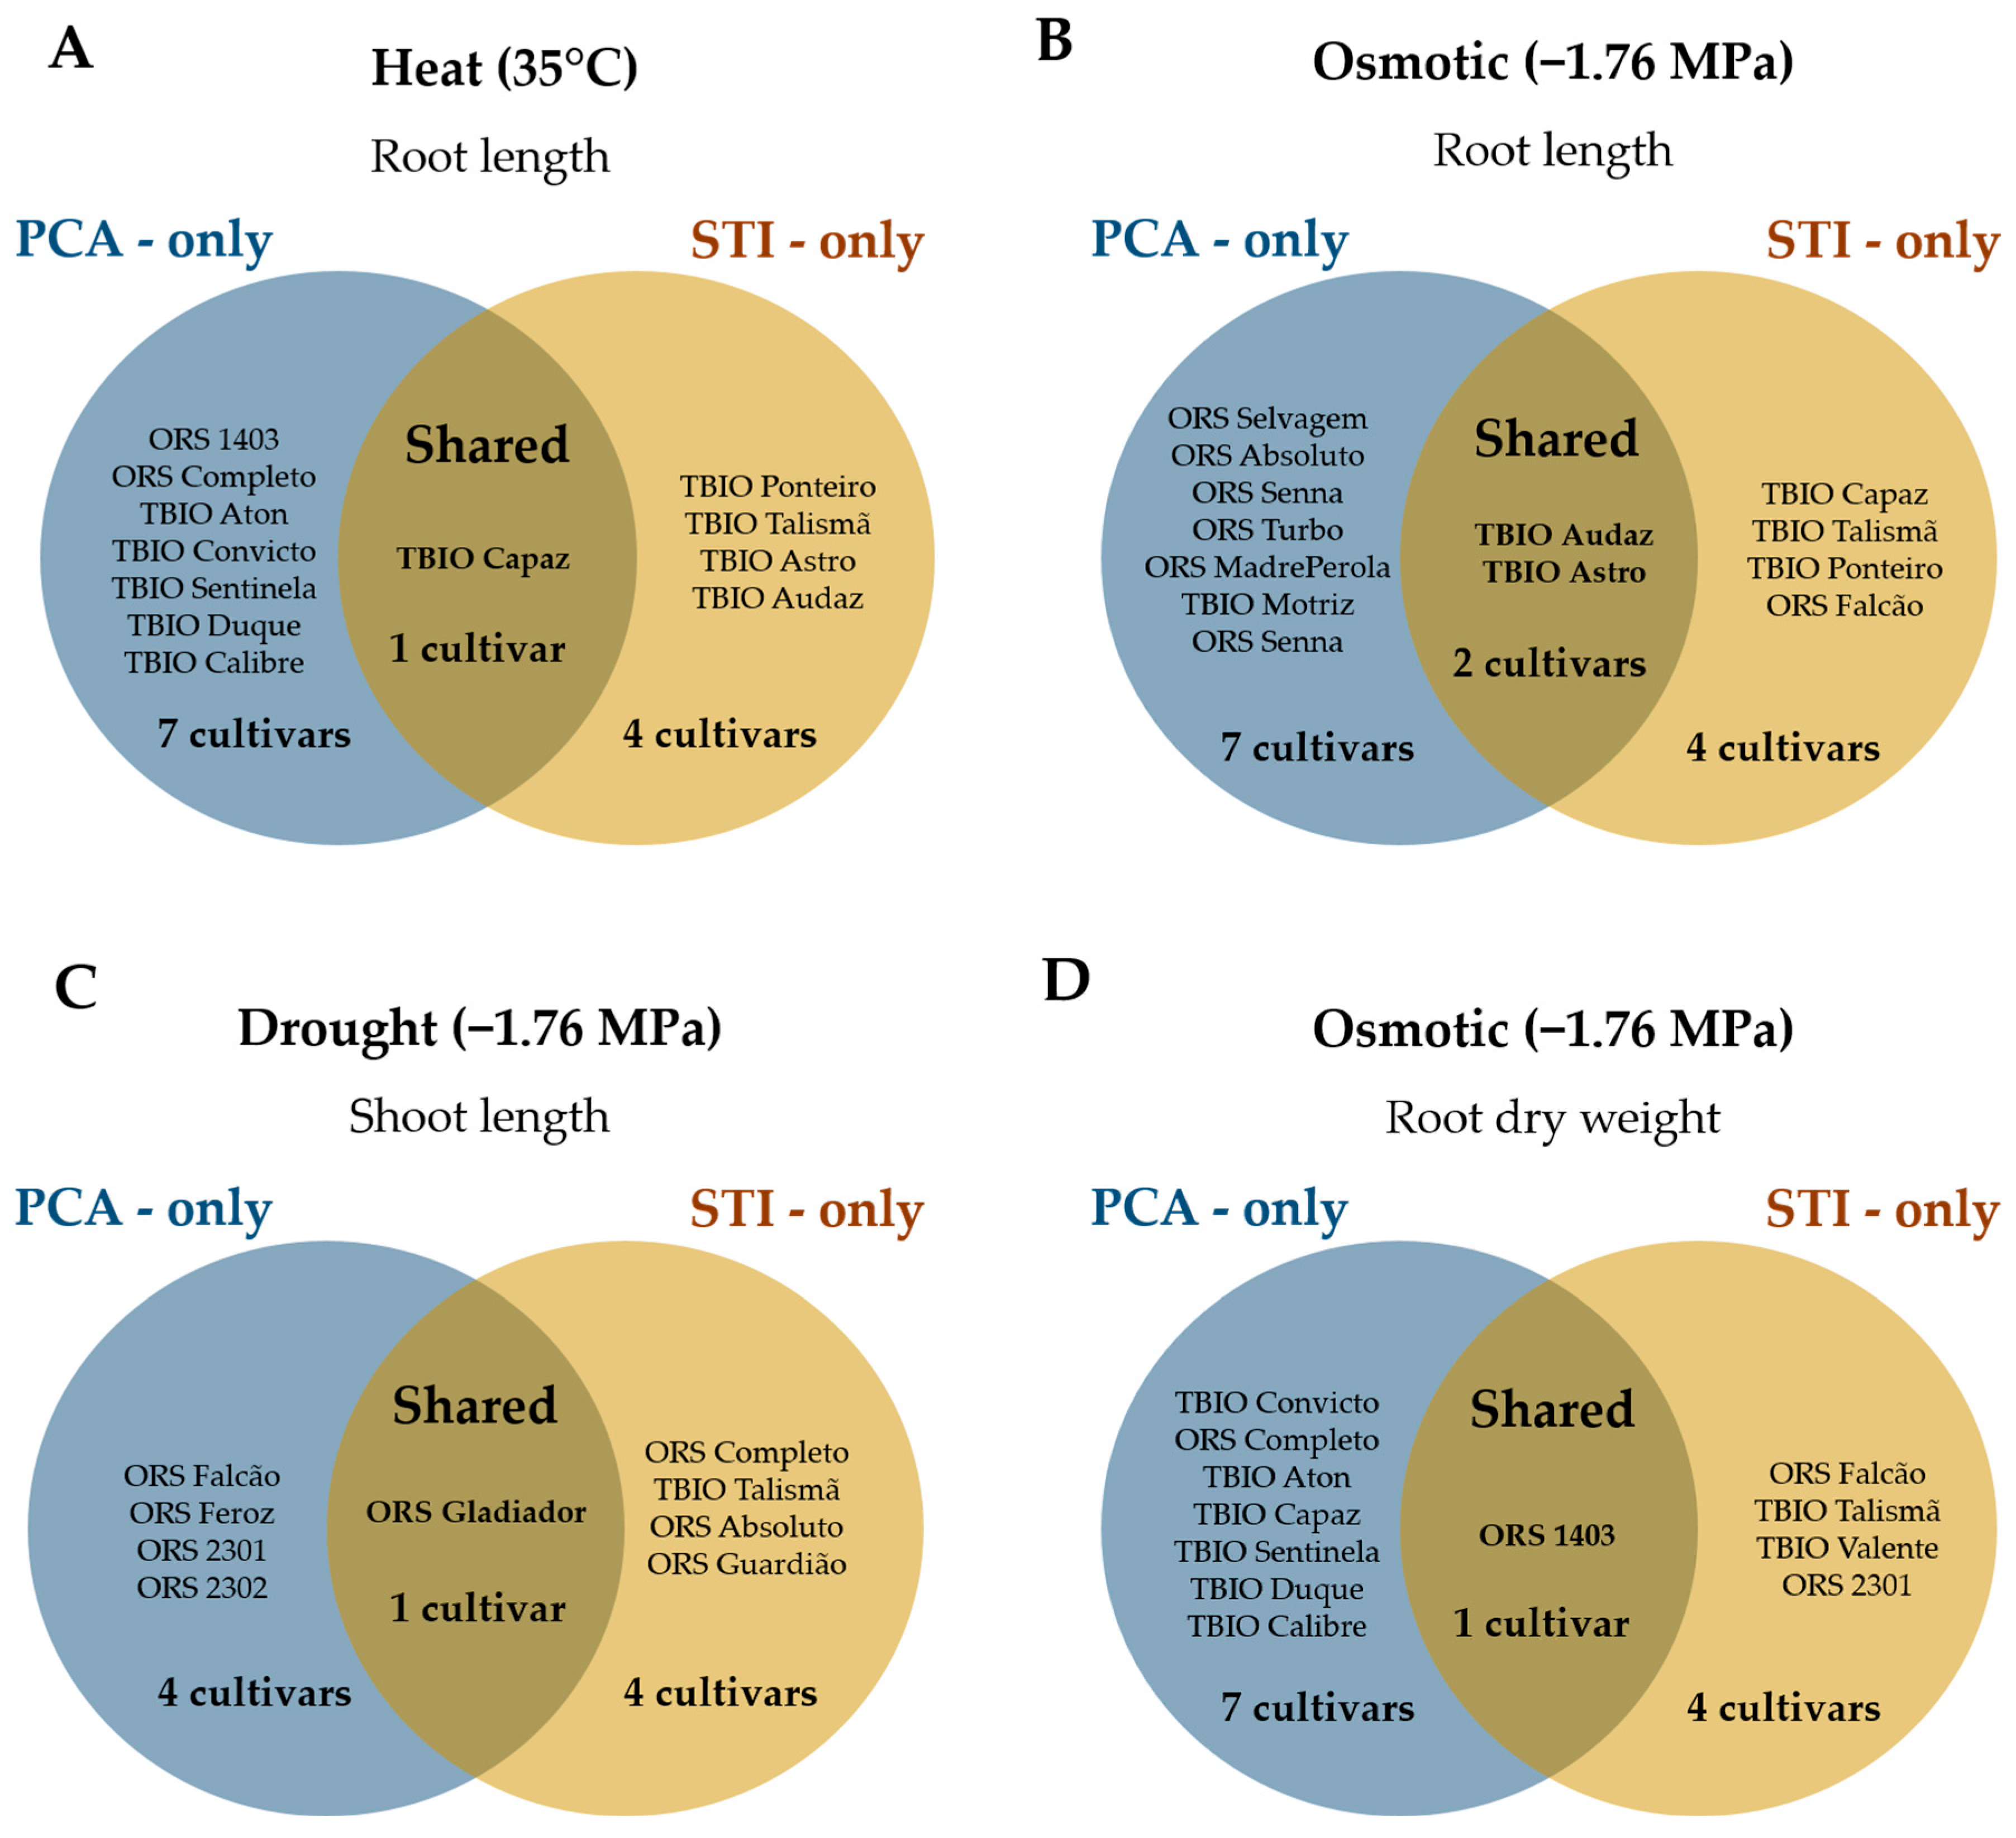
Figure 4.
Venn diagram showing the most promising wheat cultivars for heat and osmotic stresses based on the morphological traits of root length, shoot length and root dry weight as estimated by principal component analysis (PCA) in the positive region of PC1 and stress tolerance index (STI). (A): Promising cultivars for heat stress with respect to greater root length; (B): promising cultivars for osmotic stress with respect to greater root length; (C): promising cultivars for osmotic stress with respect to greater shoot length; and (D): promising cultivars for osmotic stress with respect to greater root dry weight.
Although PCA and the Stress Tolerance Index (STI) did not identify identical cultivars, the convergence of these two approaches highlighted a subset of genotypes that consistently exhibited favorable stress tolerance indices alongside advantageous multivariate phenotypic profiles. These cultivars can therefore be considered the most robust candidates for early adaptation to heat and drought stress. Regarding root length, the TBIO Capaz cultivar was identified by PCA and STI under heat stress, and TBIO Audaz and TBIO Astro under osmotic stress (Figure 4A,B). In contrast, the ORS Gladiador cultivar was identified by both approaches regarding shoot length under osmotic stress conditions (Figure 4C). Root dry weight identified ORS 1403 as the only cultivar consistently selected by PCA and STI, indicating superior maintenance of root biomass accumulation under osmotic stress (Figure 4D).
The partial convergence between the stress tolerance indices and PCA reinforces that cultivar performance under abiotic stress cannot be adequately characterized using a single criterion. Relative performance analyses revealed contrasting patterns of root responses, stress tolerance indices quantified the ability of cultivars to maintain performance under stress, whereas PCA synthesized the overall phenotypic relationships among the evaluated traits. Consequently, the cultivars consistently identified by these complementary approaches represent the most promising candidates for breeding programs aimed at improving adaptation to heat and drought stress. One methodological limitation of this study is that the stress levels used in the preliminary assay were calibrated using a single wheat cultivar (ORS Feroz). Although this approach may not fully capture cultivar-specific differences in sensitivity to heat and drought stress, the selected stress conditions successfully discriminated the responses of the 28 evaluated cultivars across a wide range of seedling traits, as demonstrated by the moderate-to-high heritability estimates and the clear phenotypic patterns revealed by the multivariate analyses. These findings indicate that the adopted stress levels were appropriate for comparative screening at the early seedling stage, although future studies including multiple cultivars during stress calibration may further refine the definition of stress thresholds for large-scale screening. Although the present study focused on early seedling responses under controlled conditions, future studies integrating greenhouse and field evaluations, including stand establishment, agronomic performance, and grain yield, will be important to validate the promising cultivars identified here under natural heat and drought conditions.
5. Conclusions
The results revealed substantial genetic variability among Brazilian wheat cultivars in their responses to combined heat and PEG-induced osmotic stress during early developmental stages. Although both stress conditions generally reduced seedling growth, cultivar responses differed markedly, revealing distinct adaptive strategies based primarily on root length and root dry weight. Root-related traits proved to be valuable indicators of stress response and exhibited substantial genotypic contributions to the observed phenotypic variation under the evaluated conditions, highlighting their usefulness for early-stage screening. The integration of relative performance analysis, stress tolerance indices, and principal component analysis provided complementary information for identifying promising cultivars with contrasting adaptive strategies. This integrated approach increased confidence in the identification of cultivars showing consistent performance across multiple analytical methods. Therefore, early-stage screening under controlled heat and PEG-induced osmotic stress conditions represents an effective and practical approach for identifying promising wheat cultivars with superior establishment potential under abiotic stress. These findings provide valuable information for wheat breeding programs aimed at improving seedling vigor and adaptation to increasingly challenging environments. Nevertheless, the cultivars identified in this study should be considered promising candidates for further validation under greenhouse and field conditions before their performance under natural stress environments can be confirmed.
Author Contributions
Conceptualization, V.E.V., C.P., L.C.d.M. and A.C.d.O.; methodology, V.E.V., C.P. and L.C.d.M.; software, A.d.A.P., J.C.P.J.d.A.F., V.E.V., C.P. and L.C.d.M.; validation, A.d.A.P., J.C.P.J.d.A.F., T.M.M., T.A.M., V.E.V., C.P. and L.C.d.M.; formal analysis, A.d.A.P., J.C.P.J.d.A.F., V.E.V., C.P. and L.C.d.M.; investigation, A.d.A.P., J.C.P.J.d.A.F., T.M.M., T.A.M., L.C.d.M., C.P. and V.E.V.; resources, A.C.d.O., L.C.d.M., C.P. and V.E.V.; data curation, A.d.A.P., J.C.P.J.d.A.F., L.C.d.M., C.P. and V.E.V.; writing—original draft preparation, A.d.A.P., J.C.P.J.d.A.F., L.C.d.M., C.P. and V.E.V.; writing—review and editing, L.C.d.M., C.P. and V.E.V.; visualization, L.C.d.M., C.P. and V.E.V.; supervision, C.P. and V.E.V.; project administration, C.P. and V.E.V.; funding acquisition, A.C.d.O., L.C.d.M., C.P. and V.E.V. All authors have read and agreed to the published version of the manuscript.
Funding
This research was funded by Conselho Nacional de Desenvolvimento Científico e Tecnológico (CNPq), Coordenação de Aperfeiçoamento de Pessoal de Nível Superior (CAPES) grant No. 001, and Fundação de Amparo à Pesquisa do Estado do Rio Grande do Sul (FAPERGS).
Institutional Review Board Statement
Not applicable.
Data Availability Statement
The dataset is available on request from the authors. The raw data supporting the conclusions of this article will be made available by the authors on request.
Acknowledgments
During the preparation of this manuscript/study, the authors used ChatGPT Go version GPT-5.5 to assist with grammatical revision, to create the schematic view of the experiment (Figure 1) and to search for references. The authors have reviewed and edited the output and take full responsibility for the content of this publication.
Conflicts of Interest
The authors declare no conflicts of interest.
References
- Sharma, K.; Sharma, P.K. Wheat as a Nutritional Powerhouse: Shaping Global Food Security. In Triticum—The Pillar of Global Food Security; IntechOpen: London, UK, 2025. [Google Scholar] [CrossRef] [Scilit]
- CNA. Panorama do Agro|Edição 07: Semana de 16/03 a 20/03/2026; Confederação da Agricultura e Pecuária do Brasil (CNA): Brasília, Brazil, 2026; Available online: https://cnabrasil.org.br/publicacoes/panorama-do-agro-semana-02-02-a-06-02-2026-edicao-07 (accessed on 5 May 2026).
- Bragagnolo, C.; Caldas, M.M. Wheat expansion in the Brazilian Cerrado: Drivers, land use changes, and policy implications. J. Land Use Sci. 2026, 21, 150–162. [Google Scholar] [CrossRef] [Scilit]
- Xiao, K.; Zhou, X.; Gui, H.; Matomela, N.; Xin, Q.; Tian, Y.; Chen, X.; Li, Y. Drought and Extreme Heat Reduce Wheat and Maize Production in the United States by Lowering Both Crop Yields and Harvestable Fraction. Adv. Earth Sp. Sci. 2025, 13, e2024EF005. [Google Scholar] [CrossRef] [Scilit]
- Lobell, D.B.; Tommaso, S.D. A half century of climate change in major agricultural regions: Trends, impacts, and surprises. Proc. Natl. Acad. Sci. USA 2025, 122, e2502789122. [Google Scholar] [CrossRef] [Scilit] [PubMed]
- Senapati, N.; Halford, N.G.; Hawkesford, M.J.; Shewry, P.R. Extreme heat and drought at flowering could threaten global wheat yields under climate change. Clim. Change 2026, 179, 28. [Google Scholar] [CrossRef] [Scilit] [PubMed]
- Ram, J.; Soltani, E. Sowing and seedbed management methods to improve establishment and yield of maize, rice and wheat across drought-prone regions: A review. J. Agric. Food Res. 2020, 2, 100089. [Google Scholar] [CrossRef] [Scilit]
- Lindsey, L.E.; Goodwin, A.W.; Harrison, S.K.; Paul, P.A. Optimum seeding rate and stand assessment of soft red winter wheat. Agron. J. 2021, 112, 4069–4075. [Google Scholar] [CrossRef] [Scilit]
- Copeland, J.P.; Pennington, D.; Singh, M.P. Maximizing winter wheat yield through planting date and seeding rate management. Crop Forage Turfgrass Manag. 2023, 9, e20240. [Google Scholar] [CrossRef] [Scilit]
- Lu, L.; Liu, H.; Wu, Y.; Yan, G. Wheat genotypes tolerant to heat at seedling stage tend to be also tolerant at adult stage: The possibility of early selection for heat tolerance breeding. Crop J. 2022, 10, 1006–1013. [Google Scholar] [CrossRef] [Scilit]
- Chapagain, S.; Kandel, B.P.; Poudel, A.; Gautam, S.; Subedi, S. Assessment of early seedling stage indices for the selection of potential drought-tolerant bread wheat genotypes. Dicover Appl. Sci. 2026, 8, 248. [Google Scholar] [CrossRef] [Scilit]
- Bhandari, R.; Paudel, H.; Ali, S.; Javed, M.; Ram, M.; Prasad, M.; Solanki, P.; Kumar, U.; Kushwaha, S. Evaluating stress tolerance indices for their comparative validity to access terminal heat stress and heat drought tolerance of winter wheat (Triticum aestivum L.) genotypes. J. Agric. Food Res. 2024, 18, 101506. [Google Scholar] [CrossRef] [Scilit]
- Suzuki, N.; Rivero, R.M.; Shulaev, V.; Blumwald, E.; Mittler, R. Abiotic and biotic stress combinations. New Phytol. 2014, 203, 32–43. [Google Scholar] [CrossRef] [Scilit] [PubMed]
- Mathew, I.; Shimelis, H.; Mutema, M.; Clulow, A.; Zengeni, R.; Mbava, N.; Chaplot, V. Selection of wheat genotypes for biomass allocation to improve drought tolerance and carbon sequestration into soils. J. Agron. Crop Sci. 2019, 205, 385–400. [Google Scholar] [CrossRef] [Scilit]
- Calleja-Cabrera, J.; Boter, M.; Pernas, M. Root Growth Adaptation to Climate Change in Crops. Front. Plant Sci. 2020, 11, 544. [Google Scholar] [CrossRef] [Scilit] [PubMed]
- Kaufmann, M.R. The Osmotic Potential of Polyethylene Glycol 60001. Plant Phisiol. 1973, 51, 914–916. [Google Scholar] [CrossRef] [Scilit]
- Hussain, S.; Chachar, Q.; Chachar, S.; Chachar, B.K.; Jatoi, W.A.; Siddiquie, M.A.; Rindh, R.A. Temperature Regimes on Seeds Germination and Growth Parameters of Wheat (Triticum aestivum L.) Genotypes at Early Seedling Stage. Biol. Sci.-PJSIR 2020, 63, 214–225. [Google Scholar] [CrossRef] [Scilit]
- Sharma, S.; Singh, V.; Tanwar, H.; Mor, V.S.; Kumar, M.; Punia, R.C.; Dalal, M.S.; Khan, M.; Sangwan, S.; Bhuker, A.; et al. Impact of High Temperature on Germination, Seedling Growth and Enzymatic Activity of Wheat. Agriculture 2022, 12, 1500. [Google Scholar] [CrossRef] [Scilit]
- Fernandez, G.C.J. Effective Selection Criteria for Assessing Plant Stress Tolerance. In International Symposium on Adaptation of Food Crops to Temperature and Water Stress Taiwan Aug 13–18, 1992; AVRDC: Tainan, Taiwan, 1992; pp. 257–270. [Google Scholar] [CrossRef]
- Fischer, R.A.; Maures, R. Drought Resistance in Spring Wheat Cultivars, 1. Grain Yield Responses. Aust. J. Agric. Res. 1978, 29, 897–912. [Google Scholar] [CrossRef] [Scilit]
- Rosielle, A.A.; Hamblin, J. Theoretical Aspects of Selection for Yield in Stress and Non-Stress Environments. Crop Sci. 1981, 21, 943–946. [Google Scholar] [CrossRef] [Scilit]
- Hallauer, A.R.; Filho, J.B.M.; Carena, M.J. Hereditary Variance: Mating Designs. In Quantitative Genetics in Maize Breeding, Handbook of Plant Breeding; Springer: New York, NY, USA, 2010; pp. 81–167. [Google Scholar]
- Iqbal, M.M.; Khan, I.; Chattha, M.U.; Hassan, M.U.; Iqbal, M.; Farooq, M. Performance of Wheat Cultivars Under Different Tillage and Crop Establishment Methods. Int. J. Plant Prod. 2022, 16, 287–297. [Google Scholar] [CrossRef] [Scilit]
- Singh, C.; Yadav, S.; Khare, V.; Gupta, V.; Patial, M.; Kumar, S.; Singh, G.; Tiwari, R. Wheat Drought Tolerance: Unveiling a Synergistic Future with Conventional and Molecular Breeding Strategies. Plants 2025, 14, 1053. [Google Scholar] [CrossRef] [Scilit] [PubMed]
- Ahmad, N.S.; Kareem, S.H.S.; Mustafa, K.M.; Ahmad, D.A. Early Screening of Some Kurdistan Wheat (Triticum aestivum L.) Cultivars under Drought Stress. J. Agric. Sci. 2017, 9, 88–103. [Google Scholar] [CrossRef] [Scilit]
- Lipiec, J.; Doussan, C.; Nosalewicz, A.; Kondracka, K. Effect of drought and heat stresses o n plant growth and yield: A review. Int. Agrophysics 2013, 27, 463–477. [Google Scholar] [CrossRef] [Scilit]
- Lamaoui, M.; Jemo, M.; Datla, R.; Bekkaoui, F. Heat and Drought Stresses in Crops and Approaches for Their Mitigation. Front. Chem. 2018, 6, 26. [Google Scholar] [CrossRef] [Scilit] [PubMed]
- Nezhadahmadi, A.; Prodhan, Z.H.; Faruq, G. Drought Tolerance in Wheat. Sci. World J. 2013, 2013, 610721. [Google Scholar] [CrossRef] [Scilit] [PubMed]
- Shahmir, A.; Kalhoro, A.; Wajid, F. Exploring the variability of root system architecture under drought stress in heat-tolerant spring-wheat lines. Plant Soil 2024, 502, 103–119. [Google Scholar] [CrossRef] [Scilit]
- Acquaah, G. Breeding Rice. In Principles of Plant Genetics and Breeding; John Wiley & Sons, Ltd.: West Sussex, UK, 2012; pp. 606–610. [Google Scholar]
- Acquaah, G. Introduction to Quantitative Genetics. In Principles of Plant Genetics and Breeding; John Wiley & Sons, Ltd.: West Sussex, UK, 2012; pp. 63–94. [Google Scholar]
- Falconer, D.S.; Mackay, T.F.C. Introduction to Quantitative Genetics, 4th ed.; Longman: London, UK, 1996; ISBN 0582243025. [Google Scholar]
- Sallam, A.; Awadalla, R.A.; Elshamy, M.M.; Andreas, B.; Heikal, Y.M. Genome-wide analysis for root and leaf architecture traits associated with drought tolerance at the seedling stage in a highly ecologically diverse wheat population. Comput. Struct. Biotechnol. J. 2024, 23, 870–882. [Google Scholar] [CrossRef] [Scilit] [PubMed]
- Sedghi, M. An integrated assessment of seed germination performance using classical and complementary metrics under abiotic stress. Sci. Rep. 2025, 15, 41880. [Google Scholar] [CrossRef] [Scilit] [PubMed]
- Farshadfar, E.; Sutka, J. Multivariate analysis of drought tolerance in wheat substitution lines. Cereal Res. Commun. 1993, 31, 33–40. [Google Scholar]
- Lamba, K.; Kumar, M.; Singh, V.; Chaudhary, L.; Sharma, R.; Yashveer, S.; Dalal, M.S. Heat stress tolerance indices for identification of the heat tolerant wheat genotypes. Sci. Rep. 2023, 13, 10842. [Google Scholar] [CrossRef] [Scilit] [PubMed]

Disclaimer/Publisher’s Note: The statements, opinions and data contained in all publications are solely those of the individual author(s) and contributor(s) and not of MDPI and/or the editor(s). MDPI and/or the editor(s) disclaim responsibility for any injury to people or property resulting from any ideas, methods, instructions or products referred to in the content. |
© 2026 by the authors. Licensee MDPI, Basel, Switzerland. This article is an open access article distributed under the terms and conditions of the Creative Commons Attribution (CC BY) license.