


Abstract
Objectives: The evidence for treating rheumatoid arthritis (RA) with a treat-to-target (T2T) approach was examined for clinical outcomes. Methods: Since August 2010, RA treatment has implemented the T2T strategy, aiming to achieve a simplified disease activity index (SDAI). The SDAI, Health Assessment Questionnaire Disability Index (HAQ), and pain score (PS-VAS) were monitored. The relationships between these clinical outcomes and variables, including changes in medication, were investigated. Results: Over a 15-year follow-up of 764 RA patients, the total duration was divided into two periods for each outcome. In the First period, the average dose of methotrexate (MTX) increased (p < 0.001). At the same time, glucocorticoids use (GCs) decreased (p < 0.001), and biologic and targeted synthetic disease-modifying anti-rheumatic drugs (bDMARDs and tsDMARDs) use increased (p < 0.01). Consequently, the mean SDAI score declined (p < 0.001), which was attributed to an increase in MTX dose and a decrease in GCs use, However, HAQ scores increased (p < 0.01), and PS-VAS remain stable. In the Second period, the average MTX dose decreased despite stable SDAI and decreasing HAQ scores and PS-VAS (p < 0.01), which was attributed to an increase in the use of tsDMARDs, particularly baricitinib, upadacitinib, and filgotinib (p < 0.01). Overall, the average age increased (p < 0.001), while SDAI scores dropped (p < 0.001), and HAQ scores and PS-VAS decreased (p < 0.01). Conclusions: Clinical outcomes stayed stable with changes in medication use under the T2T approach.
1. Introduction
In recent decades, the treatment of rheumatoid arthritis has seen significant advances [1,2,3]. Standardization of treatment approaches, driven by the development and widespread adoption of molecularly targeted drugs, has yielded notable benefits, including the prevention of comorbidities and the achievement of clinical remission as a treatment goal [4,5,6,7,8,9,10,11,12,13,14]. It has been fifteen years since treat-to-target (T2T) was introduced for rheumatoid arthritis (RA) [15]. Today, clinicians can measure disease activity quantitatively, and aiming for clinical remission has become standard practice, thereby expanding the knowledge base. The core principles of T2T remain consistent, emphasizing shared decision-making and regular monitoring of patients’ clinical indicators [15,16,17,18,19]. The T2T treatment strategy increases the clinical remission rate in RA patients, not only in the early stage but also in the established stage in daily clinical practice [20].
The IORRA cohort study shows a significant decline in disease activity from 2000 to 2020, along with increased use of methotrexate (MTX) and biological disease-modifying anti-rheumatic drugs (bDMARDs). However, MTX prescription rates have plateaued, indicating stagnation in efforts to improve disease control [21]. A similar pattern was reported in a recent article. The article reported stagnation in disease activity control, in line with a decrease in MTX dosage, in a registry of patients treated with biological and targeted synthetic disease-modifying anti-rheumatic drugs (bDMARD and tsDMARD). The authors concluded that declining renal function, due to patient aging, contributed to this stagnation in MTX use [22]. These research results suggest that while T2T has made tight control of disease activity more accessible, this is closely tied to the drug’s efficacy and safety, and that drug prescriptions and dosages must be adjusted to match disease activity and the patient’s condition or background factors.
Examining clinical outcomes and analyzing drug administration trends helps us understand how we manage RA under the T2T strategy and clarify the relationship between drug effectiveness in real-world clinical practice [23,24]. In this study, we reviewed trends in disease activity, functional capacity, and quality of life, which may be associated with clinical parameters, including drug use, in a single institute. This research aims to clarify the evidence supporting RA treatment under the T2T strategy by analyzing RA clinical indices and their monthly changes.
2. Materials and Methods
We began treating RA patients who met the ACR/EULAR 2010 classification criteria [25] with a T2T strategy in August 2010 (baseline; BL). The core idea of our T2T approach is to set treatment targets agreed upon by doctors, patients, and their families, and to choose a treatment plan they can all support. The goal is to achieve clinical remission, as measured by indices such as the simplified disease activity index (SDAI) or clinical disease activity index (CDAI), within six months. We monitor SDAI as an indicator of disease activity, along with the Health Assessment Questionnaire Disability Index (HAQ), to assess functional ability. These three measures have been tracked since baseline. At the same time, pain scores using a visual analog scale (PS-VAS) have been recorded from BL. These three parameters are designated as primary outcomes. The Euro-QOL 5-Dimension score (EQ-5D), which reflects quality of life, has been measured since January 2016. The SDAI remission rate (SDAI-RR) and the EQ-5D score are considered secondary outcomes. These measures are collected at every consultation, which occurs routinely every one to three months, depending on disease activity, or at appropriate times, such as when treatment strategies are changed. Monthly averages for each outcome at the institute are calculated from the monthly data.
2.1. Patient Recruitment
Patients with RA who were treated under the T2T strategy from the first consultation and followed for at least one consecutive year were included in the study. Patients who dropped out for any reason within one year of the first consultation were excluded. We retrospectively collected patients’ clinical data from August 2010 to April 2025. Ethical review approval was waived for this study by the Genyu Ethics Committee due to this study guaranteeing patient anonymity, and is not a follow-up study of patients, but rather a fol-low-up study of the facility. Informed consent was obtained from all subjects involved in the study.
2.2. Defining a Period
We defined phases as periods during which each monthly outcome follows the same trend, driven by changes in that outcome. (1) When there is a consecutive series of more than 6 months of increase or decrease in the monthly average compared with the previous 6-month average, and this continues until the opposite trend occurs, the period is considered one phase. (2) If there is no trend change as described in (1), and there is a continuous series of plus or minus values for each outcome, calculated as the past 6-month average minus the next 6-month average, this period is also considered one phase (Supplementary Figure S1).
2.3. Association Between Each Outcome and Clinical Parameter Evaluation
The six-month average value for each item, from the start to the end of the period, was compared using a Mann–Whitney U test.
Statistical analyses evaluated associations between each monthly primary outcome and variables such as average age, sex distribution, and drug-related factors, including prescription rates and average doses of MTX (rMTX and dMTX), the average number of prescriptions for conventional synthetic DMARDs (csDMARDs) other than MTX, and administration rates of bDMARDs and tsDMARDs—separated into groups including tofacitinib (rTOF as an administration rate) and other drugs such as baricitinib (BAR), upadacitinib (UPA), and filgotinib (FIL) (rBUF as a summed administration rate). Analyses were performed using a univariate linear regression model, followed by a multivariate model to identify significant factors. Analyses were also conducted for each period for each primary outcome and across periods for all primary and secondary outcomes.
2.4. Additional Analysis
We conducted a correlation analysis of potential confounding factors, including SDAI, HAQ, and PS-VAS at the first consultation (SDAI@BL, HAQ@BL, and PS-VS@BL), the time from RA onset to the first consultation (TLI), the number of comorbidities (N.Com), the Charlson Comorbidity Index (CCI), and the primary outcomes. Monthly averages were analyzed with linear regression for each outcome period.
We also examined relationships among various indices over the follow-up period, including mean SDAI, HAQ, and PS-VAS values, their correlations, and medication factors such as rMTX, dMTX, csDMARD, bDMARD, rTOF, rBUF, and GCs. Additionally, we explored the relationship between mean age and mean estimated glomerular filtration rate (eGFR) in the same month. All analyses were conducted using multivariate linear regression.
2.5. Statistical Analysis
All statistical analyses were performed using StatPlus:mac® v7.8.11 (AnalystSoft Inc., Walnut, CA, USA). Statistical significance was set at p = 0.05.
3. Results
By August 2025, 34,293 measurements from 764 RA patients had been analyzed. At baseline, the sex distribution was 15.2% male and 84.8% female. The mean age at the initial measurement was 63.6 years; the mean SDAI score was 13.3; the mean HAQ score was 0.487; and the mean PS-VAS was 35.1. Patient characteristics are presented in Table 1.
Table 1.
Demographics of patients participating in the study.
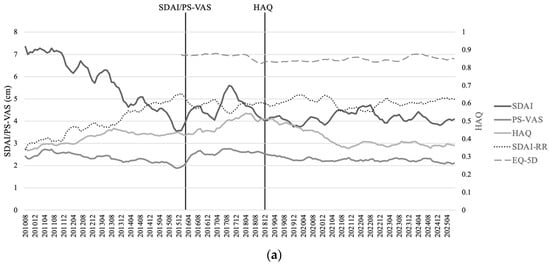
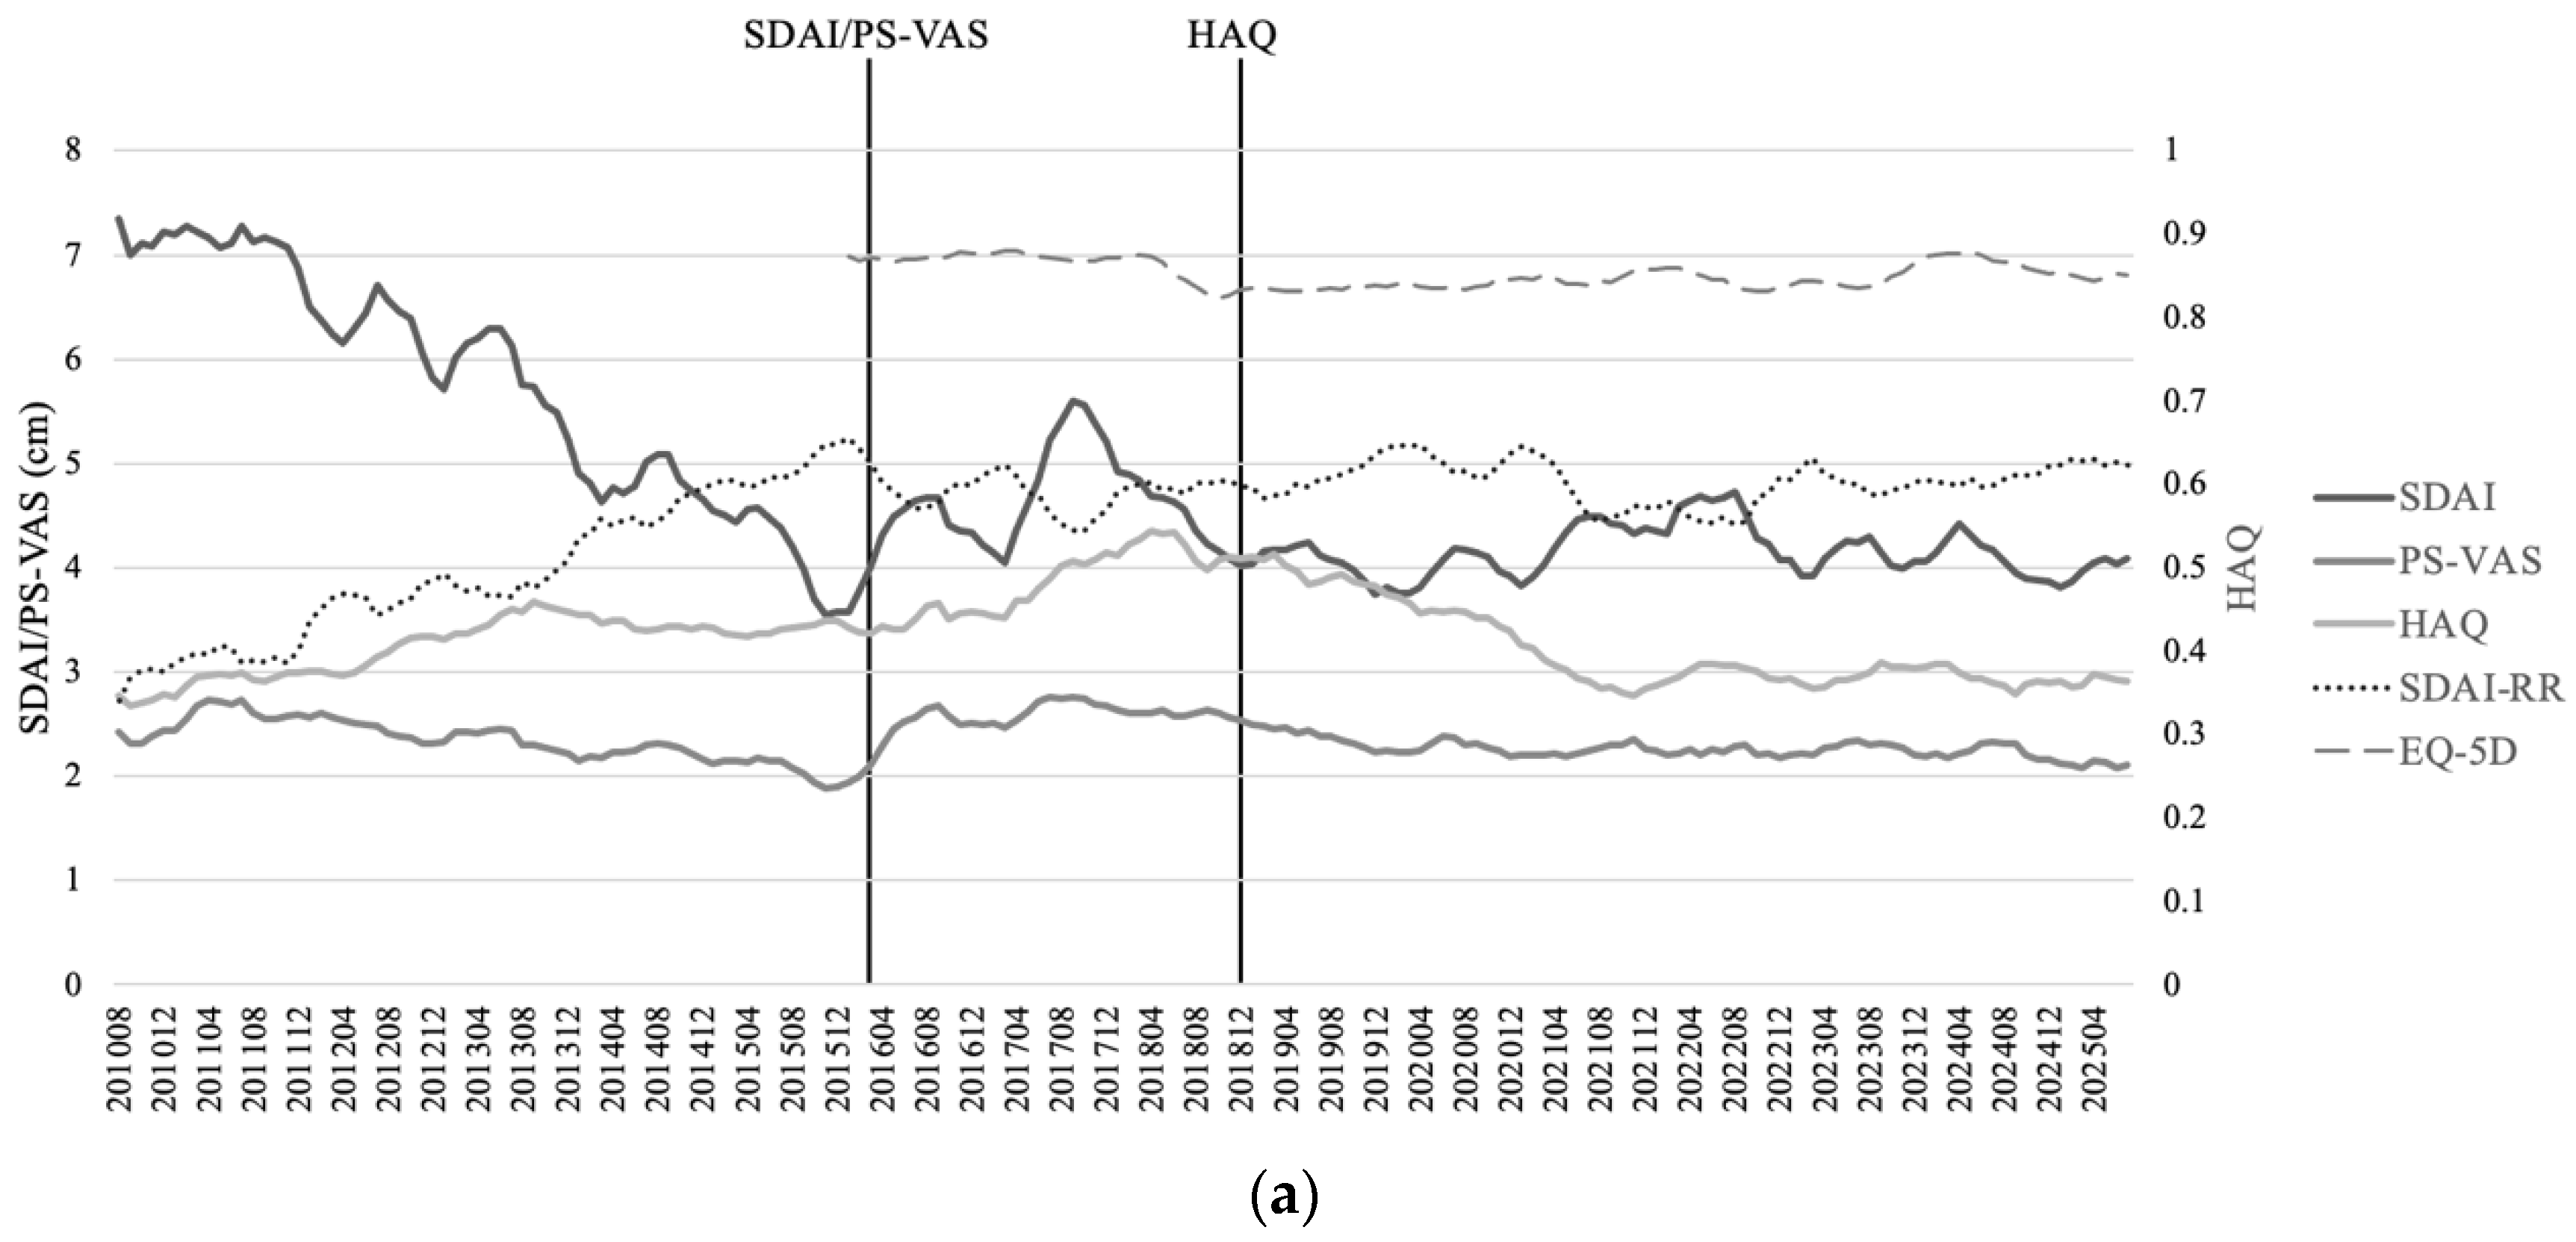
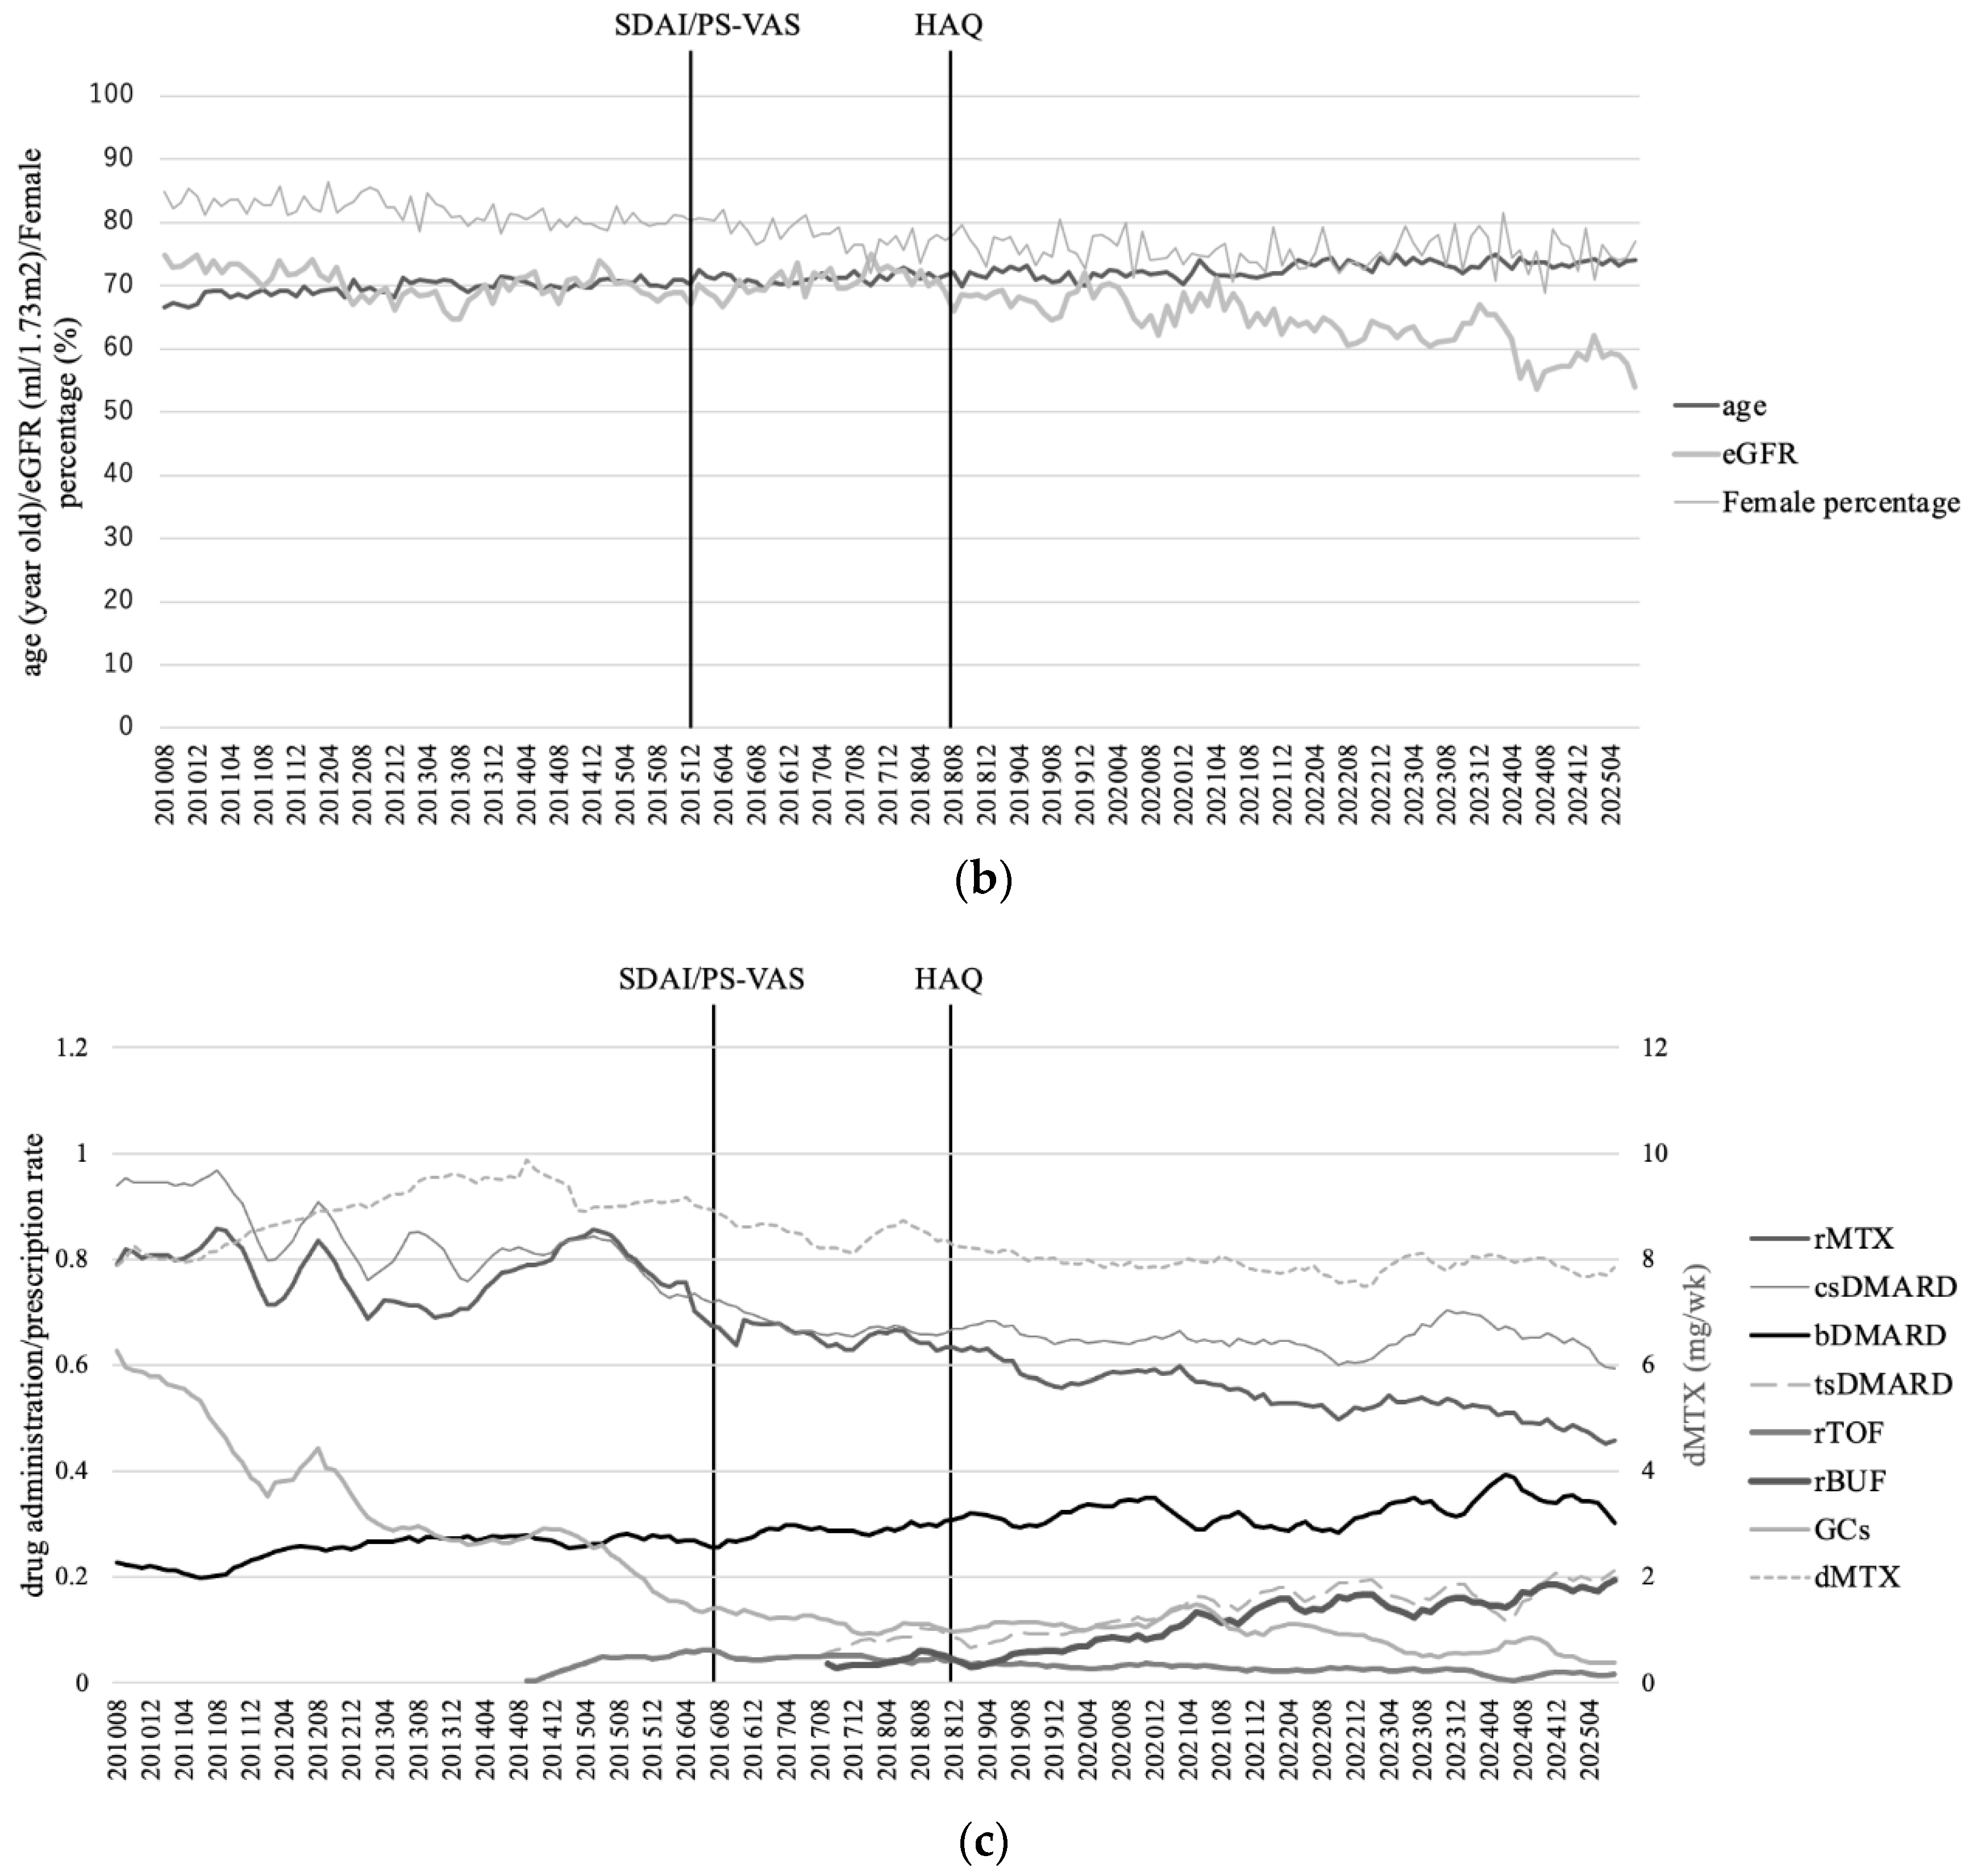
The total duration can be divided into two periods for each outcome: SDAI. The First period is from August 2010 to November 2015; the Second is from December 2015 to July 2025. HAQ; First period, from August 2010 to November 2018; Second period, from December 2018 to July 2025. PS-VAS; First period, from August 2010 to November 2015; Second period, from December 2015 to July 2025 (Figure 1).
Figure 1.
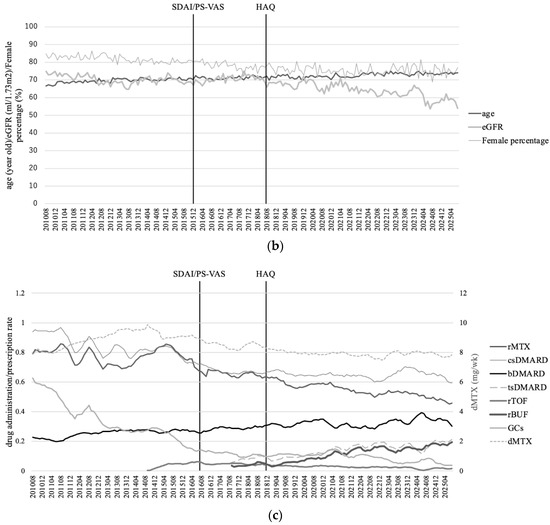
Monthly changes in clinical parameters. (a): Monthly changes in outcomes such as the SDAI score, HAQ score, PS-VAS, SDAI-RR, and EQ-5D score. (b): Monthly changes in mean age, female percentage, and eGFR. (c): Monthly fluctuations in drug-related variables, such as the prescription rate of methotrexate (rMTX), the dose of MTX (dMTX), the average prescription rate of conventional synthetic disease-modifying anti-rheumatic drugs (csDMARDs), the administration rates of biologic DMARDs (bDMARDs), targeted synthetic DMARDs (tsDMARDs), tofacitinib (rTOF), baricitinib, upadacitinib, and filgotinib (rBUF), and the prescription rate of glucocorticoids (GCs).
3.1. SDAI Score
3.1.1. First Period
During this period, the mean SDAI score decreased significantly from 7.35 to 3.55 (p < 0.001) (Figure 1a). Mean age increased significantly from 66.5 to 71.0 years (p < 0.001), and the percentage of females decreased significantly from 84.8% to 80.9% (p < 0.001) (Figure 1b).
The rMTX remained relatively stable, decreasing from 78.9% to 77.3%, while the dMTX increased notably from 7.87 to 9.46 mg/week (p < 0.001). The mean csDMARD prescription rate decreased from 94.0% to 72.9%; however, this change was not statistically significant (p = 0.88). Conversely, the bDMARD administration rate rose significantly from 22.7% to 26.3% (p < 0.001). The tsDMARD administration rate also increased significantly from 0% to 4.5% (p < 0.001). Additionally, the GC administration rate declined significantly from 62.7% to 15.5% (p < 0.001) (Figure 1c). The drug administration rate trajectory by the action is presented in Supplementary Figures S2 and S3.
In a univariate model, female percentage (positive; p < 0.001), mean age (negative; p < 0.001), dMTX (negative; p < 0.001), csDMARD (positive; p < 0.001), bDMARD (negative; p < 0.001), and GCs (positive; p < 0.001) were significantly correlated with the mean SDAI score. In a multivariate model (R = 0.80), dMTX (negative; p < 0.01) and GCs (positive; p < 0.001) remained significantly correlated (Table 2).
Table 2.
Results of linear regression analysis of variables regarding SDAI during the First period.
3.1.2. Second Period
During this period, the mean SDAI score remained stable, changing from 4.02 to 4.08 (p = 0.69) (Figure 1a).
During this period, the rMTX decreased significantly from 73.6% to 49.6% (p < 0.001), and the dMTX decreased significantly from 8.97 to 7.83 mg/week (p < 0.001). Additionally, the csDMARD decreased significantly from 73.6% to 60.4% (p < 0.05). The bDMARD remained stable, changing from 30.4% to 30.2% (p < 0.01), and the tsDMARD administration rate increased significantly from 4.5% to 21.3% (p < 0.001). Within the tsDMARD, rTOF decreased from 2.8% to 1.7%. In contrast, rBUF rose significantly from 0% to 19.5% (p < 0.001). Conversely, the GC administration rate decreased significantly from 17.3% to 3.9% (p < 0.001) (Figure 1c).
During this period, GCs were the only significant variable showing a positive correlation with the SDAI score (p < 0.05) in both univariate and multivariate models (Table 3).
Table 3.
Results of linear regression analysis of variables regarding SDAI during the Second period.
3.2. HAQ Score
3.2.1. First Period
During this period, the mean HAQ score increased significantly from 0.346 to 0.512 (p < 0.001) (Figure 1a). Mean age increased significantly from 66.5 to 71.5 years (p < 0.001), and the percentage of females decreased significantly from 84.8% to 75.8% (p < 0.001) (Figure 1b). The rMTX decreased significantly from 78.9% to 69.2%, while the dMTX increased notably from 7.87 to 8.52 mg/week (p < 0.001). The mean number of csDMARD prescriptions decreased significantly from 94.0% to 70.0% (p < 0.05). Conversely, the bDMARD administration rate increased significantly from 22.7% to 31.1% (p < 0.001). The tsDMARD administration rate increased significantly from 0% to 6.2% (p < 0.001). Among tsDMARDs, rTOF increased significantly from 0% to 3.3% (p < 0.001), and rBUF increased significantly from 0% to 2.8% (p < 0.001). Additionally, the GC administration rate declined significantly from 62.7% to 15.5% (p < 0.001) (Figure 1c).
Female percentage (negative; p < 0.001), mean age (positive; p < 0.001), rMTX (negative; p < 0.001), csDMARD (negative; p < 0.001), bDMARD (positive; p < 0.001), tsDMARD (positive; p < 0.001), rTOF (positive; p < 0.001), and rBUF (positive; p < 0.001) were significantly correlated with the mean SDAI score. GCs (negative; p < 0.001) were also significantly correlated with the HAQ score in a univariate model. Among these variables, mean age (positive; p < 0.001), female percentage (negative; p < 0.05), bDMARD (positive; p < 0.01), and rBUF (positive; p < 0.01) were significantly correlated in a multivariate model (R = 0.77) (Table 4).
Table 4.
Results of linear regression analysis of variables regarding HAQ during the First period.
3.2.2. Second Period
During this period, the mean HAQ score decreased significantly from 0.511 to 0.365 (p < 0.001) (Figure 1a).
The rMTX decreased significantly from 63.7% to 49.6% (p < 0.001), while the dMTX decreased significantly from 8.25 to 7.83 mg/week (p < 0.001). Additionally, the csDMARD decreased significantly from 69.6% to 60.4% (p < 0.05). The bDMARD remained stable, changing from 30.8% to 30.2% (p < 0.01), and the tsDMARD administration rate increased significantly from 7.0% to 22.5% (p < 0.001). Within the tsDMARD, rTOF decreased from 4.3% to 1.7%. In contrast, rBUF rose significantly from 4.5% to 19.5% (p < 0.001). Conversely, the GC administration rate decreased significantly from 9.7% to 3.9% (p < 0.001) (Figure 1c).
In a univariate model, mean age (negative; p < 0.01), rMTX (positive; p < 0.001), tsDMARD (negative; p < 0.001), rTOF (positive; p < 0.01), rBUF (negative; p < 0.001), and GCs (positive; p < 0.05) showed significant correlations with the mean SDAI score. Among these variables, only rBUF (negative; p < 0.001) remained significant in a multivariate model (R = 0.57) (Table 5).
Table 5.
Results of linear regression analysis of variables regarding HAQ during the Second period.
3.3. PS-VAS
3.3.1. First Period
During this period, the mean PS-VAS decreased significantly from 24.2 to 18.8 (p < 0.001). The other variables remained unchanged from the First period of the SDAI, as the First period of the SDAI and the PS-VAS were identical (Figure 1a).
In a univariate model, female percentage (positive; p < 0.001), mean age (negative; p < 0.01), dMTX (negative; p < 0.001), csDMARD (positive; p < 0.001), bDMARD (negative; p < 0.001), tsDMARD (= rTOF, negative; p < 0.001), and GCs (positive; p < 0.001) showed significant correlations with the mean PS-VAS. In a multivariate model (R = 0.63), dMTX (negative; p < 0.05) and tsDMARD (negative; p < 0.001) demonstrated significant correlations (Table 6).
Table 6.
Results of linear regression analysis of variables regarding PS-VAS during the First period.
3.3.2. Second Period
During this period, the mean PS-VAS remained stable, changing from 4.02 to 4.08 (p = 0.69) (Figure 1a).
Mean age (negative; p < 0.001), rMTX (positive; p < 0.001), dMTX (positive; p < 0.001), csDMARD (positive; p < 0.05); bDMARD (negative; p < 0.05); tsDMARD (negative; p < 0.001); in the tsDMARD, rTOF (positive; p < 0.001) and rBUF (negative; p < 0.001), showed a significant correlation with the mean PS-VAS in a univariate model. Among these variables, only rBUF (negative; p < 0.001) demonstrated a significant correlation using a multivariate model (R = 0.58) (Table 7).
Table 7.
Results of linear regression analysis of variables regarding PS-VAS during the Second period.
3.4. Overall Perspective
Compared from BL to the end of the follow-up periods, the SDAI score decreased (p < 0.001), the HAQ score fluctuated but ultimately decreased (p < 0.05), PS-VAS decreased (p < 0.001), the SDAI-RR increased (p < 0.001), and the EQ-5D score declined (p < 0.05) (Figure 1a).
Female percentage decreased (p < 0.001), mean age increased (p < 0.001) (Figure 1b), rMTX and dMTX decreased (p < 0.001), csDMARD decreased (p < 0.001), bDMARD increased (p < 0.001), and tsDMARD increased (p < 0.001); both rTOF and rBUF increased (p < 0.001), and GCs decreased (p < 0.001) (Figure 1c).
3.5. Correlation with the SDAI Score
Female percentage (positive; p < 0.001), mean age (negative; p < 0.001), rMTX (positive; p < 0.001), dMTX (positive; p < 0.01), csDMARD (positive; p < 0.01), bDMARD (negative; p < 0.01), tsDMARD (negative; p < 0.001), rTOF (negative; p < 0.001), rBUF (negative; p < 0.001), and GCs (positive; p < 0.001) showed significant correlations with the mean SDAI score in a univariate model. In the multivariate model (Table 2), dMTX (negative; p < 0.05), bDMARD (negative; p < 0.01), rTOF (negative; p < 0.01), rBUF (negative; p < 0.001), and GCs (positive; p < 0.01) demonstrated significant correlations (Table 8).
Table 8.
Results of linear regression analysis of variables regarding SDAI throughout the periods.
3.6. Correlation with the HAQ Score
In a univariate model, dMTX (positive; p < 0.001), tsDMARD (negative; p < 0.001), rTOF (positive; p < 0.001), rBUF (negative; p < 0.001), and GCs (positive; p < 0.05) showed significant correlations with the mean SDAI score. In a multivariate model, rBUF (negative; p < 0.001) and GCs (negative; p < 0.001) showed significant correlations (Table 9).
Table 9.
Results of linear regression analysis of variables regarding HAQ throughout the periods.
3.7. Correlation with the PS-VAS
Mean age (negative; p < 0.01), bDMARD (negative; p < 0.01), tsDMARD (negative; p < 0.001), rBUF (negative; p < 0.001), and GCs (positive; p < 0.001) showed significant correlation with the mean SDAI score in a univariate model. In the multivariate model, only rBUF (negative; p < 0.001) demonstrated significant correlation (Table 10).
Table 10.
Results of linear regression analysis of variables regarding PS-VAS throughout the periods.
3.8. Correlation with the SDAI-RR
In a univariate model, the SDAI-RR showed significant positive correlations with mean age (p < 0.001), bDMARD (p < 0.001), tsDMARD (p < 0.001), rTOF (p < 0.001), and rBUF (p < 0.001), and significant negative correlations with female percentage (p < 0.001), rMTX (p < 0.001), dMTX (p < 0.001), csDMARD (p < 0.001), and GCs (p < 0.001). In a multivariate model, dMTX (positive; p < 0.05), csDMARD (negative; p < 0.01), rTOF (positive; p < 0.01), and GCs (negative; p < 0.001) showed significant correlations (Table 11).
Table 11.
Results of linear regression analysis of variables regarding SDAI-RR.
3.9. Correlation with the EQ-5D Score
In a univariate model, the mean EQ-5D score showed significant positive correlations with female percentage (p < 0.05), rMTX (p < 0.01), dMTX (p < 0.001), csDMARD (p < 0.001), and rBUF (p < 0.05), and negative correlations with age (p < 0.05) and tsDMARD (p < 0.01). Among these, rMTX (positive; p < 0.05) and csDMARD (positive; p < 0.05) showed significant correlations (Table 12).
Table 12.
Results of linear regression analysis of variables regarding EQ-5D.
3.10. Additional Analysis
During the First period, SDAI@BL, HAQ@BL, PS-VAS@BL, N.Com, and the CCI showed significant negative correlations with the monthly average SDAI score, while TLI showed a significant positive correlation in the univariate model. In the multivariate model, HAQ@BL and PS-VAS@BL showed a significant positive correlation. During the Second period, SDAI@BL, HAQ@BL, N.Com, and the CCI showed significant positive correlations with SDAI in the univariate model; among these, SDAI@BL was the only factor to show a significant positive correlation in the multivariate model (Table 13). The trajectories of the factors and the SDAI score are shown in Supplementary Figure S4.
Table 13.
Correlation of monthly average SDAI score and possible confounding factors.
During the First period, SDAI@BL, HAQ@BL, PS-VAS@BL, N.Com, and CCI showed significant positive correlations with the monthly average HAQ score, while TLI showed a significant negative correlation in the univariate model. In the multivariate model, HAQ@BL, PS-VAS@BL, and N.Com showed a significant positive correlation, whereas SDAI@BL showed a significant negative correlation. During the Second period, SHS, TLI, and N.Com showed significant positive correlations with the HAQ score, whereas SDAI@BL showed a significant negative correlation in the univariate model; among these, TLI and N.Com showed a significant positive correlation in the multivariate model (Table 14). The trajectories of the factors, the HAQ score, and the PS-VAS are shown in Supplementary Figure S5.
Table 14.
Correlation of the monthly average HAQ score and possible confounding factors.
During the First period, HAQ@BL, N.Com, and the CCI showed significant positive correlations with the monthly average PS-VAS in the univariate model; among these, the CCI was the only factor showing a significant positive correlation in the multivariate model. During the Second period, HAQ@BL, PS-VAS@BL, and SHS showed significant positive correlations with the monthly average PS-VAS in the univariate model; among these, HAQ@BL and SHS showed significant positive correlations in the multivariate model (Table 15).
Table 15.
Correlation of monthly average PS-VAS and possible confounding factors.
Throughout the period, SDAI showed a significant positive correlation with GCs (p < 0.001) and a significant negative correlation with rTOF (p < 0.01). HAQ was significantly negatively correlated with csDMARD (p < 0.05) and rBUF (p < 0.001). PS-VAS also showed significant negative correlations with dMTX (p < 0.01), rBUF (p < 0.001), and GCs (p < 0.05). Significant positive interactions were observed between SDAI and PS-VAS (p < 0.001) and between HAQ and PS-VAS (p < 0.01) (Table 16).
Table 16.
Correlation of variables including outcomes using a multivariate linear regression analysis.
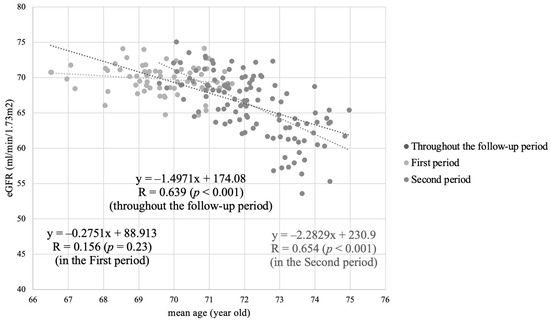
The average eGFR showed a significant negative correlation with the average age; however, this strong correlation was present only during the Second period, not the First (Figure 2).
Figure 2.
Relationships between the monthly average eGFR and mean age, separated by periods in SDAI and over the entire follow-up period.
4. Discussion
Reviewing the trajectories of clinical outcomes and their relationship to drug administration is important for evaluating the drug’s effectiveness [24]. To analyze the trend, we used linear regression. Because the trend can be estimated using linear regression with the number of months of follow-up as the independent variable and the outcome as the dependent variable, we adopted this method, which may allow us to infer the monthly trends for each indicator.
During the First period of SDAI, disease activity decreased immediately, leading to an increase in SDAI-RR. These trends were also reflected in increased MTX use. Conversely, bDMARD and tsDMARD administration rates steadily increased, while GC prescription rates declined. Notably, MTX dose and GC prescription rate correlated strongly with the SDAI score. However, the reduction in disease activity did not improve functional capacity, resulting in a gradual increase in mean HAQ and PS-VAS scores during the synchronized period. The gradual increases in the average HAQ score and PS-VAS are probably due to confounding factors. The HAQ score and the PS-VAS were correlated, and these indicators at the first consultation showed significant positive correlations. Furthermore, the number of comorbidities significantly correlated with both indicators. The HAQ score is affected by many factors, including age, disease activity, joint deformity, joint contracture, fatigue, and pain [26]. In these, the strongest factor affecting the HAQ score is the baseline HAQ score. The HAQ score moves linearly with the HAQ@BL during the First period (Supplementary Figure S5). The N.Com followed the HAQ@BL as the second strongest factor. In contrast, the N.Com showed a negative correlation with the SDAI score, as shown in Table 13. Among the possible confounding factors, TLI would be a strong candidate for affecting the SDAI score; however, no significant correlation is observed in the multivariate model in the present study.
However, the positive trend in SDAI during the First period was interrupted in the Second. The average SDAI score increased, then stabilized or gradually declined. During the Second period, the prescription rate for MTX and the average MTX dose decreased. However, these changes were not significantly correlated with the average SDAI score. Based on trends in the First period, it was expected that the SDAI score would rise and SDAI-RR would decrease if the MTX prescription rate and dose declined. Instead, they remained the same and then showed a gradual decline rather than a rise. One possible reason is the increased use of bDMARDs and tsDMARDs. The rise in bDMARDs and tsDMARDs offsets the decline in MTX prescriptions and doses.
As RA patients age, MTX use declines [22]. Renal decline is closely linked to aging. The rising average age of patients likely leads to hesitation in prescribing MTX because of concerns about worsening kidney function, as well as hesitation about non-steroidal anti-inflammatory drug use [27,28,29]. However, while being elderly is a risk factor for renal decline, aging alone does not necessarily cause decreased renal function. Recent studies suggest that the risk of eGFR decline is minimized when disease activity remains in remission [12], and reluctance to prescribe MTX can increase disease activity and, over time, contribute to renal decline. In this study, eGFR remained stable until 2019; however, a significant drop occurred afterward, despite the continued aging trend from the First period through the follow-up periods.
Another possible reason for the decrease in dMTX is MTX-related lymphoproliferative diseases (MTX-LPD). Since around 2014, Japanese institutions have published several reports on MTX-LPD. Based on these reports and the general consensus at that year’s academic conference, MTX-LPD associated with MTX treatment was believed to have a higher incidence in Japanese populations than in Western populations [30,31,32]. This may have led to hesitation in prescribing MTX. The prevalence of MTX-LPD is around 10% among MTX-receiving patients and correlates with age, dosage, and the length of MTX use [33]. Among the patients who participated in this study, several patients were diagnosed with MTX-LPD during this period. Since experiencing MTX-LPD, the dosage and prescription rate of MTX gradually decreased.
The mean HAQ score increased gradually during the First period and decreased gradually during the Second, with a corresponding change in PS-VAS, though the relationship was not perfectly linear. The HAQ score negatively correlated with the average MTX dosage and prescription rate, as well as the administration rates of tsDMARDs, specifically rBUF (baricitinib, upadacitinib, and filgotinib). Among these variables, rBUF was the only significant factor in the multivariate model. This suggests that increased use of bDMARDs and tsDMARDs cannot prevent the decline in functional abilities. If higher MTX prescription rates and doses had continued under the practices of the First period, functional abilities might have improved. The GC showed a positive correlation with the HAQ score. Reducing the GC prescription rate would help maintain the HAQ score at a low level.
In the Second period, the HAQ score is correlated with TLI and N.Com, as in the First period. These findings are interesting, as they suggest that a longer time without T2T deteriorates functional capacity in the RA patient, and that as comorbidity increases, functional capacity also declines. The issue of comorbidities is more serious with advancing age. However, N.Com showed a significant negative correlation with the SDAI score in the First period. The reason for this phenomenon is still unclear.
The PS-VAS correlated significantly only with female gender in the First period. Among the possible confounding factors, CCI demonstrated a significant correlation with the PS-VAS. These results suggest that as long as MTX is administered and the MTX dose is sufficient, the degree of pain depends on gender and the severity of the comorbidities. Whereas the PS-VAS also showed a negative correlation with the rBUF administration rate, as reflected in the HAQ score during the Second period. This suggests that a shared factor influences both the HAQ score and the PS-VAS. There is a significant direct correlation between the HAQ score and the PS-VAS, and rBUF is a potentially strong factor affecting these outcomes, although the relationship is not strictly linear.
The SDAI-RR showed significant positive correlations with the average MTX dose and negative correlations with the average number of csDMARD prescriptions and the GC prescription rate. Despite rising rates of bDMARD and tsDMARD administration, the SDAI-RR did not improve significantly over the entire period, even though these factors reduced the SDAI score. However, the rTOF showed a significant positive correlation with the remission rate, whereas GC administration had a substantial adverse effect on achieving SDAI remission.
The mean EQ-5D score showed a significant positive correlation with MTX-related variables and the csDMARD prescription rate. Increases in bDMARD and tsDMARD administration did not significantly improve quality of life over the entire follow-up period. This suggests that prescribing MTX and csDMARD may help enhance quality of life. For patients who achieved clinical remission in Phase 1, quality of life may be maintained at a good level. Throughout the follow-up period, all drug factors significantly correlated with changes in the mean SDAI score, particularly the MTX dose and the use of bDMARDs and tsDMARDs, including tofacitinib, baricitinib, upadacitinib, and filgotinib, which were associated with decreases in the SDAI score. In contrast, the prescription rate of GCs was associated with higher SDAI scores. In addition, only the MTX dose, the administration rate of tsDMARDs, and the prescription rate of GCs significantly affected the HAQ score; specifically, the administration rates of baricitinib, upadacitinib, and filgotinib were associated with lower HAQ scores. Because these drugs were administered only from the end of the First period onward, there was no significant correlation with the HAQ score during that period. However, the increased administration rate of these drugs significantly contributed to downward trends in both the PS-VAS and the HAQ score. These findings strongly suggest that the administration of these tsDMARDs helps improve HAQ and contributes to reductions in the PS-VAS. The prescription rate of GCs also contributed to reductions in the HAQ score but did not affect the PS-VAS. The mechanism underlying the reduction in the HAQ score appears different from that of the tsDMARDs.
Overall, the T2T treatment strategy remains effective throughout the follow-up period. The mean SDAI score remains low, indicating low disease activity, while the mean SDAI-RR continues to increase, and the HAQ score has decreased. These changes may reflect a reduction in the time to first consultation from RA onset (Supplementary Figure S5). This interval continued to shorten during follow-up and showed a significant correlation with the mean SDAI score, but not with the HAQ or EQ-5D scores. The decrease in time from the first consultation to achieving the first clinical remission also helps maintain control of disease activity and preserve functional abilities; however, it is associated with a decline in quality of life. We cannot explain why this occurs. One possible reason is the relatively short follow-up period for the EQ-5D score compared to the SDAI and HAQ scores. A longer follow-up period would be necessary to properly assess its association.
The effectiveness of the T2T strategy is reflected in a higher probability of clinical remission [20]. The institute conducting this study is located in a rural area in Japan, and therefore the average age of the patients is older than that of the other cohort study [20,21,34,35,36,37,38]. The MTX dosage was lower than that of the European cohort study. However, long-term follow-up studies for more than ten years using a cohort design are very rare [34]. Therefore, we believe our study is valuable because it examines long-term changes in patient conditions and the corresponding shifts in drug selection. Japan is now the leading aging country in the world, and patients with RA are getting older year by year. Our study population is very old, but it should not be a specific cohort in the near future.
This study has several strengths and limitations. Strengths include the following: 1. It adopts a longitudinal approach within a single institution. Trends in outcomes and variables, including demographic and drug-related factors and their interactions, are analyzed. 2. It reflects real-world clinical practice. Conducted at one medical facility and not focused on a specific outcome, this study provides comprehensive results on long-term outcomes, unlike double-blind trials. Limitations include as follows: 1. The patient cohort is small compared with that of a large cohort study, which introduces a risk of population bias. 2. This study is not a patient-observational study but a time-observational study. Therefore, it does not describe the effectiveness of each drug, but outcome trends can indicate potential tendencies. 3. This study does not consider socioeconomic factors or educational background, which would affect medication trends. However, we are convinced that a treatment trend exists in accordance with the patient’s transition in background, and that the response to the transition is appropriate as long as it aligns with the T2T strategy.
5. Conclusions
The association between the treatment trend in medication and changes in clinical indices was investigated using monthly data from one institute. Targeting clinical remission yields good clinical results in controlling disease activity and maintaining functional capacity, even as the patient’s clinical background changes. Adjustments in medication, in response to the patient’s changes, can help maintain these clinical indices.
Supplementary Materials
The following supporting information can be downloaded at: https://www.mdpi.com/article/10.3390/rheumato6010008/s1, Figure S1: Defining period and its border; Figure S2: Trajectory of the prescription rates of the csDMARD and NSAID; Figure S3: Trajectory of the administration rates of biological and targeted synthetic DMARDs; Figure S4: Trajectory of the clinical indicators; Figure S5: Trajectory of the clinical indicators; Figure S6: Associations between the SDAI score, the SDAI-RR, and the 6-month average value in time length from onset to the first consultation.
Author Contributions
Conceptualization, I.Y.; Methodology, I.Y.; Software, I.Y.; Validation, I.Y.; Formal analysis, I.Y.; Investigation, I.Y.; Resources, I.Y.; Data curation, I.Y.; Writing—original draft, I.Y.; Writing—review & editing, I.Y., N.S. and T.C.; Visualization, I.Y.; Supervision, N.S. and T.C.; Project administration, I.Y. All authors have read and agreed to the published version of the manuscript.
Funding
This research received no external funding.
Institutional Review Board Statement
Ethical review approval was waived for this study by the Genyu Ethics Committee due to this study guaranteeing patient anonymity, and is not a follow-up study of patients, but rather a follow-up study of the facility.
Informed Consent Statement
Informed consent was obtained from all subjects involved in the study.
Data Availability Statement
The raw data supporting the conclusions of this article will be made available by the authors on request.
Acknowledgments
The authors would like to thank Saori Tamura for the enthusiastic DXA and BMD measurements and Kaoru Kuwabara, Sayori Masuoka, Eri Morichika, and Aoi Yoshida for their dedicated data collection.
Conflicts of Interest
The authors declare no conflicts of interest.
References
- Koc, G.H.; Looijen, A.E.M.; van der Horst-Bruinsma, I.E.; de Jong, P.H.P. Sex Differences in Rheumatoid Arthritis: New Insights From Clinical and Patient-Reported Outcome Perspectives. J. Rheumatol. 2025, 52, 553–562. [Google Scholar] [CrossRef] [Scilit] [PubMed]
- Kakehasi, A.M.; Duarte, A.L.B.P.; Brenol, C.V.; Domiciano, D.S.; Laurindo, I.M.M.; Bonfiglioli, K.R.; da Mota, L.M.H.; Buch, M.H.; Macêdo, E.d.A.; Xavier, R.M. Challenges in implementing treat-to-target in rheumatoid arthritis: A perspective from Brazilian rheumatologists. Adv. Rheumatol. 2024, 64, 63. [Google Scholar] [CrossRef] [Scilit]
- He, J.; Maharaj, A.B. Highlights of advancement in Rheumatoid Arthritis research and clinical practice. Best Pract. Res. Clin. Rheumatol. 2025, 39, 102040. [Google Scholar] [CrossRef] [Scilit]
- Naniwa, T.; Tomita, H.; Ninomiya, S.; Mori, T.; Maeda, S.; Kawaguchi, H.; Sugiura, Y.; Yoshinouchi, T.; Morishita, M.; Ueda, R. Successful use of immunosuppressive agents for the treatment of progressive rheumatoid interstitial lung disease: A case report. Nihon Kokyuki Gakkai Zasshi J. Jpn. Respir. 2002, 40, 55–60. (In Japanese) [Google Scholar]
- Schipper, L.G.; Vermeer, M.; Kuper, H.H.; Hoekstra, M.O.; Haagsma, C.J.; Den Broeder, A.A.; van Riel, P.; Fransen, J.; van de Laar, M.A. A tight control treatment strategy aiming for remission in early rheumatoid arthritis is more effective than usual care treatment in daily clinical practice: A study of two cohorts in the Dutch Rheumatoid Arthritis Monitoring registry. Ann. Rheum. Dis. 2012, 71, 845–850. [Google Scholar] [CrossRef] [Scilit] [PubMed]
- Yoshii, I.; Chijiwa, T.; Sawada, N. Rheumatoid arthritis in tight disease control is no longer risk of bone mineral density loss. Osteoporos Sarcopenia 2020, 6, 75–81. [Google Scholar] [CrossRef] [Scilit]
- Terslev, L.; Brahe, C.H.; Hetland, M.L.; Georgiadis, S.; Ellegaard, K.; Juul, L.; Huynh, T.; Døhn, U.M.; Fana, V.; Møller, T.; et al. Doppler ultrasound predicts successful discontinuation of biological DMARDs in rheumatoid arthritis patients in clinical remission. Rheumatology 2021, 60, 5549–5559. [Google Scholar] [CrossRef] [Scilit]
- Tanaka, Y. Recent progress in treatments of rheumatoid arthritis: An overview of developments in biologics and small molecules, and remaining unmet needs. Rheumatology 2021, 60, vi12–vi20. [Google Scholar] [CrossRef] [Scilit]
- Yoshii, I.; Sawada, N.; Chijiwa, T.; Kokei, S. Impact of sustaining SDAI remission for preventing incident of bone fragility fracture in patient with rheumatoid arthritis. Ann. Rheum. Dis. 2022, 81, 296–299. [Google Scholar] [CrossRef] [Scilit]
- Sugano, E.; Tanaka, E.; Inoue, E.; Honda, S.; Abe, M.; Saka, K.; Sugitani, N.; Ochiai, M.; Yamaguchi, R.; Ikari, K.; et al. Impact of interstitial lung disease on clinical remission and unfavourable events of rheumatoid arthritis: Results from the IORRA cohort. Rheumatology 2024, 63, 1022–1029. [Google Scholar] [CrossRef] [Scilit]
- Sepriano, A.; Ramiro, S.; Landewém, R.; van der Heijde, D.; Ohrndorf, S.; FitzGerald, O.; Backhaus, M.; Larché, M.; Homik, J.; Saraux, A.; et al. Adding ultrasound to treat-to-target shows no benefit in achieving clinical remission nor in slowing radiographic progression in rheumatoid arthritis: Results from a multicenter prospective cohort. Clin. Rheumatol. 2024, 43, 1833–1844. [Google Scholar] [CrossRef] [Scilit]
- Fukui, S.; Winkelmayer, W.C.; Tedeschi, S.K.; Marrugo, J.; Guan, H.; Harrold, L.; Litman, H.J.; Shinozaki, T.; Solomon, D.H. Disease activity of rheumatoid arthritis and kidney function decline: A large prospective registry study. Ann. Rheum. Dis. 2025, 84, 201–209. [Google Scholar] [CrossRef] [Scilit]
- Sonomoto, K.; Tanaka, Y. Targeted Therapies for Rheumatoid Arthritis in Super-Elderly Society: Insights From FIRST Registry, Japan. Int. J. Rheum. Dis. 2025, 28, e70232. [Google Scholar] [CrossRef] [Scilit]
- Fatima, S.; Pope, J.E.; Chen, L.R.; Schieir, O.; Valois, M.F.; Bartlett, S.J.; Boire, G.; Hazlewood, G.; Hitchon, C.; Tin, D.; et al. Higher comorbidities associated with less improvement in disease activity in early rheumatoid arthritis: Results from CATCH cohort. Rheumatology 2025, 25, keaf350. [Google Scholar]
- Smolen, J.S.; Aletaha, D.; Bijlsma, J.W.; Breedveld, F.C.; Boumpas, D.; Burmester, G.; Combe, B.; Cutolo, M.; de Wit, M.; Dougados, M.; et al. T2T Expert Committee. Treating rheumatoid arthritis to target: Recommendations of an international task force. Ann. Rheum. Dis. 2010, 69, 631–637. [Google Scholar] [CrossRef] [Scilit] [PubMed]
- Smolen, J.S.; Landewé, R.; Breedveld, F.C.; Buch, M.; Burmester, G.; Dougados, M.; Emery, P.; Gaujoux-Viala, C.; Gossec, L.; Nam, J.; et al. EULAR recommendations for the management of rheumatoid arthritis with synthetic and biological disease-modifying antirheumatic drugs: 2013 update. Ann. Rheum. Dis. 2014, 72, 492–509. [Google Scholar] [CrossRef] [Scilit]
- Smolen, J.S.; Landewé, R.; Bijlsma, J.; Burmester, G.; Chatzidionysiou, K.; Dougados, M.; Nam, J.; Ramiro, S.; Voshaar, M.; van Vollenhoven, R.; et al. EULAR recommendations for the management of rheumatoid arthritis with synthetic and biological disease-modifying antirheumatic drugs: 2016 update. Ann. Rheum. Dis. 2017, 76, 960–977. [Google Scholar] [CrossRef] [Scilit]
- Smolen, J.S.; Landewé, R.B.M.; Bijlsma, J.W.J.; Burmester, G.R.; Dougados, M.; Kerschbaumer, A.; McInnes, I.B.; Sepriano, A.; van Vollenhoven, R.F.; de Wit, M.; et al. EULAR recommendations for the management of rheumatoid arthritis with synthetic and biological disease-modifying antirheumatic drugs: 2019 update. Ann. Rheum. Dis. 2020, 79, 685–699. [Google Scholar] [CrossRef] [Scilit]
- Smolen, J.S.; Landewé, R.B.M.; Bergstra, S.A.; Kerschbaumer, A.; Sepriano, A.; Aletaha, D.; Caporali, R.; Edwards, C.J.; Hyrich, K.L.; Pope, J.E.; et al. EULAR recommendations for the management of rheumatoid arthritis with synthetic and biological disease-modifying antirheumatic drugs: 2022 update. Ann. Rheum. Dis. 2023, 82, e76. [Google Scholar] [CrossRef] [Scilit] [PubMed]
- Ramiro, S.; Landewé, R.B.; van der Heijde, D.; Sepriano, A.; FitzGerald, O.; Ostergaard, M.; Homik, J.; Elkayam, O.; Thorne, J.C.; Larche, M.; et al. Is treat-to-target really working in rheumatoid arthritis? a longitudinal analysis of a cohort of patients treated in daily practice (RA BIODAM). Ann. Rheum. Dis. 2020, 79, 453–459. [Google Scholar] [CrossRef] [Scilit]
- Yamanaka, H.; Tanaka, E.; Nakajima, A.; Furuya, T.; Ikari, K.; Taniguchi, A.; Inoue, E.; Harigai, M. A large observational cohort study of rheumatoid arthritis, IORRA: Providing context for today’s treatment options. Mod. Rheumatol. 2020, 30, 1–6. [Google Scholar] [CrossRef] [Scilit]
- Kubo, S.; Miyazaki, Y.; Tanaka, H.; Fujita, Y.; Sakai, H.; Ueno, M.; Todoroki, Y.; Satoh-Kanda, Y.; Miyagawa, I.; Nakayamada, S.; et al. Transition of clinical remission rates with molecular targeted therapies in rheumatoid arthritis in Japan: Insights from FIRST registry. Rheumatology 2025, 64, 5023–5030. [Google Scholar] [CrossRef] [Scilit]
- Jia, X.; He, L.; Chang, Y.; Li, J.; Wang, J.; Zhang, X.; Guo, J. Research Trends and Developments in Nanomaterials for Rheumatoid Arthritis: A Comprehensive Bibliometric Analysis. Drug. Des. Devel. Ther. 2025, 19, 4355–4371. [Google Scholar] [CrossRef] [Scilit]
- Steinz, N.; Maarseveen, T.D.; van den Akker, E.B.; Cope, A.P.; Isaacs, J.D.; Winkler, A.R.; Huizinga, T.W.J.; Abraham, Y.; Knevel, R. Time-independent disease state identification defines distinct trajectories determined by localised vs systemic inflammation in patients with early rheumatoid arthritis. Ann. Rheum. Dis. 2025, 84, 1301–1312. [Google Scholar] [CrossRef] [Scilit]
- Aletaha, D.; Neogi, T.; Silman, A.J.; Funovits, J.; Felson, D.T.; Bingham, C.O., 3rd; Birnbaum, N.S.; Burmester, G.R.; Bykerk, V.P.; Cohen, M.D.; et al. 2010 Rheumatoid arthritis classification criteria: An American College of Rheumatology/European League Against Rheumatism collaborative initiative. Arthritis Rheum 2010, 62, 2569–2581. [Google Scholar] [CrossRef]
- Yoshii, I.; Sawada, N.; Chijiwa, T. Associations between clinical metrics of joint deformity, disease duration, disease activity, functional capacity, quality of life, pain, and fatigue in patients with rheumatoid arthritis. Clin. Rheumatol. 2023, 42, 1027–1038. [Google Scholar] [CrossRef] [Scilit]
- Bondonno, N.P.; Blekkenhorst, L.C.; Bird, A.L.; Lewis, J.R.; Hodgson, J.M.; Shivappa, N.; Hébert, J.R.; Woodman, R.J.; Wong, G.; Kerr, D.A.; et al. Dietary inflammatory index and the aging kidney in older women: A 10-year prospective cohort study. Eur. J. Nutr. 2020, 59, 3201–3211. [Google Scholar] [CrossRef] [Scilit]
- Rausch, T.; Cairoli, A.; Benhattar, J.; Spring, P.; Hohl, D.; de Leval, L. EBV+ cutaneous B-cell lymphoproliferation of the leg in an elderly patient with mycosis fungoides and methotrexate treatment. APMIS 2013, 121, 79–84. [Google Scholar] [CrossRef] [Scilit]
- Möller, B.; Pruijm, M.; Adler, S.; Scherer, A.; Villiger, P.M.; Finckh, A.; Swiss Clinical Quality Management in Rheumatic Diseases (SCQM) Foundation. Chronic NSAID use and long-term decline of renal function in a prospective rheumatoid arthritis cohort study. Ann. Rheum. Dis. 2015, 74, 718–723. [Google Scholar] [CrossRef] [Scilit]
- Bernier-Jean, A.; Prince, R.L.; Lewis, J.R.; Craig, J.C.; Hodgson, J.M.; Lim, W.H.; Teixeira-Pinto, A.; Wong, G. Dietary plant and animal protein intake and decline in estimated glomerular filtration rate among elderly women: A 10-year longitudinal cohort study. Nephrol. Dial. Transpl. 2021, 36, 1640–1647. [Google Scholar] [CrossRef] [Scilit] [PubMed]
- Kondo, S.; Tanimoto, K.; Yamada, K.; Yoshimoto, G.; Suematsu, E.; Fujisaki, T.; Oshiro, Y.; Tamura, K.; Takeshita, M.; Okamura, S. Mature T/NK-cell lymphoproliferative disease and Epstein-Barr virus infection are more frequent in patients with rheumatoid arthritis treated with methotrexate. Virchows Arch. 2013, 462, 399–407. [Google Scholar] [CrossRef] [Scilit]
- Ichikawa, A.; Arakawa, F.; Kiyasu, J.; Sato, K.; Miyoshi, H.; Niino, D.; Kimura, Y.; Takeuchi, M.; Yoshida, M.; Ishibashi, Y.; et al. Methotrexate/iatrogenic lymphoproliferative disorders in rheumatoid arthritis: Histology, Epstein-Barr virus, and clonality are important predictors of disease progression and regression. Eur. J. Haematol. 2013, 91, 20–28. [Google Scholar] [CrossRef] [Scilit]
- Tanaka, K.; Ichikawa, A.; Umezawa, N.; Yamamoto, K.; Yoshifuji, K.; Okada, K.; Nogami, A.; Umezawa, Y.; Nagao, T.; Sakashita, C.; et al. Lymphoproliferative disorder risk after methotrexate treatment for rheumatoid arthritis. Cancer Sci. 2023, 114, 3719–3727. [Google Scholar] [CrossRef] [Scilit]
- de Andrade, N.P.B.; da Silva Chakr, R.M.; Xavier, R.M.; Viecceli, D.; Correa, R.H.B.; de Oliveira Filho, C.M.; Brenol, C.V. Long-term outcomes of treat-to-target strategy in established rheumatoid arthritis: A daily practice prospective cohort study. Rheumatol. Int. 2017, 37, 993–997. [Google Scholar] [CrossRef] [Scilit]
- Song, J.J.; Song, Y.W.; Bae, S.C.; Cha, H.S.; Choe, J.Y.; Choi, S.J.; Kim, H.A.; Kim, J.; Kim, S.S.; Lee, C.K.; et al. Treat-to-Target Strategy for Asian Patients with Early Rheumatoid Arthritis: Result of a Multicenter Trial in Korea. J. Korean Med. Sci. 2018, 33, e346. [Google Scholar] [CrossRef] [Scilit]
- Brinkmann, G.H.; Norvang, V.; Norli, E.S.; Grøvle, L.; Haugen, A.J.; Lexberg, Å.S.; Rødevand, E.; Bakland, G.; Nygaard, H.; Krøll, F.; et al. Treat to target strategy in early rheumatoid arthritis versus routine care-A comparative clinical practice study. Semin. Arthritis Rheum. 2019, 48, 808–814. [Google Scholar] [CrossRef] [Scilit]
- Sepriano, A.; Ramiro, S.; FitzGerald, O.; Østergaard, M.; Homik, J.; van der Heijde, D.; Elkayam, O.; Thorne, J.C.; Larché, M.J.; Ferraccioli, G.; et al. Adherence to Treat-to-target Management in Rheumatoid Arthritis and Associated Factors: Data from the International RA BIODAM Cohort. J. Rheumatol. 2020, 47, 809–819. [Google Scholar] [CrossRef] [Scilit]
- Huang, H.; Xie, W.; Geng, Y.; Fan, Y.; Wang, Y.; Zhao, J.; Zhang, Z. Towards a Better Implementation of Treat-to-Target Strategy in Rheumatoid Arthritis: A Comparison of Two Real-World Cohorts. Rheumatol. Ther. 2022, 9, 907–917. [Google Scholar] [CrossRef]

Disclaimer/Publisher’s Note: The statements, opinions and data contained in all publications are solely those of the individual author(s) and contributor(s) and not of MDPI and/or the editor(s). MDPI and/or the editor(s) disclaim responsibility for any injury to people or property resulting from any ideas, methods, instructions or products referred to in the content. |
© 2026 by the authors. Licensee MDPI, Basel, Switzerland. This article is an open access article distributed under the terms and conditions of the Creative Commons Attribution (CC BY) license.