


Abstract
Nine elements found in 24 cumin samples from China, India, Syria and Turkey were measured by laser ablation–inductively coupled plasma–time-of-flight mass spectrometry (LA-TOF-MS) for the purpose of collecting data that could be used to discriminate among the origins. Pellets were prepared from the powdered samples and elemental abundances were measured. Discriminant function analysis (DFA) of this data was used to qualitatively differentiate the cumin from four different origins. This data was in agreement with that we obtained when calculating concentrations based on external calibration curves created using six National Institute of Standards and Technology (NIST) standards with 13C internal standardization. These curves were validated using NIST 1573a (tomato leaves) as a check standard. We highlight the usefulness of the information gained as well as its potential application to the analysis of trace evidence in a forensics laboratory.
1. Introduction
Cumin spice is grown in Syria, Turkey, East India, and parts of China. The cumin seeds are harvested and dried and then used whole or ground up. Cumin is traditionally used as a spice in Indian, Middle Eastern, Asian, and Mexican cuisine. It is also used medicinally and for preservation of foodstuff [1]. Cumin ranks second and fourth out of 12 spices/herbs in area harvested and tons of spice/herbs produced, respectively. Because of this, the Food and Agriculture Organization of the United Nations identifies cumin as a spice holding greater relevance from the productive and economic points of view [2]. Its global consumption is estimated to be 206,132 US tons [3], while the global spice market is projected to reach 3.22 billion by 2025 [4].
Food consumption used to be linked to the territory where the food was produced, but this is no longer the case. Free trade, urbanization and globalization, and changes in technology of food production and food transportation have led to the mixing of cultures and food habits across regions [5]. The Food Safety Modernization Act, signed into law in 2011, requires that companies provide verification that they are following the U.S. Food, Drug and Cosmetic Act by focusing on traceability testing. The testing is done to determine where the ingredients and products come from [6]. In the European Union, many spices are registered under Geographical Indications as a verification of their quality. For example, thirteen spices, including cumin, are registered under the Protected Designation of Origin [2]. This is also important because spices from different regions, as well as different spices across the same region, contain different levels of heavy metals. An analysis of 17 popular spices in Bahrain showed that Cuminum cyminum (cumin) contained the highest amount of iron. Nigella stavia (black cumin) contained the highest amounts of Zn and Ni. Cumin from Saudi Arabia also contained the highest concentrations of Ni and Pb [7].
Since the origin of a spice can affect its quality and therefore the cost, there is the propensity for fraud, driven by the desire for a vendor to increase its profits [8,9,10,11,12]. In addition to fraud, adulteration, where foreign or inferior materials are added to the spice, may occur. This is more common in powders [13]. Cumin is frequently sold in both ground form and unground forms. Between 1990 and 2022 there were 50–100 articles on adulteration of vanilla, oregano, thyme, black pepper, cinnamon, cumin, and cloves [2]. The Decernis Food Fraud Database noted there were seven documented occurrences of food fraud and 13 inference records (indications of probable knowledge of food fraud adulteration without sufficient documentation) involving cumin between 2000 and 2020. Examples include peanut residues and other nuts found in cumin-based products [14,15]. An analysis of 1885 samples of herbs and spices, including cumin, marketed in Europe found that 17% were adulterated. Cumin samples were adulterated with coriander and a variety of different seeds. Undeclared or unauthorized food additives and flavorings, in addition to starch, flour, and charcoal dust, have also been found in cumin and other spices [2,7,13]. The European Union Rapid Alert System for Food and Feed (RASFF) (whose priority is food safety and assisting in quick action in the event of dangers to the public’s health) identified cumin in the top 10 products of herbs and spices in total notifications and the top 7 of serious notifications (2000–2022). India, Turkey, and China were first, fourth, and fifth in reporting notifications [16].
Numerous reviews cover analytical techniques, commonly with multivariate statistics, most employed for food authenticity and geographical origin discrimination [2,5,8,9,13,17,18]. Other recent works specific to geographic origin include those for black pepper [19], garlic and onion [20], cinnamon [21], and saffron [22]. An overview of analytical tools specific to the identification of adulterants in commonly traded herbs and spices is presented by Osman et al. [23].
Recent work involving cumin focuses on the use of near-infrared (IR) spectroscopy for quantification of cumin powder adulteration with rice by-products [24], spectroscopic analysis for the quantification of adulteration of cumin seed oil [25,26], attenuated total reflectance (ATR)–Fourier Transform IR (FTIR) and fluorescence analysis for authenticity and adulteration of black cumin [27], gas chromatography/mass spectroscopy (GC/MS) for geographic origin discrimination based on cumin seed oil [28], near-IR spectroscopy for identification of cumin from different regions in China [12], electronic sensing for geographical classification and adulteration detection of cumin [29], and measuring compositions of cumin seeds at different maturity stages [30]. Most of these techniques include chemometric methods. None of the above works use elemental content for cumin origin identification. Previously we showed that wavelength dispersive X-ray fluorescence spectroscopy (WDXRF) could be used to measure the elemental composition of cumin and vanilla samples and that LA-TOF-MS could be used to measure the elemental composition of vanilla samples [31,32]. In the above WDXRF and LA-TOF-MS work, the quantitative data acquired was used to show origin attribution. Quantitation was carried out using calibration curves. While origin classification was observed using both techniques, LA-TOF-MS offers the additional advantage of decreased analysis time with higher throughput using a smaller sample size. A complete mass spectrum, including isotopic information, is acquired within a few minutes, whereas instrument collection with WDXRF takes at least 12 min per sample. A shorter analysis time could lead to a faster turnaround time in the screening of spice at Customs or at a point of vendor validation. There is also an additional advantage of measuring transient signals [33]. An overview of additional advantages and disadvantages of LA sample introduction is presented by Orellana and others [34]. The disadvantages briefly include necessity for optimization of the laser parameters based on the matrix and correction for signal drift and fractionation if quantitation is desired. Correction for the above, however, is difficult due to the lack of matrix matched calibration standards, internal standards, and reference materials. Along with our use of an external calibration curve for vanilla spice samples, several other investigators offer strategies that have been employed for different types of food and beverages [13,20,35,36,37,38,39]. In particular Voss et al. elaborate on the influence of various laser ablation parameters on the accuracy of the results [36].
In our prior work using LA-TOF-MS for vanilla attribution we correctly attributed 25 vanilla samples to four geographical origins (including two species) using one set of ablation parameters for all isotopes [32]. The goal of the current work is to apply the same set of ablation parameters to cumin samples from China, India, Syria and Turkey and determine if the elemental data can be used for origin attribution as another application of our technique. In addition, we show that the qualitative data, obtained directly from the instrument without the use of external calibration, can be used with DFA to show origin attribution. We chose cumin spice for this application since it is widely used for its flavor, aroma, and antioxidant properties and because of its availability from the above countries through McCormick’s Technical Innovation Center (McCormick and Co., Inc., Hunt Valley, MD, USA).
2. Materials and Methods
Samples: Ground cumin samples, received as gifts from McCormick & Company Inc. Technical Innovation Center reserves, had been procured through McCormick’s routine, commercial route from their representatives for each of the countries. Upon receipt the product is cleaned on a line that utilizes properties of the cumin (weight, size, color, etc.) to separate out foreign material. The product then goes into a milling line that grinds to the specified granulation requirements. The processed particle size of the samples is typically 95% through a 425 μm sieve and <5% on a 600 μm sieve. Moisture content ranges between 5 and 9% with a 7% average. All samples are stored in airtight glass jars at ambient conditions. Six samples were acquired from each of the four countries. The production years consisted of the following: 2009–2010 for China, 2006–2010 for India, 2005–2010 for Syria, 2005–2010 for Turkey. These were provided at random based on availability from the McCormick Technical Innovation Center.
Sample Preparation: All cumin samples and NIST standards were pressed into pellets in our lab using a SPEX 3630 X-Press® and a 3614 40 mm Evacuable Die Set. (SPEX Sample Prep, Metuchen, NJ, USA). The die components were cleaned using 80% ethanol prior to the addition of the sample. Thin-walled aluminum cups (Spec-caps) were added for extra stability and to facilitate the labeling and handling of the samples once pressed. Cumin samples each weighing 5.0 ± 0.1 g were poured into the bore of the die. The samples were pressed and held for 3 min at 25 tons of pressure.
LA-ICP-TOF-MS analysis: Analysis of all NIST standards and cumin samples was carried out using a GBC OptiMass 9500 ICP-TOF (GBC Scientific Equipment, Victoria, Australia) equipped with a GeoMed cryocell (GeoMed Analytical CryoCell System 10, GBC Scientific, Victoria, Australia) set at −15 °C, to ensure a constant temperature during analysis, and a Cetac LSX-213 laser ablation system (CETAC Technologies LSX-213, Omaha, NE, USA) The operating parameters are listed in Table 1.
Table 1.
LA-ICP-TOF-MS operating parameters.
LA-TOF-MS method development: Initial method development was carried out on NIST SRM 1573a to optimize laser and integration parameters. This involved varying the spot size (up to 200 µm to retain the advantage of “small” sample size), number of spots, laser power, burst counts, and integration parameters until the RSD for the element of interest (Mn) was <10%. The final combination of integration parameters and laser parameters that yielded the lowest RSD was with a 20 Hz laser shot frequency (10 s shutter delay) at 700 bursts over five 200 µm spots and to integrate the second, third, fourth, and fifth spots over four 4 s integrations. The average of this was taken, and the gas blank, which was acquired during a 4 s period prior to ablation, was subtracted. A total of 800 spectra were recorded during the 260 s acquisition time. The total counts resulting from this integration were normalized to 13C to correct for signal drift and mass bias between samples. The rest of the operating parameters are given in Table 1.
Generation of calibration curve and cumin analysis: External calibration curves were generated from the NIST standards SRM 1515 (apple leaves), 1549 (non-fat milk powder), 1547 (peach leaves), 1575a (pine needles), and 1570a (spinach) and from the Chinese standard GSB-30 (green tea) for isotopes 23Na, 25Mg, 31P, 44Ca, 55Mn, 63Cu, 64Zn, 85Rb, and 88Sr. These SRMs were selected to attempt to match the matrix and ablation characteristics of the cumin samples and to incorporate as many elements as possible, over a wide enough range to generate calibration curves. The calibration parameters are listed in Table 2. Our selection of the above isotopes measured in cumin was based on the elements that showed a recovery of >±75% compared to the tomato NIST standard and elements for which we could create a calibration curve with 3–6 elements with an R2 greater than 0.970. We were further limited by mass regions that were masked out on the detector to avoid saturation from more abundant gases (m/z 10–12, 14–16, and 37–43).
Table 2.
Calibration curve obtained using NIST standards.
Statistical analysis: The Statgraphics Centurion statistical package version 16 (StatPoint Technologies Inc., Warrenton, VA, USA) was used for the analysis of variance (ANOVA) and discriminant function analysis to classify the cumin samples according to their geographical origin using elemental data. The criteria used to decide which variables should be included in the model (training set) included maximizing the F-to-fit value while maintaining a small Wilks’ lambda using a forward fit method of analysis.
Validation of calibration curve: The validity of the calibration curve was checked using NIST 1573a (tomato leaves). The accuracy was determined by comparing the measured concentrations of the tomato leaves to the NIST certified values while the precision was determined by analyzing the tomato leaves six times over a 2-month period. Generally good recovery (86.89% to 118.84%) was achieved for all elements. Relative standard deviations (n = 6) for NIST 1573a were between 1.8% and 6.6% for all elements.
3. Results and Discussion
Analytical Results
The elemental concentrations from a total of 24 cumin samples were measured using LA-TOF-MS (six, in duplicate, from each origin). The mean elemental concentrations calculated using external calibration curves and 13C internal standardization for each origin are listed in Table 3. The relative ordering of the elements from highest to lowest concentration is Ca, P, Mg, Na, Sr, Zn, Mn, Cu, and Rb. An ANOVA test revealed Syria had the largest number of elements with concentrations that were statistically different from the other origins, followed by India, Turkey then China. These elements analyzed are unique to each country of origin and can be viewed as an elemental fingerprint for cumin from that country. Table 4 shows a comparison of our mean elemental concentrations to those we measured previously using WDXRF [31]. This WDXRF data was also acquired using an external calibration curve using the same NIST standards as used in this study. The ordering of the concentrations measured with LA-TOF-MS is similar to the values measured by WDXRF. There are differences in absolute concentrations, however. These deviations may be attributed to the need for more closely matrix matched standards for quantification in LA-TOF-MS over that of WDXRF. They may also result from the generally larger RSDs obtained for LA-TOF-MS results compared to those obtained for the WDXRF results. We observed similar differences in our previous works using WDXRF and LA-TOF-MS for the analysis of vanilla spice [32,40].
Table 3.
Mean elemental concentrations measured in cumin from each origin (mg/kg).
Table 4.
Comparison of LATOF and XRF results for Syria samples (n = 6).
The goal of this work was not to optimize the instrumental parameters needed for accurate quantitation of each isotope. We acknowledge that for more accurate quantitation this optimization for each isotope should be carried out. We wanted instead to determine the feasibility of using the data obtained with one set of conditions, using DFA, to discriminate the origins.
DFA: The cumin samples were separated into the training set (n = 40; 20 in duplicate; which represents 5 from each origin) and a test set (n = 8; 4 in duplicate, which represents 1 from each origin). The elemental concentrations of the training set were used as variables in the DFA to generate mathematical models that consist of the linear combination of weighted elemental variables. The variables were weighted such that the differences between group clusters were maximized while the differences within group clusters were minimized.
The classification model was built using a Forward Selection of discriminant analysis and the F-to-enter statistic was calculated for each variable. In a stepwise fashion, the F-to-enter statistic for each variable is compared to the F-to-enter threshold value. If the calculated F-to-enter statistic was greater than the threshold value, the variable was included in the model. However, if the calculated F-to-enter values fell below the threshold, those variables were removed. Of the ten variables analyzed, five of the variables (Na, Mg, Ca, Mn, and Zn) had F-to-enter values that were greater than threshold value. These five elements were incorporated into the three discriminant functions (DFs) used to separate the four countries of origin. These DFs are
DF1 = 1.24707*Na − 0.317234*Mg − 1.09739*Ca + 1.0946*Mn − 0.235023*Zn
DF2 = 0.273696*Na − 1.53787*Mg + 1.1688*Ca + 0.0757567*Mn + 1.20028*Zn
DF3 = 0.327323*Na + 1.37641*Mg − 0.413801*Ca − 0.971947*Mn + 0.0782053*Zn
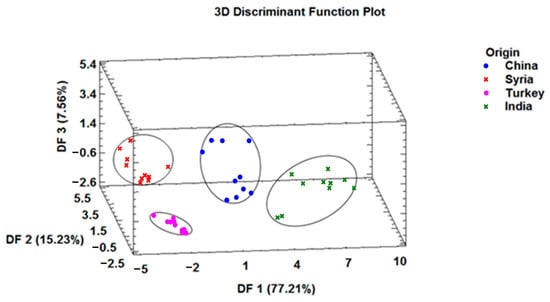
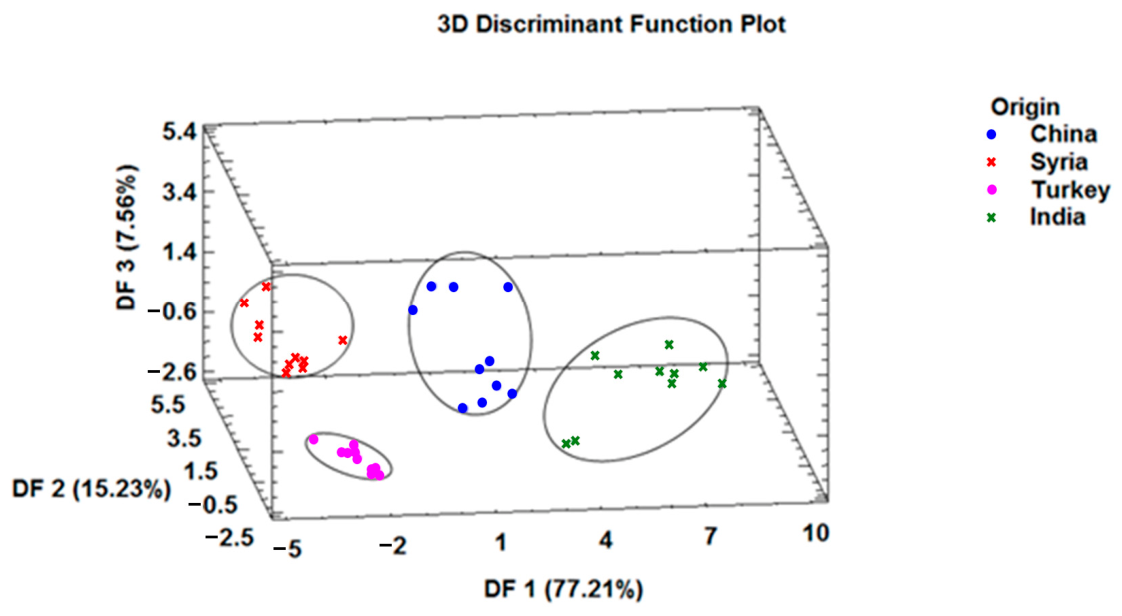
The first function explains 77.21% of the variance in the data. Figure 1 shows that India and China are well separated from Syria and Turkey, which are both clustered tighter on the DF1 axis. This reflects the geographic separation of China and India from each other and from both Syria and Turkey which share a border. Karik et al. reported essential oil yield in cumin seeds originating from Syria (1.98 ± 0.05%) and Turkey (1.87 ± 0.06%) to be closer than the essential oil yield from two different regions in India (1.64 ± 0.05% and 1.49 ± 0.06%) [28].
Figure 1.
Discriminant function plot of cumin samples from China, Syria, Turkey and India using quantitative data from external calibration curve.
Discriminant function 2 explains 15.23% of the remaining variance while DF3 explains the last 7.56%. Figure 1 shows a visual representation of the separation described by the DFs. Four distinct clusters, with each cluster representing a country of origin, are observed. The within-group variance for the cumin samples from Turkey is considerably less than the within-group variance in the groupings for Syria, China, and India. The larger variance for the Syria, China, and Turkey groupings may reflect the slightly larger variations in the soil and environmental compositions over the years the samples were collected. It may also indicate that the samples were acquired over a larger area, with more variations in soil composition, within each country. Without more information on the specific origin of the samples within each country, it is difficult to draw any conclusions. The larger distance between the origin groupings compared to the variance within each origin is sufficient for origin clustering of these samples.
The impact of each variable on the model’s ability to classify the cumin samples by origin is given by the magnitude of the variable’s coefficient. In the first function, the elements that had the greatest influence were Na and Ca. In the second function the elements that provided the greatest influence were Mg and Zn, while in the third function they were Mg and Mn. The discriminatory power of these functions is given by Wilk’s Lambda factor which ranges from 0 (100% discriminatory power) to 1 (no discriminatory power). Wilk’s Lambda factor values for DF1, DF2 and DF3 are 0.00502282, 0.0886786 and 0.380108, respectively (p = 0.000 at a 95% confidence level). Another measure of the discriminatory power is the canonical correlation coefficient. This coefficient shows the proportion of variance between the groups and the total variance. It ranges from 0 (poor separation between groups) to 1 (best separation between groups (20)). The canonical correlation coefficients for DF1, DF2 and DF3 are 0.97127, 0.87561 and 0.78733, respectively.
The model’s ability to correctly classify the country of origin was evaluated in two ways. The first was by a cross validation in which the predicted origin membership was compared to the actual origin. This evaluation revealed that 100% of the test samples were correctly classified. The method was further validated using the hold-out method where the test samples that were withheld from the training set were analyzed. The test samples were correctly assigned to their origin 100% of the time. These results are consistent with the results we obtained when using WDXRF to measure elemental concentrations from the same countries [31].
The successful validation of the model illustrates that our technique was accurate enough to measure the differences that existed in the elemental concentrations of the six cumin samples used in our study from the four origins.
We next applied the same methodology to elemental abundances of all isotopes measured and ratioed to 31P, since it showed the lowest RSD of all variables, using a Forward Selection of discriminant analysis. The resulting functions are
DF1 = 1.2576*Na/P + 1.30545*Mg/P − 2.12372*Ca/P + 0.16203*Mn/P − 0.688801*Zn/P + 1.59597*Rb/P.
DF2 = 0.386796*Na/P − 1.32238*Mg/P + 1.05774*Ca/P + 0.198346*Mn/P + 1.41245 *Zn/P − 0.0.59491*Rb/P.
DF3 = 0.22925*Na/P + 2.28675*Mg/P − 1.3916*Ca/P − 1.54082*Mn/P − 0.0.143206*Zn/P + 0.763805*Rb/P.
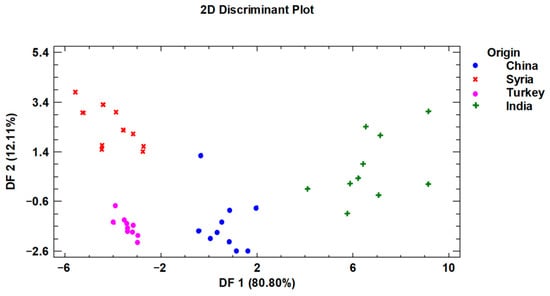
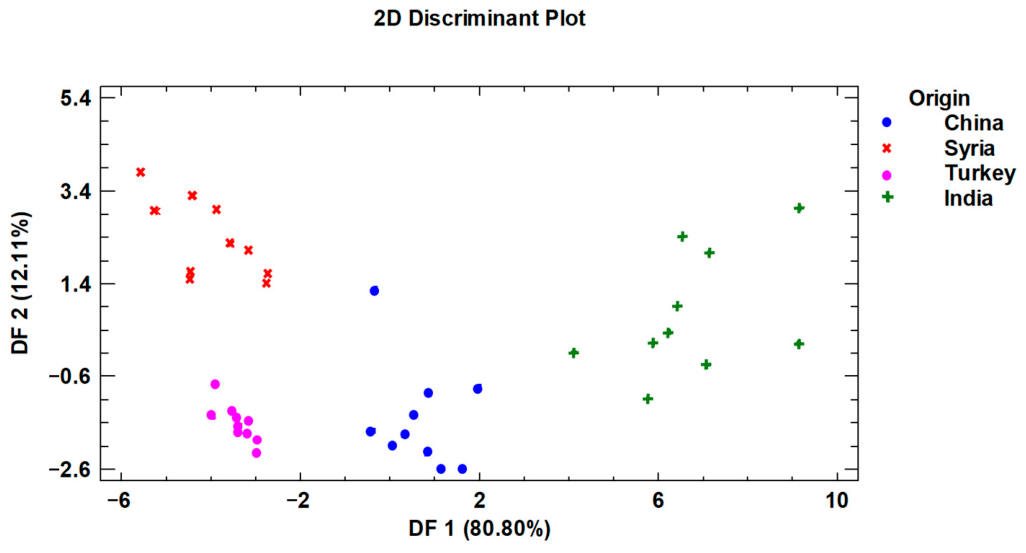
The first function explains 80.81% of the variance in the data. Function 2 explains 12.11% of the remaining variance while DF3 explains the last 7.09%. Figure 2 shows a visual representation of the separation described by the first two DFs. Wilk’s Lambda factor values for DF1, DF2 and DF3 are 0.00407629, 0.0876762 and 0.357224, respectively (p = 0.000 at a 95% confidence level). The canonical correlation coefficients for DF1, DF2 and DF3 are 0.97648, 0.86866 and 0.80173, respectively. All the samples were correctly classified and the test samples that were withheld from the training set were correctly assigned to their geographical origin 100% of the time. The cumin samples from China and India are separated from each other on the DF1 axis and separated from the cumin from Syria and Turkey, while the clusterings of the cumin samples from Turkey and Syria overlap on the DF1 axis. We observed the same pattern in the data shown in Figure 1. In comparison with the data shown in Figure 1, the model in Figure 2 is prone to greater misclassification of test samples, because the between-group separation is smaller and the within-group variability considerably larger than that shown in Figure 1.
Figure 2.
Discriminant function plot of cumin samples from China, Syria, Turkey and India using raw data ratioed to 31P.
This was an exploratory study and the first to examine the feasibility of using elemental content measured by LA-TOF-MS for cumin origin discrimination from China, Syria, Turkey, and India. This instrument is currently not standard at Customs, in food testing laboratories such as the McCormick Technical Innovation Center, or in local forensic trace laboratories. While some local forensic laboratories have scanning electron microscopy with energy dispersive X-ray spectroscopy (SEM–EDX) which can measure elemental content (mostly used for gunshot reside), SEM–EDX analysis has considerably higher initial and operating costs and does not allow for multielement throughput. Incorporating an analytical technique with high-throughput elemental analysis into trace workflow could further help in the characterization of trace evidence, including geographical origin identification of spices, herbs, marijuana, cocaine, kratom, dokha, and other drugs, whereby the elemental signatures can be used to place the evidence into a smaller subclass which holds greater value as associative evidence [41]. While techniques like ICP-MS and ICP-OES offer lower limits of detection and greater reproducibility, they require greater sample preparation including dissolution and the incorporation of internal standards [42]. An advantage of LA-TOF-MS with respect to forensics is the potential to analyze the solid sample without incorporating internal standards or without dissolution, which may introduce contaminants. Maintaining sample integrity will further help ensure the results are more defendable in court. In addition, analysis by LA-TOF-MS can be carried out with as little as a few micrograms of a sample, which is ideal for herbs, spices, drugs, and other types of trace evidence such as ink, paint, tape, fibers, glitter, and gunshot residue. As a result, it is worth continuing to explore this technique.
We have noted, like others, the lack of matrix matched standards, including those with elemental concentrations covering a range allowing for the construction of a suitable calibration curve, as the biggest challenge. In this work, for example, we included the milk SRM in our calibration. This allowed us to include and/or extend the calibration range of several elements. Future studies could explore the effects of incorporating different NIST standards on the recovery of the elements in the SRMs as well as the recovery of elements measured by LA-TOF-MS compared to measurement by a more quantitative technique such as ICP-MS/OES. This may also allow additional elements to be included in the model. Future studies could also focus on different integration strategies for the output. The software used in this study only generates counts for ablated areas (Figure S1, Table S1). The parameters we used were optimized for only one element and then applied to all elements. Our work showed the feasibility of using one set of parameters for the measurement of elements that were discriminatory for these six samples from China, India, Syria, and Turkey. In a forensic laboratory, analyses that are defendable in court must strictly follow the laboratory standing operating procedure (SOP). We have illustrated the parameters that can be used for the analysis of cumin and vanilla samples and/or used as a starting point to develop more accurate methods specific to the desired analyses [32]. In addition, quantitation by LA-TOF-MS requires correction for signal drift and fractionation. We used 13C due to its considerably large concentration and relatively homogeneous distribution [38,43,44]. We did not analyze our data without 13C internal standard correction. Future work should explore the usefulness of different types of internal standard normalization specific to the application.
Prior work with cumin focused on the use of infrared spectroscopy to differentiate unadulterated cumin powder or seed oil from adulterated cumin powder or seed oil [24,26]. Karik et al. examined cumin seed oils from different geographical regions including India, Syria, and Turkey but did not attempt any regional differentiation [28]. Yang et al. used NIR spectroscopy with machine learning algorithms to accurately distinguish cumin and fennel from three different regions in China. They showed differentiation by variance using principal component analysis (PCA) [12]. Tahri et al. also used PCA to differentiate cumin samples from Morocco, Egypt, India, and Syria based on their volatile components. Their clustering of Syrian and Indian cumin showed significant between-group separation, similar to the results we obtained using elemental data for the DFA [29]. Future work could also include incorporating both elemental and organic markers into the model.
We propose that one may use LA-TOF-MS as an initial screening technique. If the sample tested does not fall into the expected group, then the laboratory can follow up with the more time-consuming techniques of ICP-MS/OES to definitively confirm that the sample does not come from the specified origin. This follow-up analysis is possible since sample integrity is essentially maintained during LA-TOF-MS analysis. In addition, the relevance of the data in generating the model is ascertained in the DFA. Data that is less relevant does not need to be collected in the follow-up analysis. This helps to further decrease the cost and sample preparation time of the ICP-MS/OES since the analysis will require fewer calibration standards and standard reference materials.
Another application of LA-TOF-MS could be in support of food safety. As noted above, RASFF listed India, Turkey, and China as first, fourth, and fifth in reporting notifications overall. With this knowledge one may also decide that an unknown cumin sample that is classified into one of these regions should be further screened for adulterants and/or elevated levels of toxic metals [16].
4. Conclusions
We showed that 24 cumin spice samples could be differentiated among four different origins using relative abundances, ratioed to 31P, obtained from LA-TOF-MS using only one set of ablation parameters for all isotopes. This was accomplished using a model built with three functions consisting of only five elements that correctly classified 100% of the samples and the unknowns. Our results agree with those obtained using 13C internal standard correction and external calibration with NIST standards. Without external calibration, however, the smaller between-group clustering and larger within-group variance we observed means our model is more prone to error in classifying unknown samples. This work illustrates the potential for using LA-TOF-MS for the high-throughput rapid screening of spices and potentially other types of trace evidence, in shorter times than those currently used for quantitative elemental analysis, while maintaining sample integrity. We note room for improvement with both models. The relatively small sample set, and hence the limited representation, used for the chemometric classification reflects more the preliminary nature of the classification model. In addition to increasing the sample size, the accuracy and precision of the results could be improved further by exploring additional sampling, calibration, normalization, and integration strategies.
Supplementary Materials
The following supporting information can be downloaded at https://www.mdpi.com/article/10.3390/powders5020016/s1: Figure S1: Raw data collected showing (top) mass counts versus time, (bottom) counts for Mn versus time; Table S1: Raw data collected for Mn in NIST 1570a Spinach Leaves.
Author Contributions
Conceptualization, E.M.H., E.M.; methodology, E.M.H., E.M.; software, E.M.H., E.M.; validation, E.M.H., E.M.; formal analysis, E.M.H., E.M.; investigation, E.M.H., E.M.; resources, E.M.H.; data curation, E.M.H., E.M.; writing—original draft preparation, E.M.H., E.M.; writing—review and editing, E.M.H., E.M.; visualization, E.M.H., E.M.; supervision, E.M.H., E.M.; project administration, E.M.H., E.M.; funding acquisition, E.M.H., E.M. All authors have read and agreed to the published version of the manuscript.
Funding
This research received no external funding.
Data Availability Statement
The original contributions presented in this study are included in the article. Further inquiries can be directed to the corresponding author.
Acknowledgments
We would like to thank Steven Lev (Towson University) for his insight and guidance on this work, Mike Zapf (McCormick Technical Innovation Center) for providing the samples, Kristen Vereecke (Masters of Science Forensic Science Program, Towson University) for her work in helping to optimize the laser ablation and integration parameters, Mark Monk (Towson University) for his assistance with the LA-ICP-TOF-MS, the Chemistry Department of Towson University for the faculty start-up funds, and the Graduate Student Association for funding.
Conflicts of Interest
The authors declare no conflicts of interest.
References
- Gottardi, D.; Bukvicki, D.; Prasad, S.; Tyagi, A.K. Beneficial Effects of Spices in Food Preservation and Safety. Front. Microbiol. 2016, 7, 186557. [Google Scholar] [CrossRef] [Scilit] [PubMed]
- Velázquez, R.; Rodríguez, A.; Hernández, A.; Casquete, R.; Benito, M.J.; Martín, A. Spice and Herb Frauds: Types, Incidence, and Detection: The State of the Art. Foods 2023, 12, 3373. [Google Scholar] [CrossRef] [Scilit]
- Burdock, G.A. Assessment of black cumin (Nigella sativa L.) as a food ingredient and putative therapeutic agent. Regul. Toxicol. Pharmacol. 2022, 128, 105088. [Google Scholar] [CrossRef] [Scilit] [PubMed]
- Spices & Culinary Herbs. Available online: https://www.statista.com/outlook/emo/food/sauces-spices/spices-culinary-herbs/worldwide?srsltid=AfmBOoqpI1wQOsHoslcggZDJL1_zYjbseF_wuOwrvypExlPCCdCneaIP#revenue (accessed on 23 April 2026).
- Luykx, D.M.A.M.; van Ruth, S.M. An overview of analytical methods for determining the geographical origin of food products. Food Chem. 2008, 107, 897–911. [Google Scholar] [CrossRef] [Scilit]
- Available online: https://www.fda.gov/food/hfp-constituent-updates/fda-proposes-extend-compliance-date-food-traceability-rule-and-issues-new-faqs-and-other-resources (accessed on 23 April 2026).
- Alawadhi, N.; Abass, K.; Khaled, R.; Osaili, T.M.; Semerjian, L. Heavy metals in spices and herbs from worldwide markets: A systematic review and health risk assessment. Environ. Pollut. 2024, 362, 124999. [Google Scholar] [CrossRef] [Scilit]
- Lei, H.; Castanheira, I.; Guan, T. Advanced techniques against food fraud. Food Chem. 2025, 470, 142832. [Google Scholar] [CrossRef] [Scilit]
- Ferreira, M.M.; Marins-Gonçalves, L.; De Souza, D. An integrative review of analytical techniques used in food authentication: A detailed description for milk and dairy products. Food Chem. 2024, 457, 140206. [Google Scholar] [CrossRef] [Scilit]
- Jurica, K.; Brčić Karačonji, I.; Lasić, D.; Bursać Kovačević, D.; Putnik, P. Unauthorized food manipulation as a criminal offense: Food authenticity, legal frameworks, analytical tools and cases. Foods 2021, 10, 2570. [Google Scholar] [CrossRef] [Scilit] [PubMed]
- Di Noi, A.; Massaro, A.; Salvitti, C.; Managò, M.; Cosentino, F.; Piro, R.; Suman, M.; Pepi, F.; Tata, A.; Troiani, A. AP-MALDI-MS reveals adulteration of dried oregano leaves. J. Food Compos. Anal. 2025, 139, 107121. [Google Scholar] [CrossRef] [Scilit]
- Yang, B.; Chen, C.; Chen, F.; Chen, C.; Tang, J.; Gao, R.; Lv, X. Identification of cumin and fennel from different regions based on generative adversarial networks and near infrared spectroscopy. Spectrochim. Acta Part A Mol. Biomol. Spectrosc. 2021, 260, 119956. [Google Scholar] [CrossRef] [Scilit]
- Negi, A.; Pare, A.; Meenatchi, R. Emerging techniques for adulterant authentication in spices and spice products. Food Control 2021, 127, 108113. [Google Scholar] [CrossRef] [Scilit]
- Hoffman, J.M.; Lafeuille, J.-L.; Ragupathy, S.; Newmaster, S. Chapter 10—Spice and herb fraud. In Food Fraud; Hellberg, R.S., Everstine, K., Sklare, S.A., Eds.; Academic Press: Cambridge, MA, USA, 2021; pp. 177–218. [Google Scholar]
- Garber, E.A.; Parker, C.H.; Handy, S.M.; Cho, C.Y.; Panda, R.; Samadpour, M.; Reynaud, D.H.; Ziobro, G.C. Presence of Undeclared Food Allergens in Cumin: The Need for Multiplex Methods. J. Agric. Food Chem. 2016, 64, 1202–1211. [Google Scholar] [CrossRef] [Scilit] [PubMed]
- Eissa, F.; Zidan, N.E.H.A.; Sebaei, A.S. Contamination of herbs and spices: A 23-year EU RASFF notifications analysis. J. Food Saf. 2024, 44, e13131. [Google Scholar] [CrossRef] [Scilit]
- Reinholds, I.; Bartkevics, V.; Silvis, I.C.J.; van Ruth, S.M.; Esslinger, S. Analytical techniques combined with chemometrics for authentication and determination of contaminants in condiments: A review. J. Food Compos. Anal. 2015, 44, 56–72. [Google Scholar] [CrossRef] [Scilit]
- Wallace, C.A.; Manning, L. Food provenance: Assuring product integrity and identity. CAB Rev. Perspect. Agric. Vet. Sci. Nutr. Nat. Resour. 2020, 15, 1–7. [Google Scholar] [CrossRef] [Scilit]
- Chilaka, C.A.; Aparicio-Muriana, M.d.M.; Petchkongkaew, A.; Quinn, B.; Birse, N.; Elliott, C.T. A combined elementomics, metabolomics, and chemometrics approach as tools to identify the geographic origins of black pepper. Food Chem. 2025, 492, 145420. [Google Scholar] [CrossRef] [Scilit]
- Sim, K.S.; Kim, H.; Kim, Y.K.; Kim, H.J. Discrimination of garlic and onion and their geographical origin using fsLA-ICP-MS with chemometrics analysis. Microchem. J. 2025, 215, 114426. [Google Scholar] [CrossRef] [Scilit]
- Castro, R.C.; Ribeiro, D.S.M.; Santos, J.L.M.; Páscoa, R.N.M.J. Authentication/discrimination, identification and quantification of cinnamon adulterants using NIR spectroscopy and different chemometric tools: A tutorial to deal with counterfeit samples. Food Control 2023, 147, 109619. [Google Scholar] [CrossRef] [Scilit]
- Kumari, L.; Tripathy, S.S. Elemental composition and contaminants of saffron from different origins and geographical discrimination using chemometrics. Food Addit. Contam.—Part A 2024, 41, 715–729. [Google Scholar] [CrossRef] [Scilit]
- Osman, A.G.; Raman, V.; Haider, S.; Ali, Z.; Chittiboyina, A.G.; Khan, I.A. Overview of Analytical Tools for the Identification of Adulterants in Commonly Traded Herbs and Spices. J. AOAC Int. 2019, 102, 376–385. [Google Scholar] [CrossRef] [Scilit]
- Tirado-Kulieva, V.A.; Mechato, J.; Seminario-Sanz, R.S.; Castro, W. Quantification of cumin powder adulteration with rice by-products using NIR spectroscopy combined with chemometric and machine learning models. J. Food Compos. Anal. 2025, 148, 108471. [Google Scholar] [CrossRef] [Scilit]
- Çelik, S.E.; Kaya, E.N.; Şenol, O.; Apak, R. Combined spectroscopic and chromatographic techniques augmented with chemometrics for the authentication of black cumin (Nigella sativa L.) seed oil. J. Food Compos. Anal. 2024, 131, 106221. [Google Scholar] [CrossRef] [Scilit]
- Zhu, Y.; Zou, L.; Tan, T.L. A clustering group lasso method for quantification of adulteration in black cumin seed oil using Fourier transform infrared spectroscopy. Chemom. Intell. Lab. Syst. 2022, 220, 104471. [Google Scholar] [CrossRef] [Scilit]
- Arslan, F.N.; Akin, G.; Karuk Elmas, Ş.N.; Yilmaz, I.; Janssen, H.-G.; Kenar, A. Rapid detection of authenticity and adulteration of cold pressed black cumin seed oil: A comparative study of ATR–FTIR spectroscopy and synchronous fluorescence with multivariate data analysis. Food Control 2019, 98, 323–332. [Google Scholar] [CrossRef] [Scilit]
- Karik, U.; Demirbolat, I.; Toluk, Ö.; Kartal, M. Comparative Study on Yields, Chemical Compositions, Antioxidant and Antimicrobial Activities of Cumin (Cuminum cyminum L.) Seed Essential Oils from Different Geographic Origins. J. Essent. Oil-Bear. Plants 2021, 24, 724–735. [Google Scholar] [CrossRef] [Scilit]
- Tahri, K.; Tiebe, C.; Bari, N.E.; Hübert, T.; Bouchikhi, B. Geographical Classification and Adulteration Detection of Cumin by Using Electronic Sensing Coupled to Multivariate Analysis. Procedia Technol. 2017, 27, 240–241. [Google Scholar] [CrossRef] [Scilit]
- Beyzi, E. Chemometric methods for fatty acid compositions of fenugreek (Trigonella foenum-graecum L.) and black cumin (Nigella sativa L.) seeds at different maturity stages. Ind. Crops Prod. 2020, 151, 112488. [Google Scholar] [CrossRef] [Scilit]
- Hondrogiannis, E.; Peterson, K.; Zapf, C.M.; Roy, W.; Blackney, B.; Dailey, K. The use of wavelength dispersive X-ray fluorescence and discriminant analysis in the identification of the elemental composition of cumin samples and the determination of the country of origin. Food Chem. 2012, 135, 2825–2831. [Google Scholar] [CrossRef] [Scilit]
- Hondrogiannis, E.M.; Ehrlinger, E.; Poplaski, A.; Lisle, M. Use of laser ablation-inductively coupled plasma-time of flight-mass spectrometry to identify the elemental composition of vanilla and determine the geographic origin by discriminant function analysis. J. Agric. Food Chem. 2013, 61, 11332–11337. [Google Scholar] [CrossRef] [Scilit] [PubMed]
- Sturgeon, R.E.; Lam, J.W.H.; Saint, A. Analytical characteristics of a commercial ICP orthogonal acceleration time-of-flight mass spectrometer (ICP-TOFMS). J. Anal. At. Spectrom. 2000, 15, 607–616. [Google Scholar] [CrossRef] [Scilit]
- Orellana, F.A.; Gálvez, C.G.; Roldán, M.T.; García-Ruiz, C. Applications of laser-ablation-inductively-coupled plasma-mass spectrometry in chemical analysis of forensic evidence. TrAC—Trends Anal. Chem. 2013, 42, 1–34. [Google Scholar] [CrossRef] [Scilit]
- Papaslioti, E.M.; Parviainen, A.; Román Alpiste, M.J.; Marchesi, C.; Garrido, C.J. Quantification of potentially toxic elements in food material by laser ablation-inductively coupled plasma-mass spectrometry (LA-ICP-MS) via pressed pellets. Food Chem. 2019, 274, 726–732. [Google Scholar] [CrossRef] [Scilit]
- Voss, M.; Nunes, M.A.G.; Corazza, G.; Flores, E.M.M.; Müller, E.I.; Dressler, V.L. A new approach to calibration and determination of selected trace elements in food contact polymers by LA-ICP-MS. Talanta 2017, 170, 488–495. [Google Scholar] [CrossRef] [Scilit]
- Augusto, A.S.; Sperança, M.A.; Andrade, D.F.; Pereira-Filho, E.R. Nutrient and Contaminant Quantification in Solid and Liquid Food Samples Using Laser-Ablation Inductively Coupled Plasma-Mass Spectrometry (LA-ICP-MS): Discussion of Calibration Strategies. Food Anal. Methods 2017, 10, 1515–1522. [Google Scholar] [CrossRef] [Scilit]
- Li, Y.; Guo, W.; Hu, Z.; Jin, L.; Hu, S.; Guo, Q. Method Development for Direct Multielement Quantification by LA-ICP-MS in Food Samples. J. Agric. Food Chem. 2019, 67, 935–942. [Google Scholar] [CrossRef] [Scilit] [PubMed]
- Liao, X.; Luo, T.; Zhang, S.; Zhang, W.; Zong, K.; Liu, Y.; Hu, Z. Direct and rapid multi-element analysis of wine samples in their natural liquid state by laser ablation ICPMS. J. Anal. At. Spectrom. 2020, 35, 1071–1079. [Google Scholar] [CrossRef] [Scilit]
- Hondrogiannis, E.; Rotta, K.; Zapf, C.M. The Use of Wavelength Dispersive X-ray Fluorescence in the Identification of the Elemental Composition of Vanilla Samples and the Determination of the Geographic Origin by Discriminant Function Analysis. J. Food Sci. 2013, 78, C395–C401. [Google Scholar] [CrossRef] [Scilit] [PubMed]
- Balckledge, R.D. (Ed.) All that glitters is gold. In Foresnic Analylsis on the Cutting Edge: New Methods for Trace Evidence Analysis; John Wiley and Sons: Hoboken, NJ, USA, 2007. [Google Scholar]
- Senila, M. Recent Advances in the Determination of Major and Trace Elements in Plants Using Inductively Coupled Plasma Optical Emission Spectrometry. Molecules 2024, 29, 3169. [Google Scholar] [CrossRef] [Scilit]
- Ward, N.I.; Durrant, S.F.; Gray, A.L. Analysis of biological standard reference materials by laser ablation inductively coupled plasma mass spectrometry. J. Anal. At. Spectrom. 1992, 7, 1139–1146. [Google Scholar] [CrossRef] [Scilit]
- Deiting, D.; Börno, F.; Hanning, S.; Kreyenschmidt, M.; Seidl, T.; Otto, M. Investigation on the suitability of ablated carbon as an internal standard in laser ablation ICP-MS of polymers. J. Anal. At. Spectrom. 2016, 31, 1605–1611. [Google Scholar] [CrossRef] [Scilit]

Disclaimer/Publisher’s Note: The statements, opinions and data contained in all publications are solely those of the individual author(s) and contributor(s) and not of MDPI and/or the editor(s). MDPI and/or the editor(s) disclaim responsibility for any injury to people or property resulting from any ideas, methods, instructions or products referred to in the content. |
© 2026 by the authors. Licensee MDPI, Basel, Switzerland. This article is an open access article distributed under the terms and conditions of the Creative Commons Attribution (CC BY) license.