


Abstract
As an important grain-producing region of China, Anhui Province suffered its most severe drought in 70 years in 1978, particularly in summer. During the drought, the west–northward shifted western Pacific subtropical high (WPSH) induced local high temperatures, while a weakened monsoon suppressed south-to-north moisture transport into the region. These two factors jointly triggered the extreme drought. This study aims to quantitatively examine the respective contributions of water vapor and air temperature anomalies to the drought. Based on the tight relationship between precipitation and relative humidity as well as the definition expression of relative humidity, two measures are constructed to separate moisture and temperature effects, with three supplementary indicators for assessing their relative importance. The results show that water vapor anomalies dominate this drought, contributing approximately 73% of the total effect, while temperature anomalies account for 27%. At the condensation levels, the contribution of less-than-normal water vapor to the drought is roughly 4.6 times that of warmer-than-normal temperature. Distinguishing the dominance of moisture and air temperature in the drought and quantifying their respective contribution fractions provides physical support for drought classification and prediction.
1. Introduction
Drought is one of the most frequent and devastating natural disasters in Eastern China, characterized by long duration, wide coverage, and severe destructive impacts on agricultural production, ecosystems, and social economic development [1,2,3,4,5,6,7,8,9,10,11].
As a climatically sensitive and agriculturally productive region, the middle and lower Yangtze River basin (MLYRB), sitting in eastern–central China, is frequently affected by extreme drought events under the joint modulation of the East Asian summer monsoon and large-scale subtropical circulation systems [12,13,14,15,16,17,18,19,20]. Like numerous other extreme hydrological events, these extreme droughts can arise from anomalous external forcing factors, including sea surface temperature variations and thermal forcing from land surfaces and plateaus. These forcings ultimately induce anomalies in atmospheric circulation. Many prior works have diagnosed large-scale circulation drivers of droughts across the MLYRB, yet few quantitatively separate the individual contributions of water vapor and temperature anomalies.
Anhui Province is located in the MLYRB. In 1978, the province experienced a historic multi-season drought persisting throughout spring, summer, and autumn, causing unprecedented socioeconomic and ecological losses [21,22,23]. This drought also bears special socio-historical implications, as it indirectly promoted the exploration of rural institutional reform in Anhui [24,25]. The present study targets this distinctive drought event.
Conventionally, drought formation is primarily explained by anomalous moisture deficiency. In fact, for the formation of precipitation, the necessary condition is the atmospheric saturation, which is jointly determined by both water vapor content and air temperature. Horizontal atmospheric motions control the transport of water vapor and air masses, regulating the convergence of moisture and heat fluxes. Vertical motions, associated with atmospheric instability, trigger air uplift. From the perspective of regional precipitation generation, the combined (or total) effect of three-dimensional atmospheric circulation modulates local water vapor and air temperature, leading to air saturation at least at certain (condensation) levels. For the drought, the ultimate effect of the large-scale atmospheric circulation is to modulate the local water vapor and temperature, so that the air can sustain low relative humidity. Therefore, the contributions from water vapor and air temperature both deserve analysis.
Lu and Takle [26] developed a straightforward diagnostic method built on the physical linkage between precipitation and relative humidity, as well as its mathematical definition, to disentangle the concurrent effects of water vapor and air temperature on interannual seasonal-precipitation fluctuations [26]. The method separates the respective contributions of moisture and temperature by evaluating their differences between composite dry and wet years, allowing their relative importance for precipitation variability to be compared. This technique has also been utilized to evaluate the relative roles of water vapor and air temperature in severe drought formation [27,28,29].
Based on this physical method, our earlier work [30] constructed an indicator to quantitatively reflect the relative importance of water vapor and air temperature from dry years to wet years. Another indicator, which is obtained from statistical regression, was also adopted to validate the corresponding conclusion.
Extending our previous indicator, this study develops three new indicators with different definitions and notations to quantitatively characterize the relative importance and fractional contributions of water vapor and air temperature anomalies in the formation of the drought.
We aim to address several key scientific questions about the 1978 extreme drought. Under the modulation of large-scale atmospheric circulation anomalies, what is the relative importance of the contributions from the changes in local water vapor content and air temperature? Was the drought dominated by the water vapor anomalies, the air temperature anomalies, or both of them? Furthermore, what are the exact fractions of the total contribution attributable to water vapor and air temperature?
A moisture-dominated pattern would indicate that the drought is closely tied to water vapor transport and moisture convergence, whereas a temperature-dominated pattern would suggest that local thermal conditions play a more important role. Distinguishing between these two patterns and quantifying their respective contribution fractions provides physical support for drought classification and prediction.
Section 2 describes the datasets and proposed methods used in this study. This section introduces two quantitative measures to separately evaluate the contributions of water vapor and air temperature to drought and three derived indicators to represent the relative importance of their contributions and the dominance (or the fractional contributions) in their total effects. Section 3 presents the severity of the 1978 extreme drought, the associated anomalies of large-scale atmospheric circulation and precipitation-related variables, and the results of quantitative measures of the contributions from water vapor and air temperature and their quantitative comparisons. Section 4 summarizes the major findings and discusses the physical implications of the results.
2. Data and Methods
2.1. Data
The monthly precipitation provided by the National Climate Center of China is utilized in this study. The dataset consists of 160 stations and starts from 1951. Observational data from five stations within Anhui Province are used, spanning 1951–2023. The NCEP-DOE Reanalysis 1 [31], from the National Centers for Environmental Prediction (NCEP) and the Department of Energy (DOE), is also used. This dataset begins in 1948, features 17 pressure levels, and has a horizontal resolution of 2.5° × 2.5°. The data used include the monthly precipitation rate, geopotential height, air temperature, relative humidity, specific humidity, and wind components. It shares the same study period as the station observations.
2.2. Indicators for the Contributions of Water Vapor and Air Temperature to Drought and Their Relative Importance
For the formation of precipitation, saturation must be achieved at specific pressure levels (i.e., condensation levels), and the relative humidity is influenced by both water vapor and air temperature. It has been revealed that precipitation and relative humidity display a robust positive correlation on interannual timescales [26,32,33]. This is further supported by our previous study [30]. Thus, relative humidity may serve as an indicator of interannual precipitation variations.
The relative importance of water vapor and air temperature in the interannual variation of the seasonal precipitation is examined by physical and statistical methods [30]. The physical method measures the relative importance between the composite wet year and the composite dry year. In the present study, we adopt a similar framework to develop a method for comparing the relative importance of water vapor and temperature between the drought year and the climatic mean.
With the decrease in precipitation (P) from the climatic mean to the dry year (Pdry < Pclim), the decrease in relative humidity (r) at a pressure level can be expressed as rdry < rclim, where Pdry denotes precipitation in the drought year and other variables are defined analogously. It can be written as
where Dr ≡ ln(rdry/rclim) measures the change in relative humidity between the dry year and the climatic mean.
Dr < 0
The formula of relative humidity is given by r = q/qs, in which q refers to specific humidity and qs is saturation-specific humidity corresponding to temperature T. Then, we obtain Dr = Dq + DT, where
and
Therefore, the Relation (1) can be expressed as
Dq ≡ ln(qdry/qclim)
DT ≡ ln[qs(Tclim)/qs(Tdry)]
Dq + DT < 0
The Dq and DT measure the “contributions” of water vapor and air temperature to the change in relative humidity, respectively, due to their changes between the dry year and the climatic mean.
From Equation (4), the synergistic effects (or contributions) from water vapor and air temperature can be classified into three patterns. The first is the pattern with Dq < 0 < DT while |Dq| > DT. This implies that, as precipitation decreases from the climatic mean to the dry year, water vapor decreases and thereby has a positive effect on drought. At the same time, air temperature also decreases and produces a negative contribution. Moreover, the magnitude of the water vapor contribution exceeds that of air temperature. This defines the “drying” pattern, where the drought is dominated by less-than-normal water vapor.
In the second pattern, DT < 0 < Dq while |DT| > Dq. The drought corresponds to the increased water vapor and markedly increased air temperature. More-than-normal water vapor yields a negative contribution to drought. However, warmer-than-normal temperature makes a large positive contribution. Accordingly, the drought is due to the much higher temperature, despite there being more moisture in the atmosphere. This is the “warming” pattern, and thus the drought is dominated by a warmer-than-normal temperature.
The third is the “drying-warming” pattern, in which Dq < 0 and DT < 0. Corresponding to the drought, water vapor decreases while air temperature increases, and therefore both have positive contributions. For this case, further analysis is required to determine whether the drought is dominated by less-than-normal water vapor or the warmer-than-normal air temperature.
Hence, there are three indicators, Qq/T, Qq, and QT, where
and
are used to quantitively examine the relative importance or the dominance.
Qq/T = |Dq|/|DT|
Qq = |Dq|/(|Dq| + |DT|)
QT = |DT|/(|Dq| + |DT|)
The Qq/T represents the relative importance of the contributions from the water vapor and the air temperature. For the third pattern, when Qq/T > 1, the less-than-normal water vapor has more importance and dominates the drought. The larger the value, the stronger the dominance of water vapor. When Qq/T < 1, the warmer-than-normal air temperature has more importance. The Qq and QT donate the fractional contributions of the less-than-normal water vapor and the warmer-than-normal air temperature to the total effect, respectively. The Qq and QT range from 0 to 1 (i.e., 100%), and Qq + QT = 100%. Qq = 0 means water vapor exerts no effect on drought, whereas Qq = 100% indicates that the drought is entirely caused by water vapor anomalies. Similarly, QT = 0 means temperature anomalies have no effect on drought, and QT = 100% represents that temperature anomalies fully control drought formation.
It should be noted that the thresholds for the three-category classification (“drying”, “warming”, “drying-warming”) are empirically determined, and the classification results may vary if different vertical pressure levels are selected.
3. Results
3.1. The 1978 Extreme Drought over Anhui Province
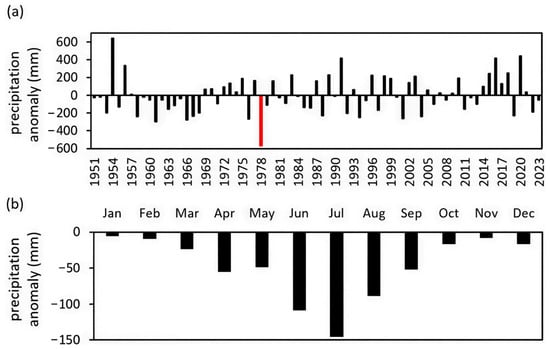
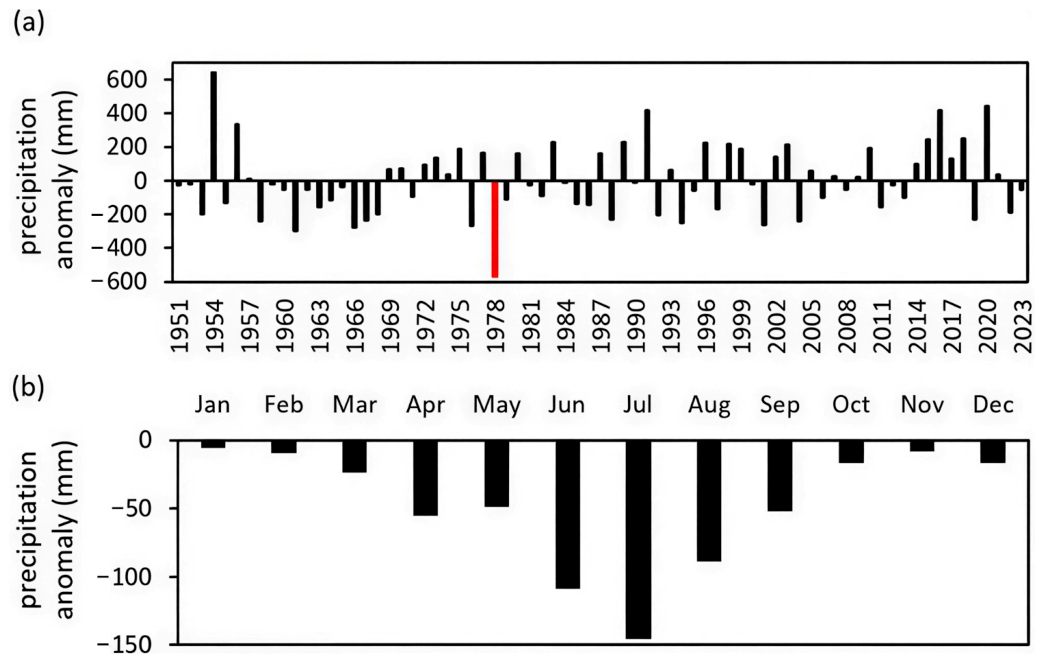
The 1978 extreme drought represents the most severe drought event since the founding of the People’s Republic of China in Anhui Province, featuring the highest intensity, the broadest spatial coverage and the longest duration among recorded droughts in the province. Figure 1a shows the time series of annual precipitation anomaly of Anhui during the period 1951–2023. The year 1978 exhibits the largest-magnitude negative precipitation anomaly among all years, indicating the highest intensity of drought there. Other representative drought events (e.g., 1966, 1994, 2001) were substantially weaker than the 1978 drought, as their negative precipitation anomaly magnitudes were approximately half that of the 1978 event. Figure 1b presents the monthly precipitation anomalies in 1978, showing negative anomalies in every month. It implies that Anhui experienced less-than-normal precipitation from the beginning to the end of the year.
Figure 1.
(a) Annual precipitation anomaly (units: mm) of Anhui Province during the period 1951–2023. The year 1978 is marked in red. The climatic mean is derived from the average for 1951–2023. All subsequent climatic means use the same reference period. The precipitation is averaged across five stations within Anhui Province (Anqing, Tunxi, Hefei, Fuyang, and Bengbu). (b) Monthly precipitation anomalies in 1978.
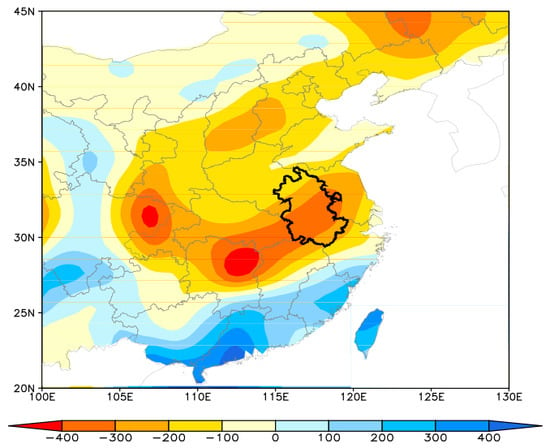
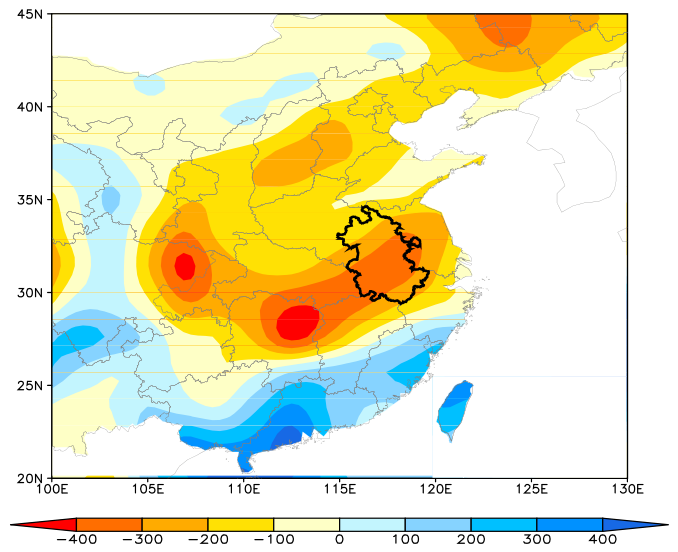
The spatial distribution of precipitation anomalies for the year 1978 is displayed in Figure 2. The administrative boundary of Anhui Province is marked by thick, black, solid lines. Evidently, the whole of Anhui Province was under drought conditions. In fact, most parts of eastern China suffered from drought, especially the middle–lower Yangtze River basin (MLYRB), where Anhui Province is precisely located. The drought in Anhui was part of this large-scale arid event across eastern China.
Figure 2.
Distribution of the precipitation anomalies (units: mm) of 1978. The thick, black, solid line denotes the boundary of Anhui Province, and the same applies below.
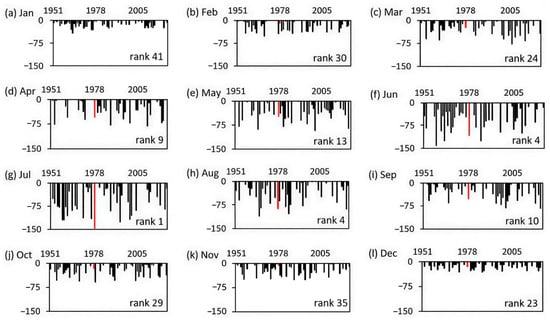
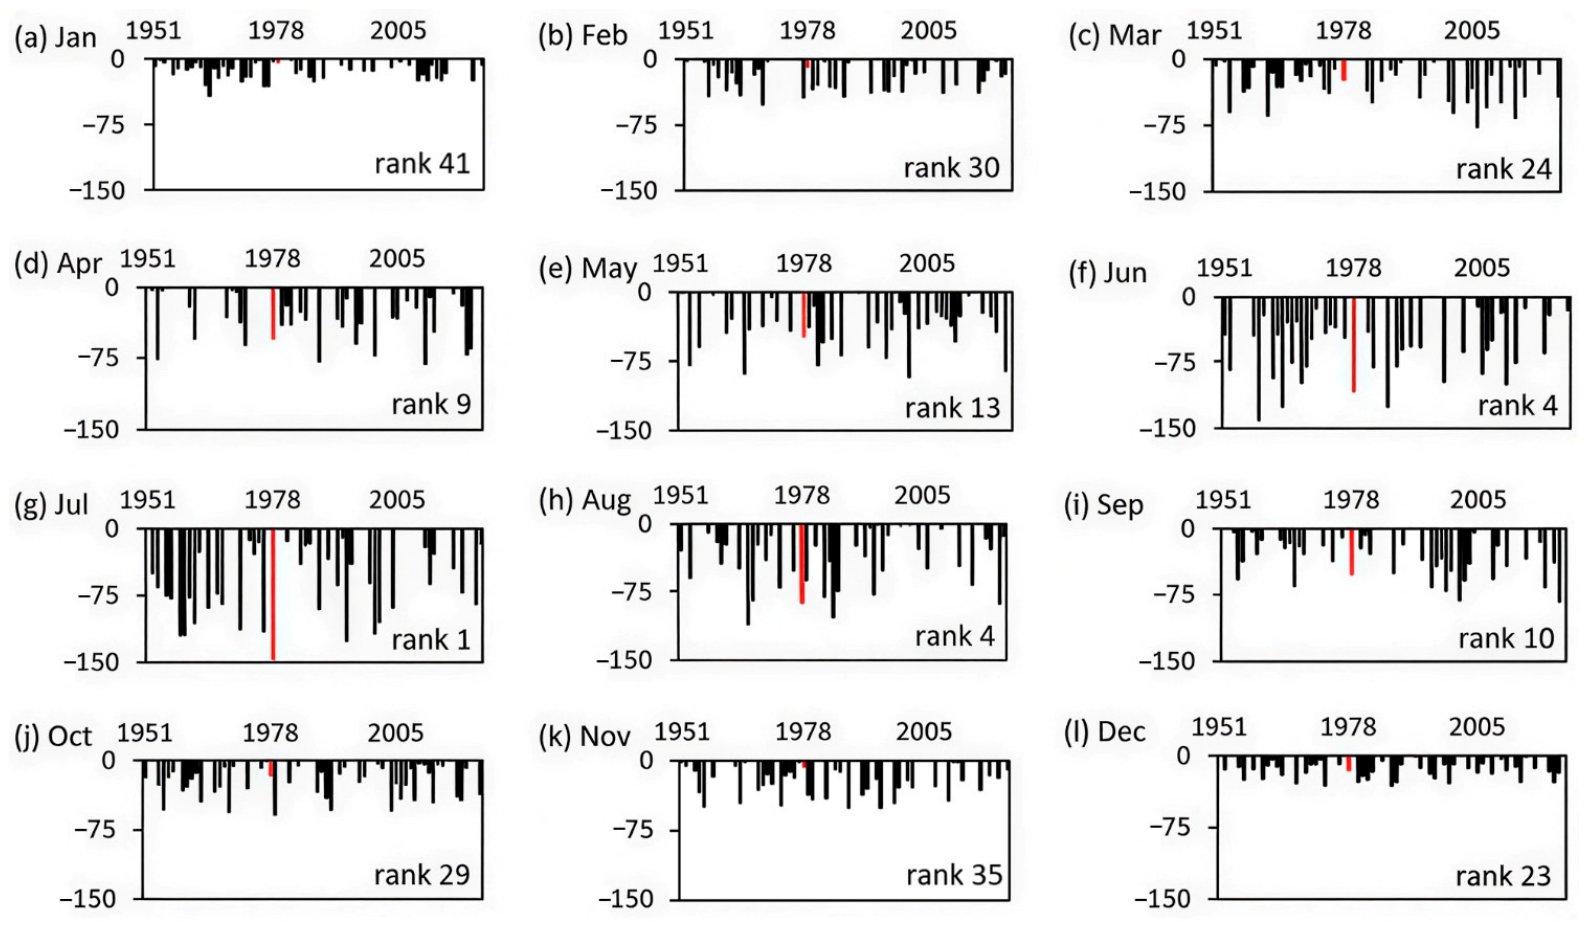
The annual precipitation anomalies for each month are shown in Figure 3a–l. The rank of the 1978 precipitation anomaly magnitude for individual months among all 73 years (1951–2023) is plotted on the bottom-right corners of each subplot. It is found that the anomalies for all the months, except for January, rank among the driest 50% of the 73-year record, and those for April–September rank among the top 15 driest values. A prolonged severe drought persisted over Anhui Province from spring through autumn.
Figure 3.
Annual precipitation anomalies of (a) January, (b) February, (c) March, (d) April, (e) May, (f) June, (g) July, (h) August, (i) September, (j) October, (k) November, and (l) December for Anhui Province during the period 1951–2023, and only negative anomalies are displayed, with the year 1978 highlighted in red.
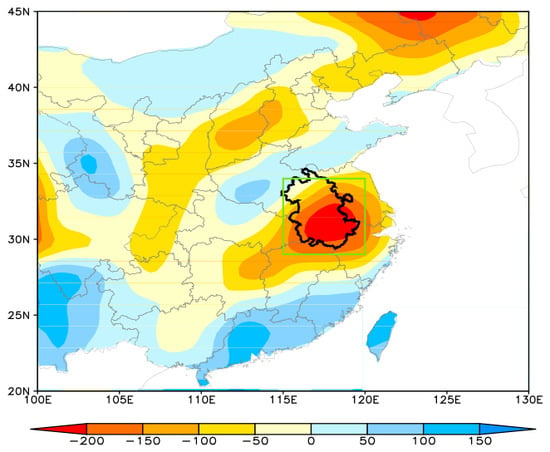
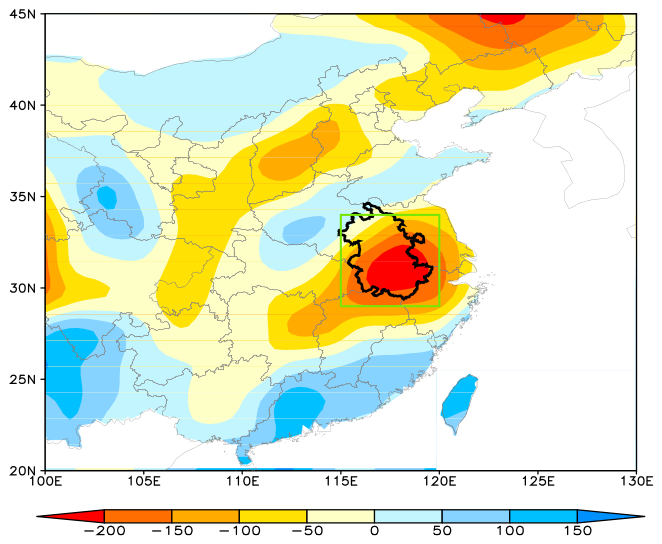
In particular, the anomalies for June, July, and August are within the top five driest values among the 73 years. Figure 4 shows the spatial distribution of 1978 June–July–August (JJA) precipitation anomalies over eastern China. Negative anomalies are found near 30° N, i.e., the MLYRB, and the center of large-magnitude negative anomalies is located over Anhui Province. Therefore, in this study, we focus on these three months, and the study region (115–120° E, 29–34° N) used for area-averaging calculations below is marked in green.
Figure 4.
Same as Figure 2, but for JJA (June–July–August) in 1978. The study region (115–120° E, 29–34° N) around Anhui Province is marked in green. All regional averages are computed for this domain.
3.2. Anomalies in Large-Scale Atmospheric Circulation and Precipitation-Related Variables
Water vapor plays an important role in the formation of precipitation. However, the necessary condition for forming precipitation is the saturation of the atmosphere, which is jointly determined by water vapor and air temperature. Whether the local atmosphere can achieve saturation is ultimately controlled by local water vapor content and local air temperature, which are modulated by large-scale circulation, through the transport of water vapor and cold or warm air masses.
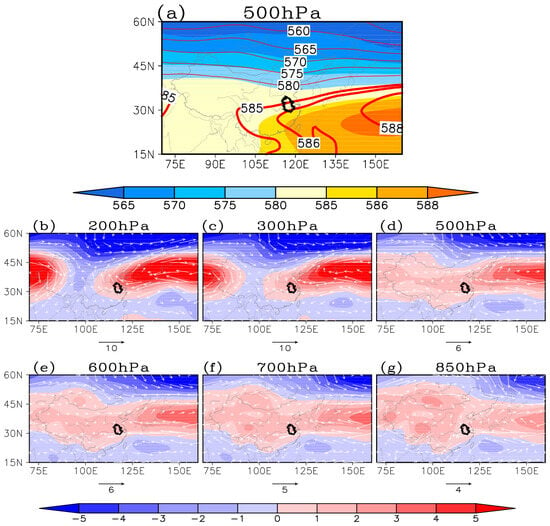
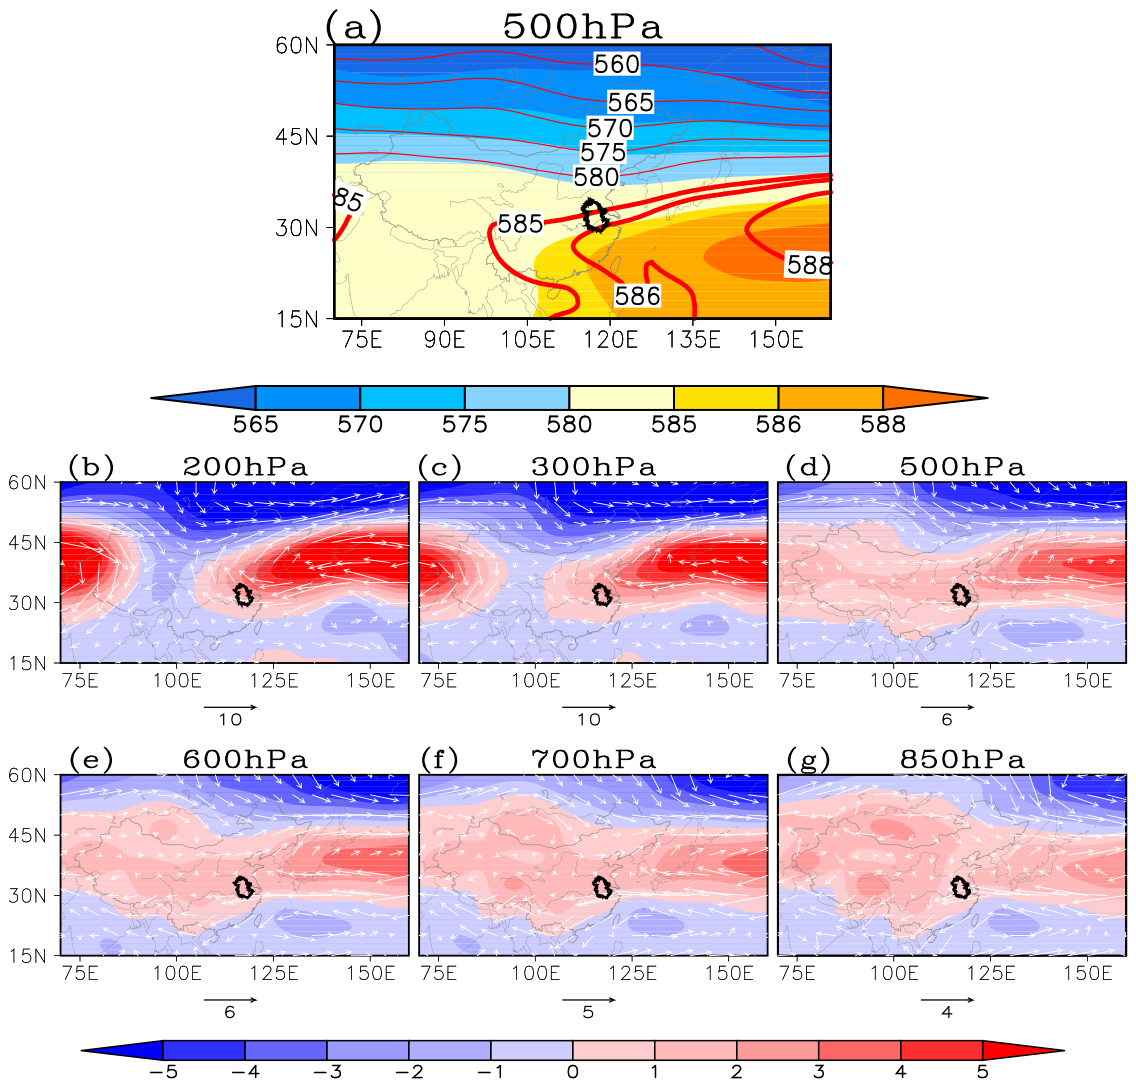
Figure 5a shows the distributions of the 1978 JJA geopotential height and the climatic mean at 500 hPa. The JJA western North Pacific subtropical high (WNPSH) in 1978 shifts northwards, with the subtropical high ridge lying near 30° N. The 585 contour (in unit of 10 gpm) extends westward to eastern China, indicating that the WNPSH exhibits a notable westward extension. Accordingly, Anhui Province, and even the whole MLYRB, is under the control of the WNPSH.
Figure 5.
(a) Distribution of climatological geopotential height (shaded, units: 10 gpm) and JJA geopotential height of 1978 (red solid line) at 500 hPa. Distributions of JJA geopotential height anomalies (shaded) and wind anomalies (vector, units: m·s−1) of 1978 at (b) 200, (c) 300, (d) 500, (e) 600, (f) 700, and (g) 850 hPa.
The distributions of the anomalies for JJA geopotential height and wind at different levels are displayed in Figure 5b–g. In the upper troposphere (i.e., 200 and 300 hPa), two positive geopotential height anomalies are identified, indicating that the South Asian High is displaced northward and intensified. The enhanced upper-level convergence acts to suppress convective activity at low levels. In the middle (i.e., 500–700 hPa) and lower (i.e., 850 hPa) troposphere, positive geopotential height anomalies occur over the mid-latitudes. Anhui Province lies within the WNPSH domain, accompanied by positive convergence anomalies. Consequently, persistent subsidence prevails over the study region at the condensation levels, suppressing local convective activity and precipitation while generating adiabatic warming.
Meanwhile, in the mid-lower troposphere, where most water vapor resides, northerly wind anomalies are observed over extensive areas south of Anhui Province. It suggests that moisture originating from the south, e.g., the South China Sea and Indian Ocean, can hardly reach the region. As a consequence, local moisture supply is greatly reduced.
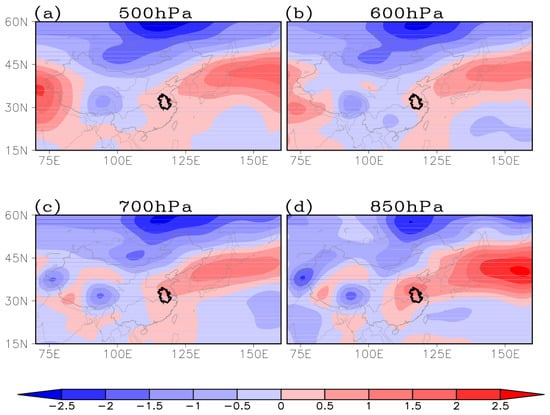
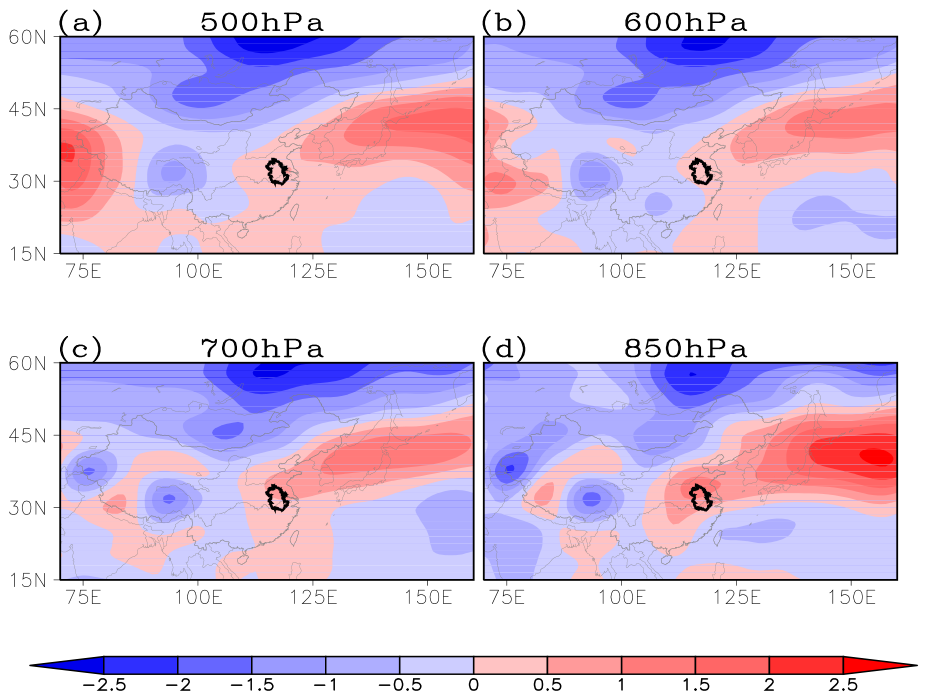
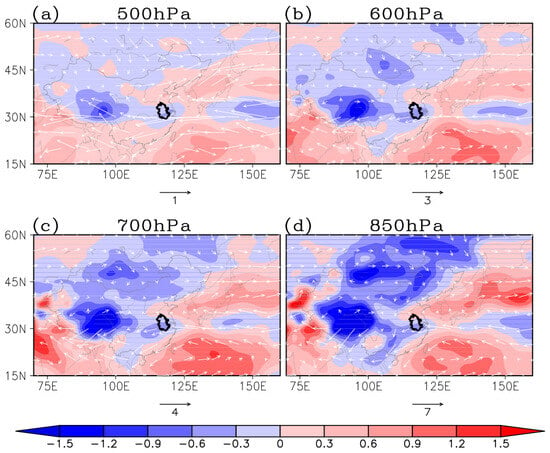
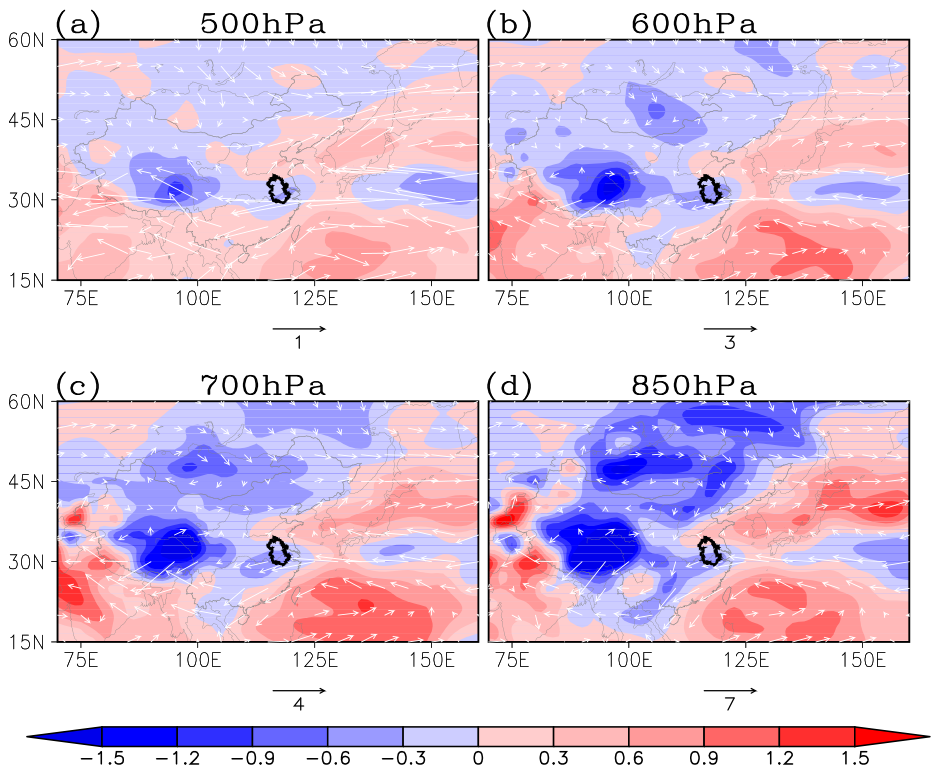
The changes in large-scale atmospheric circulation, as indicated in Figure 5, ultimately lead to the changes in local water vapor content and air temperature, the two key precipitation-related variables. Figure 6 and Figure 7 depict the anomalies of air temperature and the anomalies of specific humidity and its flux at different levels, respectively.
Figure 6.
Distributions of JJA temperature anomalies (units: °C) of 1978 at (a) 500, (b) 600, (c) 700, and (d) 850 hPa.
Figure 7.
Distributions of JJA anomalies of water vapor (shaded, units: g·kg−1) and its flux (vector, units: g·s−1·hPa−1·cm−1) of 1978 at (a) 500, (b) 600, (c) 700, and (d) 850 hPa.
Positive temperature anomalies and negative specific humidity anomalies are observed over the study region at 500, 600, 700 and 850 hPa. The mid-lower troposphere over Anhui Province features overall reduced moisture and elevated air temperature. Such less-than-normal water vaper content together with higher-than-normal temperature jointly lower local relative humidity and facilitate drought occurrence. However, their relative importance of the contributions to the drought remains unknown. That is, it is unclear whether this drought is primarily dominated by water vaper or by air temperature.
Since water vapor and air temperature are distinct physical quantities, direct inter-comparison of their fields, as illustrated in Figure 6 and Figure 7, is inappropriate. However, the 1978 extreme summer drought corresponds to the “drying-warming” pattern presented in Section 2.2. Thus, the relative importance of the effects of less-than-normal water vapor and warmer-than-normal air temperature on the extreme drought can be quantitatively measured and compared by using the indicators (3)–(7).
3.3. Quantitative Measures of Contributions from Water Vapor and Temperature Anomalies
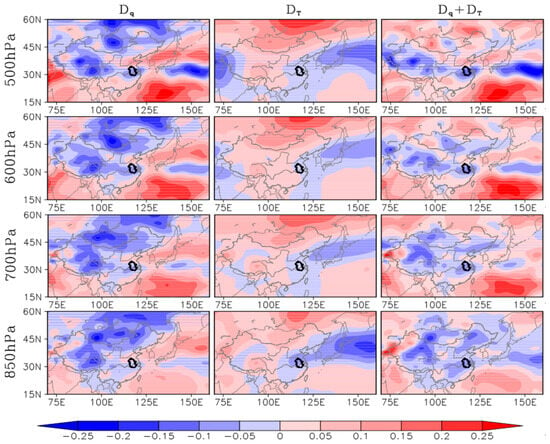
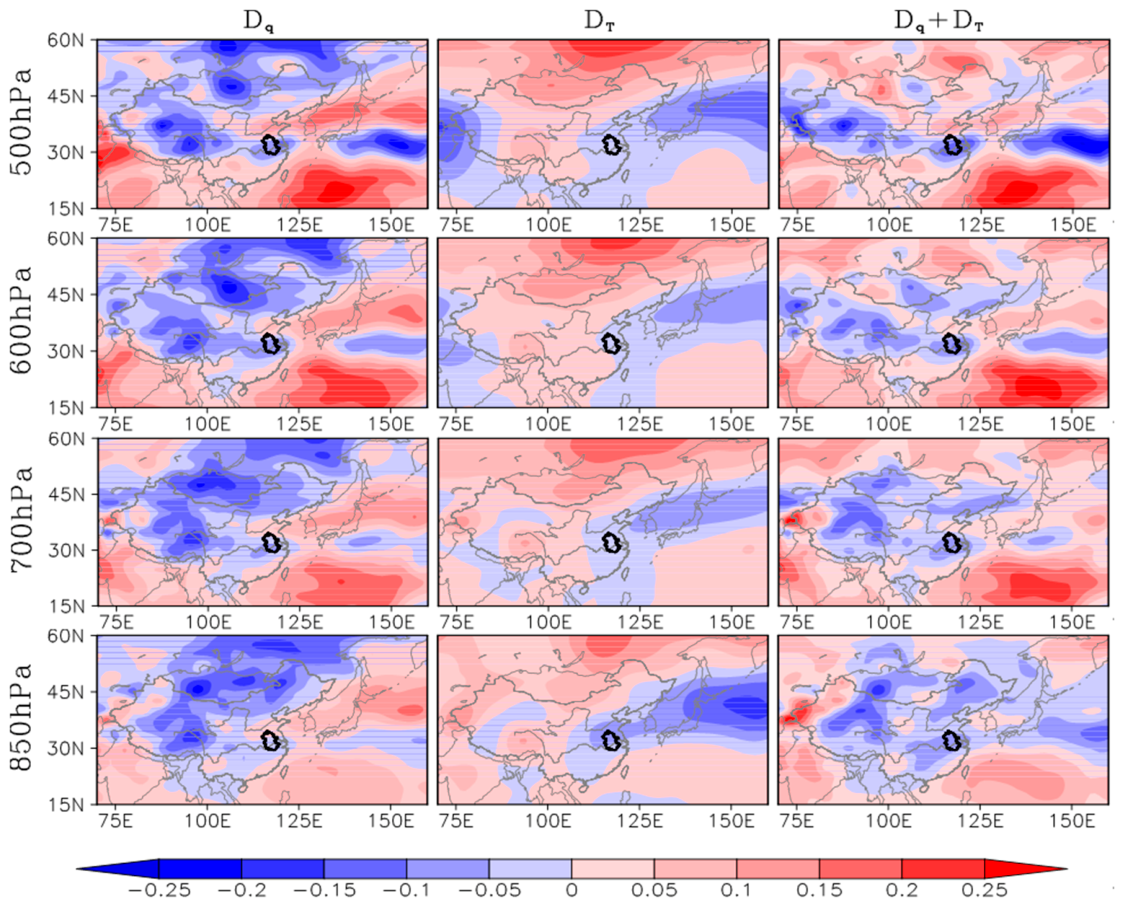
Figure 8 presents the distributions of the measures Dq, DT, and Dq + DT (i.e., Dr) at 500 hPa, 600 hPa, 700 hPa, and 850 hPa. With Equations (2) and (3) and Relation (4), the contributions of water vapor and air temperature can be indicated and directly compared.
Figure 8.
Distributions of Dq (left), DT (middle) and (right) at 500 hPa, 600 hPa, 700 hPa, and 850 hPa for the drought. Negative (positive) Dq indicates that reduced (increased) water vapor contributes to lower (higher) relative humidity, favoring the drought (flood). Negative (positive) DT denotes that higher (lower) air temperature leads to lower (higher) relative humidity and thus the drought (flood).
The plots indicate that over Anhui Province, in the middle troposphere (500–700 hPa), at the condensation levels, less-than-normal water vapor exerts a negative effect on relative humidity (Dq < 0), and warmer-than-normal air temperature also has a negative effect on relative humidity (DT < 0). Their total effect therefore reduces local relative humidity and favors the drought (Dq + DT < 0). Similar conditions hold in the lower troposphere (850 hPa).
Nevertheless, the magnitudes of these two contributions differ at each vertical level. Overall, at the condensation levels (500–700 hPa), the spatial pattern of the total contribution over eastern China closely resembles that of water vapor. It is therefore reasonable to infer that the drought is dominated by water vapor anomalies. Quantitative comparisons of the contributions are provided below.
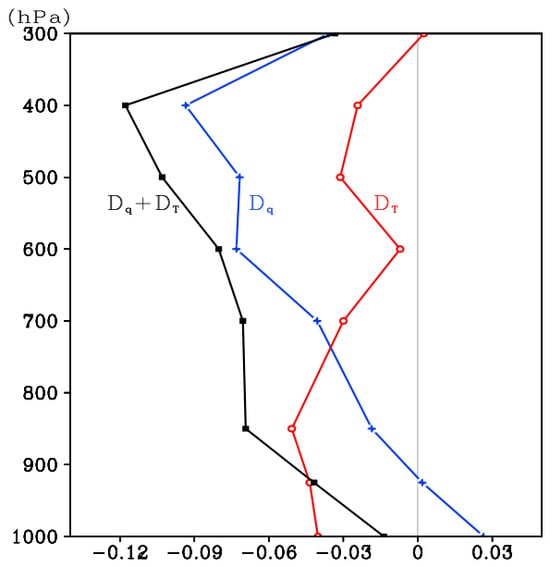
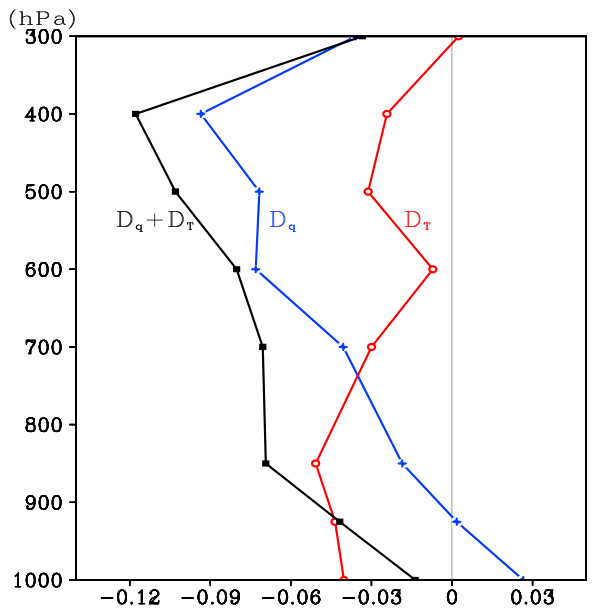
The vertical profiles of Dq, DT, and Dq + DT, averaged over the study region, are displayed in Figure 9. The three measures can be compared with each other directly. The DT exhibits negative values at all levels except for 300 hPa. Under the influence of the WNPSH, air temperature is higher than normal over the study region and facilitates the drought. The Dq is negative above 850 hPa owing to the lack of water vapor. The less-than-normal moisture in the middle and lower troposphere favors the drought. Nonetheless, the near-surface Dq is positive, which indicates that the water vapor content there is higher than normal. The total effect Dq + DT is negative at all levels and exhibits large-magnitude negative values at the condensation levels, consistent with the drought signal.
Figure 9.
Vertical profiles of Dq (blue), DT (red) and (black) averaged over the study region (115–120° E, 29–34° N). Regional-mean values are taken from Figure 8.
At the condensation levels (i.e., the middle troposphere), our main focus in this work, both less-than-normal water vapor and warmer-than-normal air temperature contribute to the formation of drought, and the contribution from water vapor is greater than that of temperature (|Dq| > |DT|). The 1978 extreme drought is therefore dominated by water vapor. This is the key concern of the present study.
In the lower troposphere, the magnitude of DT is larger than that of Dq. This suggests that the less-than-normal relative humidity there is mainly driven by warmer-than-normal temperature rather than less-than-normal moisture.
Near the surface, while more-than-normal water vapor favors precipitation, the impact of warmer-than-normal temperature outweighs that of the enhanced moisture, leading to less-than-normal relative humidity, which favors drought conditions. Although near the surface shows a local moisture surplus, low-level air parcels cannot rise freely due to the persistent subsidence and stable boundary layer controlled by the intensified WPSH.
3.4. Quantitative Comparisons of Their Contributions
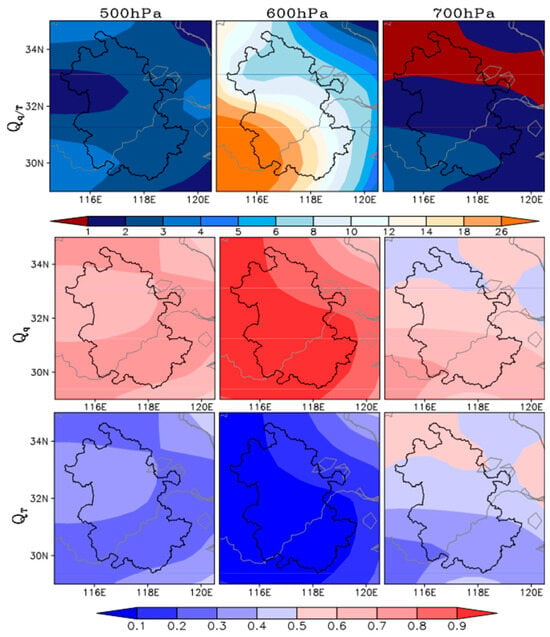
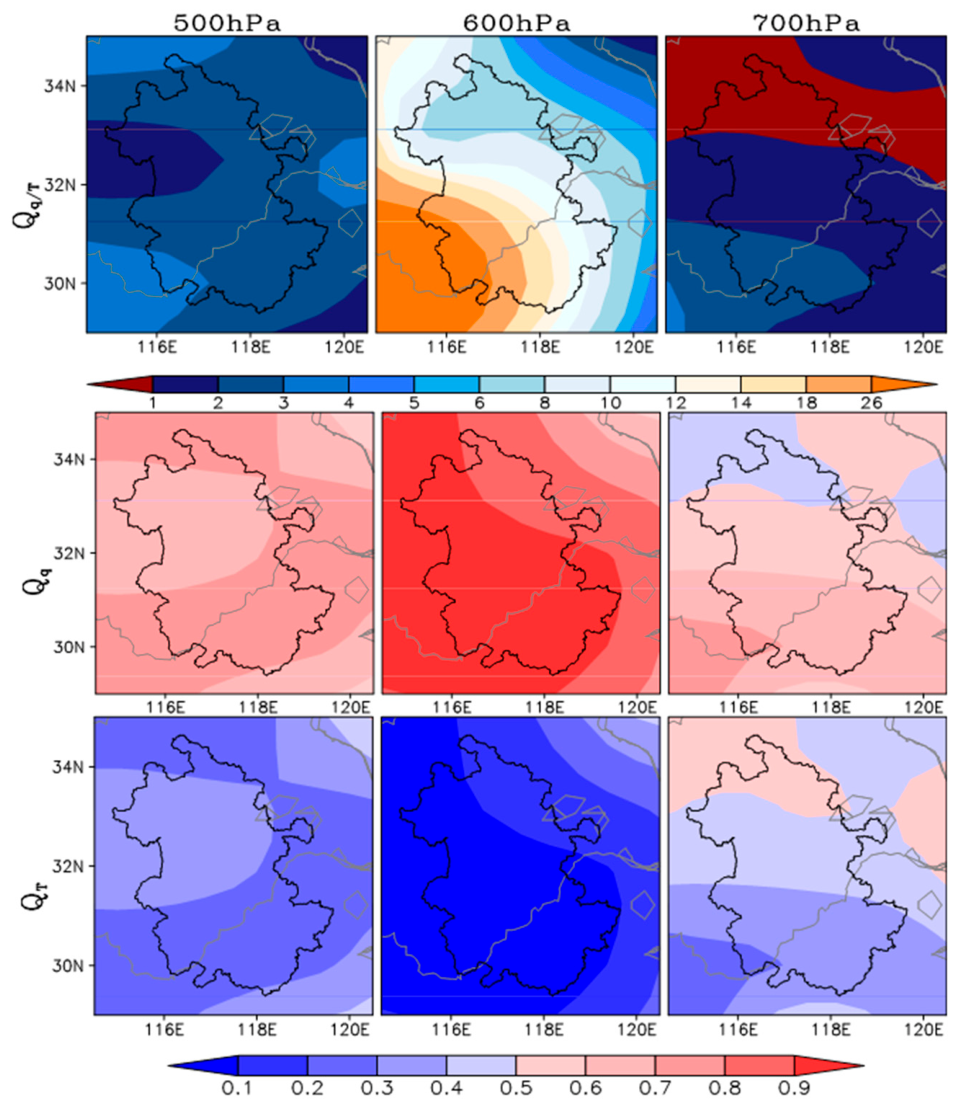
The distributions of Qq/T, Qq, and QT (i.e., the quantitative comparisons between Dq and DT) at the condensation levels over Anhui Province are shown in Figure 10. At 500 hPa, Qq/T ranges mainly from 2 to 4 across Anhui, with Qq of 0.6–0.8 and QT of 0.2–0.4. The contribution of water vapor anomalies is approximately three times that of temperature anomalies, indicating a dominant role of water vapor. At 600 hPa, the contrast between the two contributions becomes most pronounced. Local Qq/T peaks at 14–20 in southern Anhui, and Qq reaches 0.80–0.90 while QT drops to only 0.10–0.20. At 700 hPa, Qq/T exceeds 1 over central and southern Anhui, whereas it falls below 1 in a small portion of northern Anhui. Accordingly, water vapor dominates across central and southern parts of the province, while temperature becomes more important over limited northern areas. Although Qq (0.4–0.7) remains greater than QT (0.3–0.6), on average, the gap between moisture-related and temperature-related contributions is evidently reduced at this level.
Figure 10.
Distributions of Qq/T (top), Qq (middle), and QT (bottom) at 500 hPa, 600 hPa, and 700 hPa (the condensation levels). The Qq/T denotes the relative importance of contributions from water vapor and air temperature to the drought. The Qq and QT represent the fractional contributions of water vapor and air temperature to the drought, respectively.
Table 1 gives the area-averaged indicators as defined in Section 2.2 over the study region at the condensation levels. At individual pressure levels, water vapor exerts a substantially larger contribution than temperature at 500 hPa and 600 hPa, with water vapor accounting for as high as 91.11% at 600 hPa. By contrast, the two contributions are comparable at 700 hPa. For the pressure-weighted vertical average over the condensation levels, the contribution of water vapor to the drought is roughly 4.6 times that of temperature. Specifically, the contribution from less-than-normal water vapor accounts for approximately 73%, while that from warmer-than-normal temperature accounts for about 27%. While the 1978 extreme drought is dominated by less-than-normal water vapor, the contributions from warmer-than-normal air temperature are non-negligible.
Table 1.
Values of Dq and DT at 500 hPa, 600 hPa, and 700 hPa (the condensation levels) from Figure 9 and their comparisons Qq/T, Qq, and QT.
4. Summary and Discussion
Anhui Province experienced an extreme drought in 1978, which was particularly severe in summer and ranked as the most catastrophic drought event in Anhui’s observational records since 1951. In this study, we analyze the characteristics of large-scale atmospheric circulation anomalies associated with this summertime drought, with the primary objective to quantitatively compare the respective contributions of water vapor and air temperature anomalies.
It is revealed that during the drought, the WPSH intensifies and extends westward, with its ridge line displaced notably northward. Consequently, Anhui Province and even the entire MLYRB are under the control of the WPSH. Persistent subsidence prevails within the subtropical high domain, suppressing local convective activity and adiabatically warming the atmosphere. Meanwhile, northerly wind anomalies appear south of Anhui, reflecting a weakened summer monsoon, and block the transport of moisture from the South China Sea and the Indian Ocean toward this region. Such large-scale circulation anomalies lead to reduced local water vapor content and elevated air temperature at the condensation levels.
Conventionally, moisture is often emphasized when discussing the formation of precipitation or drought. In reality, however, the essential condition for forming precipitation is that the atmosphere can reach saturation, which is jointly governed by water vapor and air temperature. For drought events, large-scale atmospheric circulation alters local water vapor and air-temperature conditions, which ultimately make the atmosphere difficult to achieve saturation. Therefore, the roles of both water vapor and air temperature deserve analysis and comparison. In the present study, we focus on the synergistic effects of water vapor and air temperature during the 1978 extreme drought over Anhui Province
Based on the close relationship between relative humidity and precipitation, together with the definition of relative humidity, two measures (Dq and DT), are proposed to represent the effects of water vapor anomalies and air temperature anomalies on drought, respectively. In turn, their contributions can be directly compared. Three further indicators (Qq/T, Qq, and QT), derived from these two measures, are constructed to quantify the relative importance of the contributions from less-than-normal water vapor and warmer-than-normal air temperature to the drought and the fractional contributions of water vapor and air temperature to the drought, respectively.
Quantitative calculations and comparisons reveal that during the 1978 summer drought over Anhui Province, less-than-normal water vapor is coupled with warmer-than-normal air temperature in the middle-lower troposphere, and both have positive effects on drought. At the condensation levels, the contribution from water vapor is greater than that of temperature. Specifically, the contribution magnitude of water vapor anomalies to the drought is approximately 4.6 times that of air temperature anomalies. Quantitatively, less-than-normal water vapor accounts for roughly 73% of the total contribution, whereas warmer-than-normal air temperature accounts for about 27%. Although less-than-normal water vapor dominates this drought event, the contribution of warmer-than-normal air temperature is also considerable.
This work concentrates on the summer season with peak drought severity. In fact, the 1978 event corresponds to a multi-season drought persisting across spring, summer, and autumn. The influencing factors, large-scale circulation anomalies, and the respective contributions of water vapor and air temperature anomalies during spring and autumn also deserve further investigation in future work.
Consistent with previous studies, water vapor deficiency dominated the formation of the 1978 summer drought in Anhui Province. Beyond conventional qualitative analyses, this work further quantifies the fractional contributions of moisture and temperature anomalies, particularly the role of warming in drought. The proposed diagnostic framework can be extended to additional drought events across the MLYRB in future research.
It should be noted that our decomposition is a diagnostic partitioning of relative humidity anomalies rather than a causal separation of independent forcing factors. More importantly, a moisture-dominated drought pattern implies that drought development is largely controlled by water vapor transport and moisture convergence. By contrast, a temperature-dominated pattern highlights the dominant role of local thermal conditions. Differentiating these two patterns and quantifying their fractional contributions offers physical insights for drought classification and predictive practice.
In addition, we acknowledge the limitation of this study based on a single reanalysis dataset. Results derived from different datasets may show slight discrepancies, which merits further analysis in future work.
Author Contributions
Conceptualization, J.T.; methodology, J.T. and D.Y.; software, J.T. and D.Y.; validation, J.H.; formal analysis, J.T. and J.H.; investigation, F.H. and Y.Z.; writing—original draft preparation, J.T.; writing—review and editing, J.T.; funding acquisition, J.T., J.H., F.H. and Y.Z. All authors have read and agreed to the published version of the manuscript.
Funding
This research was funded by the Key Natural science research project of the Anhui Provincial Department of Education, grant numbers 2023AH051631 and 2025AHGXZK30329, the Scientific research project of Chuzhou University, grant number 2023qd04, the National Natural Science Foundation of China, grant number 42475034, the Natural Science Foundation of the Jiangsu Higher Education Institutions of China, grant number 1020240562, and the Key Project of Anhui Province for the Cultivation of Outstanding Young Teachers, grant number YQZD2025087.
Institutional Review Board Statement
Not applicable.
Informed Consent Statement
Not applicable.
Data Availability Statement
The reanalysis data used in this study are provided by the National Centers for Environmental Prediction (NCEP) and the Department of Energy (DOE), which are available at https://www.psl.noaa.gov/data/reanalysis/reanalysis.shtml, accessed on 1 December 2025. The observed monthly precipitation data are provided by the National Climate Center of China, which are available at https://cmdp.ncc-cma.net/cn/monitoring.htm#basic, accessed on 1 October 2025.
Conflicts of Interest
The authors declare no conflicts of interest.
References
- Chavas, D.R.; Izaurralde, R.C.; Thomson, A.M.; Gao, X. Long-term climate change impacts on agricultural productivity in eastern China. Agric. For. Meteorol. 2009, 149, 1118–1128. [Google Scholar] [CrossRef] [Scilit]
- Chen, H.; Sun, J. Changes in Drought Characteristics over China Using the Standardized Precipitation Evapotranspiration Index. J. Clim. 2015, 28, 5430–5447. [Google Scholar] [CrossRef] [Scilit]
- Zhang, L.; Zhou, T. Drought over East Asia: A Review. J. Clim. 2015, 28, 3375–3399. [Google Scholar] [CrossRef] [Scilit]
- Xu, K.; Yang, D.; Yang, H.; Li, Z.; Qin, Y.; Shen, Y. Spatio-temporal variation of drought in China during 1961–2012: A climatic perspective. J. Hydrol. 2015, 526, 253–264. [Google Scholar] [CrossRef] [Scilit]
- Zhang, Q.; Gu, X.; Singh, V.P.; Kong, D.; Chen, X. Spatiotemporal behavior of floods and droughts and their impacts on agriculture in China. Glob. Planet. Change 2015, 131, 63–72. [Google Scholar] [CrossRef] [Scilit]
- Yan, H.; Wang, S.; Wang, J.; Lu, H.; Guo, A.; Zhu, Z.; Myneni, R.B.; Shugart, H.H. Assessing spatiotemporal variation of drought in China and its impact on agriculture during 1982–2011 by using PDSI indices and agriculture drought survey data. J. Geophys. Res. Atmos. 2016, 121, 2283–2298. [Google Scholar] [CrossRef] [Scilit]
- Yu, C.; Huang, X.; Chen, H.; Huang, G.; Ni, S.; Wright, J.S.; Hall, J.; Ciais, P.; Zhang, J.; Xiao, Y.; et al. Assessing the Impacts of Extreme Agricultural Droughts in China Under Climate and Socioeconomic Changes. Earth’s Future 2018, 6, 689–703. [Google Scholar] [CrossRef] [Scilit]
- Zhang, J.; Shen, Y. Spatio-temporal variations in extreme drought in China during 1961–2015. J. Geogr. Sci. 2019, 29, 67–83. [Google Scholar] [CrossRef] [Scilit]
- Yin, J.; Guo, S.; Yang, Y.; Chen, J.; Gu, L.; Wang, J.; He, S.; Wu, B.; Xiong, J. Projection of droughts and their socioeconomic exposures based on terrestrial water storage anomaly over China. Sci. China Earth Sci. 2022, 65, 1772–1787. [Google Scholar] [CrossRef] [Scilit]
- Chen, H.; Wang, S.; Zhu, J.; Wang, D. Projected changes in the pattern of spatially compounding drought and pluvial events over Eastern China under a warming climate. Earth’s Future 2023, 11, e2022EF003397. [Google Scholar] [CrossRef] [Scilit]
- Chen, J. Regional heterogeneity in the impacts of drought in China. Int. Econ. 2025, 183, 100611. [Google Scholar] [CrossRef] [Scilit]
- Ding, Y.; Wang, Z.; Sun, Y. Inter-decadal variation of the summer precipitation in East China and its association with decreasing Asian summer monsoon. Part I: Observed evidences. Int. J. Climatol. 2008, 28, 1139–1161. [Google Scholar] [CrossRef] [Scilit]
- Li, S.; Feng, G.; Hou, W. Summer drought patterns in the middle-lower reaches of the Yangtze River Basin and their connections with atmospheric circulation before and after 1980. Adv. Meteorol. 2016, 2016, 8126852. [Google Scholar] [CrossRef] [Scilit]
- Zhang, D.; Zhang, Q.; Qiu, J.; Bai, P.; Liang, K.; Li, X. Intensification of hydrological drought due to human activity in the middle reaches of the Yangtze River, China. Sci. Total Environ. 2018, 637, 1432–1442. [Google Scholar] [CrossRef] [Scilit] [PubMed]
- Li, M.; Chai, X.R.; Wang, G.W.; Hu, W.X.; Zhang, L.Z. Research on meteorological drought in the middle and lower reaches of the Yangtze River. J. Nat. Resour. 2019, 34, 374–384. [Google Scholar] [CrossRef] [Scilit]
- Yin, H.; Fowler, H.J.; Blenkinsop, S.; Wu, Z.; He, H.; Li, Y. ENSO and IOD contributions to seasonal meteorological droughts over the Yangtze River basin. Int. J. Climatol. 2023, 43, 8120–8136. [Google Scholar] [CrossRef] [Scilit]
- Zhang, L.; Zhou, T.; Zhang, X.; Zhang, W.; Li, L.; Li, L. Attribution of the Extreme 2022 Summer Drought along the Yangtze River Valley in China Based on Detection and Attribution System of Chinese Academy of Sciences. Bull. Am. Meteorol. Soc. 2024, 105, E1062–E1067. [Google Scholar] [CrossRef] [Scilit]
- Bai, W.; Zhang, C.; Xiao, X.; Zou, Z.; Liu, Z.; Li, P.; Tang, J.; Li, T.; Zhou, X.; Peng, C. Characteristics of Meteorological Drought Evolution in the Yangtze River Basin. Water 2024, 16, 3391. [Google Scholar] [CrossRef] [Scilit]
- Liu, Y.; Yan, M.; Liu, J.; Wang, S.; Liu, Z.; Ning, L.; Wang, Z. The co-evolution of East Asian subtropical westerly jet and East Asian summer monsoon during different time periods in the Holocene and its influence on precipitation patterns in China. Sci. China Earth Sci. 2025, 68, 1100–1115. [Google Scholar] [CrossRef] [Scilit]
- Hu, R.; Yuan, S.; Jin, J.; Zhu, L.; Liu, Y. Long-term changes in the drought propagation characteristics in the Yangtze River Basin. J. Hydrol. Reg. Stud. 2026, 63, 103014. [Google Scholar] [CrossRef] [Scilit]
- Xin, J.F.; Guo, S.S. Reappearance of dreadful drought in 1978 for Anhui Province of China. In Proceedings of the 35th IAHR World Congress, Chengdu, China, 8–13 September 2013. [Google Scholar]
- Zhang, Q.; Xie, W.; Chen, X.; Zhai, P.; Wu, B.; Duan, J. Regional drought process and its variation characteristics in the middle-lower reaches of the Yangtze River from 1961 to 2019. J. Meteorol. Res. 2021, 79, 570–581. (In Chinese) [Google Scholar] [CrossRef]
- Yang, Y.; Dai, E.; Yin, J.; Jia, L.; Zhang, P.; Sun, J. Spatial and Temporal Evolution Patterns of Droughts in China over the Past 61 Years Based on the Standardized Precipitation Evapotranspiration Index. Water 2024, 16, 1012. [Google Scholar] [CrossRef] [Scilit]
- Lin, J.Y. The household responsibility system in China’s agricultural reform: A theoretical and empirical study. Econ. Dev. Cult. Change 1988, 36, S199–S224. [Google Scholar] [CrossRef] [Scilit]
- Deakin, S.; Meng, G. Resolving Douglass C. North’s ‘puzzle’concerning China’s household responsibility system. J. Institutional Econ. 2022, 18, 521–535. [Google Scholar] [CrossRef] [Scilit]
- Lu, E.; Takle, E. Concurrent variations of water vapor and temperature corresponding to the interannual variation of precipitation in the North American regional reanalysis. J. Geophys. Res. 2010, 115, D11101. [Google Scholar] [CrossRef] [Scilit]
- Lu, E.; Luo, Y.; Zhang, R.; Wu, Q.; Liu, L. Regional atmospheric anomalies responsible for the 2009–2010 severe drought in China. J. Geophys. Res. 2011, 116, D21114. [Google Scholar] [CrossRef] [Scilit]
- Lu, E.; Liu, S.; Luo, Y.; Zhao, W.; Li, H.; Chen, H.; Zeng, Y.; Liu, P.; Wang, X.; Higgins, R.W.; et al. The atmospheric anomalies associated with the drought over the Yangtze River basin during spring 2011. J. Geophys. Res. Atmos. 2014, 119, 5881–5894. [Google Scholar] [CrossRef] [Scilit]
- Yuan, D.; Hao, J.; Lu, E.; Dai, W.; Gao, R.; Zhao, C.; Zhang, Q.; Zhao, H. The 2014 severe drought over northeast China and its comparison with droughts over the southern regions: A perspective from synergic effects of water vapour and cold air. Int. J. Climatol. 2022, 42, 8854–8867. [Google Scholar] [CrossRef] [Scilit]
- Tu, J.; Lu, E. Relative importance of water vapor and air temperature in the interannual variation of the seasonal precipitation: A comparison of the physical and statistical methods. Clim. Dyn. 2020, 54, 3655–3670. [Google Scholar] [CrossRef] [Scilit]
- Kalnay, E.; Kanamitsu, M.; Kistler, R.; Collins, W.; Deaven, D.; Gandin, L.; Iredell, M.; Saha, S.; White, G.; Woollen, J.; et al. The NCEP/NCAR 40-Year Reanalysis Project. Bull. Am. Meteorol. Soc. 1996, 77, 437–472. [Google Scholar] [CrossRef] [Scilit]
- Bretherton, C.S.; Peters, M.E.; Back, L.E. Relationships between Water Vapor Path and Precipitation over the Tropical Oceans. J. Clim. 2004, 17, 1517–1528. [Google Scholar] [CrossRef] [Scilit]
- Lu, E.; Zeng, X. Understanding different precipitation seasonality regimes from water vapor and temperature fields: Case studies. Geophys. Res. Lett. 2005, 32, L21707. [Google Scholar] [CrossRef] [Scilit]

Disclaimer/Publisher’s Note: The statements, opinions and data contained in all publications are solely those of the individual author(s) and contributor(s) and not of MDPI and/or the editor(s). MDPI and/or the editor(s) disclaim responsibility for any injury to people or property resulting from any ideas, methods, instructions or products referred to in the content. |
© 2026 by the authors. Licensee MDPI, Basel, Switzerland. This article is an open access article distributed under the terms and conditions of the Creative Commons Attribution (CC BY) license.