


Abstract
Southern South America encompasses temperate forests, steppe ecosystems, peatlands, fjords, and marine environments that support unique biodiversity and human communities, containing one of the world’s largest freshwater reserves in the Patagonian Icefields. Its relevance makes climate change a major threat to both natural ecosystems and human populations. Nevertheless, future changes in climate extremes, considering the complex topographic patterns that shape regional climatic patterns, remain uncertain. This study used an ensemble of regional climate models to assess future changes in a set of 9 temperature and precipitation extreme indices under two emissions scenarios (RCP4.5 and RCP8.5) and three future time horizons (2026–2045; 2051–2070 and 2081–2100). Our results reveal a robust intensification of temperature extremes, with minimum temperature extremes projected to increase by more than 7 °C under the high-emissions scenario by the end of the century, accompanied by increases exceeding 30 summer days in the northeastern portion of the region. In contrast, precipitation extremes exhibit larger spatial variability and uncertainty, although robust reductions in the frequency of days with precipitation exceeding 20 mm partially explain the projected drying trend, while increases in 1- and 5-day maximum precipitation indicate more intense heavy rainfall events across the Patagonian steppe. These results have clear implications for the cryosphere and the biodiversity of the region.
1. Introduction
Southern South America constitutes one of the most important environmental regions of the Southern Hemisphere, as it hosts extensive freshwater reserves, globally significant glacier systems, unique biodiversity, and economic activities that depend strongly on climate conditions. The region contains the Patagonian Icefields—the Northern Patagonian Icefield, Southern Patagonian Icefield, and Cordillera Darwin Icefield—which collectively represents the largest temperate ice mass in the Southern Hemisphere and one of the largest freshwater reservoirs outside Antarctica and Greenland [1,2]. Glaciers play a fundamental role in regulating local and regional environmental conditions by providing essential ecosystem services, climate regulation, biogeochemical cycling, and hydrological regulation within watersheds that support ecosystems and human activities [3].
Hydrological and climatic changes have the potential to alter habitat distribution, ecosystem productivity, species interactions, and ecological connectivity across Patagonia. Changes in freshwater availability and in temperature regimes are already affecting land and coastal ecosystems dynamics throughout the region. For instance, indicators of plant water status and ecosystem functioning are strongly associated with climate variations [4]. These ecosystems also face multiple threats linked to human activities such as land use changes, fires or invasive exotic species, and combined effects such as desertification derived from climate change and livestock overgrazing [5,6].
Southern South America is experiencing some of the most rapid and widespread environmental changes associated with anthropogenic climate change in the Southern Hemisphere. Observational records indicate significant warming trends, characterized by increases in mean temperatures and the frequency of warm days over the last five decades [7]. These changes have occurred concurrently with shifts in precipitation regimes associated with a poleward displacement of the mid-latitude high-pressure systems, which has also favored warm-air advection toward Patagonia [2]. Observed precipitation trends exhibit large uncertainty because of the strong interannual variability of precipitation across the region [8,9], which is largely modulated by large-scale modes of climate variability, particularly the Southern Annular Mode [10]. The observed climate trends, especially those related to temperature, have resulted in accelerated glacier mass loss across the region, even for glaciers that remained in a quasi-steady state for more than a century, such as the Perito Moreno Glacier [1,2,11,12]. Enhanced glacier melt over recent decades made the region one of the largest contributors to global glacier-driven sea-level rise, despite accounting for only a small fraction of global glacier volume [9,11]. Moreover, despite the observed reduction in the number of dry days, the frequency of flammable days has increased across the region [7], contributing to the recent occurrence of large-scale fires, even areas adjacent to the Andean glaciers [13]. These changes have major implications for regional hydrology, ecosystems, and socioeconomic activities.
Understanding future climate projections in Southern South America is essential given the strategic importance of its water resources, biodiversity conservation, tourism, and regional socioeconomic development. Given the strong climatic gradients and the complex topography that characterizes the region, the use of regional climate models (RCMs) is recommended for both climate characterization and the quantification of future climate change in regions such as Southern South America [14]. In this context, recent studies have highlighted the need for a regional approach across the Andes Mountains, using information from RCMs, to adequately inform climate risk assessments and adaptation planning [15,16]. Such information is fundamental for developing adaptation strategies to climate-related risks, informing sustainable resource management, and supporting evidence-based decision-making in the region.
Several studies have used RCMs to assess future climate projections in Southern South America. For example, Llopart et al. [17] identified a projected decline in winter precipitation across Patagonia based on 8 RCMs simulations, although with large inter-model uncertainty. The authors also reported a pronounced increase in temperature by the end of the century, consistent with other studies based on RCMs simulations [18,19]. In addition, Olmo et al. [20] projected an increase in the annual frequency of sequential heatwaves and dry-spells across Southern South America. Despite the observed and projected changes in the climate of the region, there are remaining gaps in knowledge regarding the future evolution of extreme temperature and precipitation events. These gaps arise from the limited available evidence and the low confidence linked to uncertainties in climate model simulations [21,22].
To address existing knowledge gaps regarding the future evolution of climate extremes across Southern South America, we assess projected changes throughout the 21st century using a suite of temperature- and precipitation-based extreme climate indices derived from an ensemble of RCMs simulations from the Coordinated Regional Downscaling Experiment (CORDEX) project. This article is organized as follows: Section 2 presents the study area, the description of the regional model simulations and the climate extreme indices used. Section 3 presents the results of the precipitation and temperature extremes. The discussion of the main findings is presented in Section 4, while the conclusions are summarized in Section 5.
2. Materials and Methods
2.1. Study Area
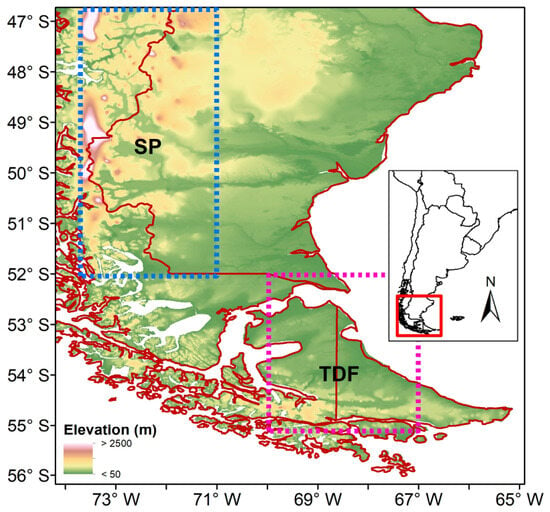
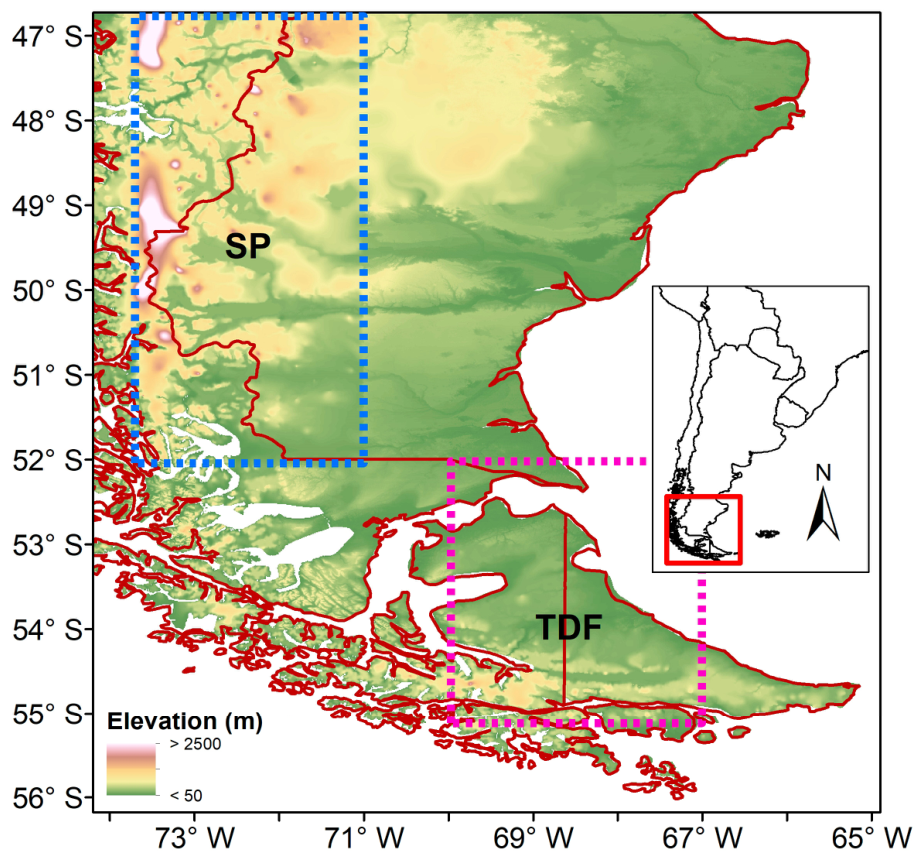
The study was focused on the southern tip of South America, encompassing portions of Patagonia in southern Argentina and Chile (Figure 1). This region is characterized by strong precipitation and temperature gradients arising from the interaction between the prevailing westerly winds and the orographic barrier imposed by the Andes Mountains [23]. These winds drive intense moisture transport from the Pacific Ocean, controlling precipitation rates at the windward portion of the region and creating a marked west-to-east precipitation gradient through orographic uplift over the Andes [10]. West of the Andes, the migratory extratropical cyclones and their associated frontal systems constitute an integral component of the baroclinic eddies, favoring annual precipitation totals exceeding 3000–7000 mm on the windward Pacific slopes, particularly around the Patagonian Icefields north of 52° S, where precipitation occurs throughout the year [24,25]. Precipitation decreases sharply eastward to less than 300 mm across the Patagonian steppe as a result of the prominent rain-shadow effect [23,26]. The spatial variability of precipitation roughly south of 52° S changes as the orientation of the topographic barrier shifts, giving rise to a band of maximum precipitation (>2000 mm) extending in a northwest-southeast direction toward southern Tierra Del Fuego. Nevertheless, the elevation of the Andes is significantly lower in this region, and the rain-shadow effect is much weaker than farther north, resulting in annual precipitation totals of approximately 600 mm in northern Tierra Del Fuego. Precipitation is relatively evenly distributed throughout the year due to the frequent passage of mid-latitude weather systems embedded in the westerly flow. The spatial distribution of temperature is modulated by the surrounding oceans and by the latitudinal and altitudinal characteristics of the region, resulting in mean annual temperatures ranging from −5 °C to 10 °C [26].
Figure 1.
Study area with the main topographic features and the selected subregions (SP: South Patagonia; TDF: Tierra Del Fuego).
The study area is part of the Southern South America region defined by Iturbide et al. [27] for regional evaluation of climate change in the Sixth Assessment Report of the Intergovernmental Panel on Climate Change (IPCC). However, given the pronounced regional differences in precipitation regimes, we further evaluated future projections by focusing on two sub-regions: South Patagonia (SP, 47–52° S, 71–74° W), which encompasses the area characterized by a strong rain-shadow effect, and Tierra Del Fuego (TDF, 52–55° S, 67–70° W). This subdivision is supported by the regionalization proposed by Zalazar et al. [28] for the National Glacier Inventory of Argentina and by the hydrological regionalization proposed by Masiokas et al. [29] based on the temporal characteristics of streamflow records.
2.2. Regional Climate Simulations
Given the spatial complexity of the regional climate, we used an ensemble of RCMs from the CORDEX project. These RCMs have higher spatial resolution than global climate models (GCMs), on the order of tens of kilometers, and are forced by specific GCMs from the fifth phase of the Coupled Model Intercomparison Project (CMIP5) over predefined geographical domains [30,31]. We selected 21 RCMs from two spatial domains covering the South American continent and adjacent oceanic regions [32]: SAM-22 and SAM-44, which have horizontal resolutions of approximately 25 and 50 km, respectively. We excluded the simulations from the SAM-20 domain given the lack of maximum and minimum temperature simulations at the time of processing the data.
To account for differences in spatial resolution among the RCMs, all model outputs were regridded to a common spatial resolution of 0.25° × 0.25° using bilinear interpolation, a widely adopted approach in climate analysis studies [33,34,35,36]. Bilinear interpolation estimates values at intermediate grid points based on the weighted average of the four nearest neighboring grid cells, thereby allowing the projection of climate model outputs onto a common two-dimensional grid [37]. This method is computationally efficient and appropriate for coarser resolution datasets such as those from GCMs and RCMs, as it captures spatial patterns effectively without introducing significant distortions [38].
Historical simulations for the period 1986–2005 were evaluated against the CRU TS 4.07 reference dataset, developed by Climatic Research Unit of the University of East Anglia [39]. The global dataset is derived from the interpolation of temperature and precipitation—among other variables—from meteorological stations from national meteorological services and other external agents, which have been subject to extensive quality control measures [40], for a spatial resolution of 0.5° and monthly time step covering the period 1901–2022. Different versions of this dataset have been widely used to investigate regional climate dynamics and to evaluate temperature and precipitation simulations from both RCMs and GCMs over South America [41,42], particularly in the Andes region [40,43,44]. To ensure a consistent spatial comparison between the regional climate simulations and the reference dataset, the CRU TS 4.07 data was bilinearly interpolated to match the spatial resolution of the regridded RCMs. Following the methodology described by Marianetti et al. [43,45], we computed a ranking index among all the model simulations based on several performance metrics such as the mean absolute error, the interannual variability skill score, the Pearson correlation coefficient, the magnitude and sign of the long-term annual trends, and the quantification of Taylor diagrams. The RCMs that best reproduced the main climate characteristics of the study area are listed in Table 1. Among the evaluated models, the fourth version of the Rossby Centre regional atmospheric model (RCA4) [46], driven by the CSIRO-Mk3-6-0, NorESM1-M, and CanESM2 global climate models, showed the best overall performance. The final selection also includes the REMO2009 [47] and RegCM4-3 [48] regional climate models, driven by the MPI-ESM-LR and HadGEM2-ES global models, respectively. It is noteworthy that the selected RCMs belong to the SAM-44 domain (Table 1), highlighting that higher spatial resolution simulations do not necessarily translate into a better representation of regional climate conditions. This finding is consistent with previous assessments of RCM performance in Europe [49] and Asia [50]. Figure A1 and Figure A2 show the spatial patterns of precipitation and temperature simulated by the multi-model ensemble of the selected RCMs, which adequately reproduce the main climatic features described in the previous section. In general, there is an overestimation of precipitation, particularly along the regions with the highest annual totals, together with an underestimation of temperature, a result documented for GCMs and RCMs across the Andes and other complex topography regions [44,51,52,53].
Table 1.
List of the selected RCMs.
For the assessment of future climate projections, we selected three time horizons: a near-future period (2026–2045), a medium-term period (2051–2070), and a far-future period (2081–2100). Future projections were evaluated under two Representative Concentration Pathways (RCPs): RCP4.5 and RCP8.5. The RCP4.5 represents an intermediate stabilization scenario, reaching a radiative forcing of 4.5 W/m2 by the year 2100. This scenario assumes the implementation of mitigation policies that lead to the stabilization of atmospheric CO2 concentrations at slightly above 500 ppm [54]. Under this scenario, global mean surface temperature is projected to increase by approximately 2.5 °C above pre-industrial levels during the second half of the 21st century. In contrast, the RCP8.5 represents the upper end of the range of emissions scenarios available in the literature and is characterized by high population growth, continued increases in greenhouse gas emissions, and the absence of climate mitigation policies [55]. This scenario is the only RCP with emissions high enough to produce a radiative forcing of 8.5 W/m2 by 2100, which would result in global warming exceeding 4 °C above pre-industrial levels by the end of the 21st century, accompanied by a rapid increase in atmospheric CO2 concentrations.
2.3. Selection of Extreme Climate Indices
We analyzed a suite of climate extreme indices derived from daily precipitation and temperature simulations, computed for each grid point of the five selected RCMs. These indices were defined by the Expert Team on Climate Change Detection and Indices (ETCCDI) to facilitate the assessment of changes in climate extremes at the global scale [56]. Following previous studies, we selected five precipitation-based extreme indices, including two intensity indices (RX1 and RX5), two frequency indices (R75p and R20mm), and one duration index (CDD). We also considered four temperature-based extreme indices comprising two intensity indices (TXx and TNn) and two frequency indices (SU and FD). A description of the selected indices is provided in Table 2. The selection of these indices is consistent with several of the climatic impact drivers defined in the Sixth Assessment Report of the IPCC, particularly those related to heat and cold and wet and dry conditions [57]. Changes in mean and extreme temperature variables, as well as in the R20mm, CDD, and R75p indices, were calculated as the absolute difference between the projected and the historical mean values. In contrast, changes in mean annual precipitation and the RX1 and RX5 indices were expressed as percentage changes relative to the historical baseline period (1986–2005).
Table 2.
Description of the selected precipitation and temperature extreme indices.
3. Results
3.1. Projected Changes in Precipitation Extremes
To provide context for the evaluation of projected changes in precipitation extremes across the study area, we first examine the projected changes in mean precipitation. The spatial patterns reveal reductions in mean precipitation across the northern and central portions of the SP sub-region for all time horizons, ranging from 0% to −15%, with the largest decreases projected under the RCP8.5 scenario (Figure A3). This region is of particular importance for freshwater availability, as it contains some of the largest glacier systems in the Southern Hemisphere. East of the Andes, the Patagonian steppe exhibits mixed signals in projected precipitation changes depending on the scenario and time horizon, resulting in large uncertainty. Along the Atlantic coast, significant reductions in mean precipitation are projected under the RCP8.5 scenario only for the 2081–2100 period. Finally, projected increases in mean precipitation dominate south of 53° S, particularly by the end of the 21st century under the RCP8.5 scenario, with increases reaching up to 15% in the southwestern portion of TDF (Figure A3). Spatially averaged precipitation changes indicate reductions over the SP sub-region and increases over TDF across all time horizons and scenarios, although the regional mean changes generally remain below 5%.
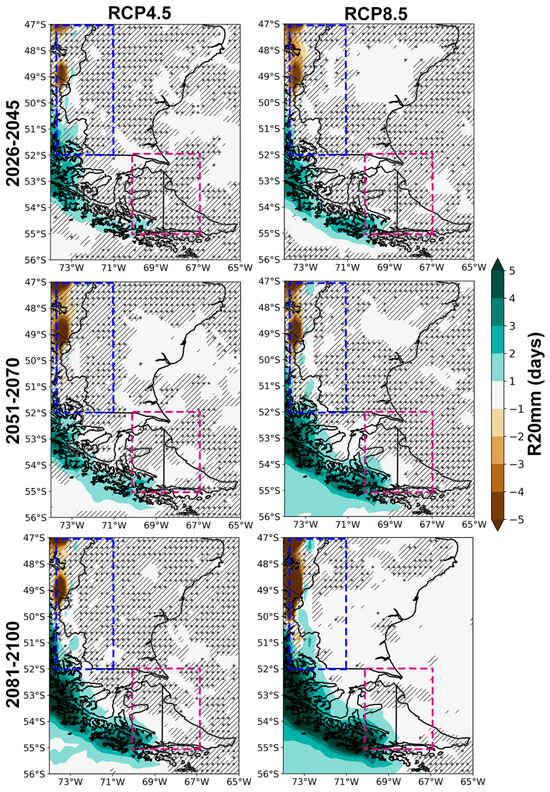
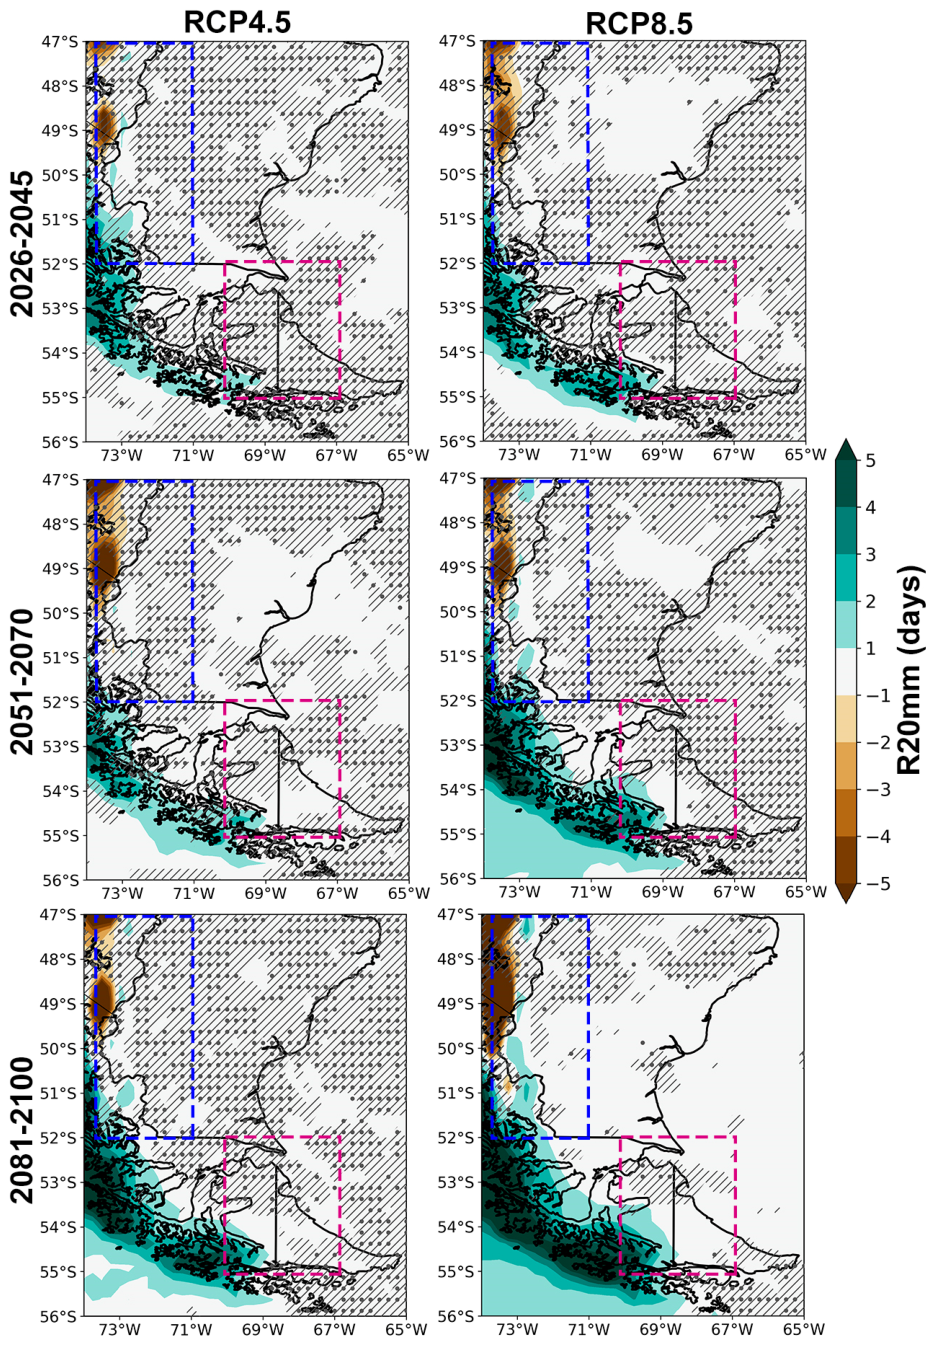
The projected changes in the R20mm index closely resemble those in mean precipitation, particularly across the SP and TDF sub-regions, with the magnitude of change remaining relatively consistent across time horizons and radiative forcing scenarios (Figure 2). The northwestern portion of the study area exhibits robust projected reductions in the number of days with precipitation exceeding 20 mm, with decreases increasing in both magnitude and spatial extent, particularly under the RCP8.5 scenario, where reductions are significant and exceed 4 days across all time horizons. Projected changes across the Patagonian steppe are spatially heterogeneous and characterized by large uncertainty, although the region is mainly dominated by increases in R20mm. In contrast, the southwestern portion of the study area shows projected increases that depend on both the time horizon and the emissions scenario, with the largest robust and significant increases (exceeding 4 days) projected for the 2081–2100 period under the RCP8.5 scenario. The same combination of time horizon and emissions scenario also results in robust and statistically significant increases in the R20mm index across most of TDF, particularly in its western portion.
Figure 2.
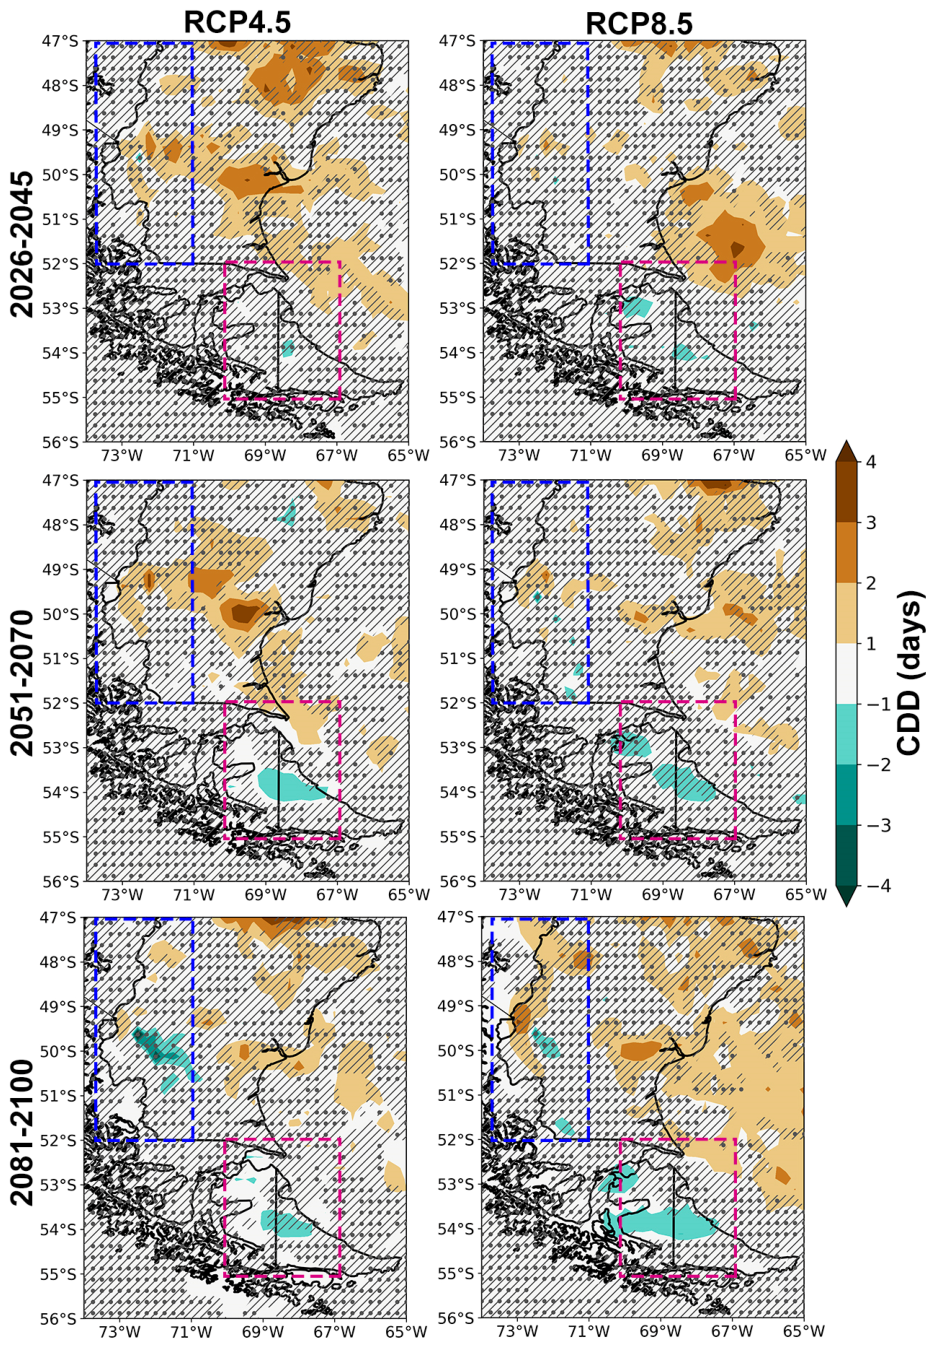
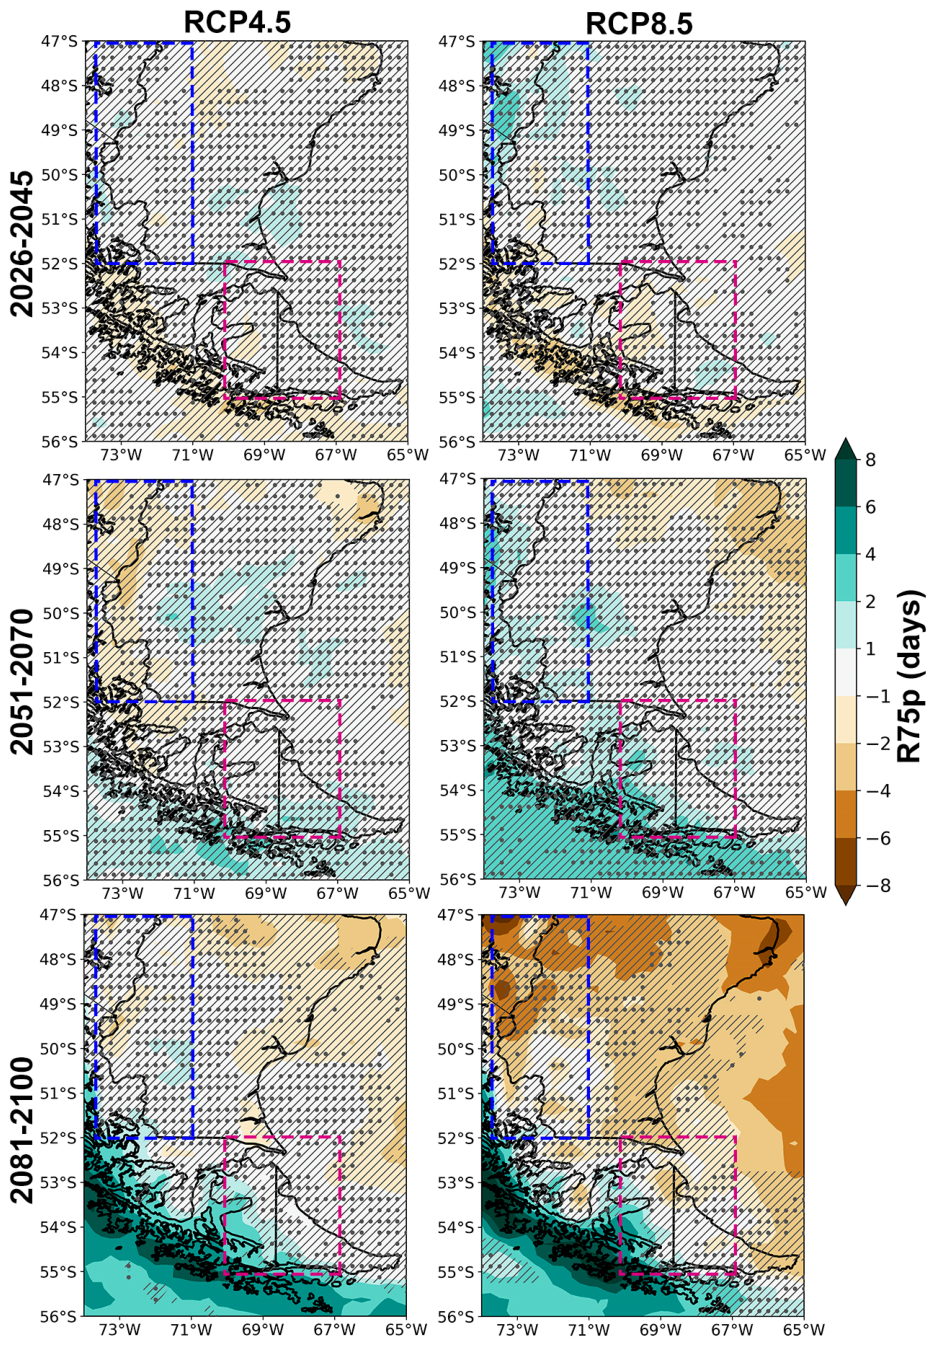
Projected changes in R20mm (days) derived from the CORDEX multi-model ensemble for the RCP4.5 (left panels) and RCP8.5 (right panels) scenarios for the time periods 2026–2045 (top panels), 2051–2070 (middle panels), and 2081–2100 (bottom panels), relative to the 1986–2005 baseline period. Blue dotted boxes represent the location of SP region, while magenta dotted boxes represent the location of the TDF region. Areas without dots indicate robust signals, where at least 80% of the models agree on the sign of change. Diagonal lines indicate regions with no significant change at 90% confidence level. Dashed boxes indicate the selected sub-regions.
To summarize the projected changes in the selected sub-regions, Table 3 shows the mean and standard deviation of the projected changes in the selected extreme precipitation indices derived from the multi-model ensemble relative to the 1986–2005 reference period, with the standard deviation as a measure of inter-model uncertainty. The SP sub-region shows projected changes in the R20mm index that are characterized by substantial uncertainty. Nevertheless, all combinations of time horizons and scenarios indicate reductions in the regional mean values of this index, with the largest decreases projected for the 2081–2100 period under the RCP8.5 scenario. In contrast, the TDF sub-region shows projected increases in the R20mm index across all time horizons and scenarios. However, the magnitude of these increases remains below 1 day and is also associated with considerable uncertainty. The largest increases are projected under the RCP8.5 scenario, irrespective of the time horizon.
Table 3.
Projected change (mean ± standard deviation) for the selected extreme precipitation indices across the different time horizons and scenarios considered averaged over the SP and TDF regions. The changes were calculated relative to the 1986–2005 baseline period.
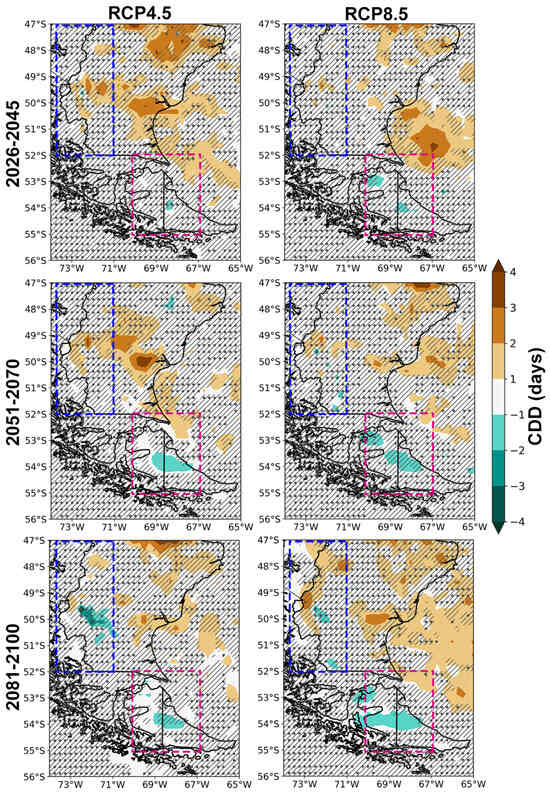
The CDD index exhibits a spatially heterogeneous pattern of projected change, with only limited areas showing robust and statistically significant changes in the index (Figure 3). Robust and significant increases of 1–3 days, are projected particularly across the Patagonian steppe around 50° S for the time horizons 2026–2045 and 2051–2070 under the RCP4.5 scenario. The spatial extent of these positive changes decreases towards the end of the century. Areas with robust reductions in CDD are mainly located south of 52° S across parts of TDF under on both scenarios. The largest reductions are projected east of the Andes around 50° S for the far-future and under both scenarios.
Figure 3.
Same as Figure 2 for the CDD index.
Projected changes in the CDD index across the selected sub-regions are characterized by large uncertainty, reflecting the pronounced spatial heterogeneity shown in Figure 3. Slight increases in CDD are projected for the SP sub-region only under the RCP4.5 scenario during the 2026–2045 and 2051–2070 time horizons. In contrast, reductions are projected under the RCP8.5 scenario for all the time horizons, although with considerable inter-model uncertainty (Table 3). Projections for the TDF sub-region indicate decreases in the CDD index across all selected scenarios and time horizons, but these changes are likewise associated with large uncertainty.
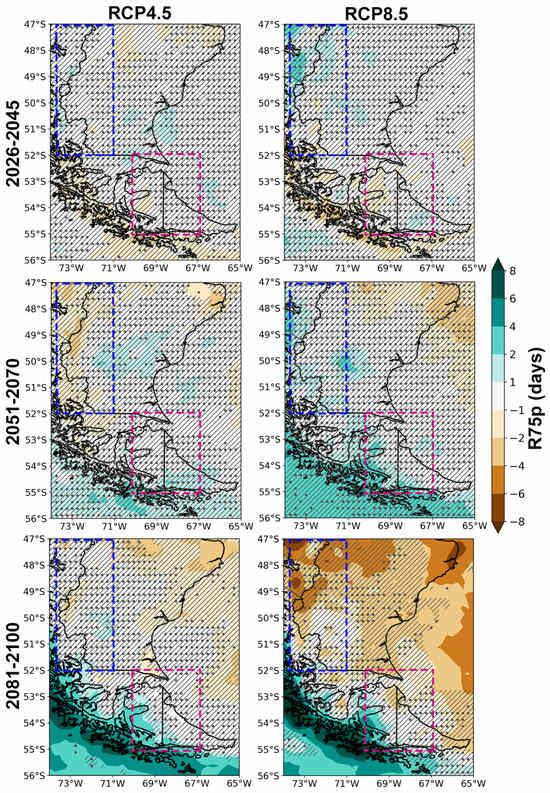
Future changes in the R75p index show non-significant reductions across much of the study area for the near-future under both scenarios (Figure 4). For the 2051–2070 period, robust reductions in R75p, although non-significant, are projected only under the RCP4.5 scenario, particularly west of 72° W along the Argentina-Chile border. The projected changes during the far-future show distinct spatial patterns depending on the emissions scenario (Figure 4). Areas with robust and significant reductions up to 4 days are projected across limited portions of the northern Patagonian steppe under the RCP4.5 scenario. Projections based on the RCP8.5 scenario show robust and significant reductions, exceeding 4 days, particularly across parts of the Patagonian steppe, the Atlantic coastal region, and the northwestern portion of the study area encompassing the Patagonian Icefields. Conversely, areas with robust and significant increases in R75p are projected for the 2081–2100 period under both scenarios, mainly the insular portion of the study area. These increases can exceed 6 days and its magnitude is higher under the RCP8.5 scenario (Figure 4).
Figure 4.
Same as Figure 2 for the R75p index.
The sub-regional synthesis of projected changes in the R75p index reveals substantial uncertainty (Table 3), reflecting the heterogeneous spatial patterns described above. The SP sub-region shows projected reductions in R75p for nearly all combinations of time horizons and scenarios, with mean changes ranging from −0.1 to −2.8 days. The magnitude of these changes shows no clear dependence on either the selected time horizon or the emissions scenario, and is associated with large inter-model uncertainty. A similar pattern is observed over TDF sub-region, where mean reductions are projected for all combinations of time horizons and scenarios, except for the far-future under the RCP4.5 scenario. However, these projections are also characterized by substantial uncertainty.
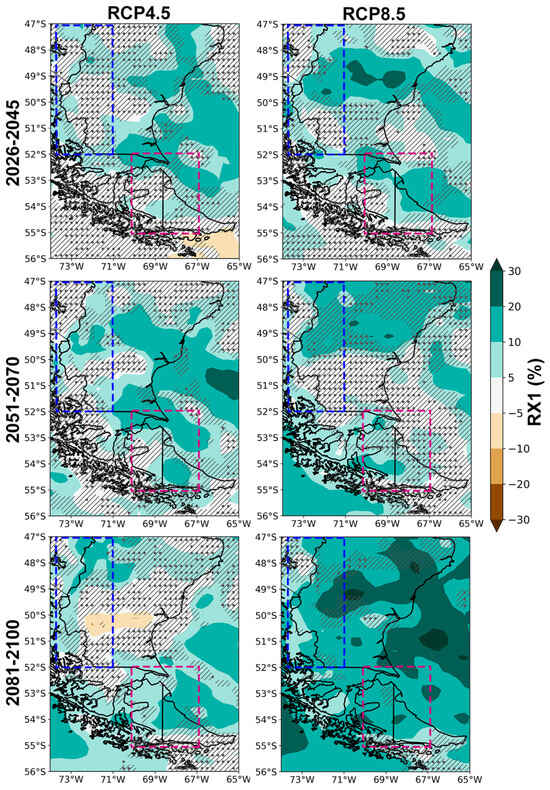
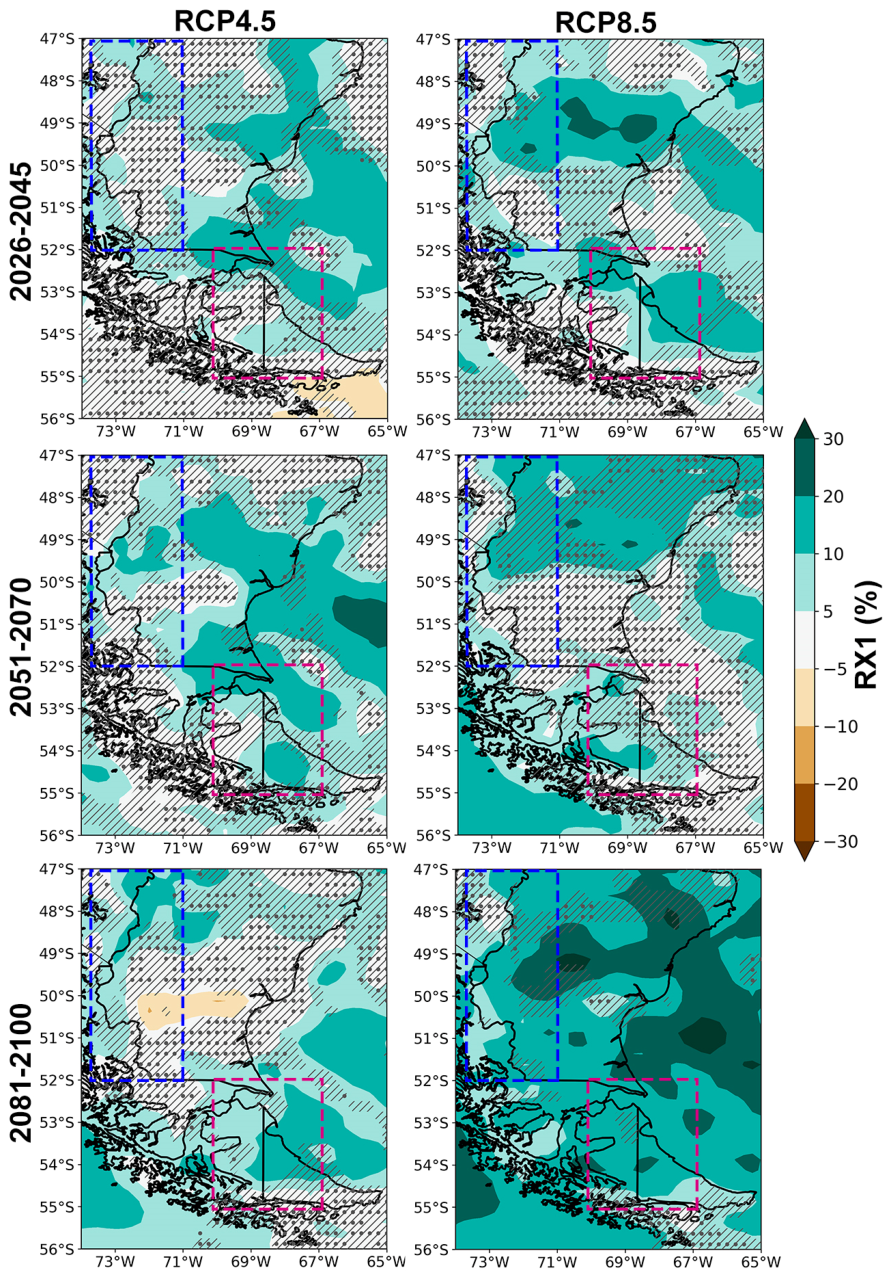
The RX1 index shows a more spatially homogeneous pattern of change in terms of sign, with increases projected across most of the study area, although only limited areas show robust and statistically significant changes (Figure 5). Under the RCP4.5 scenario, robust increases over continental areas are projected primarily across the eastern portion of the Argentinean Patagonia, with increases of up to 20% for the time horizons 2026–2045 and 2051–2070. Smaller areas in the western part of the study area also exhibit positive changes in the RX1 index for these time horizons. Projected increases of up to 20% are also evident over central TDF in the medium-term future. Considering the RCP4.5 scenario, the period 2081–2100 shows robust positive changes across the western portion of the study area, and over much of TDF, while a limited area of the Patagonian steppe between 50° to 51° S exhibits robust reductions of up to 20%. Under the RCP8.5 scenario, the spatial extent of robust and significant increases in the RX1 index expands progressively toward the end of the century (Figure 5). The largest increases are projected across the Patagonian steppe and the Atlantic coast during the 2051–2070 and 2081–2100 periods, reaching values of up to 30% relative to the baseline period.
Figure 5.
Same as Figure 2 for the RX1 index.
The projected changes in the RX1 index across the selected sub-regions (Table 3) highlight the spatially coherent nature of the projected signal across all time horizons and scenarios, with mean increases ranging from 3.4 to 8.1% over SP and from 5.5 to 13.6% considering TDF. Over the SP sub-region, the magnitude of the projected changes exhibits a clear dependence on both the time horizon and the emissions scenario, increasing toward the end of the century and reaching its largest values under the RCP8.5 scenario. A similar, although less pronounced, relationship is evident over TDF, particularly under the RCP4.5 scenario. In all cases, the projected changes are associated with substantial inter-model uncertainty.
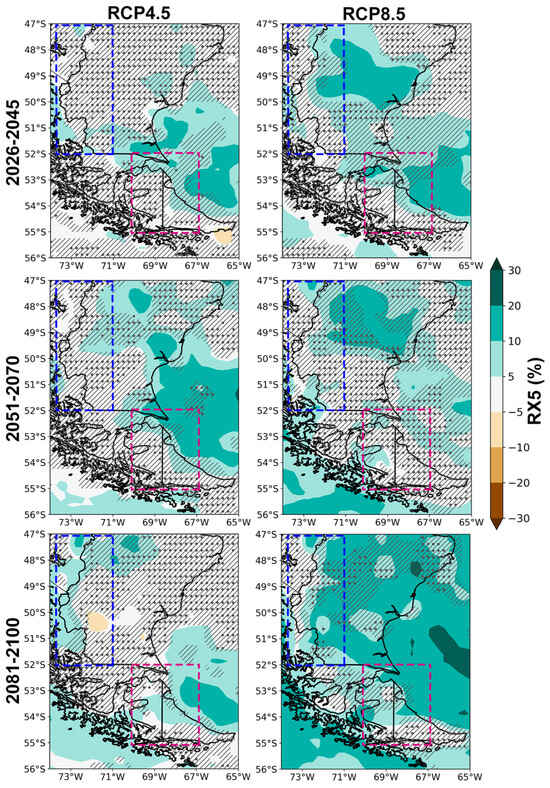
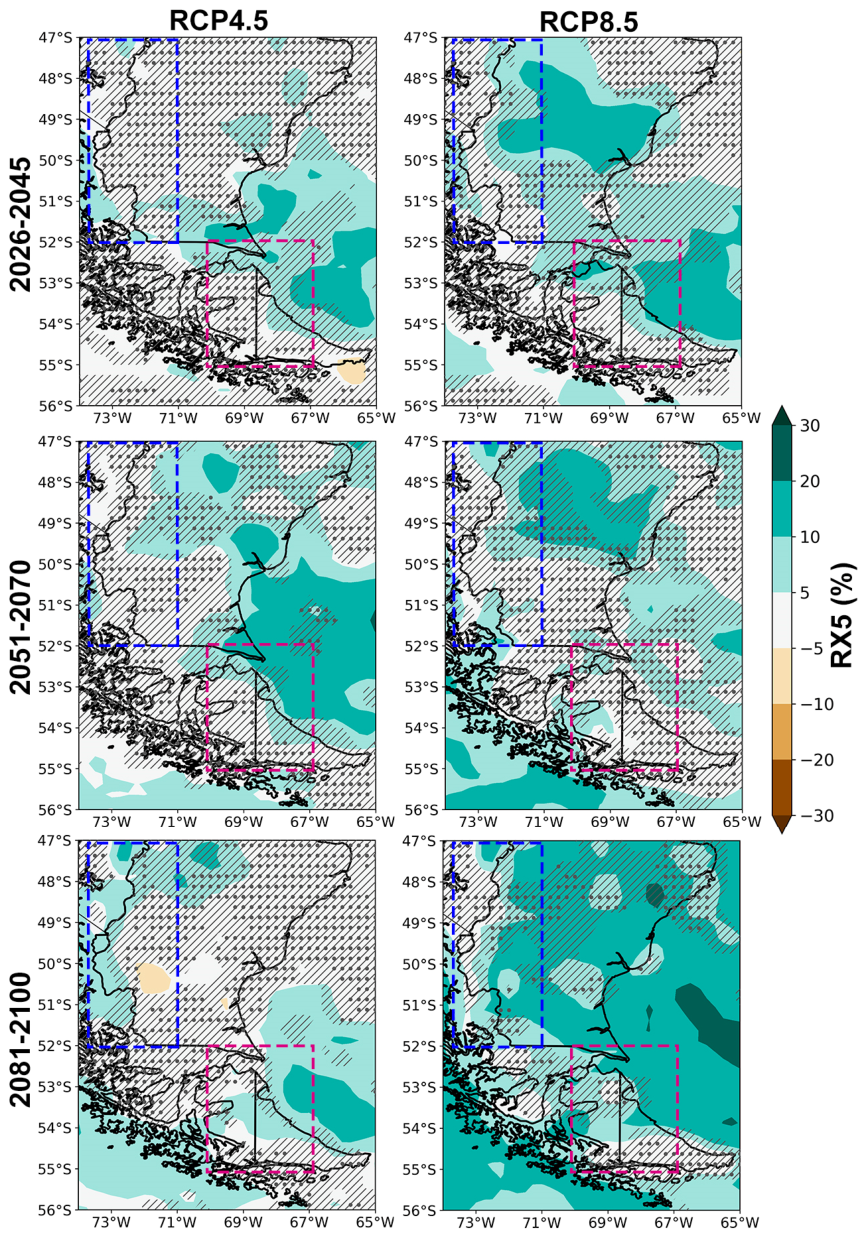
The projected changes in the RX5 index (Figure 6) broadly resemble the spatial patterns obtained for the RX1 index, with increases dominating most of the study area. Under the RCP4.5 scenario, near-future projections indicate robust increases in RX5 west of 72° W, although with magnitudes generally below 10%. Robust increases are also projected over central TDF and along the southern margin of the Patagonian steppe, while limited areas south of TDF exhibit significant reductions of up to 10%. The projected changes for the 2051–2070 period largely resemble those of the near-future period, although the extent of robust and statistically significant increases expand across the Patagonian steppe. The period 2081–2100 shows robust positive changes across the western portion of the study area and much of TDF, whereas a limited area of the Patagonian steppe between 50° to 51° S exhibits robust reductions of up to 10%. As observed for the RX1, projections under the RCP8.5 scenario indicate that the areas exhibiting robust and statistically significant increases in the RX5 index expand progressively toward the end of the century (Figure 6). The largest increases are projected across the Patagonian steppe for all the time horizons, reaching up to 20% relative to the baseline period.
Figure 6.
Same as Figure 2 for the RX5 index.
Sub-regional mean changes in the RX5 index are generally smaller than those projected for the RX1 index, with similar magnitudes considering the uncertainty (Table 3). The SP sub-region shows mean changes between 0.4 to 4.7%, with no evident dependence on the selected time horizon and scenario. Over TDF, projected mean changes range from 4.4 to 8.9%.
3.2. Projected Changes in Temperature Extremes
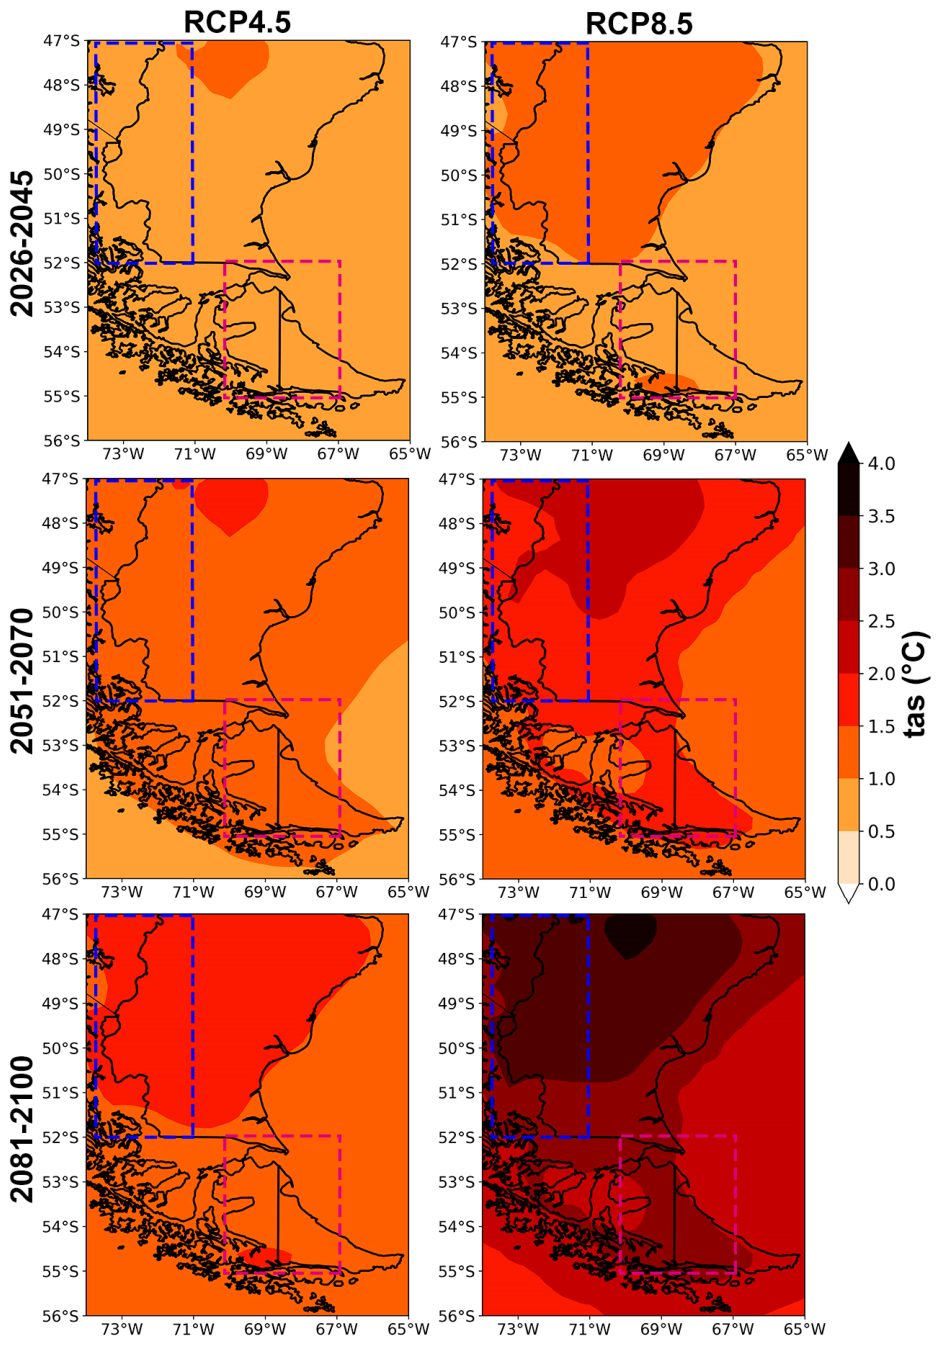
As for precipitation in the previous section, we first quantified the projected changes in mean temperature changes across the study area. Temperature projections are robust and statistically significant both in sign and magnitude under the selected emission scenarios (Figure A4), with the magnitude of warming strongly dependent on the selected time horizon and scenario. Under the RCP4.5 scenario, near-future warming exceeds 1 °C only over a limited area east of the Andes between 47° to 48° S, while the remainder of the study area showing increases between 0.5 °C to 1 °C. For the mid-future, most of the study area exhibit increases larger than 1 °C. The far-future period shows a warming pattern that exceeds 1.5 °C north of 52° S. Under the RCP8.5 scenario, a more pronounced warming signal is projected across the region for all time horizons. The period 2026–2045 shows an increase in temperature that exceeds 1 °C north of 52° S. This warming signal exceeds 2 °C in the period 2051–2070 across the region north of 50° S, with much of the land areas experiencing increases greater than 1.5 °C. The largest changes in mean temperature are projected for the far-future period, with warming exceeding 3 °C across a large portion of the study area north of 51° S. These results highlight the strong dependence of regional temperature projections on the emissions scenario, particularly toward the end of the century.
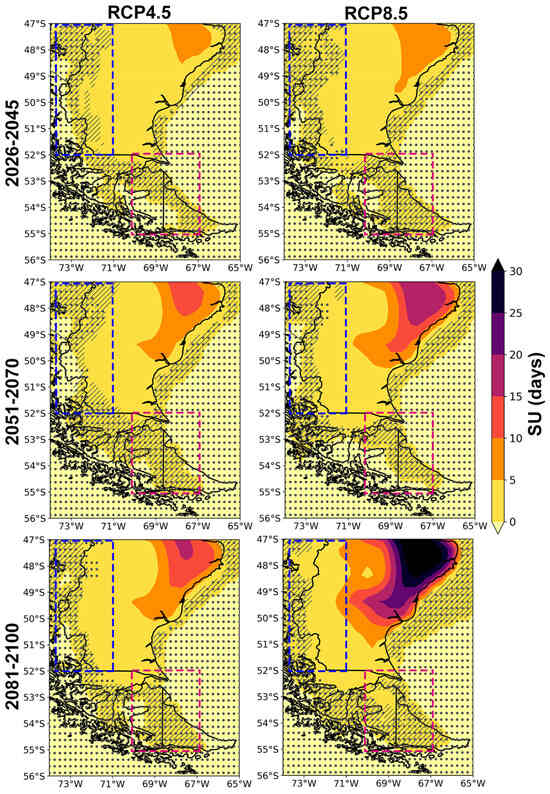
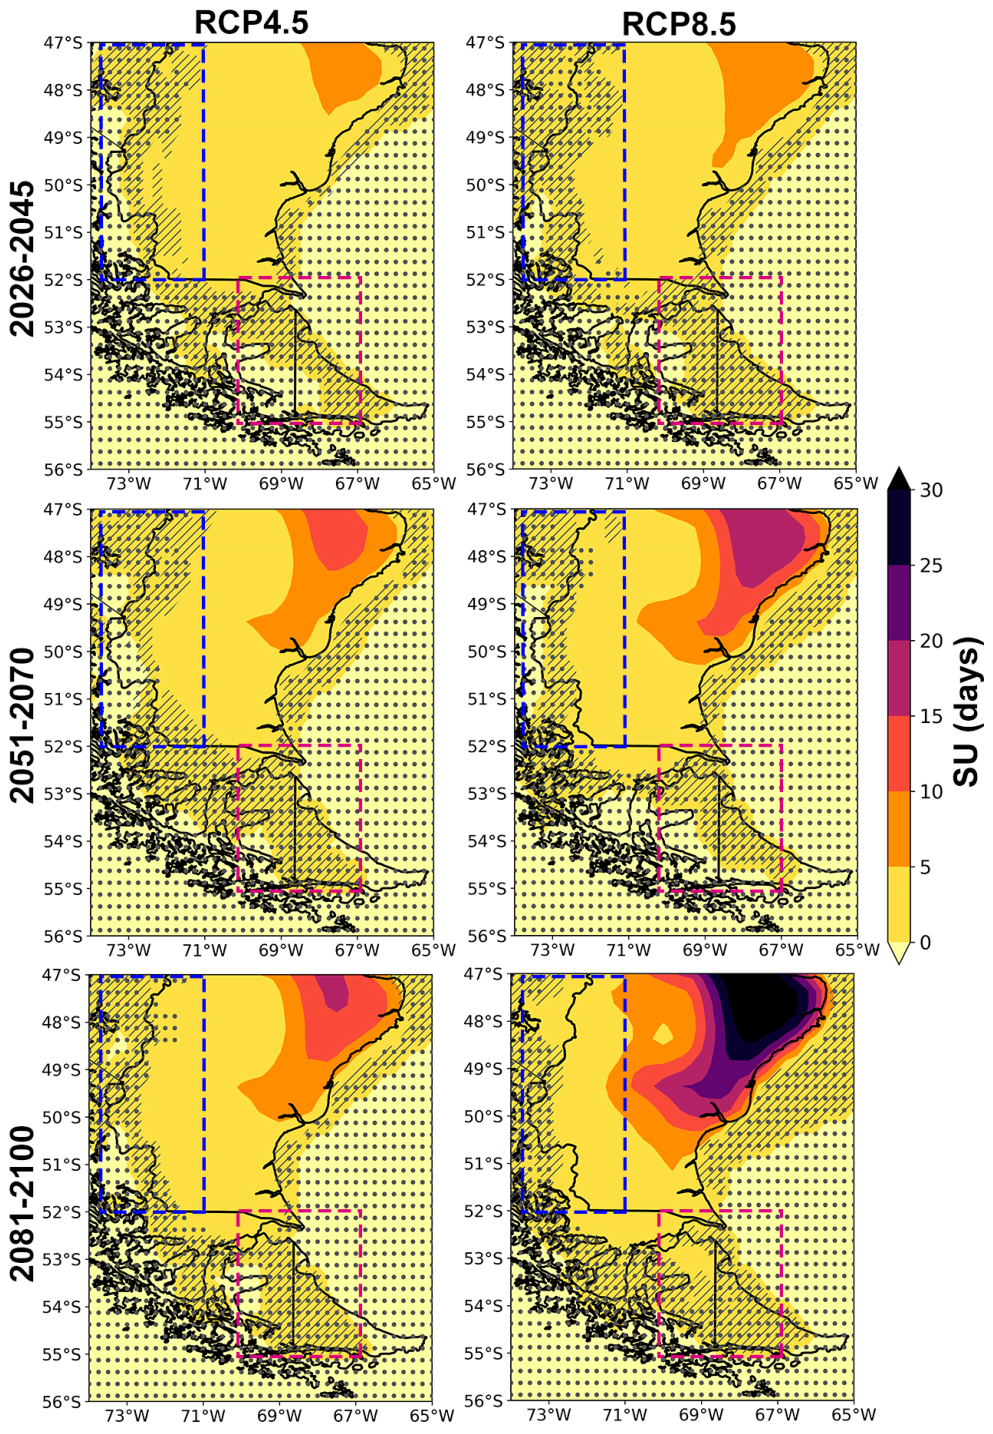
Regarding temperature extremes, the SU index exhibits a spatially homogeneous pattern of change, with increases projected across most of the study area for all combinations of scenarios and time horizons (Figure 7). Robust and statistically significant increases are projected over most of Patagonian steppe, whereas limited portions at the edge of the continent exhibit reductions, although with large uncertainty. Projections for the near-future show a similar pattern of change for both scenarios, with increases of up to 10 days in the SU index across most of the study area. Likewise, both scenarios project comparable changes during the 2051–2070 period, with a hotspot in the northeastern portion of the study area showing robust and significant increases of up to 20 days. Finally, the projections for the far future show the largest increases in SU, particularly under the RCP8.5 scenario, with increases reaching up to 30 days in the northeastern Patagonia.
Figure 7.
Projected changes in SU (days) derived from the CORDEX multi-model ensemble for the RCP4.5 (left panels) and RCP8.5 (right panels) scenarios for the time periods 2026–2045 (top panels), 2051–2070 (middle panels), and 2081–2100 (bottom panels), relative to the 1986–2005 baseline pe-riod. Blue dotted boxes represent the location of SP region, while magenta dotted boxes represent the location of the TDF region. Areas without dots indicate robust signals, where at least 80% of the models agree on the sign of change. Diagonal lines indicate regions with no significant change at 90% confidence level. Dashed boxes indicate the selected sub-regions.
To summarize the projected changes in the selected sub-regions, Table 4 presents the mean and standard deviation—as a measure of uncertainty—of the projected changes in the selected extreme temperature indices derived from the multi-model ensemble relative to the 1986–2005 reference period. The SP sub-region shows an increase in the SU index across all time horizons and emissions scenarios, although these changes are associated with large uncertainty. Only under the RCP8.5 scenario the projected increases exceed 1 day by the end of the century. This result is consistent with the large uncertainties evident in the spatial patterns of projected change across this topographically complex region. Because of the high-latitude setting of the TDF sub-region and the considerable uncertainty in the projected changes, the SU index occurs very infrequently in this region, precluding a robust assessment of future changes. Consequently, TDF is excluded from the regional analysis of projected changes in this index.
Table 4.
Same as Table 3 for the extreme temperature indices.
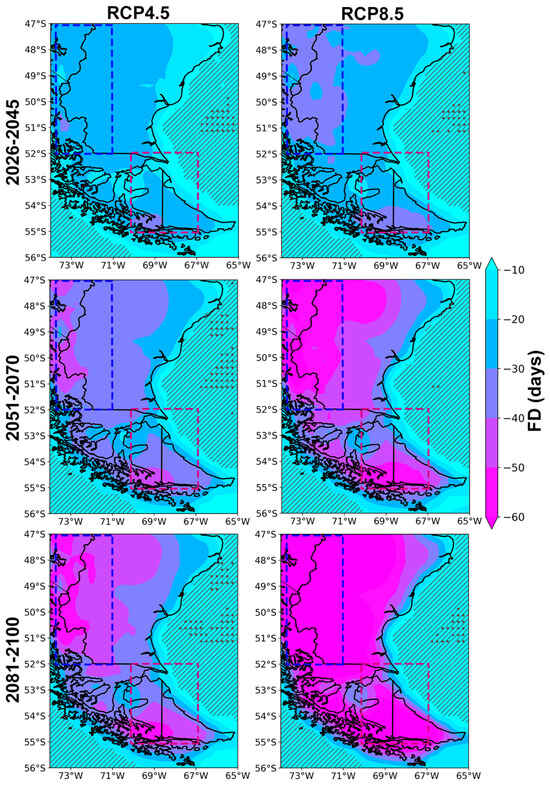
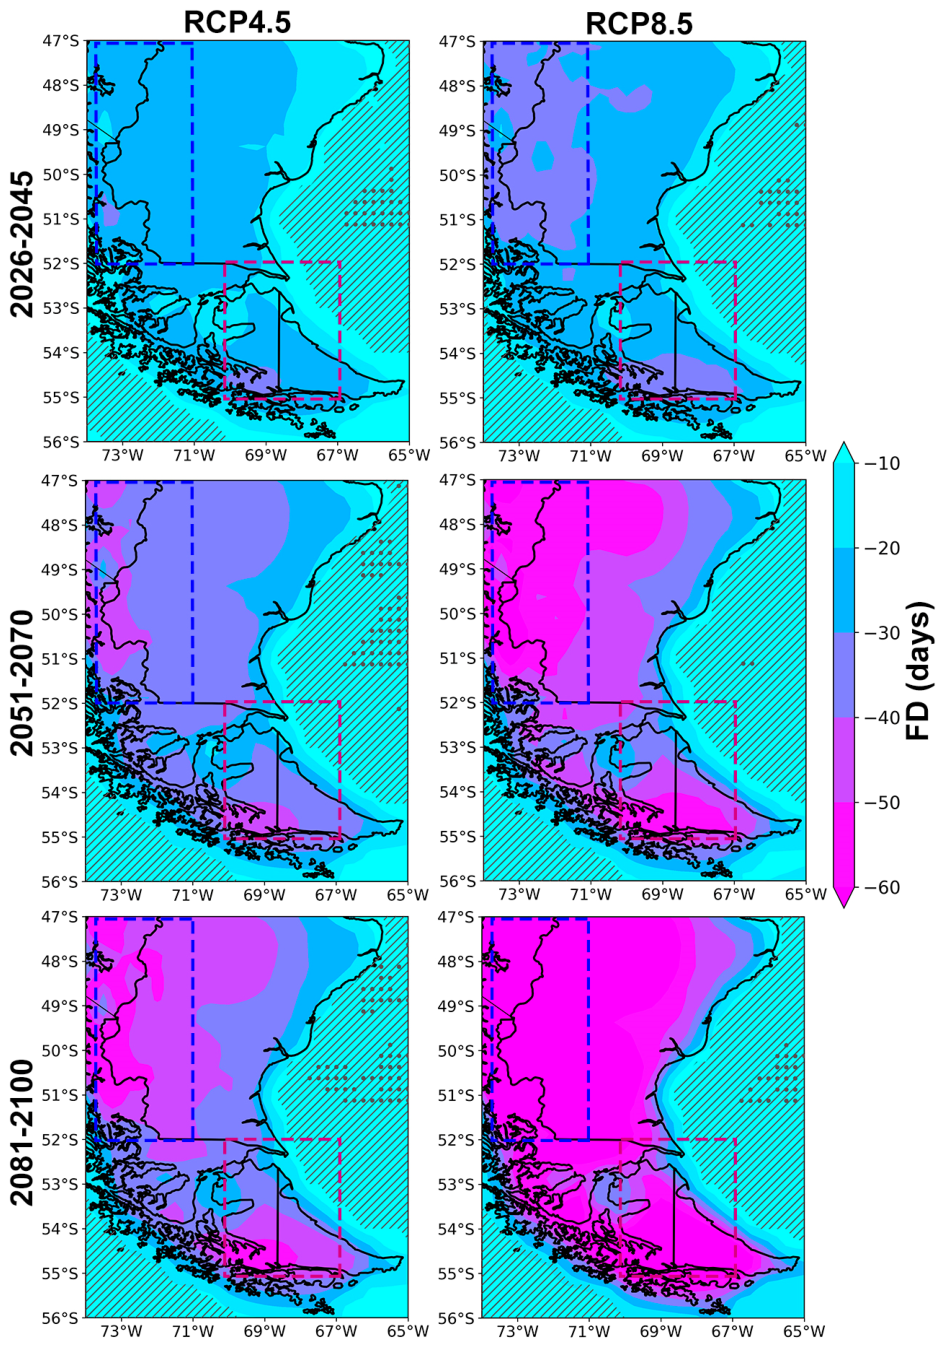
Projected changes in the FD index show widespread robust and statistically significant reductions across the study area, with the magnitude of the changes depending on the selected emission scenarios and time horizons (Figure 8). It is worth noting that most of the oceanic areas show non-significant changes in the index, with only a limited number of grid points over the Atlantic Ocean exhibiting non-robust changes. This highlights the strong response of the FD index to the projected regional warming signal (Figure A2). Under the RCP4.5 scenario, the 2026–2045 time horizon is characterized by reductions in the FD index of up to 30 days across most of the study area. The magnitude of these reductions increases during the 2051–2070 time horizon, particularly over SP and western TDF, where values up to 50 days are projected. In the far-future time horizon, reductions in the FD exceed 60 days, particularly over SP and western TDF, with a pronounced west-to-east gradient towards the Atlantic coast. Under the RCP8.5 scenario, reductions in the FD index of up to 30 days are projected across much of the study area in the 2026–2045 time horizon, with decreases exceeding 30 days over SP and southwestern TDF. During the 2051–2070 period, reductions exceed 60 days in these regions and also exhibit a marked west-to-east gradient towards the coast. The largest reductions in FD are projected over extensive areas of the northwest and southern portions of the study area. In the far-future time horizon, nearly the entire region shows robust and statistically significant reductions of more than 60 days in the index.
Figure 8.
Same as Figure 7 for the FD index.
Sub-regional mean changes in FD are summarized in Table 4. The magnitude of the projected reductions exhibits a clear dependence on both the time horizons and emission scenarios, with the largest decreases projected by the end of the century under the high-emissions scenario. Under the RCP4.5 scenario, mean reductions in the SP sub-region range from 25 to 48 days, increasing to 32–83 days under the RCP8.5 scenario. Similarly, mean reductions over TDF range from 20 to 33 days under the RCP4.5 scenario, increasing to a range from 23 to 51 days considering the RCP8.5 scenario.
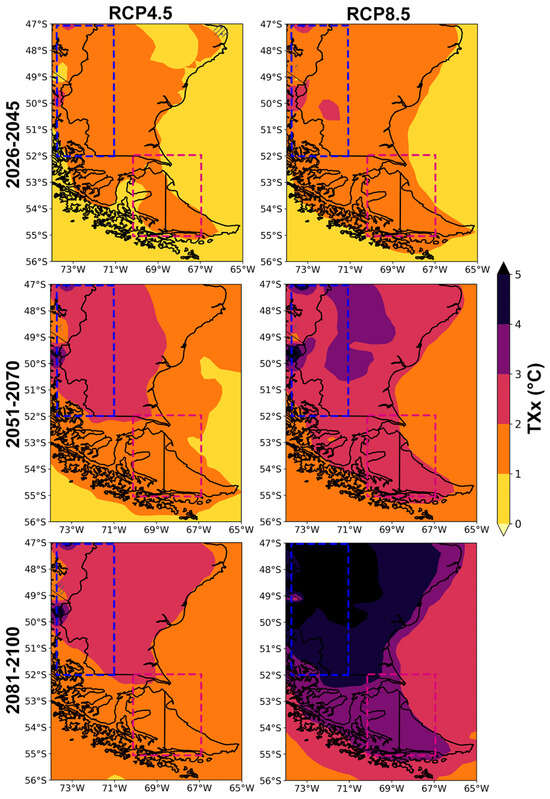
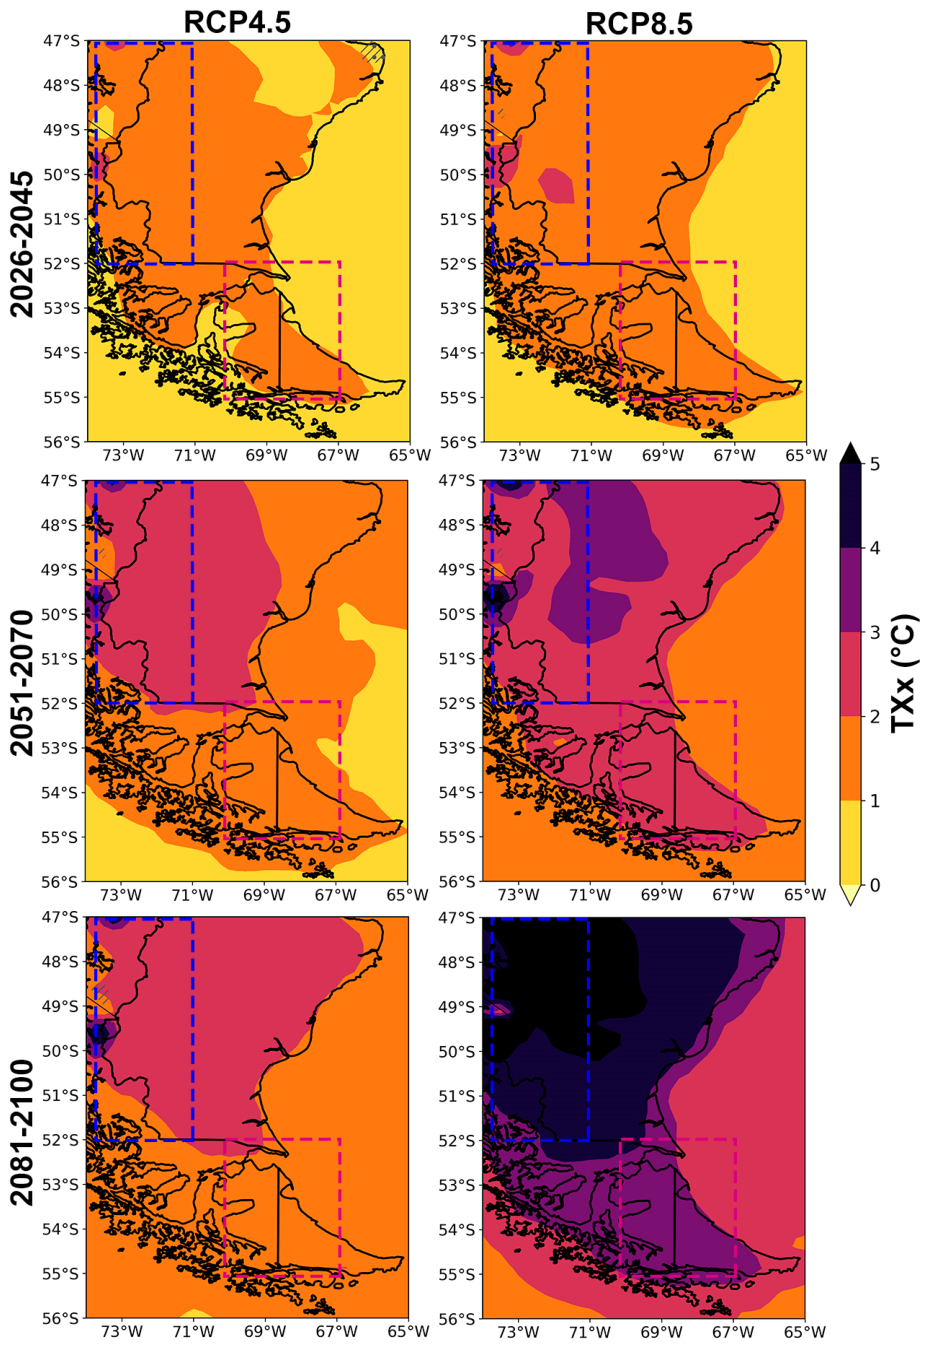
Consistent with the projected increases in mean temperature over the study area, the TXx index also exhibits a robust and statistically significant warming signal (Figure 9). The magnitude of the projected changes shows a clear dependency on both the time horizon and the emissions scenario, with the largest increases in TXx projected under the RCP8.5 scenario for the far-future. Simulations forced by the RCP4.5 scenario project increases in TXx between 1.0 °C and 2.0 °C across much of the study area during the 2026–2045 time horizon. The magnitude and spatial extent of these changes increase during the 2051–2070 and 2081–2100 time horizons, with most of the study area north of 52° S showing increases between 2.0 °C to 3.0 °C. The only exception is a small sector in the central-western part of the study area, where larger increases are projected. Under the RCP8.5 scenario, TXx increases by up to 2.0 °C across much of the study area during the 2026–2045 time horizon. The warming signal intensifies during the mid-future, with most of the region exhibiting increases of 2.0–3.0 °C and a large area of the Patagonian steppe experiencing even greater warming. The largest changes in TXX are projected for the far-future, exceeding 4 °C across much of the study area and surpassing 5.0 °C in the northwestern portion of the domain.
Figure 9.
Same as Figure 7 for the TXx index.
Sub-regional projections of the TXx index exhibit a clear warming trend that depends on both the emissions scenario and time horizon (Table 4). The SP sub-region shows increases ranging from 1.4 °C to 2.7 °C under the RCP4.5 scenario, increasing to 2.0–5.2 °C under the RCP8.5. In comparison, the TDF sub-region shows moderate increases in TXx, ranging from 1.0 °C to 1.8 °C under the RCP4.5 scenario and from 1.2 °C to 3.1 °C under the RCP8.5. It is also noteworthy that inter-model uncertainty decreases for the late-century projections.
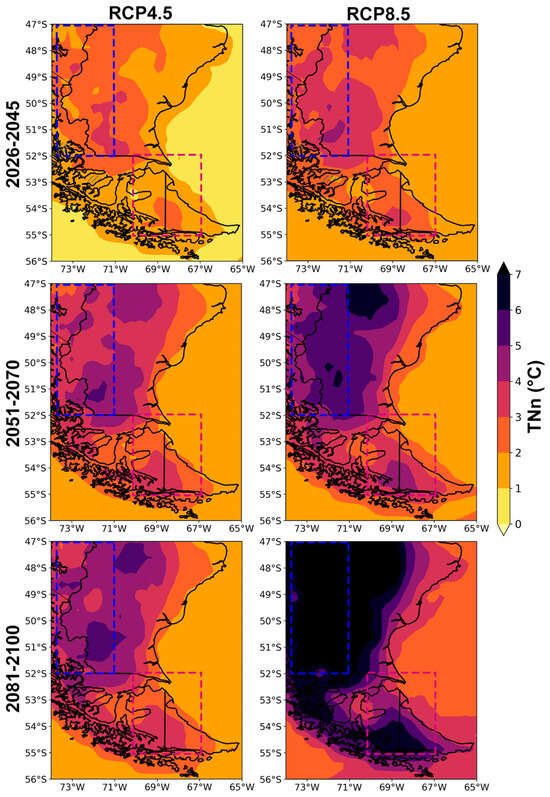
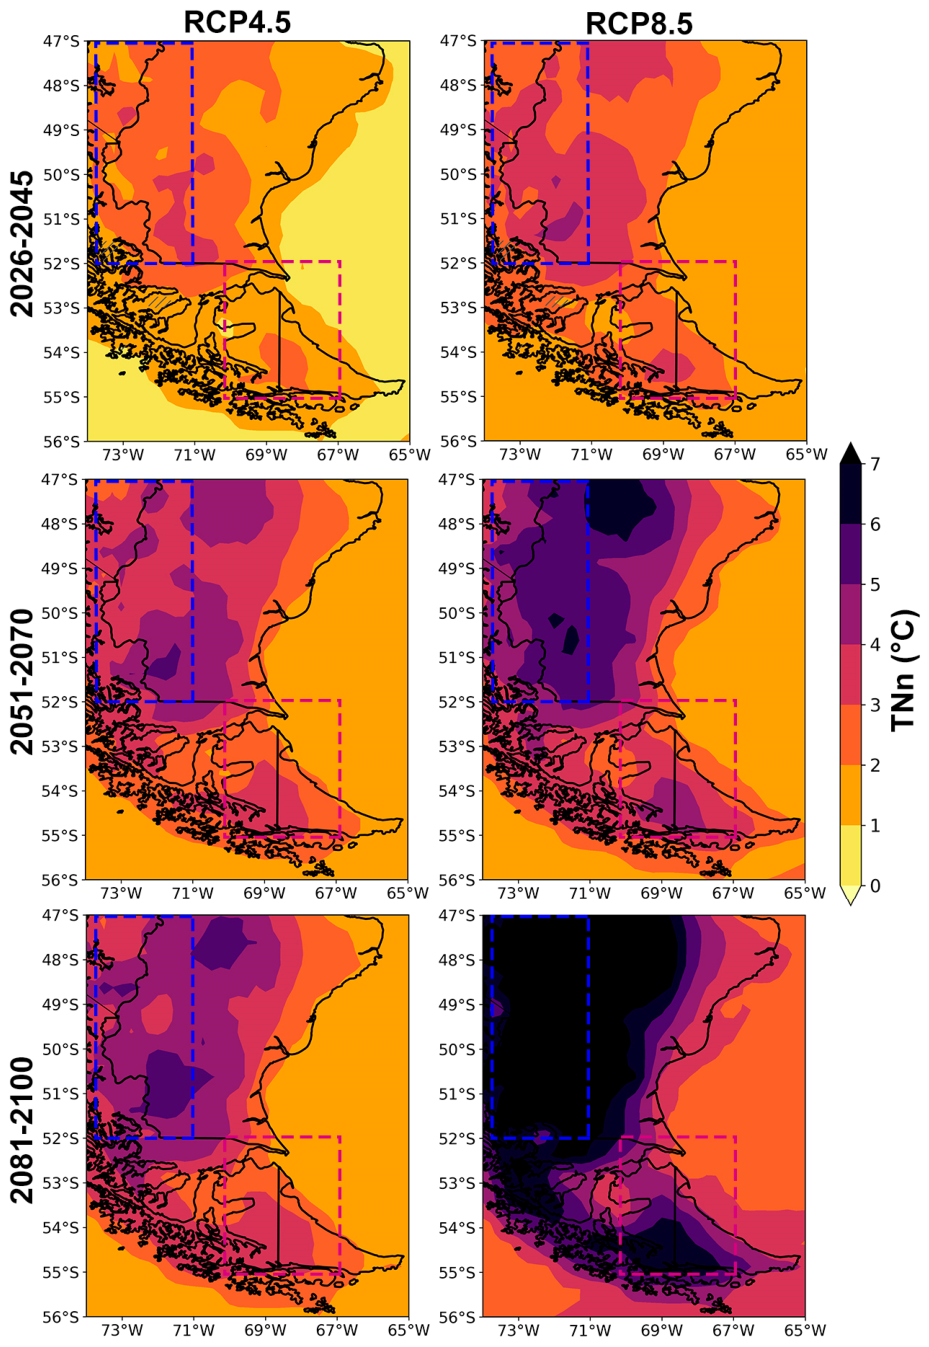
Future projections of the TNn index also indicate increases that depend on the selected time horizon and emissions scenario (Figure 10), although with substantially larger magnitudes than those projected for the TXx index. This result suggests that the projected increase in mean temperature is primarily driven by the future changes in minimum temperature. It is noteworthy that the projected changes exhibit similar spatial patterns across all combinations of time horizons and scenarios, although their magnitude varies considerably. Under the RCP4.5 scenario, most of the study area exhibits increases in TNn exceeding 1.0 °C during the 2026–2045 period, with some areas of the southern Patagonian steppe showing increases of 2.0–3.0 °C. Future projections for the mid-future show increases that exceed 3.0 °C across much of the study area, particularly north of 53° S. A similar spatial pattern is projected for the 2081–2100 time horizon, although with larger magnitudes and localized areas where increases exceed 4.0 °C. Under the RCP8.5 scenario, the magnitude of the projected changes increases markedly relative to the moderate emissions scenario, with large portions of the study area exhibiting warming exceeding 2.0 °C during the near-future period. The warming signal intensifies by the mid-future, with increases exceeding 5.0 °C across large portions of the domain, particularly north of 52° S. The TNn for the 2081–2100 period is projected to increase by more than 7.0 °C across extensive areas of the study region, especially over SP and the southwestern portion of TDF.
Figure 10.
Same as Figure 7 for the TNn index.
Sub-regional mean changes in TNn are summarized in Table 4. Despite the high-latitude location of the study area, the projected increases in this temperature index are remarkably large. The SP sub-region shows increases ranging from 2.2 °C to 4.3 °C under the RCP4.5 scenario, increasing to 3.5–7.5 °C under the RCP8.5 scenario. The TDF sub-region shows smaller increases in TNn, although the projected warming still exceeds that obtained for the TXx index. Under RCP4.5, projected increases range from 1.2 °C to 3.4 °C, whereas the high-emissions scenario projects a range of warming between 1.9 °C to 4.1 °C.
4. Discussion
Climate change represents one of the greatest challenges for Southern South America, where the observed warming trend has led to significant glacier mass loss and alterations in the hydrological patterns of the region [1,58]. For instance, the Martial South Glacier, located in Tierra Del Fuego, was declared extinct in 2024 [59]. These changes highlight the need for adequate and tailored climate information, which can only be achieved through the use of RCMs given the strong climatic gradients and complex topography of the region. For example, Hodnebrog et al. [60] analyzed climate simulations for the Andes Mountains based on a downscaling process applied to a set of GCMs, warning that the direct use of GCM outputs may lead to erroneous conclusions regarding regional-scale precipitation projections. For this reason, we used climate simulations from a selection of 5 RCMs from the CORDEX project, with focus on the projected evolution of a set of climate extreme indices.
In general, our results indicate a large uncertainty in the projected changes in precipitation extremes, consistent with previous studies and highlighting the role of the differences among RCM simulations and the influence of the drivers of seasonal and interannual variability [17]. The projected reduction in mean annual precipitation over the northwestern portion of the study area can be partially explained by the changes in the R20mm index, which exhibit robust reductions under all the combinations of time horizons and emissions scenarios. The projected precipitation signal over the Patagonian steppe seems to be modulated by the changes in extreme precipitation accumulations at the 1- and 5-day timescales, where robust responses are identified. However, as shown by Lagos-Zuñiga et al. [19], uncertainties associated with the individual model simulations remain substantial across the region. Projected changes in the CDD index also depend on the selected time horizon and emissions scenario, although the magnitude of the changes is generally small and consistent with previous findings for the region [19].
Temperature extremes exhibit robust changes in response to the projected regional warming signal. In particular, the widespread robust reduction in the frequency of FD is consistent with the marked increase projected for the TNn index, which substantially exceeds the projected changes in TXx. This result highlights the dominant role of increasing minimum temperatures in driving the projected rise in mean temperature and suggests future reductions in other temperature-related indices, such as the extreme temperature range (ETR), as documented for the Northern Hemisphere [61], and the diurnal temperature range (DTR) [62]. Changes in DTR have been linked to several factors, including increased cloud cover, specific humidity and precipitation [63], while aerosols and greenhouse gases also playing a relevant role [64]. Climatic factors, particularly those associated with temperature, are the most relevant for explaining the distribution of vegetation species in the study area, and the soil organic carbon content in Patagonian forests [65,66]. Consequently, climate change is expected to affect not only the regional cryosphere through enhanced ice loss and surface melt [21], but also the biodiversity and its ecosystemic services can experience negative impacts in the future. Consistent with the projected warming signal across the region, robust increases are projected for the SU, particularly over the northeastern portion of the Patagonian steppe. This index was highlighted as being relevant to human, animal and vegetation health [67,68]. The observed increases across Southern South America are in line with the global evaluation performed by Tye et al. [68] based on the RCP8.5 scenario. Consistent with findings for high-latitude regions of the Northern Hemisphere [69], the projected increases in both the SU and TXx indices may have important implications for human populations in Southern South America, despite the absence of a projected increase in heatwave exposure across the region [70]. This is due to the lack of adaptation measures to high temperatures, where populations are generally not prepared or acclimatized to cope with increasing thermal stress.
Given the projected changes in temperature and precipitation extremes at the higher elevations of the Andes Mountains, it is essential to assess future changes in the regional cryosphere and their implications for the hydrological cycle. Such information would provide a valuable input for regionally calibrated hydrological models, enabling more robust projections of future water availability under the combined effects of declining precipitation and increasing temperatures throughout the 21st century.
5. Conclusions
We quantified the projected impacts of climate change on a suite of temperature- and precipitation-based climate extreme indices across the southern tip of South America. This region is recognized as a biodiversity hotspot, encompassing temperate forests, steppe ecosystems, peatlands, fjords, and marine environments that support numerous endemic and threatened species. It also contains one of the world’s largest freshwater reserves in the Patagonian Icefields, making climate change a major threat to both natural ecosystems and human populations. Given the complex topography and strong climatic gradients that characterize the region, future changes were assessed using simulations from the CORDEX RCMs outputs.
The robust projected decrease in the number of days with precipitation exceeding 20 mm, particularly over the western portion of the SP sub-region, partially explains the projected drying trend across the region. A similar signal is evident in the R75p index, although only under the mid-future RCP4.5 and far-future RCP8.5 scenarios, and with substantial uncertainty, as also reflected in the projected changes in the CDD index. In contrast, the RX1 and RX5 indices sow widespread increases, indicating a shift toward more frequent and more intense heavy precipitation events, particularly across the Patagonian steppe.
The warming signal across the study area is reflected in the robust projected increases in the TXx and TNn indices, particularly north of 53° S. The projected increase in TNn substantially exceeds that of TXx, indicating that changes in minimum temperatures will be the primary driver of the intensification of temperature extremes across the study area. Under the high-emissions scenario, increases in TNn may exceed 7 °C in the far-future, while TXx is projected to increase by up to 5 °C relative to the 1986–2005 baseline period. The projected decline in the number of frost days is consistent with the increase in TNn, with reductions exceeding 60 days across most of the region under the high-emissions scenario by the end of the century. These changes have important implications for the regional cryosphere, particularly the Patagonian Icefields and its future hydrological regulation. In addition, an emerging trend in the summer days is projected over SP, although the strongest changes are concentrated in the northeastern portion of the Patagonian steppe, with increases up to 30 days by the end of the century. This emerging hotspot of warming may increase health-related risks for populations living in coastal areas by the end of the century.
Our results demonstrate the importance of high-resolution regional climate simulations for characterizing future changes in climate extremes across the complex climatic gradients of Southern South America. The projected intensification of temperature extremes and changes in precipitation regimes may have profound consequences for glacier dynamics, freshwater availability, ecosystem functioning, and regional socioeconomic activities, underscoring the need for adaptation planning and integrated water-resource management.
Author Contributions
Conceptualization, J.A.R. and G.M.; methodology, J.A.R. and G.M.; software, G.M.; validation, G.M.; formal analysis, J.A.R. and G.M.; investigation, J.A.R. and G.M.; resources, J.A.R.; data curation, G.M.; writing—original draft preparation, J.A.R.; writing—review and editing, J.A.R. and G.M.; visualization, G.M.; supervision, J.A.R. All authors have read and agreed to the published version of the manuscript.
Funding
This research received no external funding.
Institutional Review Board Statement
Not applicable.
Informed Consent Statement
Not applicable.
Data Availability Statement
CORDEX simulations were obtained through the Earth System Grid Federation (https://esgf-metagrid.cloud.dkrz.de/search, accessed on 13 January 2025).
Acknowledgments
We acknowledge the World Climate Research Programme, which coordinated and promoted CORDEX. We thank the climate modeling groups for producing and making available their model output, the Earth System Grid Federation (ESGF) for archiving the data and providing access.
Conflicts of Interest
The authors declare no conflicts of interest.
Appendix A
Figure A1.
Spatial pattern of mean annual precipitation simulated by the multi-model ensemble of selected RCMs for the period 1986–2005.
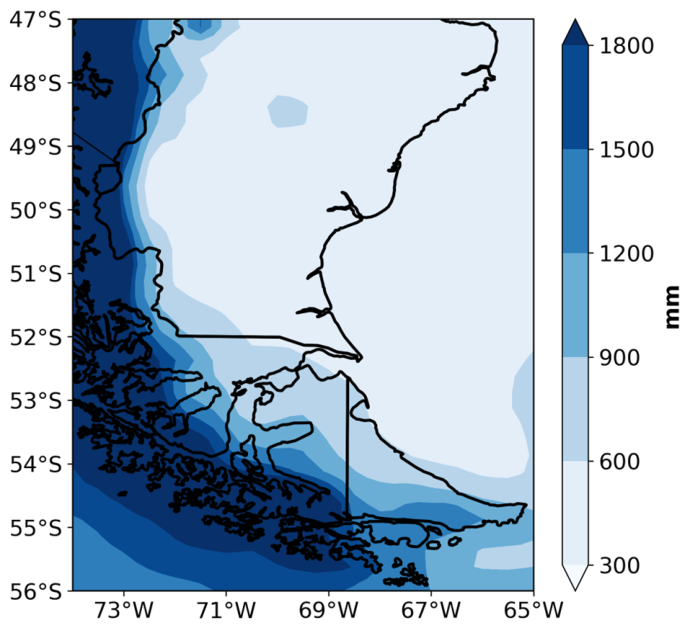
Figure A2.
Spatial pattern of mean annual temperature simulated by the multi-model ensemble of selected RCMs for the period 1986–2005.
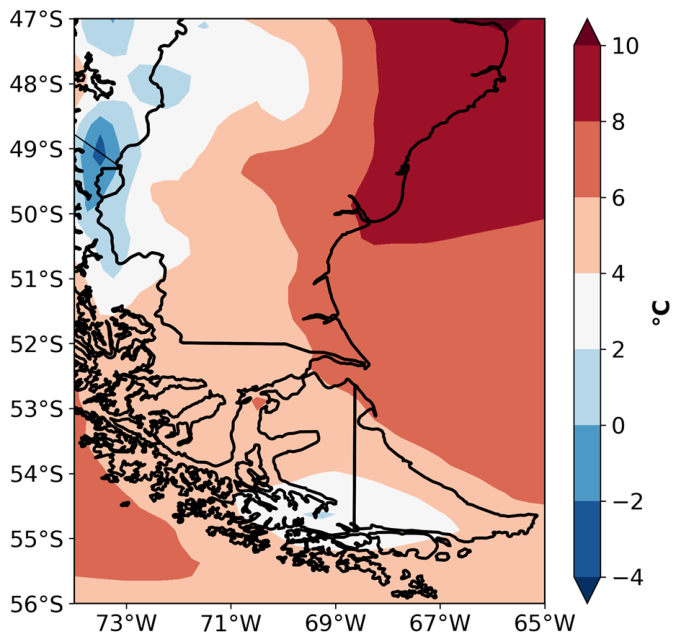
Figure A3.
Projected changes in annual precipitation totals (%) derived from the CORDEX multi-model ensemble for the RCP4.5 (left panels) and RCP8.5 (right panels) scenarios for the time periods 2026–2045 (top panels), 2051–2070 (middle panels), and 2081–2100 (bottom panels), relative to the 1986–2005 baseline period. Blue dotted boxes represent the location of SP region, while magenta dotted boxes represent the location of the TDF region. Areas without dots indicate robust signals, where at least 80% of the models agree on the sign of change. Diagonal lines indicate regions with no significant change at 90% confidence level. Dashed boxes indicate the selected sub-regions.
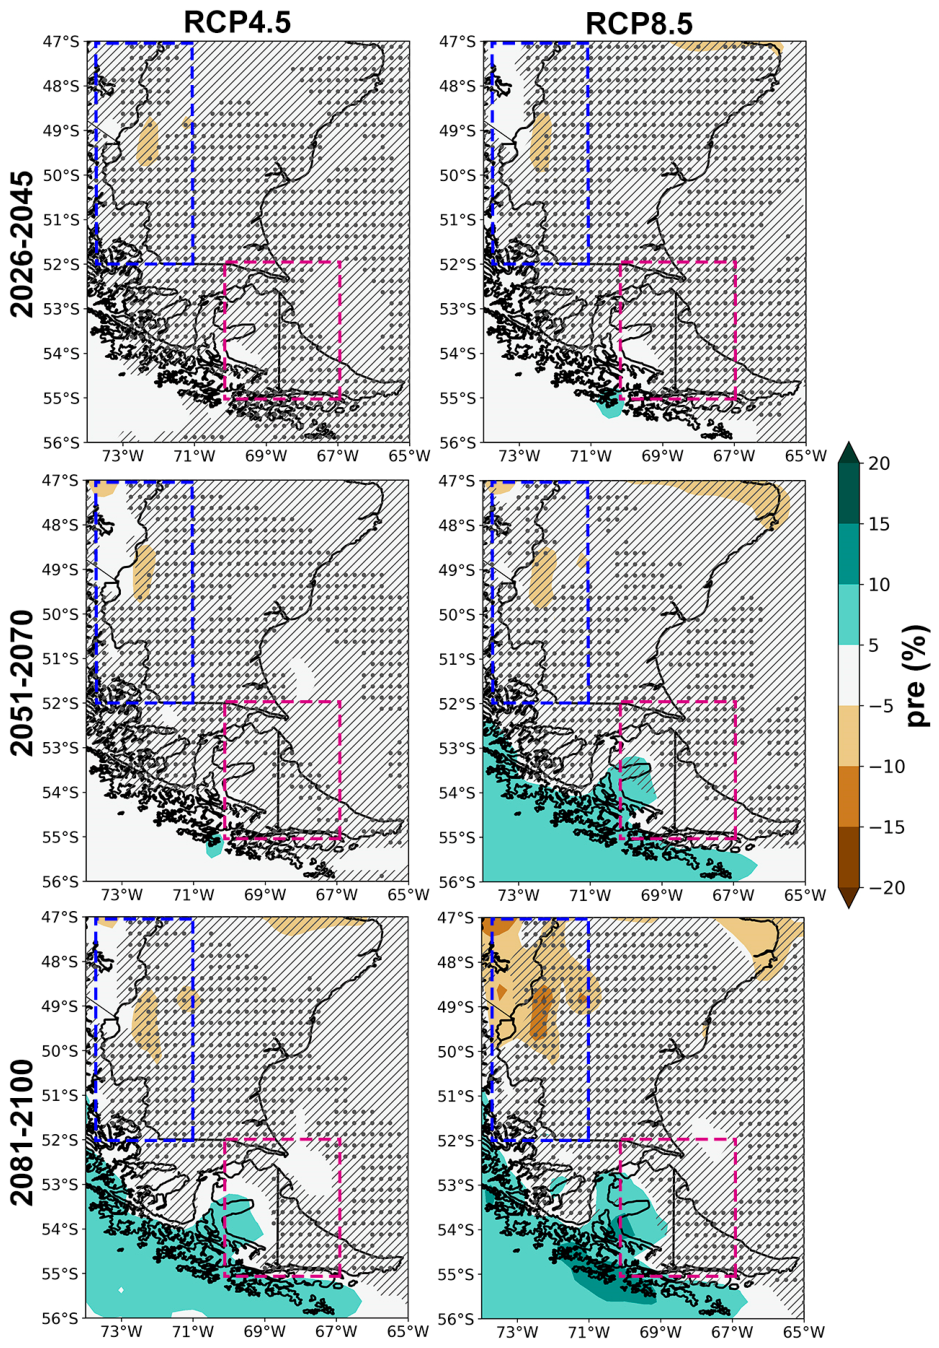
Figure A4.
Same as Figure A3 for the projected changes in annual temperature (°C).
References
- Richter, A.; Groh, A.; Horwath, M.; Ivins, E.; Marderwald, E.; Hormaechea, J.L.; Perdomo, R.; Dietrich, R. The Rapid and Steady Mass Loss of the Patagonian Icefields throughout the GRACE Era: 2002–2017. Remote Sens. 2019, 11, 909. [Google Scholar] [CrossRef] [Scilit]
- Noël, B.; Lhermitte, S.; Wouters, B.; Fettweis, X. Poleward shift of subtropical highs drives Patagonian glacier mass loss. Nat. Commun. 2025, 16, 3795. [Google Scholar] [CrossRef] [Scilit] [PubMed]
- Carrasco-Escaff, T.; Rojas, M.; Garreaud, R.D.; Bozkurt, D.; Schaefer, M. Climatic control of the surface mass balance of the Patagonian Icefields. Cryosphere 2023, 17, 1127–1149. [Google Scholar] [CrossRef] [Scilit]
- Jia, L.; Rodríguez Souilla, J.; Lencinas, M.V.; Peri, P.L.; Li, X.; Wu, W.; Martínez Pastur, G.J. Vegetation type, landscape and climate define vegetation water content: Implications for sustainable management at Southern Patagonia. Environ. Res. Lett. 2026, 21, 034002. [Google Scholar] [CrossRef] [Scilit]
- Bianchi, L.O.; Villalba, R.; Oddi, F.J.; Mundo, I.A.; Radins, M.; Amoroso, M.M.; Srur, A.M.; Bonada, A. Climate, landscape, and human influences on fire in southern Patagonia: A basin-scale approach. For. Ecol. Manag. 2023, 539, 121015. [Google Scholar] [CrossRef] [Scilit]
- Martinuzzi, S.; Olah, A.M.; Rivera, L.; Politi, N.; Silveira, E.M.O.; Pastur, G.M.; Rosas, Y.M.; Lizarraga, L.; Názaro, P.; Bardavid, S.; et al. Closing the research-implementation gap: Integrating species and human footprint data into Argentina’s forest planning. Biol. Conserv. 2023, 286, 110257. [Google Scholar] [CrossRef] [Scilit]
- Feron, S.; Cordero, R.R.; Damiani, A.; MacDonell, S.; Pizarro, J.; Goubanova, K.; Valenzuela, R.; Wang, C.; Rester, L.; Beaulieu, A. South America is becoming warmer, drier, and more flammable. Commun. Earth Environ. 2024, 5, 501. [Google Scholar] [CrossRef] [Scilit]
- Bravo, C.; Bozkurt, D.; Gonzalez-Reyes, Á.; Quincey, D.J.; Ross, A.N.; Farías-Barahona, D.; Rojas, M. Assessing Snow Accumulation Patterns and Changes on the Patagonian Icefields. Front. Environ. Sci. 2019, 7, 30. [Google Scholar] [CrossRef] [Scilit]
- Bravo, C.; Bozkurt, D.; Ross, A.N.; Quincey, D.J. Projected increases in surface melt and ice loss for the Northern and Southern Patagonian Icefields. Sci. Rep. 2021, 11, 16847. [Google Scholar] [CrossRef] [Scilit] [PubMed]
- Gómez-Fontealba, C.; Flores-Aqueveque, V.; Alfaro, S.C. Teleconnection between the Surface Wind of Western Patagonia and the SAM, ENSO, and PDO Modes of Variability. Atmosphere 2023, 14, 608. [Google Scholar] [CrossRef] [Scilit]
- The GlaMBIE Team. Community estimate of global glacier mass changes from 2000 to 2023. Nature 2025, 639, 382–388. [Google Scholar] [CrossRef] [Scilit] [PubMed]
- Minowa, M.; Skvarca, P.; Fujita, K.; Naito, N.; Sugiyama, S. Triggering mechanisms of dynamic mass loss at a freshwater-calving glacier in southern Patagonia. Earth Planet. Sci. Lett. 2026, 681, 119930. [Google Scholar] [CrossRef] [Scilit]
- Barnes, C.; Keeping, T.; Rivera, J.A.; Pessacg, N.L.; Garreaud, R.; Zazhariah, M.; Clarke, B.; Rojas Corradi, M.; Kadhasanoglu, A.; Mejía, A.; et al. Climate Change Fuels the Destruction of World’s Oldest Trees; WWA scientific report No. 82; World Weather Attribution: London, UK, 2026. [Google Scholar] [CrossRef] [PubMed]
- Gutowski, W.J.; Ullrich, P.A.; Hall, A.; Leung, L.R.; O’Brien, T.A.; Patricola-DiRosario, C.M.; Arritt, R.W.; Bukovsky, M.S.; Calvin, K.V.; Feng, Z.; et al. The Ongoing Need for High-Resolution Regional Climate Models: Process Understanding and Stakeholder Information. Bull. Amer. Meteor. Soc. 2020, 101, E664–E683. [Google Scholar] [CrossRef] [Scilit]
- Cavazos, T.; Bettolli, M.L.; Campbell, D.; Sánchez Rodríguez, R.A.; Mycoo, M.; Arias, P.A.; Rivera, J.; Reboita, M.S.; Gulizia, C.; Hidalgo, H.G.; et al. Challenges for climate change adaptation in Latin America and the Caribbean region. Front. Clim. 2024, 6, 1392033. [Google Scholar] [CrossRef] [Scilit]
- Junquas, C.; Martinez, J.A.; Bozkurt, D.; Viale, M.; Fita, L.; Trachte, K.; Campozano, L.; Arias, P.A.; Boisier, J.P.; Condom, T.; et al. Recent progress in atmospheric modeling over the Andes—part II: Projected changes and modeling challenges. Front. Earth Sci. 2024, 12, 1427837. [Google Scholar] [CrossRef] [Scilit]
- Llopart, M.; Simões Reboita, M.; Porfírio da Rocha, R. Assessment of multi-model climate projections of water resources over South America CORDEX domain. Clim. Dyn. 2019, 54, 99–116. [Google Scholar] [CrossRef] [Scilit]
- Cabré, M.F.; Solman, S.; Núñez, M. Regional climate change scenarios over southern South America for future climate (2080–2099) using the MM5 Model. Mean, interannual variability and uncertainties. Atmósfera 2016, 29, 35–60. [Google Scholar] [CrossRef] [Scilit]
- Lagos-Zúñiga, M.; Balmaceda-Huarte, R.; Regoto, P.; Torrez, L.; Olmo, M.; Lyra, A.; Pareja-Quispe, D.; Bettolli, M.L. Extreme indices of temperature and precipitation in South America: Trends and intercomparison of regional climate models. Clim. Dyn. 2024, 62, 4541–4562. [Google Scholar] [CrossRef] [Scilit]
- Olmo, M.E.; Weber, T.; Teichmann, C.; Bettolli, M.L. Compound events in South America using the CORDEX-CORE ensemble: Current climate conditions and future projections in a global warming scenario. J. Geophys. Res. Atmos. 2022, 127, e2022JD037708. [Google Scholar] [CrossRef] [Scilit]
- Ranasinghe, R.; Ruane, A.C.; Vautard, R.; Arnell, N.; Coppola, E.; Cruz, F.A.; Dessai, S.; Islam, A.S.; Rahimi, M.; Ruiz Carrascal, D.; et al. Climate Change Information for Regional Impact and for Risk Assessment. Central and South America. In Climate Change 2021: The Physical Science Basis. Contribution of Working Group I to the Sixth Assessment Report of the Intergovernmental Panel on Climate Change; Masson-Delmotte, V., Zhai, P., Pirani, A., Connors, S.L., Péan, C., Berger, S., Caud, N., Chen, Y., Goldfarb, L., Gomis, M.I., et al., Eds.; Cambridge University Press: Cambridge, UK; New York, NY, USA, 2021; pp. 1767–1926. [Google Scholar] [CrossRef] [Scilit]
- Arias, P.A.; Rivera, J.A.; Vera, C.S. Projections of Climate Change in South America. Oxf. Res. Encycl. Clim. Sci. 2024; in press. [CrossRef] [Scilit]
- Viale, M.; Bianchi, E.; Cara, L.; Ruiz, L.E.; Villalba, R.; Pitte, P.; Masiokas, M.; Rivera, J.A.; Zalazar, L. Contrasting climates at both sides of the Andes in Argentina and Chile. Front. Environ. Sci. 2019, 7, 69. [Google Scholar] [CrossRef] [Scilit]
- Sauter, T. Revisiting extreme precipitation amounts over southern South America and implications for the Patagonian Icefields. Hydrol. Earth Syst. Sci. 2020, 24, 2003–2016. [Google Scholar] [CrossRef] [Scilit]
- Garreaud, R.N.; Vuille, M.; Compagnucci, R.; Marengo, J. Present-day South American climate. Palaeogeogr. Palaeoclimatol. Palaeoecol. 2009, 281, 180–195. [Google Scholar] [CrossRef] [Scilit]
- Garreaud, R.; Lopez, P.; Minvielle, M.; Rojas, M. Large-Scale Control on the Patagonian Climate. J. Clim. 2013, 26, 215–230. [Google Scholar] [CrossRef] [Scilit]
- Iturbide, M.; Gutiérrez, J.M.; Alves, L.M.; Bedia, J.; Cerezo-Mota, R.; Cimadevilla, E.; Cofiño, A.S.; Di Luca, A.; Faria, S.H.; Gorodetskaya, I.V.; et al. An update of IPCC climate reference regions for subcontinental analysis of climate model data: Definition and aggregated datasets. Earth Syst. Sci. Data 2020, 12, 2959–2970. [Google Scholar] [CrossRef] [Scilit]
- Zalazar, L.; Ferri, L.; Castro, M.; Gargantini, H.; Gimenez, M.; Pitte, P.; Ruiz, L.; Masiokas, M.; Costa, G.; Villalba, R. Spatial distribution and characteristics of Andean ice masses in Argentina: Results from the first National Glacier Inventory. J. Glaciol. 2020, 66, 938–949. [Google Scholar] [CrossRef] [Scilit]
- Masiokas, M.H.; Cara, L.; Villalba, R.; Pitte, P.; Luckman, B.H.; Toum, E.; Christie, D.A.; Le Quesne, C.; Mauget, S. Streamflow variations across the Andes (18–55° S) during the instrumental era. Sci. Rep. 2019, 9, 17879. [Google Scholar] [CrossRef] [Scilit] [PubMed]
- Giorgi, F. Thirty years of regional climate modeling: Where are we and where are we going next? J. Geophys. Res. Atmos. 2019, 124, 5696–5723. [Google Scholar] [CrossRef] [Scilit]
- Taylor, K.E.; Stouffer, R.J.; Meehl, G.A. An Overview of CMIP5 and the Experiment Design. Bull. Amer. Meteor. Soc. 2012, 93, 485–498. [Google Scholar] [CrossRef] [Scilit]
- Region 1: South America. Available online: https://cordex.org/domains/cordex-region-south-america-cordex/ (accessed on 24 July 2026).
- Almazroui, M.; Ashfaq, M.; Islam, M.N.; Rashid, I.U.; Shahzad, K.; Abid, M.A.; O’Brien, E.; Ismail, M.; Reboita, M.S.; Sörensson, A.A.; et al. Assessment of CMIP6 models performance and projected temperature and precipitation changes over South America. Earth Syst. Environ. 2021, 5, 155–183. [Google Scholar] [CrossRef] [Scilit]
- Li, Y.; Yan, D.; Peng, H.; Xiao, S. Evaluation of precipitation in CMIP6 over the Yangtze River Basin. Atmos. Res. 2020, 253, 105406. [Google Scholar] [CrossRef] [Scilit]
- Yue, Y.; Yan, D.; Yue, Q.; Ji, G.; Wang, Z. Future changes in precipitation and temperature over the Yangtze River Basin in China based on CMIP6 GCMs. Atmos. Res. 2021, 264, 105828. [Google Scholar] [CrossRef] [Scilit]
- Warscher, M.; Wagner, S.; Marke, T.; Laux, P.; Smiatek, G.; Strasser, U.; Kunstmann, H. A 5 km Resolution Regional Climate Simulation for Central Europe: Performance in High Mountain Areas and Seasonal, Regional and Elevation-Dependent Variations. Atmosphere 2019, 10, 682. [Google Scholar] [CrossRef] [Scilit]
- Shiru, M.S.; Chung, E.S. Performance evaluation of CMIP6 global climate models for selecting models for climate projection over Nigeria. Theor. Appl. Climatol. 2021, 146, 599–615. [Google Scholar] [CrossRef] [Scilit]
- Shimizu, M.H.; Anochi, J.A.; Santos, D.J. Assessing NOAA/GFDL Models Performance for South American Seasonal Climate: Insights from CMIP6 Historical Runs and Future Projections. Climate 2025, 13, 4. [Google Scholar] [CrossRef] [Scilit]
- Harris, I.; Osborn, T.J.; Jones, P.; Lister, D. Version 4 of the CRU TS monthly high-resolution gridded multivariate climate dataset. Sci. Data 2020, 7, 109. [Google Scholar] [CrossRef] [Scilit] [PubMed]
- Rivera, J.A.; Arnould, G. Evaluation of the ability of CMIP6 models to simulate precipitation over Southwestern South America: Climatic features and long-term trends (1901–2014). Atmos. Res. 2020, 241, 104953. [Google Scholar] [CrossRef] [Scilit]
- Varuolo-Clarke, A.M.; Williams, A.P.; Smerdon, J.E.; Ting, M.; Bishop, D.A. Influence of the South American low-level jet on the austral summer precipitation trend in southeastern South America. Geophys. Res. Lett. 2022, 49, e2021GL096409. [Google Scholar] [CrossRef] [Scilit]
- Falco, M.; Carril, A.F.; Menéndez, C.G.; Zaninelli, P.G.; Li, L.Z.X. Assessment of CORDEX simulations over South America: Added value on seasonal climatology and resolution considerations. Clim. Dyn. 2019, 52, 4771–4786. [Google Scholar] [CrossRef] [Scilit]
- Marianetti, G.; Rivera, J.A.; Bettolli, M.L. Evaluation and selection of CMIP6 GCMs for the characterization of temperature and precipitation in Central-Western Argentina. Theor. Appl. Climatol. 2024, 155, 8185–8207. [Google Scholar] [CrossRef] [Scilit]
- Zazulie, N.; Rusticucci, M.; Raga, G.B. Regional climate of the subtropical central Andes using high-resolution CMIP5 models—Part I: Past performance (1980–2005). Clim. Dyn. 2017, 49, 3937–3957. [Google Scholar] [CrossRef] [Scilit]
- Marianetti, G.; Rivera, J.A.; Bettolli, M.L. A dry and warm future projected by Regional Climate Models in the Andes Mountains of Argentina. Earth Syst. Environ. 2026, 10, 7677–7699. [Google Scholar] [CrossRef] [Scilit]
- Kjellström, A.; Bärring, L.; Nikulin, G.; Nilsson, C.; Persson, G.; Strandberg, G. Production and use of regional climate model projections—A Swedish perspective on building climate services. Clim. Serv. 2016, 2–3, 15–29. [Google Scholar] [CrossRef] [Scilit] [PubMed]
- Jacob, D.; Podzun, R. Sensitivity studies with the regional climate model REMO. Meteorl. Atmos. Phys. 1997, 63, 119–129. [Google Scholar] [CrossRef] [Scilit]
- Giorgi, F.; Coppola, E.; Solmon, F.; Mariotti, L.; Sylla, M.B.; Bi, X.; Elguindi, N.; Diro, G.T.; Nair, V.; Giuliani, G.; et al. RegCM4: Model description and preliminary tests over multiple CORDEX domains. Clim. Res. 2012, 52, 7–29. [Google Scholar] [CrossRef] [Scilit]
- Pastén-Zapata, E.; Jones, J.M.; Moggridge, H.; Widmann, M. Evaluation of the performance of Euro-CORDEX Regional Climate Models for assessing hydrological climate change impacts in Great Britain: A comparison of different spatial resolutions and quantile mapping bias correction methods. J. Hydrol. 2020, 584, 124653. [Google Scholar] [CrossRef] [Scilit]
- Guo, J.; Huang, G.; Wang, X.; Wu, Y.; Li, Y.; Zheng, R.; Song, L. Evaluating the added values of regional climate modeling over China at different resolutions. Sci. Total Environ. 2020, 718, 137350. [Google Scholar] [CrossRef] [Scilit] [PubMed]
- Ortega, G.; Arias, P.A.; Villegas, J.C.; Marquet, P.A.; Nobre, P. Present-day and future climate over central and South America according to CMIP5/CMIP6 models. Int. J. Climatol. 2021, 41, 6713–6735. [Google Scholar] [CrossRef] [Scilit]
- Cui, T.; Li, C.; Tian, F. Evaluation of temperature and precipitation simulations in CMIP6 models over the Tibetan Plateau. Earth Space Sci. 2021, 8, e2020EA001620. [Google Scholar] [CrossRef] [Scilit]
- Liang-Liang, L.; Jian, L.; Ru-Cong, Y. Evaluation of CMIP6 HighResMIP models in simulating precipitation over Central Asia. Adv. Clim. Chang. Res. 2022, 13, 1–13. [Google Scholar] [CrossRef] [Scilit]
- Thomson, A.M.; Calvin, K.V.; Smith, S.J.; Page Kyle, G.; Volke, A.; Patel, P.; Delgado-Arias, S.; Bond-Lamberty, B.; Wise, M.A.; Clarke, L.E.; et al. RCP4.5: A pathway for stabilization of radiative forcing by 2100. Clim. Chang. 2011, 109, 77. [Google Scholar] [CrossRef] [Scilit]
- Riahi, K.; Rao, S.; Krey, V.; Cho, C.; Chirkov, V.; Fischer, G.; Kindermann, G.; Nakicenovic, N.; Rafaj, P. RCP 8.5—A scenario of comparatively high greenhouse gas emissions. Clim. Chang. 2011, 109, 33. [Google Scholar] [CrossRef] [Scilit]
- Zhang, X.; Alexander, L.; Hegerl, G.C.; Jones, P.; Tank, A.K.; Peterson, T.C.; Trewin, B.; Zwiers, F.W. Indices for monitoring changes in extremes based on daily temperature and precipitation data. WIREs Clim. Chang. 2011, 2, 851–870. [Google Scholar] [CrossRef] [Scilit]
- Ruane, A.C.; Vautard, R.; Ranasinghe, R.; Sillmann, J.; Coppola, E.; Arnell, N.; Cruz, F.A.; Dessai, S.; Iles, C.E.; Saiful Islam, A.K.M.; et al. The Climatic Impact-Driver Framework for assessment of risk-relevant climate information. Earth’s Future 2022, 10, e2022EF002803. [Google Scholar] [CrossRef] [Scilit] [PubMed]
- Isla, F.I.; Isla, M.F. The fate of the Patagonian rivers: Fluvial captures and climate trends. Acta Geológica Lilloana 2024, 35, 167–185. [Google Scholar] [CrossRef] [Scilit] [PubMed]
- World Meteorological Organization (WMO). State of the Climate in Latin America and the Caribbean 2024; WMO: Geneva, Switzerland, 2025; 26p. [Google Scholar]
- Hodnebrog, Ø.; Steensen, B.M.; Marelle, L.; Alterskjær, K.; Dalsøren, S.B.; Myhre, G. Understanding model diversity in future precipitation projections for South America. Clim. Dyn. 2022, 58, 1329–1347. [Google Scholar] [CrossRef] [Scilit]
- Feng, X.-F.; Qian, C. Detection, attribution and projection of changes in the extreme temperature range in the Northern Hemisphere. Adv. Clim. Chang. Res. 2024, 15, 989–1002. [Google Scholar] [CrossRef] [Scilit]
- Braganza, K.; Karoly, D.J.; Arblaster, J.M. Diurnal temperature range as an index of global climate change during the twentieth century. Geophys. Res. Lett. 2004, 31, L13217. [Google Scholar] [CrossRef] [Scilit]
- Cox, D.T.C.; Maclean, I.M.D.; Gardner, A.S.; Gaston, K.J. Global variation in diurnal asymmetry in temperature, cloud cover, specific humidity and precipitation and its association with leaf area index. Glob. Change Biol. 2020, 26, 7099–7111. [Google Scholar] [CrossRef] [Scilit] [PubMed]
- Stjern, C.W.; Samset, B.H.; Boucher, O.; Iversen, T.; Lamarque, J.-F.; Myhre, G.; Shindell, D.; Takemura, T. How aerosols and greenhouse gases influence the diurnal temperature range. Atmos. Chem. Phys. 2020, 20, 13467–13480. [Google Scholar] [CrossRef] [Scilit]
- Allué, C.; Arranz, J.; Bava, J.; Beneitez, J.; Collado, L.; García López, L. Phytoclimatic characterization and cartography of subantarctic native forests in Isla Grande de Tierra del Fuego (Patagonia, Argentina). For. Syst. 2010, 19, 189–207. [Google Scholar] [CrossRef] [Scilit]
- Martínez Pastur, G.J.; Cellini, J.M.; Lencinas, M.V.; Rosas, Y.M.; Henn, J.J.; Peri, P.L. Landscape Variables Influence over Active Restoration Strategies of Nothofagus Forests Degraded by Invasive Castor canadensis in Tierra del Fuego. Sustainability 2021, 13, 7541. [Google Scholar] [CrossRef] [Scilit]
- Dunn, R.J.H.; Herold, N.; Alexander, L.V.; Donat, M.G.; Allan, R.; Bador, M.; Brunet, M.; Cheng, V.; Ibadullah, W.M.W.; Ibrahim, M.K.I.B.; et al. Observed global changes in sector-relevant climate extremes indices—An extension to HadEX3. Earth Space Sci. 2024, 11, e2023EA003279. [Google Scholar] [CrossRef] [Scilit]
- Tye, M.R.; Dagon, K.; Molina, M.J.; Richter, J.H.; Visioni, D.; Kravitz, B.; Tilmes, S. Indices of extremes: Geographic patterns of change in extremes and associated vegetation impacts under climate intervention. Earth Syst. Dynam. 2022, 13, 1233–1257. [Google Scholar] [CrossRef] [Scilit]
- Walsh, J.E.; Redilla, K.; Shippee, N.; Cheung, L.; Bigelow, D.; Wilcock, R. Projected Changes in Extreme Event Indices for Alaska. Atmos. Clim. Sci. 2024, 14, 191–209. [Google Scholar] [CrossRef]
- Ramarao, M.V.S.; Arunachalam, S.; Sánchez, B.N.; Schinasi, L.H.; Bakhtsiyarava, M.; Caiaffa, W.T.; Dronova, I.; O’Neill, M.S.; Avila-Palencia, I.; Gouveia, N.; et al. Projected changes in heatwaves over Central and South America using high-resolution regional climate simulations. Sci. Rep. 2024, 14, 23145. [Google Scholar] [CrossRef] [Scilit] [PubMed]

Disclaimer/Publisher’s Note: The statements, opinions and data contained in all publications are solely those of the individual author(s) and contributor(s) and not of MDPI and/or the editor(s). MDPI and/or the editor(s) disclaim responsibility for any injury to people or property resulting from any ideas, methods, instructions or products referred to in the content. |
© 2026 by the authors. Licensee MDPI, Basel, Switzerland. This article is an open access article distributed under the terms and conditions of the Creative Commons Attribution (CC BY) license.