Article

Impact of the Atlantic Meridional Overturning Circulation on Global Precipitation in CMIP5 Model Projections


by
Mohima Sultana Mimi
1,* and
Md Jahangir Alam
2
1
Department of Earth and Planetary Sciences, University of California Riverside, Riverside, CA 92521, USA
2
Department of Oceanography, University of Dhaka, Dhaka 1000, Bangladesh
*
Author to whom correspondence should be addressed.
Meteorology 2026, 5(2), 8; https://doi.org/10.3390/meteorology5020008
Submission received: 24 December 2025 / Revised: 24 March 2026 / Accepted: 30 March 2026 / Published: 1 April 2026

Abstract

The Atlantic Meridional Overturning Circulation (AMOC) is a key regulator of the global climate system, yet its influence on future precipitation remains uncertain because climate models project widely varying degrees of weakening. Here, we examine the relationship between AMOC decline and global precipitation using historical and RCP8.5 simulations from ten CMIP5 models. Models are grouped by the magnitude of projected AMOC weakening, and an intermodel regression framework is used to quantify the sensitivity of precipitation to changes in overturning strength. The CMIP5 multi-model mean reproduces observed large-scale precipitation patterns. While early-century responses are modest, stronger AMOC weakening by the late century is associated with pronounced drying across the tropical North Atlantic and enhanced rainfall over the Indo-Pacific. Regression analysis indicates that precipitation within the Intertropical Convergence Zone decreases by ~2.3% per 1 Sv reduction in AMOC strength. Sensitivity experiments further show that reduced Atlantic heat transport cools the North Atlantic and shifts tropical rainfall southward. These results identify AMOC variability as an important source of uncertainty in projections of future global hydroclimate.

1. Introduction

The Atlantic Meridional Overturning Circulation (AMOC) is a fundamental component of the global climate system, redistributing heat, carbon, and salinity between hemispheres and exerting strong control on regional and global climate patterns [1,2]. Through its role in transporting warm surface waters northward and returning colder deep waters southward, the AMOC influences sea-surface temperatures, atmospheric circulation, and the global hydrological cycle. Paleoclimate evidence indicates that abrupt changes in AMOC strength have coincided with rapid climate transitions, including cooling events and glacial reorganizations, highlighting its potential to amplify large-scale climate variability [3,4,5]. The circulation is also thought to exhibit multiple equilibrium states, raising the possibility of substantially weaker configurations under changing climate conditions [6,7].
Climate model projections consistently indicate a weakening of the AMOC under increasing greenhouse gas forcing, although the magnitude and rate of this decline remain uncertain [2,8,9]. Direct observations of AMOC variability are relatively short, limiting the detection of long-term trends [10], yet proxy-based reconstructions suggest that the present-day circulation may already be weaker than at any time during the past millennium [11,12]. Although a complete collapse of the AMOC is considered unlikely during the twenty-first century, it remains a low-probability but high-impact risk with potentially large consequences for regional and global climate [13].
A large body of work has explored the climate consequences of AMOC weakening using idealized “freshwater-hosing” experiments, in which freshwater input to the North Atlantic suppresses deep-water formation. These experiments consistently produce cooling over the North Atlantic, reductions in precipitation across parts of the Northern Hemisphere, and a southward displacement of the Intertropical Convergence Zone (ITCZ) driven by changes in interhemispheric energy balance [14,15,16]. Associated atmospheric responses include shifts in midlatitude jet streams, modifications of storm tracks, and adjustments in the Hadley circulation that redistribute tropical rainfall [17,18,19,20]. Beyond the Atlantic basin, AMOC variability can also influence hydroclimate in remote regions through ocean–atmosphere teleconnections, affecting precipitation across the Americas, Africa, and Asia and potentially altering monsoon systems that support large populations [21,22,23,24,25,26].
Climate models participating in the Coupled Model Intercomparison Project Phase 5 (CMIP5) provide a framework to examine these processes in a fully coupled climate system. While CMIP simulations broadly project a decline in AMOC strength under high-emissions scenarios, substantial intermodel differences exist in both the magnitude and timing of this weakening. Previous studies have highlighted this spread as a major source of uncertainty in future climate projections (e.g., [9,27,28]). However, relatively few analyses have quantitatively examined how differences in projected AMOC weakening across models translate into differences in projected precipitation responses under identical external forcing. Consequently, it remains challenging to determine the extent to which intermodel spread in precipitation projections reflects AMOC variability rather than other processes, including thermodynamic increases in atmospheric moisture, atmospheric circulation changes unrelated to ocean dynamics, or internal climate variability.
In this study, we investigate the relationship between AMOC weakening and global precipitation responses using historical and Representative Concentration Pathway 8.5 (RCP8.5) simulations from ten CMIP5 models. Rather than attributing precipitation changes solely to AMOC decline, we evaluate how intermodel differences in AMOC strength are statistically associated with intermodel differences in precipitation anomalies under the same radiative forcing scenario. Models are first grouped according to the magnitude of projected AMOC weakening to contrast hydroclimate responses between strong and weak decline regimes. We further apply an intermodel regression framework to quantify the sensitivity of precipitation to AMOC variability and to diagnose the precipitation response associated with a unit decline in overturning strength.
This approach allows us to address two key questions. First, how much of the intermodel spread in projected precipitation can be statistically linked to differences in AMOC weakening? Second, are the resulting precipitation responses—including shifts in the latitude of tropical rainfall—consistent with theoretical expectations of interhemispheric energy balance adjustments? By combining regression-based model grouping and sensitivity analysis, this study provides a physical assessment of AMOC–precipitation coupling in CMIP5 projections.

2. Materials and Methods

2.1. Observational Data and Reanalysis Products

The Global Precipitation Climatology Project (GPCP) Version 3.3 Monthly Analysis Product provides global precipitation estimates by combining satellite and gauge observations from 1979 to the present. The dataset is produced within the Global Energy and Water Exchanges (GEWEX) program and is designed to provide a long, homogeneous global precipitation record using improved merging techniques and modern input datasets. The GPCP v3.3 monthly product is available at a spatial resolution of 0.5° × 0.5°. In this study, monthly GPCP v3.3 data for 2000–2024 are used to evaluate and validate simulations from the CMIP5 models. The dataset is distributed by the NASA Goddard Earth Sciences Data and Information Services Center (GES DISC) available at https://cmr.earthdata.nasa.gov/search/concepts/C3405935516-GES_DISC.html [29] and accessed on 15 February 2026.

2.2. CMIP5 Climate Model Simulations

We use historical and RCP8.5 simulations [30] from 10 available CMIP5 models (Table 1). Only one member run (r1i1p1) is selected from each model to ensure equal weighting in the intermodel analysis. For each model, all variables were interpolated onto a common 1° × 1° latitude–longitude grid using bilinear interpolation to ensure spatial consistency across models prior to analysis. For each ensemble member, we calculate the AMOC strength as the maximum value of the annual mean stream function below 500 m in the North Atlantic over the period 1850–2100. The Atlantic meridional overturning stream function (ψ) at depth z is calculated from the meridional velocity (v) as follows:
ψ y , z = ∫ z 0 ∫ x w x e v x , y , z ′ d x d z ′
where x , y and z′ correspond to the zonal, meridional, and vertical depth coordinates, respectively, and x w and x e represent the western and eastern boundaries of the Atlantic Ocean. The AMOC strength is defined as the maximum of the annual mean meridional stream-function below 500 m in the North Atlantic. For each variable, the projected change is calculated by subtracting the 20-year mean of 1961–1980 historical simulations from the 25-year mean of 2000–2024 historical and RCP8.5 simulations to show the impact at the beginning of this century. Similarly, the projected change is calculated by subtracting the 20-year mean of 1961–1980 historical simulations from the 25-year mean of 2076–2100 RCP8.5 simulations to show the scenario at the end of the century.
To isolate the precipitation response associated with AMOC weakening, models were classified according to the relative decline in AMOC strength rather than an absolute AMOC threshold in order to minimize the influence of intermodel differences in the mean AMOC state. For each model, AMOC weakening was quantified as the percentage change in the maximum annual-mean AMOC strength relative to the 1961–1980 baseline: %ΔAMOC = 100 × (AMOC_{future} − AMOC_{historical})/AMOC_{historical}, where future denotes the periods 2000–2024 and 2076–2100. Models were ranked by %ΔAMOC and separated into strong- and weak-AMOC-weakening groups based on the magnitude of their relative decline (Table 2). The strong-weakening group includes ACCESS1-0, ACCESS1-3, CSIRO-Mk3-6-0, and MPI-ESM-LR, while the weak-weakening group includes MPI-ESM-MR, NorESM1-ME, NorESM1-M, IPSL-CM5A-LR, IPSL-CM5B-LR, and CMCC-CMS. This classification framework emphasizes the magnitude of the forced AMOC response while reducing sensitivity to model-to-model differences in climatological AMOC strength.
No performance-based screening of AMOC fidelity was applied prior to model classification. Although CMIP5 models exhibit known biases in the simulated mean AMOC strength and structure, the objective of this study is to examine intermodel relationships between projected AMOC changes and precipitation responses rather than to evaluate absolute model skill. Because the analysis is based on anomalies relative to each model’s own baseline and focuses on differences in the magnitude of AMOC weakening, the influence of systematic mean-state biases is reduced. Nevertheless, potential model deficiencies in simulating AMOC structure and variability remain a source of uncertainty and are considered when interpreting the results. CMIP5 models were selected based on the availability of the required variables for both historical and RCP8.5 simulations over the full analysis period.

2.3. AMOC Sensitivity Experiments

We analyse AMOC sensitivity experiments performed with the EC-Earth3 climate model [31]. The experimental design follows a two-step framework. A coupled preindustrial simulation is first integrated with an imposed freshwater flux of 0.3 Sv over the North Atlantic and Arctic for ~140 years, reducing the AMOC from ~17.5 Sv to ~7 Sv. Boundary conditions for atmosphere-only simulations are then constructed from quasi-stationary segments of this coupled run. Monthly sea surface temperature and sea-ice fields are prescribed and fixed within each experiment, thereby isolating the atmospheric response to distinct AMOC states.
Three ensembles are analysed: a control state (ctrl; ~17.5 Sv), a moderate weakening (a14; ~14 Sv), and a strong weakening (a07; ~7 Sv). Each ensemble comprises 20 members generated through perturbed atmospheric initial conditions. After discarding the first simulation year, 10 years per member are retained, yielding 200 years of data for each AMOC state. Monthly fields of precipitation, near-surface air temperature, sea-level pressure, and lower-tropospheric winds are used to diagnose the atmospheric response. These experiments are used to provide a physically consistent framework for interpreting precipitation changes inferred from CMIP5 simulations, rather than being directly included in the regression analysis.
The sensitivity of precipitation to AMOC variability is quantified using an intermodel regression across CMIP5 models. At each grid point, annual-mean precipitation anomalies (relative to 1961–1980) are regressed onto corresponding AMOC anomalies (ΔAMOC, Sv) across models, treated as independent samples. The regression is performed separately for 2000–2024 and 2076–2100. Regression slopes are expressed as precipitation change per 1 Sv AMOC decline. The coefficient of determination (R2) is used to quantify the fraction of intermodel variance explained by AMOC variability.
Statistical significance is assessed using a two-sided Student’s t-test applied to the regression coefficient, and only grid points significant at the 95% confidence level (p < 0.05) are considered robust.

3. Results

3.1. Simulated AMOC Evolution in CMIP5 Models

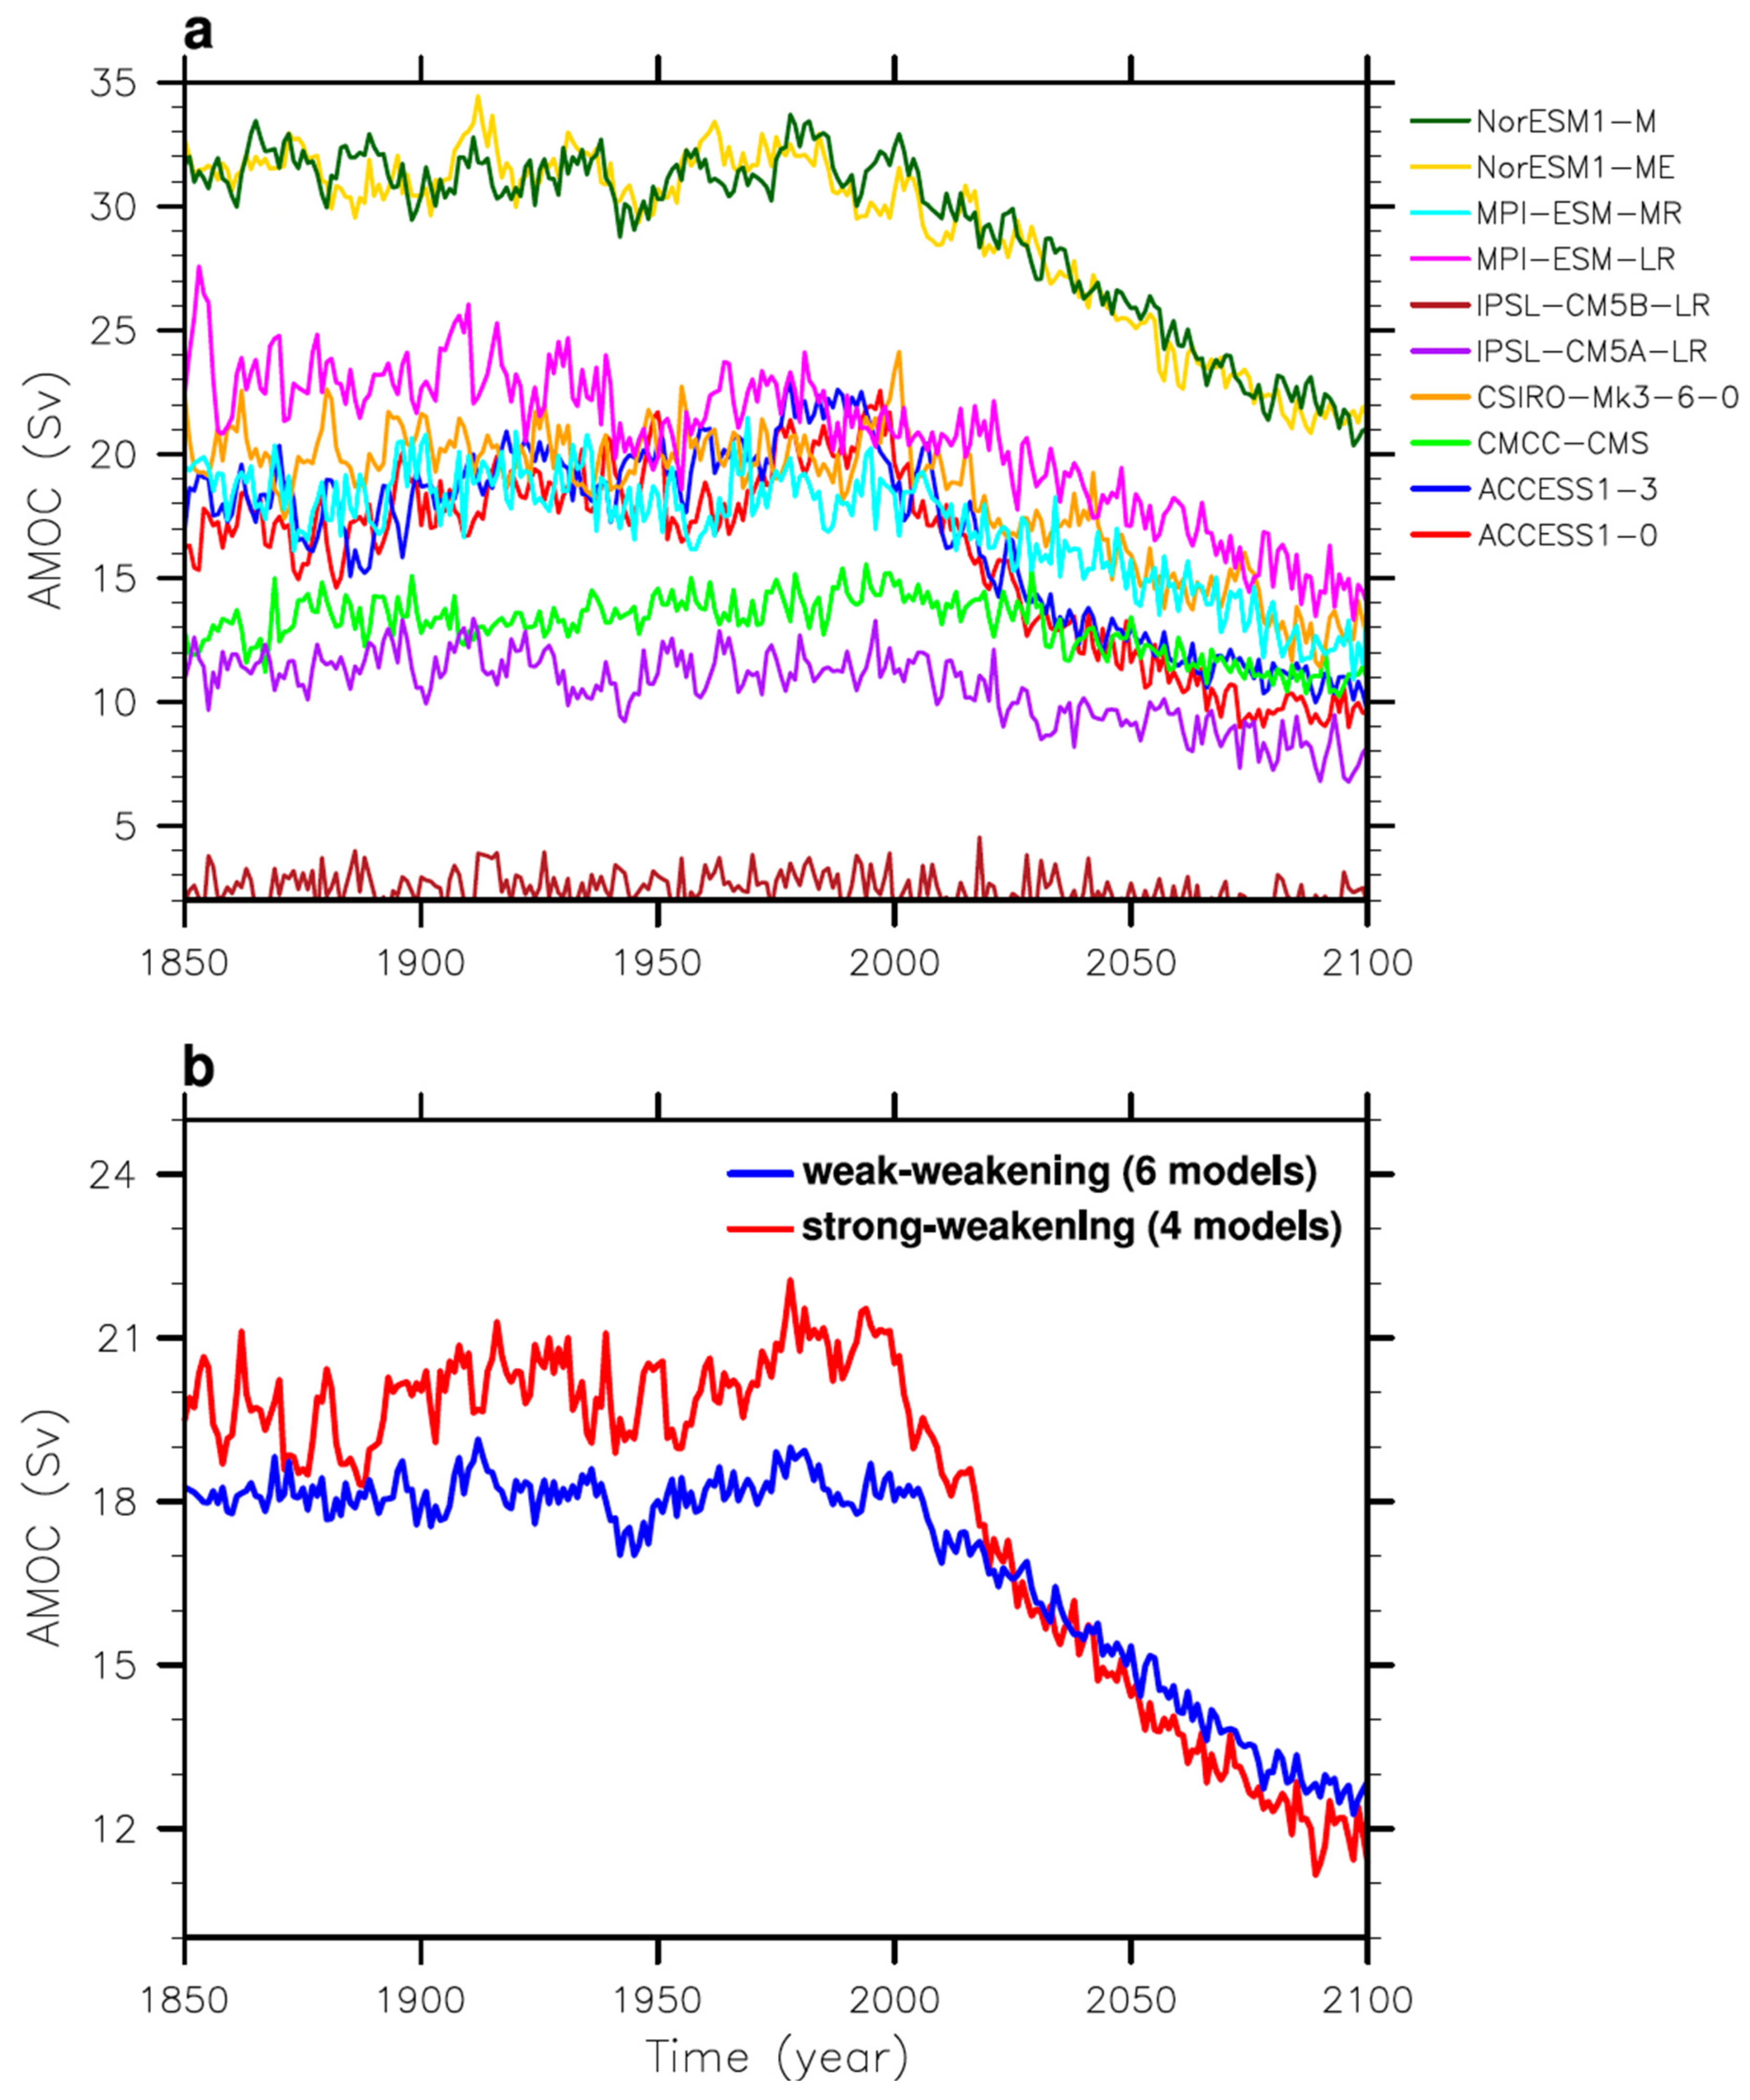
Despite large intermodel differences in simulated AMOC strength, CMIP5 models exhibit a broadly consistent long-term evolution (Figure 1a). Individual model time series span a wide range of overturning magnitudes, from very weak values in IPSL models to values exceeding 30 Sv in the NorESM models. Most simulations show modest variability and near-stable behavior from the mid-nineteenth century through much of the twentieth century, followed by a pronounced decline beginning around the turn of the twenty-first century, consistent with a forced response to increasing greenhouse-gas concentrations.
To examine how this decline varies across models, simulations were grouped according to the magnitude of projected AMOC weakening (Figure 1b). The strong-weakening group shows a rapid reduction after ~2000, decreasing from ~21 Sv to ~12 Sv by 2100, whereas the weak-weakening group exhibits a slower decline from ~18–19 Sv to ~13 Sv. This separation highlights substantial intermodel differences in the sensitivity of AMOC strength to anthropogenic forcing.

3.2. Model Evaluation of Global Precipitation

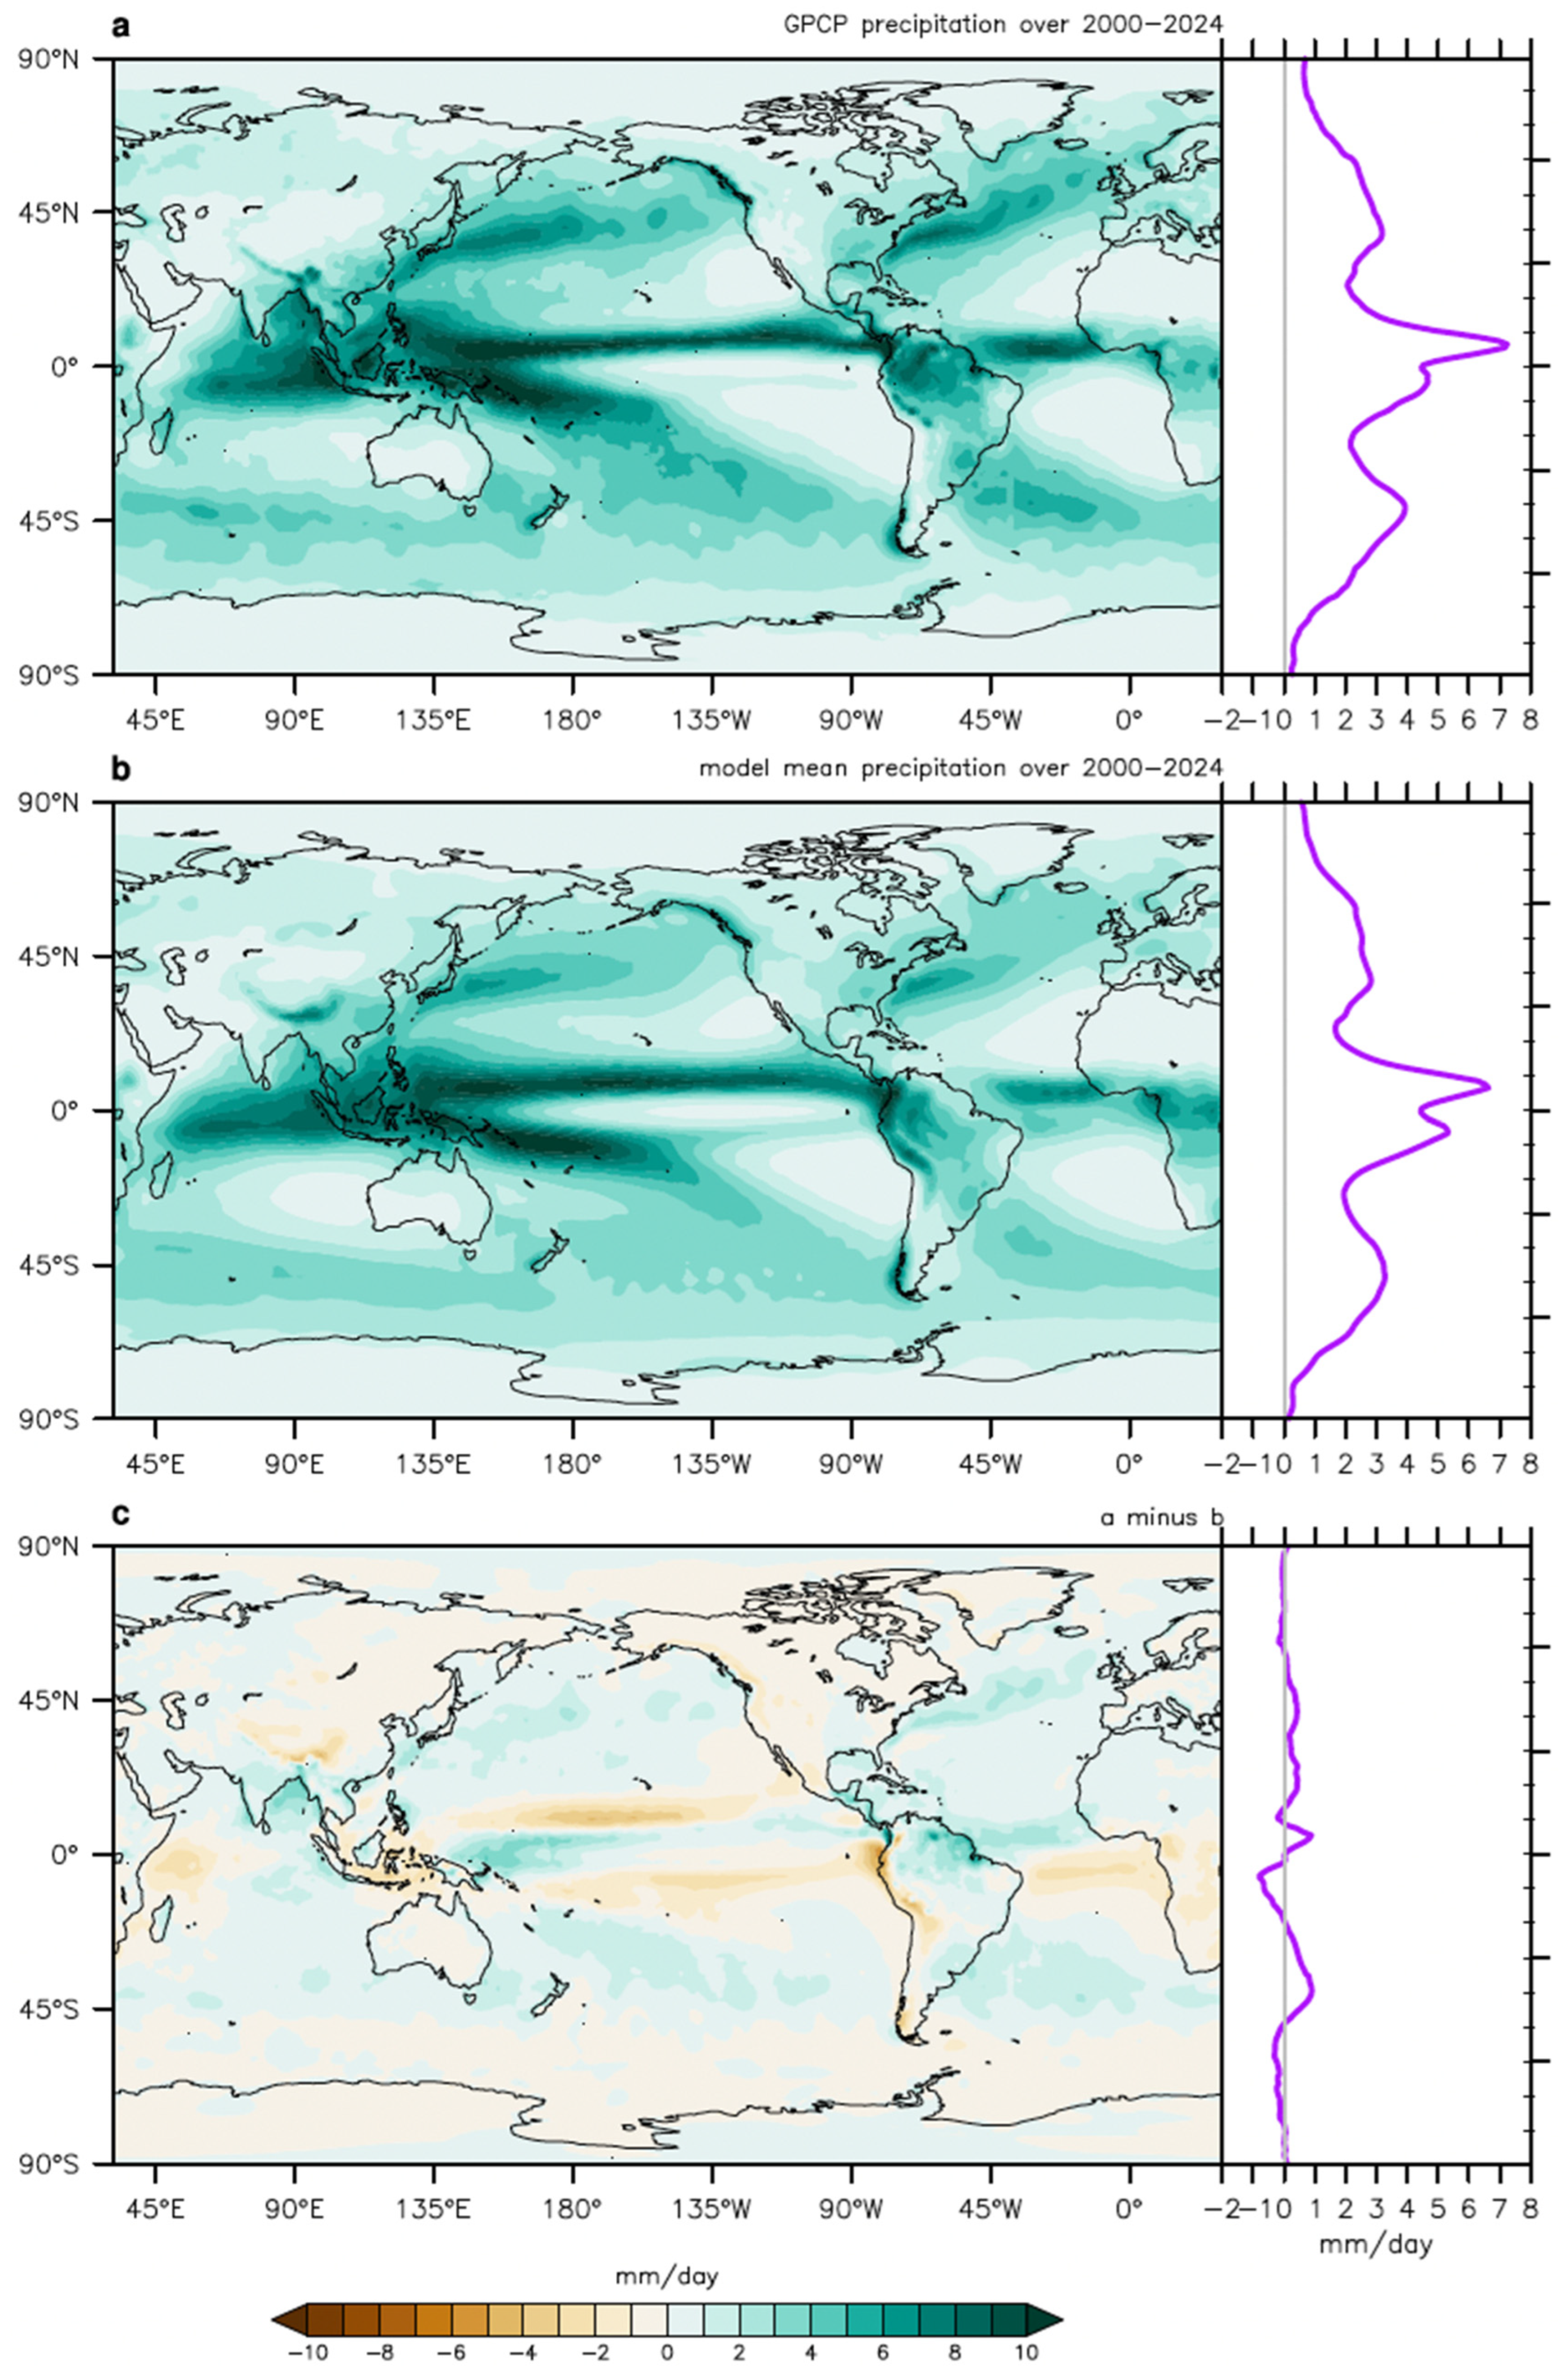
The CMIP5 multi-model mean reproduces the large-scale structure of observed precipitation over 2000–2024, including the equatorial ITCZ maximum, enhanced rainfall over the Indo-Pacific warm pool, and reduced precipitation in subtropical and mid-latitude regions (Figure 2a,b). Zonal-mean agreement indicates that models capture the broad meridional structure of the global hydrological cycle.
Model–observation differences (Figure 2c) are generally small relative to the climatological mean, although regional biases persist, including excessive precipitation over tropical oceans and dry biases over land. These discrepancies are consistent with known limitations in representing deep convection and land–atmosphere coupling. In addition, CMIP models exhibit a well-documented double-ITCZ bias, particularly over the Atlantic Ocean, which can influence the simulated distribution of tropical rainfall [32,33,34,35]. Despite these biases, zonal-mean precipitation remains well represented, supporting the use of CMIP5 models for large-scale hydroclimate analysis.

3.3. Precipitation Response to AMOC Weakening

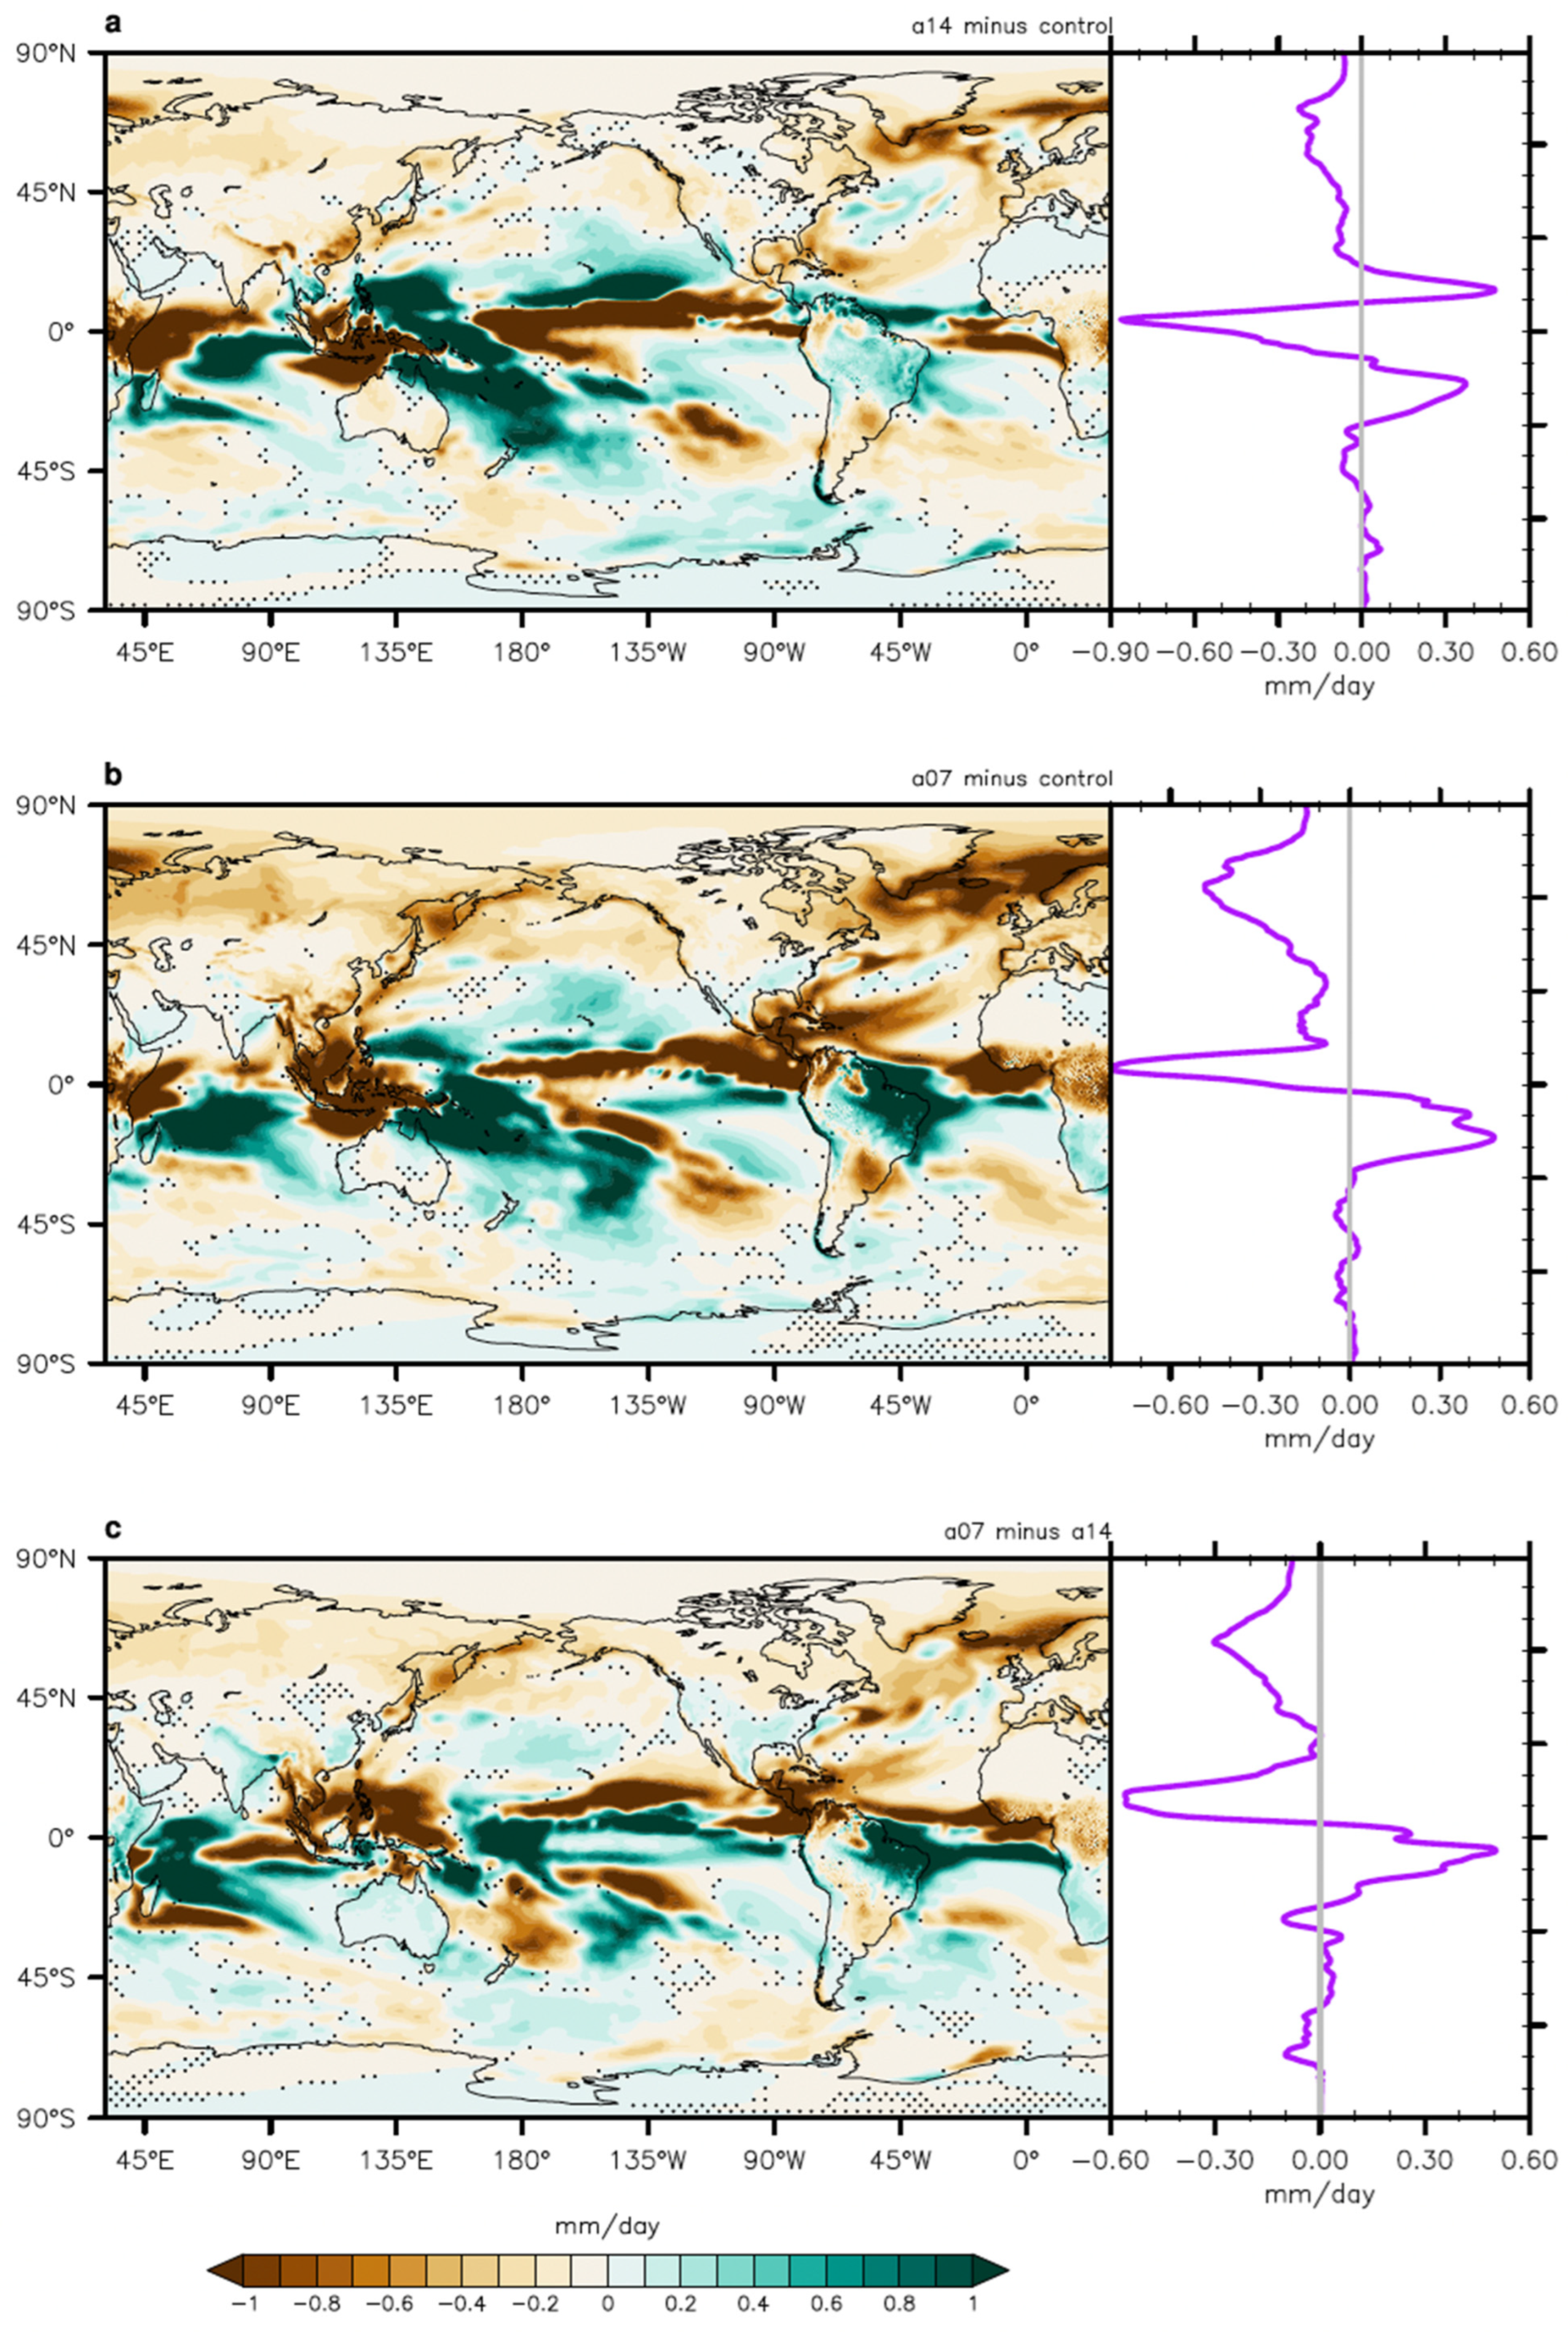
We next evaluate and quantify how imposed reductions in AMOC strength influence global precipitation patterns. Figure 3 shows the ensemble-mean precipitation response for moderate and strong AMOC weakening experiments relative to the control climate, following the experimental design described by [31].
Under moderate AMOC weakening (a14 minus control; Figure 3a), precipitation changes exhibit a coherent large-scale structure characterized by enhanced rainfall across parts of the equatorial Pacific and Indian Oceans and reduced precipitation over the tropical Atlantic and adjacent continental regions. The zonal-mean response highlights a meridional dipole pattern, with negative anomalies concentrated in the northern tropics and weak compensating increases in the Southern Hemisphere. This pattern is consistent with a modest southward displacement of the ITCZ in response to reduced northward ocean heat transport. The strong AMOC-weakening experiment (a07 minus control; Figure 3b) shows a substantially amplified hydrological response. Tropical precipitation anomalies intensify and become more spatially coherent, with pronounced drying over the tropical North Atlantic and enhanced rainfall across portions of the Indo-Pacific convergence zones. The zonal-mean structure reveals stronger negative anomalies in the Northern Hemisphere tropics and enhanced precipitation south of the equator, indicating a more pronounced hemispheric asymmetry in tropical rainfall.
The difference between the strong and moderate weakening experiments (a07 minus a14; Figure 3c) isolates the sensitivity of the hydrological cycle to the magnitude of AMOC reduction. This contrast reveals a clear meridional dipole pattern in both the spatial maps and zonal-mean precipitation profiles. Drying intensifies north of the equator, while precipitation increases across the southern tropics and subtropics. Such a structure is characteristic of an interhemispheric energy imbalance driven by reduced Atlantic heat transport and reflects southward shift in the ITCZ as AMOC weakening strengthens. Overall, the results indicate that the magnitude of AMOC decline strongly modulates the spatial structure and intensity of global precipitation responses. Larger reductions in overturning circulation produce stronger hemispheric asymmetries in tropical rainfall and a clearer southward displacement of the ITCZ, consistent with previous studies of AMOC-driven hydroclimate variability [32].
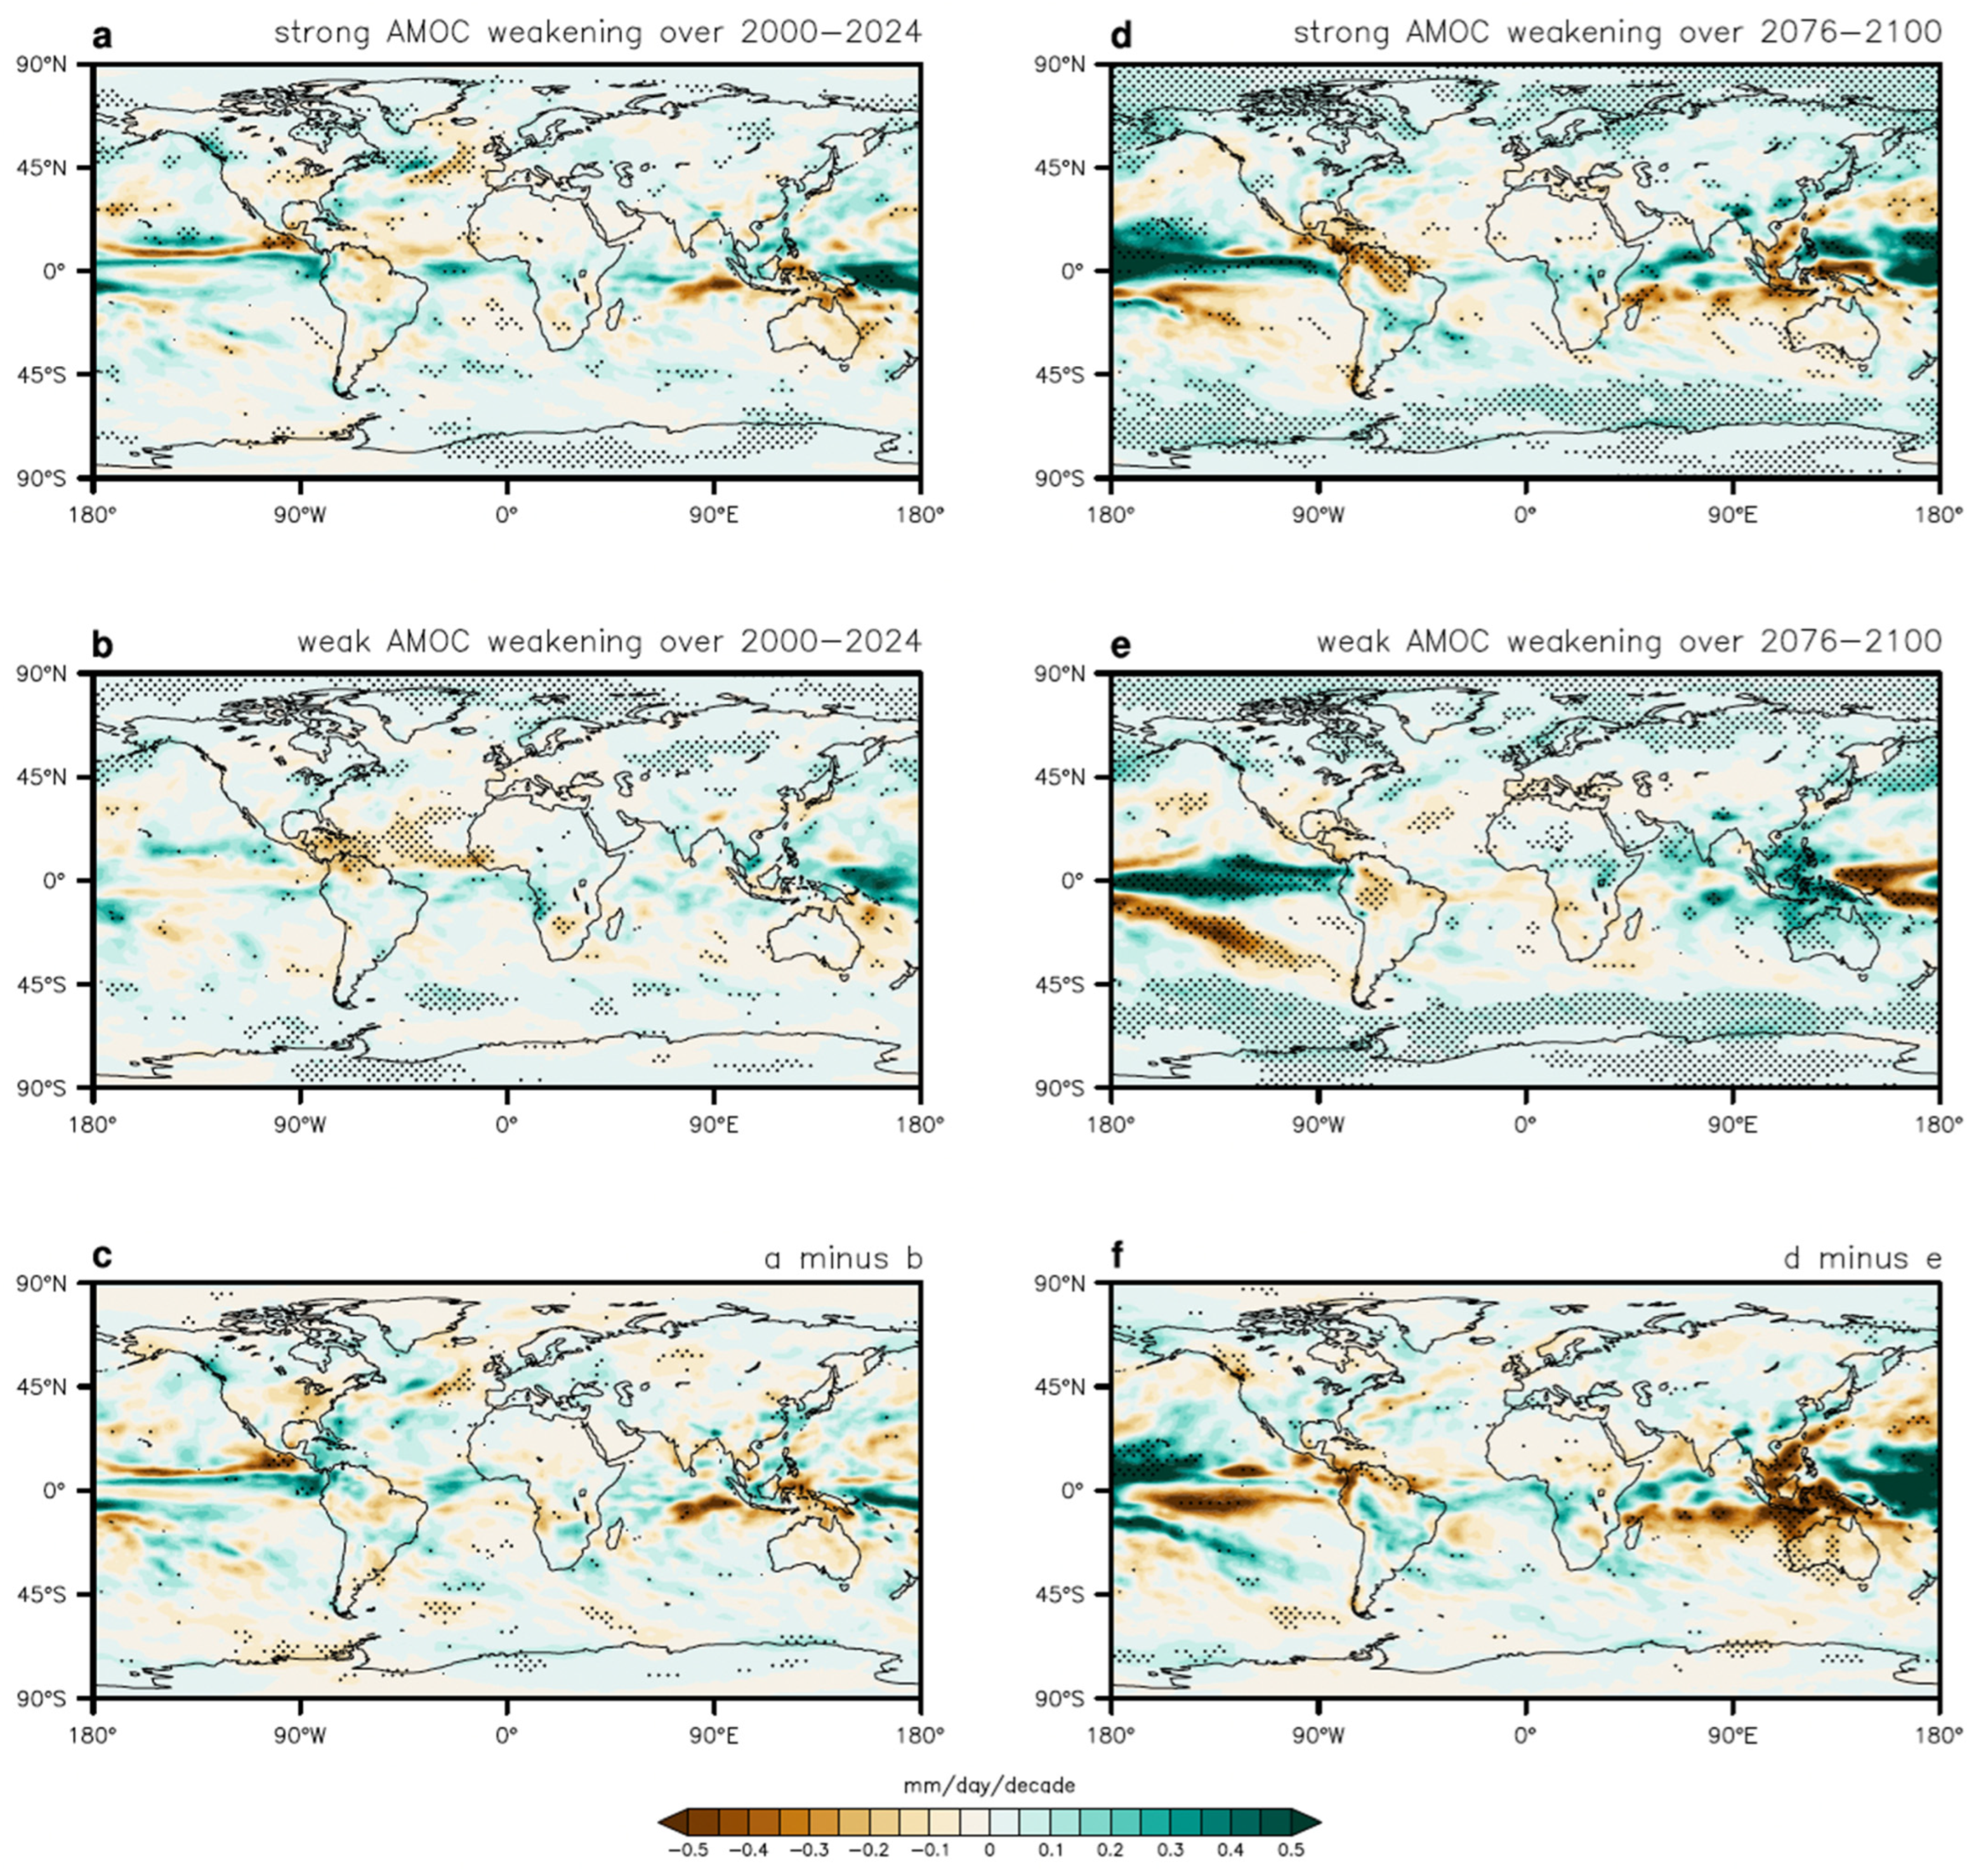
Figure 3 quantifies the precipitation response associated with changes in AMOC strength using controlled sensitivity experiments in which the overturning circulation is directly perturbed. In contrast, Figure 4 shows precipitation trends from the CMIP5 multi-model ensemble, where the potential influence of AMOC variability is inferred statistically by grouping models according to the magnitude of their projected AMOC weakening. Although these two approaches differ and each has limitations, the overall similarity between the patterns in Figure 3 and Figure 4 provides some support for the interpretation that the strong and weak AMOC-weakening groups capture aspects of the precipitation sensitivity to AMOC decline.
Consistent with Figure 3, the magnitude of AMOC weakening appears to influence the spatial structure and intensity of global precipitation trends, with contrasts between the two groups becoming clearer toward the end of the century. During the early period (2000–2024), both groups exhibit hydroclimatic features commonly associated with greenhouse-gas-driven warming, including enhanced precipitation across parts of the tropical Indo-Pacific and modest drying in several subtropical regions (Figure 4a–c). Nevertheless, models with stronger AMOC weakening show somewhat clearer signals, including enhanced drying over the North Atlantic and adjacent continental regions and a developing wet–dry contrast across the tropical belt.
In the strong-weakening group (Figure 4a), precipitation trends display zonally extended rainfall increases along the equatorial Pacific and Indian Oceans, accompanied by drying across parts of the western Pacific and Maritime Continent. The weak-weakening group (Figure 4b) shows broadly similar but weaker anomalies. The difference pattern (Figure 4c) suggests that stronger AMOC weakening is associated with modest amplification of tropical and subtropical precipitation contrasts.
By the late century (2076–2100), these signals become more pronounced and spatially coherent. Under strong AMOC weakening (Figure 4d), enhanced rainfall develops across the equatorial Pacific, while drying intensifies over the subtropical Atlantic, Indian Ocean, and parts of South America and Africa. Weak AMOC weakening models (Figure 4e) reproduce similar large-scale structures but with reduced magnitude. The late-century difference (Figure 4f) highlights stronger tropical rainfall redistribution and more extensive subtropical drying in models experiencing larger AMOC weakening.
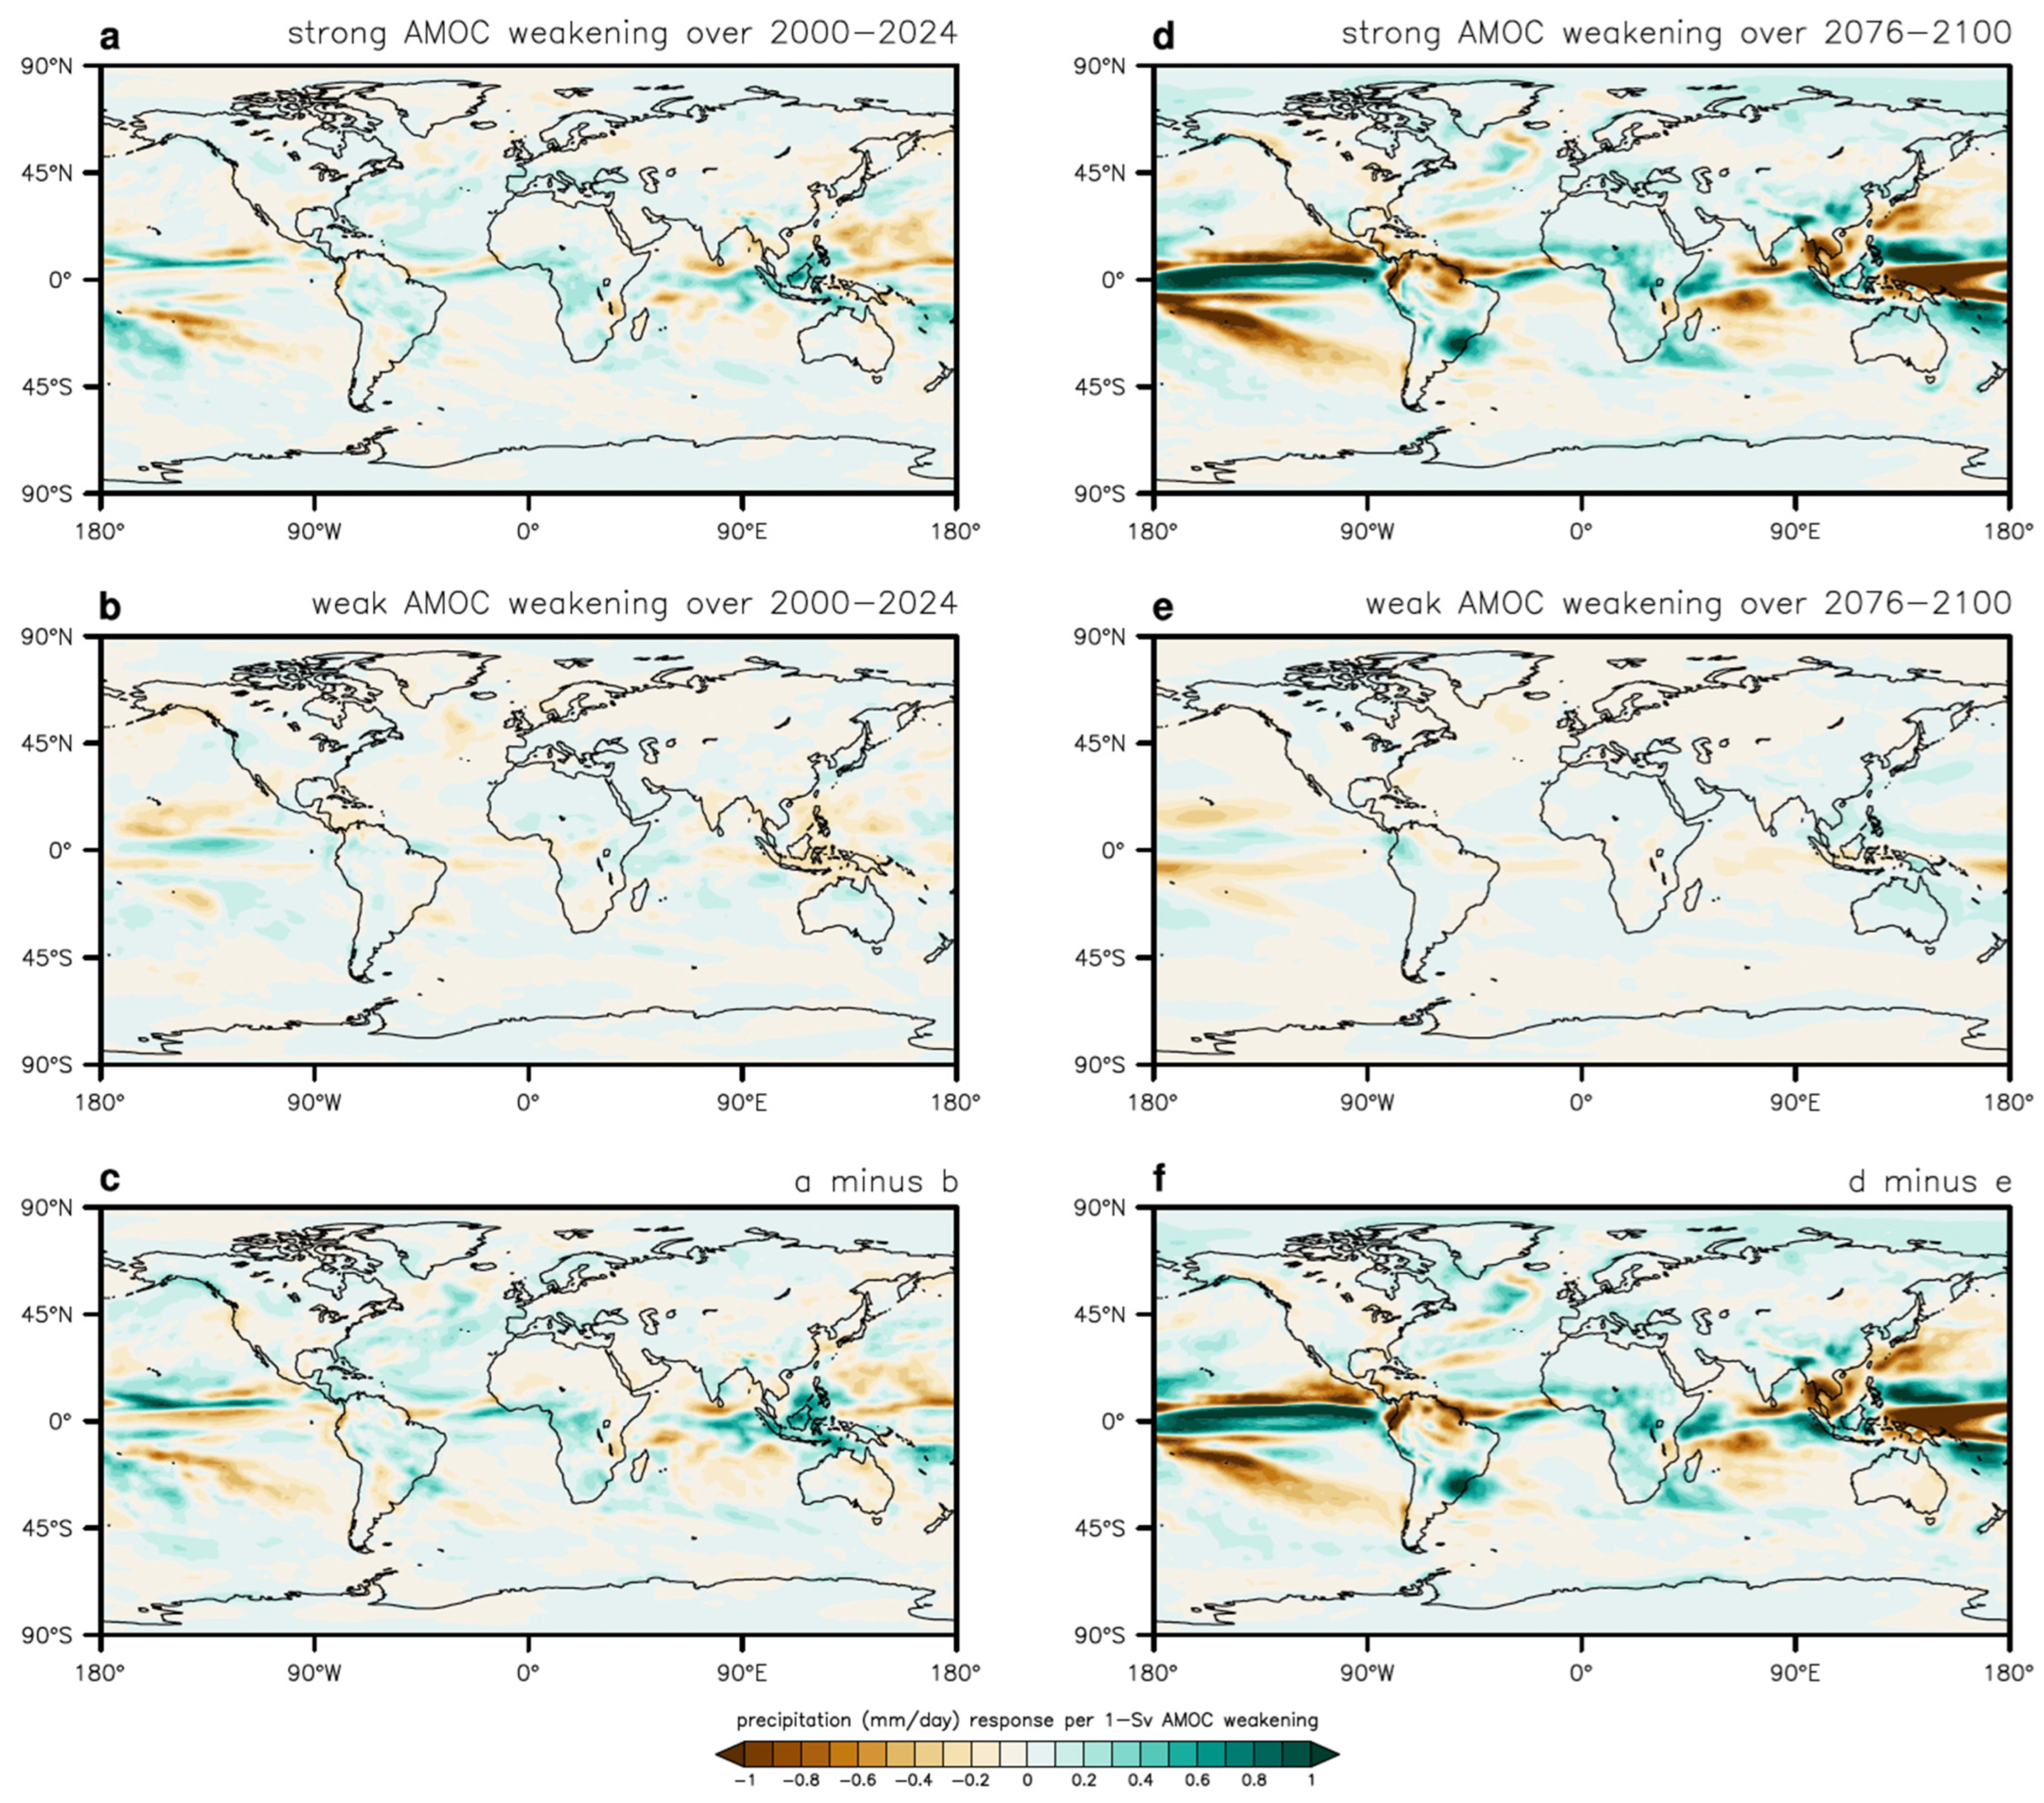
To quantify the sensitivity of global precipitation to AMOC weakening, we regress precipitation anomalies against AMOC decline across models (Figure 5). During 2000–2024, the regression reveals a redistribution of tropical rainfall associated with reduced Atlantic overturning. Relative to the 1961–1980 baseline, mean precipitation over the ITCZ region (10° S–10° N) decreases by 2.33% per 1 Sv reduction in AMOC strength. Regionally, precipitation increases by up to 29.72% Sv−1 over North Africa and decreases by up to 13.22% Sv−1 over northwestern Australia per 1 Sv AMOC decline, indicating a zonally structured pattern of precipitation change (Figure 5a–c). Comparisons between strong and weak AMOC-weakening groups further show that a larger AMOC decline is associated with enhanced drying over the tropical Atlantic and increased rainfall across the Indo-Pacific region (Figure 5).

3.4. Physical Mechanisms

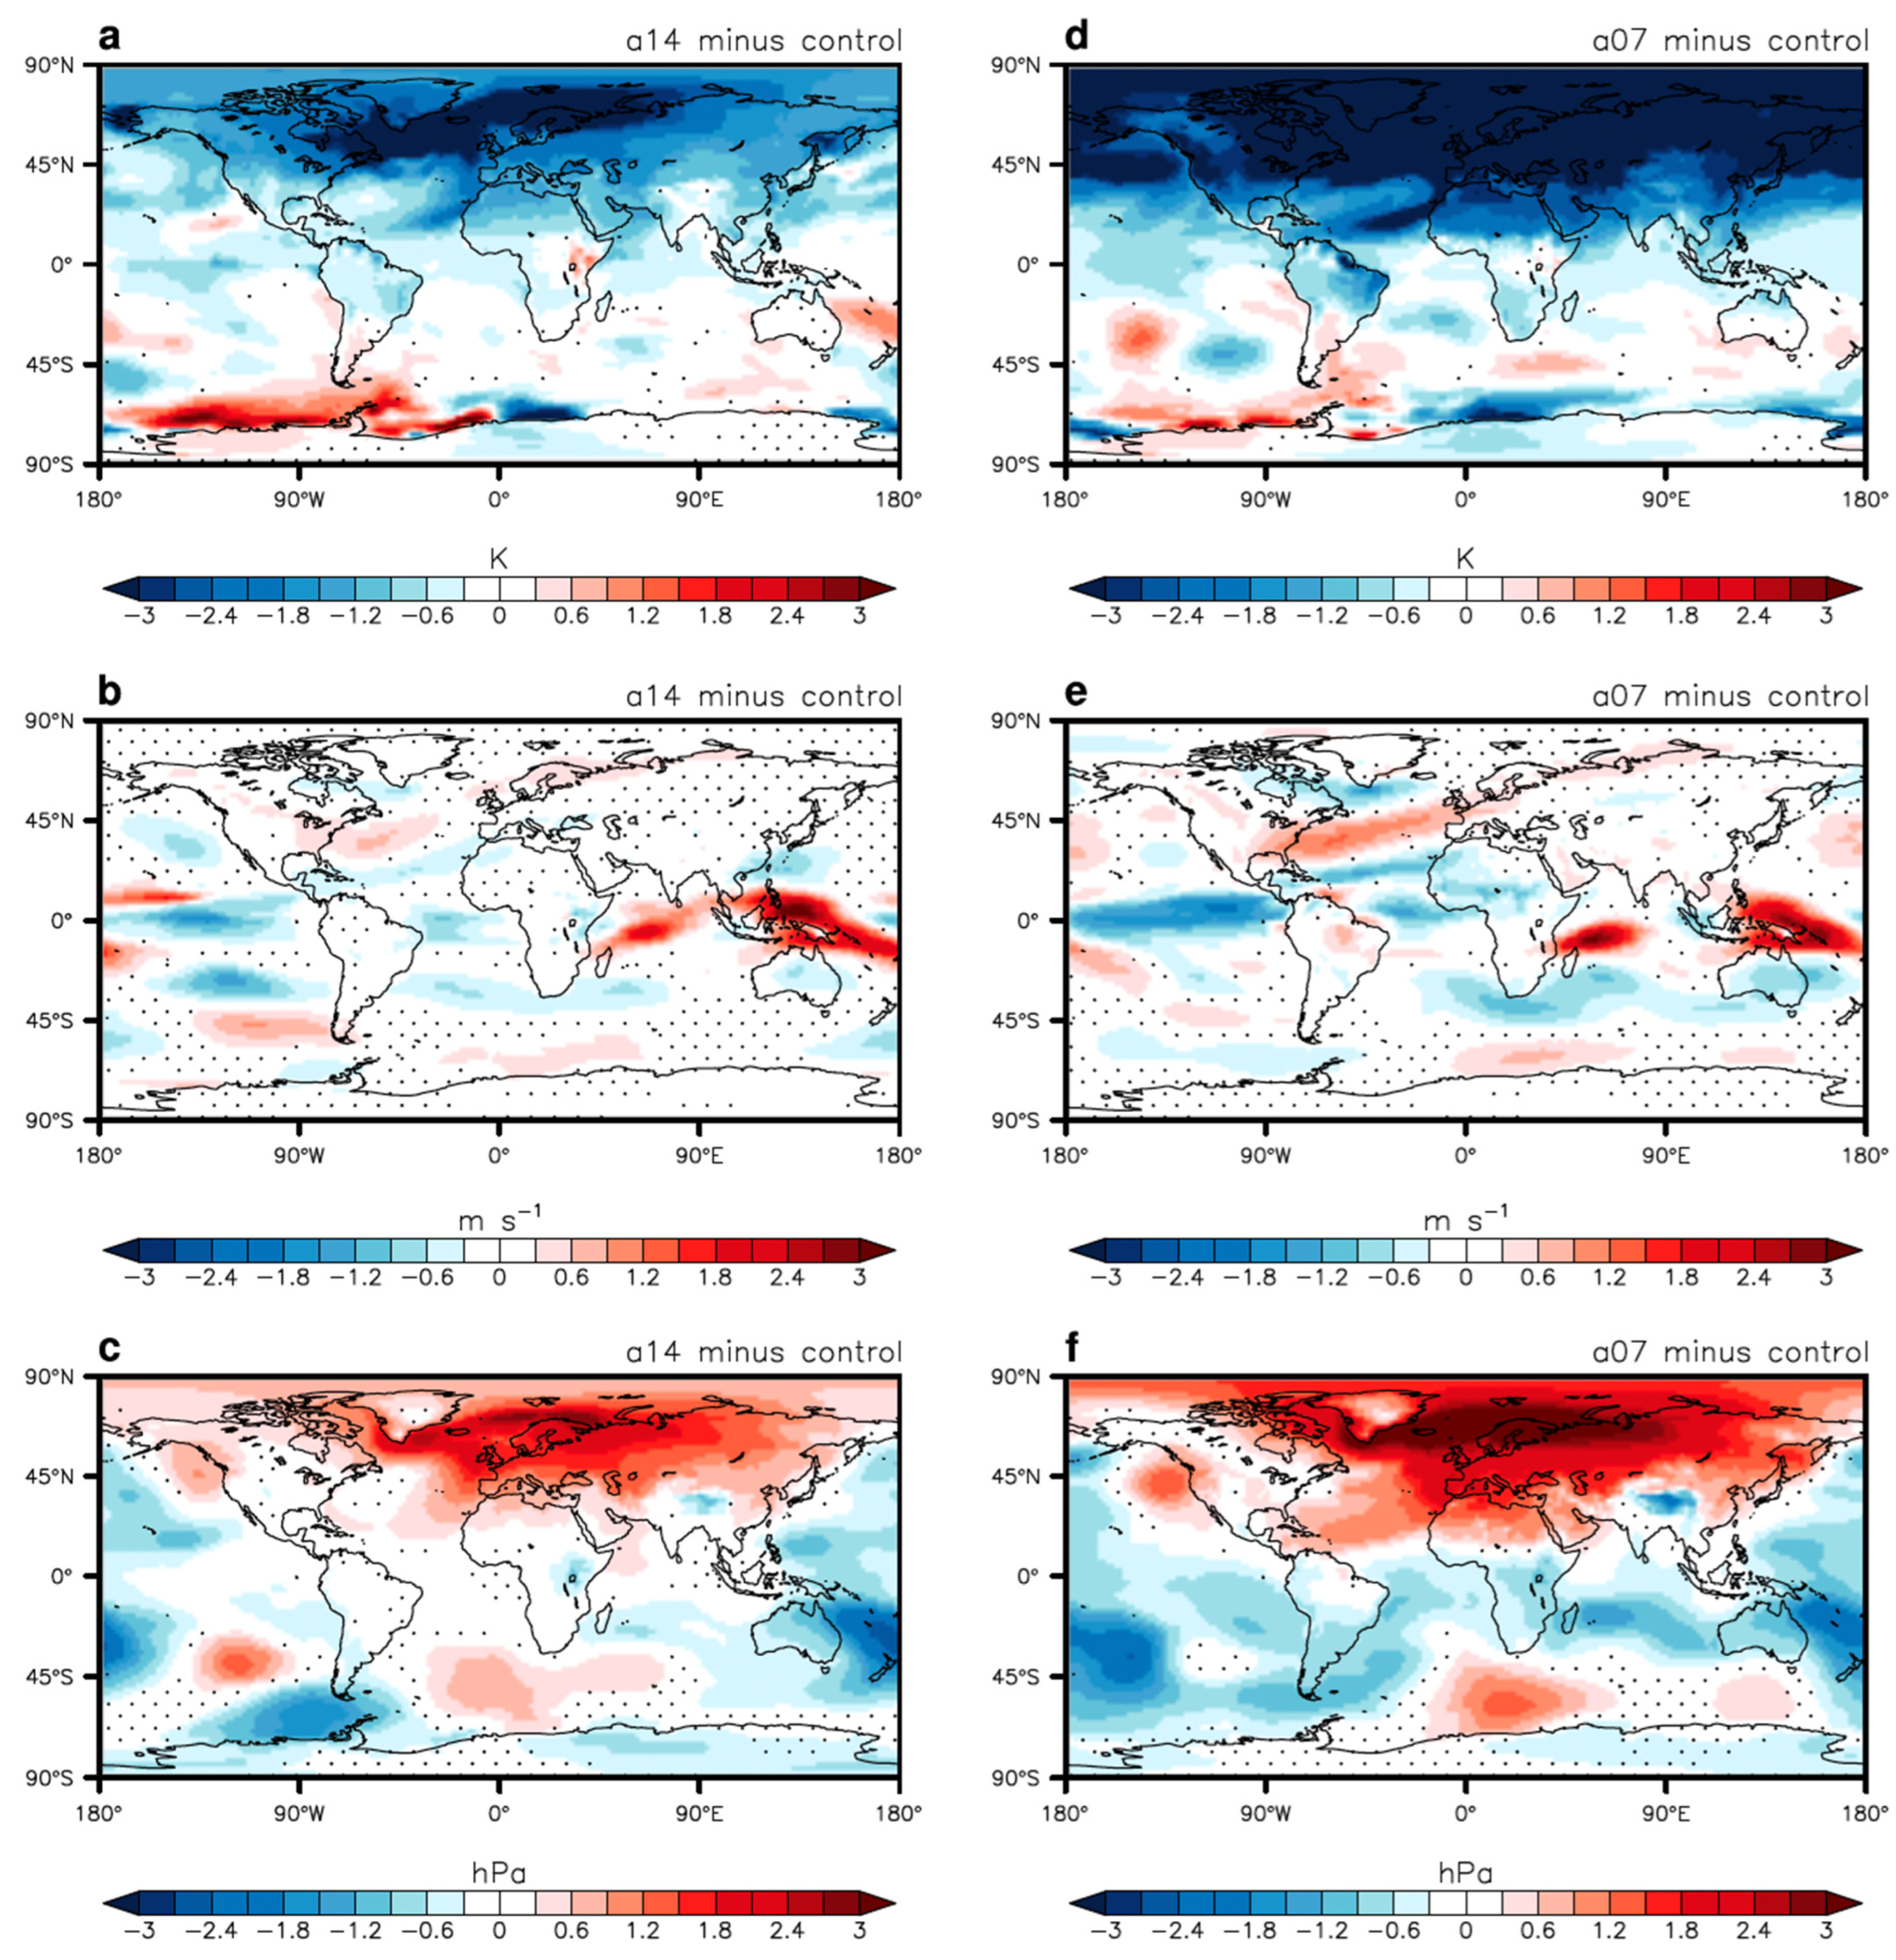
The physical mechanisms underlying these responses are illustrated using targeted AMOC-strength sensitivity experiments based on the simulations of [31] (Figure 6). In these experiments, a weakened AMOC reduces northward ocean heat transport, producing widespread cooling across the North Atlantic (Figure 6a,d) and associated changes in low-level winds and sea-level pressure (Figure 6b,c,e,f). These circulation adjustments enhance the interhemispheric temperature contrast and drive a southward displacement of the Hadley circulation and the ITCZ, shifting tropical convection toward the Southern Hemisphere. This dynamical response provides a mechanistic explanation for the precipitation redistribution identified in the AMOC-strength experiments (Figure 3) and in the CMIP5 multimodel analyses (Figure 4 and Figure 5).
Together, the multimodel precipitation patterns (Figure 4), regression-based sensitivity (Figure 5), and controlled AMOC-strength experiments (Figure 3) indicate that AMOC weakening produces a coherent precipitation response through large-scale atmospheric response (Figure 6). This mechanism also provides a dynamical explanation for the southward displacement of tropical rainfall identified in the AMOC-strength experiments (Figure 3), linking ocean circulation changes to global precipitation variability. By the late century (2076–2100), these relationships strengthen and become more spatially organized (Figure 5d–f). AMOC weakening is associated with drying across the North Atlantic basin and adjacent regions, including parts of the Americas, Europe, and northern Africa, while enhanced rainfall emerges across the equatorial Pacific and Indian Ocean. These changes reflect strengthened atmospheric teleconnections, including altered jet streams, storm tracks, Hadley circulation, and a weakened Walker circulation, collectively redistributing tropical convection (e.g., [15,16,18,19,36,37]).

4. Discussions

The climate influence of the AMOC has long been examined using idealized freshwater-hosing experiments and targeted model perturbations. These studies consistently show that a weakened AMOC reduces northward ocean heat transport, cools the North Atlantic, and shifts the ITCZ southward, producing reductions in Northern Hemisphere tropical precipitation [14,15,16,36]. More recent experiments conducted in warming climates demonstrate that similar mechanisms operate under increasing greenhouse-gas forcing, with AMOC decline altering regional temperature patterns, atmospheric circulation, and precipitation responses [38,39]. Together, these studies establish a robust theoretical framework linking AMOC weakening to interhemispheric energy imbalance and tropical rainfall redistribution.
Our analysis extends this framework by examining how intermodel differences in AMOC weakening within CMIP projections translate into differences in projected precipitation responses under identical external forcing. While previous CMIP studies have documented substantial spread in AMOC decline among models [9,27,28], relatively few have quantified the sensitivity of precipitation to the magnitude of AMOC change across models. By applying an intermodel regression framework, we directly estimate the precipitation response associated with AMOC variability across the CMIP5 ensemble. The results indicate that AMOC weakening explains a substantial fraction of intermodel precipitation variance in the tropics, particularly across the equatorial Atlantic and Indo-Pacific regions.
The spatial structure of the precipitation responses identified here is consistent with theoretical expectations of interhemispheric energy balance adjustments. Stronger AMOC weakening is associated with enhanced drying across the tropical and subtropical North Atlantic and increased rainfall across the Indo-Pacific warm pool. These patterns reflect reduced northward ocean heat transport and relative cooling of the Northern Hemisphere, which shifts the atmospheric energy balance and drives a southward displacement of the Hadley circulation and tropical rainfall bands [19,40]. The regression analysis further indicates that precipitation anomalies scale approximately linearly with the magnitude of AMOC decline, suggesting that overturning strength modulates both the intensity and spatial extent of global precipitation responses.
The physical mechanisms underlying these responses are further supported by AMOC-sensitivity experiments analyzed in this study. In these experiments, reduced overturning strength produces pronounced cooling of the North Atlantic and modifies sea-level pressure and low-level wind patterns, leading to large-scale atmospheric circulation adjustments. These changes enhance the interhemispheric temperature contrast and promote a southward displacement of tropical convection. The consistency between these controlled perturbation experiments and the statistical relationships identified across the CMIP5 ensemble provides additional support for interpreting the precipitation patterns as a dynamical response to AMOC weakening rather than solely to greenhouse-gas forcing.
Our results are broadly consistent with recent CMIP6 studies suggesting that AMOC variability contributes significantly to uncertainty in projected tropical precipitation. For example, several multi-model analyses indicate that a substantial fraction of precipitation uncertainty over the tropical Atlantic and surrounding regions can be attributed to differences in projected AMOC weakening [36,41,42,43]. By demonstrating that precipitation sensitivities emerge directly from intermodel variability within CMIP5 projections, our analysis provides a statistical bridge between idealized AMOC perturbation experiments and realistic multi-model climate simulations.
Several limitations should nevertheless be considered. CMIP5 models exhibit known biases in the simulated mean state and variability of the AMOC, including differences in overturning strength and North Atlantic sea-surface temperature patterns. Although the present analysis focuses on anomalies relative to each model’s baseline, such biases may still influence the magnitude of the projected hydroclimate responses. In addition, the regression approach isolates statistical relationships between AMOC variability and precipitation anomalies but cannot fully separate AMOC-driven responses from other processes operating in the coupled climate system. Finally, the relatively small number of models available for analysis limits the ability to robustly quantify regional uncertainty.
Despite these limitations, the results highlight AMOC variability as an important source of intermodel spread in future hydroclimate projections. By combining intermodel regression analysis with targeted sensitivity experiments, this study provides new evidence that ocean circulation changes play a significant role in shaping twenty-first-century precipitation patterns. Improving the representation of AMOC dynamics and constraining its future evolution, therefore remain critical for reducing uncertainty in projections of global and regional hydroclimate.

5. Conclusions

Using simulations from ten CMIP5 models, this study examines how intermodel differences in AMOC weakening influence projected global precipitation changes. Although the models exhibit substantial differences in mean AMOC strength and the magnitude of its future decline, they show a broadly consistent weakening under the RCP8.5 scenario. This coherent forced response enables a comparison between models experiencing relatively strong and weak AMOC decline and allows the associated hydroclimate responses to be quantified.
Our results show that differences in AMOC weakening are associated with differences in the spatial structure of precipitation change. Models with stronger AMOC decline exhibit enhanced drying across the tropical and subtropical North Atlantic and adjacent land regions, accompanied by increased rainfall across the equatorial Pacific and Indian Oceans. These contrasts become more pronounced toward the end of the twenty-first century, indicating that the hydroclimate influence of AMOC weakening strengthens as the circulation decline intensifies. Intermodel regression further indicates that tropical precipitation anomalies scale with the magnitude of AMOC weakening, revealing a near-linear sensitivity of rainfall to overturning strength. Stronger AMOC decline is associated with a modest southward displacement of tropical rainfall, consistent with an interhemispheric energy imbalance arising from reduced northward ocean heat transport and relative cooling of the Northern Hemisphere.
These findings identify AMOC variability as an important contributor to uncertainty in future hydroclimate projections. Improving constraints on AMOC evolution and its representation in climate models will therefore be substantial for reducing uncertainty in projections of regional precipitation change in a warming climate.

Author Contributions

M.S.M. conceived the study, performed the analysis and wrote the original draft of the paper. M.J.A. conducted literature reviews and contributed to the study design. All the authors contributed to interpreting the results and made improvements to the paper. All authors have read and agreed to the published version of the manuscript.

Funding

This research received no external funding.

Institutional Review Board Statement

Not applicable.

Informed Consent Statement

Not applicable.

Data Availability Statement

The precipitation observations used in this study are from the Global Precipitation Climatology Project (GPCP) Version 3.3 monthly dataset, which is publicly available from the NASA Goddard Earth Sciences Data and Information Services Center (GES DISC) at https://cmr.earthdata.nasa.gov/search/concepts/C3405935516-GES_DISC.html accessed on 15 February 2026. Climate model simulations from the Coupled Model Intercomparison Project Phase 5 (CMIP5), including historical and RCP8.5 experiments, are publicly available through the Earth System Grid Federation (ESGF) archive at https://esgf-data.dkrz.de/search/esgf-dkrz/ accessed on 15 February 2026. The AMOC-sensitivity experiment data from [31] used in this study are publicly available at Zenodo: https://doi.org/10.5281/zenodo.15200598. No new datasets were generated during this study; all analyses were performed using publicly available data.

Conflicts of Interest

The authors declare no competing interests.

References

  1. Buckley, M.W.; Marshall, J. Observations, inferences, and mechanisms of the Atlantic meridional overturning circulation: A review. Rev. Geophys. 2016, 54, 5–63. [Google Scholar] [CrossRef] [Scilit]
  2. Weijer, W.; Cheng, W.; Drijfhout, S.S.; Fedorov, A.V.; Hu, A.; Jackson, L.C.; Liu, W.; McDonagh, E.L.; Mecking, J.V.; Zhang, J. Stability of the Atlantic meridional overturning circulation: A review and synthesis. J. Geophys. Res. Ocean. 2019, 124, 5336–5375. [Google Scholar] [CrossRef] [Scilit]
  3. Broecker, W. Abrupt climate change: Causal constraints provided by the paleoclimate record. Earth-Sci. Rev. 2000, 51, 137–154. [Google Scholar] [CrossRef] [Scilit]
  4. Rahmstorf, S. Thermohaline ocean circulation. Encycl. Quat. Sci. 2006, 5, 191. [Google Scholar]
  5. Clement, A.C.; Peterson, L.C. Mechanisms of abrupt climate change of the last glacial period. Rev. Geophys. 2008, 46. [Google Scholar] [CrossRef] [Scilit]
  6. Lenton, T.M.; Held, H.; Kriegler, E.; Hall, J.W.; Lucht, W.; Rahmstorf, S.; Schellnhuber, H.J. Tipping elements in the earth’s climate system. Proc. Natl. Acad. Sci. USA 2008, 105, 1786–1793. [Google Scholar] [CrossRef] [Scilit]
  7. Johnson, H.L.; Cessi, P.; Marshall, D.P.; Schloesser, F.; Spall, M.A. Recent contributions of theory to our understanding of the Atlantic meridional overturning circulation. J. Geophys. Res. Oceans 2019, 124, 5376–5399. [Google Scholar] [CrossRef] [Scilit]
  8. Collins, M.; Knutti, R.; Arblaster, J.; Dufresne, J.-L.; Fichefet, T.; Friedlingstein, P.; Gao, X.; Gutowski, W.J.; Johns, T.; Krinner, G.; et al. Long-term climate change: Projections, commitments and irreversibility. In Climate Change 2013-The Physical Science Basis: Contribution of Working Group I to the Fifth Assessment Report of the Intergovernmental Panel on Climate Change; Cambridge University Press: Cambridge, UK, 2013; pp. 1029–1136. [Google Scholar]
  9. Bellomo, K.; Angeloni, M.; Corti, S.; von Hardenberg, J. Future climate change shaped by inter-model differences in Atlantic meridional overturning circulation response. Nat. Commun. 2021, 12, 3659. [Google Scholar] [CrossRef] [Scilit]
  10. Worthington, E.L.; Moat, B.I.; Smeed, D.A.; Mecking, J.V.; Marsh, R.; McCarthy, G.D. A 30-year reconstruction of the Atlantic meridional overturning circulation shows no decline. Ocean Sci. 2021, 17, 285–299. [Google Scholar] [CrossRef] [Scilit]
  11. Rahmstorf, S.; Box, J.E.; Feulner, G.; Mann, M.E.; Robinson, A.; Rutherford, S.; Schaffernicht, E.J. Exceptional twentieth-century slowdown in Atlantic Ocean overturning circulation. Nat. Clim. Change 2015, 5, 475–480. [Google Scholar] [CrossRef] [Scilit]
  12. Caesar, L.; McCarthy, G.; Thornalley, D.; Cahill, N.; Rahmstorf, S. Current Atlantic meridional overturning circulation weakest in last millennium. Nat. Geosci. 2021, 14, 118–120. [Google Scholar] [CrossRef] [Scilit]
  13. Arias, P.; Bellouin, N.; Coppola, E.; Jones, R.; Krinner, G.; Marotzke, J.; Naik, V.; Palmer, M.; Plattner, G.-K.; Rogelj, J.; et al. Climate Change 2021: The Physical Science Basis. Contribution of Working Group I to the Sixth Assessment Report of the Intergovernmental Panel on Climate Change; Technical Summary; IPCC: Geneva, Switzerland, 2021. [Google Scholar]
  14. Manabe, S.; Stouffer, R.J. Simulation of abrupt climate change induced by freshwater input to the north Atlantic Ocean. Nature 1995, 378, 165–167. [Google Scholar] [CrossRef] [Scilit]
  15. Vellinga, M.; Wood, R.A. Global climatic impacts of a collapse of the Atlantic thermohaline circulation. Clim. Change 2002, 54, 251–267. [Google Scholar] [CrossRef] [Scilit]
  16. Jackson, L.; Kahana, R.; Graham, T.; Ringer, M.; Woollings, T.; Mecking, J.; Wood, R. Global and European climate impacts of a slowdown of the AMOC in a high resolution GCM. Clim. Dyn. 2015, 45, 3299–3316. [Google Scholar] [CrossRef] [Scilit]
  17. Brayshaw, D.J.; Woollings, T.; Vellinga, M. Tropical and extratropical responses of the north Atlantic atmospheric circulation to a sustained weakening of the MOC. J. Clim. 2009, 22, 3146–3155. [Google Scholar] [CrossRef] [Scilit]
  18. Woollings, T.; Gregory, J.M.; Pinto, J.G.; Reyers, M.; Brayshaw, D.J. Response of the north Atlantic storm track to climate change shaped by ocean–atmosphere coupling. Nat. Geosci. 2012, 5, 313–317. [Google Scholar] [CrossRef] [Scilit]
  19. Frierson, D.M.; Hwang, Y.-T.; Fučkar, N.S.; Seager, R.; Kang, S.M.; Donohoe, A.; Maroon, E.A.; Liu, X.; Battisti, D.S. Contribution of ocean overturning circulation to tropical rainfall peak in the northern hemisphere. Nat. Geosci. 2013, 6, 940–944. [Google Scholar] [CrossRef] [Scilit]
  20. Mimi, M.S.; Liu, W. Atlantic meridional overturning circulation slowdown modulates wind-driven circulations in a warmer climate. Commun. Earth Environ. 2024, 5, 727. [Google Scholar] [CrossRef] [Scilit]
  21. Burckel, P.; Waelbroeck, C.; Gherardi, J.M.; Pichat, S.; Arz, H.; Lippold, J.; Dokken, T.; Thil, F. Atlantic Ocean circulation changes preceded millennial tropical south America rainfall events during the last glacial. Geophys. Res. Lett. 2015, 42, 411–418. [Google Scholar] [CrossRef] [Scilit]
  22. Parsons, L.A.; Yin, J.; Overpeck, J.T.; Stouffer, R.J.; Malyshev, S. Influence of the Atlantic meridional overturning circulation on the monsoon rainfall and carbon balance of the American tropics. Geophys. Res. Lett. 2014, 41, 146–151. [Google Scholar] [CrossRef] [Scilit]
  23. Wang, C.; Dong, S.; Evan, A.T.; Foltz, G.R.; Lee, S.-K. Multidecadal covariability of north Atlantic sea surface temperature, African dust, Sahel rainfall, and Atlantic hurricanes. J. Clim. 2012, 25, 5404–5415. [Google Scholar] [CrossRef] [Scilit]
  24. Moon, S.; Ha, K.-J. Future changes in monsoon duration and precipitation using cmip6. npj Clim. Atmos. Sci. 2020, 3, 45. [Google Scholar] [CrossRef] [Scilit]
  25. Wang, X.-Y.; Zhu, J.; Xin, M.; Song, C.; Li, Y.; Zhou, Y.; Li, X. Weakened seasonality of the African rainforest precipitation in boreal winter and spring driven by tropical SST variabilities. Geosci. Lett. 2021, 8, 22. [Google Scholar] [CrossRef] [Scilit]
  26. Mimi, M.S.; Ahmed, M.K.; Chowdhury, K.A.; Chowdhury, M.N.S.; Moontahab, A. The influence of climate variability events on the mesoscale eddies in the Bay of Bengal. J. Sea Res. 2024, 201, 102532. [Google Scholar] [CrossRef] [Scilit]
  27. Reintges, A.; Martin, T.; Latif, M.; Keenlyside, N.S. Uncertainty in twenty-first century projections of the Atlantic meridional overturning circulation in cmip3 and cmip5 models. Clim. Dyn. 2017, 49, 1495–1511. [Google Scholar] [CrossRef] [Scilit]
  28. Weijer, W.; Cheng, W.; Garuba, O.A.; Hu, A.; Nadiga, B.T. Cmip6 models predict significant 21st century decline of the Atlantic meridional overturning circulation. Geophys. Res. Lett. 2020, 47, e2019GL086075. [Google Scholar] [CrossRef] [Scilit]
  29. Huffman, G.J.; Adler, R.F.; Behrangi, A.; Bolvin, D.T.; Nelkin, E.J.; Gu, G.; Ehsani, M.R. The new version 3.2 global precipitation climatology project (gpcp) monthly and daily precipitation products. J. Clim. 2023, 36, 7635–7655. [Google Scholar] [CrossRef] [Scilit]
  30. Taylor, K.E.; Stouffer, R.J.; Meehl, G.A. An overview of cmip5 and the experiment design. Bull. Am. Meteorol. Soc. 2012, 93, 485–498. [Google Scholar] [CrossRef] [Scilit]
  31. Meccia, V.L.; Blázquez, J. Impacts of a reduced AMOC on the south America mean climate and extremes. J. Geophys. Res. Atmos. 2025, 130, e2025JD044103. [Google Scholar] [CrossRef] [Scilit]
  32. Zhang, X.; Liu, H.; Zhang, M. Double ITCZ in coupled ocean-atmosphere models: From cmip3 to cmip5. Geophys. Res. Lett. 2015, 42, 8651–8659. [Google Scholar] [CrossRef] [Scilit]
  33. Adam, O.; Schneider, T.; Brient, F. Regional and seasonal variations of the double-ITCZ bias in cmip5 models. Clim. Dyn. 2018, 51, 101–117. [Google Scholar] [CrossRef] [Scilit]
  34. Tian, B.; Dong, X. The double-ITCZ bias in cmip3, cmip5, and cmip6 models based on annual mean precipitation. Geophys. Res. Lett. 2020, 47, e2020GL087232. [Google Scholar] [CrossRef] [Scilit]
  35. Shimizu, M.; Sampaio, G.; Venancio, I.; Maksic, J. Seasonal changes of the south American monsoon system during the mid-Holocene in the cmip5 simulations. Clim. Dyn. 2020, 54, 2697–2712. [Google Scholar] [CrossRef] [Scilit]
  36. Zhang, R.; Delworth, T.L. Simulated tropical response to a substantial weakening of the Atlantic thermohaline circulation. J. Clim. 2005, 18, 1853–1860. [Google Scholar] [CrossRef] [Scilit]
  37. Allen, R.J.; Lee, Y.-C.; Thomas, A.; Duarte, D.; Mimi, M.S.; Li, K.-Y.; Wenzel, B.; Jeon, J.-G.; Clifton, O.E. Atmospheric chemistry enhances the climate mitigation potential of tree restoration. Commun. Earth Environ. 2025, 6, 367. [Google Scholar] [CrossRef] [Scilit]
  38. Liu, W.; Fedorov, A.V.; Xie, S.-P.; Hu, S. Climate impacts of a weakened Atlantic meridional overturning circulation in a warming climate. Sci. Adv. 2020, 6, eaaz4876. [Google Scholar] [CrossRef] [Scilit]
  39. Bellomo, K.; Mehling, O. Impacts and state-dependence of AMOC weakening in a warming climate. Geophys. Res. Lett. 2024, 51, e2023GL107624. [Google Scholar] [CrossRef] [Scilit]
  40. Marshall, J.; Donohoe, A.; Ferreira, D.; McGee, D. The ocean’s role in setting the mean position of the inter-tropical convergence zone. Clim. Dyn. 2014, 42, 1967–1979. [Google Scholar] [CrossRef] [Scilit]
  41. Vilela, I.; De Luca, P.; Koseki, S.; Silva, T.; Veleda, D.; Keenlyside, N. AMOC weakening modulates global warming impacts on precipitation over Brazil. npj Clim. Atmos. Sci. 2025, 8, 369. [Google Scholar] [CrossRef] [Scilit]
  42. Cerato, G.; Bellomo, K.; D’Agostino, R.; Von Hardenberg, J. Multimodel evidence of future tropical Atlantic precipitation change modulated by AMOC decline. J. Clim. 2025, 38, 3093–3107. [Google Scholar] [CrossRef] [Scilit]
  43. Mimi, M.S.; Chowdhury, K.A.; Moontahab, A.; Khan, T.S.; Hoquee, M.A. Influence of high temperature on different plankton ecology in the future ocean: Modeling approach. BIMRAD J. 2025, 6, 28–47. [Google Scholar] [CrossRef] [Scilit]
Figure 1. AMOC Timeseries. (a) AMOC strength (see Methods Section 2.2) derived from 10 CMIP5 models (1850–2100), and (b) time series of the strong AMOC weakening group (model mean, red) versus the weak AMOC weakening group (model mean, blue).
Meteorology 05 00008 g001
Figure 2. Comparison of the global distribution of precipitation between observations and models. Global changes in annual mean precipitation for the periods (a,b) 2000–2024 between observations (GPCPv3.3) and 10 CMIP5 models, respectively. Panel (c) shows the difference between (a) and (b). The right panels show the corresponding zonal mean precipitation anomalies (purple; mm/day).
Meteorology 05 00008 g002
Figure 3. Global distribution and zonal mean of annual mean precipitation anomalies associated with AMOC weakening experiments. (a) a14 − ctrl, (b) a07 − ctrl, and (c) a07 − a14. Shading shows precipitation differences (mm/day), and the stipples refer to the regions where changes are not significantly different from zero at the 95% confidence level of Student’s t-test. The right panels show the corresponding zonal mean precipitation anomalies (purple; mm/day). Experiments follow the AMOC perturbation framework described in [31].
Meteorology 05 00008 g003
Figure 4. Global trends in annual mean precipitation from CMIP5 models. Global trends in annual mean precipitation (mm/day/decade) for the periods (a,b) 2000–2024 and (d,e) 2076–2100 for the strong and weak AMOC weakening groups. Panels (c) and (f) show the differences between (a) and (b), and (d) and (e), respectively. The stipples refer to the regions where changes are significantly different from zero at the 95% confidence level of Student’s t-test.
Meteorology 05 00008 g004
Figure 5. Regression between AMOC and mean precipitation. Intermodel comparison for the periods (a,b) 2000–2024 and (d,e) 2076–2100 between strong and weak AMOC weakening. Panels (c) and (f) show the differences between (a) and (b), and (d) and (e), respectively. The precipitation response to a 1-Sv AMOC decline (shading in Sv) is estimated via linear regression based on inter-model differences in annual mean precipitation and AMOC strength over 2000–2024 and 2076–2100, relative to 1961–1980, for the strong AMOC weakening group (ACCESS1.0, ACCESS1.3, CSIRO-Mk3.6, MPI-ESM-LR) and the weak AMOC weakening group (MPI-ESM-MR, NorESM1-ME, NorESM1-M, CMCC-CMS, IPSL-CM5A-LR, IPSL-CM5B-LR) (see Methods Section 2.2).
Meteorology 05 00008 g005
Figure 6. AMOC impact on surface air temperature, low-level winds, and sea level pressure. Responses to reduced AMOC strength derived from AMOC-sensitivity experiments based on [31]. Panels (a–c) show differences between the a14 experiment (moderate AMOC weakening) and the control simulation, while panels (d–f) show differences between the a07 experiment (strong AMOC weakening) and the control. (a,d) Surface air temperature anomalies (K); (b,e) 850-hpa zonal wind anomalies (m s−1); (c,f) sea level pressure anomalies (hPa). Stippling indicates regions where anomalies are not statistically significant.
Meteorology 05 00008 g006
Table 1. Names and institutions of 10 CMIP5 models used in this study.
No.Model NameInstitution, Country
1ACCESS1-0Commonwealth Scientific and Industrial Research Organization (CSIRO)/Bureau of Meteorology, Australia.
2ACCESS1-3
3CMCC-CMSEuro-Mediterranean Center on Climate Change, Italy
4CSIRO-Mk3-6-0CSIRO Climate Change Centre of Excellence, Australia.
5IPSL-CM5A-LRInstitute Pierre-Simon Laplace, France.
6IPSL-CM5B-MR
7MPI-ESM-LRMax Planck Institute for Meteorology, Germany.
8MPI-ESM-MR
9NorESM1-MNorwegian Climate Centre, Norway.
10NorESM1-ME
Table 2. Percentage decline in AMOC strength for each CMIP5 model relative to the 1961–1980 baseline during the early (2000–2024) and late (2076–2100) periods, used to classify models into strong and weak AMOC-weakening groups.
AMOC (Sv)%ΔAMOC
Model1961–19802000–20242076–21002000–20242076–2100Category
ACCESS1-018.8416.979.68−9.93−48.61Strong-weakening
ACCESS1-320.5217.2910.85−15.76−47.16Strong-weakening
CSIRO-Mk3-6-020.0419.1813.01−4.27−35.08Strong-weakening
MPI-ESM-LR22.5420.7315−8.01−33.44Strong-weakening
MPI-ESM-MR18.6817.5712.53−5.96−32.95Weak-weakening
NorESM1-ME32.1929.4621.73−8.48−32.51Weak-weakening
NorESM1-M31.4630.1521.98−4.16−30.14Weak-weakening
IPSL-CM5A-LR11.4510.888−4.94−30.08Weak-weakening
IPSL-CM5B-LR2.82.222.08−20.67−25.52Weak-weakening
CMCC-CMS13.91410.980.75−20.97Weak-weakening
Disclaimer/Publisher’s Note: The statements, opinions and data contained in all publications are solely those of the individual author(s) and contributor(s) and not of MDPI and/or the editor(s). MDPI and/or the editor(s) disclaim responsibility for any injury to people or property resulting from any ideas, methods, instructions or products referred to in the content.