


Abstract
Natural gas is increasingly used in stationary spark-ignition engines because of its abundance, high octane rating, and lower carbon dioxide emissions than conventional liquid fuels. Blending hydrogen into natural gas pipelines enables large-scale transport, but pipeline compressor engines must run directly on this blended gas. Many prior hydrogen blending studies on such engines have predominantly relied on idealized indoor testing platforms coupled with dynamometer loading to isolate the impact of hydrogen addition; however, this study experimentally evaluated hydrogen blends on a six-cylinder, four-stroke industrially representative engine-compressor unit loaded by a closed natural gas compression loop operating under open-air ambient conditions to analyze the system-level response to hydrogen addition. Additionally, emissions were characterized by using a high-resolution FTIR MKS 2030 MultiGas analyzer. Natural gas–hydrogen blends containing 0–30% hydrogen by volume were tested in 5% increments. Natural gas flow generally decreased with hydrogen addition, while brake thermal efficiency increased at all operating conditions. Relative to the natural gas baseline, methane emissions decreased by as much as 47%, volatile organic compounds by 62%, and carbon monoxide by 94%; however, NOx emissions increased by as much as 324%. Carbon dioxide emissions increased by up to 12% at lower loads and decreased by up to 13% at higher loads. At 30% hydrogen, the equivalence ratio decreased by 6.25% at the lowest tested load and 8.28% at the highest tested load. Hydrogen blending can, therefore, improve efficiency and reduce carbon-based emissions in industrial, rich-burn engines, but the accompanying NOx increase and leaner operation warrant further testing with adjusted spark timing and controlled equivalence ratio.
1. Introduction
Global energy demands continue to grow, forcing the consumption of renewable and fossil fuel energy sources to reach all-time highs [1,2,3,4]. Currently, fossil fuels make up 86% of the global energy mix, continuing to serve as the backbone of our energy system, ensuring that fossil fuels remain critical contributors to the world’s energy supply for decades to come [1]. Internal combustion engines are a reliable option in transportation and stationary power sectors due to their impressive power densities and thermal efficiencies [5]. The increasing consumption of fossil fuels coupled with concerns over global warming and environmental protection have pushed researchers to seek less carbon-intense alternative fuels [6,7,8,9,10,11]. Natural gas (NG) is at the forefront of this research, as it is quite abundant and produces fewer carbon-based emissions than traditional fuels, such as gasoline and diesel [5,6,12,13,14]. This versatile resource presently constitutes approximately 23% of global energy consumption and about 34% in North America [1].
Natural gas has varying configurations, but its main constituent methane (CH4) can make up to 99% of its total composition [6,15]. Natural gas is the cleanest-burning fossil fuel due to its low carbon to hydrogen ratio, and it is easily transported and stored [15]. Furthermore, natural gas has a high-octane number, making it highly resistant to engine knock and suitable for cleaner, more efficient combustion [5]. Also, NG can be reproduced renewably [16]. However, controlling CH4 emissions from NG engines is important, as they have 25–34 times the global warming potential (GWP) of CO2 on a 100-year basis [17,18].
In addition to methane, butane, ethane, propane, and a few other higher hydrocarbons are some commonly found components within natural gas [15]. These higher hydrocarbons cause notable volatile organic compound (VOC) emissions [6]. Moreover, rich-burn and stoichiometric natural gas engines have lower air–fuel ratios (AFRs) than lean-burn engines, typically studied in a natural gas and hydrogen blending context [19]. This increase in fuel content in-cylinder can lead to higher carbon and hydrocarbon emissions [20]. To combat this, hydrogen can be blended with natural gas to increase flame propagation, and ultimately improve combustion, while further lowering the total carbon to hydrogen ratio [21,22]. With less carbon content and more complete combustion, regulated emissions, such as methane, carbon monoxide (CO), and carbon dioxide (CO2), can be significantly reduced [23]. Moreover, the increase of nitrogen oxide (NOx) emissions, which is generally considered the biggest drawback of natural gas–hydrogen (HNG) blending, can be mitigated by coupling four stroke engines with advanced exhaust aftertreatment systems [6,23,24,25].
Hydrogen (H2) is the most common element in the universe, which makes the resource an attractive alternative fuel option when considering its decarbonizing potential, ease of production, and versatility [6,26,27,28]. Hydrogen can be manufactured from renewable resources, and it can be blended with diesel, gasoline, and natural gas alike [21]. HNG blends have become a focal point in alternative fuel research within the last two decades due to blending’s potential to decrease emissions, reduce fuel consumption, and increase combustion stability and efficiency [29,30,31,32,33]. Moreover, the idea of blending hydrogen into existing natural gas infrastructure is gaining popularity due to the complications with pure hydrogen transportation, such as hydrogen embrittlement [4,8,34,35]. Blended fuels also provide flexibility in fuel composition depending on the operating condition rather than a fixed fuel [22]. This allows switching to the most suitable blend composition for specific operating conditions, guided by the fuel properties detailed in Table 1.
Table 1.
Fuel properties [6,7,20,36,37].
In our previous study, Hassan et al. [6] tested up to 30% H2 by volume HNG blends on a 17 L, SI, one-cylinder, two-stroke engine with a power rating of 61 kW. The blends were tested at three different loading conditions: 40%, 60%, and 70% of the rated load. The experimental results show that H2 addition improves CH4, CO2, NOx, and VOCs with maximum reductions being 49, 17, 95, and 70%, respectively. CO emissions increase at 40% and 60% loads but decrease at 70%. Moreover, HNG blending shortens burn duration and reduces coefficient of variations (COVs) of indicated mean effective pressure (IMEP) for all loads, with a maximum reduction of 23%. H2 addition increases indicated thermal efficiency (ITE) by 3.9, 5.9, and 5.8% at 40, 60, and 70% loads, respectively.
Katsampes et al. [23] studied the impact of HNG blends for H2 concentrations up to 30% by volume on an eight-cylinder, stoichiometric, turbocharged engine with 18 L displacement, a compression ratio of 10.25:1, and a power rating of 400 BHP at 1800 RPM. Their results reveal decreasing ignition delay and increasing peak in-cylinder pressures with increasing hydrogen content. Peak in-cylinder pressure also approaches top dead center (TDC) with increasing H2. Additionally, CO, CO2, CH4, and hydrocarbon (HC) emissions decrease with increasing H2. Moreover, the brake thermal efficiency (BTE) increases after 10% H2, and fuel flow decreases with hydrogen addition.
Chapman et al. [38] studied the impact of HNG blends up to 30% H2 by volume on a Ford 4.2 L, six-cylinder, four-stroke, SI engine with a compression ratio of 9.3:1. Their stoichiometric results reveal that 20% H2 by volume is the optimal blend for the tested engine. The 20% H2 blend resulted in a maximum increase of ~3% in BTE with H2 addition. Additionally, the maximum reductions in CO and NOx were 45% and 31%, respectively. They also conclude that retarding the ignition timing will further reduce emissions and torque.
Huang et al. [7] investigated the performance and emission impacts of natural gas–hydrogen mixtures on a three-cylinder, SI lean automotive engine at 10%, 20%, and 26% hydrogen concentrations. The study shows that the use of HNG blends in a lean-burn configuration increases NOx emissions and raises thermal efficiency while lowering emissions of HCs. The lean-burn limit additionally increases using HNG blends.
Kahraman et al. [20] tested a Ford 1.8 L, SI, four-cylinder, four-stroke automotive engine using HNG blends up to 30% hydrogen concentration. HCs, CO, and CO2 emissions decrease with the substitution of base natural gas with an HNG blend. Peak in-cylinder pressure decreases due to increasing AFRs achieved through the use of HNG blends. Thermal efficiency also increases with increasing concentrations of H2.
Ma et al. [39] tested up to 50% by volume H2 blends at various air to fuel ratios on an in-line, six-cylinder, 6.234 L engine with a compression ratio of 10.5:1 at idle conditions. Their results indicate that combustion stability and thermal efficiency increase with increasing H2 at all tested AFRs. Additionally, CH4 emissions and burn duration decrease with increasing H2. This paper also notes that retarded spark timing was essential to minimizing NOx and CH4 emissions.
De Simio et al. [21] evaluated the impact of 15% and 25% HNG blends on a heavy duty, in-line, six-cylinder engine with a power rating of 200 kW at 2100 RPM and a compression ratio of 11:1. The study used two operating strategies with respect to pure natural gas: iso-MFB50 (constant combustion phasing) and iso-NOx (constant NOx emissions). MFB50 represents the crank angle where 50% of the fuel mass is burned. At iso-MFB50, increasing hydrogen content increased thermal efficiency and NOx emissions while reducing CO, CO2, and THC emissions. At iso-NOx, efficiency improvements and reduced CO, CO2, and THC emissions were still observed. An important conclusion of this study was that HNG blends’ combustion evolution and NOx emissions can be maintained with respect to baseline CNG with spark timing calibration.
Prior studies have largely lacked industry-relevant testing platforms, relying primarily on heavily controlled indoor test cells and fixed-load dynamometers. This study is novel in that testing is conducted entirely on an outdoor integrated engine-compressor platform exposed to ambient environmental fluctuations, and the engine is loaded via an active, simulated gas compression flow loop rather than a conventional dynamometer, allowing the system to experience system pressure-driven loading typical of field operations. Also, exhaust emissions were quantified using a MKS 2030 MultiGas analyzer, a highly accurate system that reflects the comprehensive, all-in-one measurement configurations required for field emissions compliance testing. In this study, we conduct an experimental investigation of HNG blends on a four-stroke, rich-burn, carbureted, industrial engine. The engine is an integrated engine-compressor unit like those commonly deployed in field gathering, pipeline transmission, and underground gas storage applications. The test unit is commercially classified as a ‘rich-burn’ natural gas engine, a standard industry designation used to distinguish near-stoichiometric platforms from lean-burn architectures. In this paper, this term designates the engine class and nominal control architecture rather than indicating that every operating point is strictly rich. Blending H2 directly into existing natural gas pipeline networks represents a viable pathway for large-scale hydrogen distribution and industry decarbonization; however, because field compressor drivers must operate on the line gas they compress, evaluating their operational viability on HNG fuel blends is critical [3,4]. One primary objective is to evaluate how an unmodified industrial engine performs with hydrogen blends under authentic operating conditions, with a focus on fuel mass flow rates, system-level performance, and exhaust emissions.
The purpose of the study is to better understand hydrogen’s impact on the system-level response of a practical engine’s performance and emissions at various operating conditions, especially at partial loads, as the equivalence ratio is not controlled. Here, the engine powers the integrated compressor, which provides the mechanical load, operating across 140–200 Nm and 900–1400 RPM. This study will focus on regulated emissions, such as CH4, CO, CO2, NOx, and VOCs, and combustion metrics, like BTEs and fuel consumption. Understanding how different HNG blends behave under changing engine parameters, and identifying trends in combustion and emissions, will provide insights into optimizing HNG blend ratios to minimize emissions and maximize performance across all loading conditions. The empirical datasets generated across this operating envelope provide an experimental validation benchmark for system-level and process modeling. Integrating engine performance and emission curves into software allows us to simulate fuel demand, pipeline hydraulics, and emissions under HNG blend scenarios before actual large-scale field deployment.
2. Results and Discussion
In this section, the trends in fuel consumption, BTEs, emissions, and AFRs against H2 concentrations are discussed in detail for different operating conditions. HNG blends were tested from 0 to 30% H2 by volume at 5% increments across the operational envelope of the engine, i.e., from 900 to 1400 RPM and 140 to 200 Nm. The BTEs were calculated while the emissions, such as NOx, CO, CO2, CH4, and VOCs, were measured and corrected to grams per horsepower hour in the exhaust for each H2 concentration. These parameters were found at each H2 concentration.
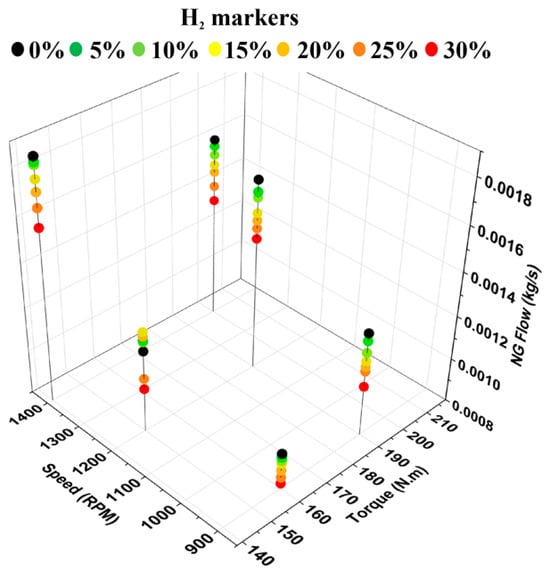
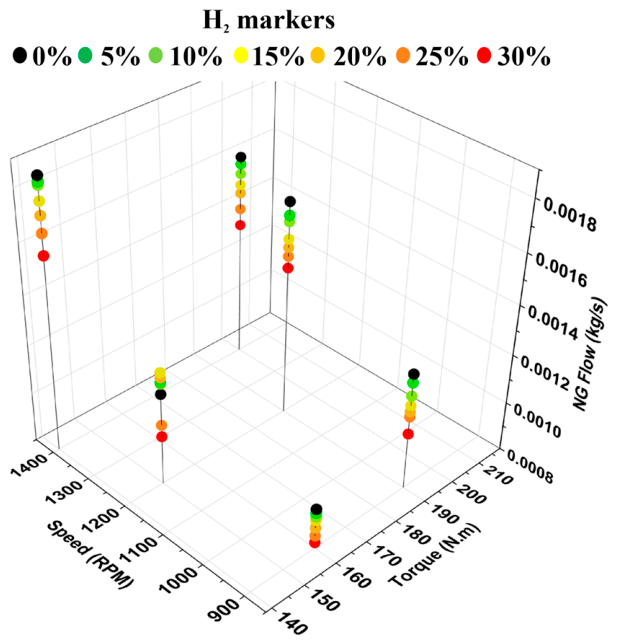
To better understand and explain emissions and BTE fluctuations, NG fuel flow is plotted first for various HNG blends across the operating envelope of the engine in Figure 1. In most cases, NG flow steadily falls as H2 fraction increases, consistent with fuel displacement and hydrogen’s contribution to combustion energy, but for the loading point at 1200 RPM and 150 (Nm) there is a rise in NG flow up to about 15% H2 before dropping toward the 30% value. A repeat trial at this setpoint confirmed that this behavior was consistent and not an instrument or procedural artifact. While localized closed-loop fueling dynamics under this load may play a role, the precise mechanism remains unconfirmed in the absence of in-cylinder diagnostics. Beyond this localized point, fuel consumption and emissions conformed to expected monotonic trends across all conditions. The maximum percent reduction in NG consumption was 19% at 900 RPM and 190 (Nm) for 30% H2. These changes in NG consumption highlight that NG flow could be actively managed through controlled H2 injection, enabling strategic reductions in NG consumption and targeted emissions reductions, both of which are advantageous for stationary oil and gas power applications, where compliance with emission regulations and engine performance are critical.
Figure 1.
Natural gas flows at varied torque and speed.
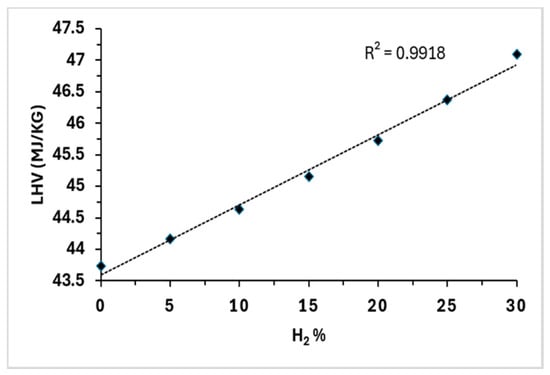
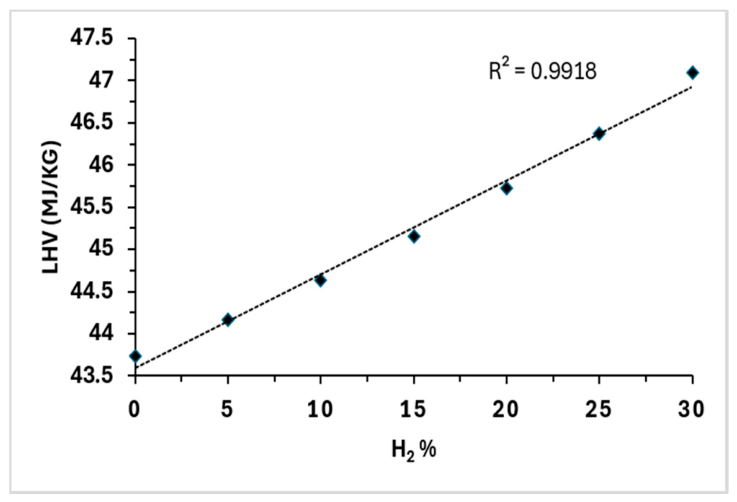
Figure 2 demonstrates the gravimetric lower heating value (LHV) for 0–30% by volume HNG blends used in this study. The figure demonstrates a steady, linear increase in fuel LHV by weight with increasing H2 concentrations. The LHV increases from pure NG’s LHV value of 43.7 MJ/kg to 47.1 MJ/kg at 30% H2 by volume. The observed reduction in NG mass flow, coupled with the higher gravimetric LHV of H2 blends, allows the engine to meet the required load with reduced fuel mass throughput; specifically, the total fuel mass flow rate decreases at a proportionally greater rate than the corresponding shift in lower heating value, driving the apparent increase in BTE. Furthermore, the accompanying decarbonization and enhanced combustion rates associated with H2 addition are likely contributors to lower carbon-based emissions without an observable penalty in engine performance.
Figure 2.
LHV versus H2 concentration by volume.
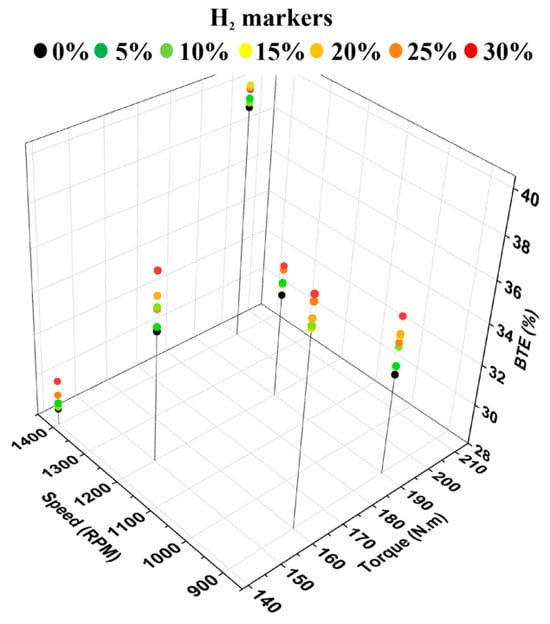
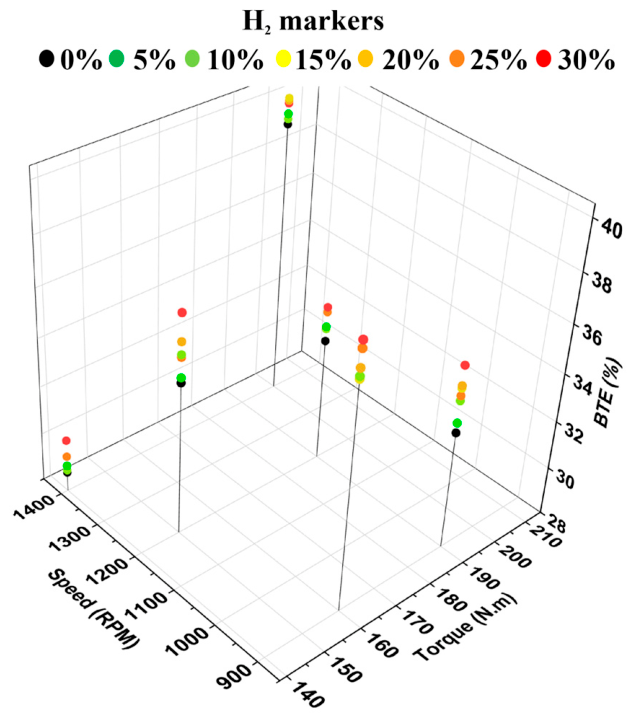
Figure 3 shows the BTEs at various H2 concentrations mapped across the engine operation at different speeds and torques. As shown in the figure below, BTEs increase with H2 addition at all operating conditions. The maximum BTE of 40% is observed at 1400 RPM, 200 Nm, and 15% H2. The greatest increase in BTE from baseline data is 2.7 percentage points and is seen at 1200 RPM, 150 Nm, and 30% H2. In general, the lower speed, lower torque points saw the greatest increases in BTEs with H2. These improvements may be attributed to hydrogen’s higher flame speed, which enhances mixture homogeneity and accelerates flame propagation during earlier phases of combustion. As seen in prior literature [6,23], the initial higher flame speed tends to cause increased peak in-cylinder pressure and it occurs closer to the TDC, leading to better conversion of chemical energy into mechanical work. These improvements in thermal efficiency align with the results of Katsampes et al. [23], Chapman et al. [38], and De Simio et al. [21], who also reported consistent efficiency gains with hydrogen enrichment.
Figure 3.
BTEs at varied torque and speed.
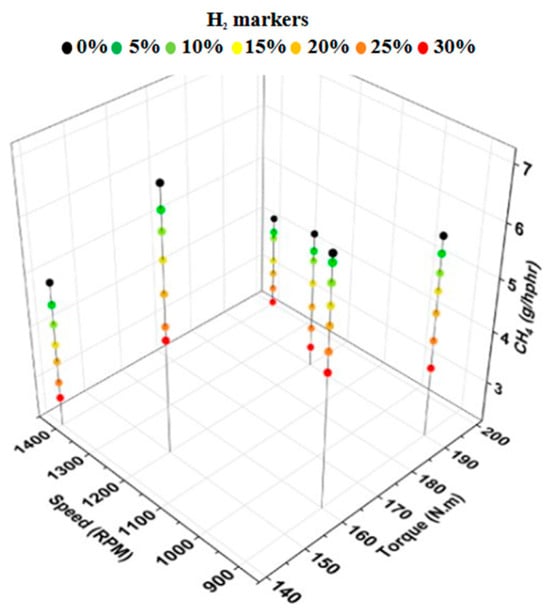
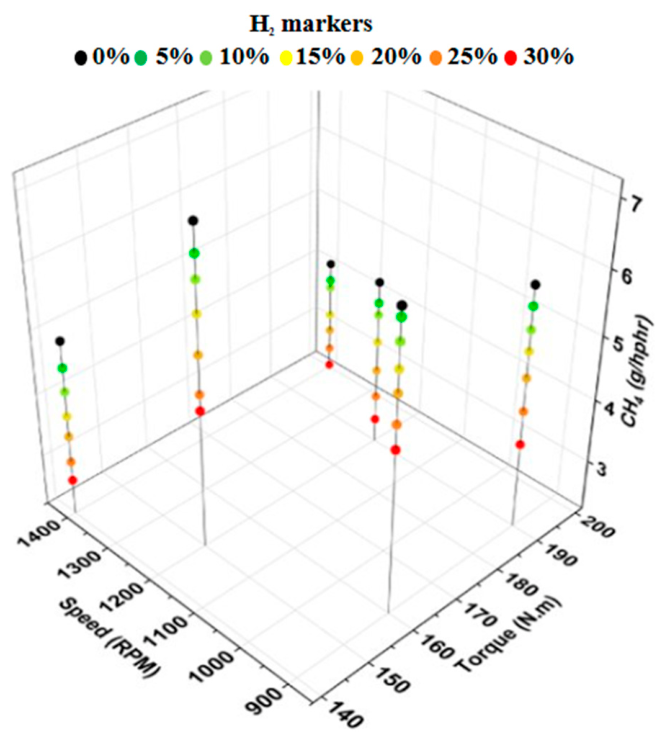
Figure 4 shows the CH4 emissions of various HNG blends plotted against various engine speeds and torques. CH4 emissions under all conditions decreased with increasing H2 concentrations. For higher speeds, 1400 RPM, baseline emissions dropped significantly as combustion efficiency increased with engine load; however, at this RPM there were still notable CH4 reductions of 45% and 44% at torques of 140 Nm and 200 Nm, respectively, with 30% by volume H2 addition. The greatest reduction in CH4 emissions from baseline was recorded at a lower loading, with 30% H2 seeing the maximum reduction of 47% CH4 emissions at 1200 RPM and 190 Nm. The reduction in CH4 emissions observed across all operating points is consistent with universal findings throughout the literature, where H2 addition consistently reduces unburned CH4. These emission reductions are likely a result of more complete combustion due to hydrogen’s lower ignition energy and higher flame speed, which lead to a more complete combustion of the fuel mixture, reducing the amount of unburned fuel. Also, NG flow decreases with increasing H2 concentrations, reducing the amount of methane prior to combustion. The combined effects of fuel decarbonization and enhanced combustion significantly reduce CH4 emissions from a rich-burn NG engine, which has a strong impact on the engine’s environmental footprint due to methane’s GWP.
Figure 4.
CH4 emissions at varied torque and speed.
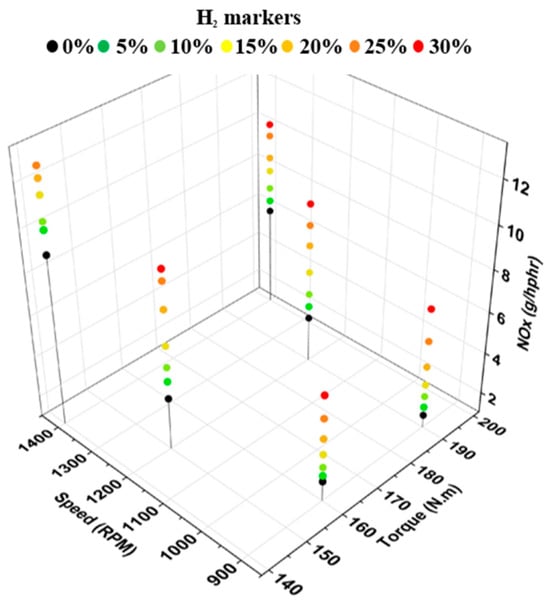
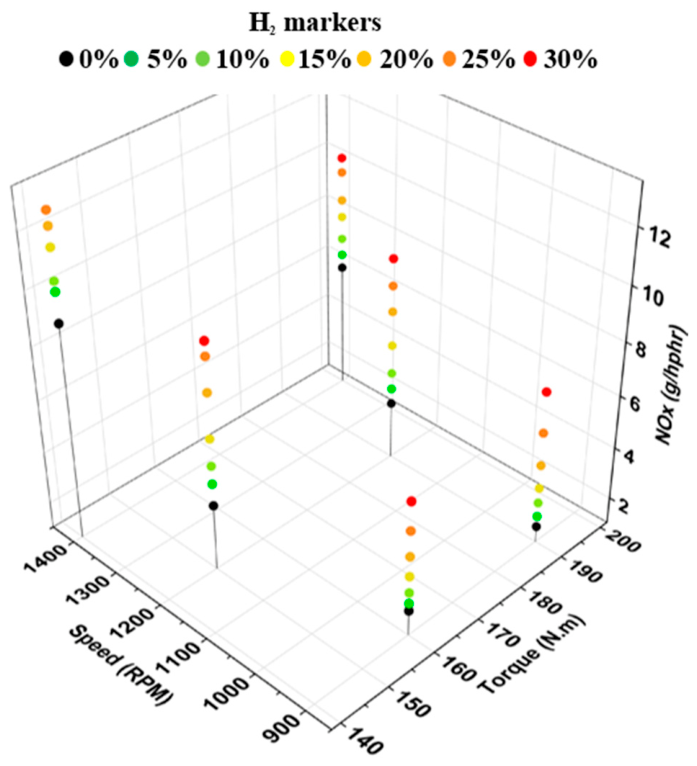
Figure 5 shows the NOx emissions of HNG blends plotted across the engine’s operating range. Every HNG blend saw increased NOx emissions compared to baseline data. NOx emissions increased sharply with higher RPM and higher torque. This is likely due to the elevated in-cylinder pressures and temperatures associated with greater power demand, which intensify NOx formation. Furthermore, at all but one point, NOx emissions increased with increasing H2 concentration. The maximum percentage increase in NOx emissions from baseline data was 324% and was observed at 900 RPM, 190 Nm, and 30% H2. H2 had the least impact on NOx emissions at 1400 RPM, seeing smaller percentage increases of 36% and 74% at 140 Nm and 200 Nm, respectively. This increase in NOx emissions follows the same trend observed by Huang et al. [7] and De Simio et al. [21]. The increase in NOx emissions with H2 addition may be attributed to hydrogen’s faster flame speed and higher adiabatic flame temperature, which lead to higher in-cylinder temperatures and pressures [23]. Furthermore, the system shifted toward leaner operation as H2 displaced NG mass flow. Although the platform is nominally designated as a rich-burn unit, mechanical carburetion without an electric, closed-loop air–fuel ratio control resulted in certain speed-load setpoints operating slightly lean across the blend sweep. This shift increases free oxygen availability, likely compounding the thermal effects of hydrogen’s accelerated combustion kinetics and elevated flame temperature. The emissions in this study were evaluated prior to the engine’s exhaust aftertreatment to establish baseline engine-out behavior. These industrial rich-burn natural gas engines typically rely on three-way catalysts to mitigate instances of NOx increases while preserving reductions in the carbon emissions [23,24,25].
Figure 5.
NOx emissions at varied torque and speed.
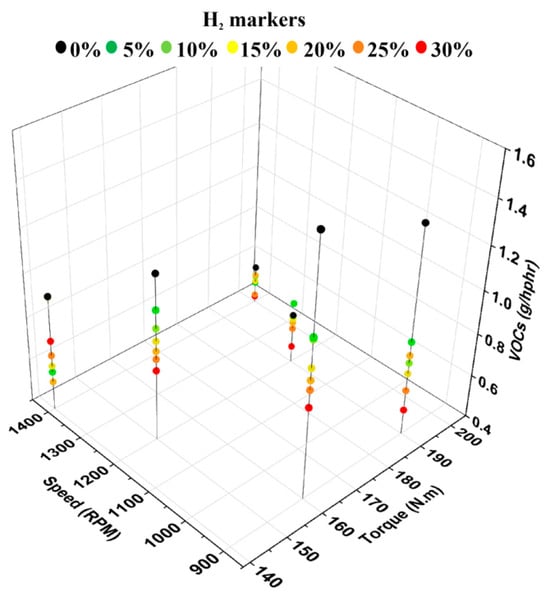
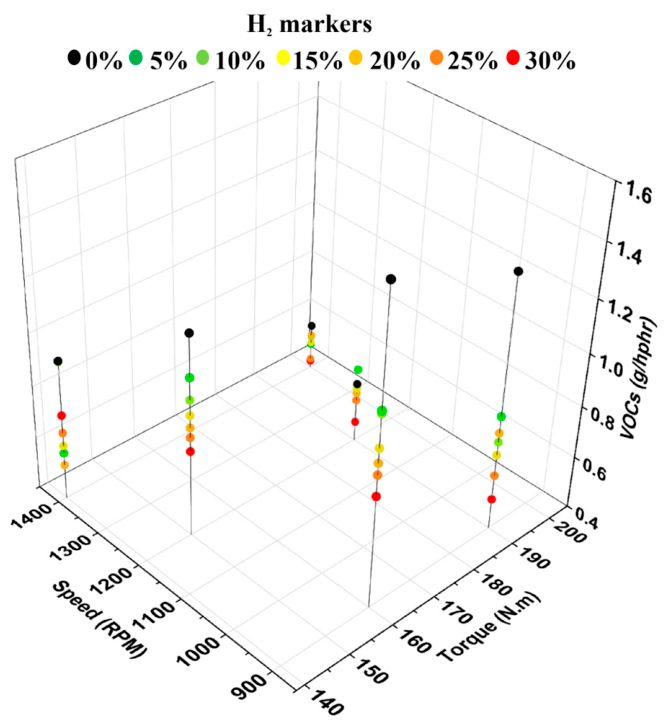
Figure 6 shows the VOC emissions of all HNG blends plotted across the torque and speed. VOCs decreased significantly with increasing RPM. At higher engine speeds, the increased velocities of air and fuel can improve mixture homogeneity, especially for carbureted engines, leading to more complete combustion, lowering VOC emissions. Baseline VOC emissions dropped by roughly 60% from 900 to 1400 RPM from the change in engine speed alone. Furthermore, the addition of H2 significantly reduced VOC emissions at all operating conditions. The maximum percent reduction in VOC emissions of 62% occurred with the 30% HNG fuel at 900 RPM and 190 Nm. Other significant reductions include a 47% drop at 900 RPM, 160 Nm, and 30% H2 and 43% drop at 1400 RPM, 140 Nm, and 20% H2. These VOC reductions are consistent with findings by Hassan et al. [6] and mirror the general decline in total hydrocarbon emissions observed across prior HNG studies [7,20,21,23]. VOC emissions originate both from hydrocarbons already present in the fuel and from incomplete combustion. In carbureted engines, imperfect mixture preparation, locally rich pockets, and flame quenching near walls and crevices limit oxidation during combustion, allowing precursor VOCs and partially oxidized VOC species to escape as VOC emissions. Both increasing engine speed and enriching with H2 improve mixture homogeneity and accelerate flame propagation, reducing the formation and survival of unburned hydrocarbon species throughout the combustion process.
Figure 6.
VOC emissions at varied torque and speed.
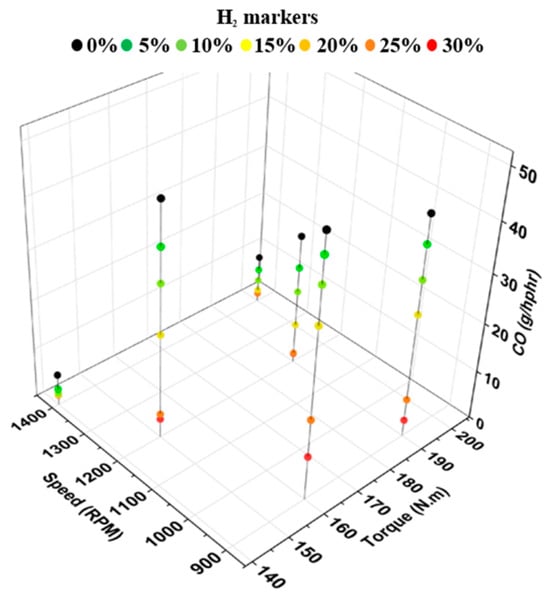
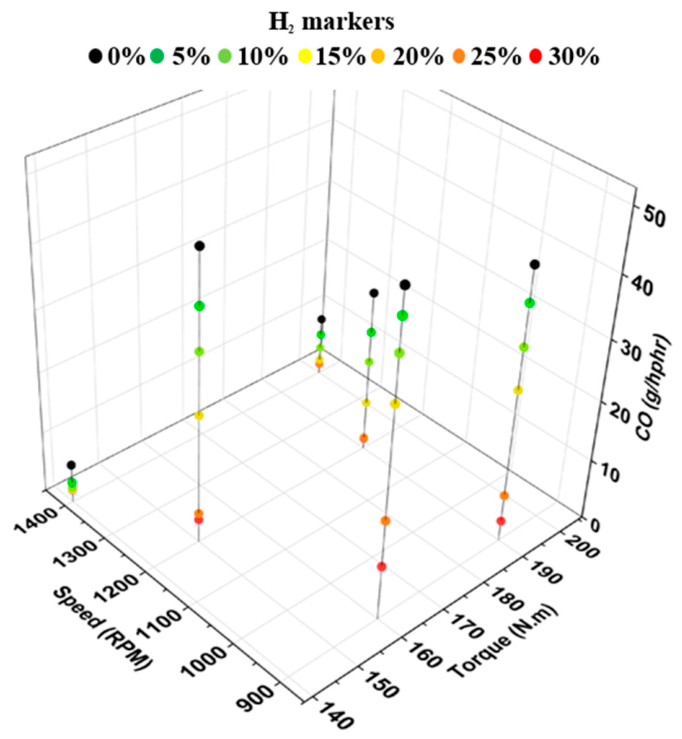
Figure 7 shows CO emissions of the HNG blends plotted across engine speed and torque ranges. CO baseline emissions drop dramatically with increased engine speed. At 900 RPM, baseline CO concentrations were highest likely due to slower combustion and poorer air and fuel mixing, but increasing engine speed to 1400 RPM resulted in an approximately 80% reduction in CO emissions even before H2 addition, demonstrating a substantial improvement in combustion completeness. The addition of H2 to the system further reduced CO emissions, likely through increasing flame speed, enhancing mixture reactivity, and lowering the C/H ratio. The maximum percent reduction of 94% was recorded at 1200 RPM and 190 Nm for the 30% HNG blend. Other reductions were between 68% and 92% at 30% H2. These reductions in CO emissions align with the findings of Katsampes et al. [23], Chapman et al. [38], and Kahraman et al. [20]. Such significant reductions indicate that the introduction of H2 substantially improved the overall combustion efficiency, leaving far less unburned carbon monoxide in the exhaust. Hydrogen’s higher flame speed and reactivity tend to promote faster and more complete combustion. Pockets of fuel-rich combustion are a driving factor in CO production, so, by promoting a more uniform and rapid flame propagation, H2 addition minimizes the occurrence of these rich zones. This ensures that a greater portion of the carbon in the fuel is fully oxidized to CO2 rather than remaining as CO. This can be observed in Figure 8, as the addition of H2 leads to increases in CO2 emissions.
Figure 7.
CO emissions at varied torque and speed.
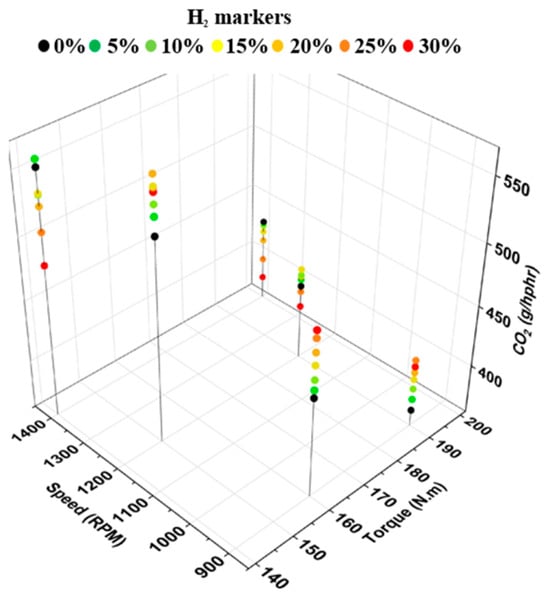
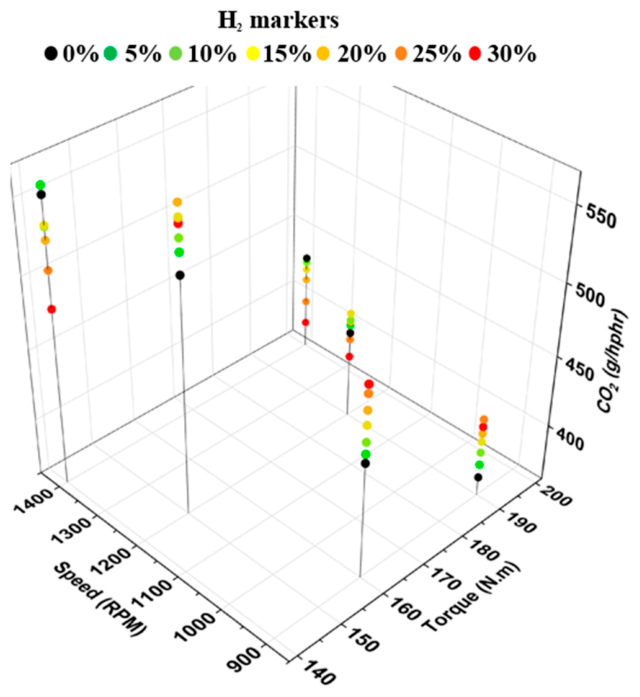
Figure 8.
CO2 emissions at varied torque and speed.
Figure 8 presents the measured CO2 emissions of HNG blends across varying torque and engine speed conditions. For pure NG, CO2 emissions increased significantly with an increase in RPM. At higher engine speeds, the air–fuel mixture became more homogeneous due to the increased intake speeds of air in the carburetor and cylinder. This in turn caused a more complete combustion of the fuel. Furthermore, at the higher speed of 1400 RPM, the addition of H2 decreased the amount of CO2 produced. This happens because H2 flow decreases the carbon content of the fuel. Lower speeds saw an increase of CO2 with H2 addition because at these loading conditions, H2’s impact on combustion completeness outweighs its decarbonizing factor. The maximum increase in CO2 emissions was 12% and it occurred at 900 RPM for 190 and 160 Nm. The maximum reduction in CO2 was 13% at 1400 RPM and 140 Nm with the 30% HNG blend.
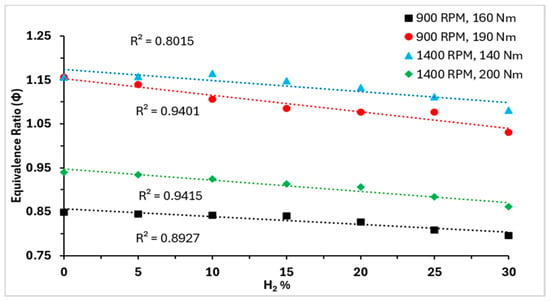
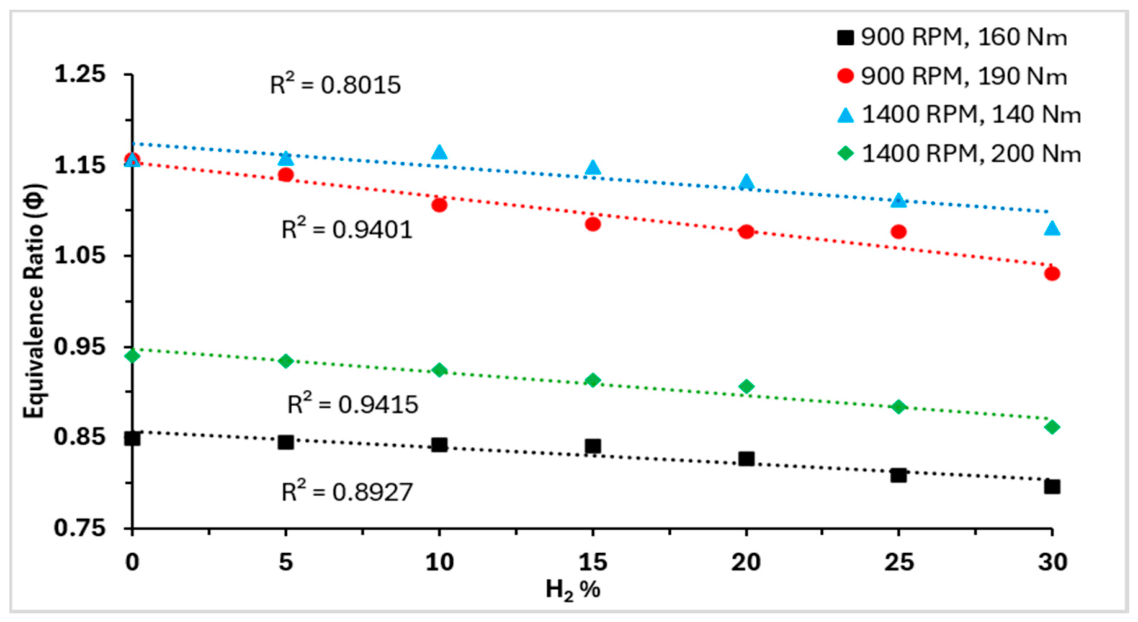
Figure 9 shows the equivalence ratio of the engine at all H2 concentrations and tested engine loading conditions. For all loading conditions, the addition of H2 led to decreases in the equivalence ratios. The maximum percentage decreases in equivalence ratio for 900 RPM, 160 Nm and 1400 RPM, 200 Nm are 6.25% and 8.28%, respectively. It was observed that increasing H2 flow rates decreased the fuel flow rate to the engine, while the air flow rate was measured to be constant for all blends at their respective loading condition, lowering the equivalence ratios. The decreased equivalence ratio indicates leaner combustion for higher H2 blends compared to baseline NG, as evident in the equivalence ratios presented in Figure 9. The decreased equivalence ratios show that not only does the H2 addition improve flame propagation, but it also makes the engine operation leaner, which helps in reduction of emissions such as CO and VOCs.
Figure 9.
Equivalence ratio vs. H2 percentage by volume.
3. Materials and Methods
The experiments were conducted at the Open-Air Laboratory of the Sustainable Energy and Carbon Management Center (SECM) at the University of Oklahoma (OU). The laboratory replicates practical oil and gas field operations by simulating NG compression in an outdoor testing environment. The experiments employed an integrated engine-compressor unit connected to an experimental gas-flow loop designed to simulate high-pressure compression conditions, allowing the compressor load, and therefore engine load, to include minor load variations in response to subtle changes in gas flow and system pressure rather than being prescribed by a fixed dynamometer load. The outdoor setup subjected the engine to real-world ambient temperature and humidity shifts typical of field installations, though these ambient variations were not evaluated as test variables. Testing HNG blends under such conditions, therefore, provides field-relevant data that can be directly applied to industrial compressor operations.
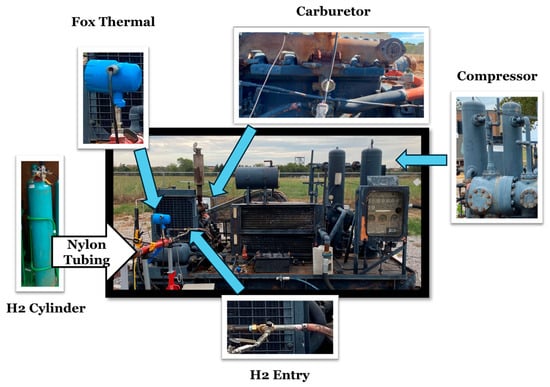
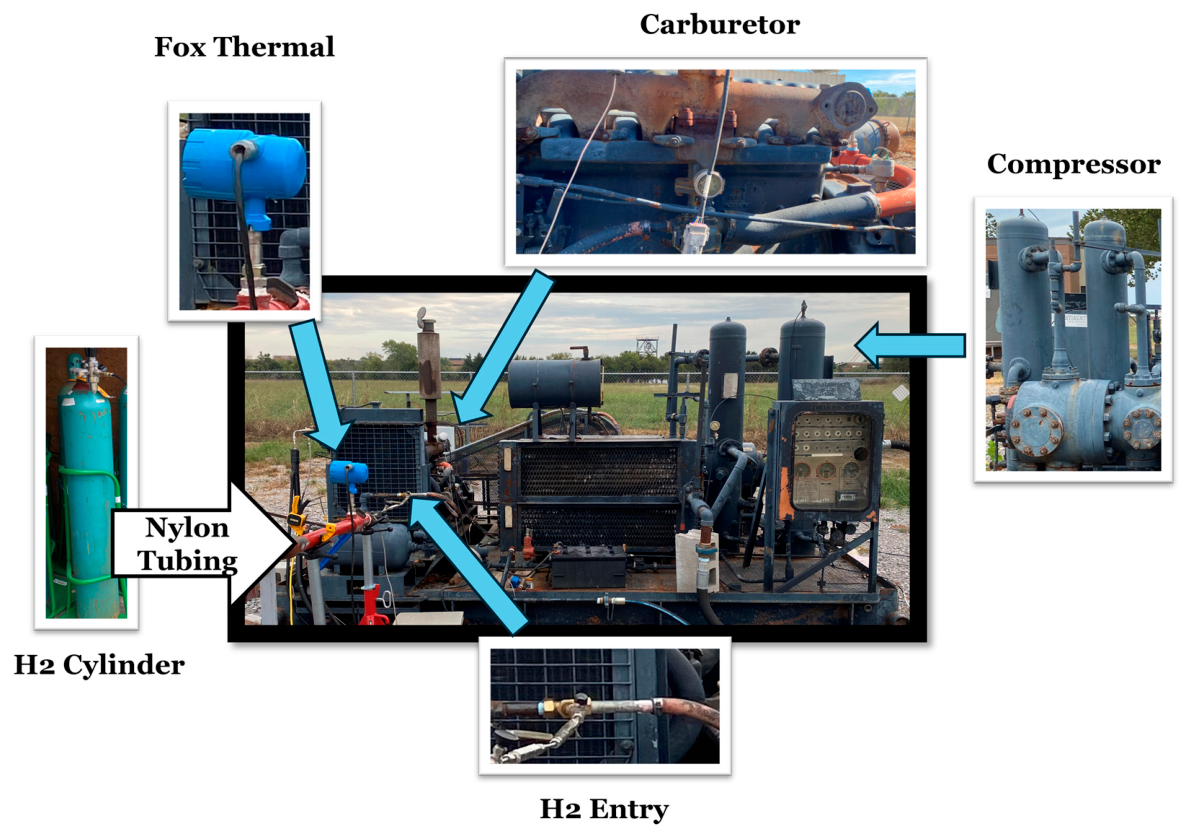
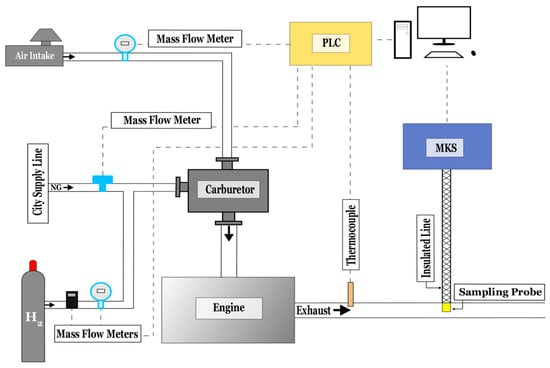
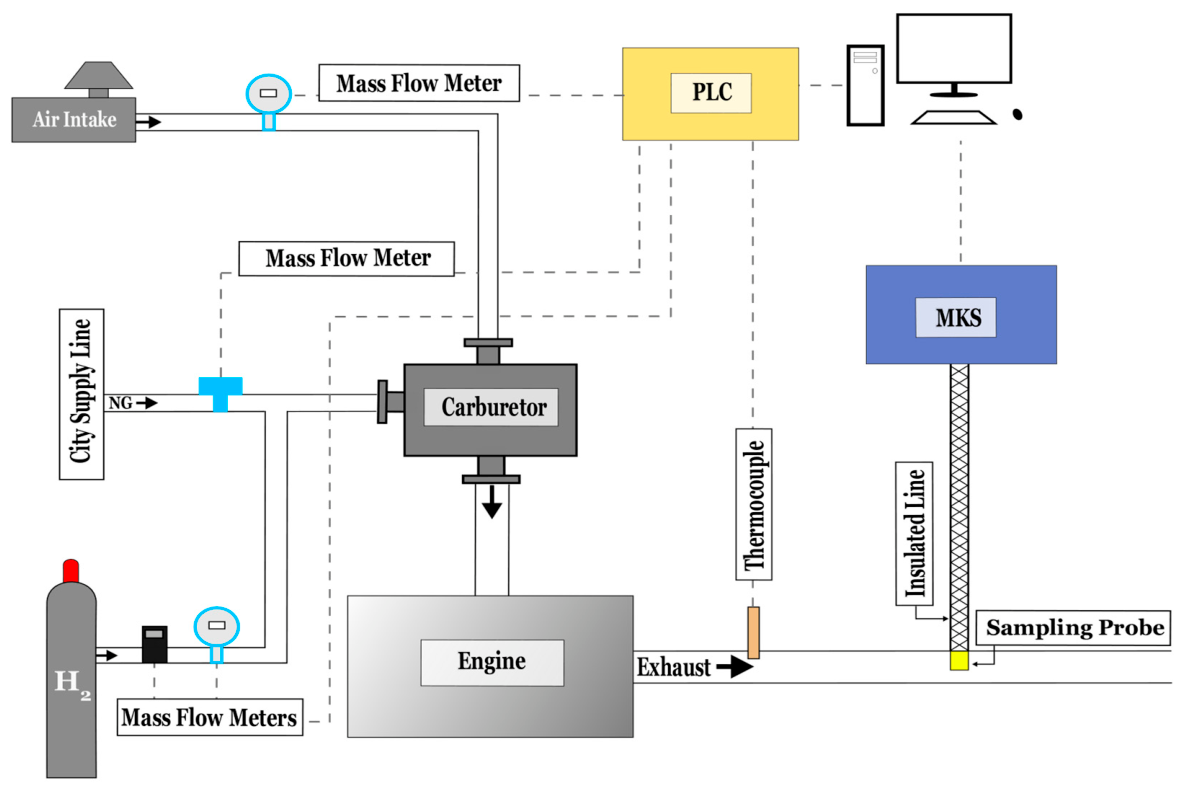
Figure 10 and Figure 11 below show the integrated engine-compressor unit along with different components/instruments and the schematic diagram of the experimental setup, respectively. Table 2 provides instrument models along with available accuracy and ranges. The compressor and engine revolutions per minute (RPM) are measured with an AI-Tek magnetic pickup sensor (AI-Tek Instruments, LLC, Cheshire, CT, USA) attached to the flywheel on the unit’s singular crankshaft. Suction and discharge pressures are measured using Omega pressure transducers (Omega Engineering, Inc., Norwalk, CT, USA). Because the experimental architecture coupled the engine directly to the flow loop without an in-line dynamometer, engine torque calculations are based on compressor brake powers, which are formulaically calculated using the following compressor parameters: suction pressure, discharge pressure, swept volume, and compressor RPM. Exhaust temperature is measured with a k-type thermocouple. A Fox Thermal FT1 mass flow meter (Fox Thermal, Marina, CA, USA) measures intake air flow rate, and a Coriolis mass flow meter (Micro Motion, Inc., Boulder, CO, USA) is used to record NG flow rate. Two other mass flow rate sensors (Fox Thermal FT1 and Omega FMA-1607A series) record the H2 flow rate. The FT1 is installed in series with the Omega sensor since the Omega sensor could not measure larger flow rates of H2 required to reach higher percent by volume concentrations.
Figure 10.
Engine and hydrogen blending setup.
Figure 11.
Schematic diagram of experimental setup.
Table 2.
Instrument specifications.
The sensor outputs are fed to a programmable logic controller (PLC) (WAGO Corporation, Germantown, WI, USA) at a rate of 1 Hz and displayed in real time on the e!COCKPIT HMI (version 1.11.2.0). The NG used in this experiment is from city supply lines of which no data are available for the exact composition. To isolate the operational effects of H2 under field conditions, a fixed, standardized fuel composition was assumed across all data points and calculations with fuel property values cited from previous works in Table 1. Because the pipeline natural gas composition was held uniform using cited baseline properties, absolute values of LHV, equivalence ratio, and criteria emissions contain a consistent compositional offset; consequently, these metrics are evaluated strictly as relative comparative trends across H2 blend fractions. While absolute values must be interpreted with caution, the high precision of the MKS MultiGas 2030 FTIR spectrometer (<2% of reading) (MKS Instruments, Inc., Andover, MA, USA) minimizes random error between individual measurements, thereby preserving the validity of observed trajectories and relative changes across fuel blends. The ultra-pure H2 (at least 99.9% pure) from Airgas (Airgas, Inc., Radnor, PA, USA) is blended with the NG. The H2 cylinders are attached to the engine via ¼” stainless steel (Swagelok Company, Solon, OH, USA) and nylon tubes (Lokotool, Florence, NJ, USA) coupled with H2-specific pressure regulators, shut-off valves, and flashback arrestors. The H2 line is easily fed to the engine with a T-Piece connector prior to the engine’s carburetor, ensuring sufficient mixing of air, H2, and NG. H2 flow is regulated and held constant with the manual use of valves and regulators. The simplicity of H2 installation in this study highlights the potential value of retrofitting similar industrial engines with HNG blends.
The engine specifications for the engine tested, an Arrow Waukesha VRG-330 (Waukesha Engine, Waukesha, WI, USA), are presented in Table 3. The engine utilizes an unmodified mechanical gas carburetor with fixed throttle settings across each test sweep. Direct in-cylinder pressure data were not recorded during testing; therefore, interpretations involving cylinder pressure, flame speed, and combustion timing represent plausible mechanisms supported by literature rather than empirical measurements. Because blends were tested without active equivalence ratio control, the effects of hydrogen addition and changing equivalence ratio are coupled. The natural gas fuel flow rate was unregulated, while the hydrogen fuel flow rate was adjusted using a gas cylinder pressure regulator and manual ball valves. Each flow was regulated individually upstream of the mixing manifold. For each test setpoint, these valves, and therefore flow rates, were set and held fixed throughout stabilization and data logging windows, ensuring steady fuel supply rates, which were then averaged over the data logging window. H2 blend fractions were determined on a volumetric basis by dividing the measured volumetric flow rate of H2 by the total combined fuel flow rate. Under the fixed-throttle operation of the mechanical carburetor, introducing H2 gas upstream naturally displaced NG volume, reducing the NG flow rate. Because no closed-loop air–fuel ratio controller was implemented, blending hydrogen into the primary natural gas supply caused the mixture to drift toward leaner operation as hydrogen displaced natural gas mass flow. The engine utilizes a fixed-timing spark plug ignition system, ensuring that spark advance was held constant across all test sweeps. Although the engine is equipped with an industrial three-way catalyst, exhaust sampling was conducted directly upstream of the aftertreatment system to isolate raw, engine-out combustion behavior.
Table 3.
Engine specifications.
Pure NG and HNG blends were tested at various loading conditions and up to 30% H2 concentration by volume with an increment of 5%. HNG blends did not pass the 30% threshold, as the continuous combustion of higher H2 blends can lead to critically high in-cylinder pressures, increased backfire and pre-ignition risk, and significantly higher thermal loads because of H2’s faster flame speed, higher adiabatic flame temperature, and extremely low ignition energy. Moreover, higher H2 concentrations can cause embrittlement and damage the engine material. This raises concerns about operator safety and engine integrity. The engine performance in terms of emissions and BTE was mapped across different speed and torque points.
An MKS 2030, a Fourier transform infrared (FTIR) spectroscopy analyzer, measures the emissions of CH4, CO, CO2, NOx, VOCs, and more. However, it cannot measure species present at higher concentrations, specifically O2 and N2. A FTIR device is a very precise instrument that identifies and quantifies concentrations of species in a mixture by recognizing the unique infrared absorption patterns of the molecules present. In this study, engine exhaust is drawn from a sampling probe located upstream of the engine catalysts, then transported to the MKS device through heated, insulated lines for analysis to prevent sample alteration or degradation. By ensuring sample integrity and eliminating response delays, this continuous single-instrument configuration emulates industrial Continuous Emissions Monitoring Systems (CEMS) commonly used to capture emission shifts under dynamic field-scale engine loads in compliance testing. The accompanying MG2000 software (version 10.7) allows real-time monitoring of emission concentrations and the ability to save the data in various formats. The MKS data were logged at 0.0667 Hz in the software.
To ensure data reliability, a ten-minute stabilization period was maintained following any change in engine speed, compressor load, or hydrogen blend fraction. For each data point, operational data were subsequently logged in the PLC continuously at 1 Hz for five-minute intervals, yielding 300 synchronized observations per operating condition. Reported values for fuel flow rates, compressor pressures, and engine RPM represent time-averaged steady-state means across this 300 s window. The corresponding brake load torque was calculated from the temporal averages. The emissions’ data were logged at a sampling rate of 15 s, resulting in 20 independent measurements over the five-minute testing interval. These data were also averaged over the temporal window. Given that these averages consist purely of continuous sampling periods rather than randomized multi-day trials, the results are evaluated strictly as observational trends without inferred statistical significance. Time-averaging across these stable windows ensured representative steady-state values rather than random noise, with observed fuel-blend shifts substantially exceeding the sensor tolerances in Table 2. For reporting and matrix classification, each nominal operating condition was rounded to the nearest 100 RPM and 10 Nm to improve visual clarity of general trends.
Theory and Calculations
The equations shown below are used to quantify engine performance under different HNG blends. Equation (1) measures the work produced by the engine based on the integrated compressor’s work. Because the compressor is coupled to the engine via a belt-driven system, the compressor work is directly powered by the engine’s crankshaft. The system brake power is then calculated using the compressor RPM and compressor work in Equation (2). The relation of the engine crankshaft RPM with the compressor shaft RPM is provided in Equation (3). Equation (4) determines the engine torque from measured brake power and engine RPM, and Equation (5) calculates BTE using the work output of the engine. Together, they determine engine load and show how hydrogen affects load, mechanical output, and efficiency:
where:
- W = work (J),
- V = swept volume of compressor cylinder (m3),
- Ps = suction pressure (Pa),
- Pd = discharge pressure (Pa),
- n = polytropic index (1.4),
- Pb = brake power (W),
- Ncomp = compressor shaft rotational speed (RPM),
- Neng = engine crankshaft rotational speed (RPM),
- Dcomp = compressor shaft pitch diameter (m),
- Deng = engine crankshaft pitch diameter (m),
- T = torque (Nm),
- BTE = brake thermal efficiency (%),
- = mass flow rate of fuel per second (kg/s),
- LHV = lower heating value (J/kg).
Brake power in this study was inferred from compressor thermodynamics using a fixed polytropic index (n = 1.4) based on a simple isentropic assumption. In-cylinder pressure instrumentation was unavailable to empirically determine the polytropic index across operating conditions. However, because operating speed, pressure ratios, and mechanical hardware were held constant throughout testing, any residual bias behaves as an invariant systematic offset in the polytropic index, n. Utilizing this idealized index overpredicts gas compression work, but the simultaneous omission of mechanical friction and belt-drive losses underpredicts shaft demand. Because these approximations act in opposing directions, they partially offset one another and reduce the net deviation from true brake output. Experimental measurement precision is largely governed by physical instrumentation, whose specifications and rated accuracies are detailed in Table 2. Consequently, the inferred metrics are utilized to evaluate relative comparative trends across fuel blends rather than absolute point values, ensuring that the observed trajectories in thermal efficiency and emissions with increasing H2 fraction remain methodologically robust.
The wet basis parts per million (ppm) data of CH4, CO, CO2, NOx, and VOCs as well as the exhaust moisture percentage were obtained via the MKS 2030. These emissions data were first converted to a dry basis using Equation (6). This practice is consistent with the reporting conventions outlined in 40 CFR Part 60 Subpart JJJJ [40]. The dry basis ppm emissions data were then converted to mole fractions using Equation (7). From here, the mass fraction of each constituent (CH4, CO, CO2, NOx, and VOCs) was determined with Equation (8), where the remaining exhaust mass was attributed to N2. Near stoichiometric combustion tends to leave little residual O2. Furthermore, due to the proximity of molecular weights between O2 (32.00 g/mol) and N2 (28.01 g/mol), there is a negligible offset in mass fraction calculations. Finally, the constituent mass fractions were utilized alongside total exhaust mass flow (the combined mass flow of NG, H2, and air) and engine horsepower per hour to find grams per horsepower hour using Equation (9). This adjustment standardizes the emissions to a common reference frame, allowing direct comparison across different engines, operating conditions, and fuel blends, in line with the Environmental Protection Agency’s (EPA) emissions testing protocols [40]:
where:
- ppmvd = parts per million on dry basis (ppm),
- ppmvw = parts per million on wet basis (ppm),
- %H2OExhaust = exhaust moisture (%),
- xi = mole fraction of species i,
- mfi = mass fraction of species i,
- MWi = molecular weight of species i (g/mol),
- = total molecular weight of exhaust gas mixture (g/mol),
- = total mass flow rate of air and fuel (g/hr),
- hp = calculated horsepower (hp).
4. Conclusions
HNG blends were tested on a rich-burn, SI engine from 0 to 30% H2 by volume, and the engine performance in terms of BTEs and the emissions were analyzed across an operating range of 900–1400 RPM and 140–200 Nm loads. The results showed promising improvements in the engine performance with the use of HNG blends:
- For each operating point, except for 1400 RPM, 200 Nm, the highest BTEs were observed for the highest HNG blend, i.e., at 30% H2. The maximum improvement in BTE was 2.7 percentage points for the 1200 RPM, 150 Nm case at 30% H2.
- A significant decline was observed in the CH4 emissions with the addition of H2 at each operating condition. The maximum reduction in CH4 emissions was 47% for the 1200 RPM, 190 Nm case at 30% H2.
- The VOC, CO, and CO2 emissions declined significantly at 30% H2. The emission reductions were monotonic for VOC and CO emissions with the addition of H2. However, the CO2 emissions increased (maximum 12%) at 900 RPM, 160 and 190 Nm loads. The exact reductions were 62% for VOCs at 900 RPM, 190 Nm, 94% for CO emissions at 1200 RPM, 190 Nm, and 13% for CO2 emissions at 1400 RPM, 140 Nm.
- NOx emissions increased monotonically with the addition of H2. Maximum increase in NOx emissions was 324% for the 900 RPM, 190 Nm case. This pronounced engine-out increase highlights the vital role of the downstream three-way catalyst in mitigating post-combustion NOx while preserving carbon reductions.
- Engine air flow rates remained constant for each RPM and load scenario. The engine began to run more lean with increased H2 concentrations due to the constant air flow rate and decreasing NG flow rates for all tested conditions.
In general, the lower carbon intensity of HNG blends compared to NG, further assisted by the faster flame speeds of H2 and improved energy utilization, helped reduce the carbon-based emissions and improve the BTEs. Within the evaluated speed and load envelope, these results demonstrate the operational feasibility of utilizing HNG blends in the tested Arrow/Waukesha VRG-330 architecture and similar industrial rich-burn engines operating on pipeline natural gas, without requiring major mechanical retrofits. Future investigations will include HNG blends on the engine at varied spark timings and constant equivalence ratios.
Author Contributions
Conceptualization, R.S., K.C., H.A.H. and P.K.; methodology, R.S., K.C., H.A.H. and P.K.; software, R.S., K.C., H.A.H. and P.K.; validation, R.S., K.C., H.A.H. and P.K.; formal analysis, R.S., K.C. and H.A.H.; investigation, R.S., K.C. and H.A.H.; resources, P.K.; data curation, R.S., K.C. and H.A.H.; writing—original draft preparation, R.S., K.C. and H.A.H.; writing—review and editing, P.K.; visualization, R.S., K.C., H.A.H. and P.K.; supervision, P.K.; project administration, P.K.; funding acquisition, P.K. All authors have read and agreed to the published version of the manuscript.
Funding
This material is based upon work supported by the U.S. Department of Energy, Office of Fossil Energy and Carbon Management, under Award Numbers DE-FE0031863 and DE-FE0032300.
Institutional Review Board Statement
Not applicable.
Informed Consent Statement
Not applicable.
Data Availability Statement
The data presented in this study are available from the corresponding author upon reasonable request. During the preparation of this manuscript, the authors used Google Gemini Advanced to assist language editing and refine textual clarity. Following this assistance, the authors thoroughly reviewed, evaluated, and edited all suggested revisions. No AI-generated text or edits were incorporated into the final manuscript without direct author consultation and approval. The authors take full responsibility for the integrity, accuracy, and content of the published work.
Conflicts of Interest
The authors declare no conflicts of interest.
References
- Davenport, J.; Wayth, N. Statistical Review of World Energy; Energy Institute: London, UK, 2023. [Google Scholar]
- Duan, Y.; Yang, J.; Duan, X.; Liu, L.; Long, J.; Mi, H. Dynamic characteristics of flame and shock wave evolution in hydrogen-blended natural gas explosions under the coupling of explosion-venting interlayer and porous materials in utility tunnels. Int. J. Hydrogen Energy 2025, 103, 1013–1032. [Google Scholar] [CrossRef] [Scilit]
- Ouyang, B.; Sun, D.; Yu, Y.; Hu, Z.; Wu, M. Simulation and analysis of leakage characteristics in hydrogen-blended natural gas pipelines. Int. J. Hydrogen Energy 2025, 99, 888–897. [Google Scholar] [CrossRef] [Scilit]
- Rosa, N.; Fereidani, N.A.; Cardoso, B.J.; Martinho, N.; Gaspar, A.; da Silva, M.G. Advances in hydrogen blending and injection in natural gas networks: A review. Int. J. Hydrogen Energy 2025, 105, 367–381. [Google Scholar] [CrossRef] [Scilit]
- Wang, J.; Huang, Z.; Fang, Y.; Liu, B.; Zeng, K.; Miao, H.; Jiang, D. Combustion behaviors of a direct-injection engine operating on various fractions of natural gas–hydrogen blends. Int. J. Hydrogen Energy 2007, 32, 3555–3564. [Google Scholar] [CrossRef] [Scilit]
- Hassan, H.A.; Nguyen, T.; Yousuf, A.; Patterson, M.; Duan, C.; Merchan-Merchan, W.; Parthasarathy, R.; Kazempoor, P. Performance and emissions of natural gas/hydrogen blends in large-bore spark-ignition engines. Int. J. Hydrogen Energy 2025, 125, 168–180. [Google Scholar] [CrossRef] [Scilit]
- Huang, Z.; Liu, B.; Zeng, K.; Huang, Y.; Jiang, D.; Wang, X.; Miao, H. Experimental study on engine performance and emissions for an engine fueled with natural gas−hydrogen mixtures. Energy Fuels 2006, 20, 2131–2136. [Google Scholar] [CrossRef] [Scilit]
- Yang, K.; Wu, H.; Chen, Y.; Lv, P.; Shen, J. Research on the dynamic behavior of hydrogen-blended natural gas vented explosion. Int. J. Hydrogen Energy 2025, 101, 650–663. [Google Scholar] [CrossRef] [Scilit]
- Korakianitis, T.; Namasivayam, A.; Crookes, R.J. Natural-gas fueled spark-ignition (SI) and compression-ignition (CI) engine performance and emissions. Prog. Energy Combust. Sci. 2011, 37, 89–112. [Google Scholar] [CrossRef] [Scilit]
- De Simio, L.; Gambino, M.; Iannaccone, S. Using Natural Gas/hydrogen mixture as a fuel in a 6-Cylinder stoichiometric spark ignition engine. In Enriched Methane: The First Step Towards the Hydrogen Economy; Springer: Cham, Switzerland, 2015; pp. 175–194. [Google Scholar]
- Lee, S.; Kim, C.; Choi, Y.; Lim, G.; Park, C. Emissions and fuel consumption characteristics of an HCNG-fueled heavy-duty engine at idle. Int. J. Hydrogen Energy 2014, 39, 8078–8086. [Google Scholar] [CrossRef] [Scilit]
- Karim, G.A.; Wierzba, I.; Al-Alousi, Y. Methane-hydrogen mixtures as fuels. Int. J. Hydrogen Energy 1996, 21, 625–631. [Google Scholar] [CrossRef] [Scilit]
- Ma, F.; Wang, Y.; Liu, H.; Li, Y.; Wang, J.; Zhao, S. Experimental study on thermal efficiency and emission characteristics of a lean burn hydrogen enriched natural gas engine. Int. J. Hydrogen Energy 2007, 32, 5067–5075. [Google Scholar] [CrossRef] [Scilit]
- Akansu, S.O.; Kahraman, N.; Çeper, B. Experimental study on a spark ignition engine fuelled by methane–hydrogen mixtures. Int. J. Hydrogen Energy 2007, 32, 4279–4284. [Google Scholar] [CrossRef] [Scilit]
- Akansu, S.O.; Dulger, Z.; Kahraman, N.; Veziroǧlu, T.N. Internal combustion engines fueled by natural gas—Hydrogen mixtures. Int. J. Hydrogen Energy 2004, 29, 1527–1539. [Google Scholar] [CrossRef] [Scilit]
- Pandey, V.; Badruddin, I.A.; Khan, T.Y. Effect of H2 blends with compressed natural gas on emissions of SI engine having modified ignition timings. Fuel 2022, 321, 123930. [Google Scholar] [CrossRef] [Scilit]
- Derwent, R.G. Global warming potential (GWP) for methane: Monte Carlo analysis of the uncertainties in global tropospheric model predictions. Atmosphere 2020, 11, 486. [Google Scholar] [CrossRef] [Scilit]
- Boucher, O.; Friedlingstein, P.; Collins, B.; Shine, K.P. The indirect global warming potential and global temperature change potential due tomethane oxidation. Environ. Res. Lett. 2009, 4, 044007. [Google Scholar] [CrossRef] [Scilit]
- Heywood, J. Internal Combustion Engine Fundamentals; McGraw-Hill: Columbus, OH, USA, 2018. [Google Scholar]
- Kahraman, N.; Ceper, B.; Akansu, S.O.; Aydin, K. Investigation of combustion characteristics and emissions in a spark-ignition engine fuelled with natural gas–hydrogen blends. Int. J. Hydrogen Energy 2009, 34, 1026–1034. [Google Scholar] [CrossRef] [Scilit]
- De Simio, L.; Iannaccone, S.; Guido, C.; Napolitano, P.; Maiello, A. Natural Gas/Hydrogen blends for heavy-duty spark ignition engines: Performance and emissions analysis. Int. J. Hydrogen Energy 2024, 50, 743–757. [Google Scholar] [CrossRef] [Scilit]
- Rao, A.; Wu, Z.; Mehra, R.K.; Duan, H.; Ma, F. Effect of hydrogen addition on combustion, performance and emission of stoichiometric compressed natural gas fueled internal combustion engine along with exhaust gas recirculation at low, half and high load conditions. Fuel 2021, 304, 121358. [Google Scholar] [CrossRef] [Scilit]
- Katsampes, N.; Montgomery, D.; Arney, G.; Olsen, D.B. Hydrogen-natural gas fuel blending in a “rich burn” engine with 3-way catalyst. Front. Fuels 2024, 2, 1416716. [Google Scholar] [CrossRef] [Scilit]
- Alpha-Gamma. Emission Factor Documentation for AP-42 Section 3.2, Natural Gas-Fired Reciprocating Engines; Alpha-Gamma: Raleigh, NC, USA, 2000. [Google Scholar]
- Huonder, A.J. Experimental and Numerical Performance Evaluation of a Thermal Oxidizer for Industrial Lean Burn Natural Gas Engines. Master’s Thesis, Colorado State University, Fort Collins, CO, USA, 2025. [Google Scholar]
- Algayyim, S.J.M.; Saleh, K.; Wandel, A.P.; Fattah, I.M.R.; Yusaf, T.; Alrazen, H.A. Influence of natural gas and hydrogen properties on internal combustion engine performance, combustion, and emissions: A review. Fuel 2024, 362, 130844. [Google Scholar] [CrossRef] [Scilit]
- Diaz, D.F.R.; Zhao, J.; Pham, J.M.Q.; Ramirez, C.; Qin, H.; Jimenez, A.J.; Pulianda, A.M.; Choudhary, C.; McDonell, V.; Li, G. Mathematical modeling for hydrogen blending in natural gas pipelines moving towards industrial decarbonization: Economic feasibility and CO2 reduction analysis. Int. J. Hydrogen Energy 2024, 88, 1422–1435. [Google Scholar] [CrossRef] [Scilit]
- Islam, A.; Alam, T.; Sheibley, N.; Edmonson, K.; Burns, D.; Hernandez, M. Hydrogen blending in natural gas pipelines: A comprehensive review of material compatibility and safety considerations. Int. J. Hydrogen Energy 2024, 93, 1429–1461. [Google Scholar] [CrossRef] [Scilit]
- Genovese, A.; Contrisciani, N.; Ortenzi, F.; Cazzola, V. On road experimental tests of hydrogen/natural gas blends on transit buses. Int. J. Hydrogen Energy 2011, 36, 1775–1783. [Google Scholar] [CrossRef] [Scilit]
- Korb, B.; Kawauchi, S.; Wachtmeister, G. Influence of hydrogen addition on the operating range, emissions and efficiency in lean burn natural gas engines at high specific loads. Fuel 2016, 164, 410–418. [Google Scholar] [CrossRef] [Scilit]
- Thurnheer, T.; Soltic, P.; Eggenschwiler, P.D. S.I. engine fuelled with gasoline, methane and methane/hydrogen blends: Heat release and loss analysis. Int. J. Hydrogen Energy 2009, 34, 2494–2503. [Google Scholar] [CrossRef] [Scilit]
- Zhang, R.; Chen, L.; Pan, J.; Wei, H.; Zhou, L.; Liu, C. Effects of direct-injected hydrogen addition on methane combustion performance in an optical SI engine with high compression-ratio. Int. J. Hydrogen Energy 2020, 45, 3284–3293. [Google Scholar] [CrossRef] [Scilit]
- Makaryan, I.A.; Sedov, I.V.; Salgansky, E.A.; Arutyunov, A.V.; Arutyunov, V.S. A comprehensive review on the prospects of using hydrogen–methane blends: Challenges and opportunities. Energies 2022, 15, 2265. [Google Scholar] [CrossRef] [Scilit]
- Cristello, J.; Dang, Z.; Hugo, R.; Park, S.S. Artificial intelligence based leak detection in blended hydrogen and natural gas pipelines. Int. J. Hydrogen Energy 2024, 91, 744–764. [Google Scholar] [CrossRef] [Scilit]
- Li, X. Status and development of hydrogen preparation, storage and transportation. Chin. Sci. Bull. 2022, 67, 425–436. [Google Scholar] [CrossRef] [Scilit]
- Huang, Z.; Wang, J.; Liu, B.; Zeng, K.; Yu, J.; Jiang, D. Combustion characteristics of a direct-injection engine fueled with natural gas–hydrogen blends under different ignition timings. Fuel 2007, 86, 381–387. [Google Scholar] [CrossRef] [Scilit]
- Mohammed, S.E.; Iffa, E.D.; Baharom, M.B.; Aziz, A.R.A. Spray characteristic comparisons of compressed natural gas and hydrogen fuel using digital imaging. J. Appl. Sci. 2011, 11, 1624–1629. [Google Scholar] [CrossRef] [Scilit]
- Chapman, K.S.; Patil, A. Performance, Efficiency, and Emissions Characterization of Reciprocating Internal Combustion Engines Fueled with Hydrogen/Natural Gas Blends; Kansas State University: Manhattan, KS, USA, 2007. [Google Scholar]
- Ma, F.; Wang, J.; Wang, Y.; Wang, Y.; Li, Y.; Liu, H.; Ding, S. Influence of different volume percent hydrogen/natural gas mixtures on idle performance of a CNG engine. Energy Fuels 2008, 22, 1880–1887. [Google Scholar] [CrossRef] [Scilit]
- Environmental Protection Agency. 40 CFR Part 63—National Emission Standards for Hazardous Air Pollutants for Source Categories; Environmental Protection Agency: Washington, DC, USA, 2002.

Disclaimer/Publisher’s Note: The statements, opinions and data contained in all publications are solely those of the individual author(s) and contributor(s) and not of MDPI and/or the editor(s). MDPI and/or the editor(s) disclaim responsibility for any injury to people or property resulting from any ideas, methods, instructions or products referred to in the content. |
© 2026 by the authors. Licensee MDPI, Basel, Switzerland. This article is an open access article distributed under the terms and conditions of the Creative Commons Attribution (CC BY) license.