


Abstract
Enteric methane (CH4) mitigation strategies should reduce environmental impact without compromising animal productivity. Residual methane emission (RME) has been proposed as a phenotype for identifying cattle that emit more or less methane than predicted after accounting for relevant sources of variation, but its associations with host metabolism, carcass, and integrated sustainability remain poorly characterized. This retrospective study evaluated whether Nellore steers classified according to RME differed in ruminal fermentation, serum and meat metabolomic profiles, productive performance, economic indicators, and environmental efficiency. Twenty-nine steers were classified as low (n = 10), intermediate (n = 9), or high (n = 10) residual methane emitters based on RME calculated after adjustment for the original dietary treatment, mean daily dry matter intake, and metabolic body weight. Methane emissions were measured using the GreenFeed system, while ruminal fermentation, serum and meat metabolomes (H-NMR), productive performance, carcass traits, economic indicators, carbon credit scenarios, and integrated sustainability indices were evaluated. Low-RME animals emitted 23.6% less methane than high-RME animals (p < 0.001), while showing average daily gain, carcass gain, and final carcass weight comparable to those of high-RME animals (p > 0.05). Differences in ruminal fermentation were also observed among phenotypes, with low-RME animals showing a greater propionate-to-acetate ratio and intermediate-RME animals showing greater acetate concentration and acetate-to-propionate ratio (p < 0.05). Exploratory principal component analysis revealed partial separation of serum metabolomic profiles but no overall discrimination of meat metabolomes. In contrast, sparse partial least squares analysis identified an exploratory multimetabolite pattern associated with RME, with serum glutamine, creatinine, carnitine, serine, citrate, and meat succinate among the metabolites contributing most strongly to the observed differentiation among methane emission phenotypes. Low emitters also achieved the greatest carcass margin, carbon credit revenue, eco-efficiency, and integrated sustainability score while exhibiting the shortest distance to the theoretical ideal sustainability point (p < 0.05). These findings indicate that residual methane emission represents a multidimensional biological phenotype integrating ruminal fermentation, host intermediary metabolism, productive efficiency, and environmental performance. Selecting cattle with low residual methane emissions may therefore contribute simultaneously to climate-smart beef production, improved eco-efficiency, and enhanced economic sustainability.
1. Introduction
Enteric methane (CH4) emissions from ruminants remain an important environmental challenge. In addition to contributing to anthropogenic greenhouse gas emissions, methane formation represents a loss of dietary energy during ruminal fermentation [1,2]. Most enteric CH4 is produced in the rumen, where methanogenic archaea use hydrogen and carbon dioxide generated during microbial fermentation. By removing hydrogen from the ruminal environment, methanogenesis helps maintain a sufficiently low hydrogen partial pressure for microbial fermentation and organic matter degradation to continue [1,3]. Methane output is therefore associated with several interrelated factors, including feed intake, diet composition, fermentation pathways, rumen microbial ecology, and host metabolism [2,3]. Reducing enteric CH4 emissions has consequently become an important objective in beef production, although mitigation strategies should preserve animal performance and remain economically feasible at the farm level [2,4]. This is particularly relevant because enteric fermentation represents one of the major agricultural sources of anthropogenic methane [2].
Even when cattle are managed under similar feeding and environmental conditions, substantial animal-to-animal variation in methane production can occur [5,6]. The biological interpretation of this variation, however, depends on the phenotype used to characterize emissions. Daily methane production is closely associated with dry matter intake and animal size. Methane yield relates emissions to the amount of feed consumed, whereas methane intensity expresses emissions relative to productive output, such as body weight or carcass gain [5,7]. Residual methane emission has been proposed as an alternative phenotype for identifying animals that emit more or less CH4 than predicted after relevant sources of variation have been accounted for [5]. This approach allows individual variation in methane emission to be evaluated after adjustment for factors related to production and feed intake, thereby facilitating comparisons among animals with different levels of intake and growth [5,8]. Nevertheless, associations between residual methane emission and feed intake, growth, feed efficiency, and carcass performance have varied among studies, suggesting that diet, production stage, and animal population may influence these relationships [5,6,9].
Variation in methane emission phenotypes may also be associated with differences in hydrogen utilization during ruminal fermentation and with interactions between the animal and its rumen microbiome [1,3,8]. Acetate and butyrate formation generally release reducing equivalents, whereas propionate formation represents an alternative hydrogen-utilizing pathway that may compete, at least partly, with methanogenesis [1,3]. Previous studies have also reported differences in the composition and functional characteristics of the rumen microbial community among cattle divergent for residual methane emission [8]. However, ruminal fermentation measurements alone may not capture the broader biological characteristics associated with low- and high-emission phenotypes. Metabolomics provides an opportunity to evaluate metabolites related to both microbial fermentation and host metabolism and may therefore help characterize systemic metabolic patterns associated with methane production [10]. Plasma metabolites associated with enteric methane emissions have been identified in beef cattle, suggesting that circulating metabolic profiles may complement direct gas measurements in the characterization of emission phenotypes [11].
Lower daily methane production does not necessarily correspond to a lower environmental impact per unit of beef produced. Animals with lower feed intake may emit less CH4 each day, but slower growth may increase the number of feeding days and maintenance requirements needed to produce a given amount of carcass [7,12]. Conversely, faster-growing cattle may have greater absolute daily emissions while producing beef with lower methane intensity [6,7]. Methane emission phenotypes should therefore not be evaluated solely on the basis of daily gas output. A broader assessment should also consider feed consumption, growth rate, carcass deposition, greenhouse gas intensity, and economic indicators [4,7,13]. Previous studies have examined associations between methane emissions and economically relevant traits [5,12,13], but limited information is available on whether cattle differing in residual methane emission also show differences in circulating and meat metabolomic profiles, economic outcomes, potential carbon credit value, and overall economic–environmental efficiency.
Although RME has been used to identify cattle with different methane emission profiles, less is known about how these differences relate to other aspects of animal biology and production. In particular, the relationships among RME, host metabolism, productive performance, and environmental and economic outcomes have not been fully explored. Evaluating serum and muscle metabolomic profiles alongside ruminal fermentation and animal performance may provide a broader view of the metabolic features associated with RME. Likewise, considering methane emissions together with carcass production and economic and environmental indicators provides a more comprehensive assessment of emission phenotypes than methane output alone. This integrated approach may help determine whether differences in RME are also associated with broader metabolic, productive, and sustainability-related characteristics.
Accordingly, this study aimed to characterize the productive, fermentative, metabolic, economic, and environmental attributes of beef cattle classified as low, intermediate, or high methane emitters based on residual methane emission within treatment. Measurements of CH4, carbon dioxide, and hydrogen were evaluated together with feed intake, growth, carcass gain, ruminal short-chain fatty acid profiles, serum and meat metabolomic profiles, feeding costs, carcass revenue, estimated carbon credit returns, and sustainability indices. We hypothesized that cattle with a low residual methane emission phenotype would differ in ruminal hydrogen partitioning and systemic metabolism and would produce carcasses with lower greenhouse gas intensity and greater economic–environmental efficiency, without a reduction in productive performance.
2. Results
2.1. Methane Emission Characteristics
Methane emission phenotypes differed markedly for all methane-related variables (Table 1). Low-RME animals emitted 15.3% and 23.6% less CH4 than INT-RME and HIGH-RME animals, respectively (p < 0.001). Similarly, methane yield (CH4/DMI) was reduced by 21.2% in low emitters compared with intermediate emitters and by 18.4% compared with high emitters (p < 0.001).
Table 1.
Methane emission characteristics of beef cattle classified as low, intermediate, and high methane emission phenotypes.
Methane emitted per unit of carcass gain also differed among phenotypes, with low emitters exhibiting lower CH4 intensity than intermediate and high emitters (p < 0.001). Carbon dioxide production was greater in high emitters than in both low and intermediate emitters (p = 0.037). Likewise, the CH4:CO2 ratio was lower in low emitters than in the other two phenotypes (p < 0.001).
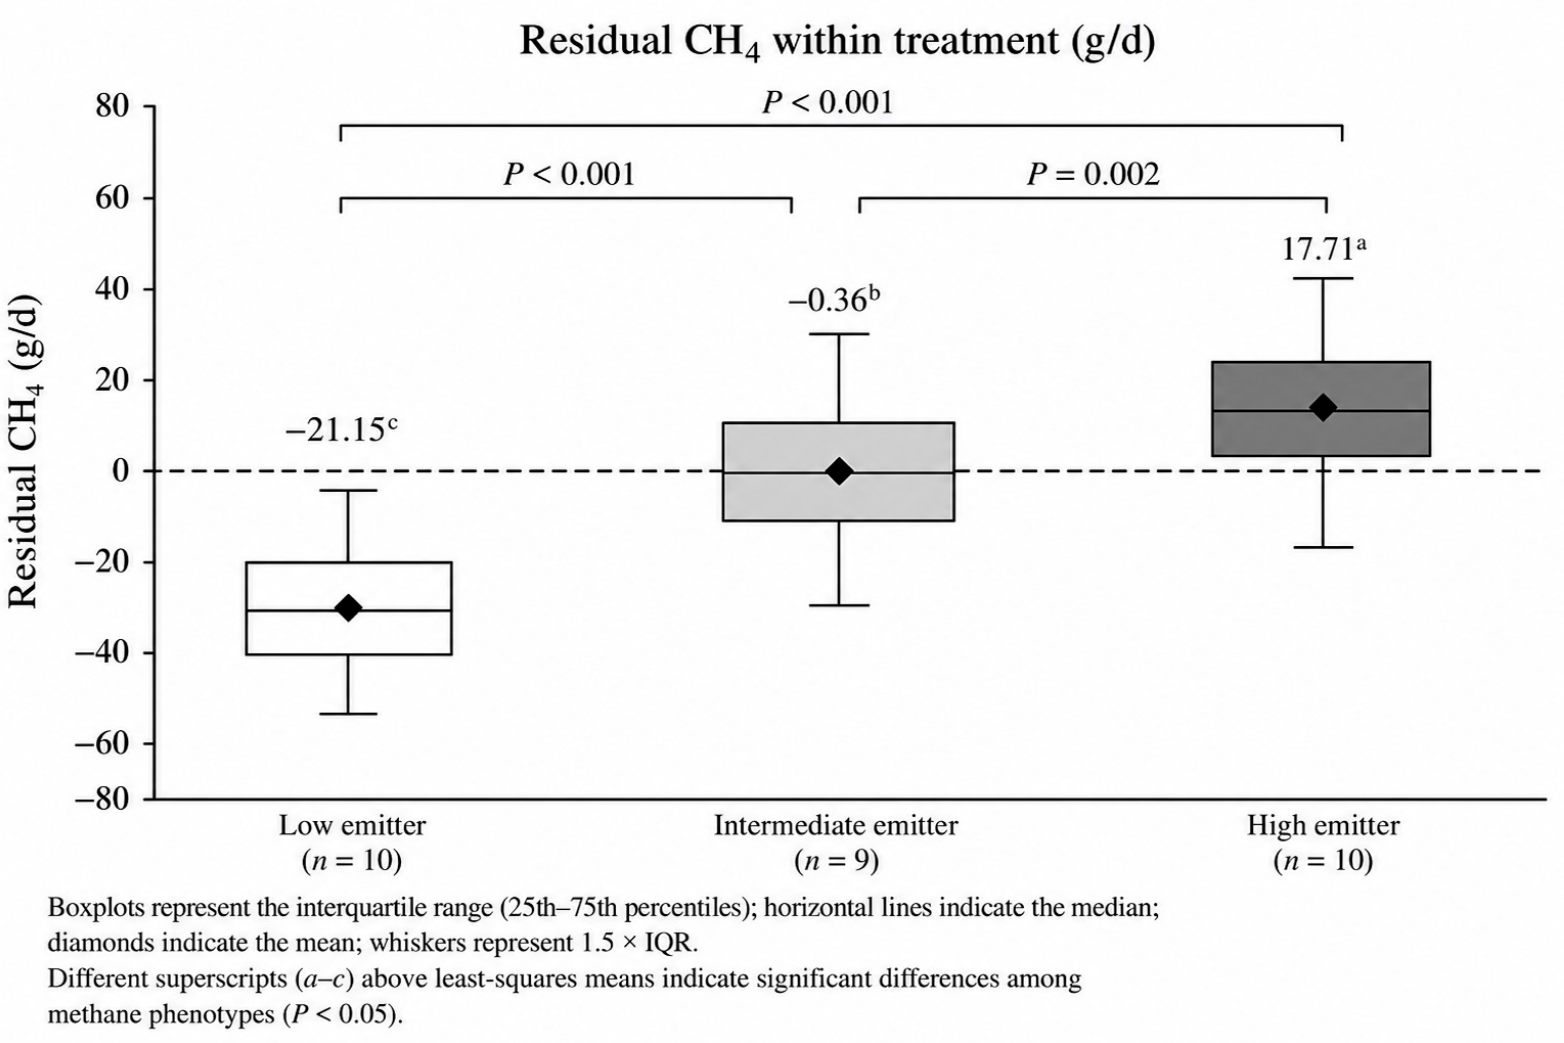
Residual methane emission effectively discriminated the three methane emission phenotypes (Figure 1). Low emitters exhibited the lowest residual methane values (−21.15 g d−1), whereas intermediate emitters showed residual values close to zero (−0.36 g d−1), and high emitters presented the greatest positive residual methane emissions (17.71 g d−1). Significant differences were observed among all phenotypes, with low emitters differing from both intermediate (p < 0.001) and high emitters (p < 0.001), while intermediate emitters also differed from high emitters (p = 0.002). The distribution of individual observations showed a clear separation among the three phenotypes with minimal overlap around the zero residual line, confirming that the recalculated residual methane emission, adjusted for dietary treatment, dry matter intake, and metabolic body weight, successfully identified biologically distinct methane-emission phenotypes.
2.2. Productive Performance, Feed Efficiency, and Carcass Characteristics
Growth performance and carcass productivity differed among methane emission phenotypes (Table 2). Final body weight was greater in low- and high-RME animals than in int-RME animals, by 7.6% and 10.6%, respectively (p = 0.007). Similarly, average daily gain was 18.2% greater in low-RME animals and 22.9% greater in high-RME animals than in int-RME animals (p = 0.009). Dry matter intake was 14.4% greater in high-RME than in int-RME animals, whereas low-RME animals showed intermediate values (p = 0.019).
Table 2.
Productive performance, feed efficiency, and carcass characteristics of beef cattle classified as low, intermediate, and high methane emission phenotypes.
Figure 1.
Residual methane (CH4) emission used to classify beef cattle into low, intermediate, and high residual methane emission phenotypes. Boxplots represent the interquartile range (25th–75th percentiles), horizontal lines indicate the median, diamonds indicate the mean, and whiskers represent 1.5 × the interquartile range (IQR). Different superscript letters (a–c) indicate significant differences among methane emission phenotypes according to Tukey’s multiple-comparison test (p < 0.05). Residual CH4 was calculated as the difference between the observed and predicted daily methane production of each animal after adjustment for the original dietary treatment, mean daily dry matter intake, and metabolic body weight.
Carcass performance followed a similar pattern. Final carcass weight was greater in low (+7.7%) and high emitters (+10.7%) than in intermediate emitters (p = 0.007). Similarly, carcass daily gain increased by 13.7% and 17.2%, respectively (p = 0.008), resulting in 13.7% and 17.2% greater total carcass gain in low and high emitters than in intermediate emitters (p = 0.008).
2.3. Ruminal Fermentation Profile
Ruminal fermentation profiles differed among methane emission phenotypes (Table 3). Acetate concentration was greater in int-RME animals than in low- and high-RME animals, by 13.7% and 13.4%, respectively (p = 0.024). Propionate concentration was 12.8% lower in high-RME than in int-RME animals and 10.2% lower than in low-RME animals (p = 0.041). Isobutyrate concentration was 23.7% greater in high-RME than in int-RME animals, whereas low-RME animals showed intermediate values (p = 0.038). The total SCFA concentration was 11.3% lower in high-RME than in int-RME animals (p = 0.049).
Table 3.
Ruminal short-chain fatty acid profile and derived fermentation indices of beef cattle classified as low, intermediate, and high methane emission phenotypes.
Fermentation-derived indices also differed among RME phenotypes. The acetate-to-propionate ratio was 5.5% greater in int-RME than in low-RME animals (p = 0.021). int-RME animals also showed a 12.7% greater lipogenic index than low-RME animals (p = 0.040) and a 15.2% greater glucogenic index than high-RME animals (p = 0.018). Conversely, the propionate-to-acetate ratio was 8.6% greater in low-RME than in int-RME animals (p = 0.024). The linear-chain SCFA concentration was 13.8% greater in int-RME than in high-RME animals (p = 0.031), whereas the branched-chain SCFA concentration was 8.7% lower in int-RME than in low-RME animals (p = 0.044).
2.4. Serum Metabolome
Principal component analysis (PCA) was performed as an exploratory approach to investigate the overall variation in serum metabolomic profiles among methane emission phenotypes (Figure 2). The first two principal components explained 43.2% of the total variance, with PC1 and PC2 accounting for 34.4% and 8.8%, respectively.
Figure 2.
Principal component analysis (PCA) of serum metabolomic profiles according to residual methane emission phenotype. The score plot shows the distribution of low (●), intermediate (■), and high (▲) residual methane emitters based on the first two principal components, which explained 43.2% of the total metabolomic variation. Arrows represent metabolite loadings, with arrow length indicating the relative contribution of each metabolite to the principal components. Dashed ellipses denote the 95% confidence interval for each methane emission phenotype.
Visual inspection of the PCA score plot suggested some structuring of serum metabolomic profiles along PC1, although substantial overlap among methane emission phenotypes was evident. Low-RME animals were more frequently distributed toward the negative scores of PC1, whereas high-RME animals tended to occur toward the positive scores, with int-RME animals distributed mainly across the overlapping central region. These patterns were considered exploratory and were not interpreted as evidence of statistical separation among RME phenotypes.
Inspection of the PC1 loadings indicated that citrate, succinate, malonate, formate, creatinine, urea, choline, dimethylglycine, and betaine contributed primarily toward the negative direction of PC1, whereas L-serine, L-glutamine, valine, L-threonine, acetoacetate, ethanol, 2-hydroxybutyrate, pyruvate, and L-lactate contributed primarily toward the positive direction. These metabolites were among the main contributors to the variation captured by PC1 and should be interpreted as drivers of the multivariate structure observed in the PCA rather than as metabolites that statistically discriminated RME phenotypes.
2.5. Meat Metabolome
Principal component analysis (PCA) was performed as an exploratory approach to investigate the overall variation in meat metabolomic profiles among residual methane emission phenotypes (Figure 3). The first two principal components explained 50.6% of the total variance, with PC1 and PC2 accounting for 28.9% and 21.6%, respectively.
Figure 3.
Principal component analysis (PCA) of meat metabolomic profiles according to residual methane emission phenotype. The score plot shows the distribution of low (●), intermediate (■), and high (▲) residual methane emitters based on the first two principal components, which explained 50.6% of the total metabolomic variation. Arrows represent metabolite loadings, with arrow length indicating the relative contribution of each metabolite to the principal components. Dashed ellipses denote the 95% confidence interval for each methane emission phenotype. PERMANOVA indicated no significant differences in the overall meat metabolomic profiles among methane emission phenotypes (p = 0.892).
Visual inspection of the PCA score plot showed considerable overlap among methane emission phenotypes, with no clear clustering of meat metabolomic profiles according to RME phenotype. Consistent with this exploratory pattern, PERMANOVA detected no significant overall difference in meat metabolomic composition among phenotypes (pseudo-F = 0.64; R2 = 0.047; p = 0.892).
Inspection of the PCA loadings indicated that formate, malonate, phenylalanine, methionine, lactate, creatine, acetoacetate, L-serine, L-glutamine, valine, L-threonine, ethanol, succinic acid, and 2-hydroxybutyric acid were among the main contributors to the variation captured by the principal components. These contributions reflect the overall structure of variation within the meat metabolomic dataset and should not be interpreted as evidence that these metabolites discriminated among RME phenotypes.
2.6. Metabolomic Signature Associated with Residual Methane Emission
Sparse partial least squares (sPLS) regression identified an exploratory multivariate metabolomic pattern associated with residual methane emission (Figure 4). The first latent component accounted for 31.3% of the variation in the metabolomic dataset and 43.2% of the variation in residual methane emission (Figure 4A). Low- and high-RME animals tended to be distributed toward opposite regions along the first latent component, whereas int-RME animals showed greater overlap and were predominantly distributed between these groups. This pattern suggests gradual variation in the multivariate metabolomic profile across RME phenotypes; however, the observed distribution should be interpreted as exploratory rather than as evidence of distinct metabolic groups.
Figure 4.
Sparse partial least squares (sPLS) analysis identifies the metabolomic signature associated with residual methane emission phenotype. (A) sPLS score plot showing the distribution of low (○), intermediate (□), and high (△) residual methane emitters according to the first two latent components. Ellipses represent the 95% confidence interval for each phenotype. (B) Heatmap of the 10 highest-ranked serum and meat metabolites selected by the sPLS model. Metabolite abundances are presented as Z-scores, with darker shades indicating higher relative abundance. (C) Relative contribution of the selected predictors to the sPLS model for residual methane emission. Model performance statistics obtained by leave-one-out cross-validation (LOO-CV), including cumulative R2Y, cumulative Q2, root mean square error of cross-validation (RMSECV), and permutation test (p = 0.018), are shown in the inset.
The heatmap of the ten highest-ranked metabolites provided a complementary visualization of the metabolomic patterns identified by the sPLS analysis (Figure 4B). Low-RME animals tended to show greater relative abundances of serum glutamine, creatinine, carnitine, serine, citrate, and glutamate, as well as meat succinate, whereas high-RME animals tended to show greater relative abundances of meat betaine and tyrosine and serum hypoxanthine. I-RME animals generally showed intermediate or overlapping patterns relative to the two extreme phenotypes. These patterns were considered exploratory and should not be interpreted as evidence of independent discrimination among RME phenotypes.
The relative contribution of each predictor to the sPLS model for residual methane emission is presented in Figure 4C. Serum glutamine showed the largest relative contribution (24.6%), followed by meat succinate (19.7%), serum creatinine (15.6%), serum carnitine (11.7%), serum serine (7.9%), serum citrate (6.5%), serum glutamate (5.6%), meat betaine (3.7%), meat tyrosine (2.8%), and serum hypoxanthine (1.9%). Cross-validation yielded cumulative R2Y and Q2 values of 0.568 and 0.198, respectively, with an RMSECV of 0.874. Although the permutation test was significant (p = 0.018), the relatively low Q2 indicates limited predictive performance. Therefore, the sPLS results should be interpreted as an exploratory multivariate pattern associated with residual methane emission rather than as evidence of a validated predictive metabolomic signature.
2.7. Economic Performance and Sustainability Indicators
Economic and sustainability indicators differed among RME phenotypes (Table 4). Basal and total feeding costs were 14.4% and 13.5% greater, respectively, in high-RME than in int-RME animals (p = 0.019). Carcass revenue was 17.2% greater in high-RME animals and 13.7% greater in low-RME animals than in int-RME animals (p = 0.008).
Table 4.
Economic performance and sustainability indicators of beef cattle classified as low, intermediate, and high methane emission phenotypes (US$).
Despite comparable carcass revenues between low- and high-RME animals, the carcass margin was 54.2% greater in low-RME than in int-RME animals (p = 0.031). The estimated carbon credit value was 43.3% greater in low-RME than in high-RME animals (p < 0.001). Under the carbon credit scenario adopted in this study, carcass margin plus estimated carbon credit value was 53.3% and 9.3% greater in low-RME animals than in int- and high-RME animals, respectively (p = 0.014). The margin per kilogram of carcass gain was also greater in low-RME than in int-RME animals (p = 0.028).
Environmental efficiency indicators also differed among RME phenotypes. Methane intensity and CO2-equivalent intensity were both 26.3% lower in low-RME than in int-RME animals (p < 0.001), whereas sustainable production efficiency was 32.6% greater in low-RME animals (p < 0.001). The economic return per unit of CO2-equivalent emitted was 76.5% greater in low-RME than in int-RME animals (p = 0.043), and the eco-efficiency index was also greater in low-RME animals (p = 0.016).
2.8. Integrated Productive, Economic, and Environmental Performance
Integrated sustainability indicators differed across RME phenotypes (Figure 5). The productive–economic score differed among phenotypes (p = 0.015), with int-RME animals showing the lowest value, whereas low- and high-RME animals showed greater values. The environmental-efficiency score also differed among phenotypes (p < 0.001), with low-RME animals showing the greatest environmental desirability compared with int- and high-RME animals.
Figure 5.
Integrated productive, economic, and environmental performance according to residual methane emission phenotype. Productive–economic (PE) and environmental efficiency (EE) scores were derived from the first principal component of their respective standardized variable sets and subsequently rescaled to a 0–1 desirability interval, with higher values indicating greater desirability. The Integrated Equilibrium Index (IEI) was calculated as √(PE × EE), whereas distance to the theoretical ideal point was calculated as √[(1 − PE)2 + (1 − EE)2]. For graphical presentation only, PE, EE, IEI, and distance values were multiplied by 100 and are therefore displayed on a 0–100 scale. Values represent adjusted means ± standard error. Higher PE, EE, and IEI values indicate greater desirability, whereas lower distance values indicate greater proximity to the theoretical optimum. p-values refer to the overall effect of methane-emission phenotype.
For the integrated assessment combining productive, economic, and environmental dimensions, the Integrated Equilibrium Index differed among RME phenotypes (p = 0.009), with low-RME animals showing the greatest value, int-RME animals the lowest value, and high-RME animals an intermediate value. Distance to the theoretical ideal point also differed among phenotypes (p = 0.012), with low-RME animals showing the shortest distance and int-RME animals the greatest distance. Within the standardization and integration framework adopted in this study, these results indicate a more favorable overall balance between productive–economic performance and environmental efficiency in low-RME animals.
3. Discussion
The present study indicates that residual methane emission is associated with biological and environmental characteristics beyond enteric methane production alone. Beef cattle classified according to residual methane emission differed in ruminal fermentation, systemic metabolism, and environmental efficiency indicators, while low- and high-RME animals showed similar productive performance. In addition, the integration of serum and meat metabolomic profiles identified an exploratory metabolic pattern associated with residual methane emission, suggesting that variation in methane output may occur alongside differences in host metabolism rather than being related exclusively to ruminal methane production. Together, these findings suggest that residual methane emission is associated with multiple physiological and productive processes involving ruminal function, intermediary metabolism, animal performance, and environmental sustainability. This supports further investigation of RME as a potentially relevant phenotype for nutritional and breeding strategies aimed at reducing greenhouse gas emissions while maintaining productive performance in beef cattle.
The differences observed among residual methane emission phenotypes support the classification used in the present study and indicate consistent variation in methane emission profiles among animals. Residual methane emission has been proposed as a biologically informative phenotype because it represents the deviation between observed and predicted methane production after accounting for known sources of variation, allowing the identification of animals that emit more or less methane than predicted under similar production conditions [5,14]. Although residual methane is a derived trait, its biological relevance may be strengthened when differences in RME are accompanied by consistent patterns across multiple methane-related variables, as observed in the present study.
This consistency was reflected in the lower daily CH4 production, methane yield (CH4/DMI), and methane intensity expressed per unit of carcass gain observed in low-RME animals. These variables describe complementary aspects of enteric methane production. While daily CH4 production represents total emissions, CH4/DMI expresses methane production relative to feed intake, and CH4 per unit of carcass gain relates methane emissions to productive output. The agreement among these indicators suggests that the lower methane emissions observed in low-RME animals were not solely associated with differences in feed intake or productive performance. Similar relationships have recently been reported in beef cattle divergently ranked for residual methane emission, with low-emitting animals consistently showing lower methane production and methane yield across repeated measurements [5,6].
Differences in CO2 production and particularly in the CH4:CO2 ratio provided additional information on the methane emission profiles of the animals. Because CO2 production is associated with whole-animal metabolism and respiratory gas exchange, whereas enteric CH4 is primarily generated through ruminal methanogenesis, the CH4:CO2 ratio provides a complementary measure of methane production relative to respiratory CO2 output. The lower CH4:CO2 ratio observed in low-RME animals was therefore consistent with their lower methane emission profile. However, this difference should not be interpreted as direct evidence of improved carbon use efficiency, which was not specifically measured in the present study. Similar relationships between methane and carbon dioxide emissions measured using GreenFeed systems have been reported previously, supporting the combined use of respiratory gas measurements for characterizing individual methane emission phenotypes [6].
Collectively, the close agreement among residual methane emission, daily methane production, methane yield, methane intensity per unit of carcass gain, and respiratory gas composition demonstrates that the phenotypic groups identified in the present study represent genuine biological differences in enteric methanogenesis rather than analytical variability. This phenotypic characterization provides a useful context for interpreting the observed associations between residual methane emission, ruminal fermentation, systemic metabolism, and integrated sustainability indicators.
One of the most relevant findings of this study is that lower residual methane emission was not associated with impaired animal performance. Although low-RME animals produced considerably less methane, they showed final body weight, average daily gain, and carcass productivity comparable to those of high-RME animals, whereas both groups performed better than int-RME animals for some productive traits. These findings indicate that lower RME can occur without detectable reductions in growth performance or carcass deposition under the conditions evaluated. Similar results have been reported in beef cattle, where divergent methane emission phenotypes showed marked differences in methane output while maintaining comparable productive performance, suggesting that lower methane production is not necessarily associated with poorer animal growth [5,6]. Likewise, recent genetic studies suggest that selection for lower methane emissions may be compatible with economically important production traits, supporting further investigation of methane-related phenotypes in breeding programs [6].
The greater dry matter intake observed in high-RME animals is consistent with the well-established positive relationship between feed intake and absolute methane production. Greater feed consumption increases the amount of fermentable substrate entering the rumen and may consequently increase hydrogen availability for methane formation [2]. However, differences in feed intake do not fully characterize the patterns observed in the present study, as low-RME animals maintained carcass gain and final carcass weight comparable to those of high-RME animals despite their lower methane emissions. This indicates that differences in RME occurred without detectable impairment of productive performance. Although methane production represents an energy loss during ruminal fermentation, energy balance, methane-associated energy loss, nutrient partitioning, and nutrient utilization efficiency were not directly measured in this study. Therefore, the present results should not be interpreted as evidence that low-RME animals used dietary energy more efficiently, and further studies directly evaluating energy and nutrient utilization are needed to determine whether such mechanisms contribute to variation in RME.
The differences in ruminal fermentation observed among RME phenotypes suggest that variation in residual methane emission was associated with differences in fermentation patterns. The greater acetate concentration and acetate-to-propionate ratio observed in int-RME animals were consistent with a fermentation pattern associated with greater hydrogen generation, whereas low-RME animals showed a greater propionate-to-acetate ratio, indicating a relatively more glucogenic fermentation pattern. Propionate formation represents an alternative pathway for metabolic hydrogen utilization and may compete with methanogenesis for reducing equivalents, providing a plausible biological link between fermentation patterns and methane production [2,3]. However, the microbial mechanisms underlying these relationships cannot be determined from the present study because rumen microbial composition and functional activity were not evaluated. Therefore, the observed fermentation differences should not be interpreted as direct evidence of altered hydrogen partitioning, methanogenic activity, or intrinsic ruminal fermentation efficiency. Future studies integrating RME phenotyping with metagenomic or metatranscriptomic approaches may help clarify the microbial populations and functional pathways associated with these fermentation and methane-emission patterns.
Another interesting finding was the lower total SCFA concentration observed in high-RME animals despite their greater dry matter intake. These animals also showed lower propionate and greater isobutyrate concentrations than the other phenotypes. Isobutyrate is derived from the metabolism of branched-chain amino acids and is involved in microbial metabolism, particularly in supporting the growth of cellulolytic bacteria, suggesting that differences in protein fermentation may be associated with the observed variation among RME phenotypes. Conversely, the greater concentration of linear-chain SCFA in int-RME animals was consistent with differences in carbohydrate fermentation, although these animals also showed a greater acetate-to-propionate ratio. Taken together, these results suggest that RME phenotypes were associated not only with differences in methane production, but also with the relative distribution of ruminal fermentation end products. This interpretation is consistent with previous studies reporting associations between divergent methane emission phenotypes, ruminal microbial communities, and fermentation patterns related to hydrogen utilization and methane production [2,6]. However, because the rumen microbiome was not evaluated in the present study, the contribution of specific microbial populations or functional pathways to these associations cannot be determined.
The exploratory PCA suggested some structuring of serum metabolomic profiles according to RME phenotype, although considerable overlap among animals remained. Low- and high-RME animals tended to be distributed toward opposite regions along the first principal component, whereas int-RME animals were more frequently distributed across the overlapping central region. Because PCA is an exploratory method, this pattern should be interpreted as a visualization of the overall metabolic variation rather than as evidence of statistical separation among phenotypes. Similar patterns have been reported in metabolomic studies of cattle, in which circulating metabolites reflect the combined influence of ruminal fermentation, nutrient availability, tissue metabolism, and physiological homeostasis, often resulting in gradual metabolic variation rather than complete separation among biological groups [15,16].
Rather than representing individual biomarkers of RME, the metabolites contributing to PC1 reflected variation across several interconnected metabolic pathways. Citrate, succinate, malonate, pyruvate, lactate, and acetoacetate are involved in central energy metabolism, including glycolytic and tricarboxylic acid cycle-related pathways [15]. Likewise, glutamine, serine, valine, and threonine are associated with amino acid metabolism and processes related to protein turnover and metabolic homeostasis [16]. Choline, betaine, and dimethylglycine participate in one-carbon metabolism and methyl-group transfer reactions involved in phospholipid synthesis, cellular methylation, and intermediary metabolism [16]. Finally, urea and creatinine are related to nitrogen and muscle metabolism and contributed to the overall variation observed in serum metabolomic profiles [15]. Together, these findings suggest that RME was associated with variation across multiple aspects of systemic metabolism; however, they do not establish that these pathways determine methane emission phenotype or represent differences in metabolic efficiency.
Because PCA is an unsupervised exploratory technique, it is useful for visualizing overall patterns of metabolic variation rather than identifying metabolites that discriminate among biological groups. Accordingly, the partial overlap observed among RME phenotypes should be interpreted as part of the overall multivariate structure of the serum metabolome and not as evidence of distinct metabolic groups. Supervised multivariate approaches can complement this exploratory analysis by evaluating combinations of metabolites associated with residual methane emission, as examined in the subsequent analyses.
In contrast to the serum metabolome, exploratory PCA showed no clear visual structuring of the meat metabolome according to RME phenotype. Consistent with this pattern, PERMANOVA detected no significant overall difference among phenotypes. These findings indicate that, under the conditions of the present study, differences in RME were not associated with detectable changes in the overall multivariate structure of the meat metabolome. Because muscle metabolism is tightly regulated to maintain tissue function and postmortem characteristics, variation in circulating metabolites may not necessarily be accompanied by detectable differences in the global muscle metabolome [15,16].
The supervised sPLS analysis provided a complementary view of the metabolomic data and identified an exploratory multivariate pattern associated with residual methane emission. Low- and high-RME animals tended to be distributed toward opposite regions of the first latent component, whereas int-RME animals showed greater overlap between these groups. This pattern suggests that the association between RME and the metabolome may involve the combined variation of multiple metabolites rather than changes in individual metabolites alone. Similar observations have been reported in cattle metabolomics, where supervised multivariate approaches have been useful for exploring metabolic patterns associated with complex production traits [15,17]. Nevertheless, given the limited predictive performance of the present model, these patterns should be regarded as exploratory and require validation in independent populations.
The metabolites contributing most strongly to the sPLS model were related to several aspects of intermediary metabolism. Serum glutamine, serine, and glutamate are involved in amino acid and nitrogen metabolism, whereas carnitine participates in mitochondrial fatty acid transport and oxidative metabolism. Citrate and succinate are intermediates of the tricarboxylic acid (TCA) cycle and are therefore related to central energy metabolism [15,16]. The contribution of these metabolites suggests that variation in RME was associated with differences in metabolic pathways involving amino acid, nitrogen, lipid, and mitochondrial metabolism. However, because energy balance, nutrient partitioning, and nutrient utilization efficiency were not directly measured, these associations should not be interpreted as evidence of greater metabolic efficiency or more efficient nutrient use in low-RME animals.
Conversely, meat betaine and tyrosine and serum hypoxanthine contributed more strongly to the multivariate pattern observed in high-RME animals. Betaine participates in one-carbon metabolism and methyl-group transfer, hypoxanthine is an intermediate of purine degradation, and tyrosine is involved in aromatic amino acid metabolism [18]. Although these metabolites made smaller individual contributions to the model, their combined variation further suggests that RME was associated with differences across multiple metabolic pathways rather than with a single biochemical process. These associations remain exploratory and do not establish a mechanistic relationship between these metabolites and methane production.
Notably, serum glutamine, meat succinate, serum creatinine, and serum carnitine were among the variables contributing most strongly to the sPLS model. These metabolites are involved in pathways related to amino acid metabolism, mitochondrial energy metabolism, and nitrogen metabolism, suggesting that variation in these processes may be associated with residual methane emission. However, these associations should be interpreted as exploratory and do not establish a direct mechanistic relationship between these metabolic pathways and methane emission phenotype. The significant permutation test further supports that the identified metabolomic signature is unlikely to have arisen by chance, reinforcing the biological relevance of these metabolites as indicators of host metabolic differences associated with methane emission phenotypes.
The economic evaluation demonstrated that residual methane emission phenotype was associated with differences in production efficiency beyond its direct effect on enteric methane emissions. Although high-emitting animals generated carcass revenues comparable to those of low emitters, their greater feed intake increased production costs, reducing overall economic efficiency. In contrast, low emitters maintained high carcass revenue while requiring lower production inputs, resulting in superior carcass margins. These findings reinforce the concept that improving methane efficiency does not necessarily compromise productive performance and may instead enhance resource use efficiency by reducing the proportion of dietary energy lost as methane [2,6].
When the estimated value of avoided CO2-equivalent emissions was incorporated into the economic assessment, low-emitting animals showed a more favorable economic outcome under the carbon price scenario adopted in this study. This difference reflects the lower methane emissions of these animals while maintaining comparable carcass production. However, the estimated carbon credit value should not be interpreted as realized revenue, as it depends on the assumed carbon price and does not account for specific market eligibility, certification, transaction costs, or verification requirements. Rather, these results illustrate a scenario in which assigning an economic value to avoided greenhouse gas emissions could influence the relative economic performance of methane emission phenotypes. As carbon markets continue to develop, scenario-based assessments such as this may help explore the potential economic implications of incorporating greenhouse gas mitigation into evaluations of beef production systems [19].
Environmental indicators showed a similar pattern. Low-RME animals produced less methane and CO2-equivalent per unit of productive output and showed greater sustainable production efficiency and economic return per unit of greenhouse gas emitted. These results are consistent with previous studies suggesting that methane intensity, which relates emissions to productive output, provides a useful perspective for evaluating the environmental performance of ruminant production systems [2,20]. Together, these findings indicate that RME was associated not only with differences in ruminal and metabolic characteristics, but also with economic and environmental indicators relevant to the sustainability of beef production.
The integrated assessment also illustrates the importance of evaluating RME phenotypes from a multidimensional perspective, because reductions in methane emissions should ideally occur without compromising productive performance or economic viability [2,21]. Productive–economic and environmental efficiency scores differed among phenotypes, with int-RME animals showing the lowest productive–economic score and low-RME animals showing the most favorable environmental efficiency score. When these dimensions were integrated, low-RME animals exhibited the greatest Integrated Equilibrium Index and the shortest distance to the theoretical ideal point. Thus, within the standardization framework adopted in this study, the low-RME phenotype was associated with a more favorable overall balance between productive–economic performance and environmental efficiency.
The Integrated Equilibrium Index provided an additional perspective by combining productive, economic, and environmental indicators into a single metric. Low-RME animals showed a greater Integrated Equilibrium Index and a shorter distance to the theoretical ideal point. Within the weighting and normalization approach adopted in this study, these results corresponded to a more favorable balance among the productive, economic, and environmental dimensions included in the assessment. Integrative approaches may be useful in livestock sustainability assessments because they allow multiple dimensions of production systems to be considered simultaneously rather than relying on isolated traits [20,22]. Nevertheless, the interpretation of such composite indices depends on the variables, assumptions, and standardization procedures used to construct them.
Overall, the present study identified associations between RME phenotype and several ruminal, metabolic, economic, and environmental characteristics. Low-RME animals maintained productive performance while showing distinct ruminal fermentation patterns, exploratory multivariate metabolomic patterns, and more favorable environmental efficiency indicators. Under the carbon credit scenario and integrated analytical framework adopted in this study, low-RME animals also showed favorable economic and sustainability-related indicators. These findings support further investigation of RME as a phenotype that may help integrate methane emissions with productive and environmental performance in beef cattle. However, given the retrospective nature of the study, these associations should not be interpreted as evidence that lower RME directly causes improvements in productive, economic, or environmental outcomes.
Several limitations should be considered when interpreting these findings. This study was based on a retrospective, phenotype-centered analysis of data originally generated to investigate dietary 3-nitrooxypropanol supplementation rather than residual methane emission phenotypes. Although the original dietary treatment was considered in the statistical analyses and in the calculation of residual methane emission, some treatment-related influence cannot be completely ruled out. The relatively small number of animals is another important limitation, particularly for the metabolomic analyses, and therefore the metabolic patterns identified here should be viewed as exploratory associations that require confirmation in larger, independent populations rather than as established biomarkers. In addition, rumen microbial composition and activity were not assessed, which prevents direct identification of the microbial mechanisms underlying the observed differences in fermentation and metabolism.
In addition, although classification into low-, int-, and high-RME phenotypes facilitated the comparison of divergent animals, RME is inherently continuous, and categorization may reduce information and increase sensitivity to the selected cut-off points (Supplementary Table S1).
The study was also restricted to Nellore steers finished under a high-concentrate feedlot system, and the results may therefore not apply to other breeds, physiological stages, diets, or production systems. Likewise, the economic, carbon credit, and sustainability indicators were calculated using the prices, assumptions, and analytical framework adopted in this study and should be interpreted as scenario-based estimates rather than as broadly applicable economic outcomes. Further prospective studies involving larger populations, different breeds and production systems, and integrated microbiome and metabolome approaches will be important to determine whether these associations are consistent across broader production conditions.
4. Materials and Methods
4.1. Experimental Location, Ethical Approval, and Animals
This experiment was conducted from September to December 2022 at the DSM Experimental Center, located at Fazenda Caçadinha, in Rio Brilhante, Mato Grosso do Sul, Brazil. The experimental procedures, animal management, dietary treatments, gas measurements, performance evaluation, slaughter procedures, and meat metabolomic analyses were originally described by Pedrini et al. [23]. All procedures involving animals were reviewed and approved by the DSM Animal Welfare Committee under protocol No. 008/22 BR 220701 and were conducted in accordance with institutional guidelines for animal care and use in research [23].
The original experiment included 30 Nellore (Bos indicus) steers with a mean initial body weight of 407.25 ± 2.04 kg. Before the beginning of the feeding period, the animals were clinically evaluated, individually identified, and considered healthy and suitable for feedlot finishing [23]. The cattle were housed in a collective feedlot pen providing approximately 24 m2 per animal, with free access to drinking water. The facilities contained six electronic feeding stations equipped with load cells (AF 1000, Intergado Ltd., Contagem, Minas Gerais, Brazil), which allowed individual animal identification and continuous recording of feed intake [23].
The animals remained in the feedlot for 86 days. The feeding program included two consecutive dietary adaptation phases followed by a finishing period. At the beginning of adaptation, feed allowance was established at approximately 1.5% of body weight and was subsequently adjusted according to daily bunk evaluation, allowing a gradual increase in dry matter intake and adaptation to the high-concentrate finishing diet [23] (Table 5). At the end of the experimental period, the animals were transported to a commercial slaughterhouse for carcass evaluation and collection of biological samples, as previously detailed by Pedrini et al. [23].
Table 5.
Ingredients and nutritional composition of the experimental diets.
For the present retrospective phenotype-centered analysis, 29 steers with complete and internally consistent records for individual gas emissions, feed intake, growth, and carcass performance were retained. One animal from the original cohort was excluded because the complete set of variables required for residual methane calculation and integrated phenotype classification was unavailable. The final dataset comprised 10 animals from the control treatment, 10 animals receiving 75 mg of 3-nitrooxypropanol/kg of dietary dry matter, and 9 animals receiving 100 mg of 3-nitrooxypropanol/kg of dietary dry matter. Dietary treatment was included as an adjustment factor in the subsequent analyses and was not considered a methane emission phenotype. Animals were subsequently classified as low, intermediate, or high residual methane emitters based on RME calculated after adjustment for original dietary treatment, mean daily DMI, and metabolic body weight.
4.2. Experimental Design and Methane Emission Phenotype Classification
The present study was conducted as a retrospective phenotype-based investigation using data generated from the feedlot experiment previously described by Pedrini et al. [23]. Unlike the original study, which evaluated the effects of dietary supplementation on enteric methane mitigation, the objective of the present work was to investigate the biological, productive, metabolic, economic, and environmental characteristics associated with divergent methane emission phenotypes. Therefore, the individual animal was considered the experimental unit, and methane emission phenotype was adopted as the main experimental factor throughout the study.
Methane emission phenotypes were established using residual methane emission (RME), defined as the individual deviation in methane production after accounting for relevant sources of variation. RME was calculated as the residual from a multiple linear regression model in which daily methane production (g/day) was adjusted for the fixed effect of the original dietary treatment, mean daily dry matter intake (DMI), and metabolic body weight (MBW). Mean body weight was calculated as the average of initial and final body weight, and MBW was expressed as mean body weight^0.75. Negative RME values therefore identified animals emitting less methane than predicted, whereas positive values identified animals emitting more methane than predicted after accounting for treatment, feed intake, and metabolic body size.
Animals were subsequently classified according to their RME values into three divergent methane emission phenotypes. Animals in the lower third of the RME distribution were classified as low methane emitters (low; n = 10), those in the intermediate third as intermediate methane emitters (int; n = 9), and those in the upper third as high methane emitters (high; n = 10).
Because the dataset originated from a 3-NOP supplementation experiment, the original dietary treatment was explicitly included in the RME model to account for systematic treatment-related differences in methane production. Thus, RME classification was based on variation in methane emission remaining after adjustment for dietary treatment, DMI, and metabolic body weight, rather than on absolute differences in CH4 production among the original treatment groups. The distribution of animals from each original dietary treatment across the low-, int-, and high-RME groups is presented in Figure 6.
Figure 6.
Distribution of low (Low), intermediate (Int), and high (High) residual methane emission (RME) phenotypes within the original dietary treatments. Values represent the percentage of animals within each treatment classified into each RME phenotype. CON = control; 3-NOP = 3-nitrooxypropanol; DM = dry matter. The association between original dietary treatment and RME phenotype was evaluated using the Fisher–Freeman–Halton exact test (p = 0.976).
4.3. GreenFeed Measurements of CH4, CO2, and H2 Emissions
Enteric gas emissions were measured using the GreenFeed Emission Monitoring (GEM) system (C-Lock Inc., Rapid City, SD, USA), as previously described by Pedrini et al. [23]. The GEM system quantifies enteric gas emissions by combining continuous airflow measurements with real-time gas concentration analyses while animals voluntarily visit the unit to consume a small quantity of pelleted bait feed. This approach enables repeated measurements under normal production conditions with minimal animal disturbance and has been extensively validated for methane phenotyping in beef cattle [6].
Animals had unrestricted access to the GreenFeed unit throughout the experimental period. Each visit was automatically identified through an individual electronic ear tag, allowing continuous recording of methane (CH4), carbon dioxide (CO2), and hydrogen (H2) emissions. Gas concentrations were continuously monitored using infrared analyzers for CH4 and CO2 and an electrochemical sensor for H2, while airflow was simultaneously measured to calculate gas fluxes (g/day). Instrument calibration, airflow correction, gas recovery procedures, and data quality control followed the manufacturer’s recommendations and the methodology described by Pedrini et al. [23].
To ensure reliable estimates of daily gas production, only animals with an adequate number of valid GreenFeed visits distributed throughout the day were included in the present analysis. Daily emissions of CH4, CO2, and H2 were calculated from multiple valid visits and expressed as grams per day (g/day), representing the average emission for each individual animal during the evaluation period [6].
4.4. Residual Methane Emission (RME) Calculation
Residual methane emission (RME) was calculated as the residual from a multiple linear regression model in which daily methane production (g/day) was adjusted for dietary treatment, mean daily dry matter intake (DMI), and metabolic body weight (MBW). Mean body weight was calculated as the average of the initial and final body weights, and MBW was expressed as mean body weight raised to the power of 0.75. Thus, RME represented the difference between the observed and predicted methane production of each animal after accounting for treatment, feed intake, and metabolic body size. Negative residual values indicated animals emitting less methane than expected, whereas positive residual values indicated greater-than-expected methane emissions. Animals were subsequently ranked according to their RME values and classified into low, intermediate, and high methane emission phenotypes using tertiles of the residual distribution [5].
4.5. Animal Performance and Carcass Evaluation
Growth performance was monitored throughout the 86-day finishing period using the methodology previously described by Pedrini et al. [23]. Animals were weighed individually at the beginning and at the end of the trial after a 16 h feed withdrawal to determine body weight gain. Average daily gain (ADG) was calculated by dividing the total body weight gain by the duration of the experimental period.
Individual feed intake was continuously monitored using an automated feeding system (Intergado Ltd., Contagem, MG, Brazil), which electronically identified each animal and recorded feed consumption at every feeding event. Daily dry matter intake (DMI) was used to calculate feed conversion ratio (FCR; DMI/ADG) and feed efficiency (FE; ADG/DMI), providing indicators of nutrient utilization efficiency under feedlot conditions [23].
Following the finishing period, all animals were slaughtered in a commercial abattoir operating under the Brazilian Federal Inspection Service, according to the procedures described by Pedrini et al. [23]. Hot carcass weight (HCW) was measured immediately after evisceration, and dressing percentage was calculated relative to the final shrunk body weight. Carcass measurements and the collection of meat samples for metabolomic analyses followed the protocol previously established in the original experiment [23].
For the present study, productive performance and carcass traits—including initial and final body weight, ADG, DMI, FCR, FE, HCW, and dressing percentage—were reanalyzed using methane emission phenotype as the experimental factor. This approach enabled the investigation of whether inherent differences in residual methane emission were associated with variation in animal productivity and carcass yield, independently of the original dietary treatment.
4.6. Ruminal Short-Chain Fatty Acids and Fermentation Indices
Ruminal contents were collected immediately after slaughter on the final day of the experiment. Approximately 500 mL of mixed ruminal digesta was obtained from the cranial, dorsal, ventral, and caudal sacs to provide a representative sample of the ruminal environment. After homogenization, the material was filtered through four layers of cheesecloth, and 800 μL of ruminal fluid was mixed with 200 μL of 25% metaphosphoric acid, refrigerated for 30 min, and centrifuged (14,000× g, 10 min, 4 °C). The supernatant was stored at −20 °C until analysis.
Short-chain fatty acids (SCFAs) were quantified by gas chromatography using a GC-2014 gas chromatograph equipped with a flame ionization detector (Shimadzu Corporation, Kyoto, Japan) and an HP-FFAP fused-silica capillary column (25 m × 0.32 mm × 0.50 μm; Agilent Technologies, Santa Clara, CA, USA). Individual concentrations of acetate, propionate, butyrate, isobutyrate, valerate, and isovalerate were determined by comparison with certified analytical standards following established chromatographic procedures for ruminal fermentation analysis [24].
To provide an integrated assessment of ruminal fermentation, several biologically relevant indices were calculated from the SCFA concentrations. The acetate-to-propionate (A:P) and propionate-to-acetate (P:A) ratios were obtained as acetate/propionate and propionate/acetate, respectively, and were used to characterize the balance between lipogenic and glucogenic fermentation pathways. The linear-chain SCFA concentration was calculated as the sum of acetate, propionate, butyrate, and valerate, whereas branched-chain SCFA corresponded to the sum of isobutyrate and isovalerate, reflecting microbial degradation of branched-chain amino acids.
Additionally, a lipogenic index (acetate + butyrate) and a glucogenic index (propionate + valerate) were calculated to estimate the relative production of fermentation products associated with lipid synthesis and hepatic gluconeogenesis, respectively. The lipogenic:glucogenic ratio, calculated as (acetate + butyrate)/(propionate + valerate), was used as an integrated indicator of the partitioning of ruminal fermentation end-products [25].
4.7. Sample Collection for Metabolomic Analyses
Blood samples were obtained from the coccygeal vein on the final day of the finishing period using sterile vacuum tubes without anticoagulant (BD Vacutainer®, Becton Dickinson, São Paulo, SP, Brazil). Immediately after collection, the tubes were kept on ice and centrifuged at 3000× g for 15 min at 4 °C. The serum fraction was carefully separated, dispensed into sterile 2 mL cryogenic microtubes, and preserved at −80 °C until metabolomic evaluation.
Following slaughter and carcass refrigeration, 4 g of longissimus lumborum muscle was excised from the left side of each carcass between the 11th and 13th ribs. The tissue samples were immediately transferred to cryogenic tubes, snap-frozen in liquid nitrogen to prevent postmortem metabolic alterations, transported in a liquid nitrogen container (20 L), and maintained at −80 °C until metabolite extraction.
4.8. Serum Metabolomic Analysis
Before extraction, serum samples were allowed to thaw at room temperature for approximately 30 min. Metabolites were isolated using a biphasic extraction procedure adapted from Costa et al. [26]. Briefly, 500 μL of serum were placed into 2 mL microcentrifuge tubes and mixed with 480 μL of ice-cold acetone, followed by vigorous vortexing. Subsequently, 400 μL of chilled chloroform was added to promote phase separation, and the samples were vortexed again. After incubation on ice for 10 min, the mixtures were centrifuged at 10,000× g for 10 min at 4 °C.
The recovered extract was reconstituted in 500 μL of 0.1 M phosphate buffer (pH 7.4) prepared with deuterium oxide (D2O) and supplemented with 0.5 mM DSS-d6 (4,4-dimethyl-4-silapentane-1-sulfonic acid), which served simultaneously as the internal quantitative standard and chemical shift reference. The solution was homogenized by vortexing and centrifuged at 14,000× g for 5 min, and the supernatant was transferred to standard 5 mm NMR tubes for spectral acquisition.
4.9. Muscle Metabolomic Analysis
Polar metabolites were extracted from frozen longissimus lumborum samples according to the methodology described by [27]. Approximately 0.5 g of muscle tissue was homogenized using an Ultra-Turrax® T25 Digital homogenizer (IKA®, Campinas, SP, Brazil). Metabolite extraction was performed with a precooled methanol:chloroform mixture (2:2:1, v/v/v), followed by vortex agitation for 1 min.
The homogenates were maintained on ice for 15 min and centrifuged at 10,000× g for 15 min at 4 °C. The supernatant containing the polar metabolites was collected, freeze-dried, and transported to Embrapa Instrumentation (São Carlos, SP, Brazil) for nuclear magnetic resonance analyses.
Immediately before spectral acquisition, the lyophilized extracts were dissolved in 600 μL of NMR buffer together with 60 μL of the internal standard solution. After vortex mixing and brief centrifugation, 600 μL of the clarified solution were transferred into 5 mm NMR tubes (178 mm; VWR International, Radnor, PA, USA).
4.10. 1H-NMR Data Acquisition and Spectral Processing
Metabolomic profiling was performed by proton nuclear magnetic resonance (H-NMR) following the analytical procedures previously described by [26]. Spectra were recorded at 300 K using a Bruker Avance III spectrometer operating at 600.13 MHz (H) and 14.1 T, equipped with a 5 mm broadband observe (BBO) probe (Bruker BioSpin GmbH, Karlsruhe, Germany).
Deuterium oxide (D2O) was used as the field-frequency lock solvent, whereas DSS served as the internal reference for both chemical shift calibration and absolute metabolite quantification. One-dimensional H-NMR spectra were acquired using a conventional 90° pulse sequence, with each spectrum generated from the accumulation of 64 free induction decays (FIDs).
Residual water resonance was minimized using the zgesgp pulse program (excitation sculpting with pulsed field gradients). Acquisition parameters consisted of a 13.05 μs 90° pulse, 5 s relaxation delay, 3.89 s acquisition time, 10.03 ppm spectral width, and 64 K complex data points.
Raw spectra were processed in Chenomx NMR Suite Professional version 7.7 (Chenomx Inc., Edmonton, AB, Canada). Data processing included automatic and manual phase adjustment, baseline correction, spectral alignment, and chemical shift calibration using the methyl resonance of DSS at 0.00 ppm. Metabolites were subsequently identified and quantified through comparison with the Chenomx reference library based on chemical shift, signal multiplicity, and peak integration, generating the final metabolite concentration dataset for statistical analyses.
4.11. Economic, Environmental, and Sustainability Indicators
Economic, environmental, and sustainability indicators were calculated individually for each animal based on productive performance, feed intake, carcass gain, methane emissions, and economic return [28]. Total feed cost was obtained from the cumulative dry matter intake multiplied by the respective diet cost throughout the experimental period. Carcass revenue was estimated from carcass gain using a market price of R$335.00 per arroba, equivalent to R$22.33 kg−1 of carcass.
Cumulative methane emission (kg) was calculated as daily CH4 production multiplied by the 86 d experimental period and divided by 1000. Avoided CH4 emissions were calculated relative to the expected cumulative CH4 emission of the control treatment (CON). Only positive reductions were considered. Avoided CH4 was converted to CO2-equivalent using a global warming potential of 27.2 kg CO2-e per kg CH4. The estimated carbon credit value was then calculated using a carbon price of US$ 15 per ton of CO2-e avoided.
Cumulative CH4 (kg) = daily CH4 (g/d) × 86/1000
CH4 avoided (kg) = max [0, expected cumulative CH4 (CON) − observed cumulative CH4]
CO2-e avoided (kg) = CH4 avoided × 27.2
Carbon-credit value (US$/animal) = (CO2-e avoided/1000) × 15
A conservative carbon credit price of US$15.00 t−1 CO2-e, representative of recent values observed in voluntary carbon markets, was adopted for the scenario analysis [19]. This value was used exclusively to estimate the potential economic benefit associated with avoided greenhouse gas emissions and does not represent an actual market transaction.
In addition to economic return, methane intensity (kg CH4 kg−1 carcass gain), carbon intensity (kg CO2-e kg−1 carcass gain), feed efficiency, carcass production efficiency, and carbon opportunity value were calculated for each animal and subsequently used in the integrated sustainability assessment.
The eco-efficiency index was calculated as follows:
where ADG is average daily gain, and FE is feed efficiency.
Eco-efficiency Index = [z(ADG) + z(FE) − z(CH4/DMI)]/3
4.12. Integrated Productive–Economic–Environmental Assessment
To simultaneously evaluate productive, economic, and environmental performance, integrated sustainability indicators were generated using a principal component analysis (PCA)-based approach. Productive–economic and environmental variables were first standardized to a mean of zero and a standard deviation of one and analyzed separately by PCA. The first principal component derived from the productive and economic variables was used to generate the productive–economic (PE) score, whereas the first principal component derived from the environmental variables was used to generate the environmental efficiency (EE) score. The direction of each component was oriented so that higher scores represented greater desirability. Individual animal PE and EE scores were subsequently rescaled to a 0–1 interval, and these rescaled values were used for all subsequent calculations.
The Integrated Equilibrium Index (IEI) was calculated for each animal as the geometric mean of the rescaled PE and EE scores:
where values approaching 1 indicate a more favorable balance between productive–economic performance and environmental efficiency.
The distance to the theoretical ideal point was calculated for each animal using the Euclidean distance:
where the theoretical ideal corresponds to PE = 1 and EE = 1. Thus, lower D values indicate greater proximity to the optimum combination of productive–economic performance and environmental efficiency. All statistical analyses of PE, EE, IEI, and D were performed using the individual animal values on their original 0–1 scale. For graphical presentation only, these values were multiplied by 100 and expressed on a 0–100 relative desirability scale in Figure 5; this transformation did not affect the underlying calculations or statistical analyses.
4.13. Statistical Analysis
All statistical analyses were performed using SAS software (version 9.4; SAS Institute Inc., Cary, NC, USA), except for sparse partial least squares (sPLS) regression and permutational multivariate analysis of variance (PERMANOVA), which were conducted in R (version 4.3.2; R Foundation for Statistical Computing, Vienna, Austria) using the mixOmics and vegan packages, respectively. Statistical significance was declared at p ≤ 0.05.
Prior to analysis, all variables were evaluated for normality of residuals using the Shapiro–Wilk test (PROC UNIVARIATE) and for homogeneity of variances using Levene’s test (PROC GLM). Variables that violated model assumptions were log-transformed when necessary. Model adequacy was confirmed by visual inspection of residual plots.
Residual methane emission (RME; g d−1) was adopted as the primary biological trait throughout the study. Residual methane emission (RME; g d−1) was obtained as the residual from a multiple linear regression model in which daily methane production was adjusted for original dietary treatment, mean daily DMI, and metabolic body weight. Thus, RME represented individual variation in methane production not directly explained by these variables.
Variables related to animal performance, carcass characteristics, serum metabolome, meat metabolome, economic indicators, environmental variables, and integrated sustainability indices were analyzed using linear models, according to the following model:
where Yij is the observed response variable; μ is the overall mean; Pi is the fixed effect of the ith residual methane emission phenotype (low-RME, int-RME, or high-RME); Tj is the fixed effect of the jth 3-NOP treatment; and εij is the residual error. No additional random effect was included in these analyses. Least squares means were estimated using the LSMEANS statement and compared using Tukey’s adjustment for multiple comparisons (PDIFF ADJUST = TUKEY).
Yij = μ + Pi + Tj + εij
Multivariate metabolomic integration was performed using sparse partial least squares (sPLS) regression. Before multivariate analyses, serum and meat metabolomic datasets were combined into a single predictor matrix. Missing observations (<5%) were imputed using the median abundance of each metabolite. Metabolite concentrations were log-transformed when required and autoscaled to zero mean and unit variance.
Residual methane emission was considered the response variable, whereas all quantified serum and meat metabolites composed the predictor matrix. The sPLS model was fitted to maximize the covariance between predictor and response matrices while simultaneously performing variable selection. The optimal model was selected according to cross-validation performance, and metabolites were ranked according to their Variable Importance in Projection (VIP) scores. The final metabolomic signature consisted of the ten metabolites showing the highest contribution, model stability, and biological relevance. Individual animal scores were projected onto the first two latent components to visualize metabolic discrimination among residual methane emission phenotypes.
Differences in the overall metabolomic profiles among residual methane emission phenotypes were assessed by permutational multivariate analysis of variance (PERMANOVA). A Bray–Curtis dissimilarity matrix was calculated from the metabolomic data, and statistical significance was evaluated using 999 permutations. PERMANOVA was performed in R using the adonis2 function of the vegan package. The pseudo-F statistic, coefficient of determination (R2), and permutation-based p-value were reported to characterize the magnitude and statistical significance of differences among methane-emission phenotypes.
Model performance and stability were assessed using leave-one-out cross-validation, with cumulative coefficients of determination (R2), predictive ability (Q2), and root mean square error of cross-validation (RMSECV) used to evaluate model fit and predictive performance. Permutation testing was additionally performed to assess whether the observed model performance exceeded that expected by chance.
The ten metabolites selected by the sPLS model were subsequently subjected to hierarchical clustering analysis. Prior to clustering, metabolite abundances were standardized as row Z-scores according to
where xij is the abundance of metabolite i in animal j, xi is the mean abundance of metabolite i, and si is its corresponding standard deviation. Hierarchical clustering of both metabolites and animals was performed using Ward’s minimum variance method based on Euclidean distance, and the resulting dendrograms and heatmaps were used to identify metabolomic similarities among residual methane emission phenotypes.
Zij = (xij − xi)/si
To obtain an integrated assessment of productive, economic, and environmental efficiency, productive–economic and environmental variables were standardized (mean = 0 and standard deviation = 1) and analyzed separately by principal component analysis using PROC PRINCOMP. The first principal components representing productive–economic performance (PE) and environmental efficiency (EE) were oriented so that higher scores represented greater desirability and were subsequently rescaled to a 0–1 interval at the individual animal level. The rescaled PE and EE scores were used to calculate the Integrated Equilibrium Index (IEI) for each animal as
where higher values indicate a more favorable balance between productive–economic performance and environmental efficiency. The Euclidean distance to the theoretical ideal point was calculated for each animal as
where the theoretical ideal corresponds to PE = 1 and EE = 1, and lower values indicate greater proximity to the optimum combination of productive–economic performance and environmental efficiency. PE, EE, IEI, and D were statistically analyzed using the individual animal values on the 0–1 scale. For graphical presentation in Figure 5 only, these values were multiplied by 100 and expressed on a 0–100 relative desirability scale.
Graphical visualization included sPLS score plots with 95% confidence ellipses, Variable Importance in Projection (VIP) plots, hierarchical clustering heatmaps, metabolite correlation matrices, and integrated productive–economic–environmental diagrams generated from standardized datasets.
Principal component analysis (PCA) was performed as an exploratory unsupervised multivariate approach to characterize the overall variation in serum metabolomic profiles and to visualize the distribution of animals according to residual methane-emission phenotype. PCA scores and metabolite loadings were examined for the first two principal components, and the proportion of variance explained by each component and the cumulative explained variance were calculated. Group dispersion was visualized using 95% confidence ellipses constructed around the PCA scores for each residual methane emission phenotype. Model performance and robustness were additionally evaluated using cumulative explained variance (R2X), cumulative predictive ability (Q2), a permutation test with 200 permutations, Hotelling’s T2 at the 95% confidence level, and the 95% SPE/DModX limit. These statistics were used as complementary diagnostic measures of model fit, predictive robustness, and the identification of observations deviating from the multivariate model.
5. Conclusions
Residual methane emission was associated with differences in ruminal fermentation, systemic metabolism, economic indicators, and environmental efficiency in Nellore steers. Low-RME animals maintained productive performance while showing distinct metabolic patterns and more favorable environmental-efficiency and integrated sustainability indicators. These results suggest that RME may be useful for identifying animals that combine lower methane emissions with satisfactory productive performance. However, because this was a retrospective study involving a relatively small number of animals under specific experimental conditions, the observed associations should be interpreted with caution and do not demonstrate that selecting for lower RME would necessarily lead to improved productive, economic, or environmental outcomes. Further studies in larger and independent populations, preferably using prospective designs and different production conditions, are needed to confirm the potential value of RME as a phenotype for more sustainable beef production.
Supplementary Materials
The following supporting information can be downloaded at: https://www.mdpi.com/article/10.3390/methane5030026/s1, Table S1: Complementary analysis of associations between residual methane emission (RME) treated as a continuous variable and selected productive, ruminal, metabolomic, economic, and environmental outcomes in Nellore steers.
Author Contributions
Conceptualization, J.R.G.; methodology, C.d.A.P., N.R.B.C., F.M.M.O. and L.A.C.; software, J.R.G.; formal analysis, J.R.G.; investigation, J.R.G. and C.d.A.P.; data curation, J.R.G.; writing—original draft preparation, J.R.G., and R.H.d.T.e.B.G.; writing—review and editing, J.R.G., R.H.d.T.e.B.G. and C.d.A.P.; supervision, C.d.A.P. and A.P.; project administration, C.d.A.P., F.S.M. and A.P.; funding acquisition, A.P., V.V.d.C., T.S.A. and J.R.G. All authors have read and agreed to the published version of the manuscript.
Funding
The study was partially financed by DSM-firmenich, 098/2022.
Institutional Review Board Statement
The animal study protocol was approved by the Animal Welfare Committee of DSM (008/22 BR 220701).
Informed Consent Statement
Not applicable.
Data Availability Statement
The data presented in this study are available from the corresponding author upon reasonable request. The data are not publicly available because they form part of an ongoing research program and may be used in future publications.
Acknowledgments
The authors would like to thank the Department of Innovation and Applied Science at DSM; Alexandre Perdigão, Victor Valério Carvalho and Tiago Sabela Acedo.
Conflicts of Interest
Author Luiz Alberto Colnago was employed by the company EMBRAPA Brazilian Agricultural Research Company, and authors Alexandre Perdigão, Victor Valério de Carvalho, and Tiago Sabella Acedo were employed by the company DSM Nutritional Products Brazil S.A., which partially sponsored this study. The remaining authors declare that the research was conducted in the absence of any commercial or financial relationships that could be construed as a potential conflict of interest.
Abbreviations
The following abbreviations are used in this manuscript:
| 3-NOP | 3-nitrooxypropanol |
| ADG | Average daily gain |
| A:P | Acetate-to-propionate |
| BRL | Brazilian real |
| BW | Body weight |
| CH4 | Methane |
| CO2 | Carbon dioxide |
| CO2e | Carbon dioxide equivalent |
| DMI | Dry matter intake |
| FCR | Feed conversion ratio |
| FE | Feed efficiency |
| H2 | Hydrogen |
| HCW | Hot carcass weight |
| IQR | Interquartile range |
| LOO-CV | Leave-one-out cross-validation |
| P:A | Propionate-to-acetate |
| PCA | Principal component analysis |
| RME | Residual methane emission |
| RMSECV | Root mean square error of cross-validation |
| SCFA | Short chain fatty acids |
| SEM | Standard error of the mean |
| sPLS | Sparse partial least squares |
| TCA | Tricarboxylic acid cycle |
| US$ | United States dollars |
| VIP | Variable Importance in Projection |
References
- Janssen, P.H. Influence of hydrogen on rumen methane formation and fermentation balances through microbial growth kinetics and fermentation thermodynamics. Anim. Feed Sci. Technol. 2010, 160, 1–22. [Google Scholar] [CrossRef] [Scilit]
- Beauchemin, K.A.; Ungerfeld, E.M.; Eckard, R.J.; Wang, M. Review: Fifty years of research on rumen methanogenesis: Lessons learned and future challenges for mitigation. Animal 2020, 14, s2–s16. [Google Scholar] [CrossRef] [Scilit] [PubMed]
- Ungerfeld, E.M. Metabolic hydrogen flows in rumen fermentation: Principles and possibilities of interventions. Front. Microbiol. 2020, 11, 589. [Google Scholar] [CrossRef] [Scilit] [PubMed]
- Basarab, J.A.; Beauchemin, K.A.; Baron, V.S.; Ominski, K.H.; Guan, L.L.; Miller, S.P.; Crowley, J.J. Reducing GHG emissions through genetic improvement for feed efficiency: Effects on economically important traits and enteric methane production. Animal 2013, 7, 303–315. [Google Scholar] [CrossRef] [Scilit] [PubMed]
- Smith, P.E.; Waters, S.M.; Kenny, D.A.; Kirwan, S.F.; Conroy, S.; Kelly, A.K. Effect of divergence in residual methane emissions on feed intake and efficiency, growth and carcass performance, and indices of rumen fermentation and methane emissions in finishing beef cattle. J. Anim. Sci. 2021, 99, skab275. [Google Scholar] [CrossRef] [Scilit] [PubMed]
- Ryan, C.V.; Pabiou, T.; Purfield, D.C.; Conroy, S.; Kirwan, S.F.; Crowley, J.J.; Murphy, C.P.; Evans, R.D. Phenotypic relationship and repeatability of methane emissions and performance traits in beef cattle using a GreenFeed system. J. Anim. Sci. 2022, 100, skac349. [Google Scholar] [CrossRef] [Scilit] [PubMed]
- Thompson, L.R.; Rowntree, J.E. Invited review: Methane sources, quantification, and mitigation in grazing beef systems. Appl. Anim. Sci. 2020, 36, 556–573. [Google Scholar] [CrossRef] [Scilit]
- Smith, P.E.; Kelly, A.K.; Kenny, D.A.; Waters, S.M. Differences in the composition of the rumen microbiota of finishing beef cattle divergently ranked for residual methane emissions. Front. Microbiol. 2022, 13, 855565. [Google Scholar] [CrossRef] [Scilit] [PubMed]
- Vargas, J.J.; Werner, M.; Swenson, M.; Sitorski, L.; Paula, E.M.; Manriquez, D.; Carvalho, P.H.V.; Place, S.E. Residual methane emission determination and classification of growing steers during the backgrounding and finishing phases. J. Anim. Sci. 2025, 103, skaf403. [Google Scholar] [CrossRef] [Scilit] [PubMed]
- Asselstine, V.; Lam, S.; Miglior, F.; Brito, L.F.; Sweett, H.; Guan, L.; Waters, S.M.; Plastow, G.; Cánovas, A. The potential for mitigation of methane emissions in ruminants through the application of metagenomics, metabolomics, and other-OMICS technologies. J. Anim. Sci. 2021, 99, skab193. [Google Scholar] [CrossRef] [Scilit] [PubMed]
- Li, H.; Wang, X.; Vinsky, M.; Manafiazar, G.; Fitzsimmons, C.; Li, L.; Li, C. Analyses of plasma metabolites using a high-performance four-channel CIL LC–MS method and identification of metabolites associated with enteric methane emissions in beef cattle. PLoS ONE 2024, 19, e0299268. [Google Scholar] [CrossRef] [Scilit] [PubMed]
- Nkrumah, J.D.; Okine, E.K.; Mathison, G.W.; Schmid, K.; Li, C.; Basarab, J.A.; Price, M.A.; Wang, Z.; Moore, S.S. Relationships of feedlot feed efficiency, performance, and feeding behavior with metabolic rate, methane production, and energy partitioning in beef cattle. J. Anim. Sci. 2006, 84, 145–153. [Google Scholar] [CrossRef] [Scilit] [PubMed]
- de Haas, Y.; Pszczola, M.; Soyeurt, H.; Wall, E.; Lassen, J. Invited review: Phenotypes to genetically reduce greenhouse gas emissions in dairying. J. Dairy Sci. 2017, 100, 855–870. [Google Scholar] [CrossRef] [Scilit] [PubMed]
- Løvendahl, P.; Difford, G.F.; Li, B.; Chagunda, M.G.G.; Huhtanen, P.; Lidauer, M.H.; Lassen, J.; Lund, P. Review: Selecting for Improved Feed Efficiency and Reduced Methane Emissions in Dairy Cattle. Animal 2018, 12, S336–S349. [Google Scholar] [CrossRef] [Scilit] [PubMed]
- Li, C.; Sun, D.; Zhang, S.; Wang, S.; Wu, X.; Zhang, Q.; Liu, L. Overview of Metabolomic Analysis and the Integration with Multi-Omics for Economic Traits in Cattle. Metabolites 2021, 11, 753. [Google Scholar] [CrossRef] [Scilit] [PubMed]
- Jeyakumar, S.; Ramesha, K.P. Metabolomics—A Powerful Tool in Livestock Research. Anim. Biotechnol. 2023, 34, 3237–3249. [Google Scholar] [CrossRef] [Scilit] [PubMed]
- Goldansaz, S.A.; Guo, A.C.; Sajed, T.; Steele, M.A.; Plastow, G.S.; Wishart, D.S. Livestock metabolomics and the livestock metabolome: A systematic review. PLoS ONE 2017, 12, e0177675. [Google Scholar] [CrossRef] [Scilit] [PubMed]
- Wishart, D.S.; Guo, A.; Oler, E.; Wang, F.; Anjum, A.; Peters, H.; Dizon, R.; Sayeeda, Z.; Tian, S.; Lee, B.L.; et al. HMDB 5.0: The Human Metabolome Database for 2022. Nucleic Acids Res. 2022, 50, D622–D631. [Google Scholar] [CrossRef] [Scilit] [PubMed]
- Ecosystem Marketplace. State of the Voluntary Carbon Market 2024; Forest Trends Association: Washington, DC, USA, 2024. [Google Scholar]
- FAO. Pathways Towards Lower Emissions: A Global Assessment of the Greenhouse Gas Emissions and Mitigation Options from Livestock Agrifood Systems; Food and Agriculture Organization of the United Nations: Rome, Italy, 2023. [Google Scholar]
- Herrero, M.; Henderson, B.; Havlík, P.; Thornton, P.K.; Conant, R.T.; Smith, P.; Wirsenius, S.; Hristov, A.N.; Gerber, P.J.; Gill, M.; et al. Pathways towards climate-neutral livestock production. Nat. Clim. Change 2021, 11, 902–908. [Google Scholar]
- FAO. OECD-FAO Agricultural Outlook 2023–2032; OECD Publishing: Paris, France; Food and Agriculture Organization of the United Nations: Rome, Italy, 2023. [Google Scholar]
- Pedrini, C.A.; Machado, F.S.; Fernandes, A.R.M.; Cônsolo, N.R.B.; Ocampos, F.M.M.; Colnago, L.A.; Perdigão, A.; de Carvalho, V.V.; Acedo, T.S.; Tamassia, L.F.M.; et al. Performance, meat quality and meat metabolomics outcomes: Efficacy of 3-nitrooxypropanol in feedlot beef cattle diets. Animals 2024, 14, 2576. [Google Scholar] [CrossRef] [Scilit] [PubMed]
- Playne, M.J. Determination of ethanol, volatile fatty acids, lactic acid and succinic acid in fermentation liquids by gas chromatography. J. Sci. Food Agric. 1985, 36, 638–644. [Google Scholar] [CrossRef] [Scilit]
- Bergman, E.N. Energy contributions of volatile fatty acids from the gastrointestinal tract in various species. Physiol. Rev. 1990, 70, 567–590. [Google Scholar] [CrossRef] [Scilit] [PubMed]
- Costa, M.B.; Cônsolo, N.R.B.; Silva, J.; Buarque, V.L.M.; Padilla, A.R.H.; Coutinho, I.D.; Barbosa, L.C.G.S.; Colnago, L.A.; Silva, S.L.; Saran Netto, A. Performance, carcass traits and serum metabolomic profile of Nellore males with different genetic potential for post-weaning growth. Animal 2020, 14, 873–880. [Google Scholar] [CrossRef] [Scilit] [PubMed]
- Cônsolo, N.R.B.; Silva, J.; Buarque, V.M.; Barbosa, L.C.G.; Padilla, A.H.; Colnago, L.A.; Saran Netto, A.; Gerrard, D.E.; Silva, S.L. Metabolomic signature of genetic potential for muscularity in beef cattle. Anim. Biotechnol. 2022, 33, 1308–1317. [Google Scholar] [CrossRef] [Scilit] [PubMed]
- IPCC. Climate Change 2021: The Physical Science Basis. Contribution of Working Group I to the Sixth Assessment Report of the Intergovernmental Panel on Climate Change; Cambridge University Press: Cambridge, UK, 2021. [Google Scholar]
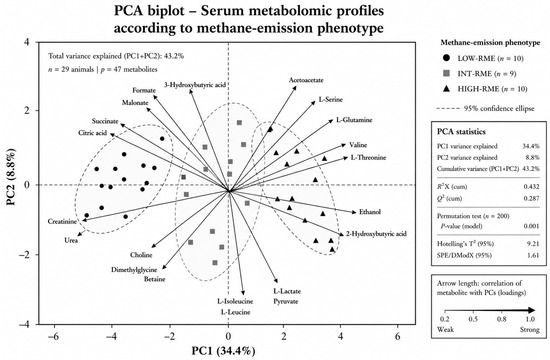
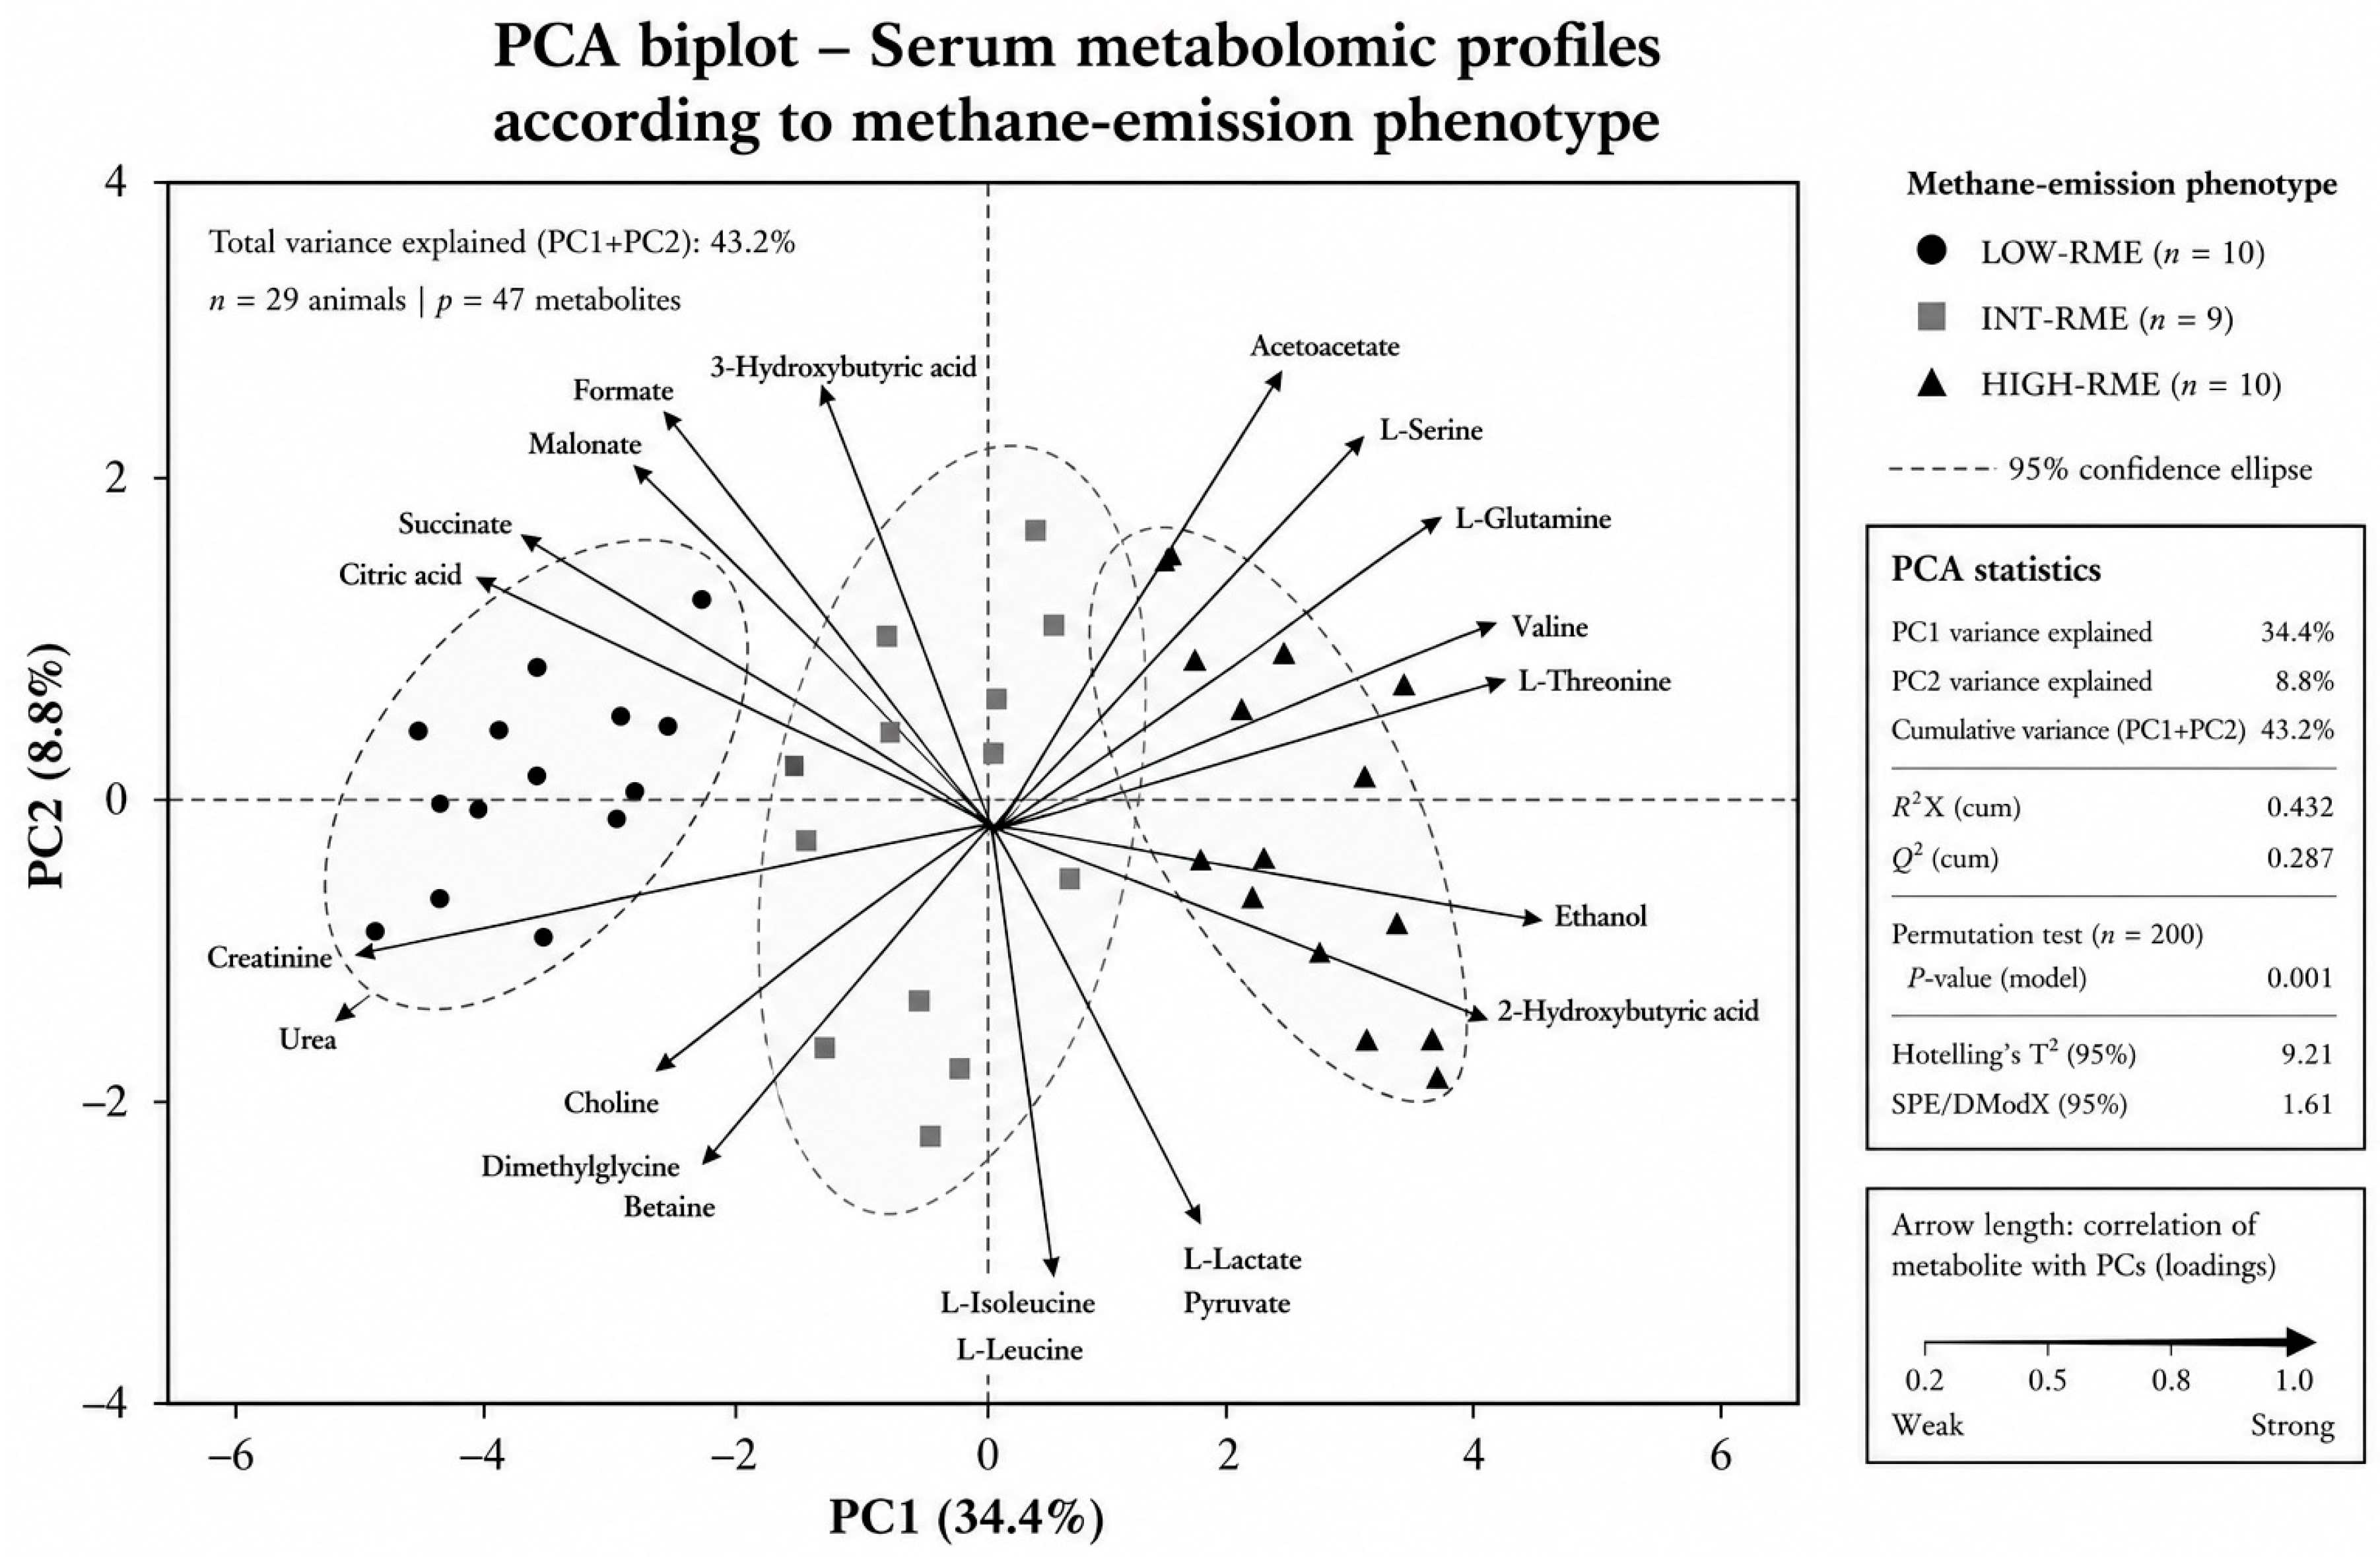
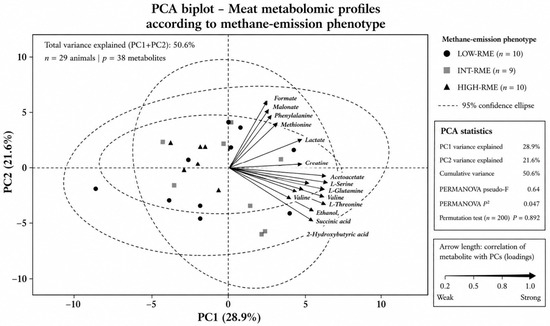
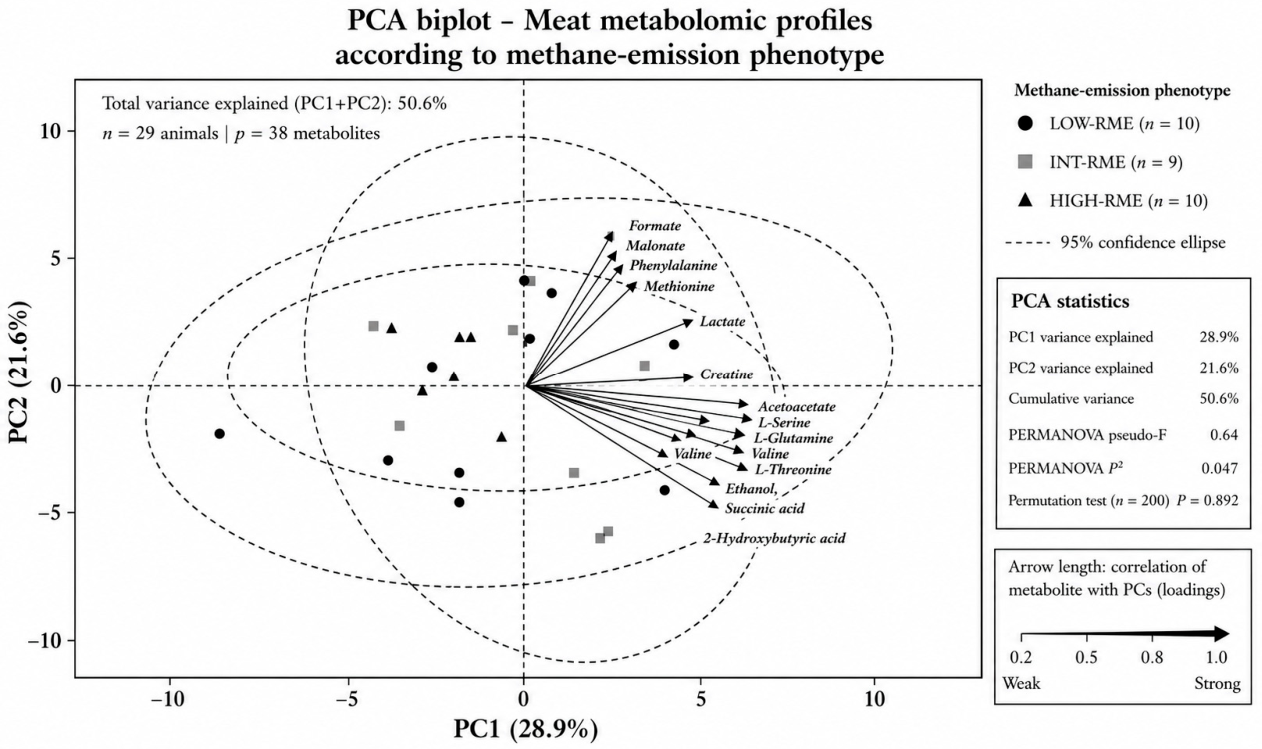
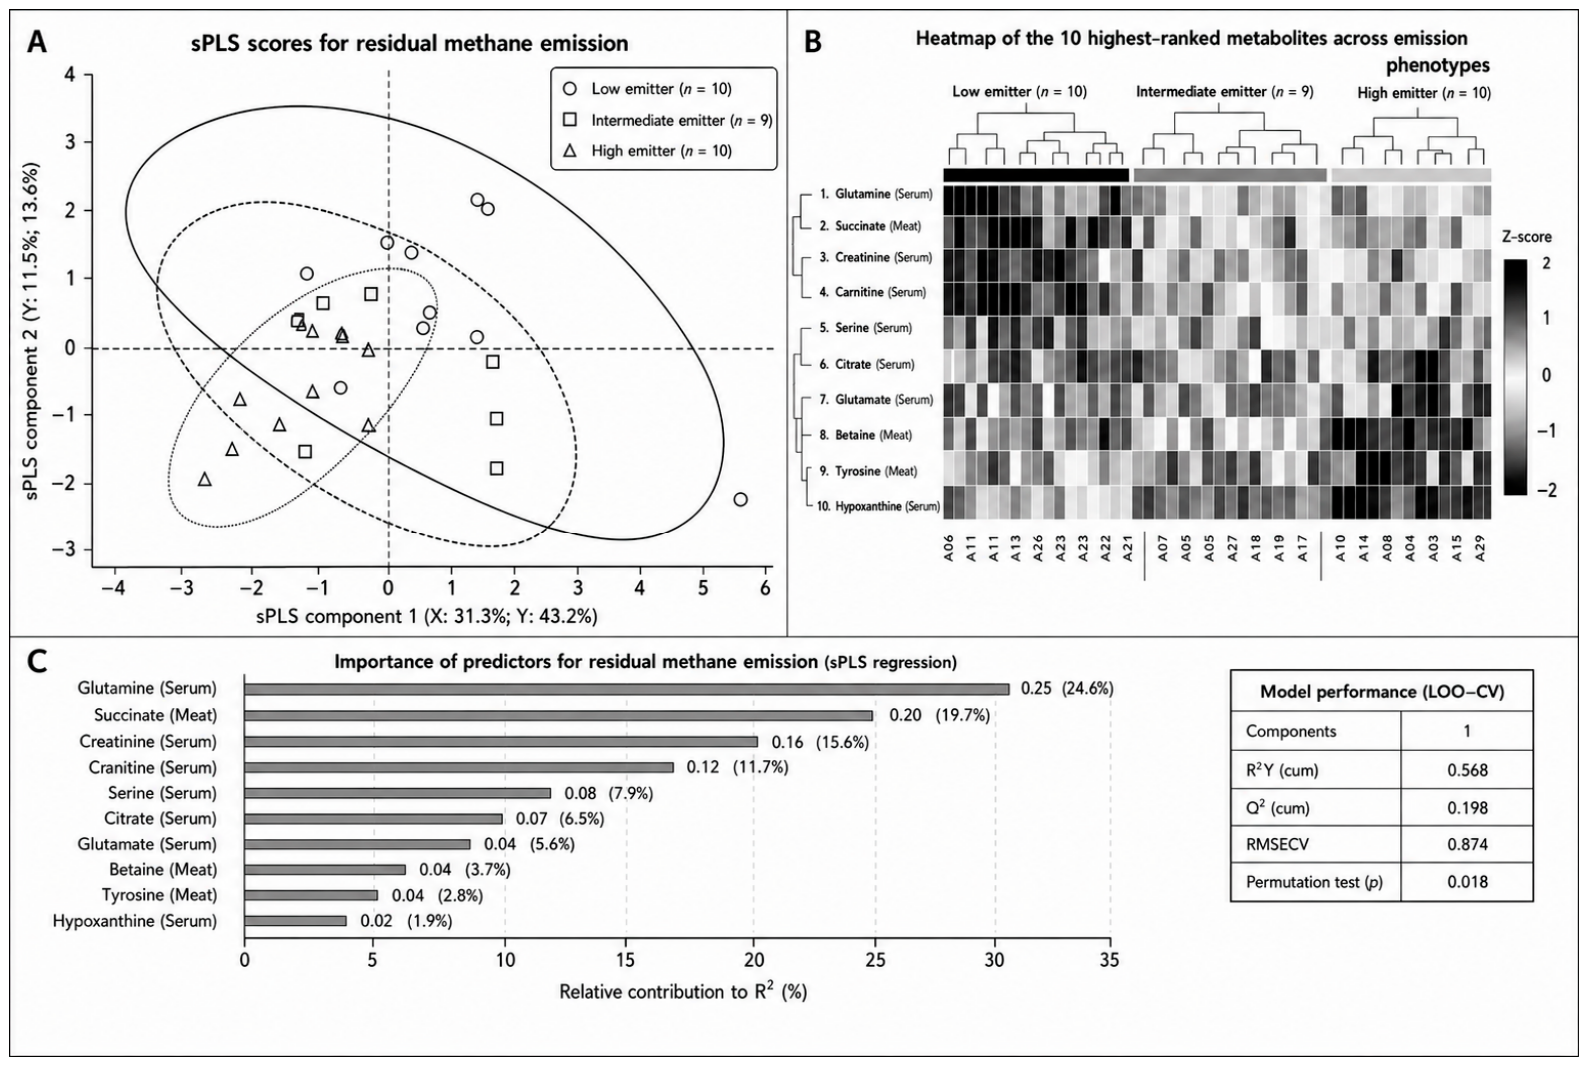
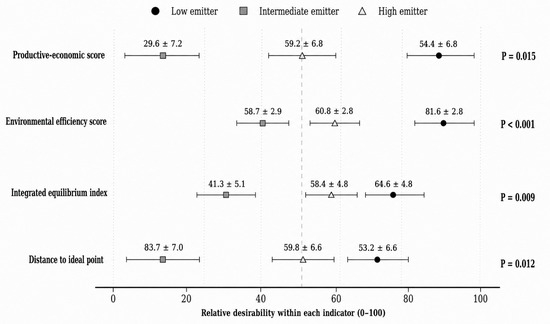
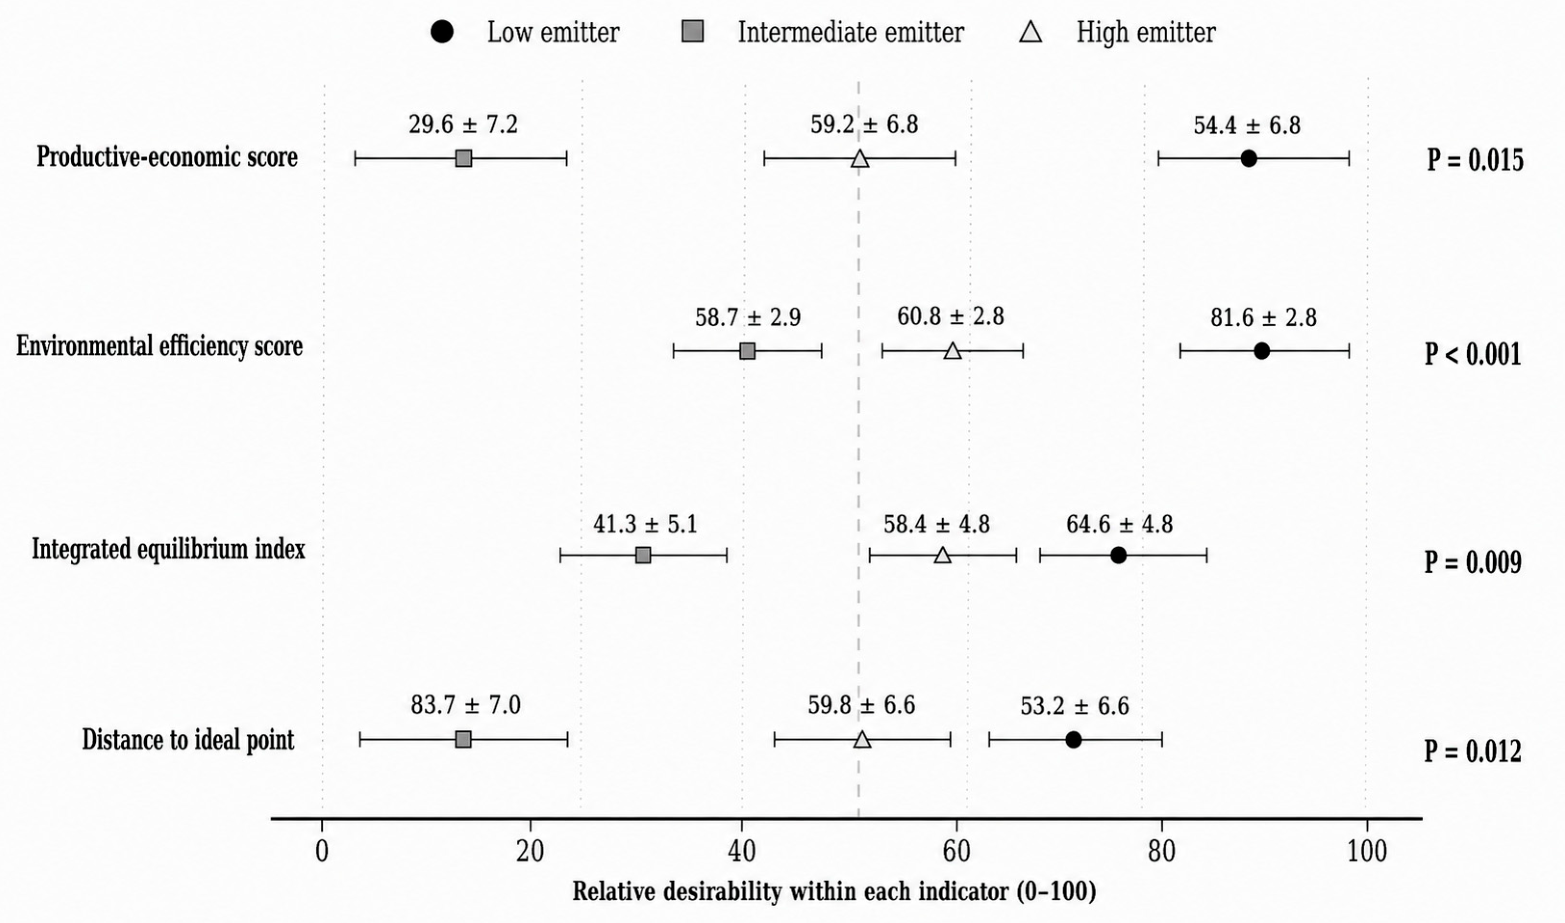
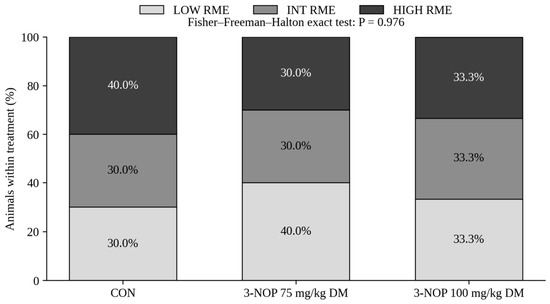
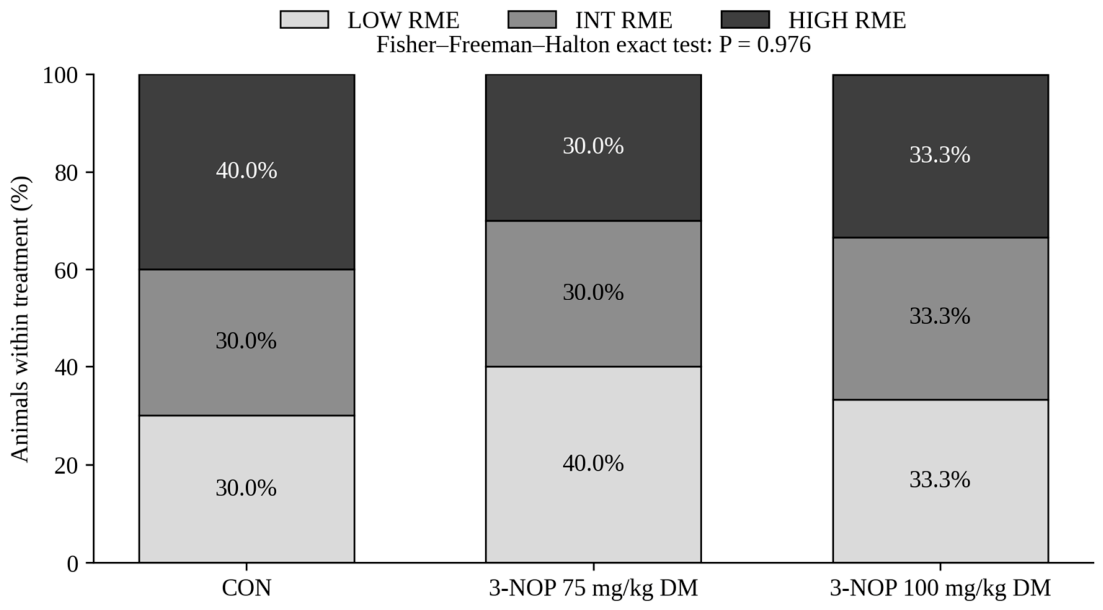

Disclaimer/Publisher’s Note: The statements, opinions and data contained in all publications are solely those of the individual author(s) and contributor(s) and not of MDPI and/or the editor(s). MDPI and/or the editor(s) disclaim responsibility for any injury to people or property resulting from any ideas, methods, instructions or products referred to in the content. |
© 2026 by the authors. Licensee MDPI, Basel, Switzerland. This article is an open access article distributed under the terms and conditions of the Creative Commons Attribution (CC BY) license.