


Abstract
The limited pre-starting torque of Darrieus-type vertical-axis wind turbines remains a major restriction for low-speed wind energy applications. This study evaluates, under fixed-rotor static conditions, two integrated dual-airfoil blade concepts derived from a baseline flow-concentrator geometry: the Static-Torque Booster Blade (STBB) and the Converging-Flow Blade (CFB). Both designs preserve the rotor envelope, blade height, radius, swept area, and NACA 6412 airfoil family, so that the effect of the relative arrangement between the primary torque-generating airfoil and the auxiliary flow-guiding airfoil can be isolated. Response surface methodology coupled with two-dimensional CFD was used only as a design-screening stage at to identify influential geometric parameters and reduce the design space; it is not interpreted as a quantitative predictor for the final comparison at . The selected configurations were then assessed through three-dimensional static CFD and wind tunnel static-torque measurements with the rotor fixed at prescribed azimuth positions under the same nominal confined low-speed condition. The two-dimensional screening showed that the auxiliary airfoil setting angle, azimuth position, and radial location strongly influence the static-torque response. In three dimensions, the STBB produced the highest static-torque peak (), increased the positive-torque fraction to , and yielded the lowest adverse-torque contribution. The CFB produced the highest mean positive torque contribution (), but also stronger adverse-torque sectors and no increase in relative to the conventional rotor. Experimentally, the CFB reached approximately – near 0° and 180°, whereas the STBB reached approximately near 15–30°. The numerical–experimental comparison is therefore interpreted as trend-level static-torque agreement under confined wind tunnel conditions, not as a free-field performance prediction, a calibrated torque model, or a complete dynamic self-starting validation. Further free-rotation tests, mechanical loss characterization, and blockage correction studies are required before field-scale extrapolation.
1. Introduction
Vertical-axis wind turbines (VAWTs) are attractive for distributed microgeneration in urban environments because of their omnidirectional operation, compact architecture, low acoustic impact, and tolerance to turbulent inflows [1,2]. Recent studies indicate that VAWT research has moved beyond conventional rotor comparison toward application-specific aerodynamic design, including flow-control strategies, hybrid configurations, urban integration, aeroacoustic mitigation, and low-speed operation [3,4,5,6,7,8]. Within this context, H-type Darrieus rotors remain attractive due to their structural simplicity and high efficiency within the optimal tip-speed-ratio range. However, their use in small-scale and low-wind-speed applications is still constrained by poor self-starting capability, mainly associated with low and strongly azimuth-dependent starting torque [9,10].
Start-up in a Darrieus turbine is governed by the aerodynamic torque generated under static and near-static conditions, where the blades operate over a wide range of azimuth-dependent effective angles of attack. As the aerodynamic moment may alternate between driving and resisting sectors during a single revolution, self-starting cannot be assessed from the maximum static torque alone, but from the balance and persistence of positive torque over the azimuth cycle [11,12,13,14,15]. This issue becomes more critical in small-scale rotors, where low-Reynolds-number stall behavior, shaft inertia, and drivetrain resistive forces can prevent the transition from incipient motion to sustained acceleration. Accordingly, angularly resolved static-torque analysis is a necessary first step for assessing the pre-starting capability of Darrieus rotors. Full self-starting assessment, however, also requires subsequent dynamic tests that include rotor inertia, shaft friction, drivetrain losses, and angular acceleration under free-rotation conditions.
A distinct approach to improving Darrieus turbine performance relies on external flow augmentation devices, including guide vanes, deflectors, curtains, curved elements, and hybrid Darrieus–Savonius arrangements [16,17,18,19,20,21]. These strategies reshape the incident flow before it interacts with the rotor, thereby improving the effective incidence angle, extending favorable torque sectors, and reducing adverse wake–blade interactions that can hinder self-starting. Nevertheless, the use of ancillary structures modifies the effective rotor envelope, increases blockage sensitivity, and adds architectural complexity. These effects complicate direct comparisons with the baseline rotor and may limit integration in compact operating environments.
Beyond fixed-geometry modifications, variable, adaptive, and deformable blade concepts have also been investigated, including variable-pitch rotors, morphing blades, adaptive flaps, and flexible trailing edges [22,23,24,25,26,27]. These approaches can improve local incidence control, delay dynamic stall, and enhance low-speed torque generation. However, their aerodynamic benefits typically depend on additional moving parts, control systems, actuators, or material-specific constraints. For small-scale turbines intended for low-cost and robust operation, this added complexity can reduce the practical value of the performance gains.
In the present study, CFD is used to evaluate how the relative arrangement of the primary and auxiliary airfoils modifies the static-torque response under fixed-rotor, pre-starting conditions. Since this response depends on azimuth incidence, separation, pressure redistribution, and blade–wake interaction, it cannot be reliably inferred from geometry alone. Three-dimensional RANS simulations with SST k– modeling have been widely adopted for aerodynamic load prediction in VAWTs [28,29,30,31].
The limitation in many self-starting strategies is that the reported torque improvement is often coupled with changes in the external rotor envelope, swept area, or added flow augmentation devices. Under these conditions, it becomes difficult to distinguish whether the gain originates from the intended blade-level aerodynamic mechanism or from a larger effective exposure to the incoming flow. Comparatively less attention has been given to integrated secondary aerodynamic elements capable of improving pre-starting torque while preserving the same rotor height, radius, swept area, and airfoil family.
To address this limitation, this work proposes two RSM-selected dual-airfoil blade concepts derived from a baseline flow-concentrator blade for a Darrieus-type VAWT. The Static-Torque Booster Blade (STBB) is designed to increase the static aerodynamic moment through the interaction between a primary torque-generating airfoil and an auxiliary flow-guiding airfoil. The Converging-Flow Blade (CFB) uses a converging dual-airfoil arrangement to redirect the incoming flow toward the rotor region and intensify the aerodynamic loading under pre-starting conditions. In both concepts, the external rotor envelope, blade height, rotor radius, swept area, and NACA 6412 airfoil family are preserved, enabling the dual-airfoil effect to be evaluated independently of changes in global rotor scale. A freestream velocity of 2.8 m/s was selected because the wind turbine equipped with the STBB and CFB blade configurations exhibited a rocking motion under this condition. This behavior was considered a preliminary indication of the onset of rotor rotation, although it does not necessarily confirm successful self-starting or sustained rotational operation.
The main contribution of this study is a numerical–experimental framework for evaluating whether integrated dual-airfoil flow-guiding strategies can enhance the static torque available under pre-starting conditions. The specific contributions are summarized as follows:
- Two dual-airfoil blade concepts, the Static-Torque Booster Blade (STBB) and the Converging-Flow Blade (CFB), are proposed while preserving the external rotor envelope, blade height, rotor radius, swept area, and NACA 6412 airfoil family.
- A two-dimensional CFD-based response surface methodology is developed to screen the geometric design space, identify the dominant variables, and select candidate STBB and CFB configurations, as shown in Figure 1.
- Three-dimensional CFD simulations are performed to verify whether the aerodynamic trends obtained from the reduced-order design-screening stage remain valid when finite-span effects and three-dimensional flow structures are considered.
- Low-speed wind tunnel experiments are conducted with the rotor mechanically fixed at prescribed azimuth positions to compare the static-torque trends predicted by the three-dimensional CFD model under the same nominal confined test-section condition.
Figure 1.
Three-dimensional CAD representation of the proposed dual-airfoil flow-concentrator blade configurations for a Darrieus-type vertical-axis wind turbine: (a) STBB and (b) CFB.
This paper is organized as follows. Section 2 describes the blade geometries, CFD model, response surface design-screening procedure, and experimental setup. Section 3 presents the two-dimensional design screening, three-dimensional CFD results, and wind tunnel trend-level comparison. Section 4 summarizes the main findings and outlines future work on dynamic start-up analysis.
2. Materials and Methods
This study evaluates two RSM-selected blade concepts derived from the baseline flow-concentrator blade shown in Figure 2. The STBB configuration was designed to increase the static torque available at low wind speeds through the interaction between the main Darrieus airfoil and an auxiliary inducer profile. The CFB configuration is named after its funnel-like arrangement, which promotes flow redirection toward the rotor region and enhances the aerodynamic loading under pre-starting static conditions.
Figure 2.
Parent flow-concentrator blade geometry used to derive the STBB and CFB concepts. The rotor has a blade height of and a radius of ; the primary and auxiliary airfoil sections are based on the NACA 6412 profile.
The objective was to quantify the static torque generated under low-speed conditions and identify the azimuth regions favorable for incipient rotor motion. In a previous study, the baseline flow-concentrator blade increased the mean static torque by approximately 90% across different azimuth orientations at a wind speed of 7.0 m/s in Ref. [32]. Therefore, the present work assesses whether the RSM-selected STBB and CFB geometries can further improve the static-torque response under equivalent fixed-rotor operating conditions. The final three-dimensional CFD simulations and the wind tunnel measurements were both static: the rotor was fixed at prescribed azimuth positions, and the comparison was performed under the same nominal low-speed test condition of .
The proposed blade concepts were evaluated using three complementary approaches: computational fluid dynamics (CFD), response surface methodology (RSM), and wind tunnel experiments. The geometries were developed in SolidWorks 2022 for parametric modeling of the aerodynamic profiles and rotor components, whereas ANSYS 2021 R1 was used to perform the CFD simulations and support the geometry design screening through the response surface framework.
2.1. Geometric Definition and Aerodynamic Rationale of the Blade Concepts
The proposed blade concepts are derived from a previously reported flow-concentrator blade for a Darrieus-type VAWT [32]. Each configuration is defined by the relative arrangement of two aerodynamic elements: a primary airfoil, responsible for the main torque-generating contribution, and an auxiliary airfoil, intended to modify the local incidence conditions and guide the incoming flow toward the rotor region. To isolate the aerodynamic effect of this dual-airfoil arrangement, the maximum blade height, rotor radius, external rotor envelope, and NACA 6412 airfoil family were kept unchanged for all configurations.
The parametric design space was constructed by varying six active geometric variables: the primary and auxiliary chord lengths, the primary and auxiliary setting angles, the auxiliary azimuthal offset, and the auxiliary radial position. The primary- and auxiliary airfoil chord lengths, denoted and , were varied within the range of 30–50 mm. The setting angles were varied from to , while the auxiliary radial position controlled the effective spacing between the airfoil elements. The azimuthal position of the auxiliary airfoil was varied from to with respect to the reference horizontal axis, whereas the primary airfoil azimuthal position, , and the primary radial position, , were kept fixed to preserve the reference rotor envelope. The static torque computed under stationary rotor conditions was used as the objective response in the response surface methodology (RSM).
The STBB concept was selected to enhance the static aerodynamic moment through controlled interaction between the primary torque-generating airfoil and the auxiliary flow-guiding airfoil. In this configuration, the primary chord is reduced to = 30 mm, whereas the auxiliary chord is increased to = 50 mm. The radial separation is set to X = 20 mm, and the auxiliary setting angle is adjusted to , as shown in Figure 3. This arrangement is intended to strengthen the local airfoil–flow interaction while preserving the original rotor envelope.
Figure 3.
Geometric definition of the Static-Torque Booster Blade (STBB) configuration. The selected geometry is defined by = 30 mm, = 50 mm, X = 20 mm, and . (a) General arrangement of the STBB. (b) Detailed geometric definition.
The CFB concept follows a different aerodynamic rationale. Instead of primarily amplifying the local airfoil interaction, it uses a converging dual-airfoil arrangement to redirect the incoming flow toward the rotor region. In this configuration, the primary and auxiliary airfoils retain chord lengths of = 30 mm and = 50 mm, respectively, but their setting angles are modified to and , as illustrated in Figure 4. This geometry is intended to increase the effective aerodynamic loading under pre-starting conditions by promoting a more directed flow path through the blade arrangement.
Figure 4.
Geometric definition of the Converging-Flow Blade (CFB) configuration. The selected geometry is defined by = 30 mm, = 50 mm, X = 20 mm, , and . (a) General arrangement of the STBB. (b) Detailed geometric definition.
Thus, the two RSM-selected concepts represent distinct integrated flow-guiding strategies. The STBB emphasizes static-torque amplification through controlled airfoil interaction, whereas the CFB emphasizes flow redirection through a converging blade layout. Since both concepts preserve the same global rotor dimensions and airfoil family, their static-torque response can be compared without introducing changes in swept area or overall rotor scale.
2.2. Mesh Generation and Numerical Modeling Strategy
The numerical assessment was conducted using two complementary modeling levels. A two-dimensional (2D) configuration was first employed to accelerate the parametric evaluation and reduce the computational cost during the response surface design-screening stage. Subsequently, selected blade concepts were analyzed using a three-dimensional (3D) configuration to capture finite-span effects, spanwise flow development, and the three-dimensional aerodynamic response of the blade assembly, which cannot be fully represented in a purely two-dimensional formulation.
For both modeling levels, the computational domain was divided into two control regions, as shown in Figure 5. The external region represents the wind tunnel test section, where the upstream boundary was prescribed as a velocity inlet and the downstream boundary as a pressure outlet. The inner region corresponds to the turbine subdomain surrounding the blade assembly. In the present static calculations, this subdomain was not used to simulate free rotor acceleration; instead, the blade geometry was fixed at each prescribed azimuth position and the aerodynamic torque was computed from the converged flow solution. In the two-dimensional simulations, the same domain topology was retained, but the control regions were defined as planar surfaces bounded by line boundaries rather than three-dimensional volumes.
Figure 5.
Computational domain and boundary-condition layout for the fixed-rotor static CFD simulations. The final low-speed comparison cases used a velocity inlet, a pressure outlet, no-slip blade/shaft surfaces, and solid no-slip tunnel walls; no symmetry boundary is used in the final three-dimensional confined wind tunnel comparison.
For the two-dimensional model, the mesh was generated using an element size of 20 mm in the wind tunnel region and 1 mm in the turbine subdomain, with a curvature capture criterion of . The turbine subdomain perimeter was discretized using 250 divisions, while a local refinement with a maximum element size of 0.05 mm was imposed along the airfoil surfaces. Inflation layers were applied at the interface between the wind tunnel region and the turbine subdomain, as well as near the airfoil boundaries, to improve the near-wall resolution and the representation of boundary-layer gradients. This mesh resulted in approximately elements, as shown in Figure 6.
Figure 6.
Two-dimensional mesh refinement around the primary and auxiliary airfoils, showing the turbine subdomain discretization and the local near-wall refinement applied to resolve the boundary-layer region.
For the three-dimensional simulations, the wind tunnel region was discretized with an element size of 100 mm, whereas the turbine region was refined using an element size of 0.5 mm and a curvature capture criterion of 1°. A patch-conforming tetrahedral method was applied in the turbine subdomain. In addition, a conformal interface was defined between the wind tunnel region and the turbine subdomain to ensure proper connectivity between the corresponding meshes. The final three-dimensional mesh contained approximately elements, as illustrated in Figure 7.
Figure 7.
Refined three-dimensional computational mesh around the primary and auxiliary airfoils, highlighting the near-wall discretization used to resolve boundary-layer gradients and three-dimensional airfoil–flow interaction.
The numerical and experimental stages were separated according to their purpose, as summarized in Table 1. The two-dimensional simulations were used only for design screening and response-surface construction at . In contrast, the final three-dimensional CFD calculations and the wind tunnel tests were both static, with the rotor fixed at the same prescribed azimuth positions. The final three-dimensional CFD simulations were performed at a fixed inlet velocity of , which corresponds to the one-decimal nominal wind-speed condition used in the wind tunnel measurements. Therefore, the numerical–experimental comparison in Section 3.3 is not a comparison between a dynamic simulation and a static test; it is a fixed-rotor static-torque trend-level comparison under matched nominal low-speed conditions.
Table 1.
Numerical and experimental conditions.
After defining the two-dimensional and three-dimensional mesh configurations, the CFD simulations were performed using the shear stress transport k– turbulence model with curvature correction. This two-equation model, originally proposed in [33], combines the advantages of the k– model in the near-wall region with the robustness of the k– formulation in the outer flow. This formulation is particularly suitable for aerodynamic flows involving adverse pressure gradients and flow separation, which are expected in vertical-axis wind turbines operating under high-incidence conditions [34]. The SST k– model has been widely adopted in numerical studies of wind turbines [35,36], and previous investigations have reported good agreement with experimental measurements when this model is properly implemented [37,38].
Because the initial azimuth orientation of a vertical-axis wind turbine can strongly affect the torque available before motion begins, the static-torque analysis was performed over a full rotor revolution. Based on previous findings for flow-concentrator blades and related studies on self-starting behavior [39], the blade orientation was varied from 0° to 360° in increments of 15° with respect to the incoming wind direction. This angular resolution allowed the static-torque variation over the complete azimuth cycle to be characterized and enabled the identification of favorable pre-starting orientations.
A mesh-independence analysis was carried out before the final CFD simulations to verify that the predicted static torque was not significantly affected by the chosen discretization. The evaluated mesh parameters included the element size in the wind tunnel region, the refinement level in the turbine subdomain, the number of divisions at the interface between both control regions, and the maximum element size imposed on the blade surfaces. Figure 8 and Figure 9 show the variation of static torque as the mesh was progressively refined. The selected mesh corresponds to the region where additional refinement produced negligible changes in the torque response, providing a balance between numerical accuracy and computational cost. The grid-convergence check was performed using the baseline flow-concentrator geometry under a representative fixed-rotor condition. The final three-dimensional mesh was accepted because the relative change in static torque with respect to the previous refinement was below 1%, as summarized in Table 2. To avoid overstating the scope of this check, the grid-independence statement is restricted to the reported static-torque quantity and operating condition. Because the final production cases involve RSM-selected geometries at the lower nominal velocity of , the STBB and CFB simulations were additionally checked at critical azimuths on the accepted mesh using residual, torque-stability, and near-wall-resolution criteria. These checks are reported in Table 3, and the minimum local critical-mesh refinement record required for the selected STBB and CFB cases is defined in Table 4. The present checks are used as production-case verification of numerical stability; the local refined-mesh values must be reported before claiming geometry-specific grid independence.
Figure 8.
Mesh-independence analysis of the static-torque response under progressive mesh refinement.
Figure 9.
Static torque convergence of STBB and CFB blade configurations with increasing mesh resolution.
Table 2.
Three-dimensional mesh-independence summary.
Table 3.
Final-mesh stability checks.
Table 4.
Critical-grid checks.
For the three-dimensional comparison, the wind tunnel confinement was modeled using solid no-slip test-section walls, together with no-slip blade and shaft surfaces. The two-dimensional screening stage used a simplified planar representation only to reduce the computational cost of the RSM. This distinction is important because the blockage ratio is non-negligible and the final numerical–experimental comparison is restricted to the confined test-section condition.
Figure 10 presents the variation in the wall values as a function of the number of mesh elements for the STBB and CFB configurations. The red curve corresponds to the STBB model, whereas the black curve represents the CFB model. Both configurations exhibit an overall decrease in as the number of mesh elements increases, although differences are observed in the magnitude and evolution of this parameter. For the STBB model, reaches a maximum value of approximately 0.46 at relatively low element counts, followed by a progressive decrease to approximately 0.23 near 70 million elements. In contrast, the CFB model exhibits a more pronounced reduction at lower element counts, decreasing from approximately 12 to 2.4 at the upper end of the investigated range. These trends allow a comparison of the response of both configurations to variations in mesh resolution and facilitate the assessment of numerical solution sensitivity. Overall, the results provide complementary information for evaluating the consistency of the simulations and the selection of the parameters employed in the aerodynamic analysis.
Figure 10.
Variation in the wall values of the CFB and STBB blade configurations as a function of mesh refinement.
2.3. Static-Torque Metrics and Comparison Criteria
The main performance variable in this work is the static aerodynamic torque, , evaluated at a prescribed azimuth angle while the rotor remains fixed. Because the reference Darrieus torque can approach zero at some azimuth positions, pointwise percentage differences may become ill-conditioned and may overstate physically small absolute changes. For this reason, the comparison among blade concepts was based primarily on the complete torque distribution and on cycle-level indicators rather than on isolated percentage peaks.
For a set of M evaluated azimuth positions, the mean static torque is defined as
while the positive and adverse contributions are separated as
The fraction of azimuth positions producing positive torque is calculated as
where is an indicator function. These quantities distinguish between peak torque amplification and persistent positive torque generation, which is essential for interpreting pre-starting behavior. When dimensional results obtained under the same confined test-section condition are discussed, the confined static-torque coefficient is used only as an internal normalization:
where is the nominal inlet velocity inside the wind tunnel test section, is the projected rotor swept area, R is the rotor radius, and H is the blade height. In the final CFD–experiment comparison, the rotor condition and nominal inflow velocity were matched at , so the dimensional static torque can be compared directly as a trend-level assessment of the azimuthal response inside the same confined test section.
The tested rotor occupies a non-negligible fraction of the wind tunnel section. Using and , the projected rotor area is , whereas the test-section area is . The resulting geometric blockage ratio is therefore approximately . This value is high enough to modify the local acceleration of the flow around the rotor. Since no Glauert, Maskell, Pope, or equivalent analytical blockage correction is applied in this study, is reported only as an internal normalization for the confined test-section condition. It must not be interpreted as a free-field static-torque coefficient or used for field-scale extrapolation without additional blockage-correction or free-domain CFD studies. Accordingly, all torque comparisons are framed as comparative static-torque evidence under the same confined wind tunnel condition, not as free-field performance predictions.
For a future dynamic start-up interpretation, the static-torque curves could be combined with the rotor moment of inertia and mechanical loss torque through
where is the theoretical incipient angular acceleration, is the rotor moment of inertia, and is the resistive mechanical torque. Because and were not independently characterized in the present work, Equation (6) is not used to claim validated self-starting performance; it is included only to define the additional information required for a complete free-rotation start-up assessment.
2.4. Governing Equations
The aerodynamic characterization of the fixed Darrieus-type rotor requires the solution of a separated, orientation-dependent flow field with large variations in local incidence angle and adverse pressure gradients around the blade surfaces. For the present low-speed operating conditions, the incoming air velocity remains within the low-Mach-number regime; therefore, air was modeled as an incompressible Newtonian fluid with constant density and viscosity.
The static CFD calculations were solved at prescribed rotor azimuth positions. Thus, the governing equations were treated in their steady incompressible Reynolds-averaged form for each fixed orientation. The continuity equation is
and the momentum conservation equation is
where and are the Reynolds-averaged velocity and pressure fields, respectively, is the air density, is the dynamic viscosity, and denotes the Reynolds stress tensor. The Reynolds stresses were closed using the shear stress transport k– turbulence model with curvature correction, as described in Section 2.2. This modeling strategy is consistent with the objective of the present work, i.e., comparing the static aerodynamic loads produced by alternative fixed blade arrangements rather than resolving the transient angular acceleration of a freely rotating rotor.
2.5. Response Surface Design-Screening Framework
Response surface methodology (RSM) is a mathematical and statistical framework widely used in engineering design screening and optimization to approximate the relationship between a set of design variables and a target response using a limited number of system evaluations [40,41]. In CFD-based aerodynamic design screening, this approach is particularly useful because it reduces the computational burden associated with exhaustive parametric studies while preserving the capability to identify trends, interactions, and favorable regions within the design space.
In the present study, RSM was employed to evaluate the influence of the geometric parameters of the dual-airfoil blade concept on the static torque of the Darrieus-type rotor. The active RSM design space was defined by six sampled variables: , , , , , and . The primary azimuthal position, , and the primary radial position, , were fixed to preserve the reference rotor envelope and avoid conflating blade-level flow-guiding effects with a change in rotor scale. The static torque obtained from two-dimensional CFD simulations was used as the objective response, since it represents the aerodynamic moment available under fixed-rotor pre-starting conditions.
The response surface was constructed by fitting a surrogate model to the CFD responses obtained from a finite set of design points. In general, the response can be approximated by a second-order polynomial of the form
where is the predicted static torque, and are the design variables, and , , , and are the regression coefficients associated with the constant, linear, quadratic, and interaction terms, respectively. This formulation allows the effect of individual parameters and coupled geometric interactions to be evaluated without requiring a full-factorial CFD campaign.
For the RSM screening, the scalar objective was defined from the angularly resolved two-dimensional static-torque response, not from an isolated maximum. For each design vector , the response supplied to the surrogate-ranking stage was
where is the independent azimuth interval used in the planar screening stage. The prime denotes a two-dimensional sectional static-torque metric obtained from the planar CFD model; it is used for RSM ranking only and is not interpreted as the full three-dimensional rotor torque measured in the wind tunnel. Because a large value of can still hide local braking sectors, the final candidate selection also checked the auxiliary indicators , , and , defined analogously to Equations (2)–(4). Therefore, the RSM was used to rank and filter geometries, whereas the final conclusions were based on direct three-dimensional static CFD and wind tunnel trend-level comparison at the matched lower-speed condition.
The initial design ranges used for the RSM design-screening are summarized in Table 5. The table also lists the fixed quantities used to preserve the same global rotor envelope defined in Section 2.1.
Table 5.
RSM design space.
A central composite design with a G-optimality criterion, implemented in ANSYS DesignXplorer, was adopted to generate an efficient distribution of design points within the six-dimensional active parameter space. This strategy was selected because it provides sufficient information to estimate linear, quadratic, and interaction effects while avoiding the prohibitive cost of a full-factorial study. For instance, considering six active variables with seven discrete levels would require CFD simulations. Assuming approximately 2 h per simulation, this would correspond to h, or approximately 9804 days of computation, which is not feasible for the present design-screening problem. In contrast, the adopted RSM strategy used 400 two-dimensional CFD evaluations in total across the repeated sampling process. Four sampling distributions were compared within this campaign to reduce the sensitivity of the surrogate model to the initial set of design points.
The response surface was used as a design-screening tool rather than as the final source of the reported aerodynamic loads. This distinction is essential because the two-dimensional screening was performed at , whereas the final three-dimensional CFD and wind tunnel measurements were performed at . For the explored chord range of 30–50 mm, these velocities correspond approximately to chord-based Reynolds-number intervals of – at and – at . Since separation and low-Reynolds-number stall behavior can change across this interval, the 7.0 m/s RSM was not treated as evidence that the same geometries are globally optimal at 2.8 m/s. It was used only to identify geometric sensitivities and candidate arrangements that were then recomputed directly under the lower-speed confined condition. Consequently, the final ranking and conclusions are based on direct three-dimensional static CFD and wind tunnel trend-level comparison at , not on the two-dimensional surrogate predictions.
Despite this Reynolds number separation, the higher-speed RSM remains useful as a qualitative flow-redirection screening step because the governing geometric mechanism is imposed by the relative chord, setting angle, azimuthal offset, and radial placement of the NACA 6412 primary and auxiliary profiles. These variables define the functional path through which the auxiliary airfoil modifies the local incidence, pressure-gradient distribution, and high- and low-pressure regions around the primary torque-generating airfoil. Therefore, the RSM is interpreted as preserving the geometric functional similarity of the main flow-guiding and pressure-loading trends, while the absolute torque magnitude, separation onset, and final candidate ranking are verified only through direct three-dimensional static CFD and confined wind tunnel measurements at .
The Reynolds number difference in Table 6 is treated as a methodological limitation. In this low-Reynolds-number range, boundary-layer separation and stall onset may change with velocity and chord. Therefore, the two-dimensional RSM response is not interpreted as proof of global optimality at . The STBB and CFB configurations are treated as RSM-selected candidate geometries obtained from a higher-speed two-dimensional screening stage. As a minimum low-speed verification step, both candidate geometries were recomputed directly with the final three-dimensional confined-domain model at and compared against the conventional Darrieus and the baseline flow-concentrator reference. The verification is local rather than global: it confirms that the selected candidates remain aerodynamically relevant under the final low-speed condition, but it does not prove that they are globally optimal over the full design space at .
Table 6.
Reynolds-number scope.
The direct low-speed verification of the RSM-selected candidates is summarized in Table 7.
Table 7.
Low-speed candidate verification.
The quantitative adequacy of the response surface was assessed using the diagnostics exported from the final ANSYS DesignXplorer response-surface report and listed in Table 8. These diagnostics were used only to support the screening process; the final aerodynamic claims remain based on direct three-dimensional CFD and wind tunnel measurements, not on surrogate predictions.
Table 8.
RSM surrogate diagnostics.
The first RSM stage was used to identify the variables with the greatest effect on the static-torque response. Variables with negligible influence were then removed or restricted to narrower ranges, allowing the design space to be progressively refined. This iterative process improved the predictive quality of the response surface and enabled the selection of two RSM-selected candidate blade concepts: the CFB and the STBB. The final geometric parameters of both configurations are reported in Table 9.
Table 9.
Final CFB and STBB geometry.
For the CFB concept, the primary airfoil chord was reduced to 30 mm, while its setting angle was increased to 12°, and its azimuth angle was kept at 0°. The radial position of the primary airfoil was fixed at 140.8 mm to preserve the maximum rotor envelope. The auxiliary airfoil chord was increased to 50 mm, with a setting angle of and an azimuth angle of . Its radial position was set to 121.6 mm, corresponding to a minimum separation of approximately 19.56 mm between the two airfoil elements, accounting for the NACA 6412 curvature and the angular orientation of both profiles.
For the STBB concept, the primary airfoil chord was also reduced to 30 mm, while both its setting and azimuth angles were maintained at 0°. The auxiliary airfoil chord was increased to 50 mm, with a setting angle of and an azimuth angle of . Although the radial position of the auxiliary airfoil was the same as in the CFB concept, the different setting angle produced a minimum separation of approximately 22.6 mm between both airfoil elements. This difference illustrates that small geometric variations in angular orientation can modify the local airfoil interaction and, therefore, the resulting static-torque response.
Figure 11 illustrates the initial response surface generated from the design variables listed in Table 5. One of the main advantages of RSM is that it enables the visualization of the relationship between the input variables and the objective response either in two dimensions, for single-variable sensitivity analysis, or in three dimensions, for evaluating coupled interactions between two design variables. This capability was used to identify dominant geometric parameters, discard low-impact variables, and refine the numerical approximation before the final three-dimensional CFD assessment.
Figure 11.
Initial response surface results obtained from the design space defined in Table 5. The original panels are displayed vertically for legibility: (a) azimuthal sectional static-torque screening response and (b) the corresponding three-dimensional response surface.
The refined response surface, shown in Figure 12, was used to select the final STBB and CFB candidate geometries for the subsequent three-dimensional CFD analysis. Although both selected configurations share similar chord lengths and radial positions, their angular definitions produce different aerodynamic mechanisms. The STBB concept emphasizes inducer-assisted static-torque amplification, whereas the CFB concept promotes flow redirection through a converging arrangement. These differences were further evaluated in the three-dimensional simulations, where finite-span effects, lift and drag contributions, and turbulent three-dimensional flow structures were resolved more completely than in the two-dimensional design-screening stage.
Figure 12.
Refined response surface after reducing the design space to the most influential variables. The plotted gray curve and individual sampled points are retained from the original software output.
2.6. Experimental Setup and Static-Torque Measurement Protocol
Experimental tests were conducted in an open-circuit wind tunnel with an overall length of 4 m and a square test section of , as shown in Figure 13. The experimental campaign was focused exclusively on the static-torque response of the evaluated blade concepts. This measurement approach was selected to quantify the aerodynamic moment generated by each configuration under stationary rotor conditions, which is directly related to the torque available before rotor motion begins.
Figure 13.
Experimental setup used for the static-torque evaluation of the rotor configurations. (a) General view of the open-circuit wind tunnel. (b) Test section with the rotor prototype installed for stationary torque measurements.
The final numerical and experimental comparison followed the same physical interpretation: the rotor was fixed at prescribed azimuth positions and the torque was measured or computed under the same nominal low-speed wind tunnel conditions. Therefore, the comparison reported here concerns the azimuthal static-torque response and should not be interpreted as a dynamic self-starting test.
Because the rotor occupied a non-negligible fraction of the wind tunnel section, the measurements are interpreted strictly as confined test-section static-torque data rather than free-field torque measurements. The geometric blockage ratio was estimated from the projected rotor area as
where is the projected rotor area, and is the wind tunnel test-section area. A Maskell-type blockage treatment would require an empirical velocity-increment or wake-shape factor to relate the confined and corrected reference velocities, for example
and the corresponding blockage-corrected static-torque coefficient, which is not used in the present comparison, would be evaluated as
In the present work, was not calibrated from an independent wake survey, wall-pressure measurement, or free-domain reference simulation. Applying a Glauert-, Maskell-, Pope-, or equivalent blockage correction without that calibration would introduce unsupported numerical precision. Consequently, no analytical blockage correction is applied here; the reported torque and are used only as internally consistent comparative indicators for the same confined wind tunnel condition. To maintain consistency between numerical and experimental results, the three-dimensional CFD domain reproduced the wind tunnel test section used in the experiments, and the results are not interpreted as free-field performance estimates.
The turbine prototype was mounted inside the test section, with the rotor shaft aligned vertically and positioned to provide a repeatable testing condition for all configurations. During each measurement, the rotor was mechanically constrained at a prescribed azimuthal position, preventing free rotation and allowing the aerodynamic moment acting on the stationary rotor to be evaluated directly. Therefore, the experimental protocol was limited to static-torque characterization and did not include rotational speed measurements.
The wind tunnel operation and data acquisition sequence were managed using a National Instruments roboRIO controller. The inlet speed was checked with a calibrated anemometer/velocity probe positioned upstream of the rotor, on the test-section centerline and approximately at rotor mid-height, before each static-torque sequence. This location was selected to define a repeatable nominal inlet condition for all geometries; it does not constitute a complete spatial map of the test-section velocity field. The inlet turbulence intensity used in the CFD model was therefore imposed as a nominal value of rather than derived from an independent turbulence-characterization campaign. The static force generated by the rotor was measured using a 1 kg strain-gauge load cell coupled to an HX711 signal-conditioning module. The load cell was connected to a known moment arm fixed to the rotor shaft, so that the measured force could be converted into static torque. For each blade configuration and rotor orientation, the force signal was recorded once the response reached a stable condition.
The main instrumentation used in the experimental setup is summarized in Table 10.
Table 10.
Experimental instrumentation.
The static torque, , was calculated from the measured force according to
where F is the force measured by the strain-gauge load cell, and L is the effective moment arm between the rotor shaft axis and the force measurement point. This relation provides a direct estimate of the aerodynamic moment generated by the stationary rotor.
For each experimentally reported configuration, the static-torque measurement was repeated at the selected azimuthal positions to characterize the angular dependence of the aerodynamic moment. The experimental figures in this work focus on the reference Darrieus blade and the RSM-selected STBB and CFB concepts. The baseline flow-concentrator geometry is retained in the three-dimensional CFD comparison as the parent configuration from [32], but it is not introduced as an additional experimental curve in Section 3.3.
The experimental uncertainty budget used for the static-torque measurements is summarized in Table 11. The values are reported with one decimal where applicable to avoid false precision in the wind-speed condition. Before each test sequence, the load cell was tared with the rotor installed, and the force signal was checked under a zero-flow condition. The force conversion was calibrated using known reference masses over the operating range of the measurement system. The standard force uncertainty, , combines calibration scatter, tare drift, and stable-signal dispersion after averaging. The acquisition frequency was set to , and each reported torque value was computed from a stable-signal window after the force signal reached steady behavior.
Table 11.
Measurement uncertainty.
The uncertainty associated with torque conversion was estimated from the propagation of the force and moment-arm uncertainties as
where is the standard uncertainty of the force measurement, and is the standard uncertainty of the effective moment arm. Using the values in Table 11, the propagated uncertainty at is approximately . Since the measured torques are small, the experimental results are interpreted primarily in terms of repeatable azimuthal trends and relative differences among geometries. The repeated-measurement envelope, represented by and in Section 3.3, is used to show the experimental dispersion at each angular position.
This experimental protocol enabled the direct evaluation of the torque available under pre-starting static conditions. Consequently, the experimental data provided a reference for assessing whether the RSM-selected blade concepts increased the static aerodynamic moment relative to the baseline Darrieus-type configuration.
3. Results and Discussion
As described in the previous sections, the objective of this study was to improve the static-torque response of the baseline flow-concentrator blade without modifying the external rotor envelope. Therefore, the maximum blade height, maximum rotor radius, and NACA 6412 airfoil family were kept constant. This constraint ensured that the observed variations in performance were mainly associated with the aerodynamic interaction between the primary torque-generating airfoil and the auxiliary flow-guiding airfoil, rather than with changes in swept area or rotor scale.
The analysis was focused on two main aspects: first, the identification of RSM-selected geometric configurations capable of increasing the static torque under fixed-rotor conditions; and second, the trend-level comparison of the main azimuthal torque features using three-dimensional CFD and wind tunnel static measurements performed under matched low-speed test conditions. Accordingly, this section presents the results obtained from the two-dimensional response surface design screening, the subsequent three-dimensional static CFD simulations, and the wind tunnel static-torque experiments.
3.1. Two-Dimensional Assessment of Design Parameters
The two-dimensional assessment was performed at to screen the geometric design space and identify the parameters governing the static-torque response under stationary rotor conditions. This velocity was used only for the reduced-order design-screening stage and not for the final numerical–experimental trend comparison. The ordinate of the two-dimensional plots is therefore interpreted as the sectional RSM torque metric , not as a directly measurable full-rotor torque. Since the initial azimuth position strongly affects the torque available before motion begins, the static torque was evaluated using angular increments of 15°. The two-dimensional screening plots are reported over the independent 0–180° azimuth interval because the fixed two-blade configuration repeats the static-torque pattern every half revolution; the final three-dimensional comparison was plotted over 0–360° to verify the full-cycle periodic behavior; the 360° point is shown only for visual closure and is not included in the cycle averages.
Figure 14 presents the initial static-torque responses obtained from the response surface screening. The configuration reported in [32] was used as the reference case. The evaluated designs generally increased the mean static torque over the analyzed azimuth interval, with improvements of approximately 25–45% relative to [32] within the two-dimensional screening framework. These values are interpreted as design-selection indicators rather than final performance claims. The trend confirms that the relative placement of the auxiliary airfoil can substantially modify the aerodynamic moment available under pre-starting static conditions, even when the external rotor envelope remains unchanged.
Figure 14.
Initial two-dimensional response surface results for the static-torque variation over the independent 0–180° azimuth interval at . “Baseline FC” denotes the previously reported flow-concentrator reference [32].
The first screening stage showed that the dominant effects were associated with the auxiliary airfoil. In particular, the setting angle, , and the azimuth offset, , produced the largest variations in the static-torque response. The radial position, , also contributed significantly because it modifies the spacing between the primary and auxiliary airfoils, thereby altering their aerodynamic interaction. By contrast, the auxiliary chord length, , had a weaker influence within the 30–40 mm interval, although its effect became more relevant as the chord approached 50 mm.
Figure 15 shows the coupled effect of and on the static torque. The response surface indicates that the torque is governed primarily by the angular orientation of the auxiliary airfoil rather than by chord-length variation alone. Thus, acts as a controlling parameter for the local incidence conditions and the flow-guiding mechanism, whereas mainly modifies the effective interaction area between both airfoil elements.
Figure 15.
Response surface of the two-dimensional sectional static-torque metric as a function of the auxiliary airfoil setting angle, , and chord length, .
After the dominant variables were identified, the design space was refined by increasing the sampling density around the most relevant regions. The refined results, shown in Figure 16, reveal that configurations with higher mean torque over the analyzed azimuth interval may still produce localized adverse-torque sectors. This distinction is important because the torque available before rotor motion is not only determined by the maximum or mean value but also by the persistence of favorable torque throughout the analyzed azimuth interval. Therefore, the final selection considered both torque amplification and the reduction of angular regions where the aerodynamic moment opposes rotor motion.
Figure 16.
Refined two-dimensional sectional static-torque metric response after focusing the response surface analysis on the dominant geometric variables. “Baseline FC” denotes the flow-concentrator reference reported by [32].
Based on the refined two-dimensional analysis, two configurations were selected for further evaluation: the Static-Torque Booster Blade (STBB) and the Converging-Flow Blade (CFB). Figure 17 compares their static-torque response with [32]. All configurations exhibit the expected periodic torque variation over the analyzed azimuth interval. However, the RSM-selected concepts modify both the magnitude and angular distribution of the favorable torque regions.
Figure 17.
Two-dimensional sectional static-torque metric comparison among [32], STBB, and CFB over the independent 0–180° azimuth interval. The horizontal axis denotes the azimuth angle. The legend entry “Baseline FC” denotes the flow-concentrator reference reported by [32].
The configuration reported in [32] exhibits a comparatively smooth response, with maximum torque values close to near . However, a substantial portion of the analyzed azimuth interval remains below its mean torque level of approximately . The STBB configuration increases the torque in two main angular regions. The first occurs between approximately and , where the torque approaches , while the second appears near . This behavior shows that the STBB improves the airfoil–flow interaction at selected azimuth positions without requiring an increase in rotor envelope.
The CFB configuration produces one of the strongest positive-torque responses in the two-dimensional screening stage, exceeding near . This response is consistent with the converging arrangement of the primary and auxiliary airfoils, which intensifies the local aerodynamic loading. Nevertheless, the CFB also introduces negative-torque regions around –. Therefore, the CFB favors positive-torque concentration in selected sectors, whereas the STBB provides a more balanced torque distribution over the analyzed azimuth interval.
The two-dimensional results were used only as a comparative design-screening criterion. In the two-dimensional formulation, the computed torque corresponds to a planar section with unit spanwise depth; therefore, these values should not be interpreted as the final torque of the physical rotor. Instead, they provide a consistent metric for identifying favorable geometric trends before conducting the three-dimensional assessment.
3.2. Three-Dimensional Static-Torque Response of the STBB and CFB Concepts
Although the two-dimensional analysis enabled an efficient identification of the most promising geometries, a three-dimensional evaluation is required to assess whether the observed improvements are preserved when finite-span effects, three-dimensional pressure redistribution, lift and drag contributions, and turbulent flow structures are considered. Therefore, the selected STBB and CFB candidate concepts were evaluated using full three-dimensional CFD simulations and compared with both the baseline flow-concentrator blade and a conventional Darrieus blade.
Figure 18 presents the static-torque variation as a function of azimuth angle for the four blade configurations. Overall, the three-dimensional results preserve the periodic behavior observed in the two-dimensional stage, although the magnitude of the torque peaks and the amplitude of the fluctuations differ among the geometries. This confirms that the blade arrangement has a direct influence on the global aerodynamic loading of the rotor.
Figure 18.
Three-dimensional static-torque response of the conventional Darrieus blade, baseline flow concentrator blade, STBB, and CFB concepts over one azimuth revolution at the nominal static comparison condition, . “Baseline FC” corresponds to the flow-concentrator reference from [32].
The CFB configuration increases the favorable static torque in selected azimuth sectors, with local peaks of approximately near 0° and 180° under the low-speed static comparison condition; the point plotted at 360° is only the periodic closure of 0° and is not counted as an additional independent sample. This confirms that the aerodynamic trends identified during the response surface screening are not suppressed when three-dimensional effects are included. However, the CFB also shows more pronounced low- and adverse-torque regions around 105° and 285°, indicating that this configuration may induce local braking effects over specific azimuth intervals.
The STBB configuration exhibits the highest overall static-torque peak in the three-dimensional CFD results and a more balanced response over the azimuth cycle. Compared with the CFB, the STBB avoids the strongest adverse-torque intervals and provides the lowest adverse-torque contribution among the RSM-selected configurations. This behavior is advantageous for pre-starting operation because it reduces the occurrence of strong braking sectors that may delay the onset of motion.
The cycle-level indicators defined in Section 2.3 are reported in Table 12. These quantities are used as the primary quantitative comparison because they remain well conditioned even when the reference Darrieus torque approaches zero at individual azimuth positions.
Table 12.
Three-dimensional cycle-level torque metrics.
The azimuth-resolved CFD values used to compute Table 12 are mandatory Supplementary Materials. The supplementary package must include the pointwise values for the Darrieus, baseline flow-concentrator, STBB, and CFB configurations over the 24 unique CFD azimuth positions. Reporting the pointwise values is essential because the cycle-level indicators depend on the complete torque distribution rather than on a single peak.
Table 13 reports cycle-level absolute differences relative to the conventional Darrieus blade. This representation preserves the physical scale of the torque changes and avoids overstating small absolute differences near zero-torque reference angles.
Table 13.
Torque differences from Darrieus.
The cycle-level comparison therefore supports a more precise interpretation: the CFB increases the mean positive torque contribution in selected favorable sectors, but it also intensifies adverse-torque regions and does not improve the positive-torque fraction relative to the conventional Darrieus rotor. In contrast, the STBB reaches the highest overall static-torque peak, increases the positive-torque fraction, and provides the most robust reduction of adverse torque among the RSM-selected configurations.
3.3. Experimental Static-Torque Results
Wind tunnel experiments were conducted to assess whether the torque trends predicted by the three-dimensional static CFD simulations were preserved under physical testing conditions. The measurements were performed at a nominal wind speed of , which is the same one-decimal inlet velocity imposed in the final three-dimensional static CFD comparison. The rotor was fixed at prescribed azimuth positions, and the resulting static torque was obtained from the measured force at the torque arm. Therefore, the experimental analysis was focused on the pre-starting static-torque capability of each configuration rather than on dynamic rotational performance.
For each azimuth position, the repeated measurements were processed in terms of the lower bound, upper bound, and mean static torque, defined as
where is the static torque measured during the kth repetition at a given azimuth position, and N is the number of repeated measurements. This representation allows the experimental dispersion and the mean torque trend to be evaluated simultaneously. The comparison criterion is therefore based on the agreement of the main azimuthal features, including the location of favorable and weak-torque sectors, rather than on exact point-by-point equality between CFD and experiment.
To make this trend-level comparison objective, the CFD–experiment agreement is quantified using half-cycle sector metrics. First, the angular peak-offset metric is defined as
where and are the azimuth positions of the dominant CFD and experimental static-torque peaks within the measured interval. Second, the favorable-sector overlap and weak-sector overlap are defined as
where denotes the favorable high-torque sector and denotes the weak or adverse-torque sector. Values close to unity indicate that CFD and experiment identify the same angular regions, even when the absolute torque magnitude is biased. These metrics are used only for sector-level agreement under confined static conditions; they are not used to claim calibrated torque prediction.
Because the tested rotor has a two-blade periodic arrangement and the available wind tunnel measurements were acquired over the independent 0–180° interval, the experimental comparison in this manuscript is restricted strictly to the measured half-cycle. No full-cycle experimental torque claim is made from these data. The full-cycle numerical indicators in Section 3.2 use the 24 unique CFD azimuth positions from 0° to 345°; the experimental figures, sector summaries, and CFD–experiment agreement metrics are reported only over the measured half-cycle. A complete experimental full-cycle claim would require measured data from 180° to 360° or an independently justified symmetry verification.
To ensure traceability and reproducibility, the azimuth-resolved experimental data used to generate Figure 19, Figure 20 and Figure 21 are provided as Supplementary Materials, along with the results summarized in Table 14, Table 15 and Table 16. The supplementary dataset includes , , and at each measured azimuthal position for the Darrieus, STBB, and CFB configurations. The experimental curves and sector-based summaries are interpreted as evidence of trends observed across repeated measurements.
Figure 19.
Experimental and three-dimensional CFD static-torque comparison for the CFB concept under low-speed wind tunnel conditions. The experimental response is represented by , , and at the measured azimuth positions; connecting lines are used only as visual guides.
Figure 20.
Experimental and three-dimensional CFD static-torque comparison for the STBB concept under low-speed wind tunnel conditions. The experimental response is represented by , , and at the measured azimuth positions; connecting lines are used only as visual guides.
Figure 21.
Experimental and three-dimensional CFD static-torque comparison for the conventional Darrieus blade under low-speed wind tunnel conditions. The experimental response is represented by , , and at the measured azimuth positions; connecting lines are used only as visual guides.
Table 14.
Experimental half-cycle trends.
Table 15.
CFD–experiment sector agreement.
Table 16.
CFD–experiment bias summary.
Figure 19 shows that the CFB configuration produces a strongly azimuth-dependent static-torque response. The highest mean values occur near the beginning and end of the analyzed azimuth interval, reaching approximately at 0° and at 180°. The upper experimental bound exceeds in these favorable regions. In contrast, the torque decreases toward nearly zero between 60° and 105°, identifying a weak-torque sector in which the aerodynamic moment available for incipient motion is substantially reduced.
The comparison in Figure 19 also shows that the three-dimensional CFD prediction captures the main angular structure of the CFB response, including the high-torque regions near 0° and 180° and the torque reduction in the intermediate sector. However, the numerical model underpredicts the experimental mean torque in the intervals 0–30° and 135–180°, with differences of approximately 20–40% relative to . This deviation is interpreted as a systematic modeling bias rather than as a calibrated prediction error. Possible contributors include the nominal inlet turbulence intensity fixed at , the absence of an experimental turbulence-intensity map, the high blockage level without analytical correction, prototype surface and manufacturing tolerances, support interaction, residual mechanical compliance, and instrumentation uncertainty. Since these effects were not isolated independently, the comparison is interpreted as azimuthal trend-level agreement rather than exact torque prediction. Despite these differences, the agreement in the location of the dominant torque regions confirms that the CFD model reproduces the principal aerodynamic trend of the CFB configuration.
The STBB response, shown in Figure 20, presents a different experimental behavior. Unlike the CFB, which concentrates its highest torque near the limits of the evaluated interval, the STBB reaches its maximum mean torque between and , with values close to . The upper experimental bound exceeds in this region. After this favorable sector, the torque decreases progressively and approaches zero around 105–120°, indicating the onset of a low-contribution angular region.
Figure 20 demonstrates that the three-dimensional CFD prediction reproduces the main STBB trend, particularly the location of the favorable torque region between and and the subsequent reduction in torque as the azimuth position increases. As observed for the CFB, the CFD model underestimates the experimental torque, especially near the maximum-torque region, where the measured mean values are approximately 30–40% higher than the numerical prediction. This magnitude difference should be interpreted together with the uncertainty budget, the nominal turbulence assumption, the unresolved blockage correction, and the sensitivity of separated low-Reynolds-number flow to near-wall resolution and prototype tolerances. Therefore, the numerical model is used here to identify favorable and unfavorable azimuth sectors under static conditions, not to provide a fully calibrated torque magnitude.
The conventional Darrieus blade response, presented in Figure 21, provides the experimental reference for evaluating the RSM-selected configurations. Compared with Figure 19 and Figure 20, the Darrieus rotor exhibits substantially lower static-torque levels over the analyzed azimuth interval. This confirms that the dual-airfoil concepts increase the aerodynamic moment available under pre-starting conditions relative to the conventional Darrieus experimental reference, even when the rotor remains stationary. The parent baseline flow-concentrator geometry is used only in the three-dimensional CFD comparison and is not claimed as an additional experimental baseline in this section.
Overall, Figure 19, Figure 20 and Figure 21 confirm that the RSM-selected blade concepts modify the pre-starting torque response in distinct ways. The CFB concentrates favorable torque in specific azimuth sectors, consistent with its converging-flow arrangement, but it also retains a weak-torque sector in the intermediate angular range. The STBB provides the highest measured favorable sector and a more continuous torque contribution over a broader portion of the analyzed azimuth interval, which is advantageous for reducing low-torque sectors. Therefore, the CFB is better interpreted as a flow-redirection concept that increases mean positive torque at selected orientations, whereas the STBB offers the most balanced static-torque distribution for pre-starting static operation.
4. Conclusions
This study investigates two dual-airfoil blade concepts optimized to improve the static torque response and their sensitivity to changes in azimuthal orientation. The proposed STBB and CFB configurations were derived from a previously developed flow-concentrator blade while preserving the same rotor envelope, maximum blade height, rotor radius, and NACA 6412 airfoil family. This design approach made it possible to distinguish the aerodynamic effect of the first blade section (the outer profile) from that of the second blade section (the inducer or secondary profile). Two-dimensional response surface analysis demonstrated that certain design variables related to the airfoil profiles, specifically the pitch angle, azimuthal position, and radial location of the inducing airfoil, have a greater impact on the response variable (static torque) than others when analyzed individually across different azimuthal orientations.
The initial stage of the RSM analysis demonstrated that optimized geometric configurations could increase the average static torque by 25–45% compared with the reference flow-concentrator blade. However, further analysis also showed that a higher peak torque does not necessarily guarantee a better response throughout the entire azimuthal cycle, as some configurations exhibited localized regions of adverse torque. The CFB concept generated the highest static torque peaks, particularly at favorable azimuthal orientations, confirming the effectiveness of the converging arrangement in intensifying the aerodynamic load on the rotor. However, this configuration also exhibited more pronounced regions of negative torque, which would tend to locally oppose rotation. In contrast, the STBB concept produced a more favorable torque distribution, with lower peak static torque values than the CFB but a positive contribution throughout the azimuthal cycle. Therefore, the CFB is more suitable when the priority is to maximize peak static torque, whereas the STBB provides a more favorable response for reducing adverse torque fluctuations during the initial stage of the operating cycle.
Wind tunnel experiments were conducted at a low wind speed of , with the wind turbine mechanically fixed at prescribed azimuthal positions. These experiments validated the main trends predicted by the three-dimensional CFD simulations. For the CFB configuration, the highest average static torque values were observed near and 180°, while low-torque regions appeared approximately between and . For the STBB configuration, the most favorable region was identified between and , with measured peak torque values exceeding the numerical predictions. Although the CFD model underestimated the magnitude of the experimental torque in some azimuthal intervals, both approaches consistently identified the azimuthal regions associated with maximum and minimum torque generation.
Overall, the results demonstrate that modifying the relative orientation and spacing between the outer and inner profiles is an effective strategy for improving static torque generation in small-scale Darrieus-type rotors. The STBB and CFB concepts offer two distinct aerodynamic mechanisms: static torque amplification through controlled interaction between the blade profiles and flow redirection through a convergent blade arrangement. This work presents a comparison of static torque at different azimuthal orientations rather than an evaluation of dynamic torque. Consequently, the results should be interpreted as a comparative assessment of the different blade designs tested under confined conditions. It should be noted that the STBB and CFB models were derived from RSM analyses conducted at , with the objective of optimizing the flow-concentrating configuration rather than specifically optimizing the designs for . This study specifically examines whether the behavior resulting from the inducing profile remains observable at a lower wind speed—the same wind speed at which the “pitching” (or “nodding”) effect was previously observed.
Future work should include a more detailed analysis of the flow within the channel between the two airfoils across various azimuthal orientations; dynamic torque testing to define operating speeds and their limits; characterization of mechanical losses; quantification of uncertainty in static torque measurements; and transient CFD simulations to evaluate the transition from torque generation to rotor acceleration.
Supplementary Materials
The following supporting information can be downloaded at https://www.mdpi.com/article/10.3390/wind6040067/s1 or https://doi.org/10.5281/zenodo.24119975, Table S1, local critical-mesh refinement values for STBB and CFB at the selected critical azimuths; Table S2, azimuth-resolved experimental static-torque values over the measured 0–180° half-cycle, including , , and ; Table S3, azimuth-resolved three-dimensional CFD static-torque values over the 24 unique azimuth positions used to compute the cycle-level indicators; and Table S4, the sector definitions used to compute , , and .
Author Contributions
Conceptualization, M.A.C.A., L.G.V., C.E.C.F. and M.M.; methodology, M.A.C.A., L.G.V. and M.M.; software, M.A.C.A. and L.G.V.; verification and trend-level comparison, M.A.C.A., L.G.V. and M.M.; formal analysis, M.A.C.A., L.G.V., M.M. and A.T.-M.; investigation, M.A.C.A., L.G.V., M.M., A.T.-M. and H.J.V.-H.; resources, L.G.V., A.T.-M., C.E.C.F. and H.J.V.-H.; data curation, M.A.C.A., C.E.C.F. and L.G.V.; writing—original draft preparation, M.A.C.A., L.G.V. and M.M.; writing—review and editing, M.M., A.T.-M. and H.J.V.-H.; visualization, M.A.C.A. and L.G.V.; supervision, L.G.V., M.M. and H.J.V.-H. All authors have read and agreed to the published version of the manuscript.
Funding
This research received no external funding.
Institutional Review Board Statement
Not applicable.
Informed Consent Statement
Not applicable.
Data Availability Statement
Data will be made available on request.
Acknowledgments
The authors acknowledge the institutional support and laboratory facilities used for the numerical and experimental work.
Conflicts of Interest
The authors declare no conflicts of interest.
References
- Rosato, A.; Perrotta, A.; Maffei, L. Commercial small-scale horizontal and vertical wind turbines: A comprehensive review of geometry, materials, costs and performance. Energies 2024, 17, 3125. [Google Scholar] [CrossRef] [Scilit]
- Vadhyar, A.; Sridhar, S.; Reshma, T.; Radhakrishnan, J. A critical assessment of the factors associated with the implementation of rooftop VAWTs: A review. Energy Convers. Manag. X 2024, 22, 100563. [Google Scholar] [CrossRef] [Scilit]
- Hand, B.; Kelly, G.; Cashman, A. Aerodynamic design and performance parameters of a lift-type vertical axis wind turbine: A comprehensive review. Renew. Sustain. Energy Rev. 2021, 139, 110699. [Google Scholar] [CrossRef] [Scilit]
- Ahmad, M.; Shahzad, A.; Qadri, M.N.M. An overview of aerodynamic performance analysis of vertical axis wind turbines. Energy Environ. 2023, 34, 2815–2857. [Google Scholar] [CrossRef] [Scilit]
- Lee, K.Y.; Cruden, A.; Ng, J.H.; Wong, K.H. Variable designs of vertical axis wind turbines—A review. Front. Energy Res. 2024, 12, 1437800. [Google Scholar] [CrossRef] [Scilit]
- Didane, D.H.; Behery, M.R.; Al-Ghriybah, M.; Manshoor, B. Recent progress in design and performance analysis of vertical-axis wind turbines—A comprehensive review. Processes 2024, 12, 1094. [Google Scholar] [CrossRef] [Scilit]
- Salvador-Gutierrez, B.; Sanchez-Cortez, L.; Hinojosa-Manrique, M.; Lozada-Pedraza, A.; Ninaquispe-Soto, M.; Montaño-Pisfil, J.; Gutiérrez-Tirado, R.; Chávez-Sánchez, W.; Romero-Goytendia, L.; Díaz-Aliaga, J.; et al. Vertical-Axis Wind Turbines in Emerging Energy Applications (1979–2025): Global Trends and Technological Gaps Revealed by a Bibliometric Analysis and Review. Energies 2025, 18, 3810. [Google Scholar] [CrossRef] [Scilit]
- Moreno, M.; Trejo-Zúñiga, I.; Terrazas, J.; Díaz-Ponce, A.; Pérez-Terrazo, A. Hybridization of a Micro-Scale Savonius Rotor Using a Helical Darrieus Rotor. Fluids 2025, 10, 63. [Google Scholar] [CrossRef] [Scilit]
- Abhinaya, V.; Kumar, G.G. A comprehensive review on H-type Darrieus wind turbine: Aerodynamics, blade profile, CFD simulations. J. Eng. Appl. Sci. 2026, 73, 106. [Google Scholar] [CrossRef] [Scilit]
- Gallegos-Molina, J.S.; Chavero-Navarrete, E. A Systematic Review of Technological Strategies to Improve Self-Starting in Darrieus-Type Vertical-Axis Wind Turbines. Sustainability 2025, 17, 7878. [Google Scholar] [CrossRef] [Scilit]
- Celik, Y.; Ma, L.; Ingham, D.; Pourkashanian, M. Aerodynamic investigation of the start-up process of H-type vertical axis wind turbines using CFD. J. Wind. Eng. Ind. Aerodyn. 2020, 204, 104252. [Google Scholar] [CrossRef] [Scilit]
- Khalid, M.S.U.; Wood, D.; Hemmati, A. Self-Starting Characteristics and Flow-Induced Rotation of Single- and Dual-Stage Vertical-Axis Wind Turbines. Energies 2022, 15, 9365. [Google Scholar] [CrossRef] [Scilit]
- Xu, Z.; Dong, X.; Li, K.; Zhou, Q.; Zhao, Y. Study of the Self-starting Performance of a Vertical-axis Wind Turbine. J. Appl. Fluid Mech. 2024, 17, 1261–1276. [Google Scholar] [CrossRef] [Scilit]
- Abul-Ela, M.S.; ElRefaie, M.E.; Sayed, A.I. Enhancing vertical-axis wind turbine self-starting with distinctive blade airfoil designs. J. Eng. Appl. Sci. 2025, 72, 95. [Google Scholar] [CrossRef] [Scilit]
- Eltayeb, W.; Somlal, J.; SirElkhatim, M.; Yedukondalu, G.; Srinath, A. Enhancing start-up and torque in Darrieus VAWTs through a novel plain gurney flap design. Sci. Rep. 2026, 16, 7136. [Google Scholar] [CrossRef] [Scilit] [PubMed]
- Li, Y.; Zhao, S.; Qu, C.; Tong, G.; Feng, F.; Zhao, B.; Tagawa, K. Aerodynamic characteristics of straight-bladed vertical axis wind turbine with a curved-outline wind gathering device. Energy Convers. Manag. 2020, 203, 112249. [Google Scholar] [CrossRef] [Scilit]
- Chen, W.H.; Lam, T.T.; Chang, M.H.; Jin, L.; Chueh, C.C.; Augusto, G.L. Optimizing H-Darrieus Wind Turbine Performance with Double-Deflector Design. Energies 2024, 17, 503. [Google Scholar] [CrossRef] [Scilit]
- Ghafoorian, F.; Enayati, E.; Mirmotahari, S.R.; Wan, H. Self-Starting Improvement and Performance Enhancement in Darrieus VAWTs Using Auxiliary Blades and Deflectors. Machines 2024, 12, 806. [Google Scholar] [CrossRef] [Scilit]
- Ghafoorian, F.; Hosseini Rad, S.; Moghimi, M. Enhancing Self-Starting Capability and Efficiency of Hybrid Darrieus–Savonius Vertical-Axis Wind Turbines by Installing a Curtain. Machines 2025, 13, 87. [Google Scholar] [CrossRef] [Scilit]
- Inácio, R.G.d.S.; da Rosa, I.A.; Avila, V.H.; Rocha, L.A.O.; Isoldi, L.A.; Dias, G.d.C.; Gonçalves, R.A.A.C.; dos Santos, E.D. Numerical Investigation of Hybrid Darrieus/Savonius Vertical Axis Wind Turbine Subjected to Turbulent Airflows. J. Mar. Sci. Eng. 2025, 13, 1979. [Google Scholar] [CrossRef] [Scilit]
- Sengupta, A.R.; Rakshit, S.; Majumder, H. A comprehensive review on various approaches for performance improvement of Savonius wind turbines. Discov. Appl. Sci. 2026, 8, 79. [Google Scholar] [CrossRef] [Scilit]
- Baghdadi, M.; Elkoush, S.; Akle, B.; Elkhoury, M. Dynamic shape optimization of a vertical axis wind turbine via blade morphing technique. Renew. Energy 2020, 154, 239–251. [Google Scholar] [CrossRef] [Scilit]
- Hao, W.; Li, C. Performance improvement of adaptive flap on flow separation control and its effect on VAWT. Energy 2020, 213, 118809. [Google Scholar] [CrossRef] [Scilit]
- Minetto, R.A.L.; Paraschivoiu, M. Simulation based analysis of morphing blades applied to a vertical axis wind turbine. Energy 2020, 202, 117705. [Google Scholar] [CrossRef] [Scilit]
- Su, J.; Li, Y.; Chen, Y.; Han, Z.; Zhou, D.; Zhao, Y.; Bao, Y. Aerodynamic performance assessment of ϕ-type vertical axis wind turbine under pitch motion. Energy 2021, 225, 120202. [Google Scholar] [CrossRef] [Scilit]
- Tong, H.; Wang, Y. Experimental study on unsteady aerodynamic characteristics of deformed blades for vertical axis wind turbine. Renew. Energy 2021, 173, 808–826. [Google Scholar] [CrossRef] [Scilit]
- Somoano, M.; Huera-Huarte, F.J. Bio-inspired blades with local trailing edge flexibility increase the efficiency of vertical axis wind turbines. Energy Rep. 2022, 8, 3244–3250. [Google Scholar] [CrossRef] [Scilit]
- Belabes, B.; Paraschivoiu, M. Numerical study of the effect of turbulence intensity on VAWT performance. Energy 2021, 233, 121139. [Google Scholar] [CrossRef] [Scilit]
- Maalouly, M.; Souaiby, M.; ElCheikh, A.; Issa, J.S.; Elkhoury, M. Transient analysis of H-type vertical axis wind turbines using CFD. Energy Rep. 2022, 8, 4570–4588. [Google Scholar] [CrossRef] [Scilit]
- Barnes, A.; Marshall-Cross, D.; Hughes, B.R. Validation and comparison of turbulence models for predicting wakes of vertical axis wind turbines. J. Ocean. Eng. Mar. Energy 2021, 7, 339–362. [Google Scholar] [CrossRef] [Scilit]
- Mirmotahari, S.R.; Ghafoorian, F.; Mehrpooya, M.; Hosseini Rad, S.; Taraghi, M.; Moghimi, M. A comprehensive investigation on Darrieus vertical axis wind turbine performance and self-starting capability improvement by implementing a novel semi-directional airfoil guide vane and rotor solidity. Phys. Fluids 2024, 36, 065151. [Google Scholar] [CrossRef] [Scilit]
- Carlos Alberto, M.A.; Victor, L.G.; Christian, C.F.; Isaac, H.A.; Miriam, V.P.; Marco Antonio, E.M. Analysis of a New Blade Design for a Vertical Axis Wind Turbine Called Flow Concentrator. J. Appl. Fluid Mech. 2025, 18, 2488–2503. [Google Scholar] [CrossRef] [Scilit]
- Menter, F.R. Two-Equation Eddy-Viscosity Turbulence Models for Engineering Applications. AIAA J. 1994, 32, 1598–1605. [Google Scholar] [CrossRef] [Scilit] [PubMed]
- ANSYS, Inc. ANSYS Fluent Theory Guide; ANSYS, Inc.: Canonsburg, PA, USA, 2024. [Google Scholar]
- Costa Rocha, P.A.; Barbosa Rocha, H.H.; Moura Carneiro, F.O.; Vieira da Silva, M.E.; Freitas de Andrade, C. A Case Study on the Calibration of the k–ω SST (Shear Stress Transport) Turbulence Model for Small Scale Wind Turbines Designed with Cambered and Symmetrical Airfoils. Energy 2016, 97, 144–150. [Google Scholar] [CrossRef] [Scilit]
- Al-Ttowi, A.; Mohammed, A.N.; Al-Alimi, S.; Zhou, W.; Saif, Y.; Ismail, I.F. Computational Fluid Dynamics (CFD) Investigation of NREL Phase VI Wind Turbine Performance Using Various Turbulence Models. Processes 2024, 12, 1994. [Google Scholar] [CrossRef] [Scilit]
- Casillas Farfán, C.; Solorio Díaz, G.; López Garza, V.; Galván González, S.; Figueroa, K. Novel Induction Blade Design for Horizontal Axis Wind Turbines to Improve Starting Phase: CFD and Testing Analysis. J. Appl. Fluid Mech. 2022, 15, 1635–1648. [Google Scholar] [CrossRef] [Scilit]
- Elsakka, M.M.; Ingham, D.B.; Ma, L.; Pourkashanian, M. CFD Analysis of the Angle of Attack for a Vertical Axis Wind Turbine Blade. Energy Convers. Manag. 2019, 182, 154–165. [Google Scholar] [CrossRef] [Scilit]
- Alqurashi, F.; Mohamed, M.H. Aerodynamic Forces Affecting the H-Rotor Darrieus Wind Turbine. Model. Simul. Eng. 2020, 2020, 1368369. [Google Scholar] [CrossRef] [Scilit]
- Elsakka, M.M.; Ingham, D.B.; Ma, L.; Pourkashanian, M.; Moustafa, G.H.; Elhenawy, Y. Response surface optimisation of vertical axis wind turbine at low wind speeds. Energy Rep. 2022, 8, 10868–10880. [Google Scholar] [CrossRef] [Scilit]
- Lee, S.L.; Shin, S. Wind Turbine Blade Optimal Design Considering Multi-Parameters and Response Surface Method. Energies 2020, 13, 1639. [Google Scholar] [CrossRef] [Scilit]
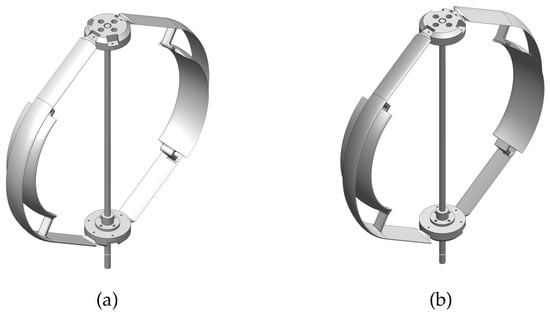
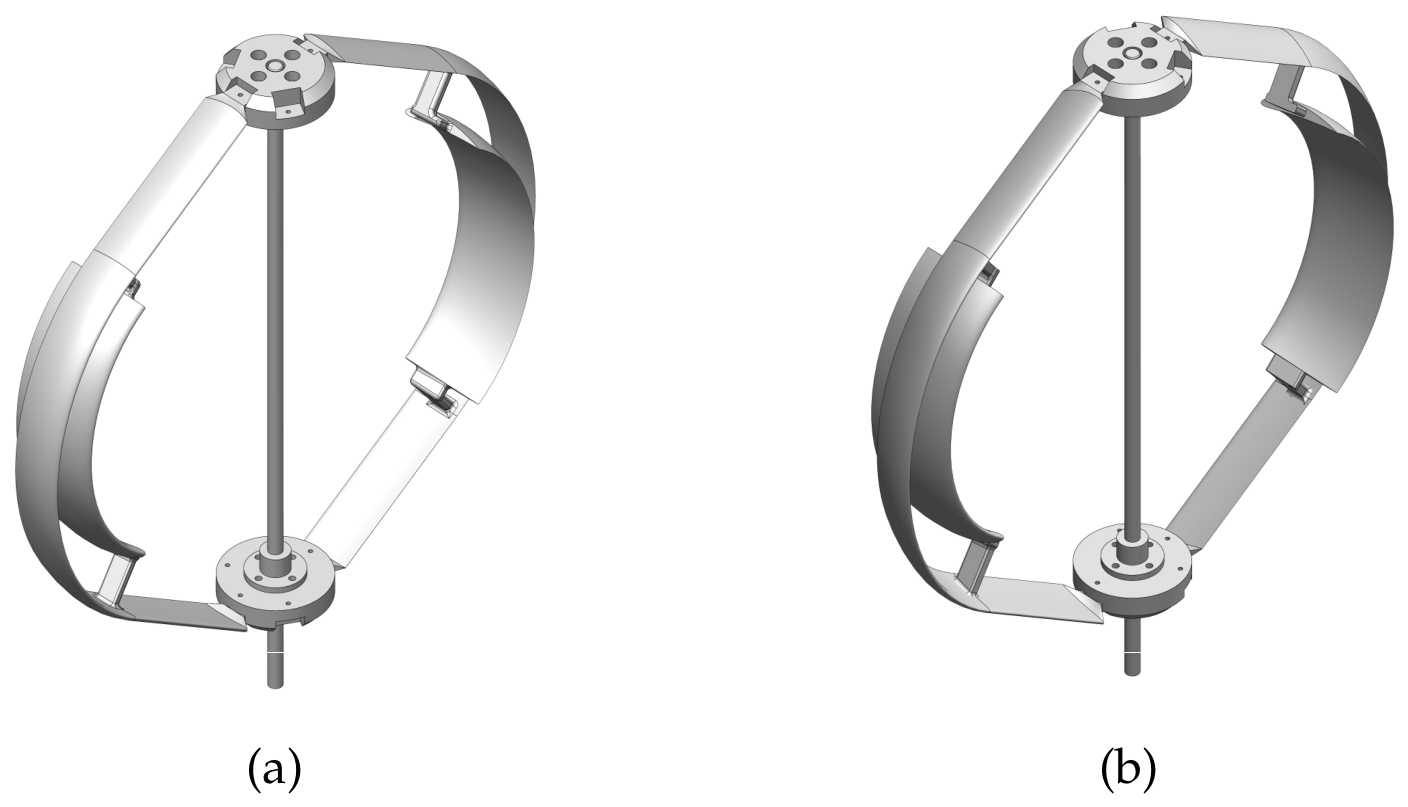
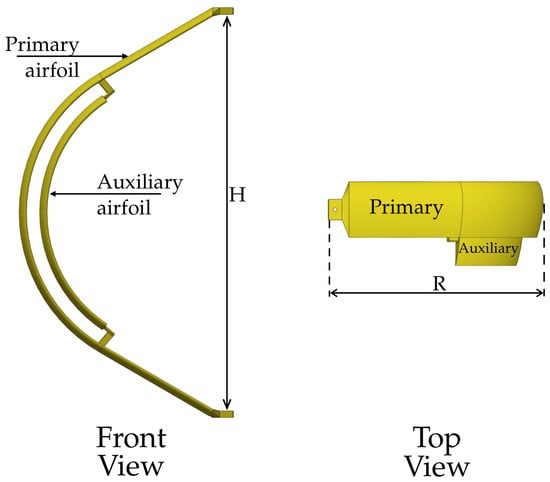
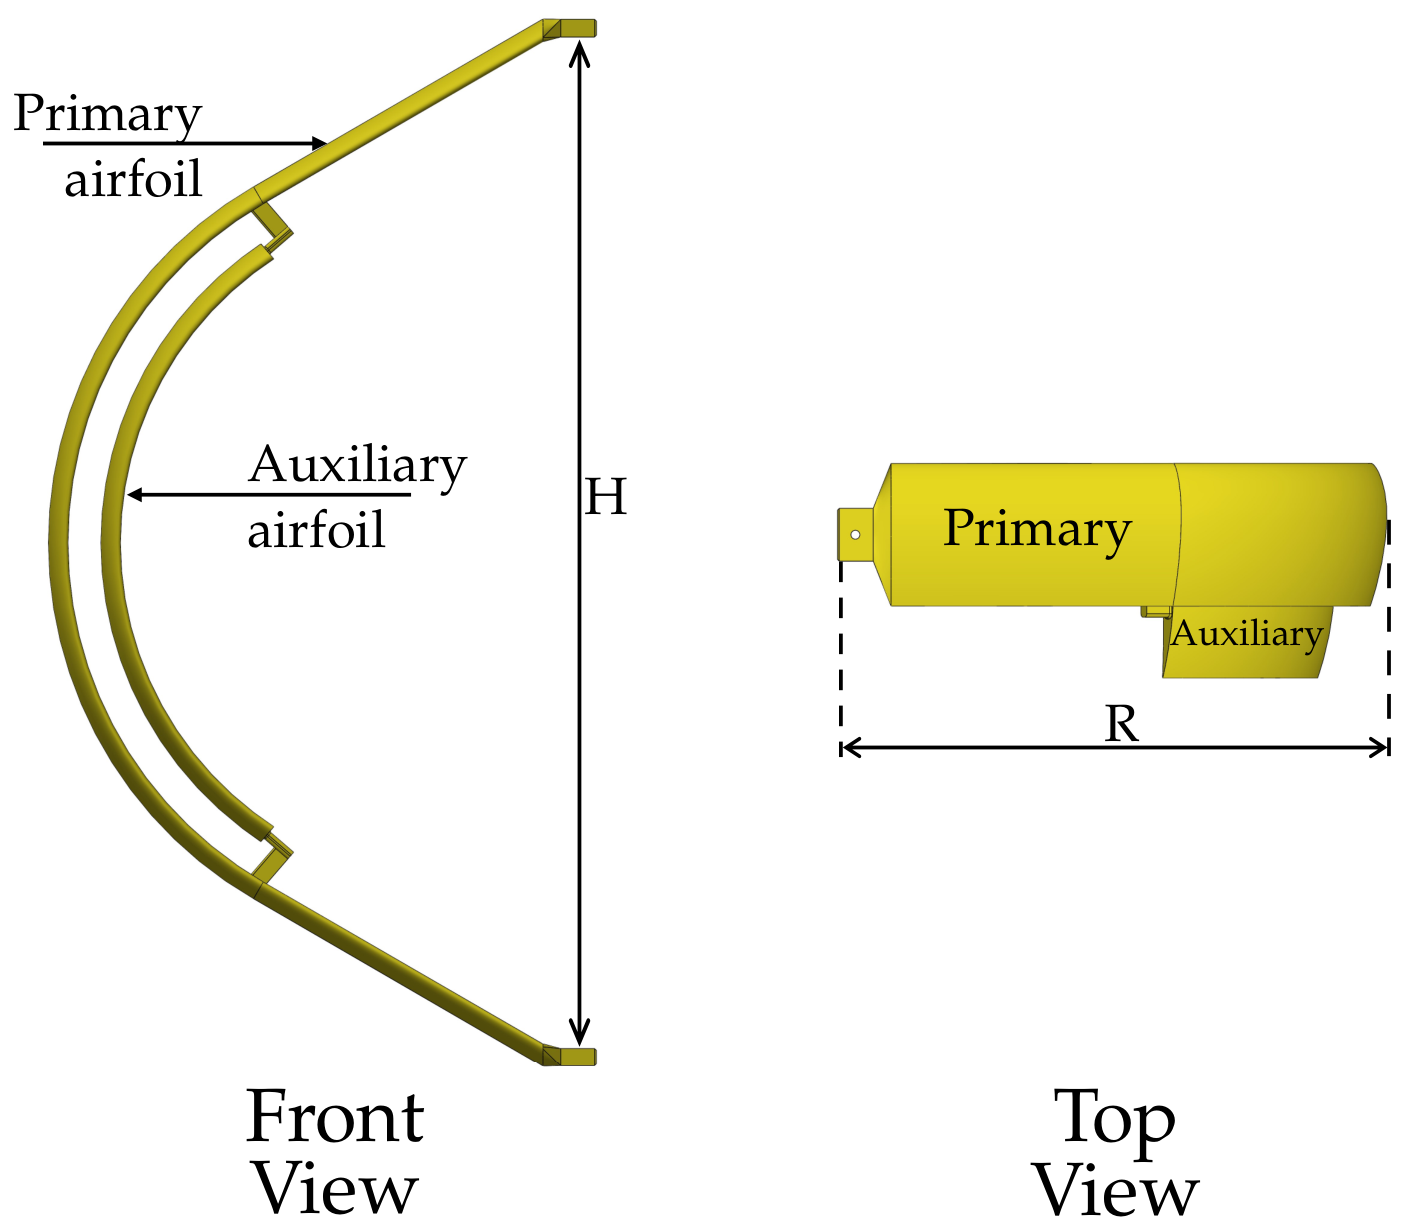
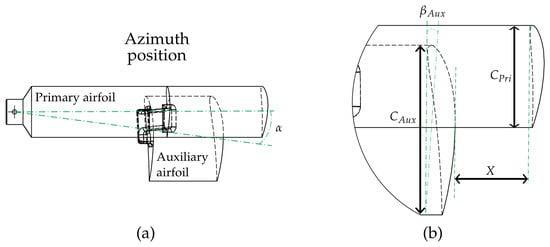
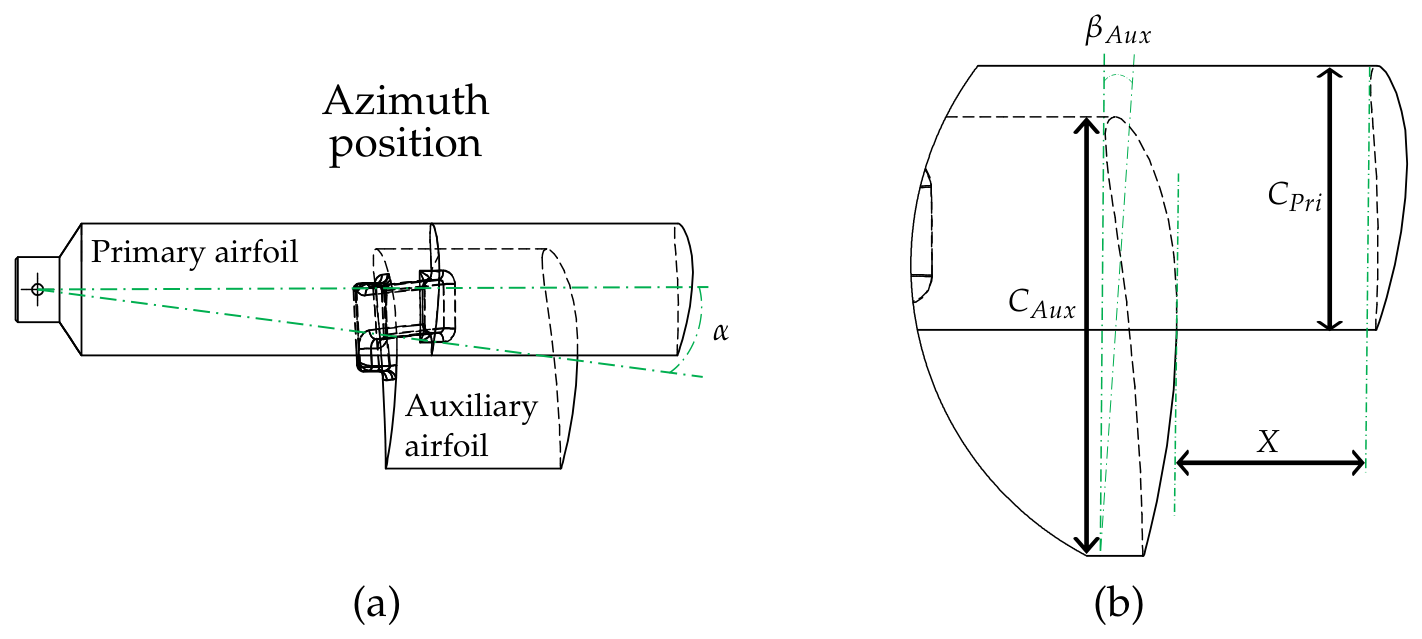
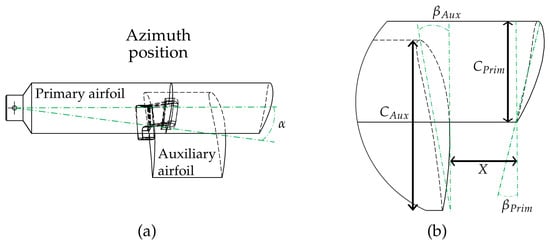
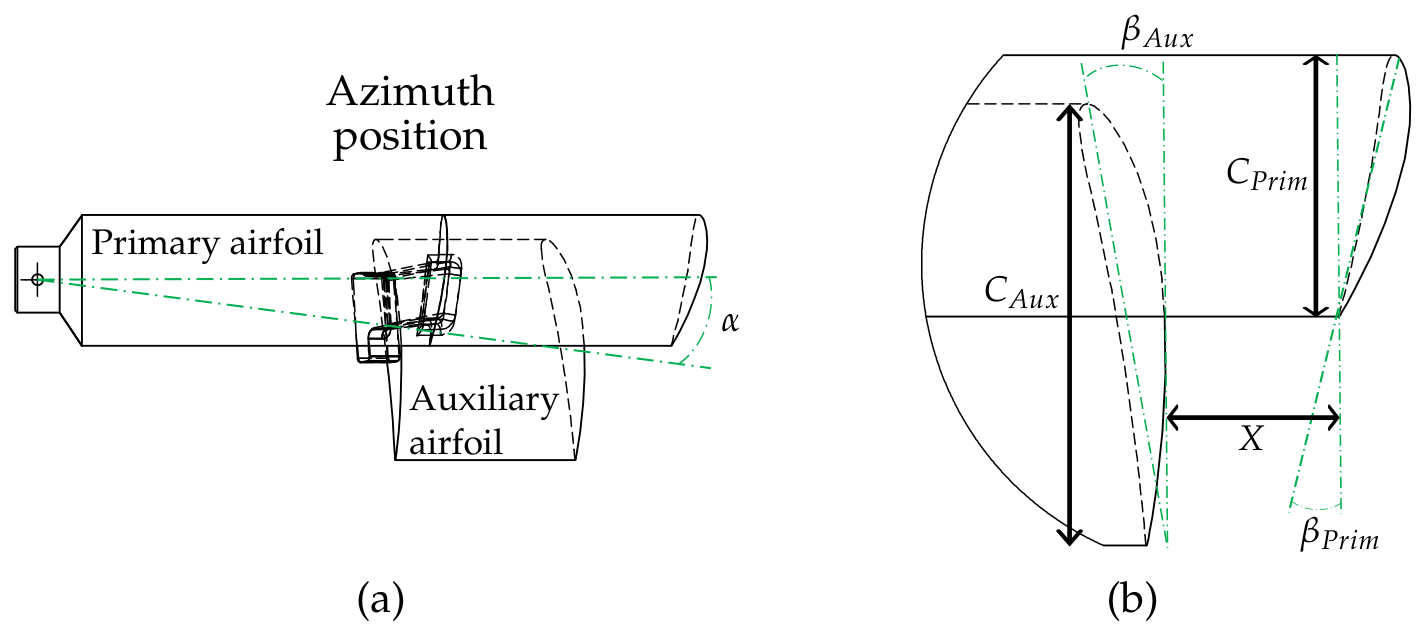
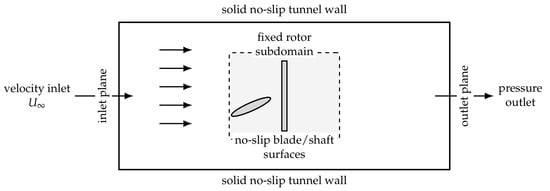
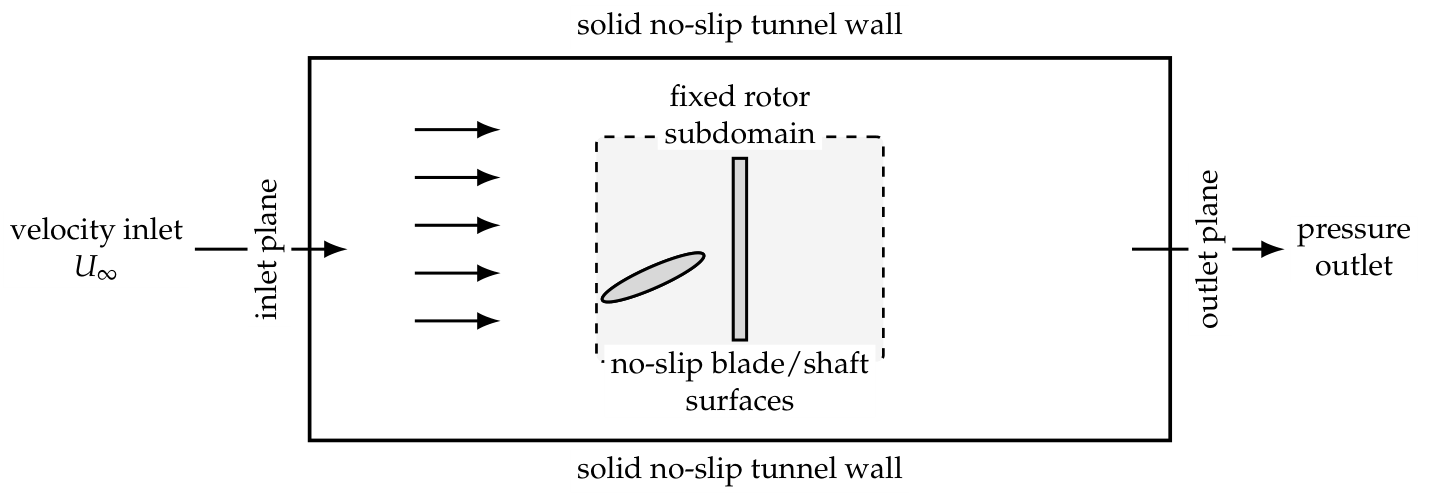
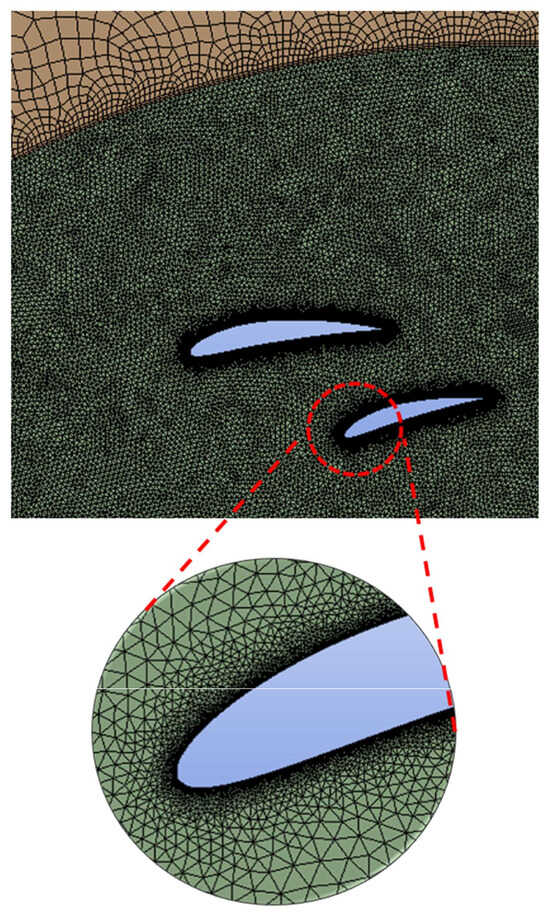
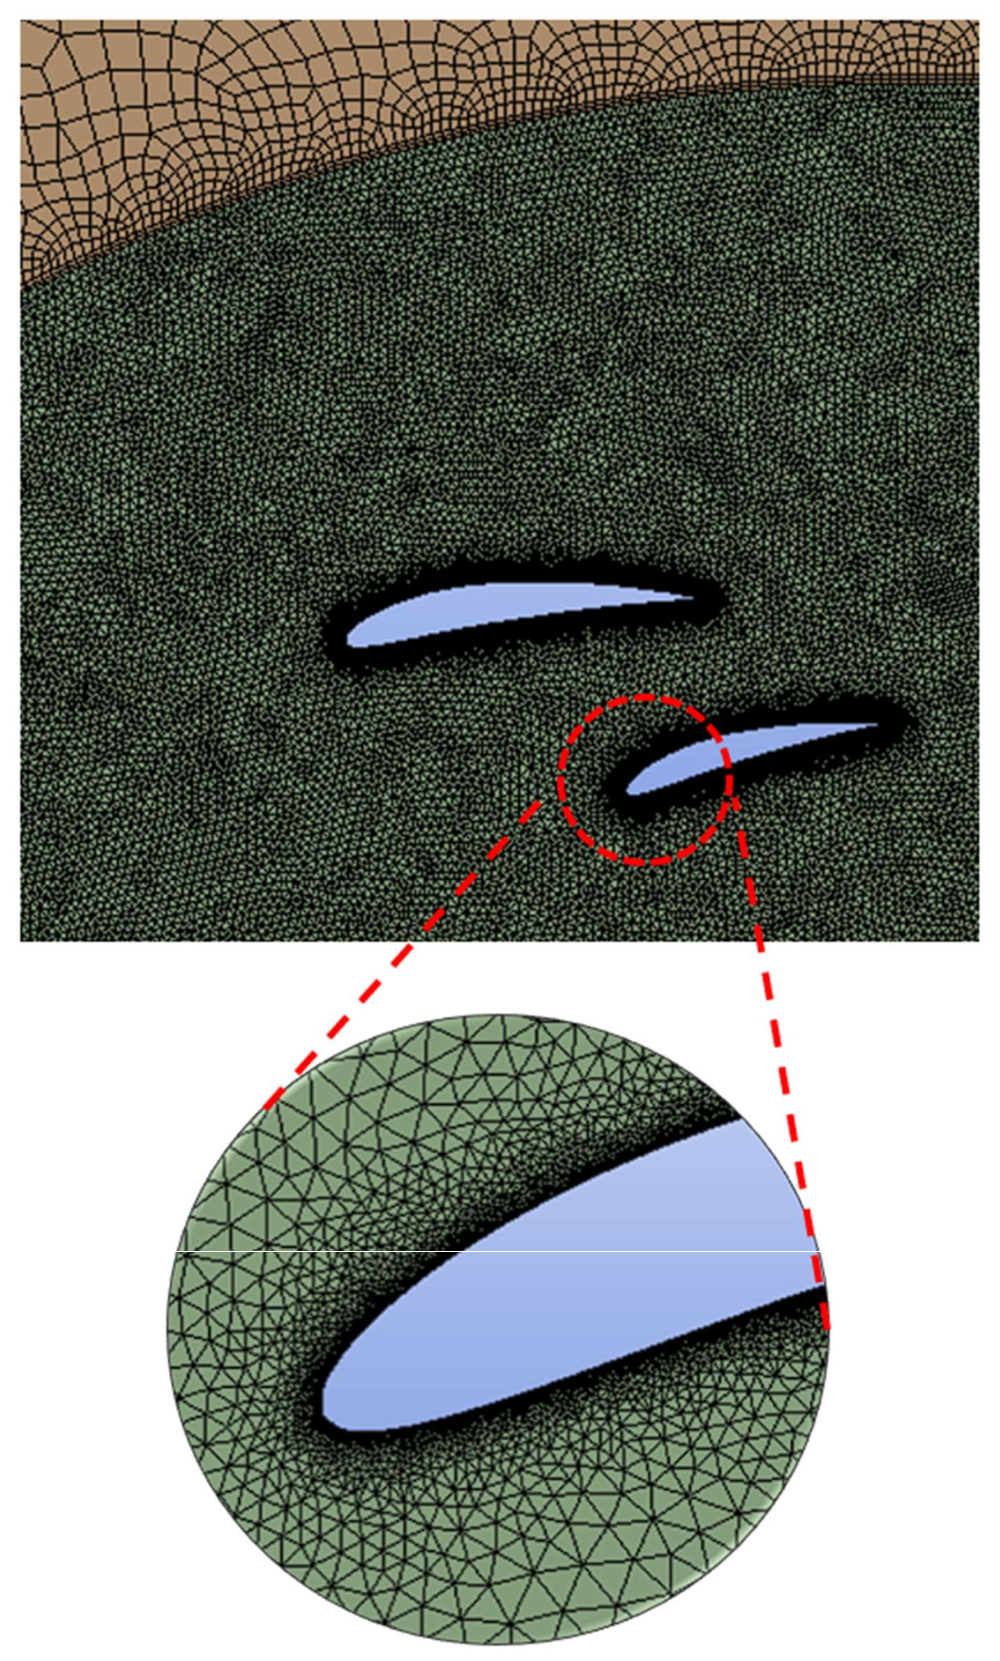
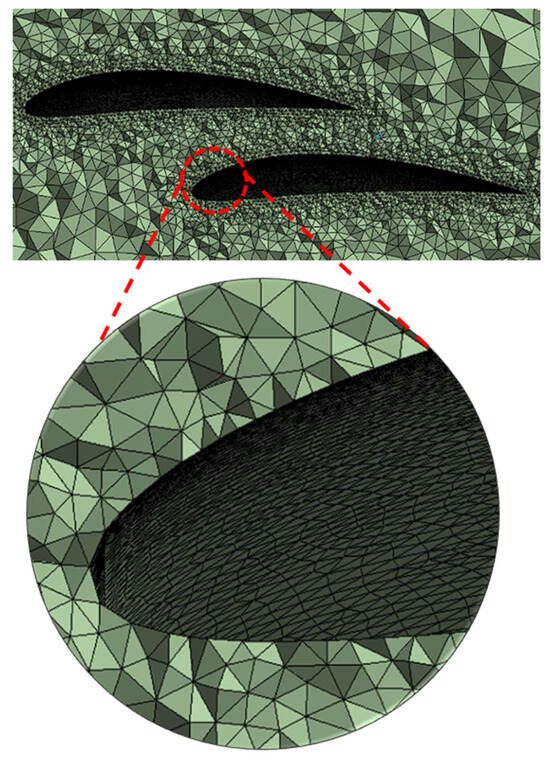
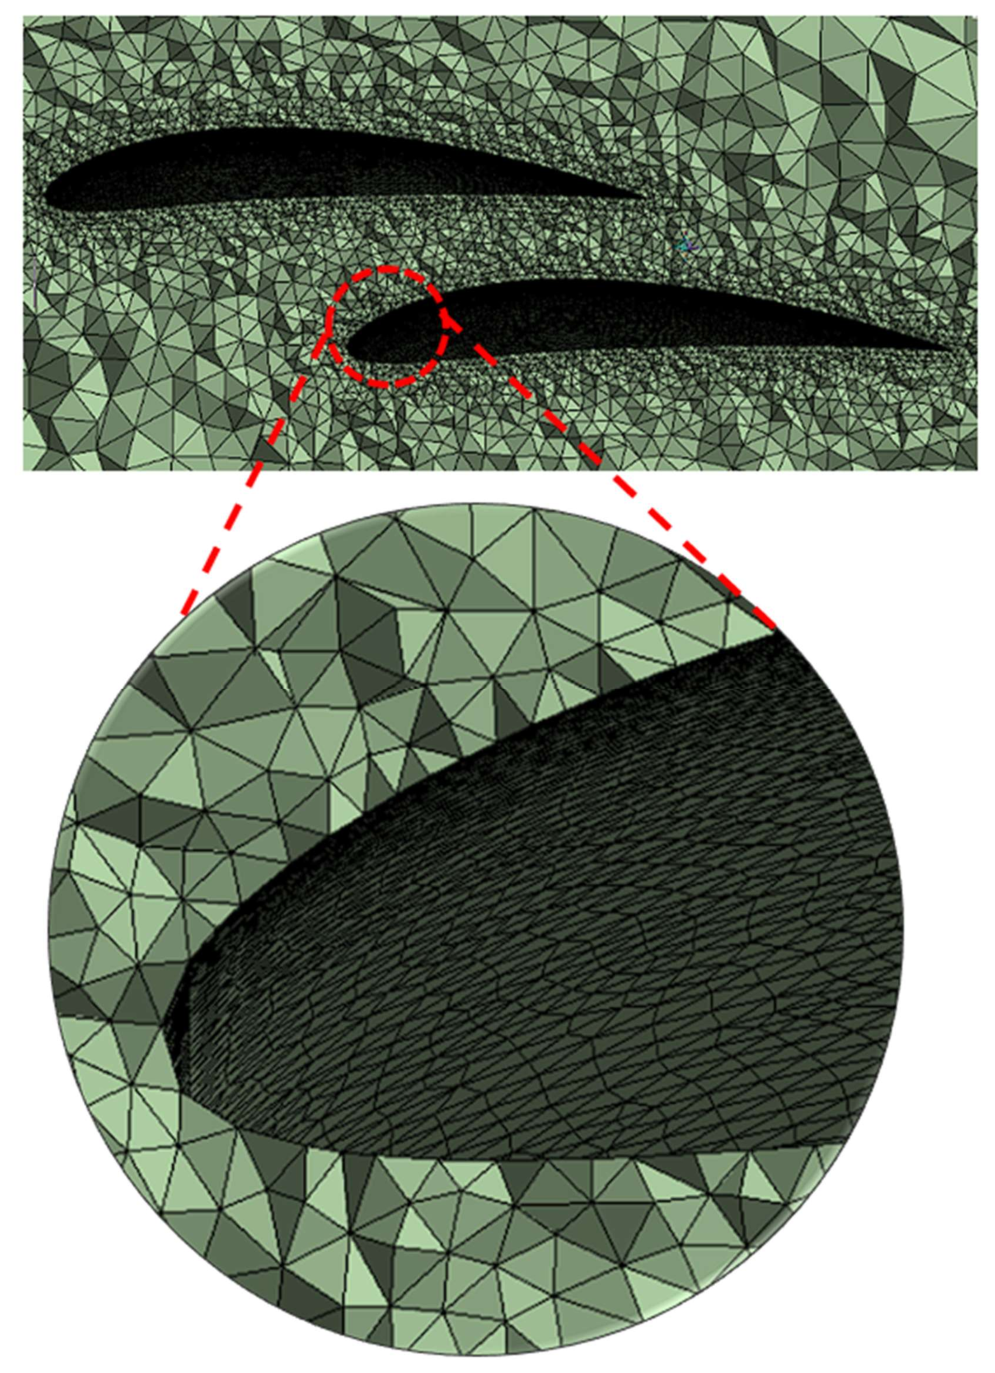
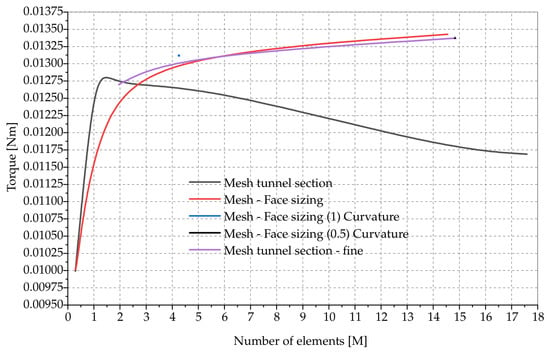
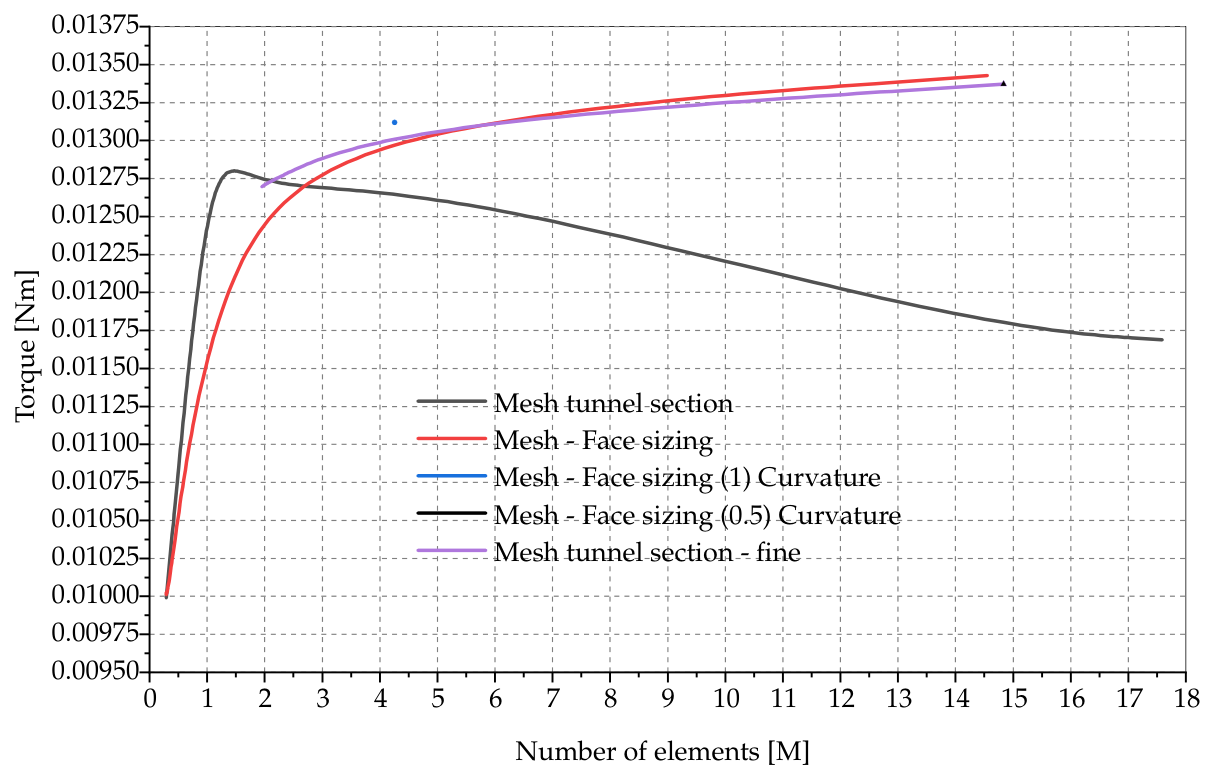
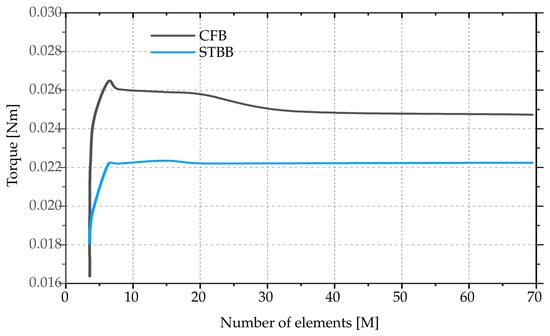
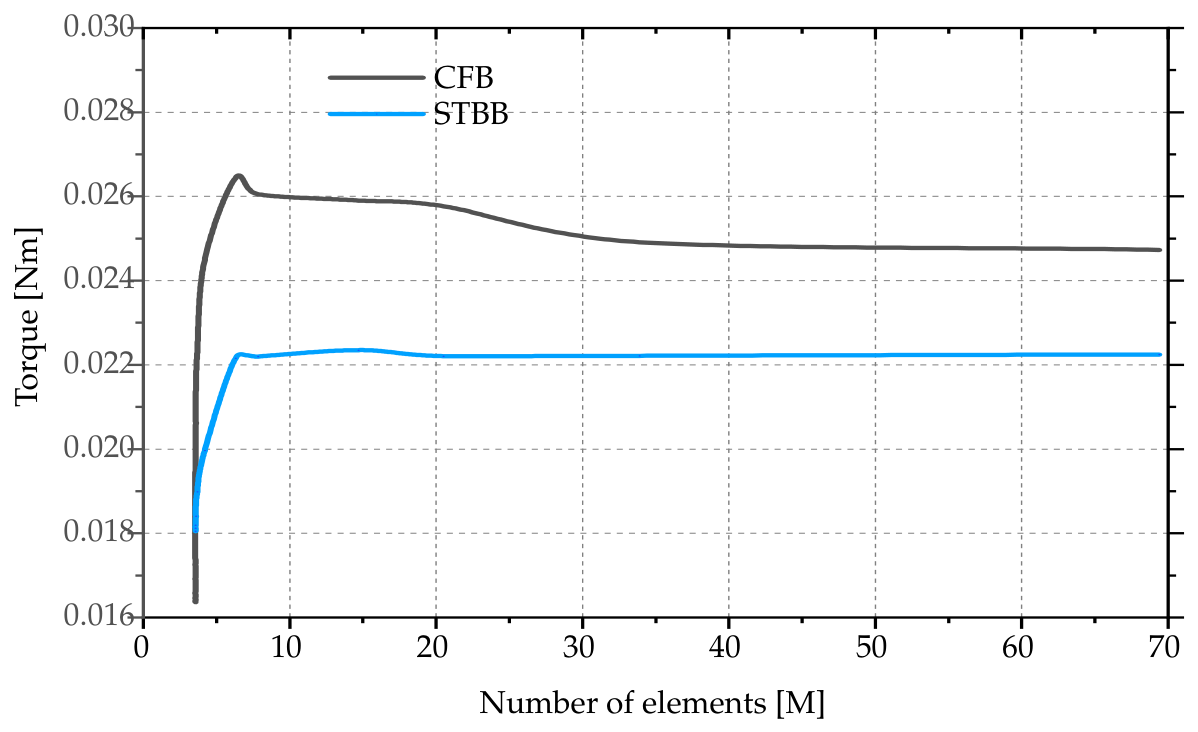
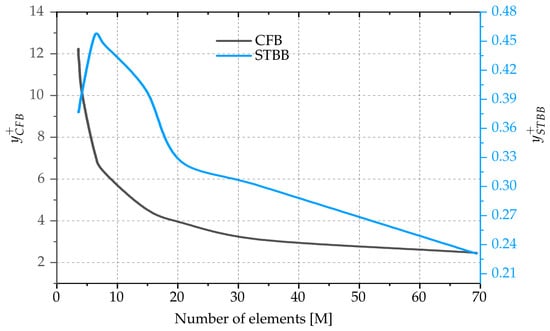
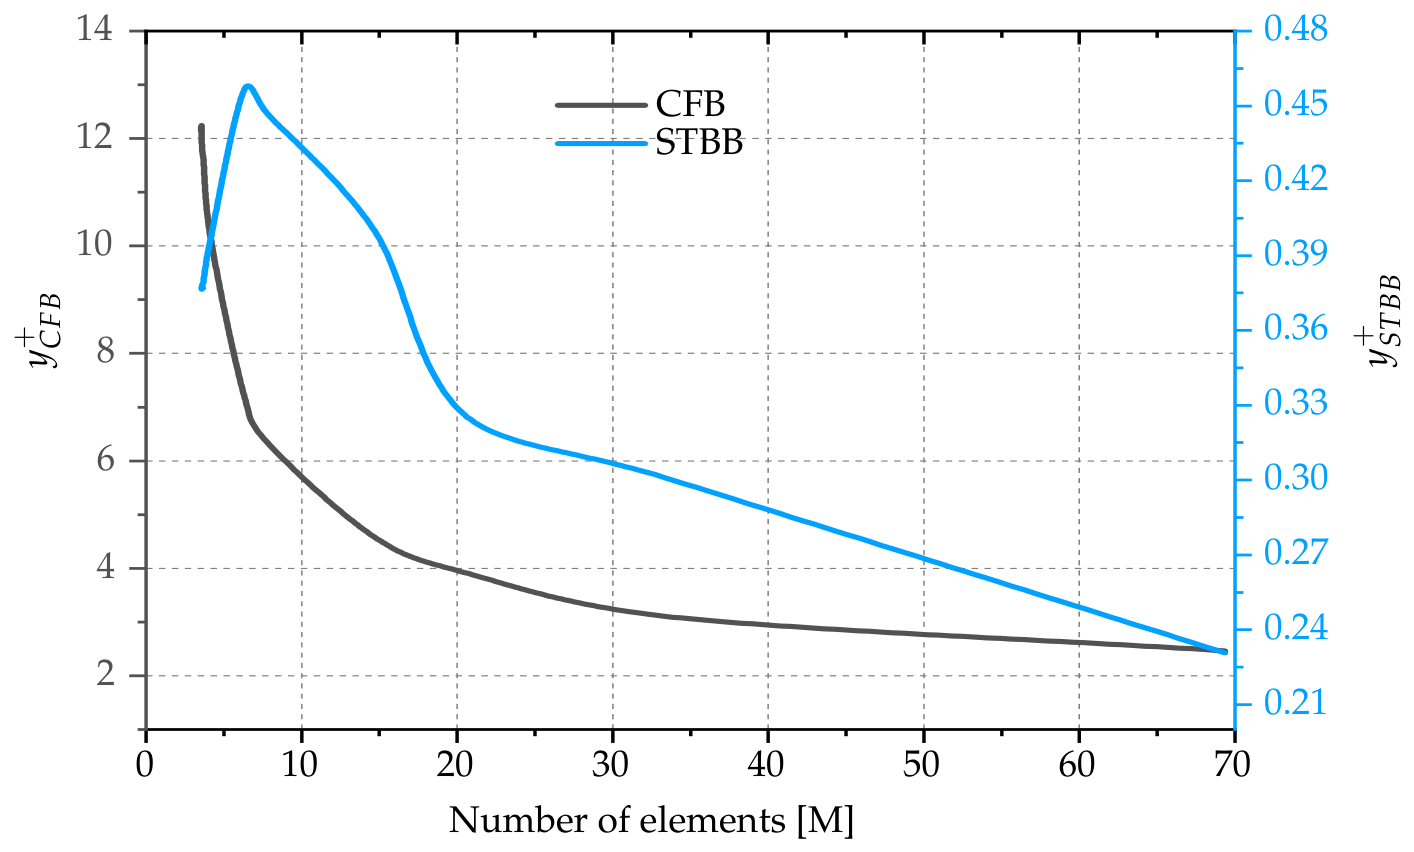
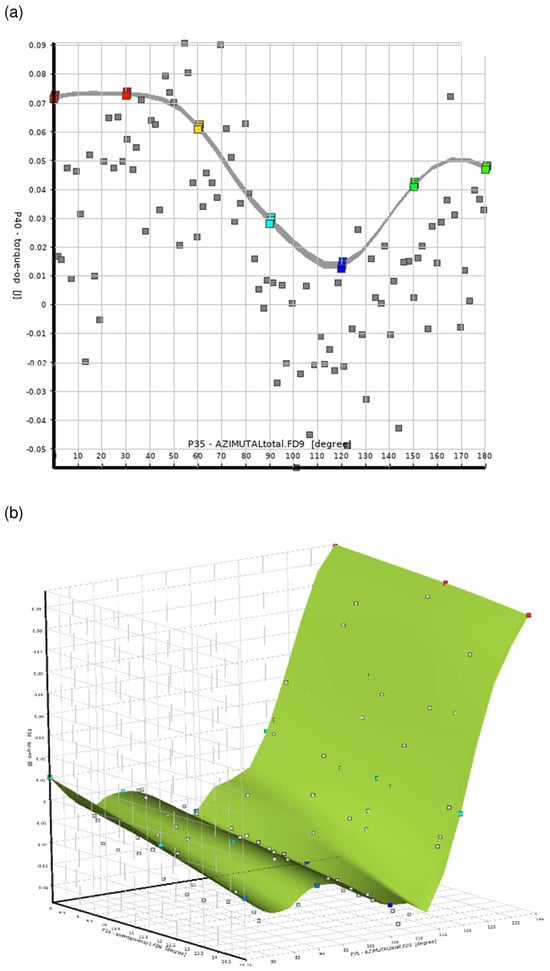
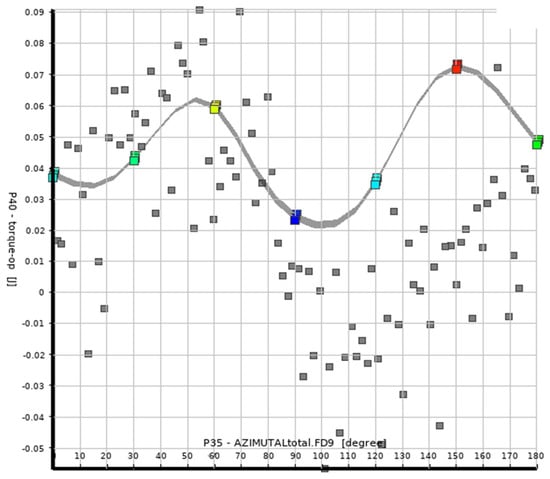
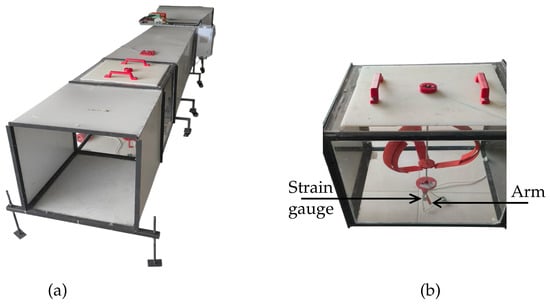
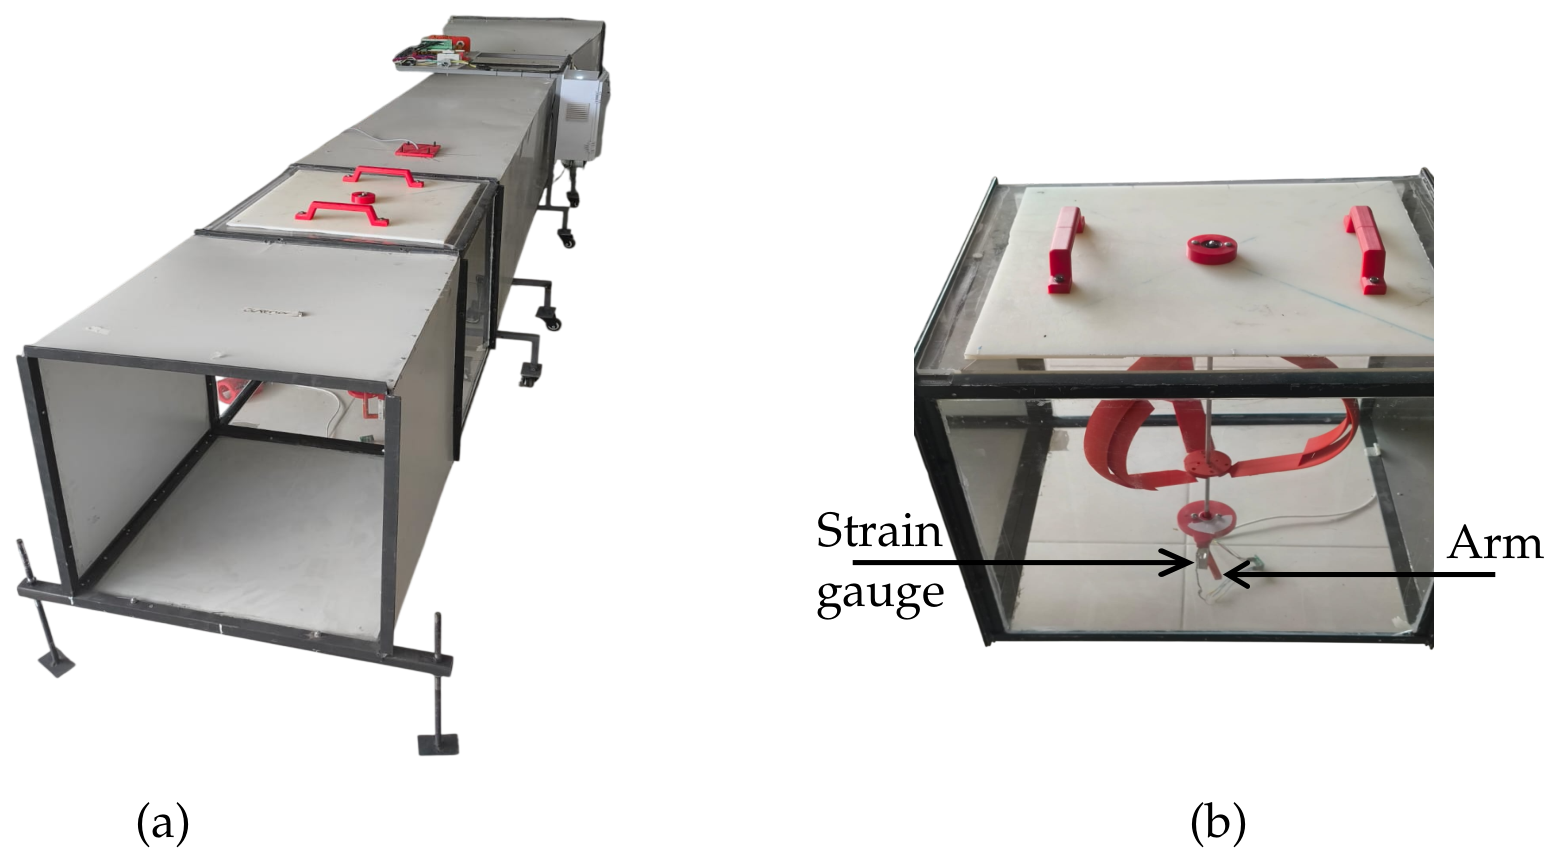
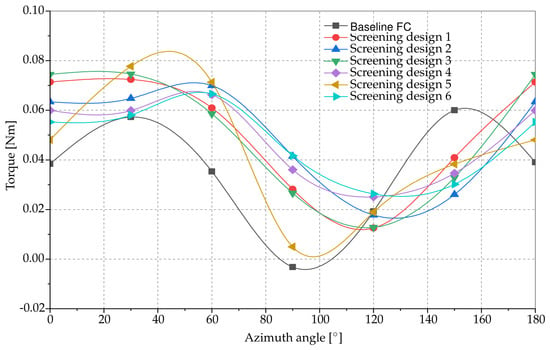
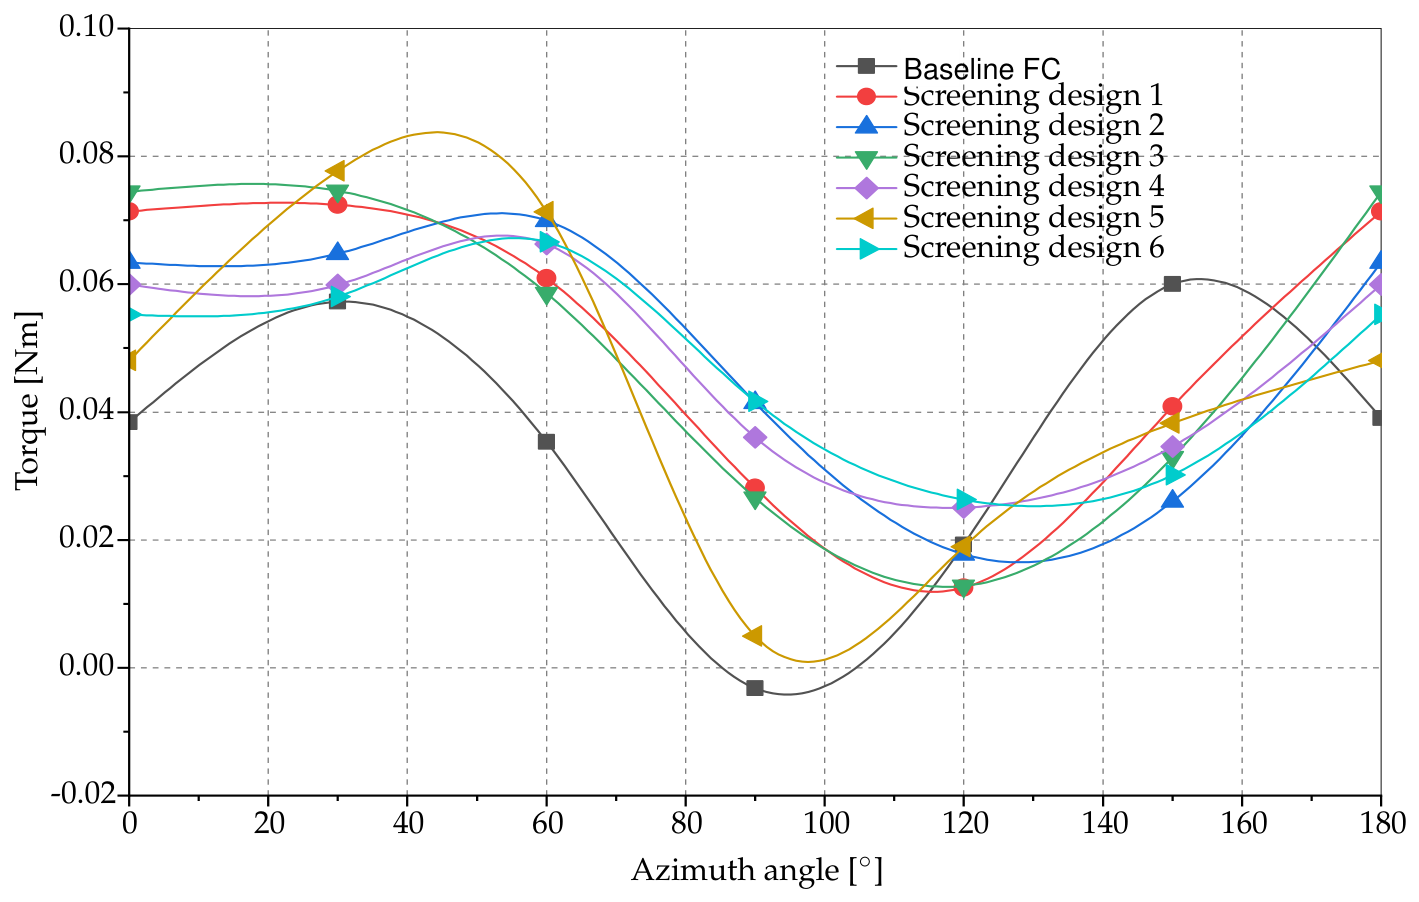
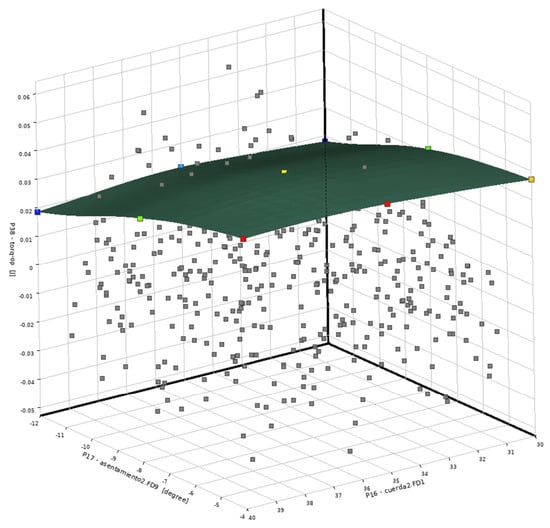
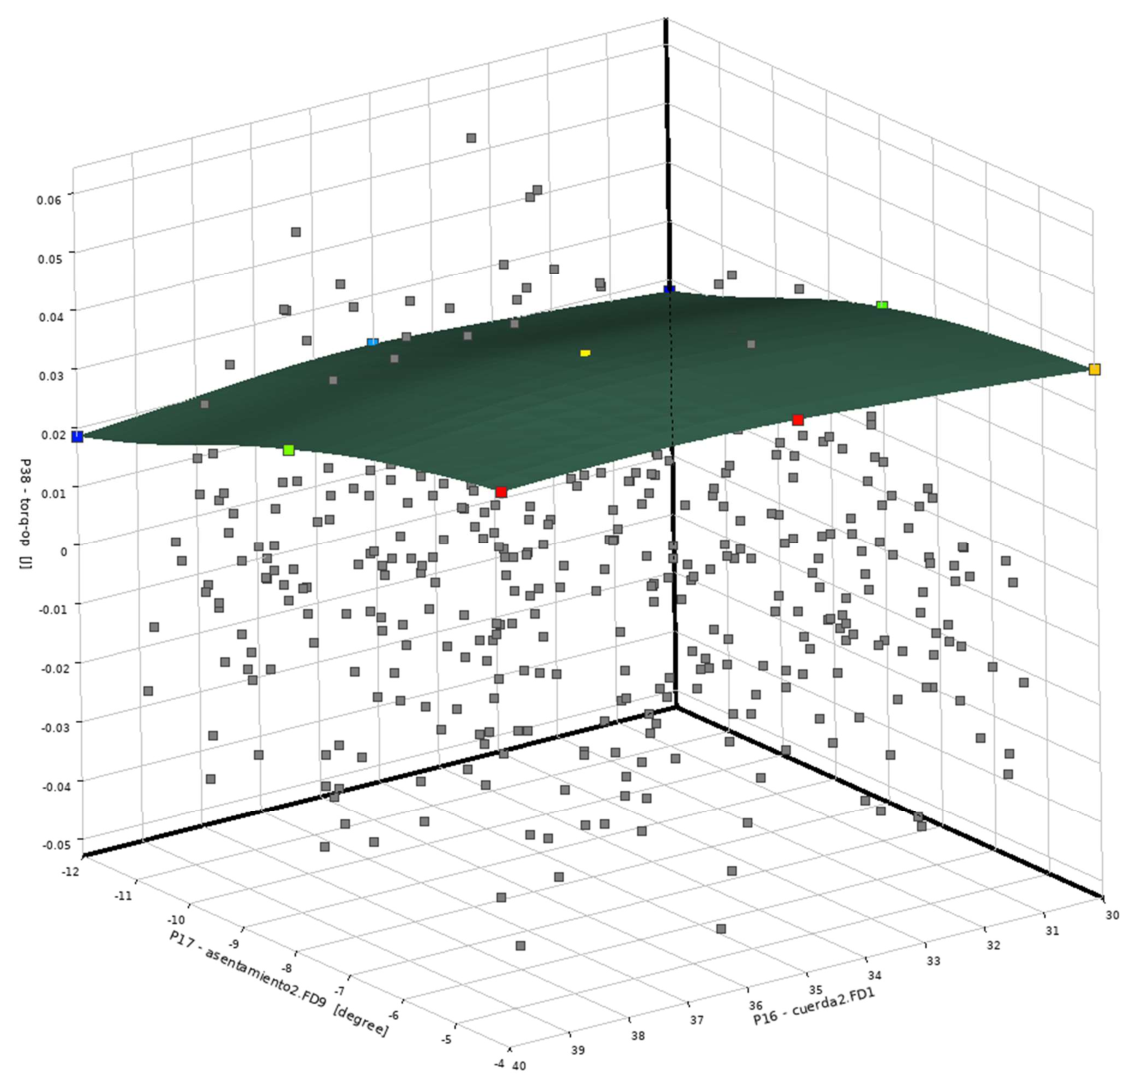
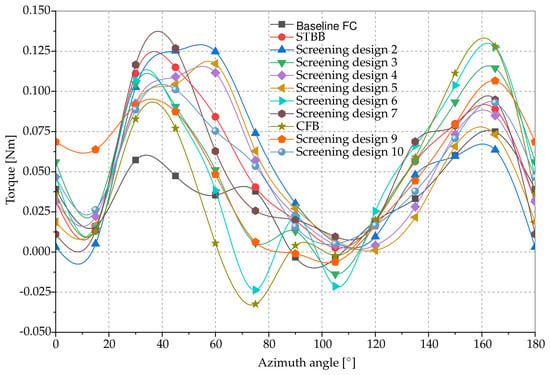
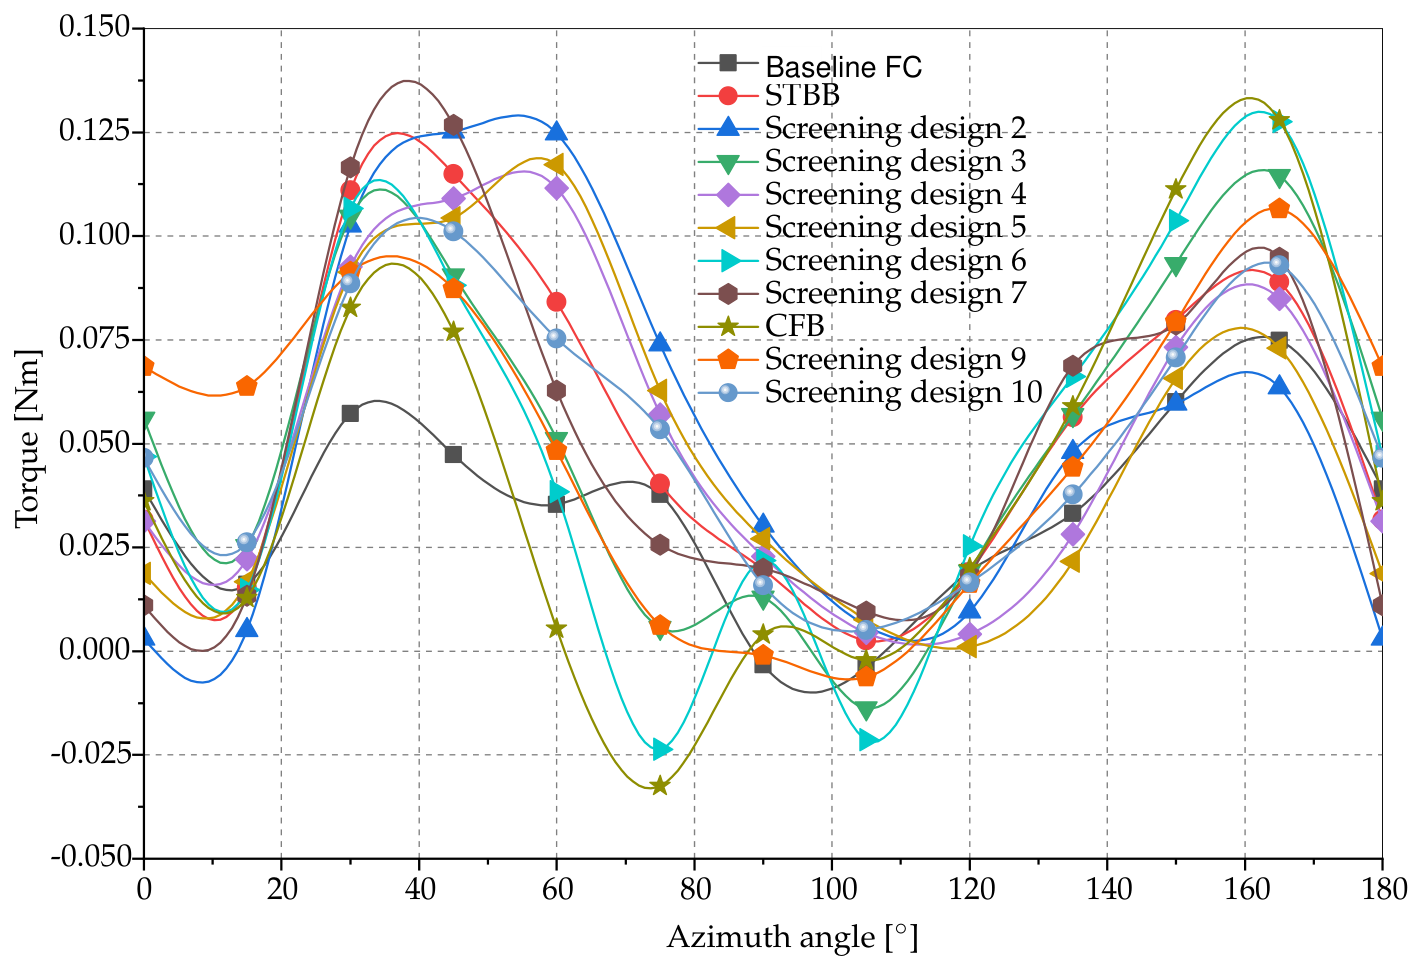
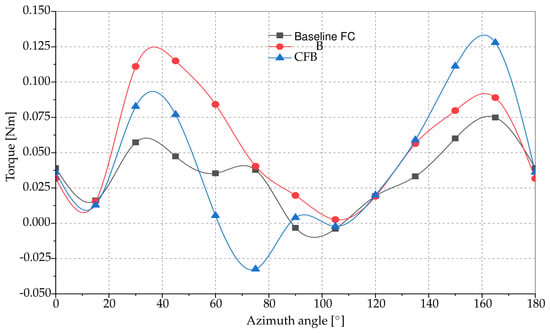
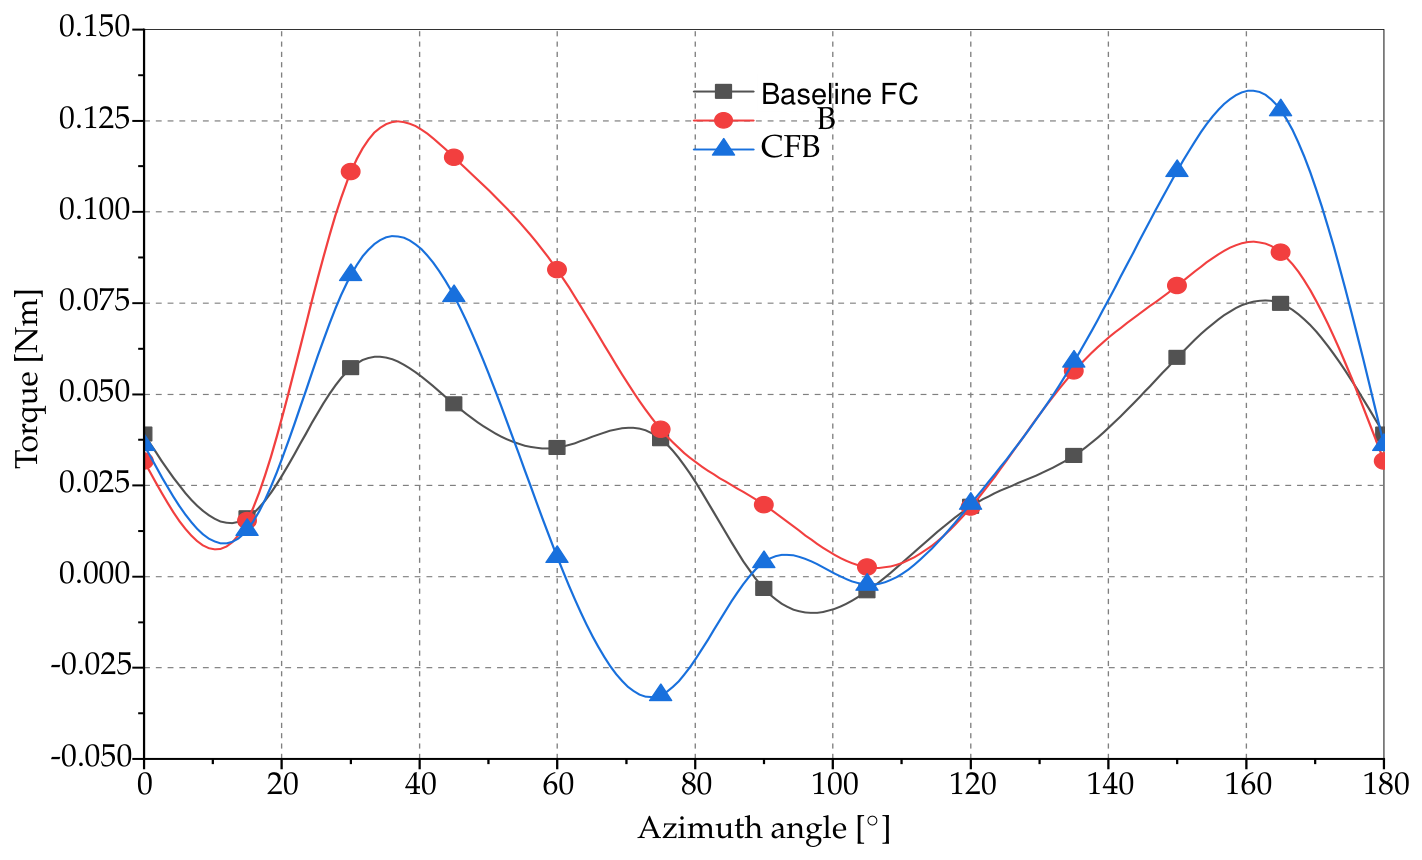
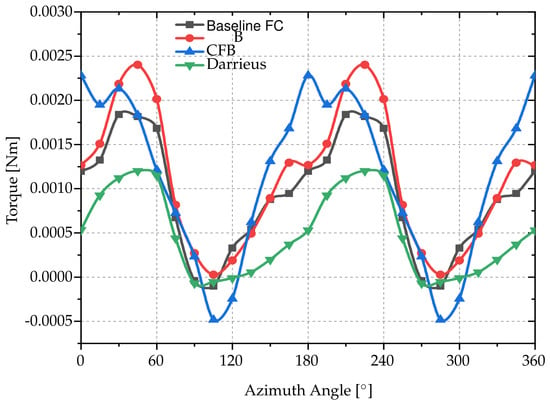
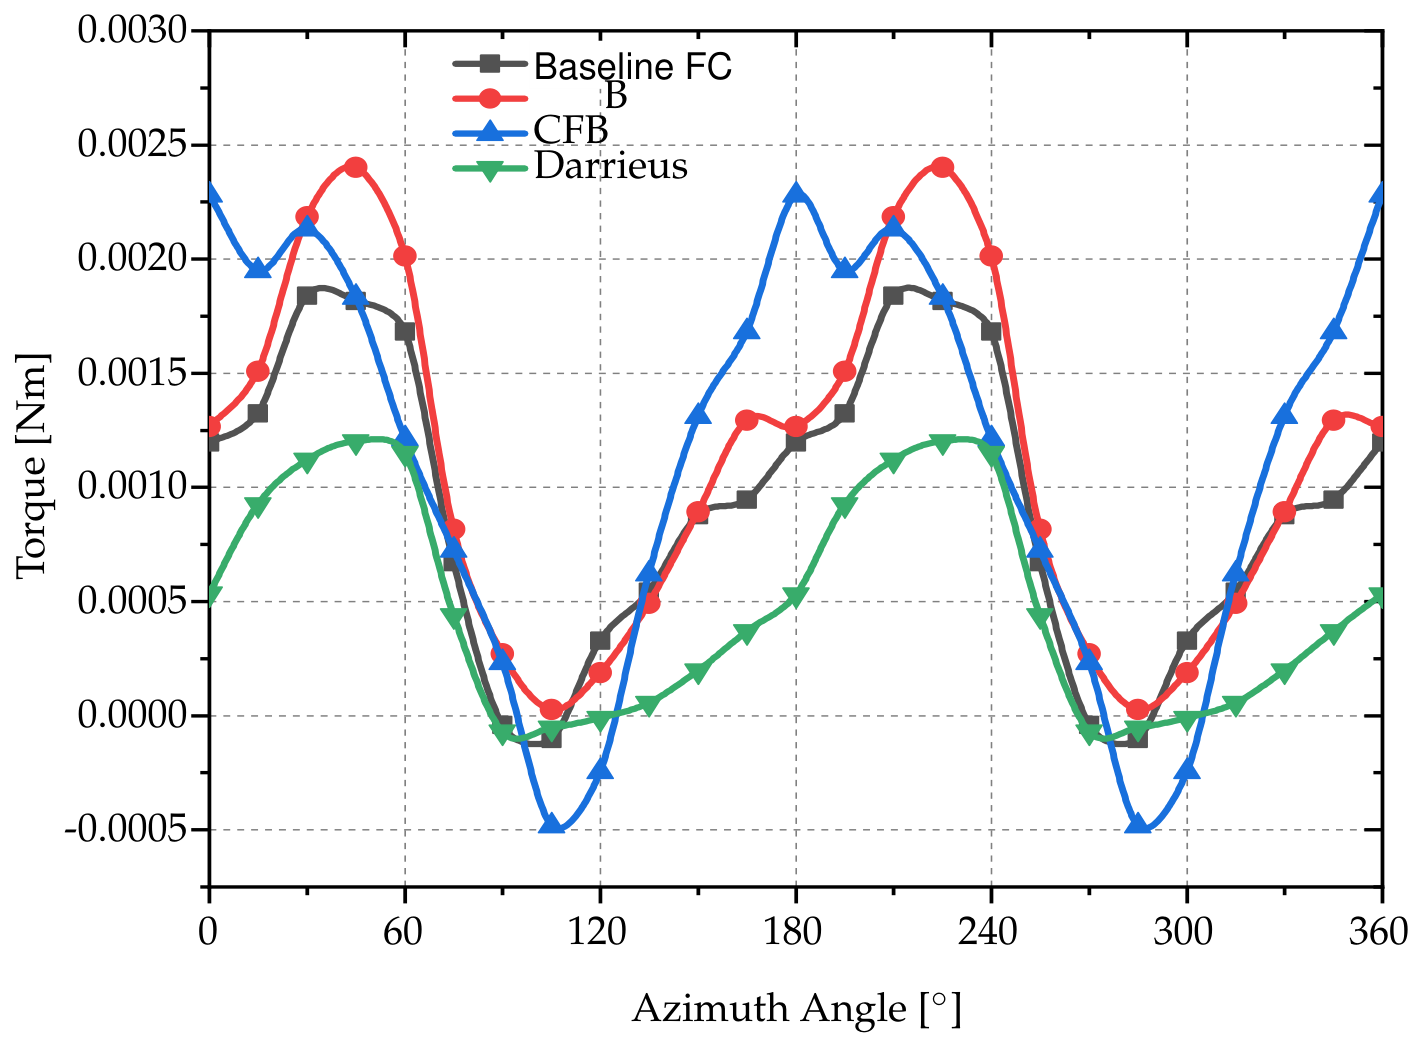
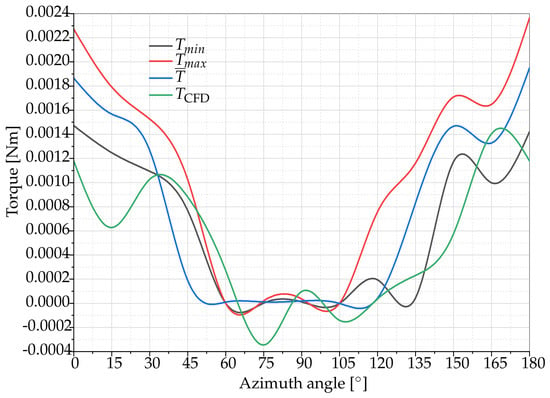
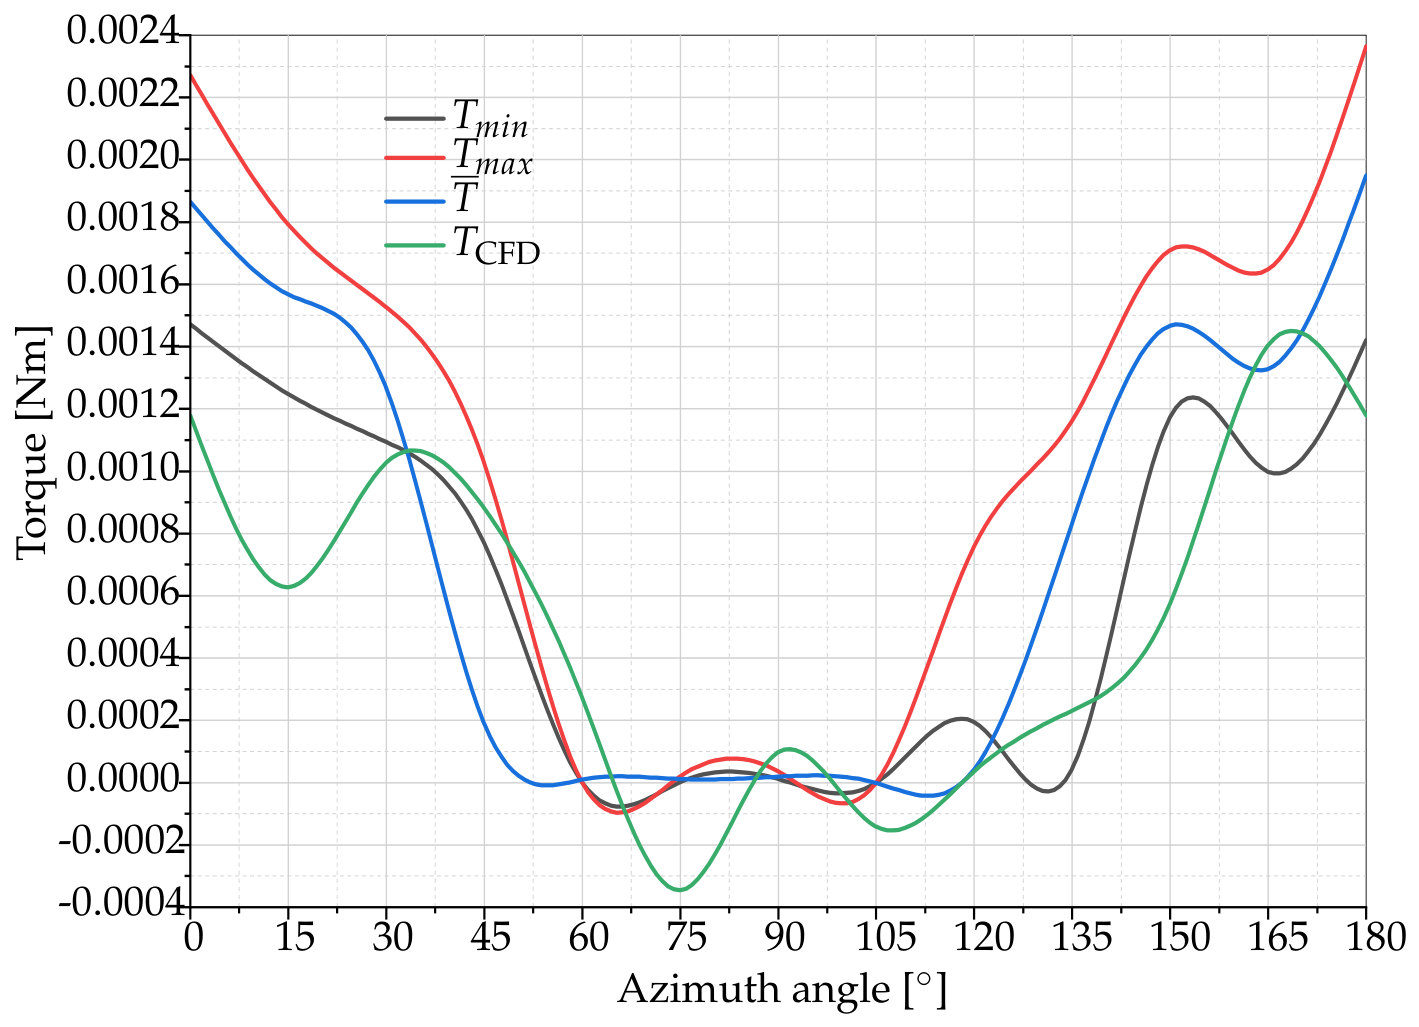
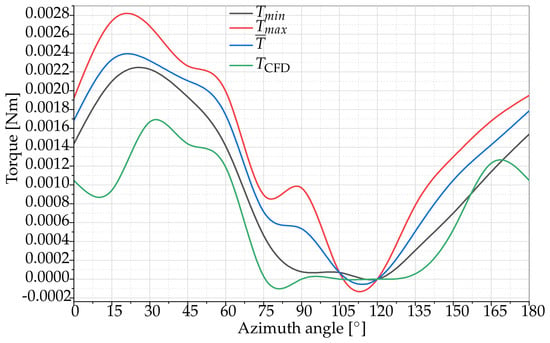
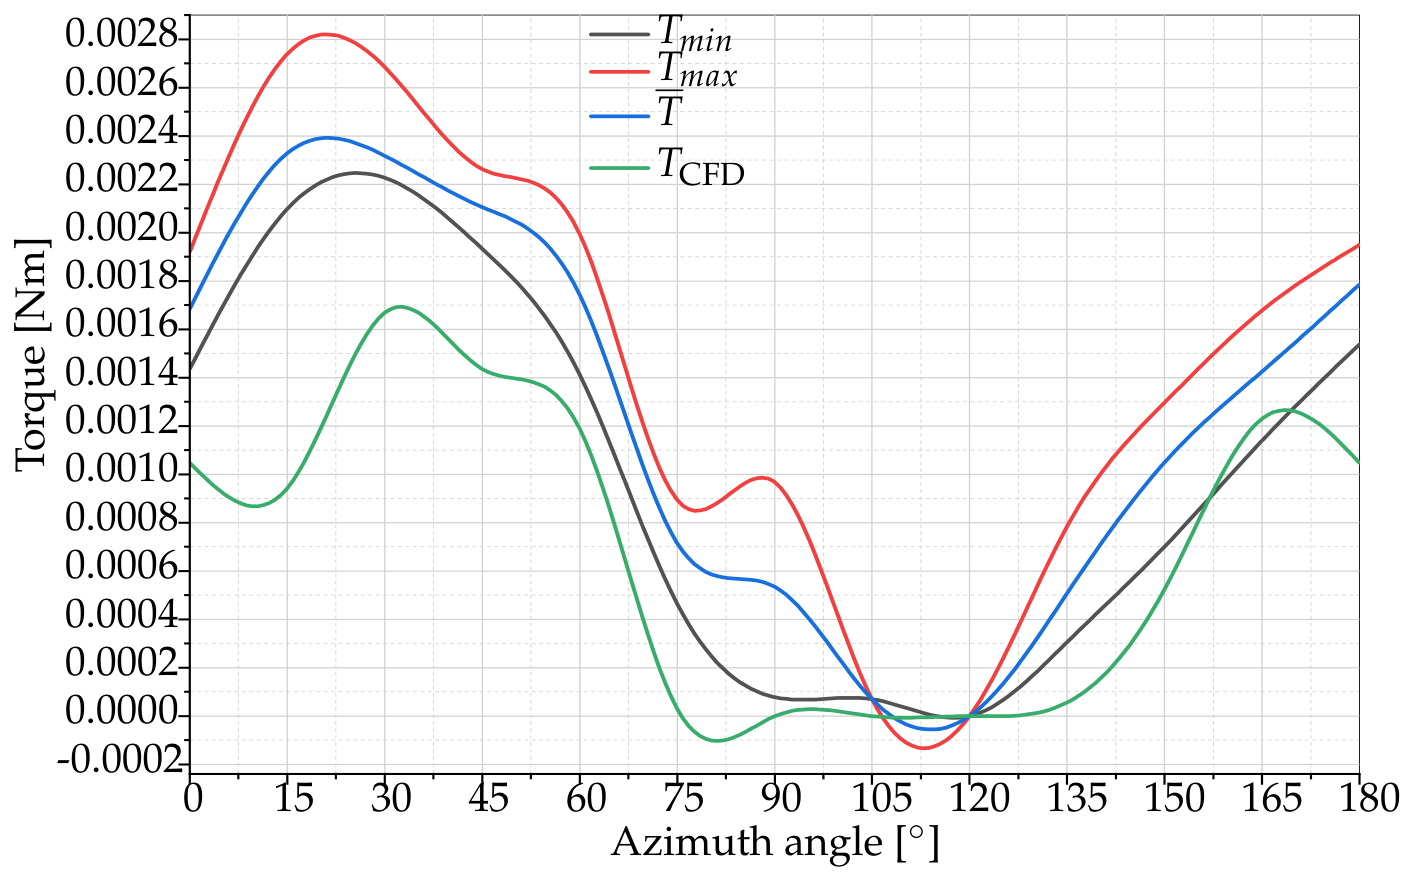
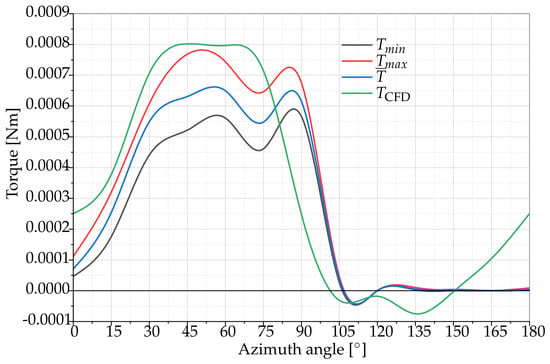
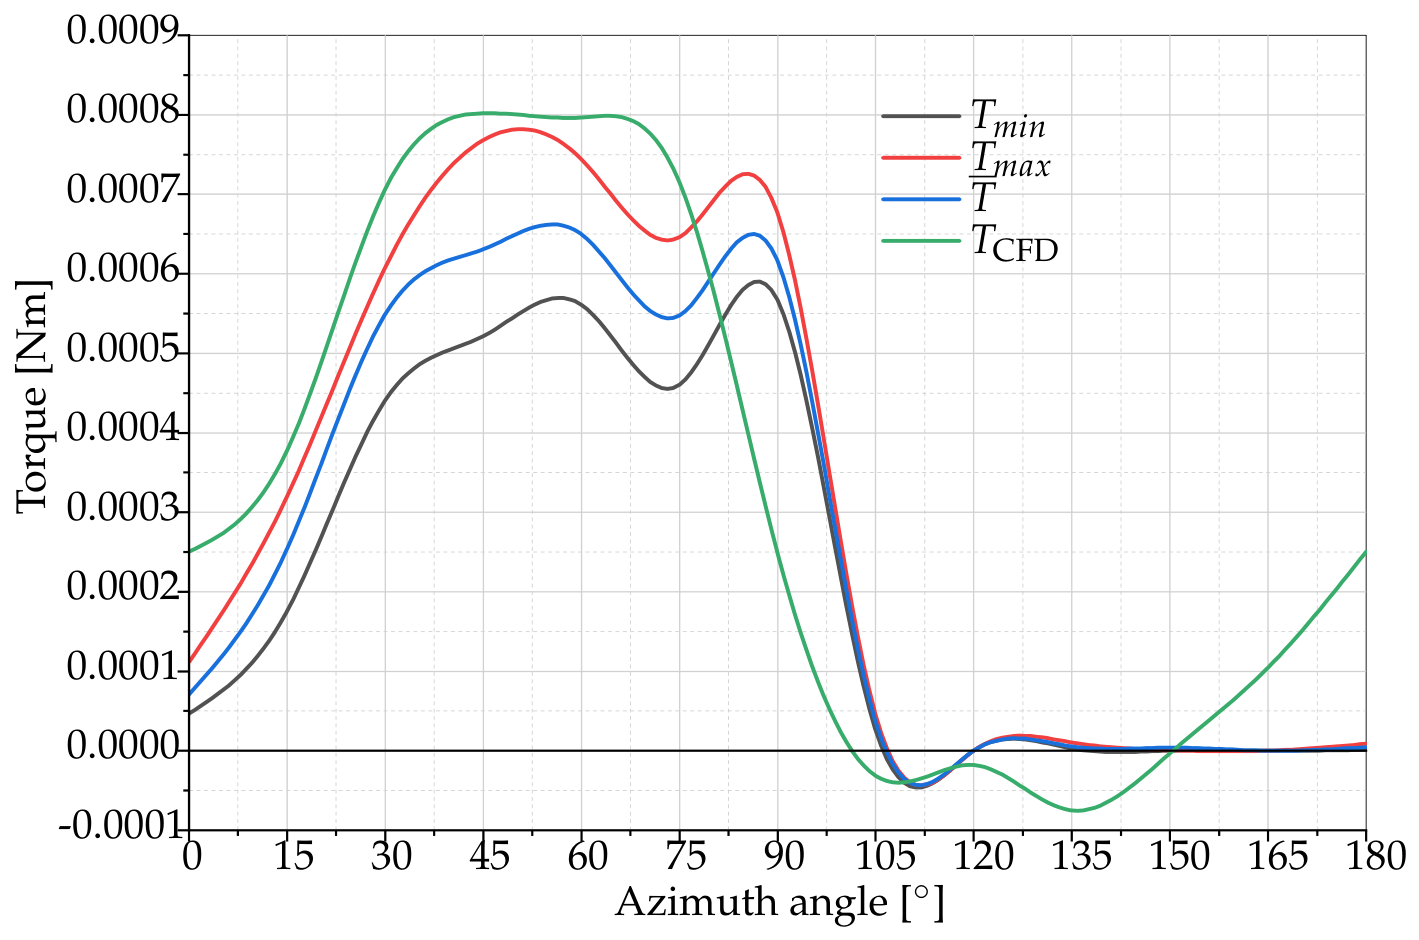

Disclaimer/Publisher’s Note: The statements, opinions and data contained in all publications are solely those of the individual author(s) and contributor(s) and not of MDPI and/or the editor(s). MDPI and/or the editor(s) disclaim responsibility for any injury to people or property resulting from any ideas, methods, instructions or products referred to in the content. |
© 2026 by the authors. Licensee MDPI, Basel, Switzerland. This article is an open access article distributed under the terms and conditions of the Creative Commons Attribution (CC BY) license.