


Abstract
Artificial intelligence (AI) has become an integral part of our daily lives as a most extraordinary assistant for providing information and carrying out various tasks. We can have an extensive amount of work done by a dedicated AI that we cannot do ourselves due to our easily distracted minds. AI is given vast amounts of information that we have been gathering for a long time. Using that information, it can analyze large amounts of data and sort it into particular topics and narrow down the solutions or choices we are interested in. With highly sophisticated high-resolution ground- and space-based telescopes and observatories, we have been gathering huge amounts of data. The analysis of these data will require both a considerable amount of manpower and time. Both of these factors can be reduced easily if we train dedicated AIs for spectral line identification and plasma modeling for analysis. While high-accuracy atomic data are needed for precise astrophysical plasma modeling, there are many gaps in the data due to computations of these high-accuracy data being complex and numerically challenging and requiring a significant amount of time. These problems can also be tackled to a very good approximation by training AI for simulations of existing high-accuracy data and producing data that are missing. A general algorithm for such predicted data and its implementation in astrophysical applications is presented. A recent application of AI in measuring oxygen abundance in galaxies is also presented.
1. Introduction
Since the beginning of the use of computers, we have been very much interested in the concept of having robots, androids, etc., now commonly referred to as artificial intelligence or AI. Many pieces of science fiction media have been written on AI’s roles based on these ideas. For example, we are very much fond of the ever-helpful and highly informative android Mr. DATA of the science fiction series STAR TREK. We have now entered an era where AI has been integrated gradually, without the knowledge of most of us, through various applications we use, such as for improvements in computing power (GPUs, cloud computing), for the availability of large datasets, and advances in statistical learning theory. It is involved in the search engine and retrieval of information for Google, it recommends content and moderation; ranks feeds; targets ad for social media, like Instagram and YouTube; and acts as voice assistants for smartphones. AI is used for predictive text and autocorrect, face recognition (Face ID), and scene detection in cameras. In transportation, AI directs navigation systems, predicts traffic, and provides autonomous vehicle driving by combining computer vision, sensor fusion, and reinforcement learning. AI is acting as an extraordinary assistant carrying out enormous tasks that we cannot perform due to our distracted minds.
We have independent individual AIs, such as an AI doctor who can diagnose a patient’s symptoms and offer possible treatments, reducing the tasks of a doctor. An AI nurse can serve an elderly patient with physical help and speak tirelessly to keep their spirits up. Ohio State University has built an ensemble of 500 robotic cable telescopes maintained by an AI, where each cable can be pointed to a particular astronomical object for observations. AI manages and stores data in a disciplined and efficient manner. AI can also interact with the general public through a web-based platform, like ChatGPT, and provide information.
The US Administration has announced “Launching the GENESIS Mission”, which is a focused and coordinated national effort to introduce a new age of AI-accelerated innovation and discovery. The aim is to ensure American science and technology dominance, economic growth, and national security. AI will transform a broad range of occupations spanning the nation’s industrial, government, educational, and research and development sectors, and will double the productivity and impact of science and engineering in a decade, and address some of the most challenging problems of this century. The Department of Energy (DOE) will lead the GENESIS Mission to mobilize national laboratories, industry, and universities to harness the nation’s leading capabilities in high-performance computing, next-generation quantum computers, and artificial intelligence to revolutionize science innovation. Ohio State University has instituted the “AI Fluency” program to train all students to adapt to AI programmings, applications, and implementations.
2. AI for Astronomy
AI can contribute to astronomy enormously. The following subsections describe briefly how AI can be involved in some crucial ways.
2.1. Searching for Habitable Planets
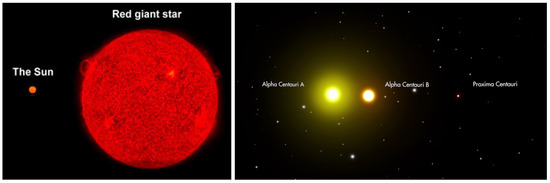
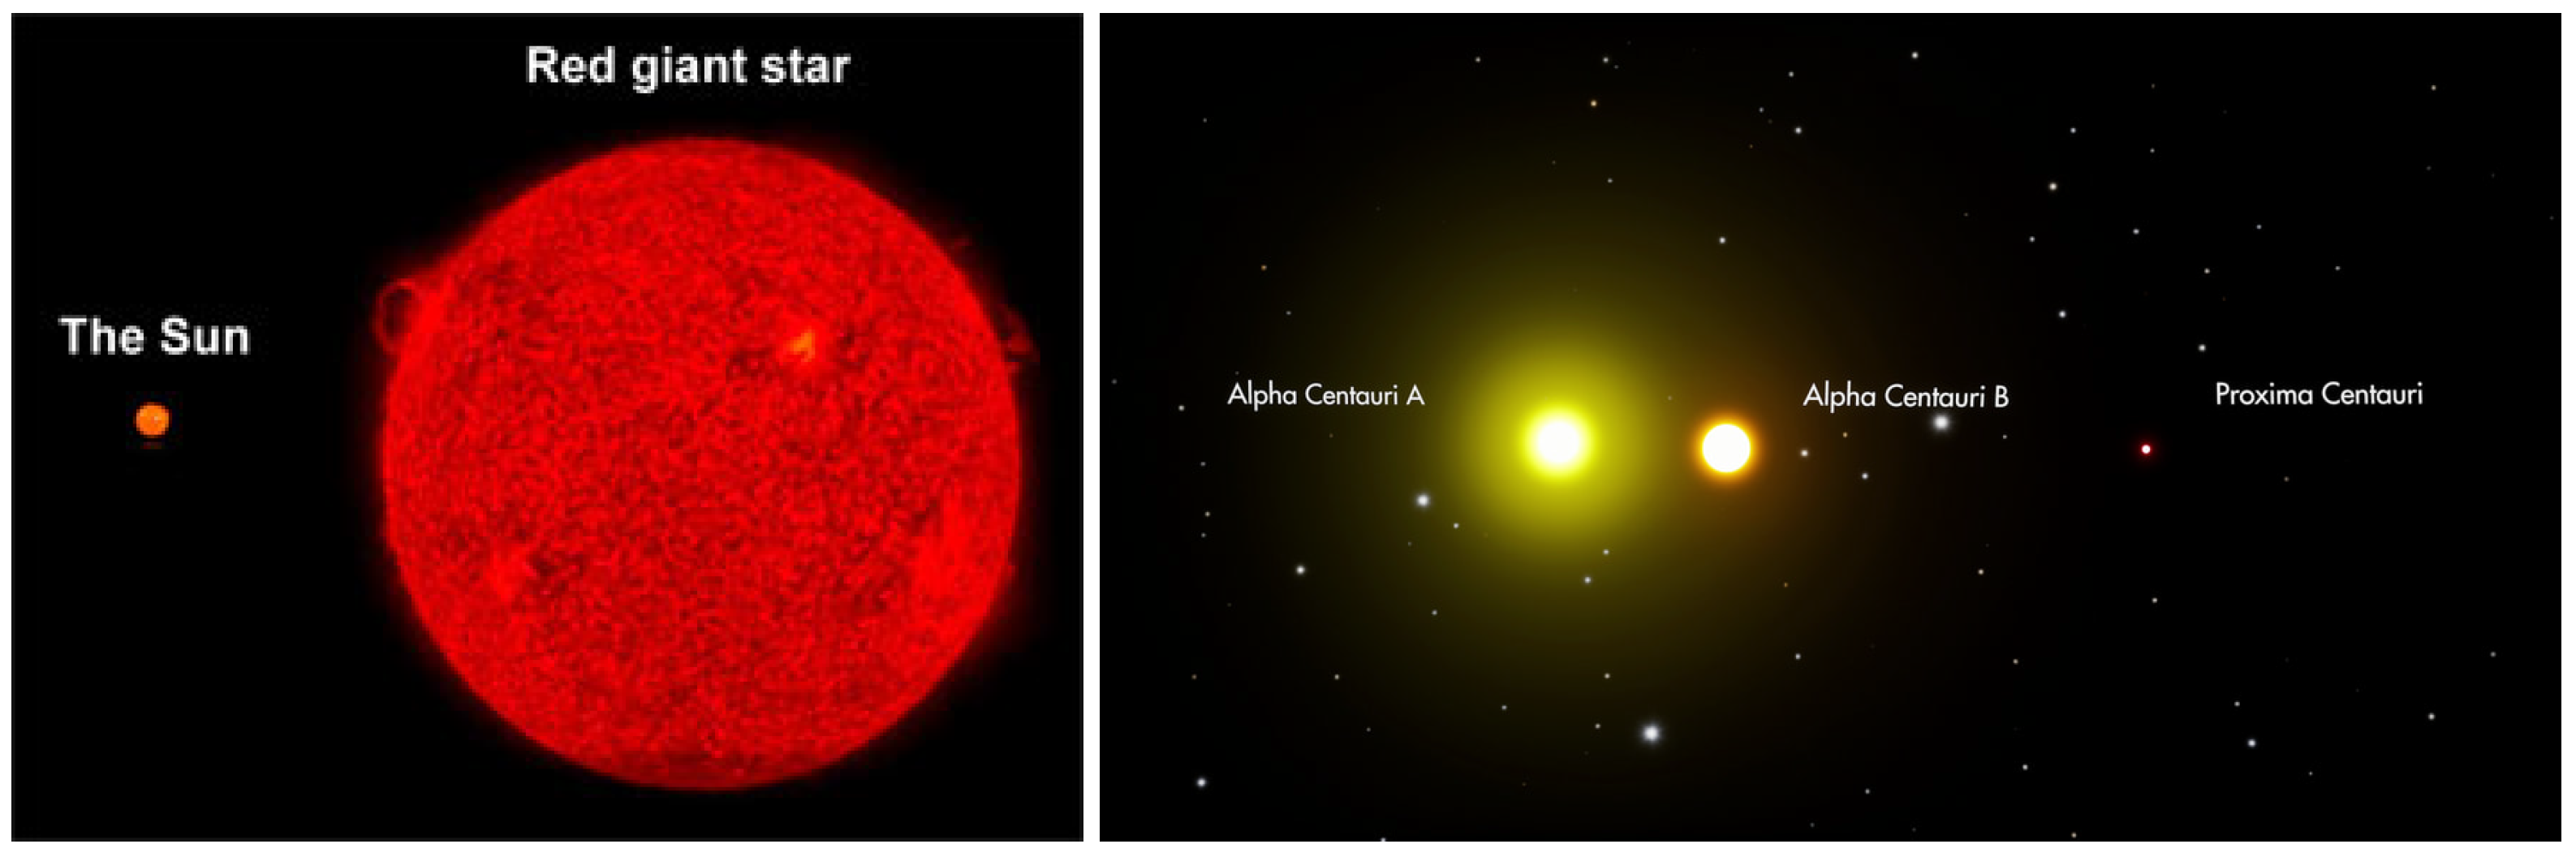
Our star, the Sun, is about 4.5 BYr old and expected to live for another 6–7 BYr. With the depletion of hydrogen atoms through nuclear fusion, the Sun will become a red giant, a dying expanded star (see Figure 1). The heat and radiation of its core and electrons will push materials out to form this red giant. The red giant will slowly become planetary nebulae and ultimately a white dwarf. Over 90% of stars will end up as white dwarves. In the process, Earth will be engulfed. So, we will need another home planet before the end of Sun’s lifetime.
Figure 1.
L: Current size of our Sun compared to a red giant with a much larger size, which will be formed after all hydrogen fuel in the Sun will be depleted. R: The nearest stars to the Sun, about 4 LYr away, including the Alpha Centaurai system, now found to be have three exoplanets, one of which is expected to be habitable (NASA pictures).
We have been searching for habitable planets that are solid and hold liquid water. Fortunately, we have found Proxima b, the exoplanet to our closest star systems Alpha Centauri A, B, and Proxima Centauri (4 ly away), which is Earth-like in size, with a hard and rocky surface, possibly holds liquid water, and has a temperature similar to Earth’s. However, a spacecraft using current technology will take about 18 thousand years to reach it. This prompts us to advance this technology faster. One new idea for reaching this exo-planet is having a probe reach it in 20 years by developing a laser propeller that could push the probe-carrying spacecraft at 1/4 the speed of the light. We will need advanced technology to develop such a propeller. Even if we advance our technology, we may not be able travel for a long time in zero gravity. Recent findings indicate a high risk for humans subjected to prolonged stays in near-zero-gravity space: (i) low gravity can shift the brain fluid of an astronaut slightly, causing imbalance conditions, and (ii) astronauts’ STEM cells seem to age faster than those of normal people. The solutions for all these problems and difficulties could be reduced or solved with the help of AI.
2.2. Spectral Analysis for Identification and Categorizing Astronomical Objects
Our galaxy, the Milky Way, contains about 200–400 billion stars. There are about 2 trillion galaxies in the universe. Observational studies of them will also lead to an unprecedented amount of data to analyze. Knowledge about these objects may be essential for our benefit and survival. For example, any change in the Sun, which is the source of energy for us, will affect us and our lives.
Every day, we are collecting huge amount of data on astronomical objects using various ground- and space-based telescopes. Several of them carry out sky surveys. We have been surveying the sky for a long time. Table 1 gives an idea of the data being collected by survey missions alone and their metrics. The number of bands refers to distinct photometric or spectral channels used in surveys.
Table 1.
Metrics of various sky survey missions of NASA and astronomical data being collected by them.
It will take many years effort and manpower to make even a general category of classes of observed data on these astronomical objects. The solution could be the use of AI. If we train AI on basic spectroscopy for the identification of these astronomical objects with general characteristics, it can process huge amounts of observed data much faster than us.
3. Astrophysical Spectroscopy
We study astronomical objects by analyzing the light or photons coming out from them. The light or radiation from them is emitted mainly by atoms and the molecules in them. Telescopes detect these photons and pass them through the spectrometer, which reveals the spectral lines of individual photons. These spectral lines are unique to the elements which created them through atomic processes and hence can be used for their identification. There are several atomic radiative and collisional processes that are dominant in astrophysical plasma. The study of each process precisely for accurate data is itself a domain of detailed physics and complex numerical computations. We employ the most powerful R-matrix method with close coupling (CC) wavefunction expansion to study these atomic processes.
Astrophysical spectroscopy depends mainly on the data of the atomic processes if the plasma is thin in the astronomical object. However, plasma modeling for incorporating plasma’s effects on atomic processes is needed for denser and warmer plasma. The dominant atomic processes impacting the formation of spectral lines, the relevant data, and a brief description of the theoretical background are given below.
3.1. Data for Atomic Processes in Astrophysical Plasma
There are about six common atomic radiative and collisional processes in astrophysical plasma data that are incorporated into spectral models.
1. Photo-excitation and de-excitation: This is the most common radiative process for excitation of the atomic system by absorption of a photon in the presence of a radiative source and is the main process for forming the spectral features of the atomic system. For an element X with charge z, we can write the process as
where is the energy with photon frequency and ∗ indicates excitation. The reverse process is de-excitation by emission of a photon. Since an atomic system has infinite number of energy levels, there are infinite number of possible excitation or de-excitation or transitions among them. However, not all ransitions form strong lines. Oscillator strength, the quantity relevant to the strength of a transition line, predicts the wavelength or range of wavelengths where lines are strong enough to be detected.
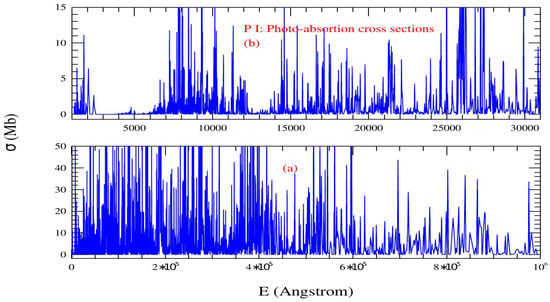
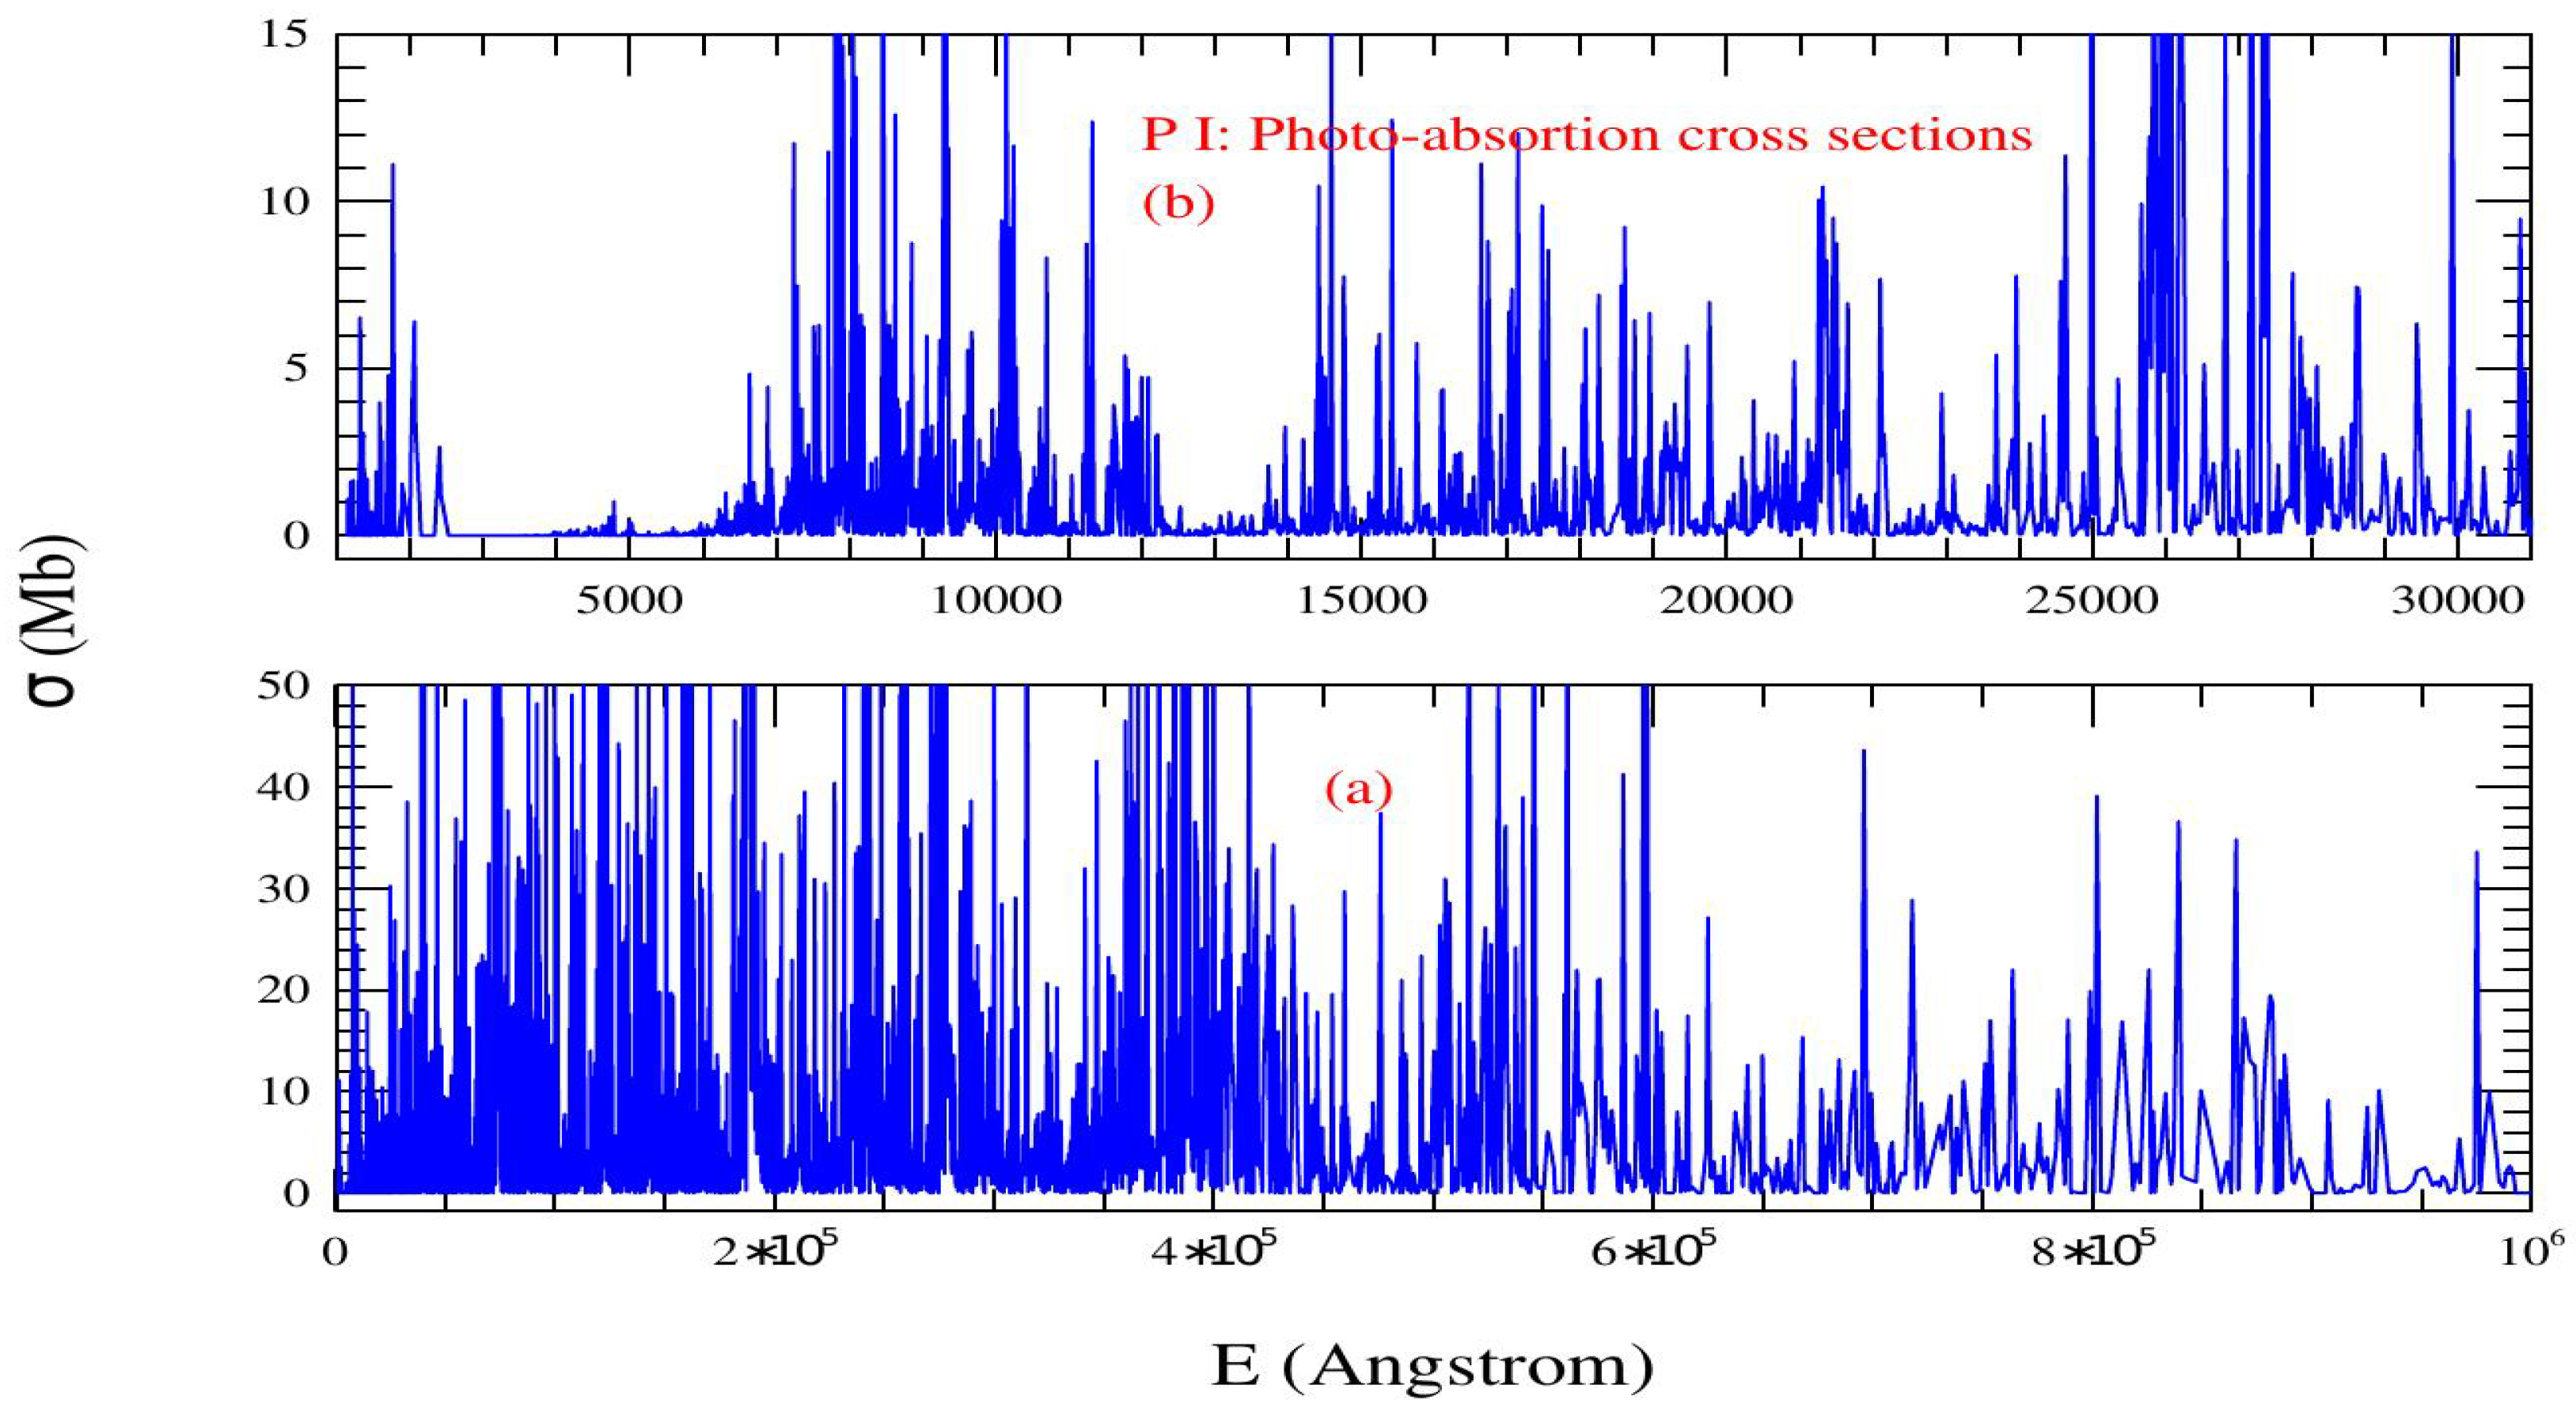
An example of a photo-absorption spectrum generated by photo-absorption cross-sections obtained from oscillator strengths for the radiative transitions in neutral phosphorus (P I) is presented in Figure 2, full spectrum is presented in panel (a) and wavelength range upto 30,000 Åin panel (b). The spectrum, corresponding to 32,678 fine structure lines among 343 bound levels, were obtained using the R-matrix method. The wavelength range in Figure 2 covers from X-rays to far infrared and includes lines that can be detected by JWST (wavelength range: 0.6–28 m). Phosphorus is an element in DNA and is treated as a clue for finding extra-terrestrial lifeforms in space.
Figure 2.
Panel (a): Full absorption spectrum of neutral phosphorus, P I, from X-rays to far-infrared. Panel (b): Details of line strengths from X-rays to 30,000 Å. The spectrum consists of 32,678 fine structure transitions among 343 bound levels. JWST detection covers wavelength range of 0.6–8 m and hence includes the wavelengths of P I.
2. Photoionization is the other radiative process that takes place in the presence of a radiative source when a photon absorbed by the atomic system leads to ionization, directly as
or through a two-step process when an intermediate doubly excited autoionizing state is formed before the ionization:
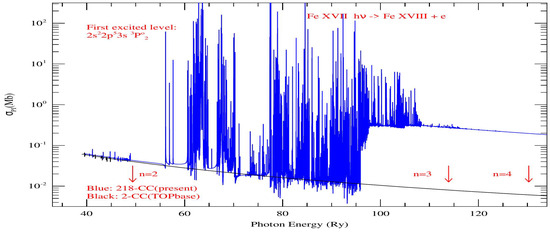
The two-step process takes place when the energy of the photon matches the energy of a Rydberg autoionizing state above the ionization threshold. This process is manifested by the introduction of a resonance in the cross-section of photoionization. The process is natural and enhances the features and the value of the cross-section. Figure 3 illustrates the features and impact of resonances in photoionization cross-sections of an iron ion, Fe XVII. These resonances are similar to, but weaker than, the oscillator strengths of radiative transitions among bound levels. Resonances can appear as absorption lines if they are strong. In astrophysical plasma, the resonance is often dissolved by the plasma density, motion, and temperature, but contribute to the enhancement structure of the spectral background.
Figure 3.
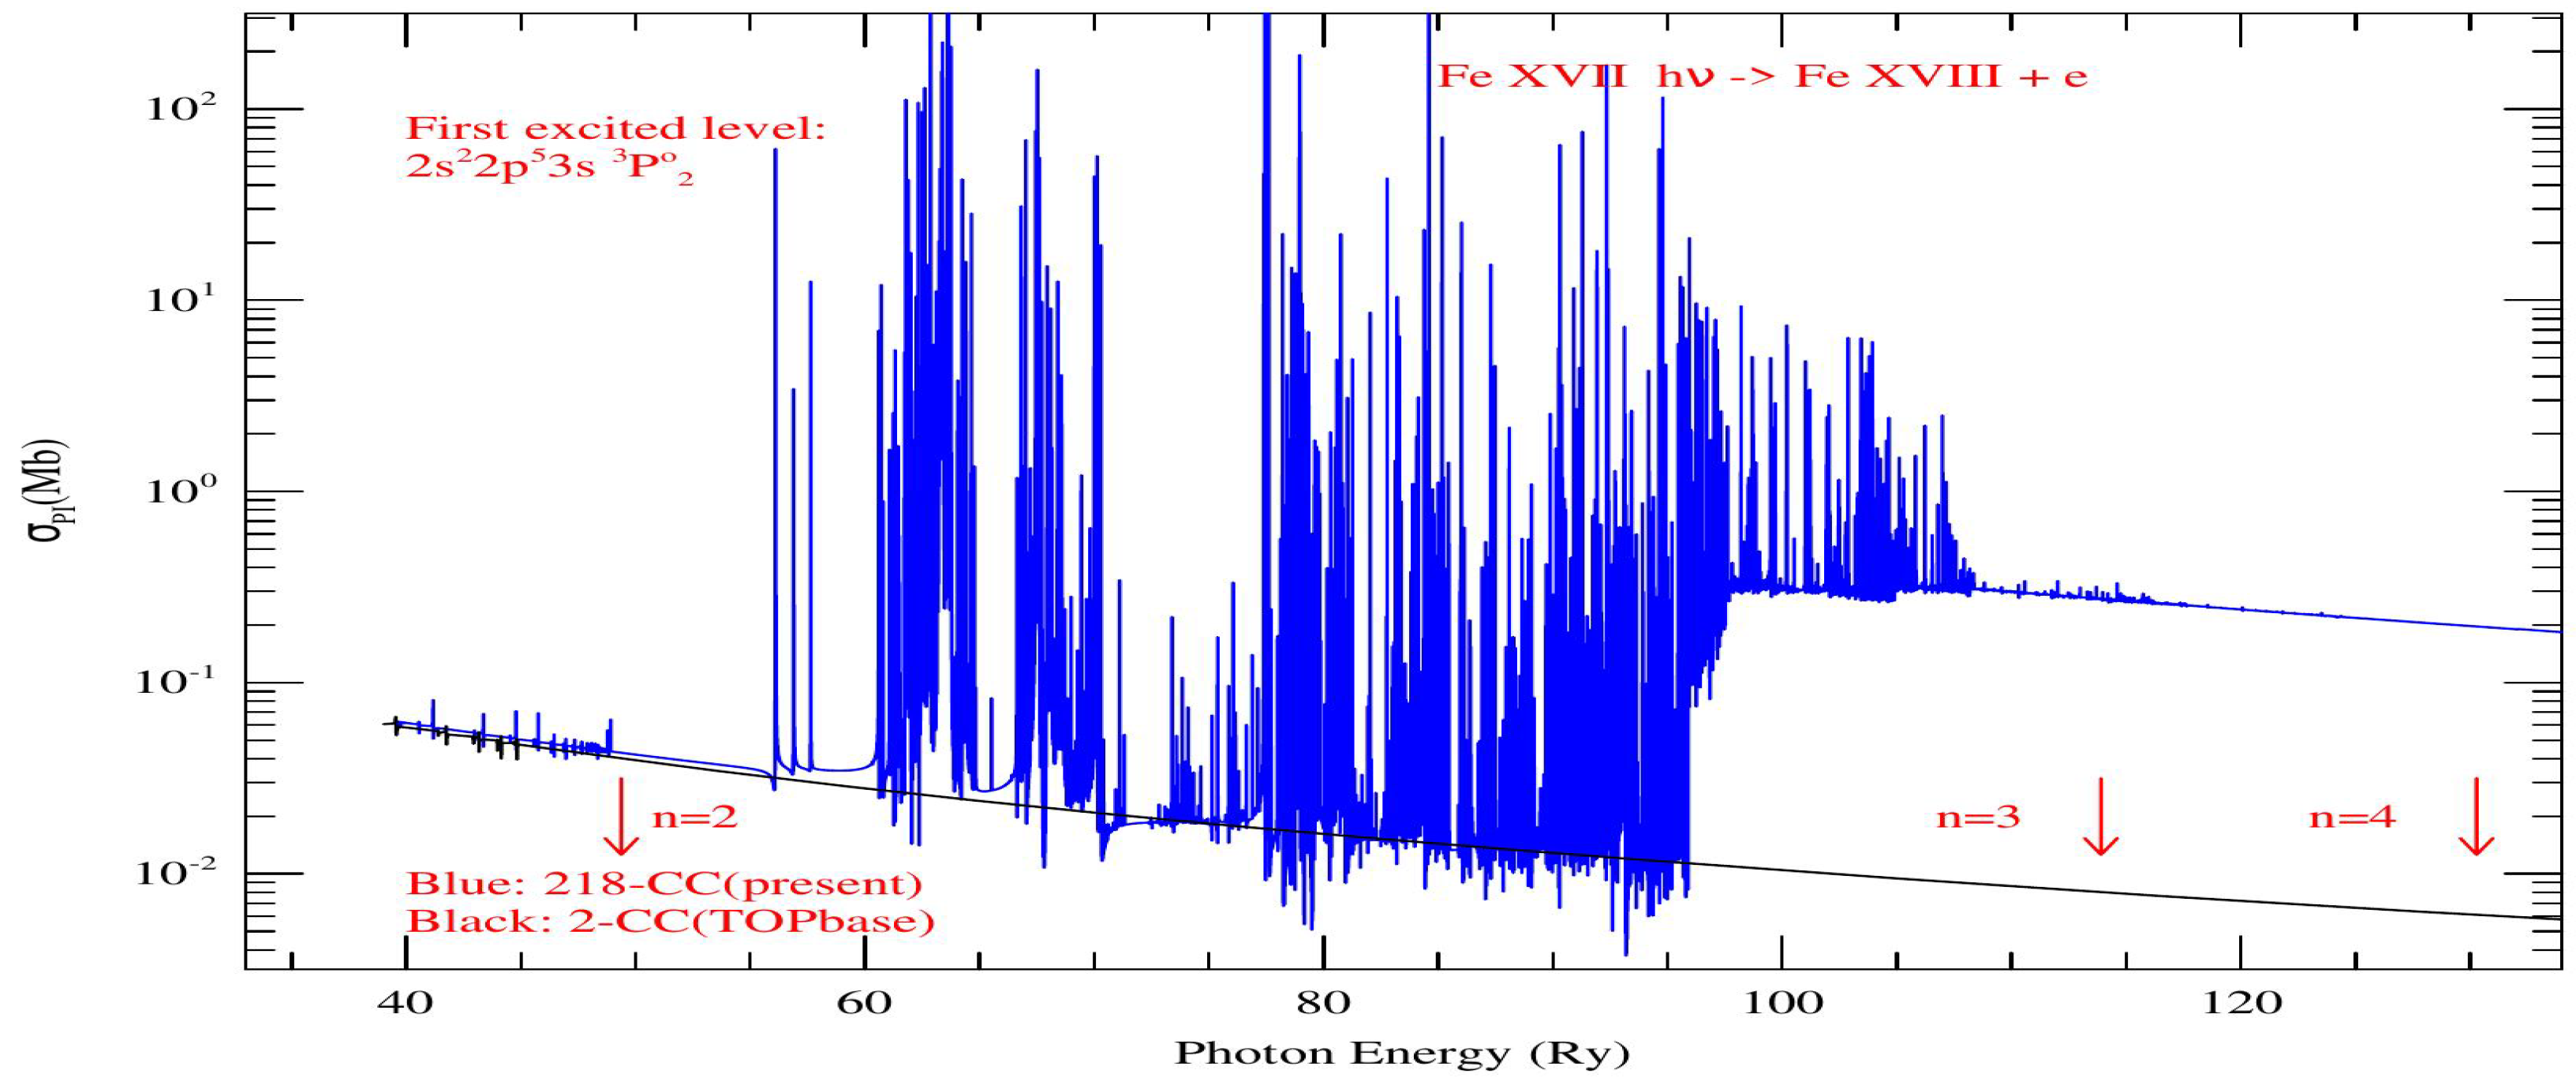
Photoionization cross-sections of excited 3 level of Fe XVII illustrating the features of photoionization with sharp resonances. These resonances represent the Rydberg series of states belonging to many core ion excitations of Fe XVII during photoionization.
Calculations of photoionization of Fe XVII using a large close coupling wavefunction in the R-matrix method has taken quite a number of years for completion. But it is very important to carry out such a study for the high-accuracy features of the process. Without the inclusion of these complex resonant features, cross sections show a smooth background curve as displayed by the featureless black curve in the figure. The astrophysical applications of such cross-sections, such as for the computation of plasma opacity, are grossly underestimated.
3. The third process, electron–ion recombination, is a radiative process. It is the inverse of photoionization, when a photo-electron combines with an ion with the emission of a photon, directly shown as
which is known as radiative recombination (RR), or through the two-step process, when an intermediate doubly excited autoionizing state is formed that leads to recombination with the emission of a photon, which is known as dielectronic recombination (DR),
Electron–ion recombination can also occur in a medium without a radiative source when a traveling electron combines with an ion through the emission of a photon. As in the case of photoionization above, the doubly excited autoionizing states formed during the DR process also introduce resonances. To incorporate the resonances in electron–ion recombination naturally into the cross-sections, we use the ab initio unified theory based on the R-matrix method and compute total recombination, which includes both RR and DR. Recombination rates are needed for spectral analysis to provide the ionization fractions, equilibrium conditions, cascading for line intensities, and recombination lines used for plasma diagnostics.
4. The fourth dominant atomic process, electron impact excitation (EIE), occurs when a projectile electron excites an atomic system by transferring some of its energy during a collision with the atom:
The excited electron comes down with the emission of a photon. The process can take place anywhere in space: in an empty space or in an astronomical object with or without any radiative source. However, it is an important process when a traveling projectile electron excites an atomic electron to a low-lying excited level in a cold empty space or in a dusty galaxy, leading to the emission of a weak photon. Such weak photons are not typically absorbed by other atomic systems and hence, can travel for a long distance before being detected. Similar to photoionization and electron–ion recombination, characteristic resonances appear in the EIE collision strength when the projectile electron energy reaches an autoionizing state. This process is used for the determination of the ratios of two spectral line intensities, which provide plasma diagnostics, such as density, temperature, and elemental abundances.
5. The fifth atomic process, electron impact ionization (EII), is a radiationless process that occurs when the atomic system is ionized as
No line is formed in the process. The relevant atomic quantities for ionization rates are obtained from experimental measurements as well as from some analytical expressions based on models. Although not involved directly in spectral line formation, the process provides ionization fractions that are relevant to line intensities.
6. The sixth process, hydrogen–proton collisions,
is common in denser plasma. It is also a radiationless process for which model calculations are carried out. This process is needed for the kinematics of the plasma being studied.
3.2. AI Assistance in Computational Challenges for High-Accuracy Atomic Data
High-accuracy atomic data is one most essential parts of precise astrophysical analyses for the determination of elemental abundances, the physical conditions of the plasma, and chemical evolution. However, computation for high-accuracy data faces many numerical challenges, from the complexity of the atomic structure, dimensions of Hamiltonian and other quantities, to numerical tolerance problems. High accuracy typically means an accurate wavefunction expansion representing the atomic system and the methodology for computations.
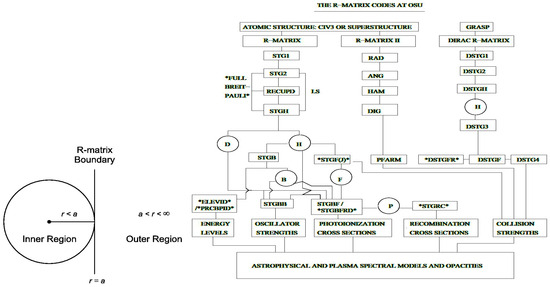
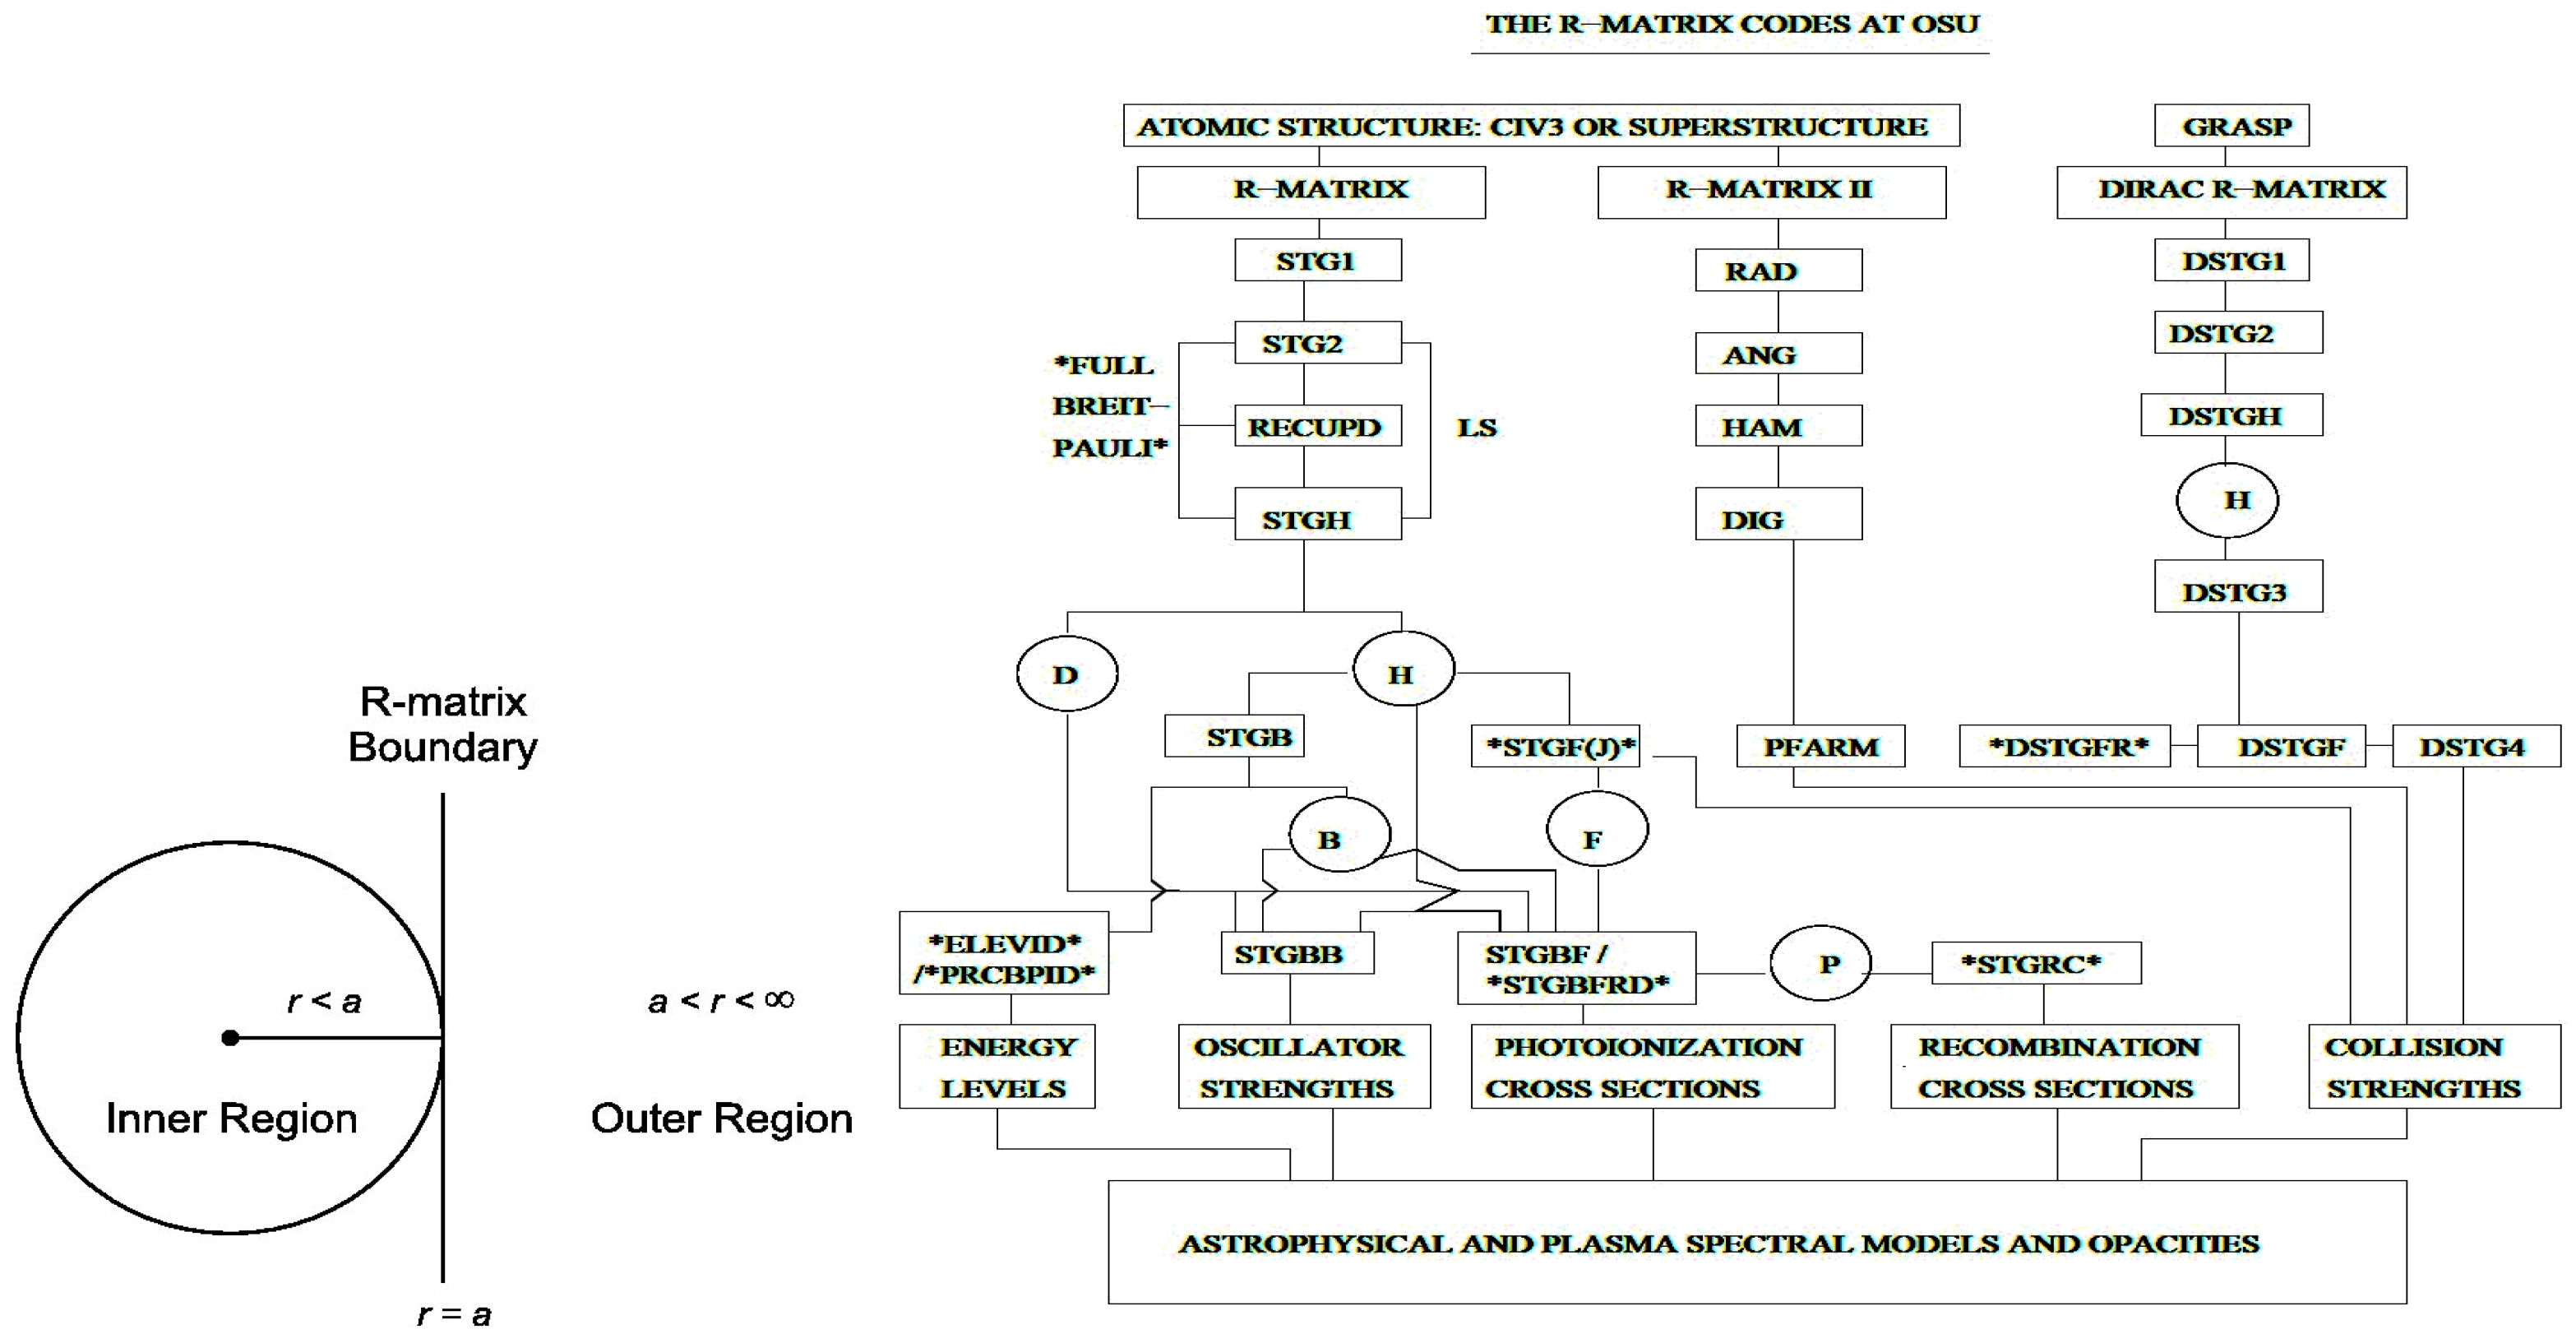
For high accuracy, we use close coupling (CC) wavefunction expansion, which generates inherently the most accurate characteristic features of the atomic processes in the plasma. The wavefunction includes excitation of the core ion of the atomic species being studied, a phenomenon that occurs naturally all the time. As explained above, these excitations in the core ion give rise to a series of resonances in the atomic process. The use of CC wavefunction in the non-relativistic Schrodinger or Hartree–Fock, or relativistic Dirac–Fock equation introduces a set of coupled equations. These sets are solved using the R-matrix method to obtain the Hamiltonian matrix, wavefunctions, and energies of the atomic system. In this method, an R-matrix sphere is chosen such that it contains all electron–electron correlation interaction potentials that are complex to calculate (see Figure 4). The sphere radius determines that almost no effective electron–electron correlation interaction exists outside the sphere. Hence, the atomic wavefunction can be treated as Coulombic outside the boundary. The coupled equations inside the sphere are solved by constructing orbital wavefunctions with expansions of about dozen of terms, known as the R-matrix basis set. The Hamiltonian matrix is created as the coupled equations are solved. One advantage of the R-matrix method over atomic structure calculations is that the Hamiltonian from the R-matrix, unlike that from the atomic structure, can be re-used for all energies of the outer electron.
Figure 4.
L: R-matrix sphere. R: Algorithm of R-matrix codes. For descriptions, see [1]. * indicates component created at the Ohio State University.
Our research group of atomic astrophysics at the Ohio State University has been carrying out calculations for high-accuracy atomic data using the R-matrix method and close coupling approximation for a long time. R-matrix computations follow number of stages as specified in the R-matirx program algorithm of Figure 4. We use the Briet-Pauli R-matrix method (the leftmost branch in the figure) for various atomic processes. Computation also includes atomic structure data obtained from using the relativistic atomic structure code SUPERSTRUCTURE [2]. All published atomic data are freely available online in the NORAD (Nahar-OSU-Radiative-Atomic-Data) database. One objective of the current on-going effort of the group is to implement AI for astrophysical applications using NORAD atomic data and to generate simulated data by training AI with the high-accuracy NORAD atomic data.
AI can play a crucial role in computing atomic parameters at a good accuracy. As computations for various atomic processes go on for years using high-performance supercomputers, we can produce these data in a limited manner for representative atomic species. Some characteristic features of low and medium Z (nuclear charge) and of highly charged isoelectronic ions (ions with same number of electrons but different Z) often show similar characteristics. So, the features of isoelectronic ions can be predicted at a good accuracy by using the features of an ion for which accurate data are available. The background photoionization cross-sections of these ions also show dependence; that is, comparing the z-numbers of two isoelectronic ions of difference Z the background features may be predicted. AI can be trained to carry out such simulated sets of data when needed data are missing for a model.
4. AI Framework for Astrophysical Applications
AI operates using machine learning (ML), which enables computer systems to learn patterns from given data banks, generalize them to unseen data using statistical models, and identify data relationships to make predictions, decisions, or generate content, with accuracy increasing as they are exposed to more data. Our plan is to implement a Large Language Model (LLM) implemented in ML. ML can perform tasks without explicit programming language instructions and improve its performance over time. Within a subdiscipline of ML, advances in the field of deep learning have allowed neural networks, a class of statistical algorithms, to surpass many previous ML approaches in performance. The neural network, a convolutional neural network (CNN), is particularly effective for data interpretation, optimization, and classification tasks. It has several key components, such as convolutional layers for input data to learn significant data, feature maps to reduce computational complexity, and making the network robust to small shifts in the input data. Maximum pooling is used to reduce spatial dimensions, the activation function allows for learning complex data patterns, and a Fully Connected (FC) layer allows for effective data classification, etc. We also plan to use a transformer emulator for benchmarking.
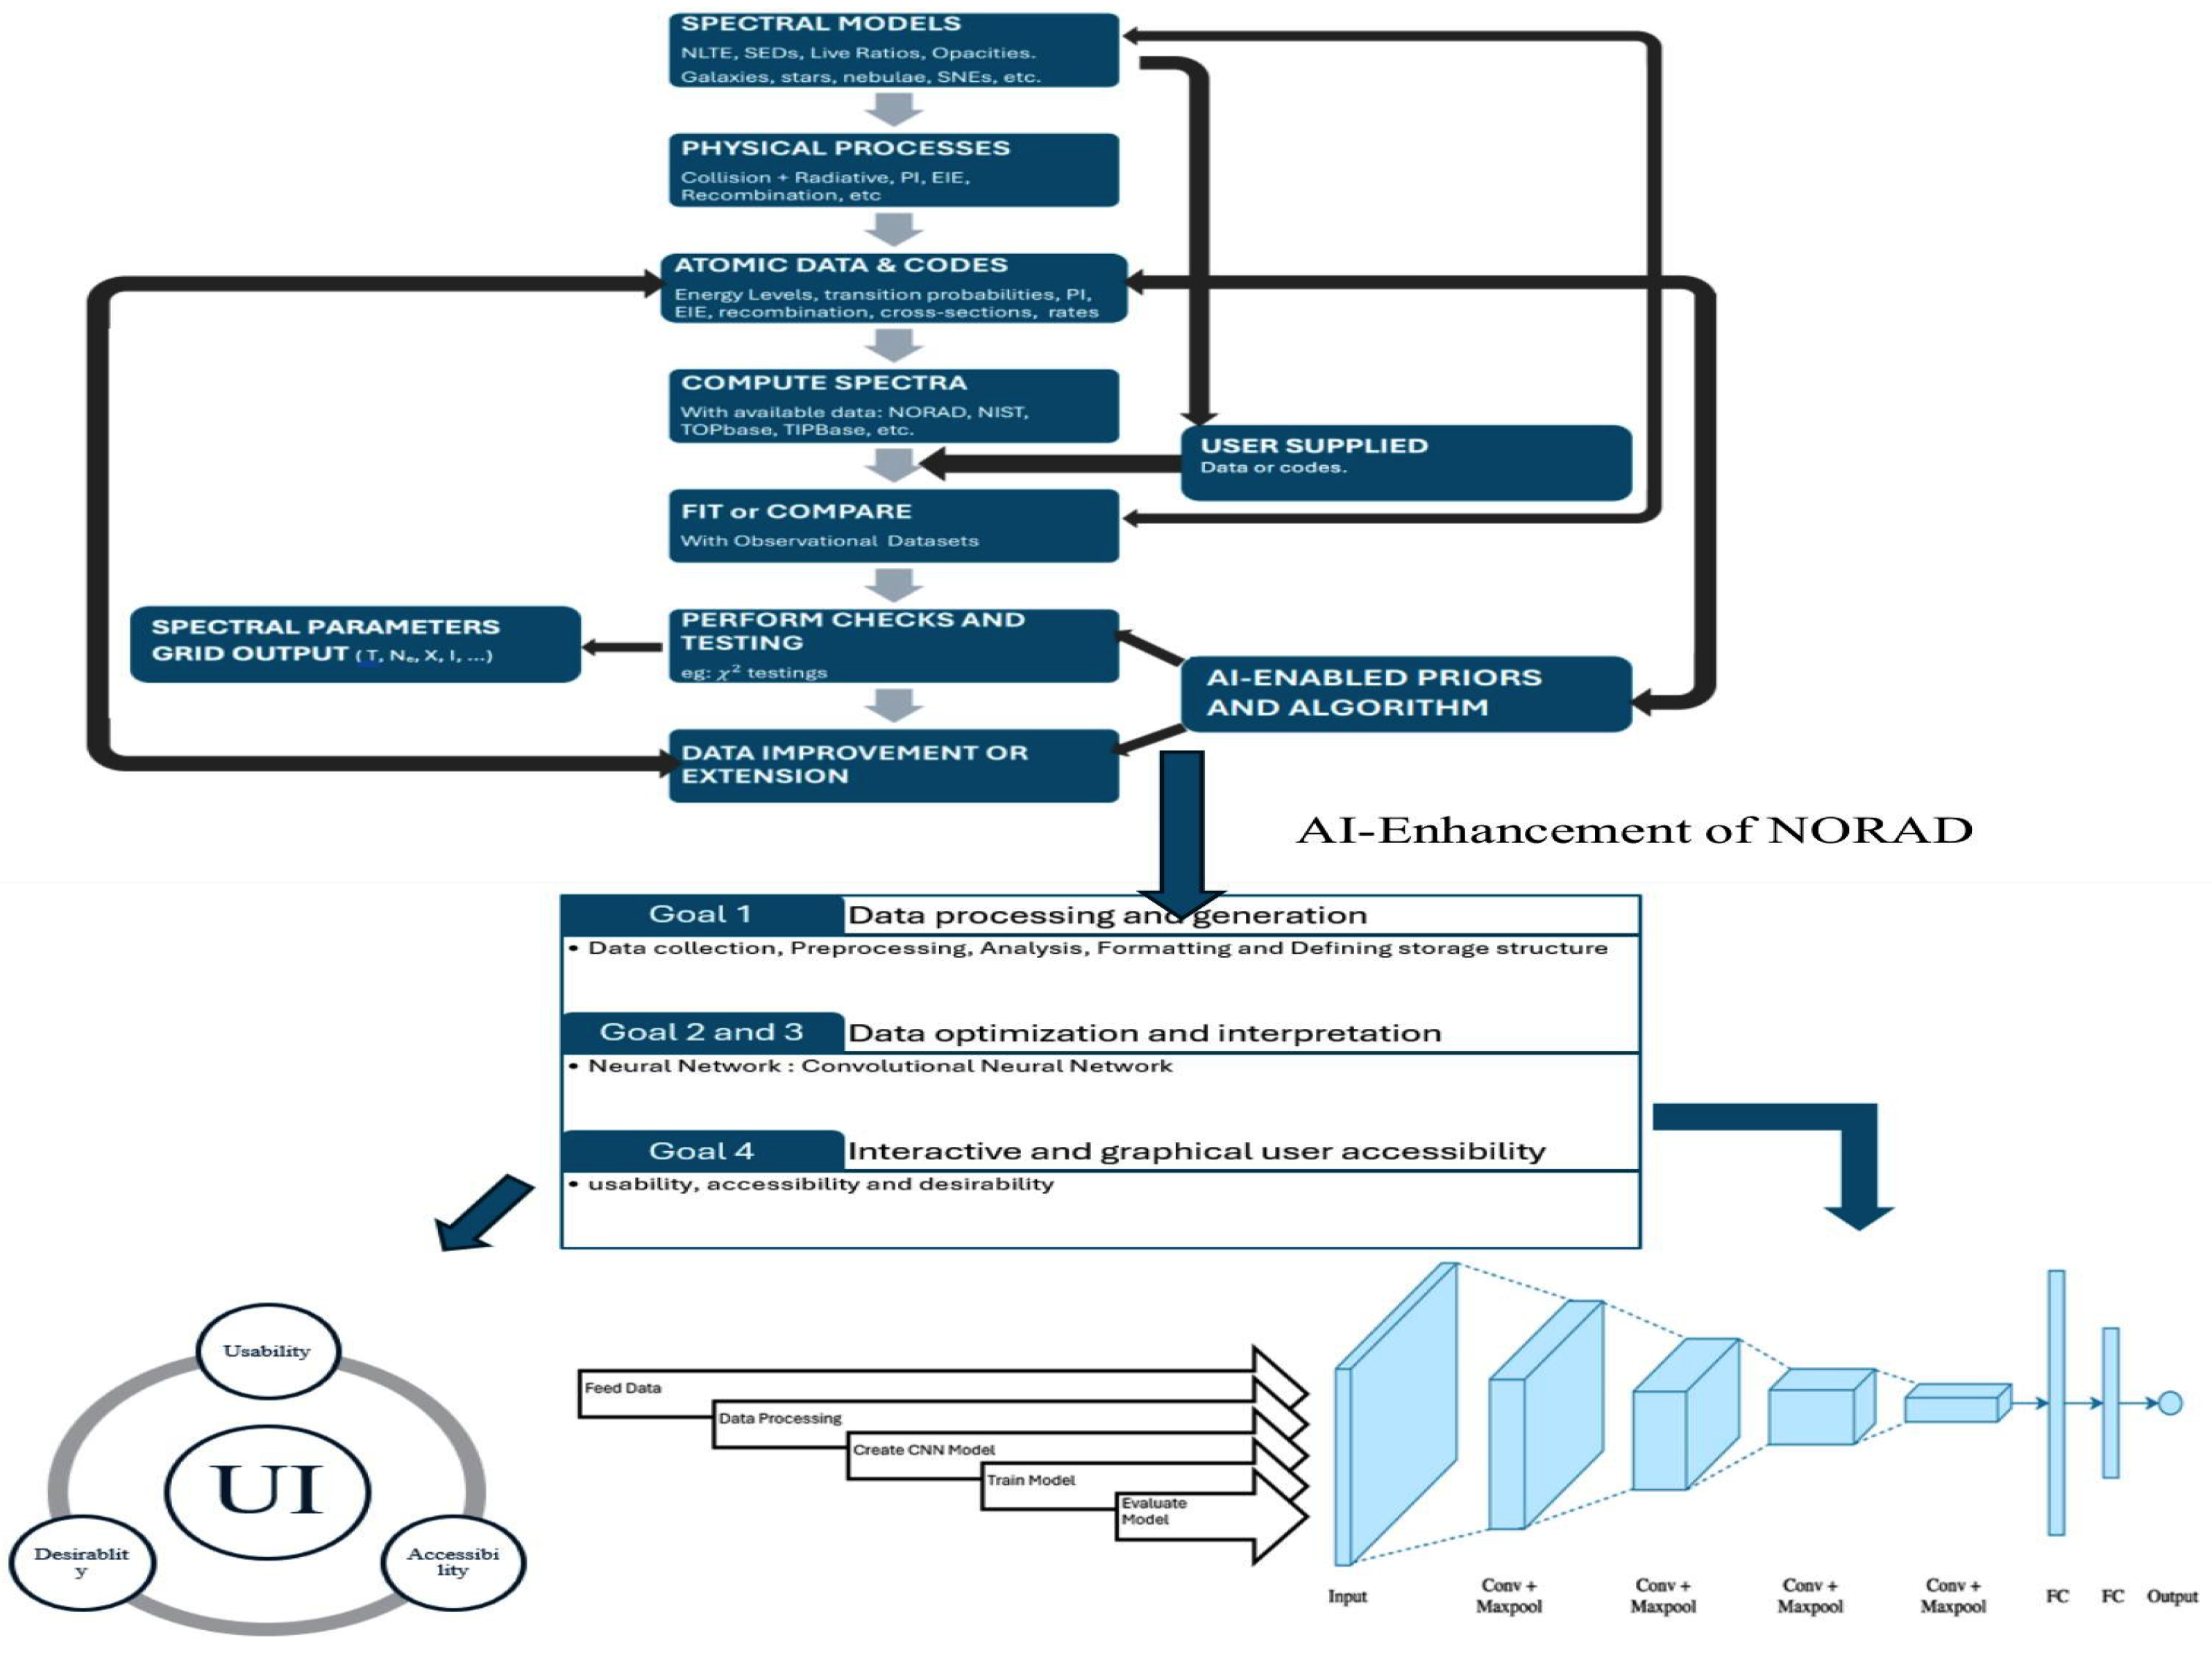
We have proposed a framework of algorithms for astrophysical applications using AI, as shown in the chart in Figure 5. As the chart shows, astrophysical spectral models are initiated with the underlying science of physical atomic processes occurring in the astrophysical plasma, such as those discussed above: photoionization, radiative transitions, electron–ion recombination, electron impact excitation (EIE), and electron impact ionization (EII).
Figure 5.
Framework for AI enhancement of NORAD and spectral modeling with recurrent neural network loop. Completion of datasets of high accuracy would be coupled to spectral synthesis. This is followed by data generation as needed for optimization with universal macrovariables such as effective temperature and elemental chemical composition, and universal microvariables such as atomic energy levels, oscillator strengths, cross-sections, and rate coefficients.
The relevant data on atomic processes, as mentioned above, are oscillator strengths or radiative decay rates, photoionization cross-sections, recombination rates, EIE collision strengths, and EII cross-sections, which are given to the model. These data can be termed the microvariables or universal parameters for the spectral analysis performed by the AI model. Using these microvariable data, the spectral models compute or simulate the spectra where data are collected from the NORAD database, and other data sources, such as NIST, TOPbase, and TIPbase, as needed.
Spectral models are based on the physical conditions of the plasma and can be modeled with NLTE (Non-Local Thermodynamic Equilibrium) plasma, spectral line ratios, or plasma opacities for various astronomical objects, including stars, galaxies, nebulae, and supernovae. The relevant star-specific quantities, such as effective temperature (T), surface gravity (g), metallicity (e.g., [Ft/H]), composition and abundances ([X/H]), densities, opacities, microturbulence, and rotation macroturbulence, can be termed the macrovariables for an AI model. The relevant macrovariables are used to carry out the fitting to match or compare with the observed spectrum.
The fitting parameters provide the output information of the astronomical spectra and conditions of the object. Various checks and tests are done for the validity of the parameters. The User Interface (UI) part of AI’s role will be relevant when carrying out checks and testing with other existing similar data and in data improvements or extensions.Checks involve the collection of known data from sources, such as NORAD, NIST, TOPbase, and TIPbase; preprocessing; analysis; formatting; and storage structure. Testing is carried out through data optimization and interpretation. Optimization is carried out using universal macrovariables and universal microvariables. These tasks are performed through a convolutional neural network (CNN). The UI will be utilized through interactions with and graphical representation by the AI.
These may further require data accuracy improvements and extensions for completeness. One main criterion of a spectral analysis is to have accurate atomic data, which can be obtained through the R-matrix method and high-precision atomic structure codes, as mentioned above. The R-matrix method is the most powerful method for studying atomic processes. However, often, high-accuracy data are not available for atomic species and processes, and data is not complete for models, in which case, AI can play a role for data generation using simulation as indicated above.
AI will generate microvariable data as needed for completeness and improved optimization. The strategy for optimization builds upon the natural decomposition of parameter space and specific processes with components as follows.
We will develop deep neural network emulators for computationally intensive processes. Starting with a minimal set of benchmark stars, we will focus on optimizing universal parameters with only the Sun and/or Arcturus as calibrators, as main-sequence and giant stars, respectively, and which already have high-quality observed spectra.A transformer-based emulator, the Payne emulator, which efficiently maps stellar labels specified by macroscopic fundamental parameters, will be trained. Optimization proceeds in a few stages. (1) Stellar label optimization directly minimizes the difference between observed spectra and model spectra generated by training the Payne emulator on a grid of synthetic spectra with our current set of fundamental atomic constants. Once trained, the emulator enables rapid exploration convergence over stellar label space. Spectral line parameter optimization with a pre-trained emulator is used for fast forward modeling to substantially reduce the computation time compared to direct calculations, and parallelized JAX-enabled automatic differentiation is utilized. These will meet the UI goals of usability, accessibility, and desirability.
5. AI Modeling for Determination of Evolution of Oxygen Abundance with Redshift
Our first implementation of AI for astrophysical spectroscopy has been on the evolution of oxygen abundance with redshift z. This notation z is different from charge of an ion, and is given by
Higher z means older galaxies. We studied oxygen abundance using observations from three telescopes, JWST, VLT, and Keck, and high-accuracy data from NORAD for analysis [3]. The flux data for [O III] from 45 galaxies in three time epochs—early universe, high-z, and low-z galaxies—were taken from observations from the three telescopes. Our radiative–collisional model includes radiative transitions, collisional excitation, and electron–ion recombination from NORAD for the line ratios and plasma diagnostics. The application of line ratios for well-known oxygen abundance models by both [4] and [5] showed similar trends for the chemical evolution of oxygen with redshift. Details will be given in [3].
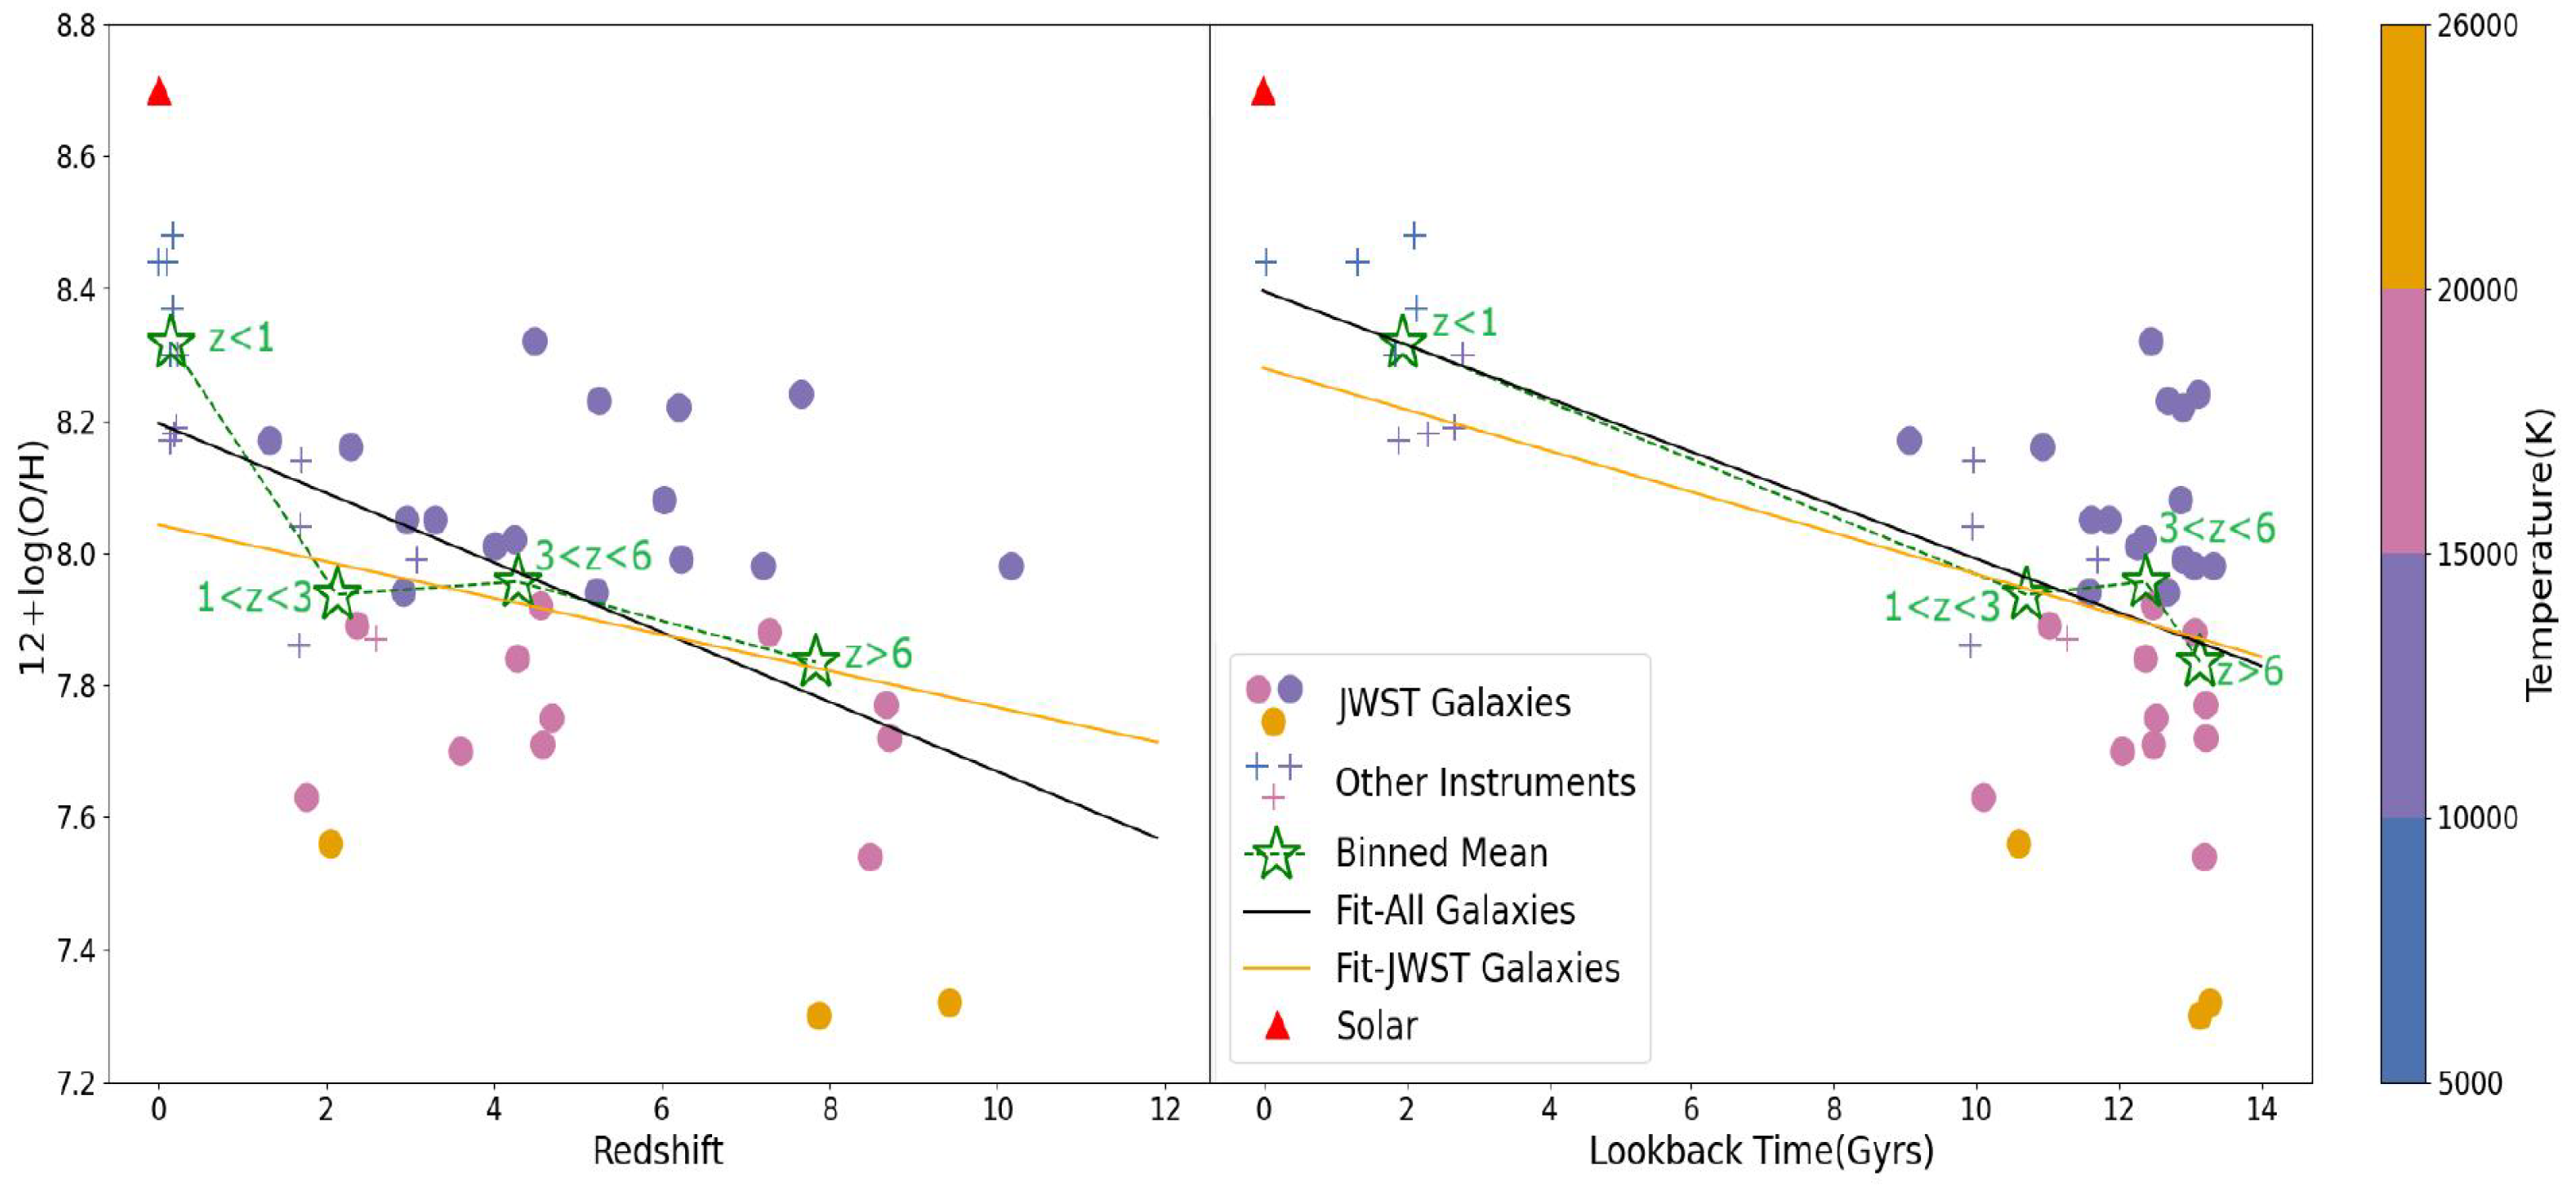
Figure 6 shows our preliminary results on oxygen abundances relative to hydrogen, O/H, varying with respect to the redshift z (left) and to lookback time in Gyrs (right). The lookback time was calculated from redshifts using the cosmological model FlatCDM cosmology created by the program Astropy Planck18.
Figure 6.
Oxygen abundance evolution with redshift (Left) and lookback time (Right) using Izotov et al. [4] oxygen abundance formula. The temperature is shown in the color-coded bar on the right. The results show redshift ranges 0 < z < 1, 1 < z < 3, 3 < z < 6, and 6 < z <11, superimposed on a linear best fit through the data (black line). Abundance trend of ground-based data from Keck and VLT instruments up to z − 3 falls within 8.5–7.9, and lie in between JWST observations of galaxies with similar redshifts.
For further analysis, ML was used to identify patterns in the parameter space and quantify predictive relationships in a few different perspectives. K-means clustering was computed using within-cluster sum of squares (WCSS), which revealed k = 3 as the optimum cluster number and clustering naturally separating galaxies by cosmic epoch with clear trends in temperature and metallicity. (Details are in Ref. [3]).
Four regression algorithms for data reduction were tried for the 45 galaxies—Ridge regression, linear regression, Random Forest, and Gradient Boosting—using z redshift and temperature as predictors.Performance was assessed with 70% of the data used for training and 30% of the data kept for testing data to evaluate the final performance. The training was split into five equal folds. Each training used four folds and one fold for cross-validation. The validation fold rotated each time for the five trainings.
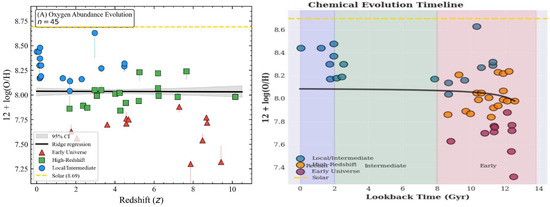
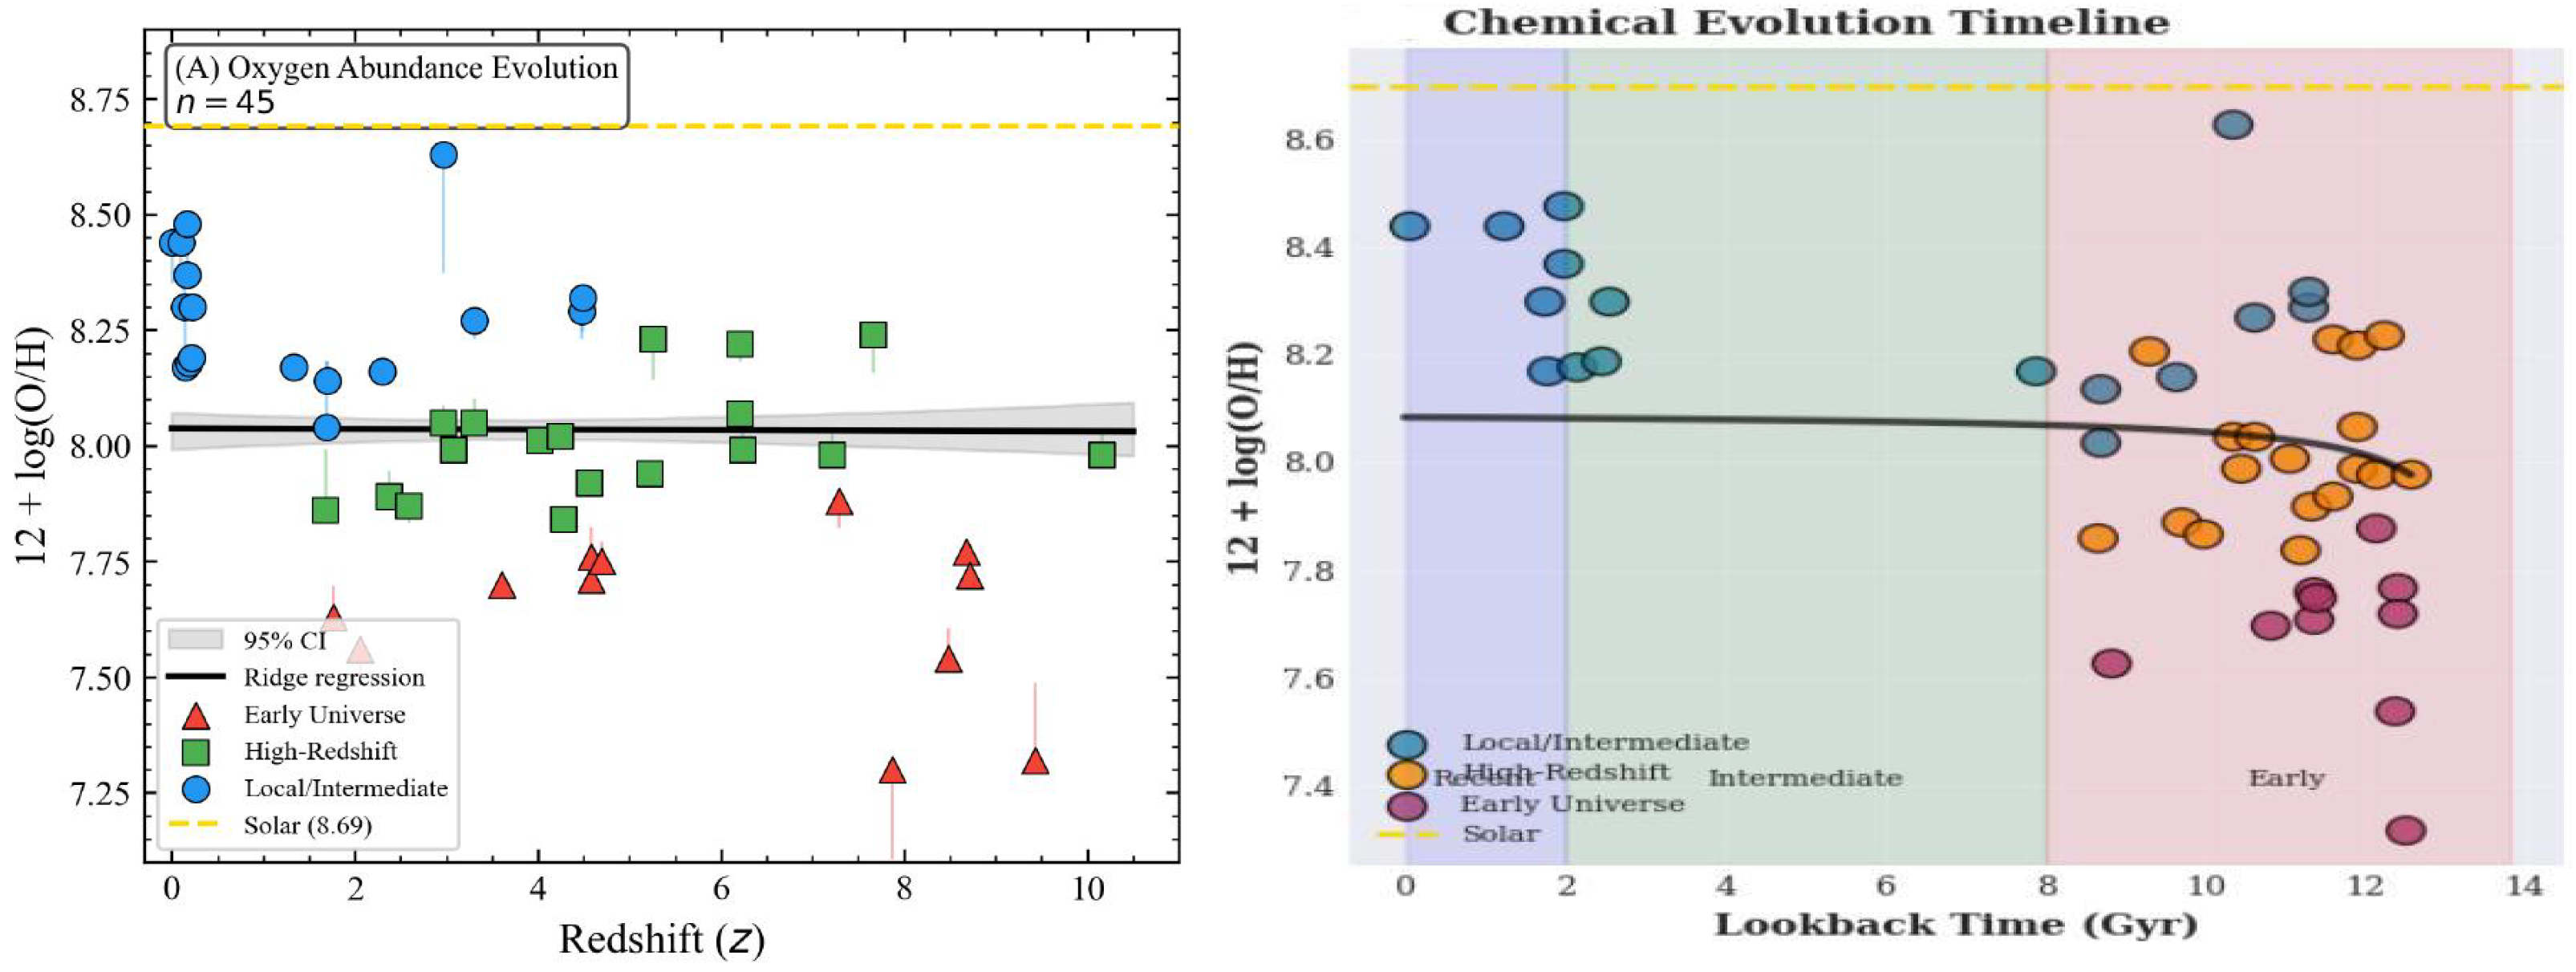
The ML regression analysis with oxygen abundance evolution is presented in Figure 7. The metric quantity of Ridge regression, , evaluates how much better the model has performed by measuring the proportion of variance in the dependent variable compared to a simple horizontal line at the mean of the target variable. , the residual sum of squares, is obtained from the sum of the squared differences between actual values and the model’s predictions. for Ridge regression is found to be 0.832 on the 30% held-out test set. It has better stability than other regressions tested. However, 5-fold cross-validation producing = 0.34 ± 0.86 indicates substantial instability across folds, attributable to the limited training sample (n = 45). The gap between the test-set and cross-validated performance reflects that the held-out test partition may not represent the full parameter range. These will be discussed in detail in [3] for final predictions.
Figure 7.
L: ML regression analysis with oxygen abundance evolution with redshift, colored by cluster membership. Ridge regression prediction (black line) with 95% bootstrap confidence interval (gray shading). Solar abundance is shown as gold dashed line near the top. Vertical lines connected to each galaxy indicate Ridge regression prediction, thus illustrating individual deviations. The scatter about the trend is comparable to or exceeds typical measurement uncertainties, particularly at z > 6, where the standard deviation within the Early Universe cluster (0.15 dex) matches the full prediction interval. R: Chemical evolution timeline with lookback time showing the trend in lower abundance with the Early Universe approaching solar abundance (gold dashed line) at local or low redshift. Shaded regions indicate cosmic epochs: Recent (blue), Intermediate (green), and Early (red) Universe.
To illustrate its practical use, we have applied the trained Ridge model to the CEERS-1019 galaxy (z = 8.679, Te = 17,000 K) using a leave-one-out procedure, withholding its measured abundance from the training set. The model predicts 12 + log(O/H) = 7.79, compared to the directly derived value of 7.77 (using the Izotov method), a residual of 0.017 dex, well within the 95% prediction interval of ±0.246 dex. This example illustrates how the model can provide a rapid abundance estimate for a galaxy.
6. Conclusions
AI will be an essential and integral part of scientific analyses of vast amounts of astrophysical data being collected. We have described and proposed a general algorithm of AI applications for atomic data generation and the study of astrophysical objects.
We have presented an example study of the chemical evolution of oxygen with galaxies at redshift of 0 to about 10. This study includes observations of O III lines from three telescopes from 45 galaxies and high-accuracy atomic data from the online database, NORAD, at the Ohio State University for line ratios and plasma diagnostics of oxygen. We find a chemical evolution trend for the oxygen abundances of 45 galaxies from which O III lines have been observed.
Despite the scatter in the derived parameters from a fairly large sample of 45 galaxies, the overall trend and redshift-averaged values appear to lead to the same conclusion of a distinct and systematic trend in the decrease in oxygen abundance with increasing redshift up to z > 10.
The results also demonstrate and confirm earlier observational work based on JWST data that metallicities in high-z galaxies were already significant before a lookback time of up to 13 Gyrs and the formation of H II regions by massive stars in the Early Universe.
We have attempted to expand the analysis, using a basic machine learning algorithm, beyond what is inferred directly from observational data that validates these trends statistically. The Ridge regression analysis achieves R2 = 0.832, confirming the strong Te-abundance anti-correlation. The comprehensive data analytics workflow developed for this study integrates atomic physics calculations, empirical calibrations, and machine learning validation, providing a reproducible framework applicable to the larger galaxy samples anticipated from upcoming JWST surveys.
While the oxygen abundance shows a distinct but slow evolution with z, more data are needed to ascertain metallicity evolution precisely. We expect to continue these studies with high-z spectra of iron and other elements.
AI is becoming more powerful and indispensable as it can access very large amounts of data and be trained. It even is trying to write programs to make itself more capable of solving problems. There is also a fear of it taking over human beings by following the logic it finds more valuable than how we view it and attempting to implement.Hence, there is a deep concern around encountering AI that may work against us, overpower us, and try to harm us.
AI does not comprehend human logic and ethics that may involve compassion, emotion, and circumstantial evaluation. The BIG question is “will AI replace human decision making?” Both sides of AI have been of great hope, concern, and debate for us. These points need to be under consideration as we improve AI for our needs.
Funding
This research was funded by NSF.
Institutional Review Board Statement
Not applicable.
Informed Consent Statement
Not applicable.
Data Availability Statement
Data for this article is available at NORAD-Atomic-Data (http://norad.astronomy.ohio-state.edu).
Acknowledgments
This work is partially supported by an NSF grant. All computations were carried out using the research grant of the Ohio Supercomputer Center, Ohio. The author would like to acknowledge the contributions of and discussions with A.K. Pradhan, M. Xu, V. Bhandari, and Y.S. Ting on oxygen abundance.
Conflicts of Interest
The funders had no role in the design of the study; in the collection, analyses, or interpretation of the data; in the writing of the manuscript; or in the decision to publish the results.
References
- Berrington, K.A.; Eissner, W.; Norrington, P.H. RMATRIX1: Belfast atomic R-matrix codes. Comput. Phys. Commun. 1995, 92, 290–420. [Google Scholar] [CrossRef] [Scilit]
- Eissner, W.; Jones, M.; Nussbaumer, H. Techniques for the calculation of atomic structures and radiative data including relativistic corrections. Comput. Phys. Commun. 1974, 8, 270–306. [Google Scholar] [CrossRef] [Scilit]
- Bhandari, V.; Xu, M.; Nahar, S.N.; Pradhan, A.K. [O III] line ratios and evolution of oxygen abundance with redshift using JWST-VLT-Keck observations. Mon. Not. R. Astron. Soc. 2026, 549, stag955. [Google Scholar] [CrossRef] [Scilit]
- Izotov, Y.I.; Stasińska, G.; Meynet, G.; Guseva, N.G.; Thuan, T.X. The chemical composition of metal-poor emission-line galaxies in the Data Release 3 of the Sloan Digital Sky Survey. Astron. Astrophys. 2006, 448, 955–970. [Google Scholar] [CrossRef] [Scilit]
- Méndez-Delgado, J.E.; Esteban, C.; García-Rojas, J.; Kreckel, K.; Peimbert, M. Temperature inhomogeneities cause the abundance discrepancy in H ii regions. Nature 2023, 618, 249–251. [Google Scholar] [CrossRef] [Scilit] [PubMed]

Disclaimer/Publisher’s Note: The statements, opinions and data contained in all publications are solely those of the individual author(s) and contributor(s) and not of MDPI and/or the editor(s). MDPI and/or the editor(s) disclaim responsibility for any injury to people or property resulting from any ideas, methods, instructions or products referred to in the content. |
© 2026 by the author. Licensee MDPI, Basel, Switzerland. This article is an open access article distributed under the terms and conditions of the Creative Commons Attribution (CC BY) license.