


Abstract
Background/Objectives: Adverse childhood experiences (ACEs) are associated with child socio-emotional difficulties, but when using parents’ reports, it remains unclear which scoring approaches are most informative about younger children. This study evaluated a Portuguese caregiver-report ACE assessment derived from the Finkelhor/Turner framework in a community sample of children aged 2–10 years. Methods: Caregivers provided reports on ACE exposure and socio-emotional adjustment for 341 children. Three ACE scores were compared: an approximate original ACE score, a full ACE pool score, and an adapted reduced caregiver-report score. Associations with socio-emotional adjustment were examined using correlations, adjusted regressions, ROC analyses, domain models, and latent class analysis. Results: Higher ACE exposure was associated with greater difficulties and lower prosocial behavior. The nine-item approximate original ACE score, which did not include emotional neglect, showed the strongest overall predictive and discriminative performance for caregiver-reported SDQ outcomes in this Portuguese sample. This finding should therefore be interpreted as evidence regarding the available approximation of conventional ACE indicators rather than the complete original ACE inventory. Among the two expanded ACE scoring approaches, however, the adapted reduced score consistently outperformed the full ACE pool, supporting a more parsimonious approach. ROC analyses indicated acceptable discrimination for elevated total difficulties, with the approximate original score showing the highest area under the curve (AUC); however, positive predictive values were low across all three scores, indicating limited stand-alone screening utility at the individual level. Domain analyses highlighted economic stressors, maltreatment, and family disorder as salient predictors. Latent class analysis identified low adversity, moderate family/economic adversity, and high polyadversity profiles. Both adversity-exposed classes showed poorer socio-emotional adjustment than the low-adversity class. Conclusions: Findings support the relevance of caregiver-report ACE assessment for understanding socio-emotional adjustment in young children, while also highlighting the need for developmentally sensitive, culturally adapted, and outcome-validated scoring approaches. More extensive ACE pools were not necessarily more informative than shorter empirically or theoretically grounded scores.
1. Introduction
Adverse childhood experiences (ACEs) refer to potentially harmful events, conditions, and relational environments occurring during childhood that may compromise developmental, psychological, and physical health. Since the original ACE Study, cumulative exposure to childhood abuse, neglect, and household dysfunction has been consistently associated with a broad range of adverse health and mental health outcomes across the life course (Felitti et al., 1998; Hughes et al., 2017; Petruccelli et al., 2019). From a developmental perspective, early adversity is not only a retrospective marker of later adult risk but may also disrupt emerging systems of emotion regulation, stress responsivity, behavior, learning, and socio-emotional adaptation during childhood itself (Shonkoff et al., 2012). Consequently, identifying children exposed to meaningful patterns of adversity is a central priority for prevention, early intervention, and trauma-informed child health and educational systems.
Despite its influence, the conventional ACE framework has important measurement limitations. The original ACE inventory was developed to examine adult health outcomes and focused primarily on maltreatment and household dysfunction. It did not emerge from a systematic empirical selection of the childhood adversities that are most predictive of child outcomes, nor did it fully capture broader domains such as peer victimization, community violence, property crime, interpersonal loss, and economic hardship (Cronholm et al., 2015; Finkelhor et al., 2013). This limitation is particularly relevant when ACEs are used for screening or risk identification in children, because the adversities that best predict concurrent child mental health may not be the same as those originally selected to predict adult morbidity and mortality.
A further challenge concerns the widespread use of cumulative ACE scores. Cumulative scores are useful because they provide a simple index of adversity burden and often show graded associations with negative outcomes. However, ACEs are not interchangeable symptoms of a single reflective latent construct; rather, they are heterogeneous exposure events and conditions that may differ in severity, timing, chronicity, relational meaning, and developmental impact. As a result, two children with the same ACE count may have experienced very different adversity profiles. This has led researchers to argue that ACE measurement should move beyond the mere accumulation of conventional ACEs and examine which adversities, domains, or profiles are most informative for child outcomes and decision-making (Finkelhor, 2018; McEwen & Gregerson, 2019). Recent critical appraisals of ACE screening have similarly cautioned that ACE scores should not be used uncritically as stand-alone clinical decision tools without evidence of predictive validity, clear referral pathways, and trauma-informed implementation (Austin et al., 2024).
Developmental timing and informant source are also central to ACE assessment. Younger children may not be able to provide valid self-reports across complex adversity domains, making caregiver-report approaches necessary in many research and applied contexts. At the same time, caregiver reports may capture some events more accurately than others and may be particularly suited to family-level adversities, caregiving disruptions, economic stressors, and observable socio-emotional outcomes. Turner et al. (2020) directly addressed this developmental issue by comparing a broad pool of 40 ACE indicators across 11 conceptual domains in younger children and older youth. Their study used caregiver reports for children under 10 years and self-reports for children aged 10 years and older and found that different 15-item sets best predicted trauma symptoms in younger versus older children. For younger children, family-related and economic adversity indicators were especially predictive, whereas community and peer violence exposures were more predictive for older youth.
The Turner et al. (2020) findings are important because they suggest that ACE screening and research instruments should be developmentally sensitive and empirically evaluated rather than assumed to generalize across age groups or informants. In their younger-child caregiver-report sample, the empirically reduced ACE measure explained substantially more variance in trauma symptoms than the original ACE measure, supporting the value of broader and age-specific adversity assessment.
However, because the empirical refinement of this ACE framework has been developed and tested primarily in U.S. youth samples, its generalizability to other countries, languages, informants, and child mental health outcomes remains insufficiently examined. Finkelhor et al. (2013) tested an expanded ACE scale in a nationally representative U.S. sample of youth aged 10 to 17 years, and Finkelhor et al. (2015) examined a revised ACE inventory using the 2014 U.S. National Survey of Children’s Exposure to Violence. Turner et al. (2020) then extended this line of work using pooled U.S. NatSCEV data to derive age-specific reduced ACE measures. Together, these studies provide a strong empirical rationale for expanding ACE assessment, but they also highlight the need to evaluate whether culturally adapted caregiver-report measures based on this framework perform similarly in non-U.S. contexts.
The present study aimed to evaluate the validity and utility of a Portuguese culturally adapted caregiver-report ACE measure based on the broader ACE framework proposed by Turner et al. (2020) in a sample of caregivers of children aged 2 to 10 years. Consistent with the community-based nature of the Finkelhor/Turner studies, the present study examined ACE assessment in a non-clinical Portuguese caregiver sample, extending this line of work to a different cultural and linguistic context. Specifically, we compared three scoring approaches: an approximate original ACE score based on the conventional ACE indicators available in the dataset, a full ACE pool score derived from the broader set of adversity indicators, and an adapted reduced Finkelhor/Turner caregiver-report score. We examined convergent and predictive validity by testing associations between caregiver-reported ACE exposure and caregiver-reported children’s socio-emotional adjustment. We further examined discriminative validity by testing whether ACE scores identified children with elevated socio-emotional difficulties. Finally, we explored whether domain-level ACE scores and latent adversity profiles provided additional information beyond cumulative ACE scores.
Based on prior evidence linking ACE exposure to child and adolescent mental health problems, we hypothesized that higher ACE scores would be associated with greater socio-emotional difficulties and lower prosocial behavior. Drawing on Turner et al. (2020), we also expected the adapted reduced Finkelhor/Turner caregiver-report score to show better or more parsimonious prediction of socio-emotional adjustment than the full ACE pool and the approximate original ACE score. Following Turner et al. (2020), the approximate original ACE score was included as a benchmark comparator; however, because the present study used a different cultural context and socio-emotional adjustment rather than trauma symptoms as the external criterion, this comparison was treated as an empirical extension rather than a direct replication. Domain-level and latent class analyses were considered exploratory. Based on Turner et al.’s findings for younger children, we expected family, economic, and maltreatment-related domains to be particularly relevant for caregiver-reported child socio-emotional adjustment.
2. Method
2.1. Participants
The initial dataset included 362 caregiver reports of children aged between 2 and 10 years. For the main adjusted analyses, the analytic sample was restricted to children with valid data on the ACE scores, SDQ outcomes, child age, and binary child gender, resulting in a final sample of 341 children. Three cases with rare gender response categories were excluded from the adjusted models to avoid unstable parameter estimates.
In the final sample, children were aged between 2 and 10 years (M = 7.46, SD = 2.11). Of these, 177 were girls (51.9%) and 164 were boys (48.1%). Caregivers had a mean age of 37.70 years (SD = 7.45; valid n = 337), with ages ranging from 20 to 68 years. Most respondents were mothers (n = 202, 59.2%), followed by fathers (n = 96, 28.2%). Smaller proportions were stepparents (n = 18, 5.3%), grandparents (n = 13, 3.8%), or other caregivers (n = 12, 3.5%).
Regarding caregivers’ educational attainment, the largest proportion had completed secondary education (n = 115, 33.7%), followed by 6 years of schooling (n = 72, 21.1%), a bachelor’s degree (n = 56, 16.4%), 9 years of schooling (n = 53, 15.5%), a master’s degree (n = 24, 7.0%), and 4 years of schooling (n = 21, 6.2%). No caregiver in the analytic sample reported holding a doctoral degree. In terms of occupational status, most caregivers were employed (n = 249, 73.0%), while 66 were unemployed (19.4%) and 26 reported another occupational situation (7.6%). Caregivers provided information on children’s adverse childhood experiences and completed the Strengths and Difficulties Questionnaire (SDQ).
2.2. Procedure
Data were collected through an anonymous online questionnaire administered via Qualtrics (Qualtrics, Provo, UT, USA) over a six-month period in 2025. Participants were recruited through multiple digital channels, including social media, mailing lists, WhatsApp parent groups, blogs, and snowball dissemination. Eligible participants were mothers, fathers, or other direct caregivers of a child aged between 2 and 10 years. When caregivers had more than one child within this age range, they were instructed to answer the questionnaire with reference to their youngest child. This decision was made to reduce ambiguity in child selection within families and to increase developmental comparability across respondents, particularly given the developmental salience of temperament during early childhood.
Before accessing the questionnaire, participants were presented with an informed consent form describing the aims of the study, the voluntary nature of participation, the anonymous handling of data, and their right to discontinue participation at any time without penalty. Contact details of the research team were provided. The study was reviewed and approved by the Ethics and Deontology Committee for Scientific Research (CEDIC), Lusófona University (approval code: CEDIC125_05.25; approved on 16 July 2025). Only those who provided informed consent were allowed to proceed to the survey.
The questionnaire included measures of adverse childhood experiences, child temperament, parenting practices, and children’s socio-emotional adjustment. To minimize participant burden and address ethical concerns related to sensitive content, particularly in the ACE items, respondents were allowed to submit the questionnaire with unanswered items. At the end of the survey, caregivers were provided with information about relevant public health, social, and child protection services that could offer support if participation raised any concerns or need for help. The contact details of the principal investigator were also provided, allowing participants to request clarification and, when appropriate, more individualized guidance regarding available sources of support. Because individual participants could not be identified in this anonymous design, individual case-level follow-up by the research team was not possible if potentially concerning responses were provided. This trade-off between protecting participant anonymity and the inability to intervene in individual cases was considered as part of the ethics-approved protocol. The full questionnaire, including the ACE items and the remaining study measures, took approximately 30 min to complete. No IP addresses or other directly identifying metadata were collected. Data were stored anonymously in encrypted folders with access restricted to the research team.
A total of 538 caregivers submitted the questionnaire. Responses were screened for completeness prior to analysis. Cases were excluded when the questionnaire was left essentially unanswered or when the proportion of missing data exceeded 15% across the survey (n = 176), resulting in a final dataset of 362 caregiver reports. This first screening step addressed overall questionnaire completeness. For the present analyses, cases were then further restricted according to variable-specific data availability, namely valid ACE scores, SDQ outcomes, child age, and binary child gender. The main adjusted analyses were therefore conducted with an analytic sample of 341 children. Cases with rare gender response categories were not included in adjusted models to avoid unstable parameter estimates, as described in the Section 2.4 Data Analysis. Figure 1 presents the flow of participants from initial questionnaire submission to the final analytic sample.
Figure 1.
Participant flow from questionnaire submission to the final analytic sample. Note. Each caregiver report referred to one target child. ACE = adverse childhood experiences; SDQ = Strengths and Difficulties Questionnaire.
2.3. Measures
Sociodemographic questionnaire. Participants completed a brief sociodemographic questionnaire developed for the present study. This section gathered information about caregiver characteristics (e.g., age, gender, educational level, and occupational status) and child characteristics (e.g., age and gender). These variables were used to describe the sample, and child age and gender were also considered in the main analyses as covariates.
Adverse Childhood Experiences. Adverse childhood experiences (ACEs) were assessed using a parent/caregiver-report version of the ACEs questionnaire based on the framework proposed by Turner et al. (2020), which was designed to assess children’s lifetime exposure to a broad range of adverse experiences across multiple domains. This version was culturally adapted to Portuguese by the authors through translation, back-translation, and review of item wording to ensure conceptual equivalence and cultural appropriateness. In the original version, the measure draws on items from the Juvenile Victimization Questionnaire, the Lifetime Childhood Adversity measure, and additional parent-screening questions, covering both victimization-related and non-victimization adversities. The Portuguese caregiver-report ACE measure used in the present analyses included 37 dichotomous adversity indicators, coded 0 = no and 1 = yes, reflecting children’s lifetime exposure to adverse experiences. Three cumulative ACE scores were computed. The approximate original ACE score included nine conventional ACE indicators: physical abuse, emotional abuse, sexual victimization, physical neglect, witnessing domestic violence, parental separation or not living with both biological parents, family mental illness, family alcohol/drug problems, and parental incarceration. Emotional neglect was not directly available and was therefore not included. The full ACE pool score included all 37 adversity indicators, covering the broader Finkelhor/Turner domains of family instability, interpersonal loss, family disorder, non-relational threat, economic stressors, maltreatment, community violence, property crime, physical assault, sexual victimization, and peer victimization. The adapted reduced Finkelhor/Turner caregiver-report ACE score followed the younger-child caregiver-report measure proposed by Turner et al. (2020), adapted to the Portuguese item pool, and included 14 indicators: child removal from the family, parental mental illness, parental job loss, welfare receipt, physical abuse, emotional abuse, parental violence or chronic conflict, witnessing weapon-related assault, theft, peer assault, sexual harassment, sexual victimization, peer physical intimidation, and peer emotional abuse. It included 14 rather than 15 indicators because the Portuguese measure contained a general peer assault item, whereas the injury-specific follow-up item asking whether the incident involved injury yielded no valid responses; peer assault with and without injury could therefore not be distinguished reliably. Higher scores indicated greater exposure to adversity. Because ACE indicators represent heterogeneous exposure events rather than interchangeable indicators of a single reflective construct (Bollen & Diamantopoulos, 2017; McEwen & Gregerson, 2019), internal consistency coefficients such as Cronbach’s alpha were not computed or interpreted for the ACE scores. Instead, validity evidence was examined through convergent, predictive, discriminative, and pattern-based analyses, as described in the Section 2.4 Data Analysis.
Socio-emotional Adjustment. Children’s socio-emotional adjustment was assessed using the Strengths and Difficulties Questionnaire (SDQ; Goodman, 2001; Portuguese version, Fleitlich et al., 2005), a widely used 25-item caregiver-report behavioral screening measure of child adjustment. Items are rated on a three-point scale and grouped into five five-item subscales: Emotional Symptoms, Conduct Problems, Hyperactivity/Inattention, Peer Problems, and Prosocial Behavior. In the present study, socio-emotional difficulties were operationalized using the Total Difficulties score, obtained by summing the 20 items from the Emotional Symptoms, Conduct Problems, Hyperactivity/Inattention, and Peer Problems subscales, excluding the five Prosocial Behavior items. Higher scores on the difficulty scales indicated greater socio-emotional difficulties, whereas higher Prosocial Behavior scores indicated more prosocial functioning. In the present sample, internal consistency was α = 0.68 for Emotional Symptoms, α = 0.86 for Conduct Problems, α = 0.79 for Hyperactivity/Inattention, α = 0.74 for Peer Problems, α = 0.91 for Prosocial Behavior, α = 0.90 for Total Difficulties, α = 0.78 for Internalizing Problems, and α = 0.89 for Externalizing Problems.
2.4. Data Analysis
All analyses were conducted in R (version 4.3.2; R Foundation for Statistical Computing, Vienna, Austria) running on Windows. Preliminary data screening included inspection of variable ranges, response coding, missing data, and consistency of ACE and SDQ item scoring. Because ACE indicators represent heterogeneous exposure events rather than reflective symptoms of a latent construct, validation analyses did not rely primarily on internal consistency estimates or confirmatory factor analysis. Instead, we evaluated the predictive, convergent, discriminative, and pattern-based validity of the ACE scores.
Three ACE scores were computed. First, an approximate original ACE score was created using the nine conventional ACE indicators available in the dataset: physical abuse, emotional abuse, sexual victimization, physical neglect, witnessing domestic violence, parental separation or not living with both biological parents, family mental illness, family alcohol/drug problems, and parental incarceration. Emotional neglect was not directly available and was therefore not included. Second, a full ACE pool score was computed from 37 adversity indicators available in the broader item pool. Third, an adapted reduced Finkelhor caregiver-report ACE score was computed using the items corresponding to the reduced caregiver-report version proposed for younger children. Because the dataset included one general peer assault item rather than separate peer assault indicators with and without injury, the adapted reduced score included 14 indicators. Because ACE indicators represent heterogeneous exposure events rather than interchangeable reflective indicators of a single latent construct (Bollen & Diamantopoulos, 2017; McEwen & Gregerson, 2019), missing ACE items were not treated as absence of exposure, and no imputation or prorating was used when computing the ACE scores. For each score, participants were assigned a valid value only when all required items for that score were available. If one or more required items were missing, the corresponding ACE score was coded as missing. This conservative approach was used to avoid assuming non-exposure for unanswered ACE items or estimating exposure counts from qualitatively different adversity indicators. In the retained dataset of 362 caregiver reports, valid scores were available for 354 participants on the approximate original ACE score, 344 on the full ACE pool score, and 352 on the adapted reduced Finkelhor/Turner score. To ensure that comparisons across the three ACE scoring approaches were based on the same participants, the main adjusted analyses used a common analytic sample with valid data on the ACE scores, SDQ outcomes, child age, and binary child gender, resulting in N = 341.
Descriptive statistics were calculated for all ACE scores, ACE domains, and SDQ outcomes. Spearman correlations were used to examine associations among the ACE scores and between ACE scores and SDQ outcomes, given the ordinal/count nature and skewed distribution of ACE exposure scores.
Predictive validity was examined using linear regression models with SDQ outcomes as dependent variables. Outcomes included emotional symptoms, conduct problems, hyperactivity/inattention, peer problems, prosocial behavior, total difficulties, internalizing problems, and externalizing problems. For each outcome, a baseline model including child age and binary child gender was compared with models adding each ACE score separately. Predictive performance was evaluated using R2, adjusted R2, change in R2 relative to the baseline model, Akaike information criterion (AIC), and Bayesian information criterion (BIC). ACE predictors were standardized in regression models to facilitate comparison across scores. Cases with rare gender response categories were excluded from adjusted models to avoid unstable parameter estimates. The main adjusted analyses were conducted using complete cases with valid data on ACE scores, SDQ outcomes, child age, and binary child gender.
Several robustness and complementary analyses were performed. First, the main adjusted models comparing the full ACE pool and the reduced Finkelhor score were repeated using heteroskedasticity-consistent robust standard errors (HC3). Second, sensitivity analyses were conducted after excluding 10-year-old children, restricting the sample to children aged 2–9 years, to align with the original caregiver-report age range. The 2–10-year age range was defined a priori to reflect the Portuguese caregiver-report recruitment context, in which parent groups are often organized around preschool and primary-school settings rather than exact child age. Because children who had recently turned 10 could belong to the same primary-school cohorts as 9-year-old children, excluding them solely on the basis of age would have introduced an unnecessarily restrictive and contextually artificial eligibility boundary. Third, ACE domain scores were created from the full item pool and grouped into 11 theoretically defined domains: family instability, interpersonal loss, family disorder, non-relational threat, economic stressors, maltreatment, community violence, property crime, physical assault, sexual victimization, and peer victimization. Each domain score reflected the number of adverse experiences within that domain. Each domain was tested separately as a predictor of SDQ outcomes in models adjusted for child age and gender. A multidomain model including all domains simultaneously was also estimated, with variance inflation factors examined to assess multicollinearity.
Discriminative validity was examined using receiver operating characteristic (ROC) analyses. Elevated SDQ total difficulties were defined as scores in the top 10% of the analytic sample. Area under the curve (AUC) values and 95% confidence intervals were estimated for the approximate original ACE score, full ACE pool score, and reduced Finkelhor score. AUCs were compared using DeLong tests. Optimal cut-offs were identified using Youden’s index, and sensitivity, specificity, positive predictive value, and negative predictive value were calculated. Logistic regression models were then used to estimate odds ratios for elevated SDQ total difficulties based on the derived high-ACE cut-offs.
Finally, an exploratory domain-based latent class analysis (LCA) was conducted to identify patterns of adversity exposure. For this analysis, the 37 ACE indicators from the full pool were aggregated into 11 theoretically defined adversity domains. Each domain was coded as a binary indicator reflecting the absence versus presence of at least one adverse experience within that domain. This domain-level approach was used to reduce model complexity, avoid sparse item-response patterns, and improve the interpretability of the resulting adversity profiles. Models with one to five classes were estimated using multiple random starts. Model selection considered AIC, BIC, sample-size adjusted BIC, entropy, average posterior classification probabilities, class sizes, and substantive interpretability. After selecting the optimal class solution, classes were compared on SDQ outcomes using linear models adjusted for child age and gender. Pairwise class comparisons were conducted using Tukey-adjusted estimated marginal means, and partial eta squared was calculated as an effect size for the overall class effect. All statistical tests were two-tailed, with significance set at p < 0.05. Given the number of outcomes and complementary analyses conducted, the possibility of inflated Type I error was considered when interpreting the findings. Because the main aim was to compare the relative performance of alternative ACE scoring approaches, and because the domain-level and latent class analyses were exploratory, no global Bonferroni correction was applied. Results were therefore interpreted with attention to the consistency of findings across outcomes, effect sizes, model fit and discrimination indices, and the distinction between planned score comparisons and exploratory analyses, rather than isolated p-values.
3. Results
3.1. Descriptive Statistics and Preliminary Associations
The main analytic sample included 341 caregiver reports of children aged 2 to 10 years with valid data on the ACE scores, SDQ outcomes, child age, and binary child gender. Three ACE scores were computed: an approximate original ACE score, a full ACE pool score, and an adapted reduced Finkelhor caregiver-report ACE score. The approximate original ACE score included nine conventional ACE indicators available in the dataset, as emotional neglect was not directly assessed. The full ACE pool score included 37 adversity indicators. The adapted reduced Finkelhor score included 14 indicators, as the dataset included one general peer assault item rather than separate indicators for peer assault with and without injury. Descriptive statistics for the three ACE scores and their Spearman correlations with SDQ outcomes are presented in Table 1.
Table 1.
Descriptive statistics and Spearman correlations between ACE scores and SDQ outcomes.
The approximate original ACE score had a mean of 2.14, a median of 1, and a maximum score of 9. The full ACE pool score had a mean of 7.94, a median of 4, and a maximum score of 29. The adapted reduced Finkelhor score had a mean of 3.16, a median of 1, and a maximum score of 12. Spearman correlations showed that higher ACE scores were generally associated with greater SDQ difficulties and lower prosocial behavior. The approximate original ACE score showed the strongest associations with most SDQ outcomes, including conduct problems, ρ = 0.423, total difficulties, ρ = 0.394, peer problems, ρ = 0.378, internalizing problems, ρ = 0.316, externalizing problems, ρ = 0.382, and prosocial behavior, ρ = −0.537. The full ACE pool score was significantly associated with all SDQ outcomes except emotional symptoms, whereas the reduced Finkelhor score was significantly associated with all SDQ outcomes. Emotional symptoms showed the weakest associations across the three ACE scores.
The three ACE scores were strongly intercorrelated. The approximate original ACE score correlated highly with the full ACE pool score, ρ = 0.872, p < 0.001, and with the adapted reduced Finkelhor/Turner score, ρ = 0.806, p < 0.001. The full ACE pool score also correlated very strongly with the adapted reduced Finkelhor/Turner score, ρ = 0.916, p < 0.001. These correlations indicate substantial overlap among the three scoring approaches and suggest that the subsequent predictive comparisons should be interpreted as comparisons among highly related, non-independent ACE scores.
3.2. Predictive Validity of the ACE Scores
Adjusted linear regression models were used to compare the predictive performance of the approximate original ACE score, the full ACE pool score, and the adapted reduced Finkelhor score. All models controlled for child age and binary gender. The analytic sample for these adjusted models included 341 children. The adjusted regression models comparing the three ACE scores across SDQ outcomes are presented in Table 2.
Table 2.
Adjusted predictive models comparing ACE scores across SDQ outcomes.
Across all SDQ outcomes, the approximate original ACE score showed the strongest predictive performance, as indicated by the highest R2 values and the lowest AIC and BIC values. For SDQ total difficulties, the baseline model including age and gender explained 10.7% of the variance. Adding the approximate original ACE score increased explained variance to 20.6%, ΔR2 = 0.100. In comparison, the full ACE pool score increased explained variance to 15.6%, ΔR2 = 0.049, and the reduced Finkelhor score increased explained variance to 17.1%, ΔR2 = 0.064. Thus, for total difficulties, the approximate original ACE score was the strongest predictor, followed by the reduced Finkelhor score and then the full ACE pool score.
A similar pattern was observed across the remaining SDQ outcomes. The approximate original ACE score outperformed both the full ACE pool and the reduced Finkelhor score for emotional symptoms, conduct problems, hyperactivity/inattention, peer problems, prosocial behavior, internalizing problems, and externalizing problems. Among the two Finkelhor-derived scores, however, the reduced Finkelhor score consistently outperformed the full ACE pool score across all SDQ outcomes. This was reflected in higher R2 values and lower AIC and BIC values for the reduced score compared with the full pool.
For example, for conduct problems, the R2 values were 0.269 for the approximate original ACE score, 0.237 for the full ACE pool, and 0.242 for the reduced Finkelhor score. For peer problems, R2 values were 0.214, 0.182, and 0.193, respectively. For prosocial behavior, R2 values were 0.374 for the approximate original ACE score, 0.308 for the full ACE pool, and 0.309 for the reduced Finkelhor score. Overall, these results suggest that the approximate original ACE score had the strongest predictive validity in this sample, while the reduced Finkelhor score provided a more parsimonious and more predictive alternative to the full ACE pool.
Robustness analyses using heteroskedasticity-consistent standard errors supported the same pattern for the comparison between the full ACE pool and the reduced Finkelhor score. The ACE coefficients remained statistically significant for all SDQ outcomes except emotional symptoms, and the reduced Finkelhor score continued to show better model fit than the full ACE pool. A sensitivity analysis restricted to children aged 2 to 9 years also yielded the same pattern: the reduced Finkelhor score outperformed the full ACE pool across all SDQ outcomes. Therefore, the full 2–10-year-old caregiver-reported sample was retained as the primary analytic sample.
3.3. Discriminative Validity for Elevated SDQ Total Difficulties
ROC analyses were conducted to examine the ability of the three ACE scores to identify children with elevated SDQ total difficulties. Elevated total difficulties were defined as scores in the top 10% of the analytic sample. The resulting cut-off was TTDIF ≥ 26, identifying 39 children, corresponding to 11.4% of the analytic sample. ROC results, optimal cut-offs, and classification indices are presented in Table 3.
Table 3.
ROC analyses and high-ACE cut-offs for elevated SDQ total difficulties.
The approximate original ACE score showed the highest discriminative performance, with an AUC of 0.807, 95% CI [0.757, 0.857]. The full ACE pool score showed an AUC of 0.745, 95% CI [0.687, 0.804], and the adapted reduced Finkelhor score showed an AUC of 0.726, 95% CI [0.656, 0.797]. DeLong tests indicated that the approximate original ACE score had significantly higher discriminative accuracy than both the full ACE pool score, p < 0.001, and the adapted reduced Finkelhor score, p < 0.001. The AUC difference between the full ACE pool score and the adapted reduced Finkelhor score was not statistically significant, p = 0.224.
Optimal cut-offs based on Youden’s index were ≥2 for the approximate original ACE score, ≥6 for the full ACE pool score, and ≥2 for the adapted reduced Finkelhor score. The approximate original ACE cut-off identified 36 of the 39 children with elevated total difficulties, corresponding to sensitivity of 0.923 and specificity of 0.639. The full ACE pool cut-off also identified 36 of the 39 elevated cases, with sensitivity of 0.923 and specificity of 0.626. The adapted reduced Finkelhor cut-off identified 35 of the 39 elevated cases, with sensitivity of 0.897 and specificity of 0.560. Despite these high sensitivity values, positive predictive values were low across the three scores (0.248 for the approximate original ACE score, 0.242 for the full ACE pool score, and 0.208 for the adapted reduced Finkelhor score). This indicates that many children classified above the ACE cut-offs did not meet the elevated SDQ total difficulties criterion. In contrast, negative predictive values were high (0.985, 0.984, and 0.977, respectively), suggesting that the scores were more informative for ruling out elevated total difficulties when ACE exposure was below the cut-off than for confirming elevated difficulties when ACE exposure was above the cut-off.
Logistic regression models showed that children scoring above the approximate original ACE cut-off had substantially higher odds of elevated SDQ total difficulties, OR = 21.25, 95% CI [7.44, 89.53], p < 0.001. Similar effects were observed for the full ACE pool cut-off, OR = 20.07, 95% CI [7.04, 84.55], p < 0.001, and the adapted reduced Finkelhor cut-off, OR = 11.12, 95% CI [4.31, 37.89], p < 0.001. Thus, although all three scores showed meaningful group-level discriminative validity, the low positive predictive values indicate that these cut-offs have limited utility as stand-alone individual screening tools.
3.4. ACE Domains as Predictors of SDQ Outcomes
The 37 ACE indicators from the full pool were grouped into 11 theoretically defined domains: family instability, interpersonal loss, family disorder, non-relational threat, economic stressors, maltreatment, community violence, property crime, physical assault, sexual victimization, and peer victimization. The prevalence of each ACE domain in the analytic sample is presented in Table 4.
Table 4.
ACE domain prevalence.
The most prevalent domain was interpersonal loss, reported for 57.5% of children. This was followed by family disorder (50.1%), economic stressors (49.9%), physical assault (48.7%), property crime (43.7%), maltreatment (41.9%), family instability (38.7%), community violence (32.8%), peer victimization (32.6%), non-relational threat (14.4%), and sexual victimization (12.9%).
When tested separately in models adjusted for child age and binary gender, economic stressors emerged as the strongest domain predictor for total difficulties, conduct problems, peer problems, internalizing problems, and externalizing problems. Maltreatment was the strongest domain predictor of prosocial behavior, whereas family disorder was the strongest predictor of hyperactivity/inattention. For emotional symptoms, non-relational threat showed the largest incremental contribution, although the association was negative and should therefore be interpreted cautiously. The strongest ACE domain predictors for each SDQ outcome are presented in Table 5.
Table 5.
Strongest ACE domain predictors across SDQ outcomes.
These findings suggest that economic stressors, family disorder, and maltreatment were particularly salient correlates of caregiver-reported child difficulties in this sample.
A multidomain model including all 11 domains simultaneously was also estimated. Variance inflation factors were below conventional thresholds, with the highest VIF observed for maltreatment (VIF = 3.80), indicating acceptable levels of multicollinearity. The multidomain models explained substantial variance in SDQ outcomes, including 37.32% of variance in total difficulties, 39.22% in conduct problems, 33.15% in peer problems, 44.18% in prosocial behavior, and 36.76% in externalizing problems. However, some domains showed negative coefficients in the multidomain models, likely reflecting suppression effects due to the intercorrelations among adversity domains. Therefore, these multidomain findings were interpreted cautiously and considered complementary to the separate domain models.
3.5. Exploratory Domain-Based Latent Class Analysis
An exploratory latent class analysis was conducted using 11 binary ACE domain indicators. Models with one to five classes were estimated. Fit indices for the one- to five-class solutions are presented in Table 6. The three-class solution was selected as the most parsimonious and interpretable solution. Although AIC and sample-size adjusted BIC continued to decrease with additional classes, the three-class solution had the lowest BIC, good entropy, and adequate class sizes. The three-class model had entropy = 0.845, with average posterior classification probabilities ranging from 0.893 to 0.957.
Table 6.
Fit indices for domain-based latent class models.
The three classes were labelled as follows: Low adversity, Moderate family/economic adversity, and High polyadversity. The Low adversity class included 165 children (48.4%) and was characterized by low probabilities across most ACE domains. The Moderate family/economic adversity class included 83 children (24.3%) and showed moderate probabilities of family instability, interpersonal loss, family disorder, economic stressors, maltreatment, property crime, physical assault, and peer victimization. The High polyadversity class included 93 children (27.3%) and showed high probabilities across most domains, including family instability, interpersonal loss, family disorder, economic stressors, maltreatment, community violence, property crime, physical assault, and peer victimization. Adjusted comparisons of SDQ outcomes across these three latent adversity classes are presented in Table 7.
Table 7.
SDQ outcomes by latent adversity class.
Class membership was significantly associated with all SDQ outcomes after adjustment for child age and gender. The strongest class effects were observed for prosocial behavior, partial η2 = 0.220, conduct problems, partial η2 = 0.171, peer problems, partial η2 = 0.140, total difficulties, partial η2 = 0.129, and externalizing problems, partial η2 = 0.125.
Children in the Low adversity class had consistently better SDQ outcomes than children in both adversity-exposed classes. For SDQ total difficulties, the Low adversity class had a mean score of 11.33, compared with 16.67 in the Moderate family/economic adversity class and 17.06 in the High polyadversity class. Tukey-adjusted comparisons showed that the Low adversity class differed significantly from both the Moderate family/economic adversity class and the High polyadversity class, whereas the two adversity-exposed classes did not differ significantly from each other on total difficulties.
A similar pattern was observed for conduct problems, hyperactivity/inattention, peer problems, internalizing problems, and externalizing problems. For prosocial behavior, however, all three classes differed significantly from each other. The Low adversity class had the highest prosocial behavior scores, followed by the Moderate family/economic adversity class, whereas the High polyadversity class had the lowest scores. This suggests that while moderate and high adversity profiles were similarly associated with broad child difficulties, high polyadversity was particularly associated with lower prosocial behavior.
4. Discussion
The present study evaluated the validity and utility of a Portuguese culturally adapted caregiver-report ACE measure derived from the broader Finkelhor/Turner framework in a community sample of caregivers of children aged 2 to 10 years. Overall, the findings support the relevance of ACE assessment for understanding children’s socio-emotional adjustment in a non-clinical Portuguese sample. Higher ACE exposure was generally associated with greater socio-emotional difficulties and lower prosocial behavior, consistent with the broader literature linking childhood adversity to mental health and developmental risk (Hughes et al., 2017; Petruccelli et al., 2019). Importantly, the study also showed that the way ACEs are scored matters: different scoring approaches produced different levels of predictive and discriminative performance.
4.1. Predictive and Discriminative Performance of the ACE Scores
A central finding was that, across the three scoring approaches, the nine-item approximate original ACE score showed the strongest overall predictive performance for caregiver-reported SDQ outcomes, outperforming both the full ACE pool and the adapted reduced Finkelhor/Turner score in this Portuguese community sample. Because emotional neglect was not available, this score should be understood as an approximation of conventional ACE indicators rather than a direct replication of the complete original 10-item ACE inventory. This pattern contrasts with Turner et al. (2020), who found that their empirically reduced 15-item ACE measures predicted trauma symptoms better than the original ACE measure in both younger and older children. In the present study, the approximate original ACE score was the strongest predictor of broad caregiver-reported socio-emotional adjustment, including total difficulties, conduct problems, peer problems, prosocial behavior, internalizing problems, and externalizing problems. This may indicate that the conventional ACE indicators available in this dataset captured a particularly salient set of family- and maltreatment-related adversities for caregiver-rated child adjustment in this Portuguese community sample. However, this divergence from Turner et al. should be interpreted in light of important methodological differences, including cultural context, caregiver-report assessment, and especially the external criterion used: Turner et al. focused on trauma symptoms, whereas the present study examined broader socio-emotional adjustment as measured by the SDQ. Thus, the present findings should not be interpreted as establishing the general superiority of the original ACE approach. Rather, they indicate that the available nine-item approximation of conventional family- and maltreatment-related ACE indicators was particularly informative for caregiver-reported socio-emotional adjustment in this specific cultural, informant, and outcome context.
One possible interpretation is that the approximate original ACE score may have performed well because several of its indicators reflect family-context adversities and maltreatment experiences that are highly visible to caregivers and closely linked to child behavioral and relational functioning. The original ACE framework includes physical abuse, emotional abuse, sexual abuse, physical neglect, witnessing domestic violence, parental separation, family mental illness, substance problems, and parental incarceration. Although this set is narrower than the full Finkelhor/Turner pool, it may capture high-impact family and caregiving risks that are especially relevant to caregiver-reported socio-emotional adjustment. This is consistent with Turner et al.’s finding that conventional ACEs such as physical and emotional abuse remained important predictors, even when broader adversity domains were considered.
At the same time, the findings do not support a simple return to the original ACE framework as sufficient. Among the two Finkelhor-derived scores, the adapted reduced Finkelhor/Turner score consistently outperformed the full ACE pool across all SDQ outcomes. This finding is consistent with the broader measurement argument advanced by Finkelhor and colleagues: ACE assessment should not rely simply on the accumulation of more adversity indicators, but should evaluate which adversities add predictive value for specific developmental periods, informants, and outcomes. Earlier work by Finkelhor et al. (2013, 2015) showed that expanding the original ACE framework to include adversities such as peer victimization, community violence, and socioeconomic adversity can improve prediction. Turner et al. (2020) extended this approach by starting from a broad pool of ACEs and deriving reduced age-specific measures based on predictive performance. In line with this rationale, the present findings suggest that a broad ACE pool may be useful for comprehensive assessment and item selection, but that a shorter empirically informed score may provide a more parsimonious and more predictive alternative for research and screening purposes.
However, the practical magnitude of these gains should not be overstated. From an applied assessment perspective, the usefulness of a predictive score does not depend only on whether it performs better statistically, but also on the size of that improvement, the burden of obtaining and implementing the information, and its value for the intended assessment purpose (Hunsley & Meyer, 2003). In the present study, the adapted reduced Finkelhor/Turner score consistently showed better model fit than the full ACE pool, but the gains in explained variance were modest for several outcomes. Thus, the main practical implication is one of parsimony and predictive efficiency: a shorter set of indicators may reduce respondent burden while retaining, and in some cases slightly improving, predictive performance relative to a larger item pool. This psychometric advantage should therefore not be equated with demonstrated clinical or individual-level decision utility. Any applied use of ACE score cut-offs would require evidence that score-based decisions improve assessment, referral, or intervention processes relative to usual practice while adequately considering the consequences of false-positive and false-negative classifications (Sachs et al., 2020; Vickers et al., 2019).
Thus, the present results partially extend Turner et al. (2020). The adapted reduced Finkelhor/Turner score did not outperform the approximate original ACE score, but it did provide a more parsimonious and more predictive alternative to the full ACE pool. This distinction is important. It suggests that the empirical value of the Finkelhor/Turner approach may lie less in simply expanding ACE assessment and more in identifying which adversity indicators are most informative for a given developmental period, informant, cultural context, and outcome. In this sense, the findings support the broader principle that ACE measures should be empirically evaluated rather than assumed to generalize across settings, informants, and outcomes. This is consistent with prior work showing that expanded ACE measures can improve prediction when they include developmentally relevant adversities, such as peer victimization, community violence, and socioeconomic adversity, but also with cautions that ACE scores should not be treated as universally valid clinical screening tools without context-specific validation (Finkelhor et al., 2013).
The ROC analyses further clarify both the potential and the limits of these scoring approaches. All three ACE scores showed meaningful discrimination for elevated SDQ total difficulties, with AUC values in the acceptable range. The approximate original ACE score showed the highest AUC and was significantly more discriminative than both the full ACE pool and the adapted reduced Finkelhor/Turner score. However, the full ACE pool and adapted reduced score did not differ significantly from each other in AUC. These findings suggest that cumulative ACE scores may be useful as broad indicators of elevated socio-emotional risk, but they should be interpreted cautiously at the individual level. In the present study, all high-ACE cut-offs had high negative predictive values but low positive predictive values. This means that low ACE scores were relatively useful for ruling out elevated difficulties, whereas high ACE scores often identified children who did not meet the elevated SDQ total difficulties threshold. These findings therefore support the use of ACE scores as broad group-level indicators of socio-emotional risk, but not as stand-alone individual screening or referral tools. This pattern is consistent with evidence that ACE scores have stronger utility for population-level risk stratification than for precise individual-level prediction (Baldwin et al., 2021; Meehan et al., 2022), and with recent critical appraisals cautioning against the use of ACE screening as a stand-alone clinical decision tool (Austin et al., 2024). It also highlights the heterogeneity of children’s responses to adversity: not all children with high ACE exposure show elevated socio-emotional difficulties, which is consistent with resilience research demonstrating that protective factors, such as supportive relationships, trusted adults, positive childhood experiences, and child, family, school, and community resources, may buffer or modify the effects of adversity (Bellis et al., 2017; Bethell et al., 2019; Gartland et al., 2019). More specifically, the growing literature on Positive Childhood Experiences (PCEs) and Benevolent Childhood Experiences (BCEs) helps distinguish exposure to adversity from the presence of protective and promotive experiences that may support positive adaptation, thereby offering a useful counterbalance to deterministic interpretations of ACE scores (Bellis et al., 2017; Bethell et al., 2019; Crandall et al., 2019; Narayan et al., 2018). Because protective mechanisms were not directly examined in the present analyses, high ACE scores should be understood as indicators of possible risk rather than deterministic markers of impairment. Future research should therefore examine ACE scores jointly with PCEs, BCEs, family resources, and contextual supports.
4.2. ACE Domains and SDQ Outcomes
The domain-level analyses provided further insight into which forms of adversity were most salient in this caregiver-report sample. Economic stressors emerged as the most consistent domain predictor, particularly for total difficulties, conduct problems, peer problems, internalizing problems, and externalizing problems. This finding aligns with Turner et al. (2020), who found that economic stressors were particularly relevant for younger children, and with family stress models suggesting that economic hardship may affect child adjustment through parental psychological distress, interparental conflict, and disrupted parenting practices (Conger et al., 1994; Masarik & Conger, 2017). Longitudinal evidence also supports economic pressure as a pathway linking socioeconomic adversity to child and adolescent adjustment difficulties (Neppl et al., 2015). Because the present outcomes captured caregiver-reported socio-emotional adjustment rather than trauma symptoms specifically, economic adversity may have been reflected not only in trauma-related distress, but also in everyday behavioral, peer, and family functioning.
At the same time, the prominence of economic stressors should not be interpreted as evidence that maltreatment, neglect, or victimization experiences are less clinically important. This pattern may partly reflect the community-based and caregiver-report nature of the sample, because economic hardship may be more observable, reportable, and less socially stigmatizing for caregivers to disclose than maltreatment-related experiences. Caregiver reports may also underestimate adversities that occur outside the home or within the caregiving context, particularly maltreatment-related ACEs (Chan, 2015; Cooley & Jackson, 2022; Kobulsky et al., 2017; Stewart-Tufescu et al., 2022). Replication in higher-risk samples and with multi-informant designs is therefore needed to determine whether maltreatment, neglect, or other victimization domains become more prominent when exposure is assessed in more vulnerable populations or through less caregiver-dependent reporting methods.
Maltreatment was most strongly associated with lower prosocial behavior, whereas family disorder was most strongly associated with hyperactivity/inattention, reinforcing the importance of family and caregiving contexts for children’s regulatory, relational, and socio-emotional functioning. Maltreatment-related experiences may interfere with empathy, trust, cooperative behavior, and emotion regulation, which are central to prosocial functioning (Berzenski & Yates, 2022; Chen et al., 2023; Cigala & Mori, 2022; Song et al., 2018). Family disorder may contribute to attentional and behavioral dysregulation through caregiver psychological distress, parental psychopathology, substance-related problems, family stress, and reduced caregiving consistency (Anderson et al., 2023; Cheung & Theule, 2016). Finally, the negative association observed for non-relational threat and emotional symptoms should not be interpreted as protective. Given the low prevalence of this domain, its weak explanatory contribution, and the suppression effects observed in multidomain models, this finding is more likely to reflect statistical instability, residual confounding, or overlap among adversity domains (Babyak, 2004; Kim, 2019; Maassen & Bakker, 2001). This cautious interpretation is also consistent with Turner et al. (2020), who found that non-relational threat indicators, such as natural disaster, bad accident, and serious illness, were not significantly related to trauma symptoms in either younger or older children within their domain-based analyses.
4.3. Latent Adversity Profiles and SDQ Outcomes
The exploratory latent class analysis complemented the cumulative and domain-level findings by showing that adversity exposure clustered into meaningful profiles rather than reflecting only a single cumulative burden. This supports the value of person-centered approaches for identifying configurations of adversity that may be obscured by total ACE counts, and is consistent with prior research showing that children and adolescents can be grouped into distinct adversity profiles with different mental health correlates (Parnes & Schwartz, 2022).
A particularly important finding was that the Moderate family/economic adversity and High polyadversity classes did not differ significantly from each other on most difficulty outcomes. This pattern suggests that moderate adversity concentrated in family and economic domains may already be sufficient to confer substantial socio-emotional risk in younger children, rather than risk increasing only when adversity becomes broadly multidomain. This interpretation is consistent with person-centered ACE research showing that risk is not always a simple linear function of the total number or breadth of adversities, and that moderate or family/economic adversity profiles may carry risks comparable to broader high-adversity profiles for some child outcomes (Clifford et al., 2023; Lanier et al., 2017).
However, the distinct pattern observed for prosocial behavior suggests that broader multidomain adversity may be particularly relevant for positive social functioning and adaptive relational development, not only for symptoms or difficulties. From an applied perspective, this distinction is important because prosocial behavior reflects social competence and adaptive functioning, which may be key targets for prevention and intervention.
4.4. Implications for ACE Assessment and Screening
Taken together, these findings have several implications for ACE assessment and screening. First, they suggest that caregiver-report ACE assessment can provide meaningful information about socio-emotional risk in Portuguese community samples. Second, they indicate that broader ACE pools should not be assumed to be superior simply because they include more items. In this study, the full ACE pool was less predictive than both the approximate original ACE score and the adapted reduced Finkelhor/Turner score. Third, the findings support the need to evaluate ACE measures against specific outcomes and populations before using them for screening, referral, or intervention planning. This point is consistent with recent cautions that ACE screening should be embedded within trauma-informed systems, supported by clear referral pathways, and used as one component of broader psychosocial assessment rather than as a stand-alone risk algorithm (Austin et al., 2024).
The study also contributes to the cross-cultural extension of the Finkelhor/Turner framework. Whereas the original Turner et al. (2020) analyses were based on pooled U.S. population survey data, the present study examined a culturally adapted Portuguese caregiver-report version in a non-clinical community sample. The results show both convergence and divergence. Consistent with Turner et al., the reduced Finkelhor/Turner approach was more informative than the full ACE pool and family/economic adversities were especially salient. In contrast, the approximate original ACE score performed better than the adapted reduced score in predicting broad socio-emotional adjustment. This divergence may reflect differences in cultural context, sampling, informant interpretation, item adaptation, or criterion outcome. It may also reflect the fact that the SDQ captures broad behavioral and relational functioning, whereas Turner et al. focused specifically on trauma symptoms.
4.5. Limitations and Future Directions
Several limitations should be considered. First, the study used a cross-sectional design, which prevents causal inference. ACE exposure and socio-emotional adjustment were assessed at the same time, and associations cannot establish temporal ordering or mechanisms. In addition, the number of statistical tests conducted across multiple SDQ outcomes, ACE scoring approaches, domain models, ROC analyses, and latent class comparisons increases the possibility of Type I error. This issue is particularly relevant for the exploratory domain-level and person-centered analyses. These findings should therefore be interpreted as hypothesis-generating and require replication in independent samples. Second, all information was provided by caregivers, which may introduce shared-method variance and reporting bias. Because ACE exposure and socio-emotional adjustment were reported by the same caregiver at the same time, associations may partly reflect same-informant effects or informant-specific response tendencies, rather than only substantive exposure-outcome associations (Podsakoff et al., 2003, 2012). This concern is particularly relevant in child socio-emotional assessment, where parent, teacher, and child/youth reports often show meaningful discrepancies, reflecting both informant-specific perspectives and context-specific observations (De Los Reyes et al., 2022; De Los Reyes & Epkins, 2023). Caregiver depressive symptoms may also influence ratings of child emotional and behavioral problems, including SDQ-based assessments (Madsen et al., 2019), and may contribute to discrepancies between caregiver and child reports (Liskola et al., 2021). For these reasons, the comparative performance of the ACE scores should be interpreted specifically as caregiver-report predictive performance and should not be assumed to generalize to child self-reports, teacher reports, clinician-rated outcomes, or administrative records. In relation to ACE exposure specifically, caregivers may be more aware of some adversities than others, particularly family-level and observable events, and may underreport or be unaware of experiences such as peer victimization, sexual victimization, or events occurring outside the home. This limitation is particularly relevant for maltreatment-related ACEs, because caregivers may minimize, omit, or be unaware of abuse, neglect, domestic violence, or other sensitive experiences, especially when these occur within the caregiving context or involve household members. Parent/caregiver reports of maltreatment are known to show discrepancies with child reports and other sources, suggesting that caregiver-reported ACE data may underestimate some forms of victimization (Chan, 2015; Cooley & Jackson, 2022; Kobulsky et al., 2017; Stewart-Tufescu et al., 2022). Third, the sample was community-based but non-probabilistic and recruited online, which limits generalizability compared with nationally representative survey designs such as NatSCEV. Online community recruitment may also underrepresent families experiencing more severe adversity, child-protection involvement, or lower digital access, which may have influenced the prevalence and relative predictive salience of some ACE domains. The target-child selection procedure may also have affected within-family representativeness. When caregivers had more than one eligible child, they reported on the youngest child, which reduced ambiguity but systematically excluded older eligible siblings within participating families. Fourth, the adapted reduced Finkelhor/Turner score included 14 rather than 15 indicators because the Portuguese measure included a general peer assault item, whereas the injury-specific follow-up item asking whether the incident involved injury yielded no valid responses. It was therefore not possible to distinguish peer assault with injury from peer assault without injury reliably. This adaptation was methodologically necessary but means that the reduced score is not a direct replication of the original Turner et al. measure.
A further limitation concerns the approximate original ACE score. Emotional neglect was not directly available, and therefore the original ACE measure could only be approximated using nine conventional indicators. Although this score showed the strongest predictive and discriminative performance, its superiority should be interpreted with caution because it was not the complete original 10-item ACE inventory. Similarly, the full ACE pool and domain scores were based on available items and on theoretically defined groupings, and some domains were represented by fewer or less frequent indicators. Because item availability, domain construction, sample type, and informant source can affect which adversities appear most predictive, the present findings should not be interpreted as establishing a definitive hierarchy of ACE domains. Rather, they indicate which ACE scores and domains were most informative in this specific Portuguese caregiver-report community sample.
Future research should replicate these findings in larger and more representative Portuguese samples, ideally using longitudinal designs that can test prospective prediction of child socio-emotional outcomes. Replication in higher-risk and more vulnerable samples is also needed, including children involved in child protection, residential care, clinical services, or other adversity-exposed contexts, to determine whether maltreatment, neglect, or other victimization domains become more prominent when exposure is assessed in populations with higher expected adversity burden. Studies should also examine whether caregiver-report ACE scores predict clinician-rated outcomes, teacher-reported adjustment, service use, and later developmental trajectories. Multi-informant designs, incorporating child, caregiver, teacher, clinician, and/or administrative data where possible, would be particularly valuable for reducing informant bias and improving the detection of adversities that may be underreported in caregiver-only assessments. Further work is needed to determine whether Portuguese adaptations of the Finkelhor/Turner reduced score require item modification, reweighting, or age-specific calibration. In addition, future studies should investigate whether domain-based or person-centered approaches improve screening decisions beyond cumulative ACE counts, especially when combined with protective factors, family resources, and contextual information.
In conclusion, this study provides preliminary evidence that a Portuguese caregiver-report ACE assessment derived from the Finkelhor/Turner framework is meaningfully associated with children’s socio-emotional adjustment in a community sample. The results support the general value of ACE assessment but also show that measurement choices are consequential. Across the three scoring approaches, the nine-item approximate original ACE score showed the strongest overall predictive and discriminative performance for caregiver-reported SDQ outcomes in this Portuguese sample, suggesting that the available conventional family- and maltreatment-related ACE indicators remained highly salient for caregiver-reported child adjustment. However, this finding should not be interpreted as demonstrating the general superiority of the complete original ACE inventory, because emotional neglect was unavailable and the external criterion was caregiver-reported socio-emotional adjustment rather than trauma symptoms or independently assessed clinical outcomes. At the same time, among the two Finkelhor/Turner-derived scoring approaches, the adapted reduced score was more parsimonious and more predictive than the full ACE pool, supporting the rationale for empirically informed item selection. Domain and latent class analyses further indicated that economic stressors, family disorder, maltreatment, and family/economic adversity profiles may be especially relevant for identifying children at socio-emotional risk, while high polyadversity may be particularly relevant for lower prosocial functioning. Overall, the findings reinforce the need for developmentally sensitive, culturally adapted, and outcome-validated ACE assessment rather than relying on untested cumulative scores.
Author Contributions
Conceptualization, L.S. and R.J.P.; Methodology, L.S. and R.J.P.; Software, R.J.P.; Validation, Â.M.; Formal analysis, R.J.P.; Investigation, L.S.; Data curation, L.S. and R.J.P.; Writing—original draft preparation, L.S.; Writing—review and editing, Â.M. and R.J.P.; Supervision, Â.M. and R.J.P. All authors have read and agreed to the published version of the manuscript.
Funding
This research was conducted at the Hei-Lab Digital Human-Environment Interaction, University Lusófona, and was funded by national funds through FCT–Fundação para a Ciência e a Tecnologia, I.P., under project UIDB/05380/2020. The Centre is registered under the DOI: https://doi.org/10.54499/UID/05380/2025. This research was also partially conducted at the Psychology Research Centre (CIPsi; PSI/01662), School of Psychology, University of Minho, and was funded by the Portuguese Foundation for Science and Technology (FCT; UID/01662/2025) through the Portuguese State Budget. The Centre is registered under the DOI: https://doi.org/10.54499/UID/01662/2025.
Institutional Review Board Statement
The study was reviewed and approved by the Ethics and Deontology Committee for Scientific Research (CEDIC) of the Faculty of Psychology and Education, Lusófona University—Porto University Centre (approval code: CEDIC125_05.25; Act No. 55, Opinion No. 1; date of approval: 16 July 2025).
Informed Consent Statement
Informed consent was obtained from all subjects involved in the study.
Data Availability Statement
The data presented in this study are available on reasonable request from the corresponding author. The data are not publicly available due to ethical and privacy considerations related to the sensitive nature of the information collected.
Conflicts of Interest
The authors declare no conflicts of interest.
References
- Anderson, A. S., Siciliano, R. E., Pillai, A., Jiang, W., & Compas, B. E. (2023). Parental drug use disorders and youth psychopathology: Meta-analytic review. Drug and Alcohol Dependence, 244, 109793. [Google Scholar] [CrossRef] [Scilit] [PubMed]
- Austin, A. E., Anderson, K. N., Goodson, M., Niolon, P. H., Swedo, E. A., Terranella, A., & Bacon, S. (2024). Screening for adverse childhood experiences: A critical appraisal. Pediatrics, 154(6), 2024067307. [Google Scholar] [CrossRef] [Scilit] [PubMed]
- Babyak, M. A. (2004). What you see may not be what you get: A brief, nontechnical introduction to overfitting in regression-type models. Psychosomatic Medicine, 66(3), 411–421. [Google Scholar] [CrossRef] [Scilit] [PubMed]
- Baldwin, J. R., Caspi, A., Meehan, A. J., Ambler, A., Arseneault, L., Fisher, H. L., Harrington, H. L., Matthews, T., Odgers, C. L., Poulton, R., Ramrakha, S., Moffitt, T. E., & Danese, A. (2021). Population vs. Individual prediction of poor health from results of adverse childhood experiences screening. JAMA Pediatrics, 175(4), 385–393. [Google Scholar] [CrossRef] [Scilit] [PubMed]
- Bellis, M. A., Hardcastle, K., Ford, K., Hughes, K., Ashton, K., Quigg, Z., & Butler, N. (2017). Does continuous trusted adult support in childhood impart life-course resilience against adverse childhood experiences—A retrospective study on adult health-harming behaviours and mental well-being. BMC Psychiatry, 17(1), 110. [Google Scholar] [CrossRef] [Scilit] [PubMed]
- Berzenski, S. R., & Yates, T. M. (2022). The development of empathy in child maltreatment contexts. Child Abuse & Neglect, 133, 105827. [Google Scholar] [CrossRef] [Scilit] [PubMed]
- Bethell, C., Jones, J., Gombojav, N., Linkenbach, J., & Sege, R. (2019). Positive childhood experiences and adult mental and relational health in a statewide sample: Associations across adverse childhood experiences levels. JAMA Pediatrics, 173(11), e193007. [Google Scholar] [CrossRef] [Scilit] [PubMed]
- Bollen, K. A., & Diamantopoulos, A. (2017). In defense of causal-formative indicators: A minority report. Psychological Methods, 22(3), 581–596. [Google Scholar] [CrossRef] [Scilit] [PubMed]
- Chan, K. L. (2015). Are parents reliable in reporting child victimization? Comparison of parental and adolescent reports in a matched Chinese household sample. Child Abuse & Neglect, 44, 170–183. [Google Scholar] [CrossRef] [Scilit] [PubMed]
- Chen, P., Zhang, Q., Sun, X., Ye, X., Wang, Y., & Yang, X. (2023). How do childhood abuse and neglect affect prosocial behavior? The mediating roles of different empathic components. Frontiers in Psychology, 13, 1051258. [Google Scholar] [CrossRef] [Scilit] [PubMed]
- Cheung, K., & Theule, J. (2016). Parental psychopathology in families of children with ADHD: A meta-analysis. Journal of Child and Family Studies, 25(12), 3451–3461. [Google Scholar] [CrossRef] [Scilit]
- Cigala, A., & Mori, A. (2022). Perspective taking ability in psychologically maltreated children: A protective factor in peer social adjustment. Frontiers in Psychology, 13, 816514. [Google Scholar] [CrossRef] [Scilit] [PubMed]
- Clifford, M. E., Nguyen, A. J., & Bradshaw, C. P. (2023). Patterns of adverse childhood experiences associated with externalizing problems: A Latent class analysis. Violence and Gender, 10(2), 91–100. [Google Scholar] [CrossRef] [Scilit]
- Conger, R. D., Ge, X., Elder, G. H., Lorenz, F. O., & Simons, R. L. (1994). Economic stress, coercive family process, and developmental problems of adolescents. Child Development, 65(2), 541. [Google Scholar] [CrossRef]
- Cooley, D. T., & Jackson, Y. (2022). Informant discrepancies in child maltreatment reporting: A systematic review. Child Maltreatment, 27(1), 126–145. [Google Scholar] [CrossRef] [Scilit] [PubMed]
- Crandall, A. A., Miller, J. R., Cheung, A., Novilla, L. K., Glade, R., Novilla, M. L. B., Magnusson, B. M., Leavitt, B. L., Barnes, M. D., & Hanson, C. L. (2019). ACEs and counter-ACEs: How positive and negative childhood experiences influence adult health. Child Abuse & Neglect, 96, 104089. [Google Scholar] [CrossRef] [Scilit] [PubMed]
- Cronholm, P. F., Forke, C. M., Wade, R., Bair-Merritt, M. H., Davis, M., Harkins-Schwarz, M., Pachter, L. M., & Fein, J. A. (2015). Adverse childhood experiences: Expanding the concept of adversity. American Journal of Preventive Medicine, 49(3), 354–361. [Google Scholar] [CrossRef] [Scilit] [PubMed]
- De Los Reyes, A., & Epkins, C. C. (2023). Introduction to the special issue. A dozen years of demonstrating that informant discrepancies are more than measurement error: Toward guidelines for integrating data from multi-informant assessments of youth mental health. Journal of Clinical Child & Adolescent Psychology, 52(1), 1–18. [Google Scholar] [CrossRef] [Scilit] [PubMed]
- De Los Reyes, A., Talbott, E., Power, T. J., Michel, J. J., Cook, C. R., Racz, S. J., & Fitzpatrick, O. (2022). The needs-to-goals gap: How informant discrepancies in youth mental health assessments impact service delivery. Clinical Psychology Review, 92, 102114. [Google Scholar] [CrossRef] [Scilit] [PubMed]
- Felitti, V. J., Anda, R. F., Nordenberg, D., Williamson, D. F., Spitz, A. M., Edwards, V., Koss, M. P., & Marks, J. S. (1998). Relationship of childhood abuse and household dysfunction to many of the leading causes of death in adults: The adverse childhood experiences (ACE) study. American Journal of Preventive Medicine, 14(4), 245–258. [Google Scholar] [CrossRef] [Scilit] [PubMed]
- Finkelhor, D. (2018). Screening for adverse childhood experiences (ACEs): Cautions and suggestions. Child Abuse & Neglect, 85, 174–179. [Google Scholar] [CrossRef] [Scilit] [PubMed]
- Finkelhor, D., Shattuck, A., Turner, H., & Hamby, S. (2013). Improving the adverse childhood experiences study scale. JAMA Pediatrics, 167(1), 70–75. [Google Scholar] [CrossRef] [Scilit] [PubMed]
- Finkelhor, D., Shattuck, A., Turner, H., & Hamby, S. (2015). A revised inventory of adverse childhood experiences. Child Abuse & Neglect, 48, 13–21. [Google Scholar] [CrossRef] [Scilit] [PubMed]
- Gartland, D., Riggs, E., Muyeen, S., Giallo, R., Afifi, T. O., Macmillan, H., Herrman, H., Bulford, E., & Brown, S. J. (2019). What factors are associated with resilient outcomes in children exposed to social adversity? A systematic review. BMJ Open, 9(4), e024870. [Google Scholar] [CrossRef] [Scilit] [PubMed]
- Goodman, R. (2001). Psychometric properties of the strengths and difficulties questionnaire. Journal of the American Academy of Child & Adolescent Psychiatry, 40(11), 1337–1345. [Google Scholar] [CrossRef] [Scilit] [PubMed]
- Hughes, K., Bellis, M. A., Hardcastle, K. A., Sethi, D., Butchart, A., Mikton, C., Jones, L., & Dunne, M. P. (2017). The effect of multiple adverse childhood experiences on health: A systematic review and meta-analysis. The Lancet Public Health, 2(8), e356–e366. [Google Scholar] [CrossRef] [Scilit] [PubMed]
- Hunsley, J., & Meyer, G. J. (2003). The incremental validity of psychological testing and assessment: Conceptual, methodological, and statistical issues. Psychological Assessment, 15(4), 446–455. [Google Scholar] [CrossRef] [Scilit] [PubMed]
- Kim, Y. (2019). The causal structure of suppressor variables. Journal of Educational and Behavioral Statistics, 44(4), 367–389. [Google Scholar] [CrossRef] [Scilit]
- Kobulsky, J. M., Kepple, N. J., Holmes, M. R., & Hussey, D. L. (2017). Concordance of parent- and child-reported physical abuse following child protective services investigation. Child Maltreatment, 22(1), 24–33. [Google Scholar] [CrossRef] [Scilit] [PubMed]
- Lanier, P., Maguire-Jack, K., Lombardi, B., Frey, J., & Rose, R. A. (2017). Adverse childhood experiences and child health outcomes: Comparing cumulative risk and latent class approaches. Maternal and Child Health Journal, 22(3), 288–297. [Google Scholar] [CrossRef] [Scilit] [PubMed]
- Liskola, K., Raaska, H., Lapinleimu, H., Lipsanen, J., Sinkkonen, J., & Elovainio, M. (2021). The effects of maternal depression on their perception of emotional and behavioral problems of their internationally adopted children. Child and Adolescent Psychiatry and Mental Health, 15(1), 41. [Google Scholar] [CrossRef] [Scilit] [PubMed]
- Maassen, G. H., & Bakker, A. B. (2001). Suppressor variables in path models: Definitions and interpretations. Sociological Methods and Research, 30(2), 241–270. [Google Scholar] [CrossRef] [Scilit]
- Madsen, K. B., Rask, C. U., Olsen, J., Niclasen, J., & Obel, C. (2019). Depression-related distortions in maternal reports of child behaviour problems. European Child & Adolescent Psychiatry, 29(3), 275–285. [Google Scholar] [CrossRef] [Scilit] [PubMed]
- Masarik, A. S., & Conger, R. D. (2017). Stress and child development: A review of the Family Stress Model. Current Opinion in Psychology, 13, 85–90. [Google Scholar] [CrossRef] [Scilit] [PubMed]
- McEwen, C. A., & Gregerson, S. F. (2019). A critical assessment of the adverse childhood experiences study at 20 years. American Journal of Preventive Medicine, 56(6), 790–794. [Google Scholar] [CrossRef] [Scilit] [PubMed]
- Meehan, A. J., Baldwin, J. R., Lewis, S. J., MacLeod, J. G., & Danese, A. (2022). Poor individual risk classification from adverse childhood experiences screening. American Journal of Preventive Medicine, 62(3), 427–432. [Google Scholar] [CrossRef] [Scilit] [PubMed]
- Narayan, A. J., Rivera, L. M., Bernstein, R. E., Harris, W. W., & Lieberman, A. F. (2018). Positive childhood experiences predict less psychopathology and stress in pregnant women with childhood adversity: A pilot study of the benevolent childhood experiences (BCEs) scale. Child Abuse & Neglect, 78, 19–30. [Google Scholar] [CrossRef] [Scilit] [PubMed]
- Neppl, T. K., Senia, J. M., & Donnellan, M. B. (2015). The effects of economic hardship: Testing the family stress model over time. Journal of Family Psychology: JFP: Journal of the Division of Family Psychology of the American Psychological Association (Division 43), 30(1), 12. [Google Scholar] [CrossRef] [Scilit] [PubMed]
- Parnes, M. F., & Schwartz, S. E. O. (2022). Adverse childhood experiences: Examining latent classes and associations with physical, psychological, and risk-related outcomes in adulthood. Child Abuse & Neglect, 127, 105562. [Google Scholar] [CrossRef] [Scilit] [PubMed]
- Petruccelli, K., Davis, J., & Berman, T. (2019). Adverse childhood experiences and associated health outcomes: A systematic review and meta-analysis. Child Abuse & Neglect, 97, 104127. [Google Scholar] [CrossRef] [Scilit] [PubMed]
- Podsakoff, P. M., MacKenzie, S. B., Lee, J. Y., & Podsakoff, N. P. (2003). Common method biases in behavioral research: A critical review of the literature and recommended remedies. Journal of Applied Psychology, 88(5), 879–903. [Google Scholar] [CrossRef] [Scilit] [PubMed]
- Podsakoff, P. M., MacKenzie, S. B., & Podsakoff, N. P. (2012). Sources of method bias in social science research and recommendations on how to control it. Annual Review of Psychology, 63, 539–569. [Google Scholar] [CrossRef] [Scilit] [PubMed]
- Sachs, M. C., Sjölander, A., & Gabriel, E. E. (2020). Aim for clinical utility, not just predictive accuracy. Epidemiology, 31(3), 359. [Google Scholar] [CrossRef] [Scilit] [PubMed]
- Shonkoff, J. P., Garner, A. S., Siegel, B. S., Dobbins, M. I., Earls, M. F., McGuinn, L., Pascoe, J., Wood, D. L., High, P. C., Donoghue, E., Fussell, J. J., Gleason, M. M., Jaudes, P. K., Jones, V. F., Rubin, D. M., Schulte, E. E., Macias, M. M., Bridgemohan, C., Fussell, J., … Wegner, L. M. (2012). The lifelong effects of early childhood adversity and toxic stress. Pediatrics, 129(1), e232–e246. [Google Scholar] [CrossRef] [Scilit] [PubMed]
- Song, J. H., Colasante, T., & Malti, T. (2018). Helping yourself helps others: Linking children’s emotion regulation to prosocial behavior through sympathy and trust. Emotion, 18(4), 518–527. [Google Scholar] [CrossRef] [Scilit] [PubMed]
- Stewart-Tufescu, A., Garces-Davila, I., Salmon, S., Pappas, K. V., McCarthy, J. A., Taillieu, T., Gill, S., & Afifi, T. O. (2022). Child maltreatment reporting practices by a person most knowledgeable for children and youth: A rapid scoping review. International Journal of Environmental Research and Public Health, 19(24), 16481. [Google Scholar] [CrossRef] [Scilit] [PubMed]
- Turner, H. A., Finkelhor, D., Mitchell, K. J., Jones, L. M., & Henly, M. (2020). Strengthening the predictive power of screening for adverse childhood experiences (ACEs) in younger and older children. Child Abuse & Neglect, 107, 104522. [Google Scholar] [CrossRef] [Scilit] [PubMed]
- Vickers, A. J., van Calster, B., & Steyerberg, E. W. (2019). A simple, step-by-step guide to interpreting decision curve analysis. Diagnostic and Prognostic Research, 3(1), 18. [Google Scholar] [CrossRef] [Scilit] [PubMed]
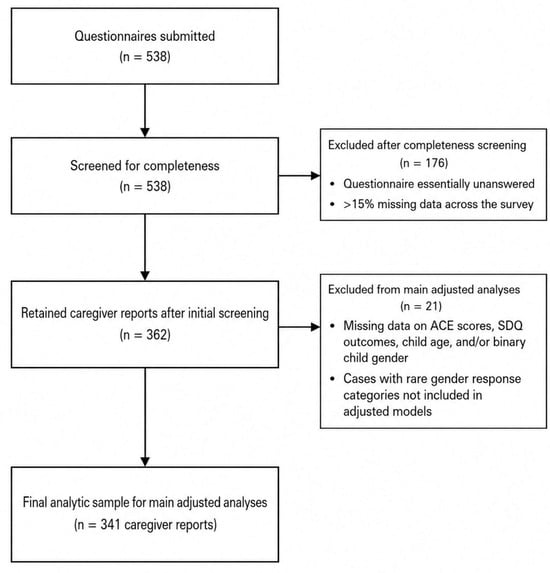

Disclaimer/Publisher’s Note: The statements, opinions and data contained in all publications are solely those of the individual author(s) and contributor(s) and not of MDPI and/or the editor(s). MDPI and/or the editor(s) disclaim responsibility for any injury to people or property resulting from any ideas, methods, instructions or products referred to in the content. |
© 2026 by the authors. Licensee MDPI, Basel, Switzerland. This article is an open access article distributed under the terms and conditions of the Creative Commons Attribution (CC BY) license.