


Abstract
Wind load can create high pressure on solar panels, resulting in either physical damage to the solar panels or a reduction in the efficiency of the panels due to the vibration of the panels. Investigations of wind load on solar panels usually focus on the roof-anchored mounting system. In this study, the use of a ballasted PV mounting system is investigated. Modern ballasted PV mounting systems are engineered with wind deflectors attached to the back side of the solar panel. This study investigates the effect of the wind deflector inclination angle along with the PV panel tilt angle by investigating three wind deflector inclination angles (30°, 60°, 90°) with respect to four PV panel tilt angles (15°, 18°, 21°, 24°). The direction of wind was changed for all of the investigated parameters from 90° to 180° in 15° increments. The investigations were performed numerically using Ansys fluent along with the Ansys fluent meshing tool. The CFD model was validated using the experimental investigation results from another paper that investigated the effect of wind load on solar panels experimentally using wind tunnels. The investigation results showed that a 30° wind deflector inclination angle reduced the lift coefficient by 38.49% compared with the 90° wind deflector inclination angle.
1. Introduction
Correctly estimating the performance and survivability of solar photovoltaic panels under wind load is an important factor that influences their application. Solar panel wind load evaluations are very important in design and installation. The utilization of renewable energy resources including solar panels has expanded in the last few decades; however, there are different factors to be considered when utilizing solar panels, such as building height, the location and inclination of panels, the landscape, and upstream exposure. These factors have been carefully considered in all computational and experimental procedures. With the development of the methodology of computational fluid dynamics and the progression of technology in computer hardware, numerical simulations of solar panels’ wind aerodynamics have developed significantly [1,2,3].
However, nowadays, more people have started to install solar panels on their houses to compensate for the large energy consumption that has increased with the increasing number of electrical devices in every house due to technology developments. The difference in the installation system and the space between the panels and the surface they are placed on makes a big difference in the wind load effect. A large space between the surface and the panels when they are installed on a flat roof or over the ground makes them less affected by wind load than when they are installed over residential inclined roofs, where the space between the panels and the surface is significantly lower in comparison. Scaled models and wind tunnels have been used to experimentally investigate solar panels installed over residential roofs and gable-type roofs in particular [4,5].
The effect of the scale of the geometry on the pressure induced by wind has been investigated. The results of the investigations reveal that wind tunnel size can significantly affect the assessment of wind loads on solar panels [3]. To reduce the manufacturing cost of solar panels, an economic analysis was conducted, and the local pressure distribution was experimentally measured for a solar panel array [6]. The investigation results showed that the lift and drag coefficients were higher on the last and first rows of the array, and then they decreased gradually for the subsequent rows because of sheltering [6]. Computational fluid dynamics simulation was performed to foresee the solar panel wind loads under various wind speeds (35–75 m/s) and turbulence intensities (0.1–0.3) [7]. The highest lift and drag forces were found on the solar array first row, the first row of the solar array sheltering effect gradually decreasing for the drag and lift coefficients along the wind direction [7]. Studies have also highlighted the importance of wind direction in heat evacuation and how it can reduce the solar panel temperature during hot weather conditions [8]. Wind load effect on solar panels has been investigated numerically by different researchers utilizing different models and boundary conditions. The SST k-w model was used as a turbulent model as it is an improved model combining the functions of the k-w and k-ε models that can more accurately predict the turbulent flow, and it is applicable in both near-wall and far-wall calculations [7,9,10].
Choi et al. [11] studied the optimal number of ballasted PV mounting systems that can weather wind uplift pressure without affecting the structure of buildings. They investigated different building heights and wind directions to conclude that ballasted PV mounting systems reduce the uplift pressure. Kuruneru et al. [12] numerically developed a CFD model to investigate the flow physics of ballasted PV mounting systems, investigating 25° and 90° PV panel tilt angles as well as an east–west configuration. They found that the installment configurations affect the pathways of air flow as well as the air temperature and the temperature distribution on solar panels. Opie et al.’s [13] review studied ballasted PV mounting systems; they found that ballasted PV mounting systems reduce mechanical failure risks, and their simplicity in structure makes them most favorable for large-scale projects.
The investigations on using ballasted PV mounting systems have been limited so far. Al Sayegh [14] experimentally investigated the aerodynamic characteristics of ballasted PV mounting systems and the difference between them and the roof-anchored system. It was found that the pressure coefficient and the net uplift force were reduced effectively with the use of wind deflectors. A ballasted PV mounting system can add significant weight on the roofs and can be considered less ideal for high wind zones, but it can be made more stable during high winds by adding a wind deflector to the rare side of the system, which, in return, will add to the advantage of using it without any roof penetration. Designing ballasted PV mounting systems with wind deflectors will minimize the uplift, allowing the solar panels to stay rooted even during strong storms without adding more weight.
From reviewing the literature that investigates the effect of wind load on solar panels and using ballasted PV mounting systems, we noticed thar there is a gap in the investigations of installing wind deflectors and choosing the right wind deflector inclination angle with respect to the PV panel tilt angle. This study investigates the wind deflector inclination angle and how it can change the net coefficient of pressure on the solar panels as well as the lift coefficient of the solar panels. A wide range of wind deflector inclination angles and PV panel tilt angles were investigated. From a structural engineering perspective, low-tilt configurations such as between 15° and 24° are highly representative of commercial flat-roof installations. This specific range minimizes aerodynamic uplift and wind loading. Minimizing the panel profile reduces both drag and overturning moments under oblique and cornering winds, which are critical design constraints for ballasted PV mounting system installations where roof penetrations must be minimized or avoided entirely [15]. The wind direction was changed from 90° to 180° in 15° intervals. The originality of this study lies in investigating a different wind deflector inclination angle and the importance of choosing the right angle.
2. Methodology
2.1. Details of the PV Model
The investigations were performed numerically using computational fluid dynamics; the dimensions of the panels and the entire model will have 1:1 scale, eliminating the chances of inaccurate results [16]. The models that are being investigated here consist of two solar panels, and the overall dimensions of the PV model are 1.134 m × 4.556 m × 0.03 m. The solar panels were presumed to be side by side with no space between them. The small gap between the panels was neglected as well as the details of the mounting system structure to reduce the simulation running cost [17,18].
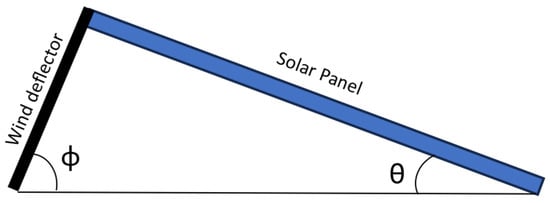
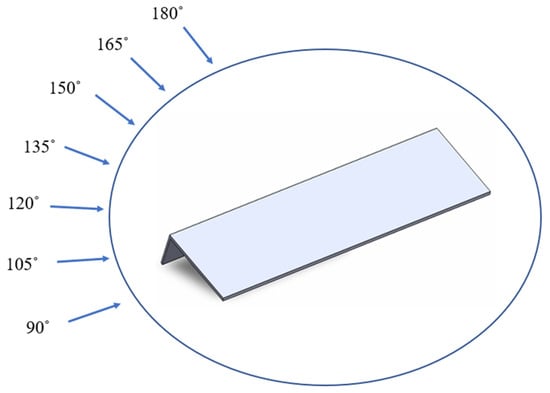
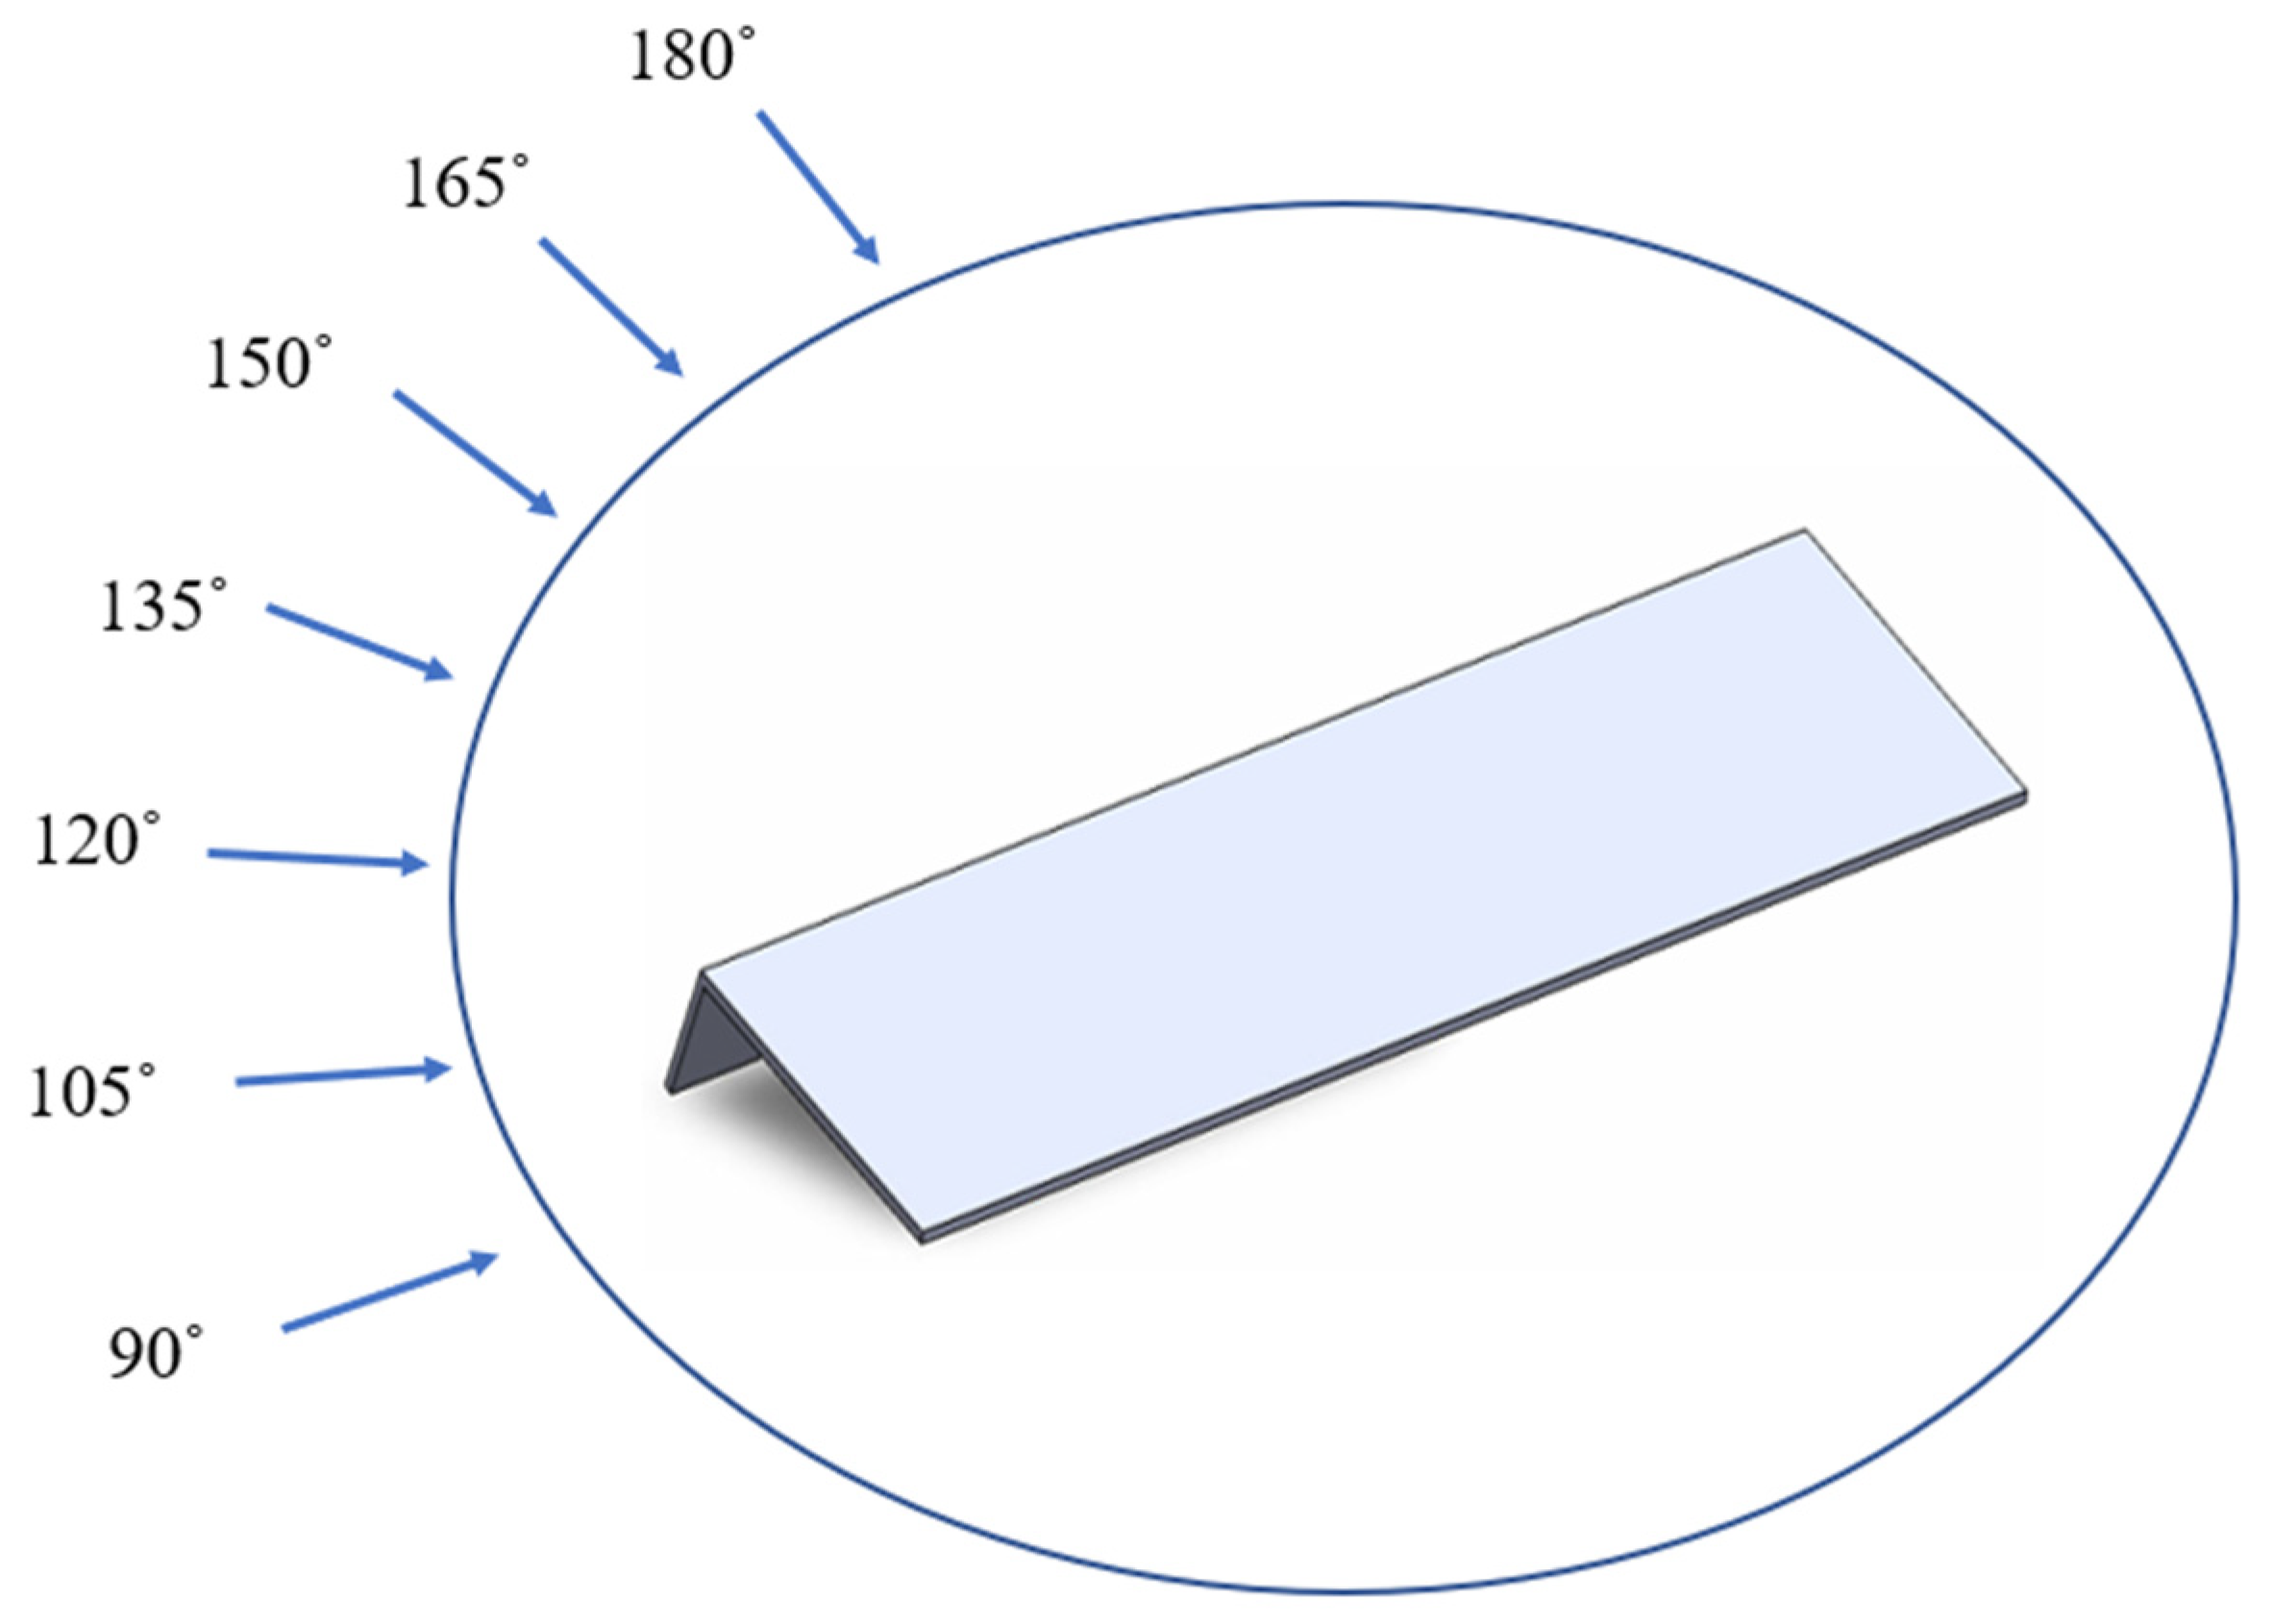
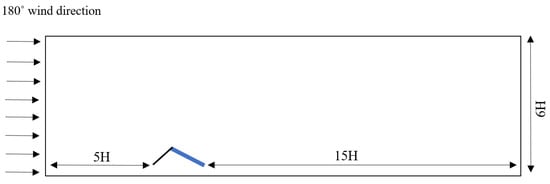
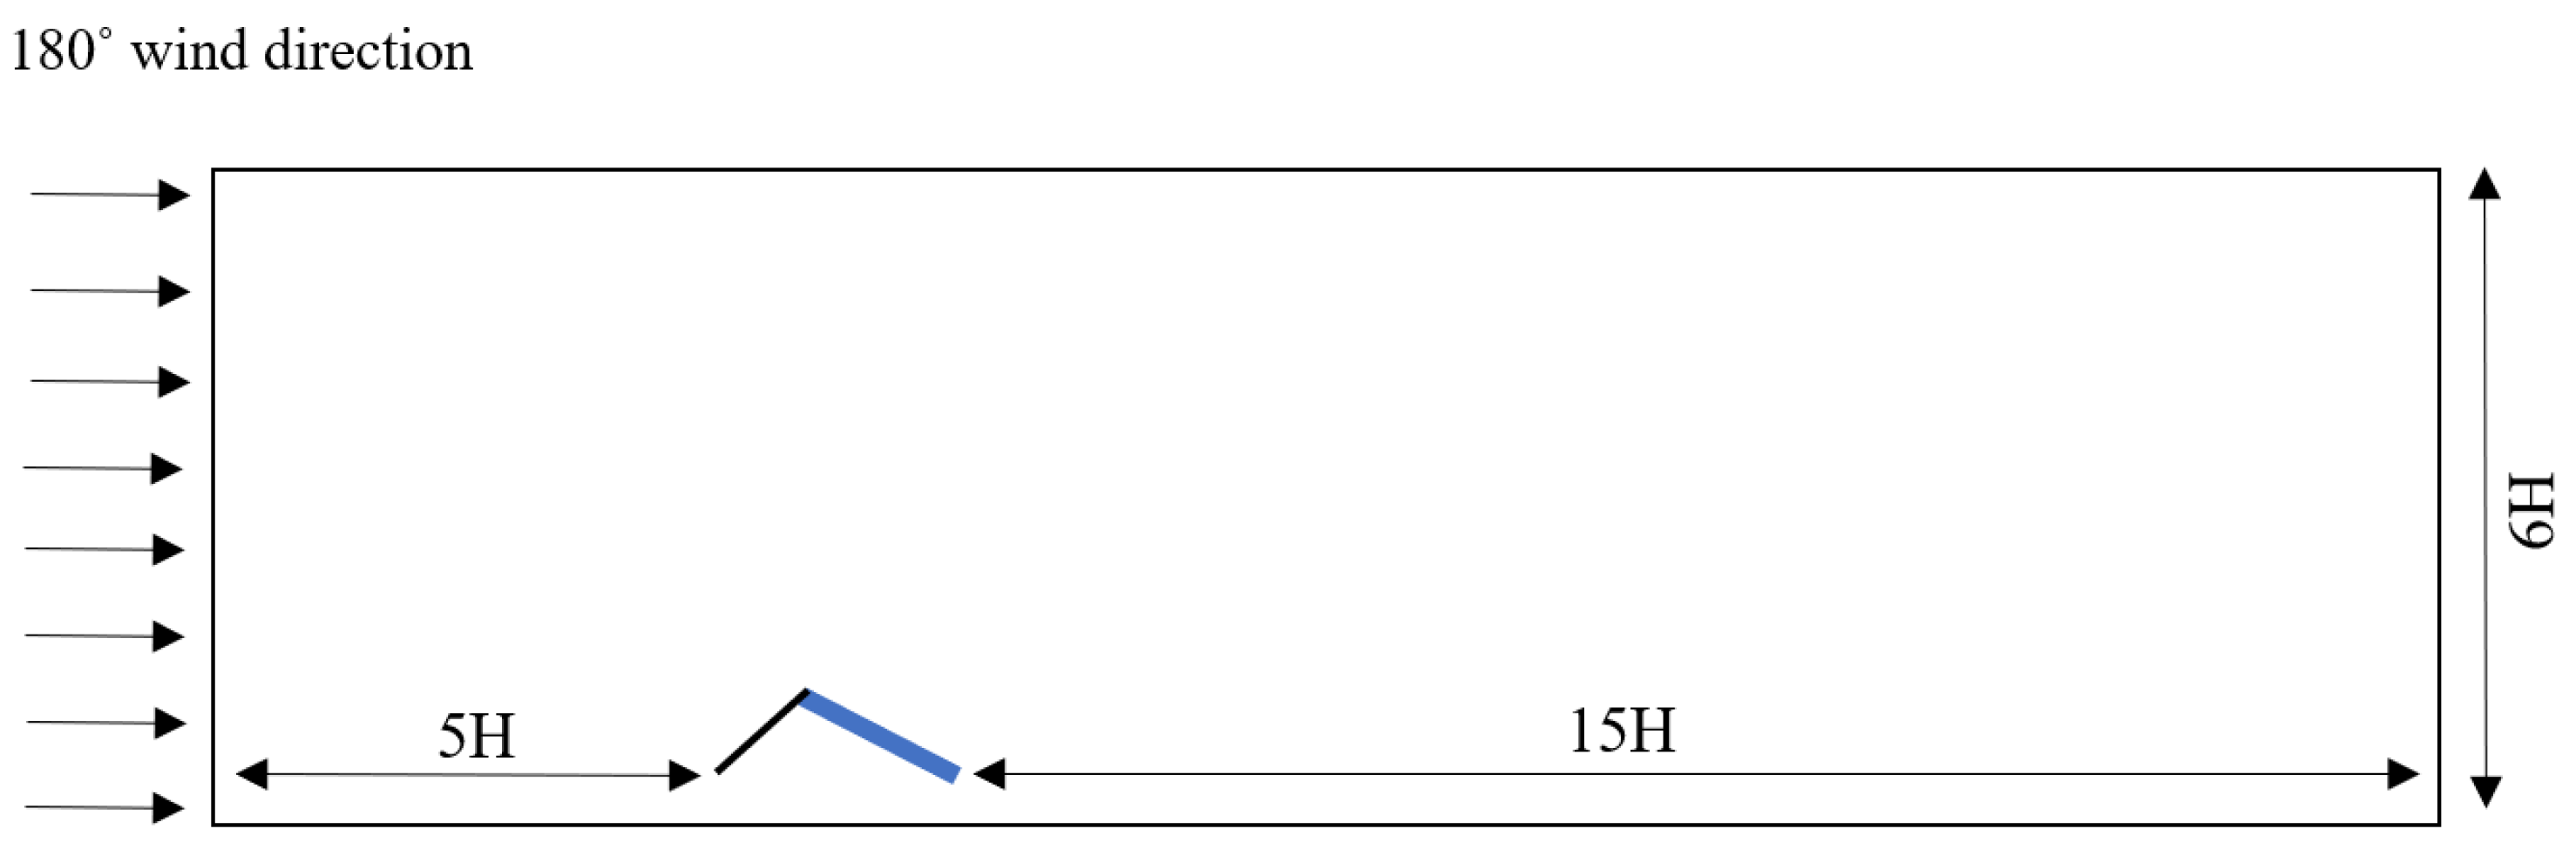
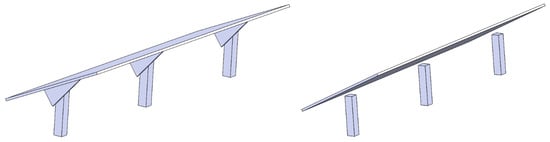
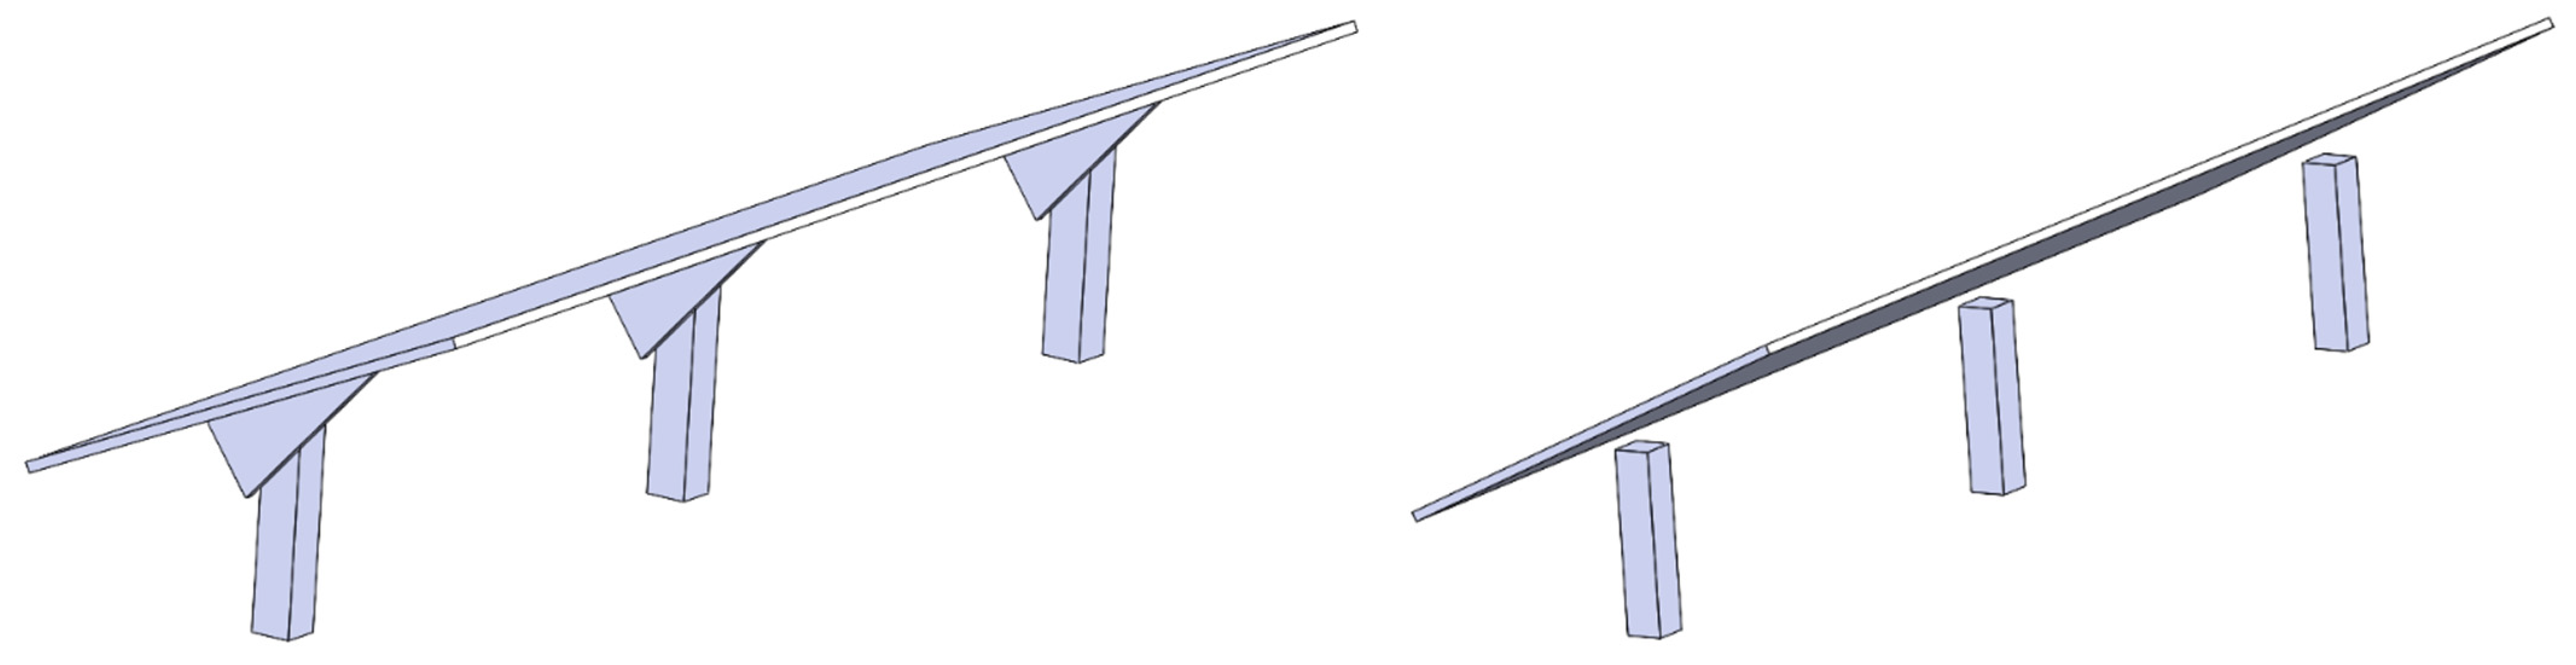
The PV panel tilt angle (θ) changed between (15°, 18°, 21°, and 24°). Meanwhile, the wind deflector inclination angle (ϕ) is (30°, 60°, 90°); these angles were chosen as they are among the largest used wind deflector inclination angles that are being used commercially (Figure 1). The investigated wind direction angle changes from 90° to 180° with an increment of 15°, as can be seen in Figure 2. The computational domain was created based on the best practice guideline for the CFD simulation of flows in the urban environment established by Franke et al. [19]. The computational domain, which can be seen in Figure 3, was created with 5H upstream boundary, 15H downstream boundary, and 5H boundary on either side of the PV model. 6H is the height of the computational domain (H = overall height of the model). The Q-criterion identification method was used to isolate and visualize the coherent vortex structures. The Q-criterion defines a vortex as a region where the rotation rate is greater than strain rate [20].
where Ω and S represent vorticity tensor and strain rate tensor, respectively.
Q = 1/2(|Ω|2 − |S|2)
Figure 1.
Schematic diagram of the model.
Figure 2.
Schematic diagram for wind direction.
Figure 3.
The computational domain used for the investigations.
Vortex structures in Ansys fluent were identified using an iso-surface of Q-criterion fixed at a threshold of Q = 500 S−2.
2.2. Grid and Grid Independence
The grid meshing was performed using Ansys fluent meshing. The hybrid mesh structure was established for the model, where fine element size was utilized close to the PV module and coarse element size was utilized further away from the module.
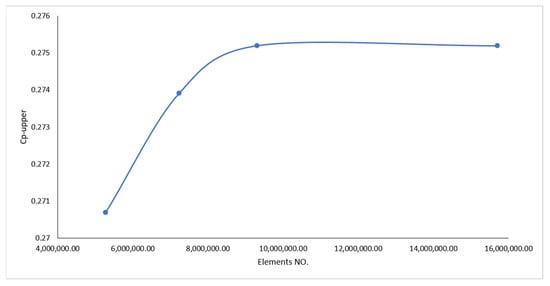
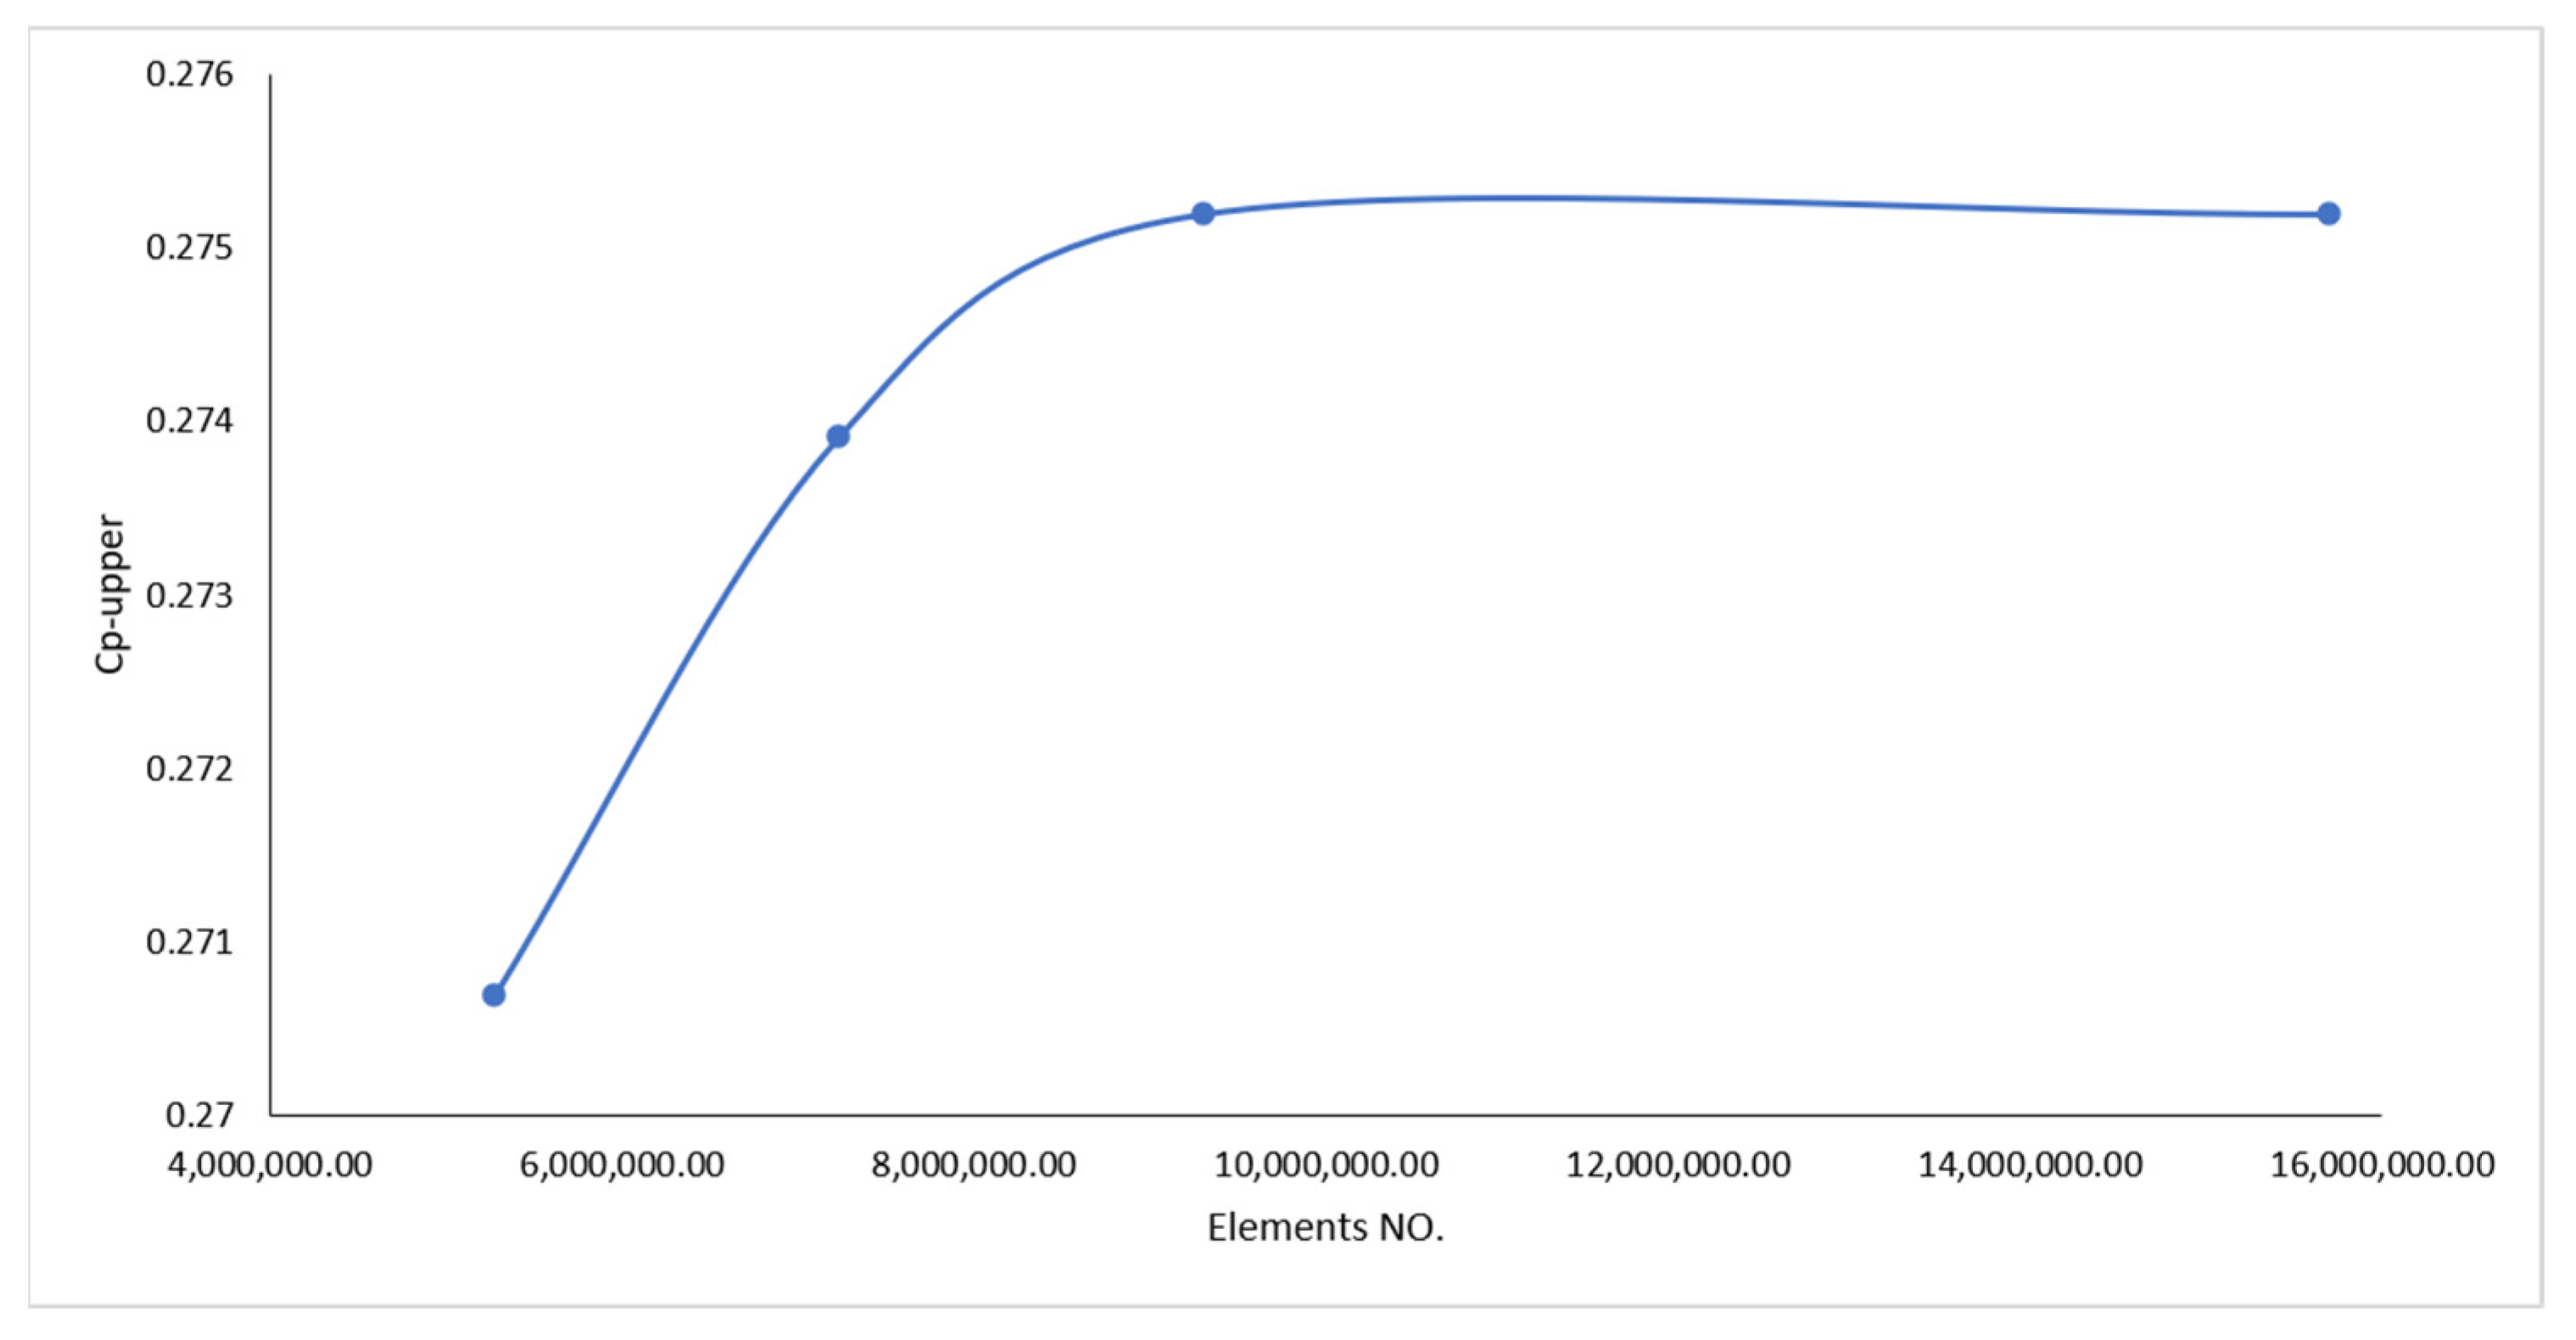
Grid independence study was performed to test mesh sizes from coarse to fine structures. The mesh cell size was increased constantly until a monotonic convergence state was reached for the Cp-upper values, as can be seen in Figure 4.
Figure 4.
Grid independence.
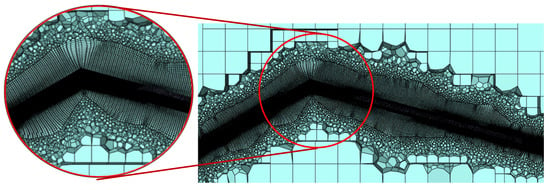
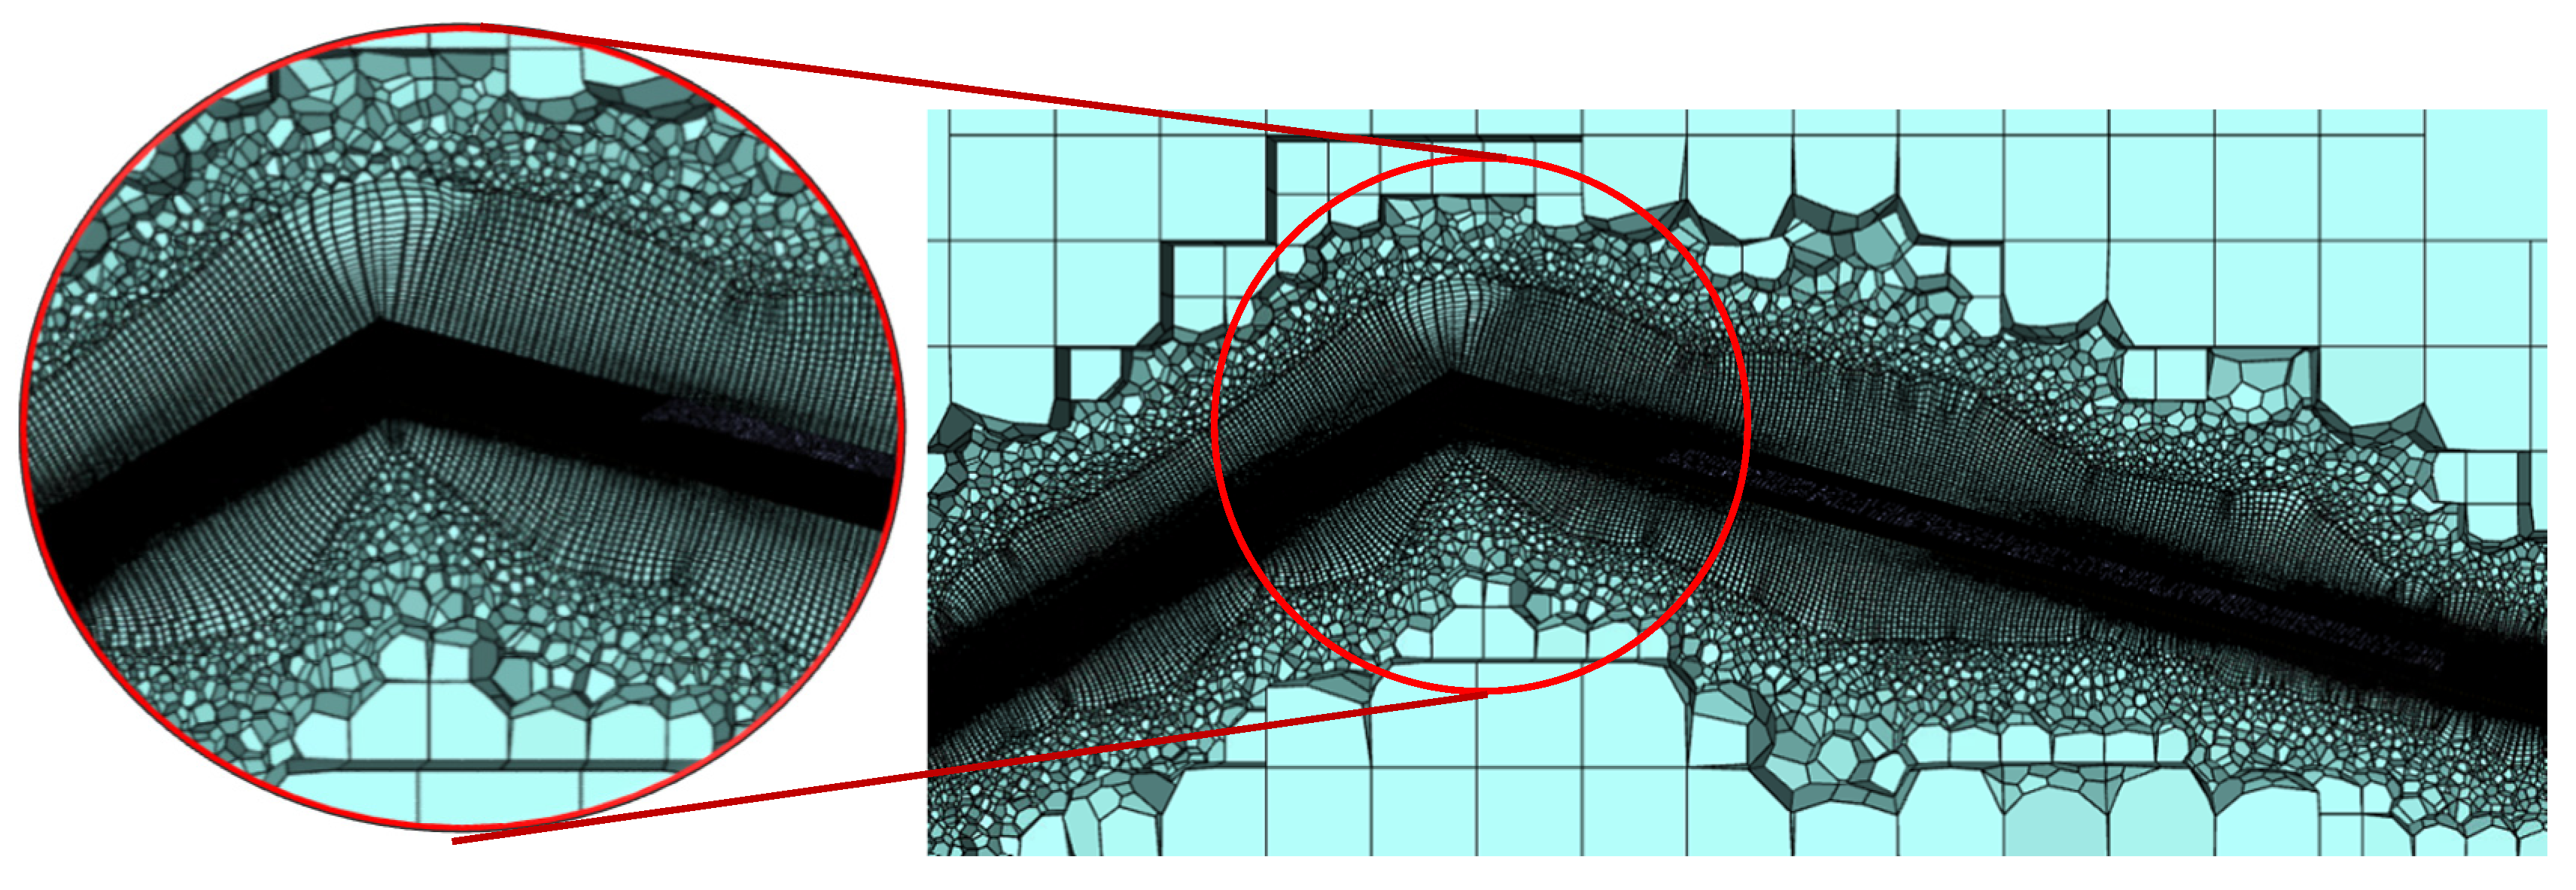
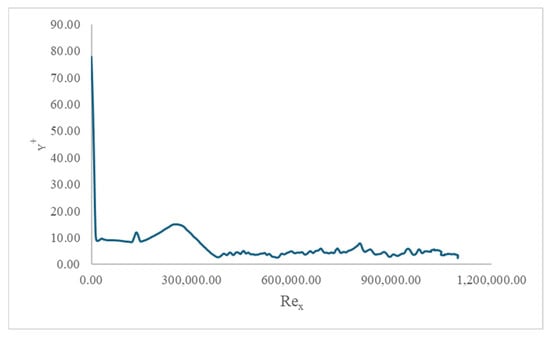
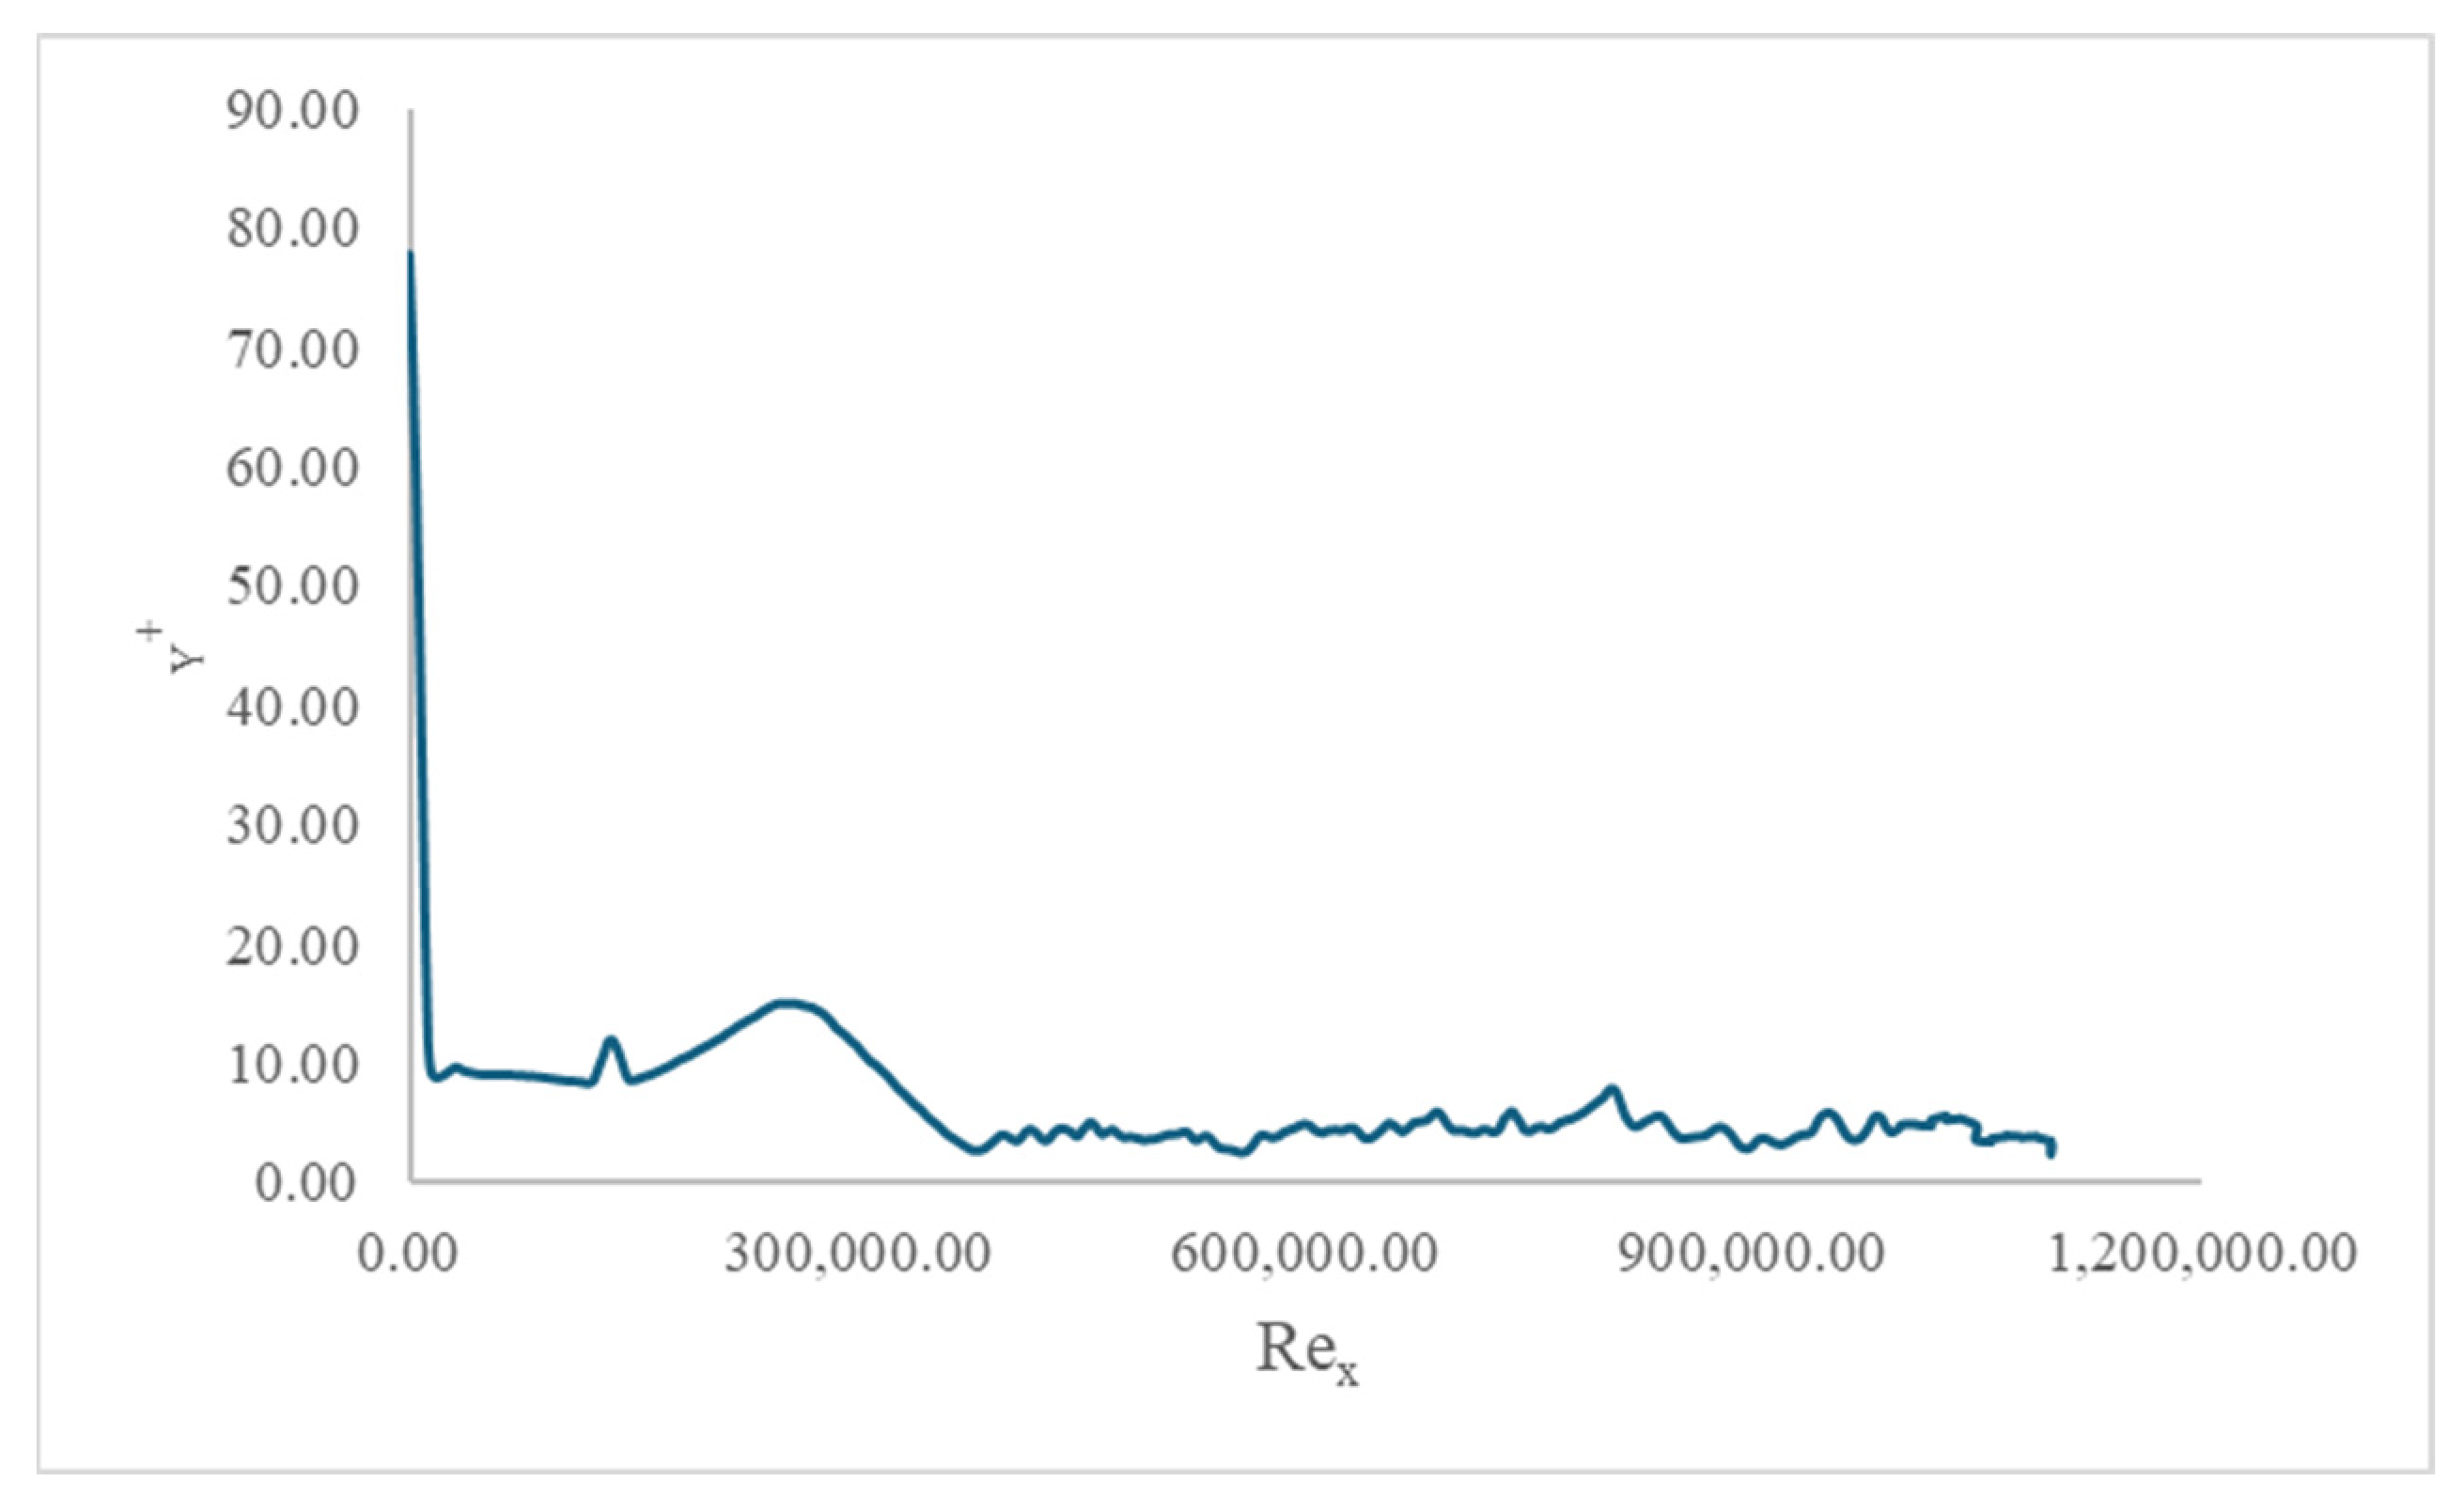
Poly-hexacore volume mesh structure was adopted with 25 inflation layers around the array geometry, 10 inflation layers from the computational domain ground and 2 buffer layers, Figure 5. This mesh setting was found to be the most suitable choice in terms of running cost; it also gave y+ ≥ 8, which goes along with the requirement of the SST turbulent model for Rex ≥ 3.5 × 10⁵ [21]. The mesh requirement for SST turbulent model was found by testing the effect of y+ on different Rex numerically and experimentally [21]. It was established that y+ is acceptable up to 8 after Rex ≥ 3.5 × 10⁵, and the CFD results are in a very close match with the experimental results. For the mesh used in these investigations, the y+ values can be seen in Figure 6 with respect to the Rex on the upper surface of the solar module. When the flow hits the top edge of solar module upper surface, the y+ value is high but sharply deceases with increasing Rex in the entrance region, then stabilizes with small periodic fluctuations downstream, indicating that the flow reaches a more developed state after the initial transient behavior, and the near-wall mesh resolution becomes more consistent as the boundary layer develops.
Figure 5.
Mesh structure.
Figure 6.
Behavior of y+ along with Rex.
2.3. Details of the Numerical Model
RAN simulations were conducted using a steady-state pressure-based solver in Ansys fluent, along with coupled pressure–velocity scheme. The SST turbulent model was used for the simulations [7,9,10,22] since the most favorable residuals were generated using SST turbulent model compared to the other turbulence models that were verified. The SST turbulent model pairs two transport equations with the SST k-ꞷ turbulence model [21]; moreover, the SST turbulent model is intended for flow with traditional boundary layer with nonzero freestream velocity [21], much like the situation that is being investigated in this study. The SST transport equation for the intermittency factor (γ) is as follows:
(∂(ργ))/∂t + (∂(ρUj γ))/(∂xj) = Pγ1 − Eγ1 + Pγ2 − Eγ2 + ∂/(∂xj) [(μ + μt/σγ) ∂γ/(∂xj)]
The sources of transition Pγ1 and Eγ1 are as follows:
where S is the strain rate magnitude, Ca1 and Ce1 hold the values of 2 and 1, respectively, Flength is an empirical correlation that controls the length of the transition region, Fonset is an empirical transition onset trigger (or function), ρ is the density, Uj is the mean flow velocity vector component in the (j) direction, μt is the eddy viscosity, and μ is the viscosity. The destruction sources are defined as follows:
where Ω is the vorticity magnitude, and Fturb is a turbulent blending function.
Eγ1 = Ce1 Pγ1 γ
Pγ2 = Ca2 ρΩγFturb
Eγ2 = Ce2 Pγ2 γ
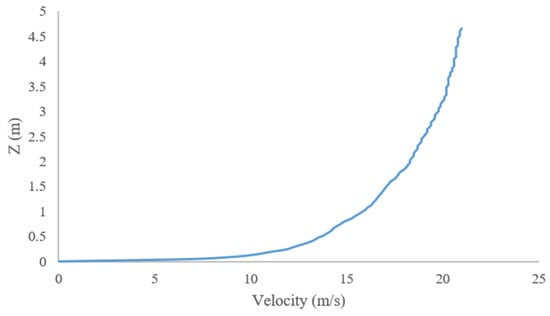
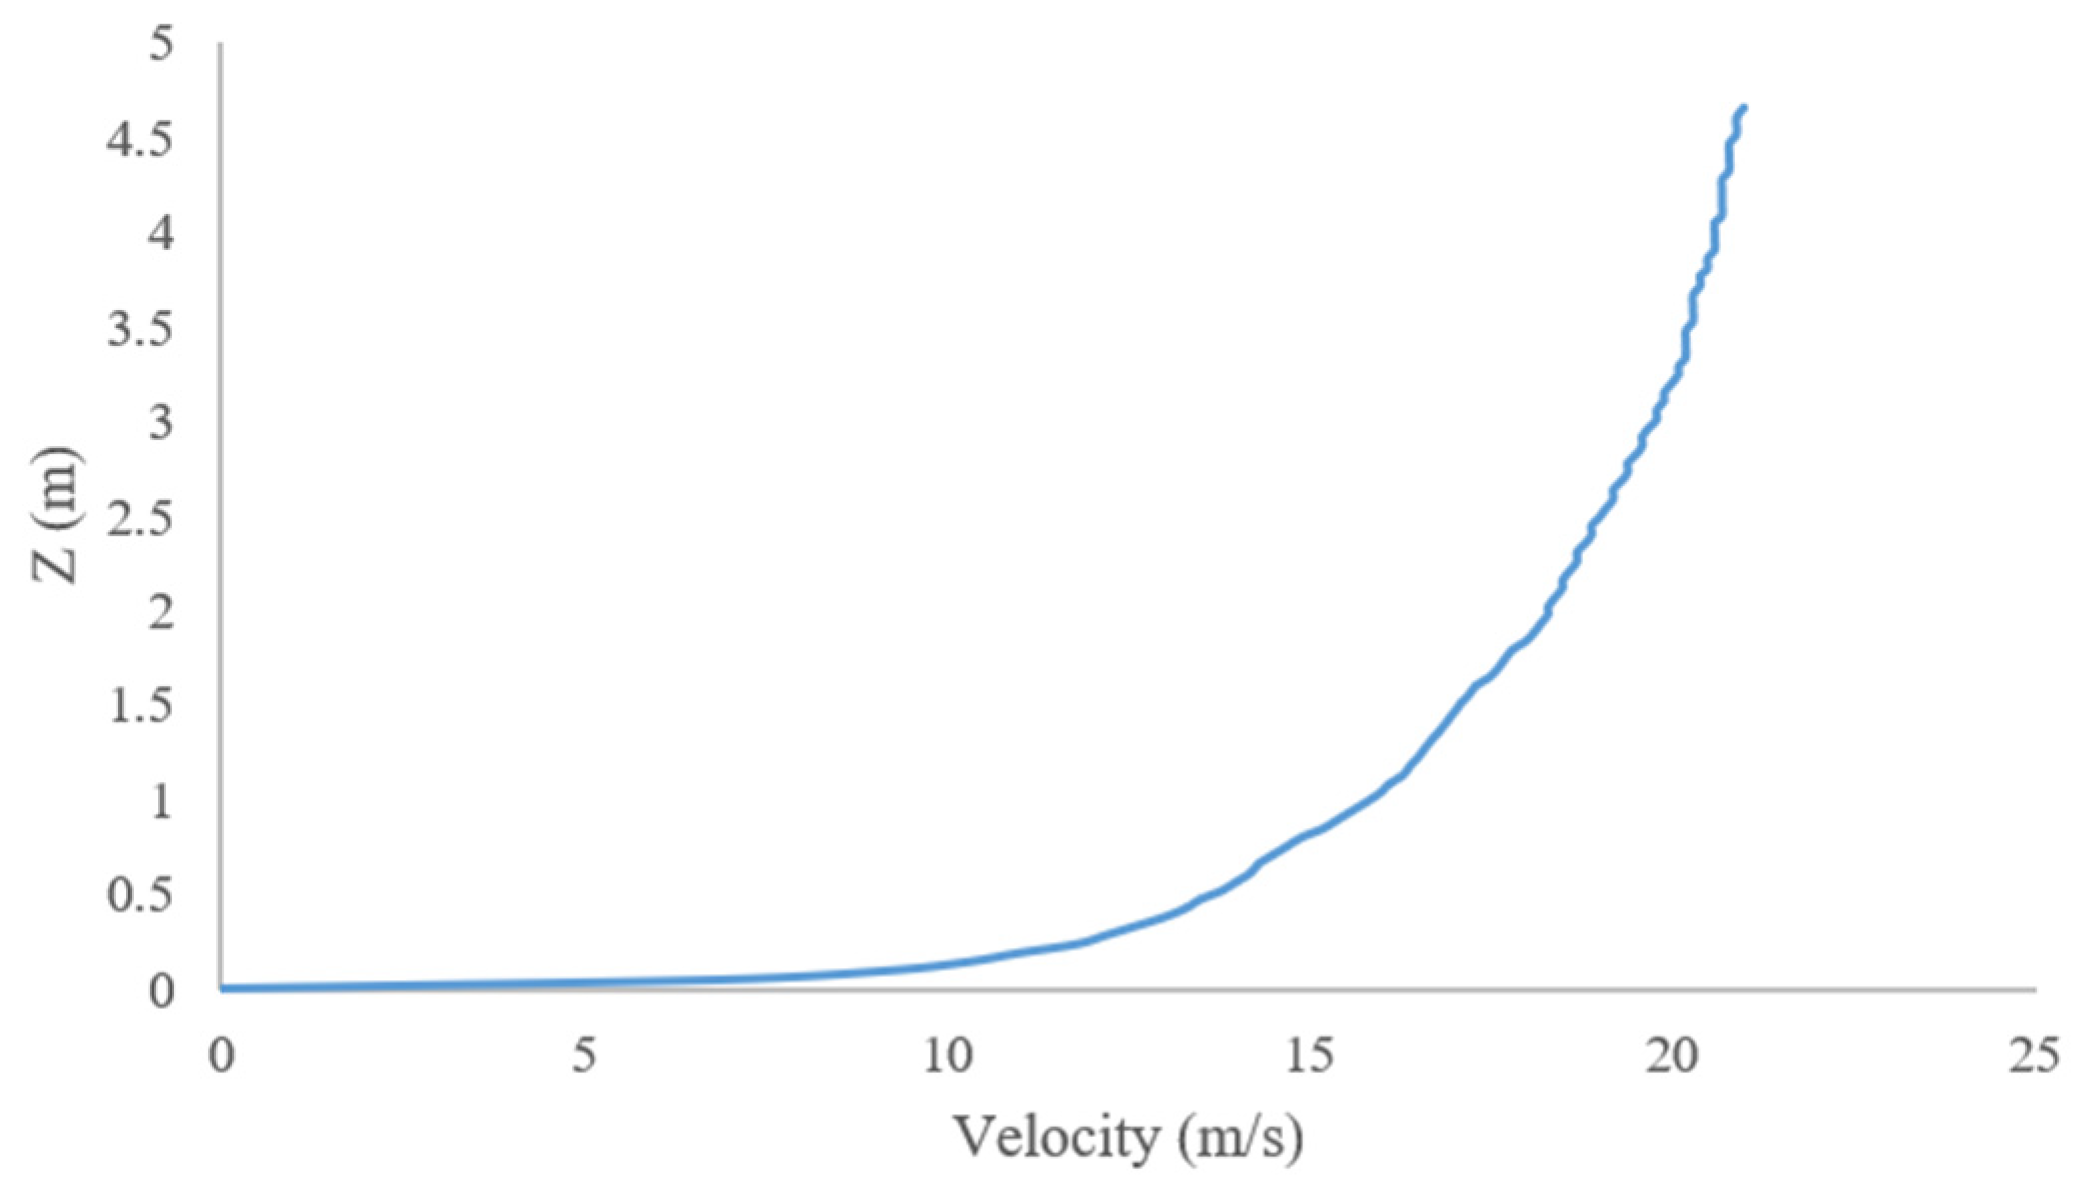
An equation was used to express the inlet velocity to capture the velocity in a real-world situation, Equation (6) [23,24,25,26,27,28], and the outlet conditions were expressed as atmospheric pressure. The side walls as well as the top wall of the computational domain were set as symmetric, while the ground wall of the computational domain was set as no-slip wall.
where 1/α = 0.16 is the terrain-dependent exponent, zg is the gradient height, ug is the gradient wind speed, and u is the mean wind velocity at height z from the ground [24]. The results are shown in Figure 7.
Figure 7.
Velocity profile.
While the numerical model captures the core physical phenomena that are being investigated, some limitations of the numerical model still exist, such as the governing equations being solved under steady-state assumptions to isolate the time-averaged impact of the tilt angles. Consequently, transient atmospheric phenomena, such as highly dynamic wind gusts, fluctuating turbulent scales, and time-dependent vortex shedding frequencies behind the panel, are not explicitly resolved. Another limitation is that, to ensure mesh optimization and convergence stability, the physical solar panel array was idealized as a perfectly flat, smooth rigid plate. Fine structural details, including the rear mounting brackets, tracking gaps, framing edges, and surface roughness, were omitted. These micro-geometries could induce localized micro-turbulences and flow trips in a real-world scenario.
2.4. Data Reduction
The pressure coefficient Cp was investigated over the top and bottom surfaces of the solar panels to determine the critical spots in which the wind load pressure can affect the performance of the solar panels.
The pressure coefficient Cp can be expressed as follows [23].
where Pi is the measured pressure at location i on the model surface, Vref is the reference velocity taken at a height equal to the inclined panel’s lowest point, ρ is the air density. The average Cp value was calculated for the upper and lower surfaces of the solar panels. The reference velocity was taken at the top point of the array inclination [23], whereas the reference pressure was taken as 0 gage pressure, which was set as the outlet pressure.
Considering the upper and lower sides of the solar panels are experiencing wind pressure effect, the net pressure coefficient Cp-Net was calculated.
Cp-Net is the result of subtracting Cp on the leeward side of the surface from Cp on the windward side of the surface [29,30,31,32,33,34,35].
The aerodynamic lift and drag coefficients were calculated to show the most favorable wind deflector inclination angle with respect to the PV panel tilt angle. The aerodynamic lift and drag coefficients were calculated according to Equations (9) and (10) [36].
where F is the lift force acting vertically to the wind direction [6,37], D is the drag force acting parallel with flow direction, and A is the surface area of the solar module.
3. CFD Validation
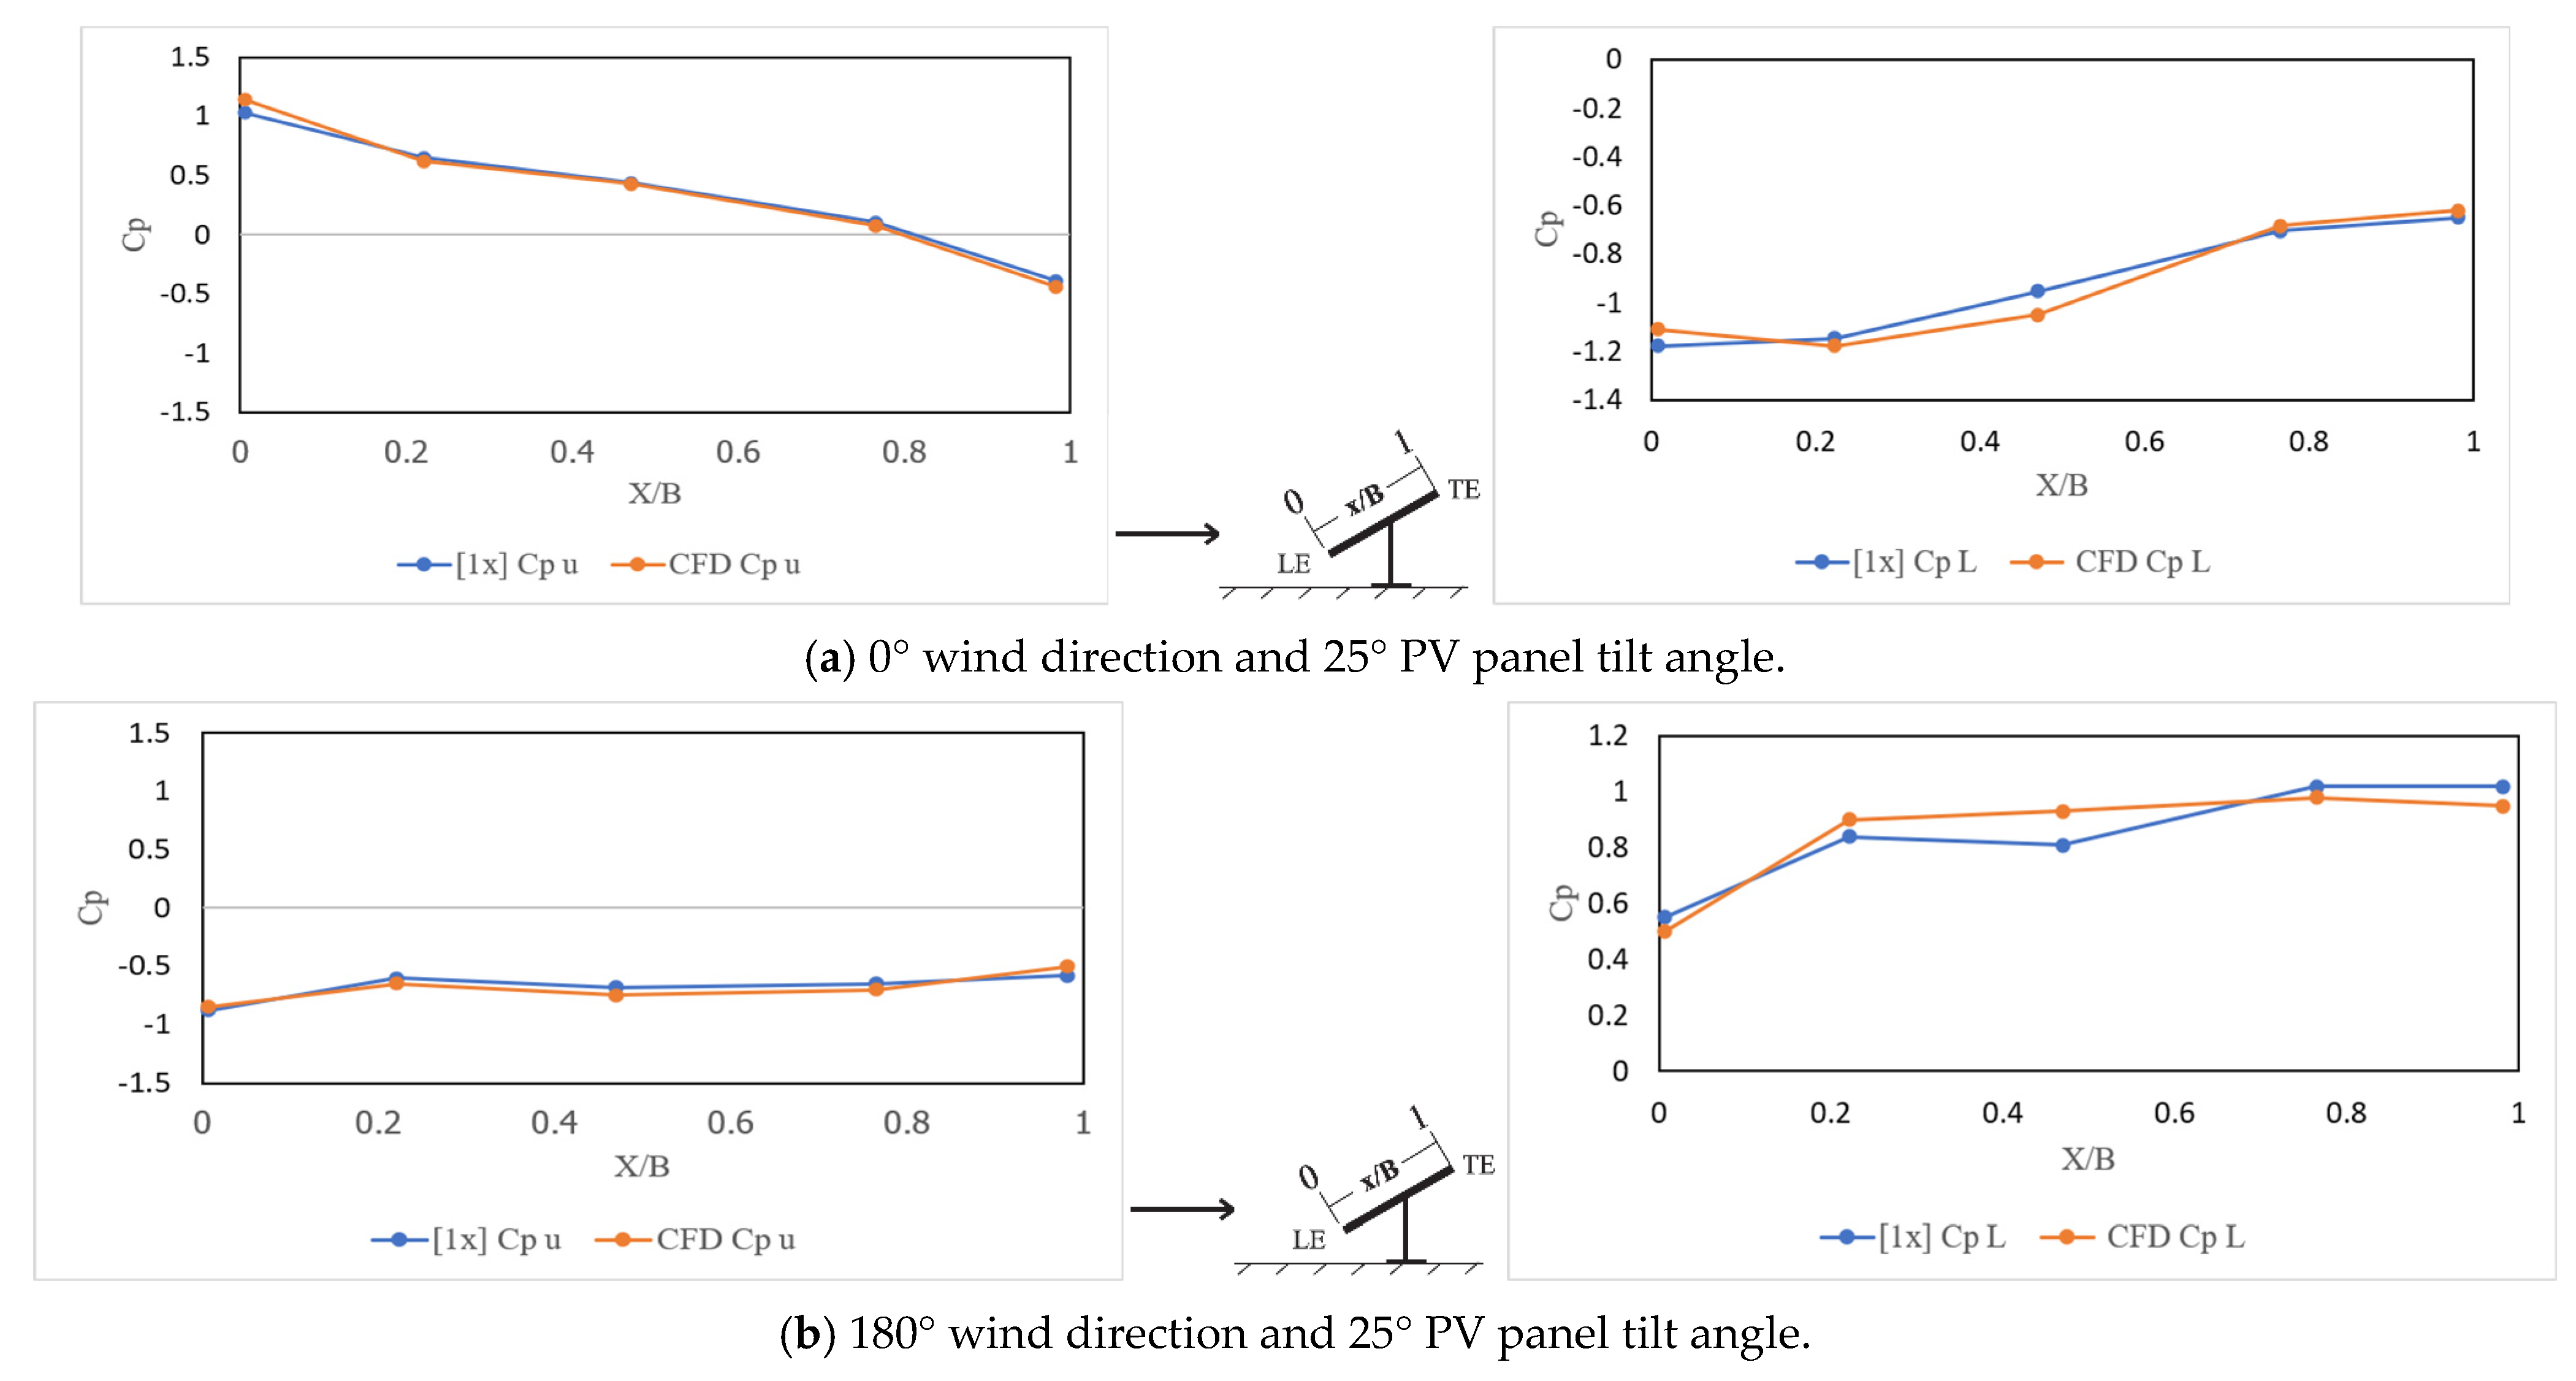
The results of experimental investigations executed by Abiola-Ogedengbe et al. [23] were utilized to validate the computational fluid dynamic model. Abiola-Ogedengbe et al. [23] created a 1:10-scaled model of a ground-mounted PV module before performing a wind tunnel experiment. They measured the pressure at 64 points, both on the top and bottom surfaces of the model, then used the measured pressure to calculate the pressure coefficient. The 3D geometry created for the validations has the same dimensions as the experimental model, except for the mounting system. Since the author did not specify the dimensions of the array–column connection, the array and the column were created as two detached parts, leaving space between the PV array and the ground-attached column [31,38]. Figure 8 shows a comparison between the experimental model and the model used in the CFD simulations. The boundary conditions and the computational domain were taken correspondingly, as mentioned in the Methodology section, considering V(z_ref) and 1⁄α values to be like the values mentioned by Abiola-Ogedengbe et al. [23]. Figure 9 shows the CFD results compared with the experimental results measured by Abiola-Ogedengbe et al. [23], where the CFD model results seem to agree with the experimental results with an average error of 2–7% between the experimental and CFD results. The CFD results for the Cp values on the lower surface of the PV module differ from the experimental Cp values, especially at x/B = 0.48, which is the location of the array and column connection. This difference was expected since the array and column connection was neglected in CFD geometry due to a lack of data. The agreement between the CFD and the experimental results along with the grid independence study shows that the CFD simulation settings are valid and can be used for further investigations.
Figure 8.
Comparison between the 3D model and the experimental rig [23].
Figure 9.
Comparison between CFD and experimental results for Cp values.
4. Results
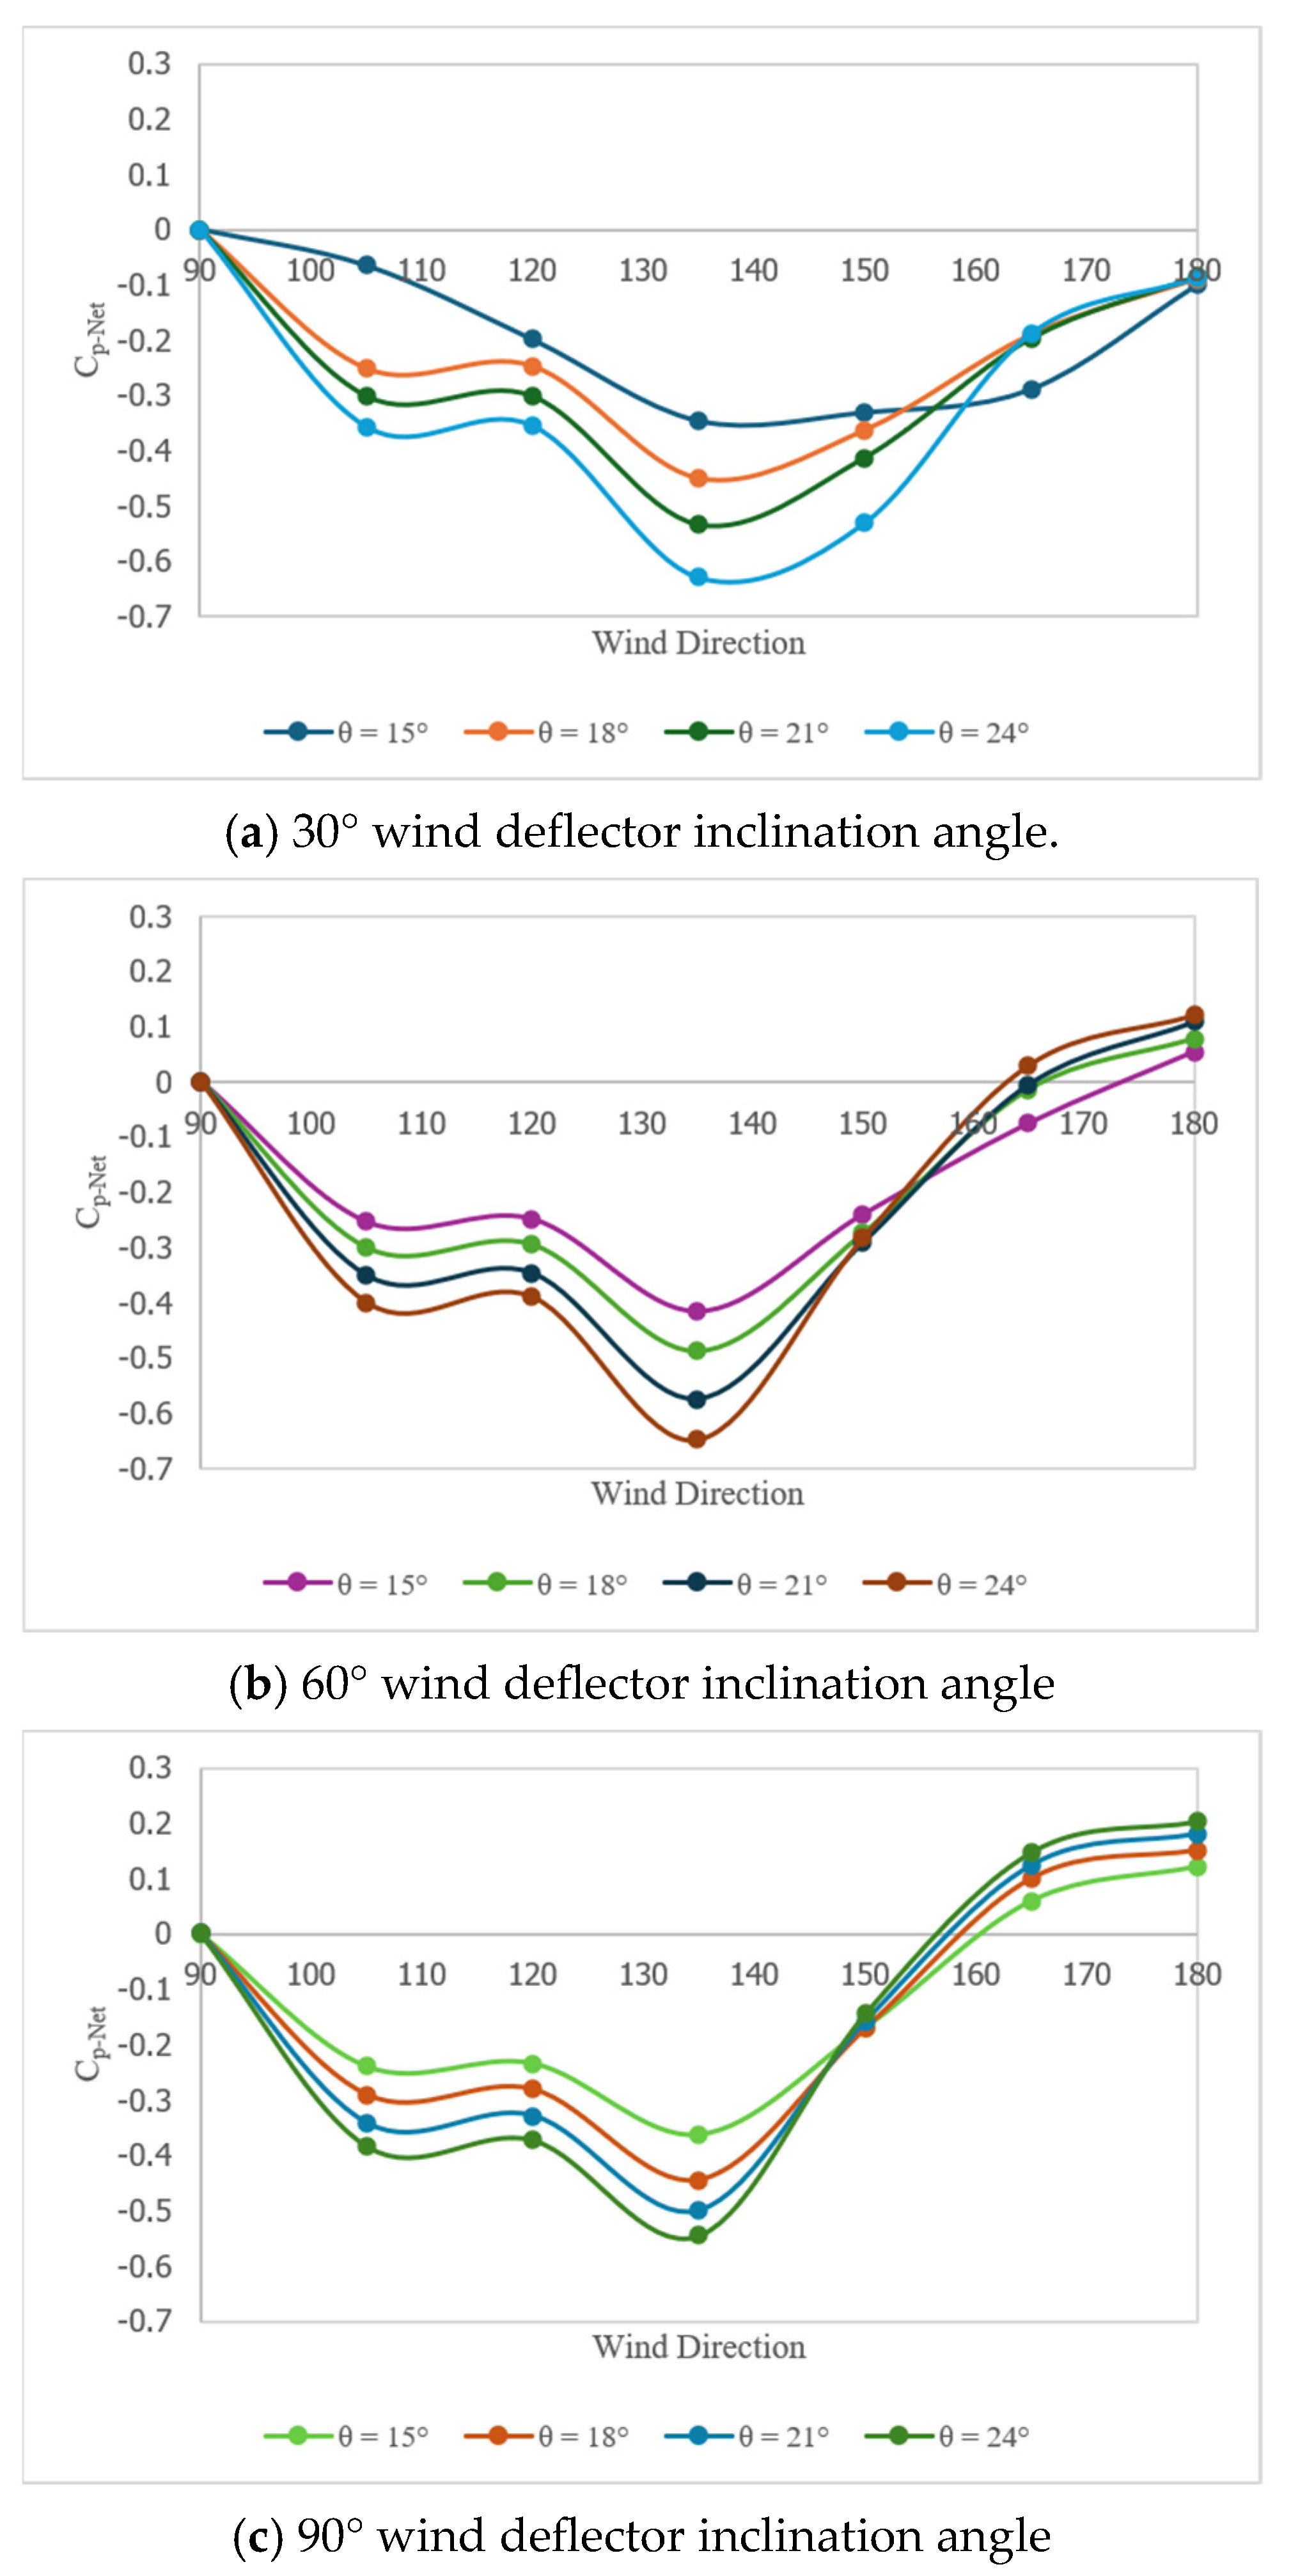
Figure 10 shows the Cp-Net values with respect to the wind direction as it changes from 90°, which indicates that the wind blows on the side of the solar panels to 180°, meaning that the wind blows on the back side of the solar panels. The pattern that Cp-Net values follow with respect to wind direction agreed with the findings of other researchers [26,35]. The effect of the wind deflector inclination angle on the Cp-Net values can be seen clearly by comparing Figure 10a–c, where it can be seen that the Cp-Net values changed from a suction negative pressure to a positive downward pushing pressure as the wind deflector inclination angle changed from 30° to 90° for the same wind direction angle of 180°. Figure 10 also shows a shift in the effect of wind deflector inclination angle with respect to the PV panel tilt angle as the wind direction changes from 90° to 150°. The highest Cp-Net values were achieved with a 15° PV panel tilt angle, whereas lower Cp-Net values were achieved with a 24° PV panel tilt angle. However, from 150° to 180° wind direction angles, the curve reversed and the highest Cp-Net values were achieved with a 24° PV panel tilt angle, whereas lower Cp-Net values were achieved with a 15° PV panel tilt angle. Since the PV panel tilt angles are chosen depending on the azimuth and the location in which the solar panels are to be installed, these results can be used to determine a favorable wind deflector inclination angle depending on the PV panel tilt angle, the location and the layout of the solar modules.
Figure 10.
Cp-Net with respect to the wind direction for the different wind deflector inclination angles.
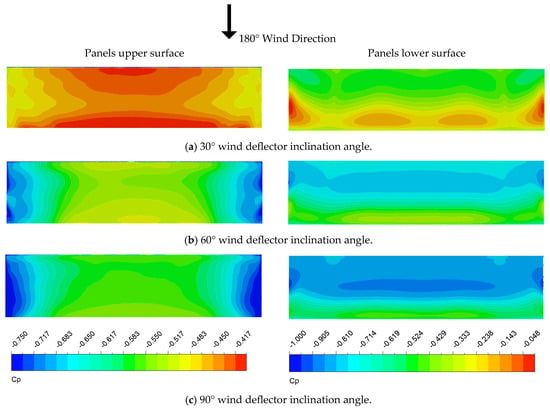
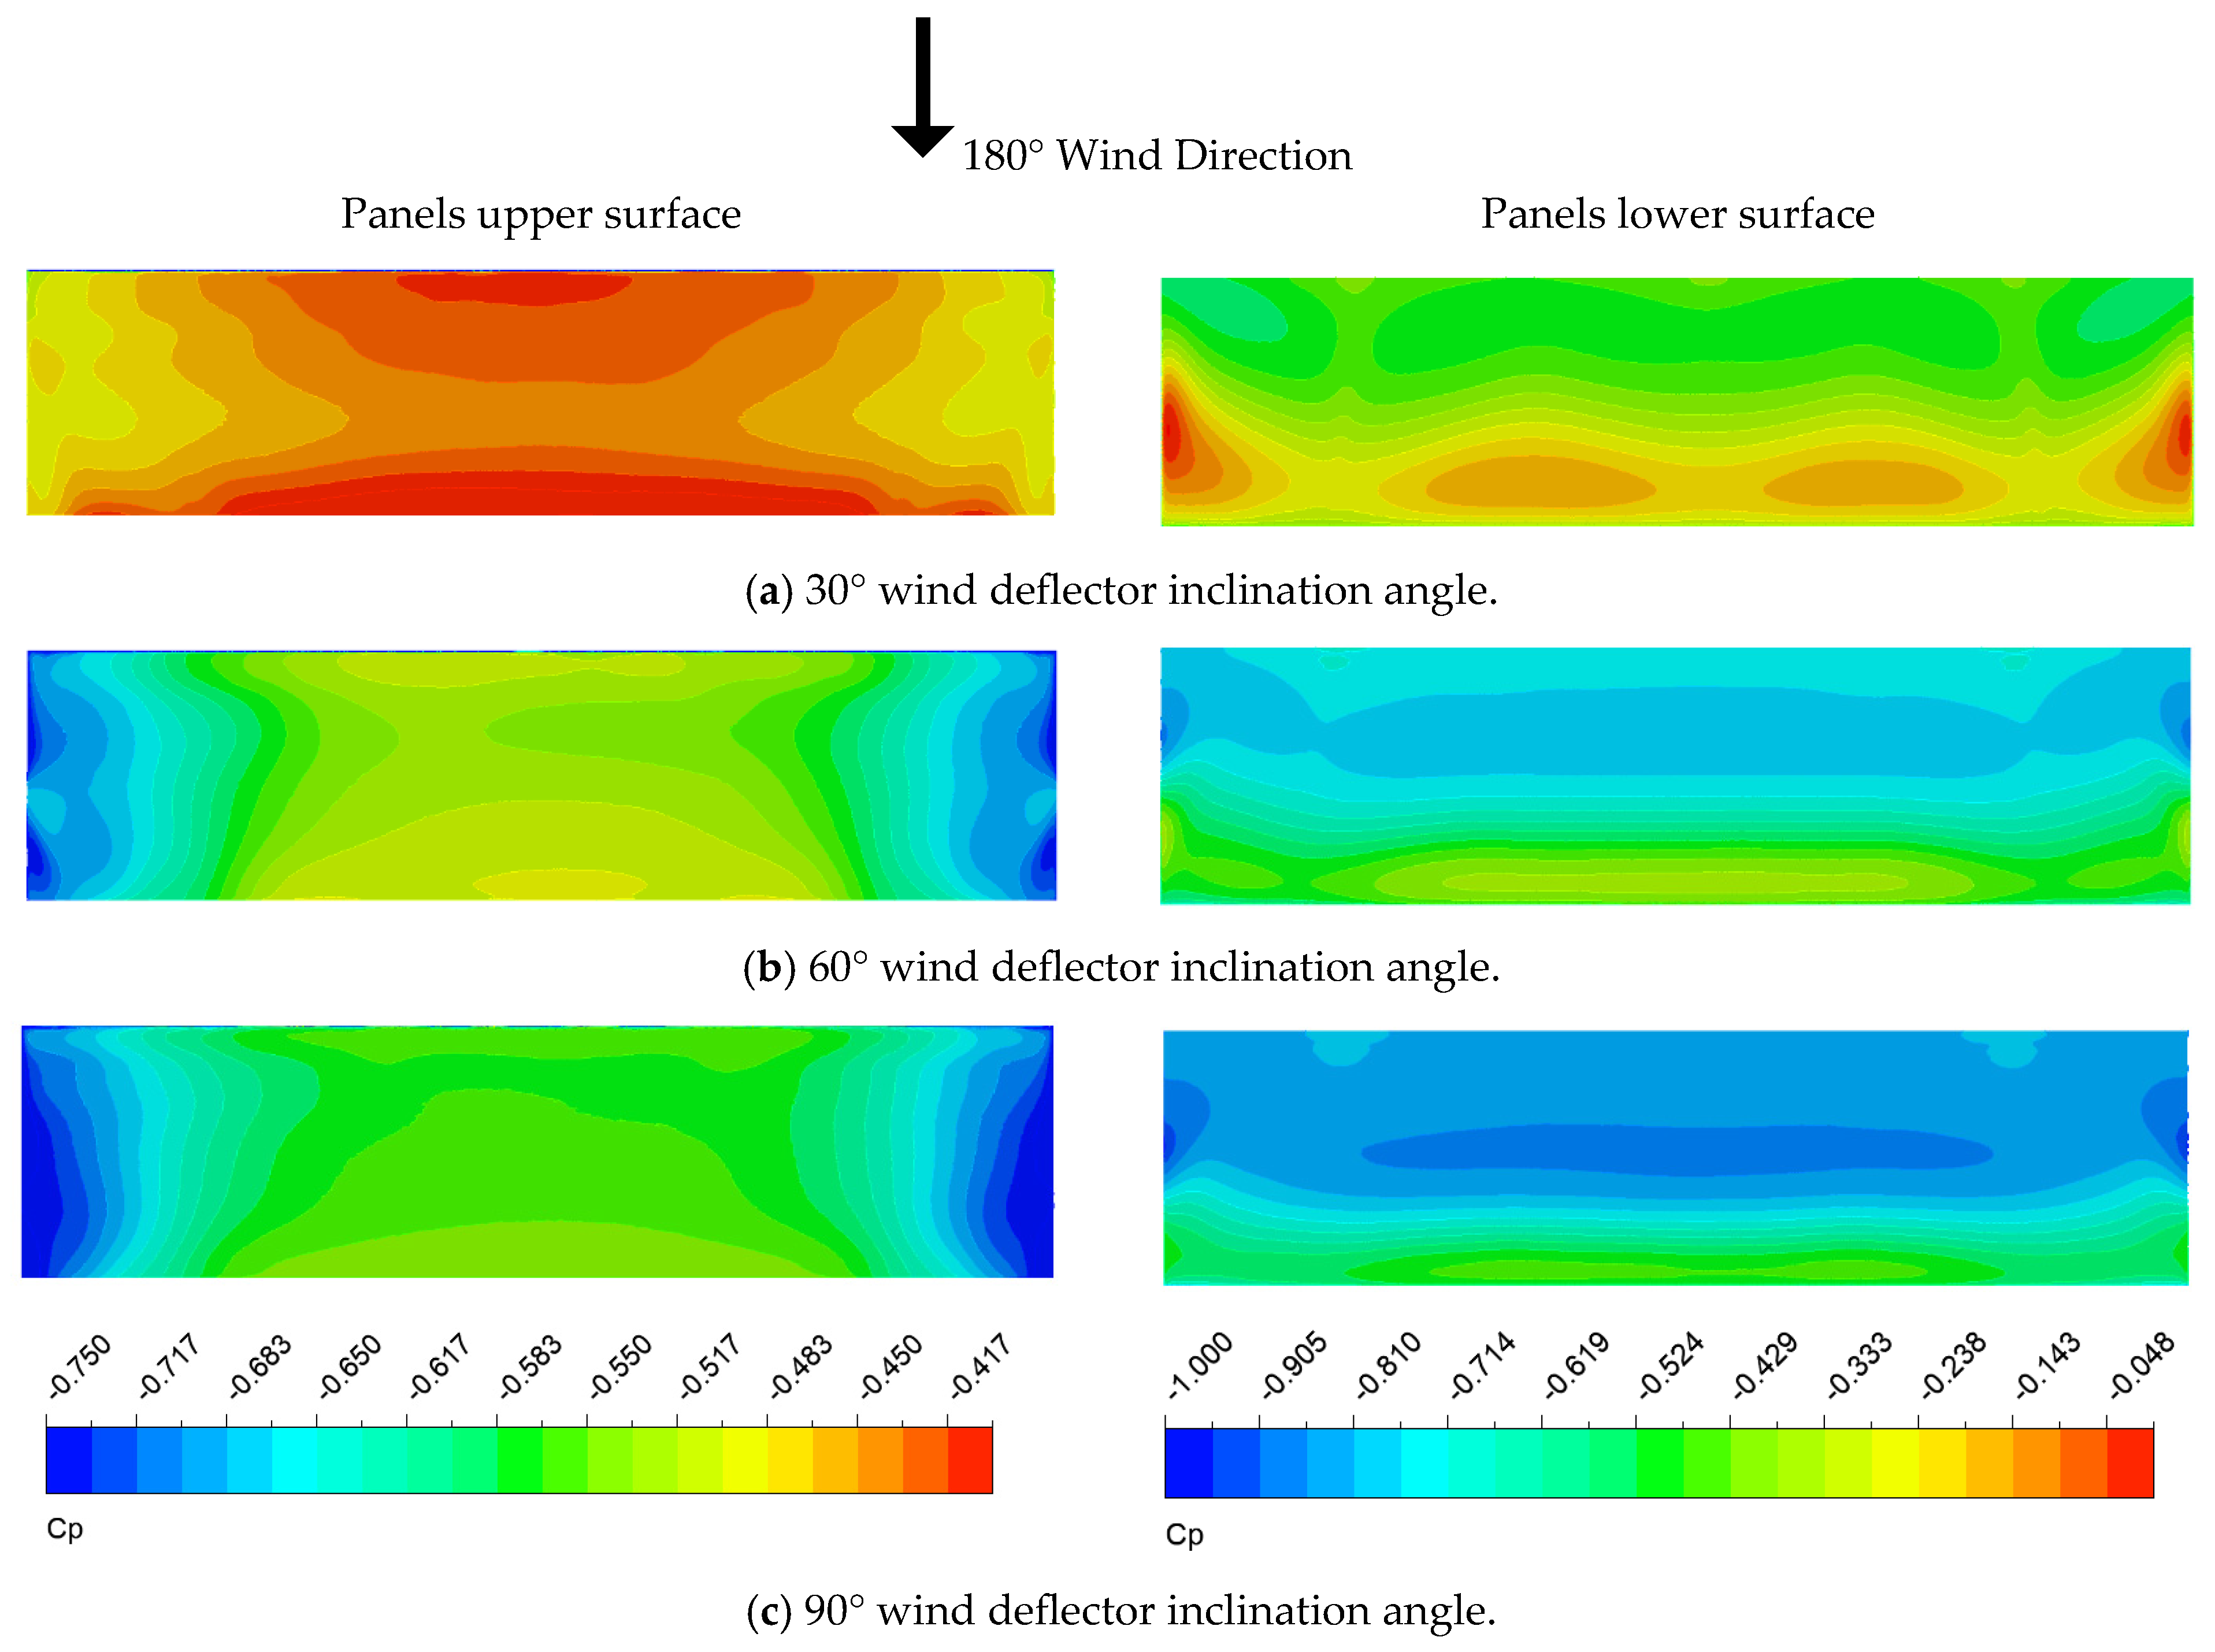
The pressure coefficient Cp distribution on the upper and lower surfaces of the solar panels at 180° wind direction angles and different wind deflector inclination angles can be seen in Figure 11. The upper surface of the solar panels shows symmetrical distribution, and the side edge of the solar panels was found to experience the lowest Cp value compared to the center.
Figure 11.
Cp contour on the lower surface of the solar panels for multiple wind deflector inclination angles and 18° PV panel tilt angle at 180° wind direction angle.
The Cp distribution on the lower surfaces of the panels starts with a lower value for Cp at the leading edge, increasing as the flow reaches the trailing edge, due to the low-pressure region generated by the acceleration of the flow [38]. Cp on the lower surface of the solar panels for 30° wind deflectors was higher than the 60° and 90° wind deflector inclination angles.
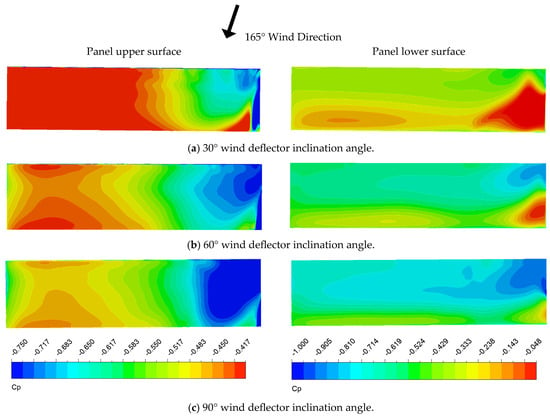
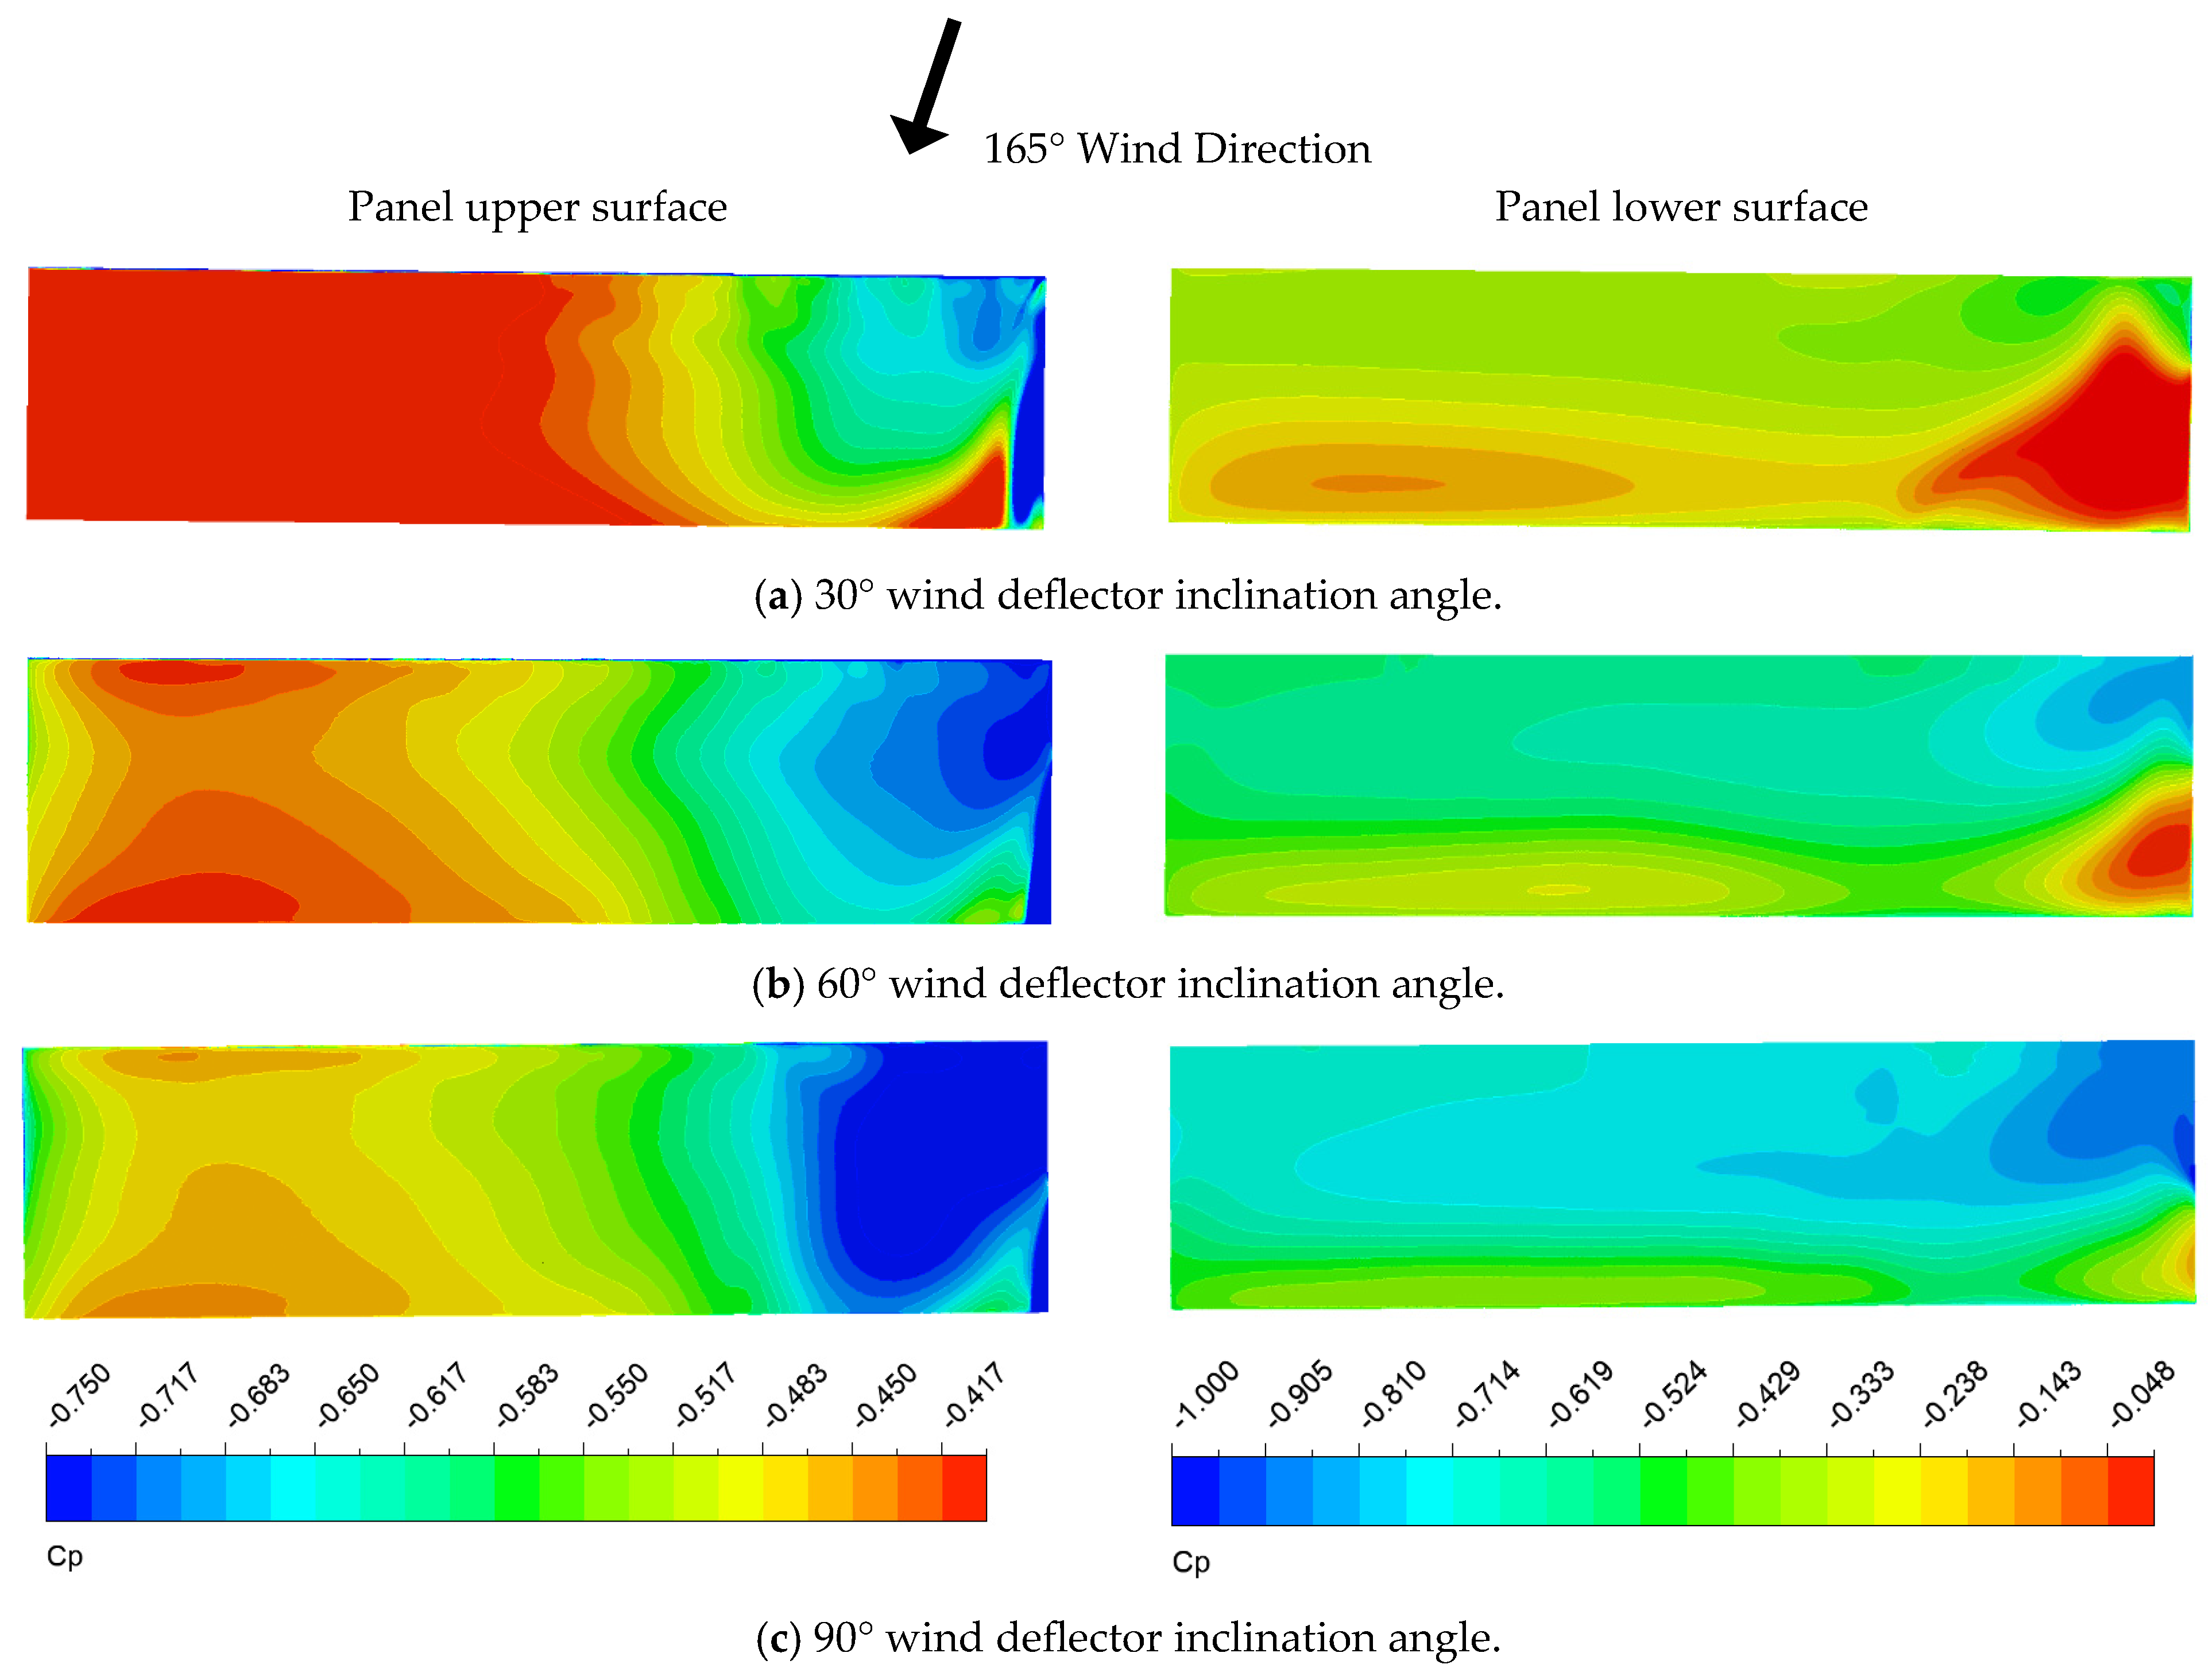
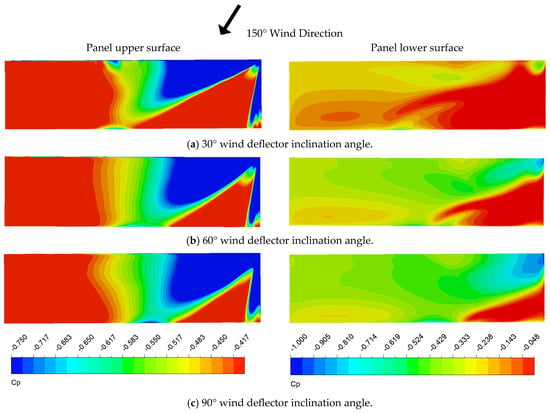
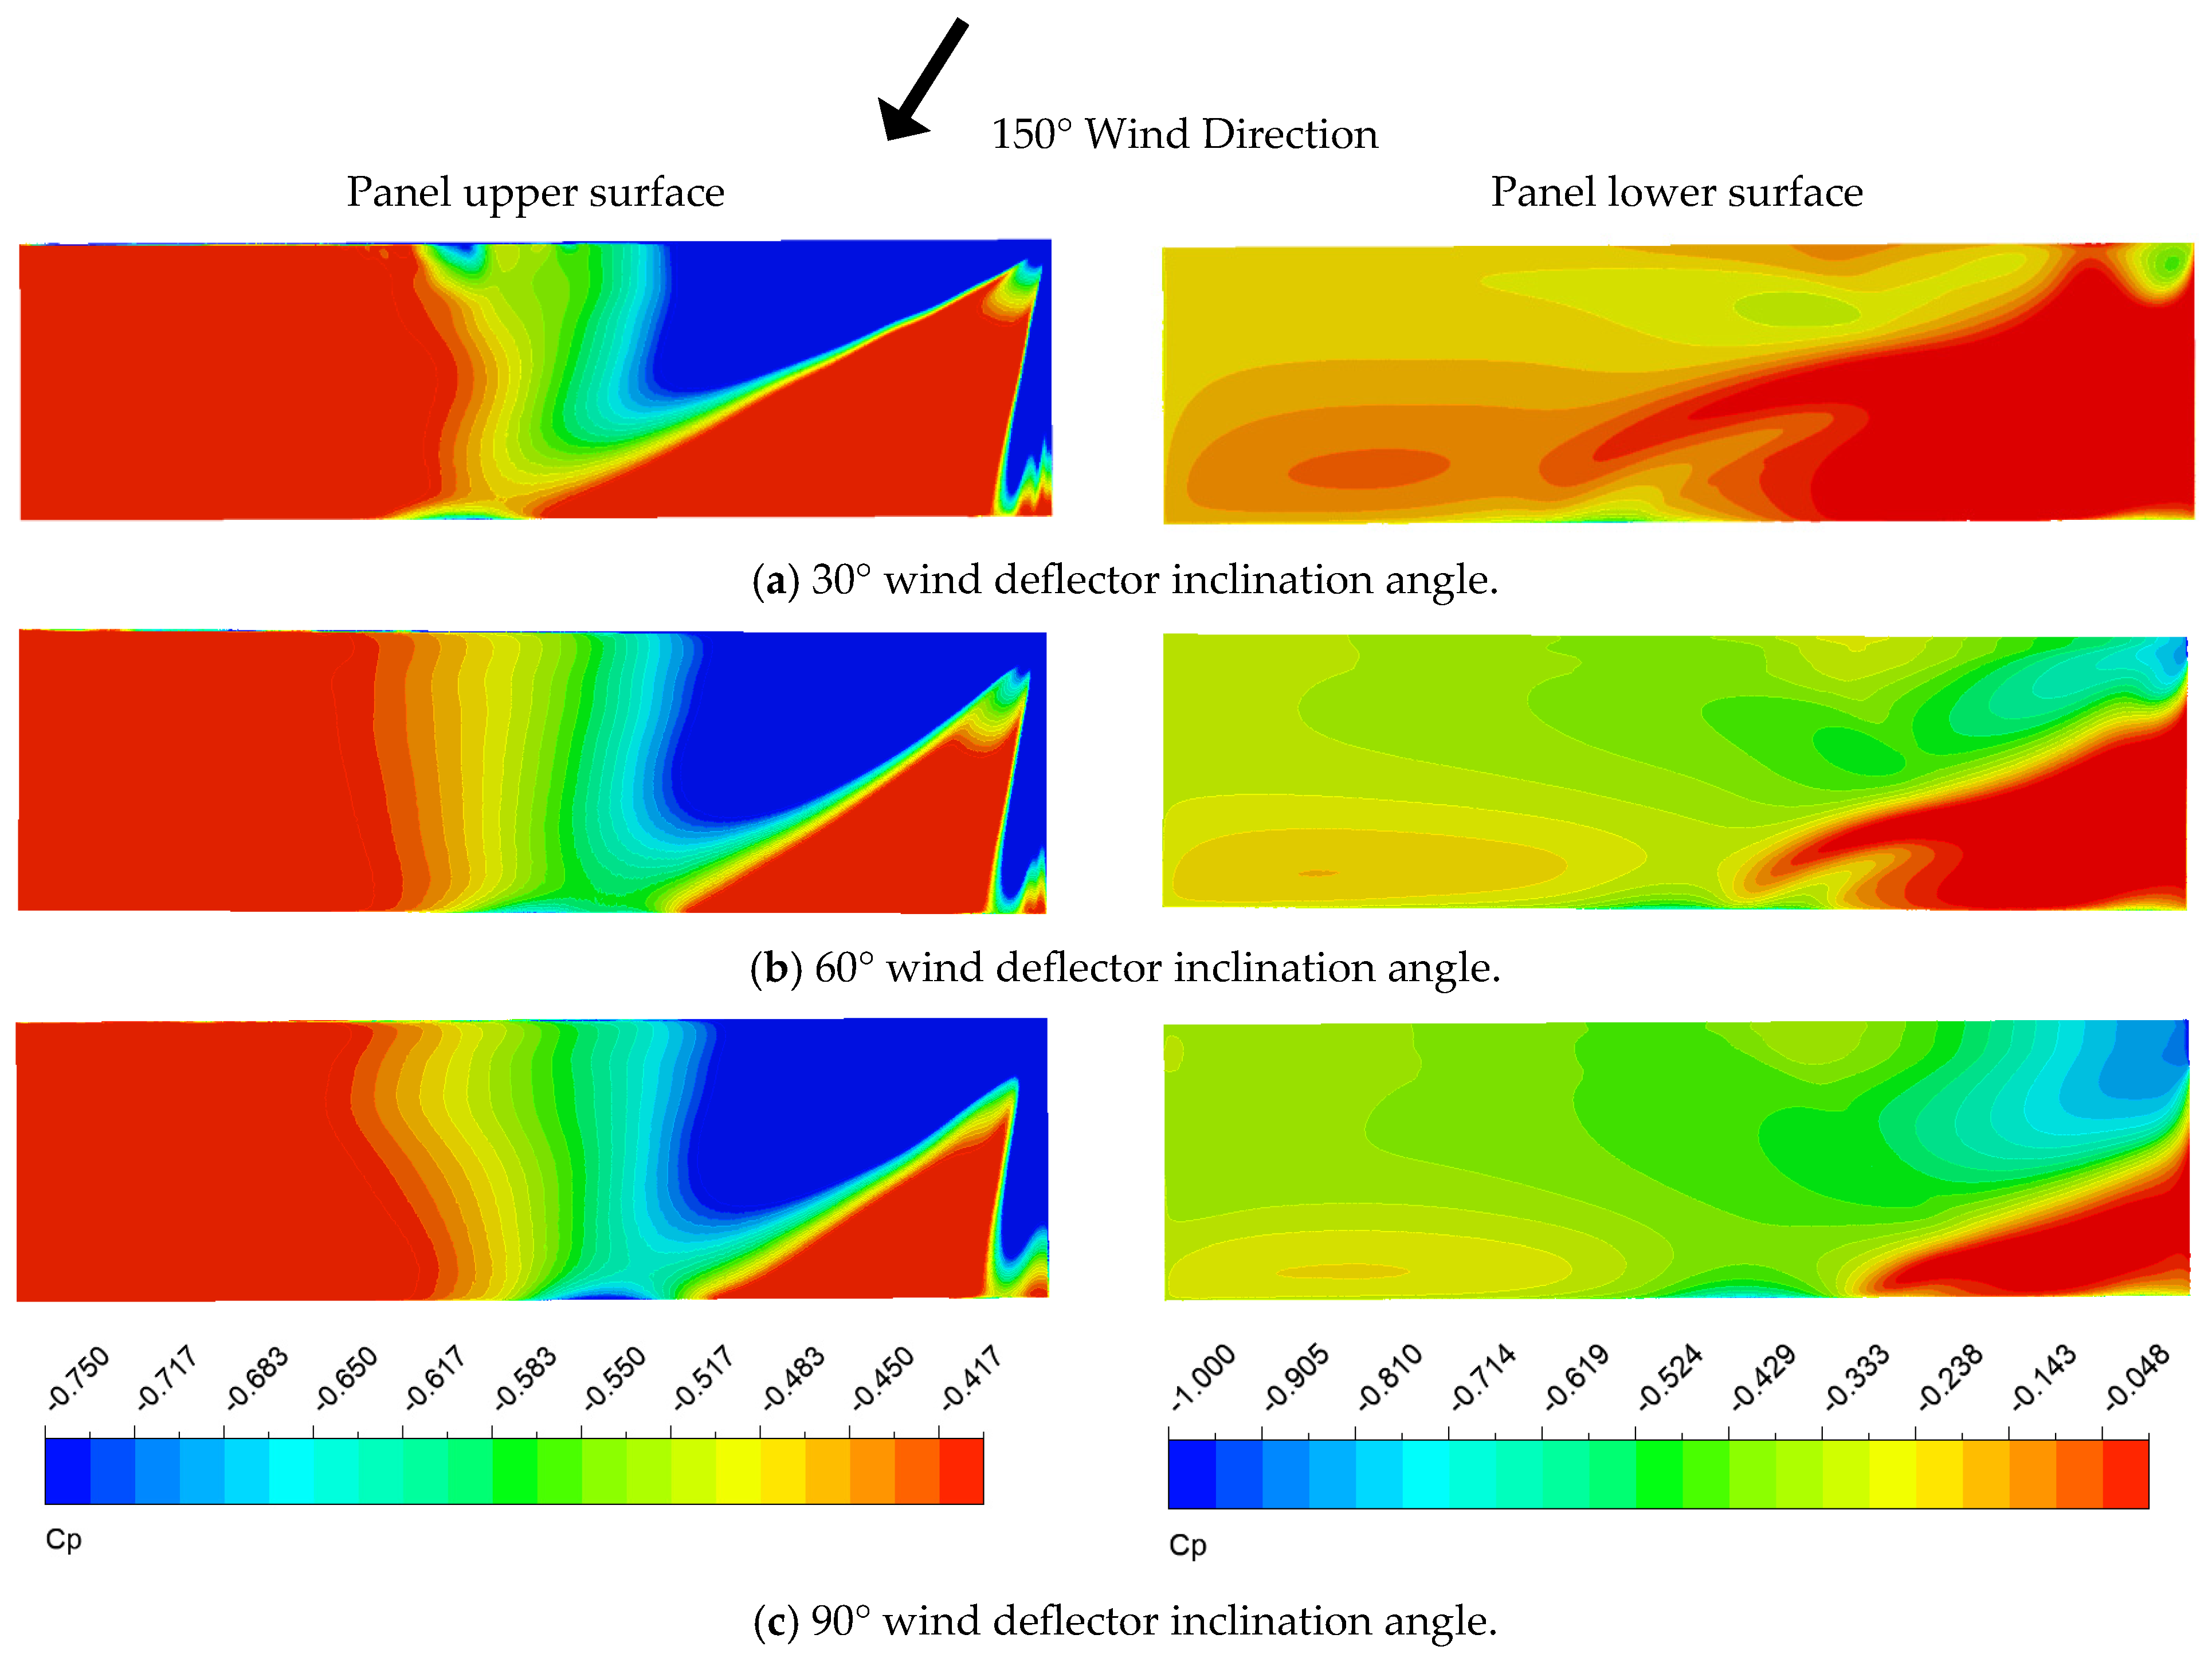
Figure 12 and Figure 13 show the Cp distribution on the upper and lower surfaces of the solar panels at 165° and 150° wind direction angles and different wind deflector inclination angles. A localized high-Cp region can be seen on the right-side lower surface of the solar panels starting from the upper-right corner of the lower surface of the solar module; when the wind direction is between 165° and 150°, the leading edge of the flow is close to the top-right side of the solar module, which, in return, creates higher pressure on the bottom-right corner of the solar module. This behavior may indicate the possibility of vortex generation on the corners of the lower region of the solar module.
Figure 12.
Cp contour on the lower surface of the solar panels for multiple wind deflector inclination angles and 18° PV panel tilt angle at 165° wind direction angle.
Figure 13.
Cp contour on the lower surface of the solar panels for multiple wind deflector inclination angles and 18° PV panel tilt angle at 150° wind direction angle.
Figure 13 shows that the Cp values on the top surface of the solar panels were much lower than the bottom surface of the solar panels when the wind deflector inclination angles were 30° and 60°, which indicate higher suction pressure on the upper surface of the solar panels in these cases.
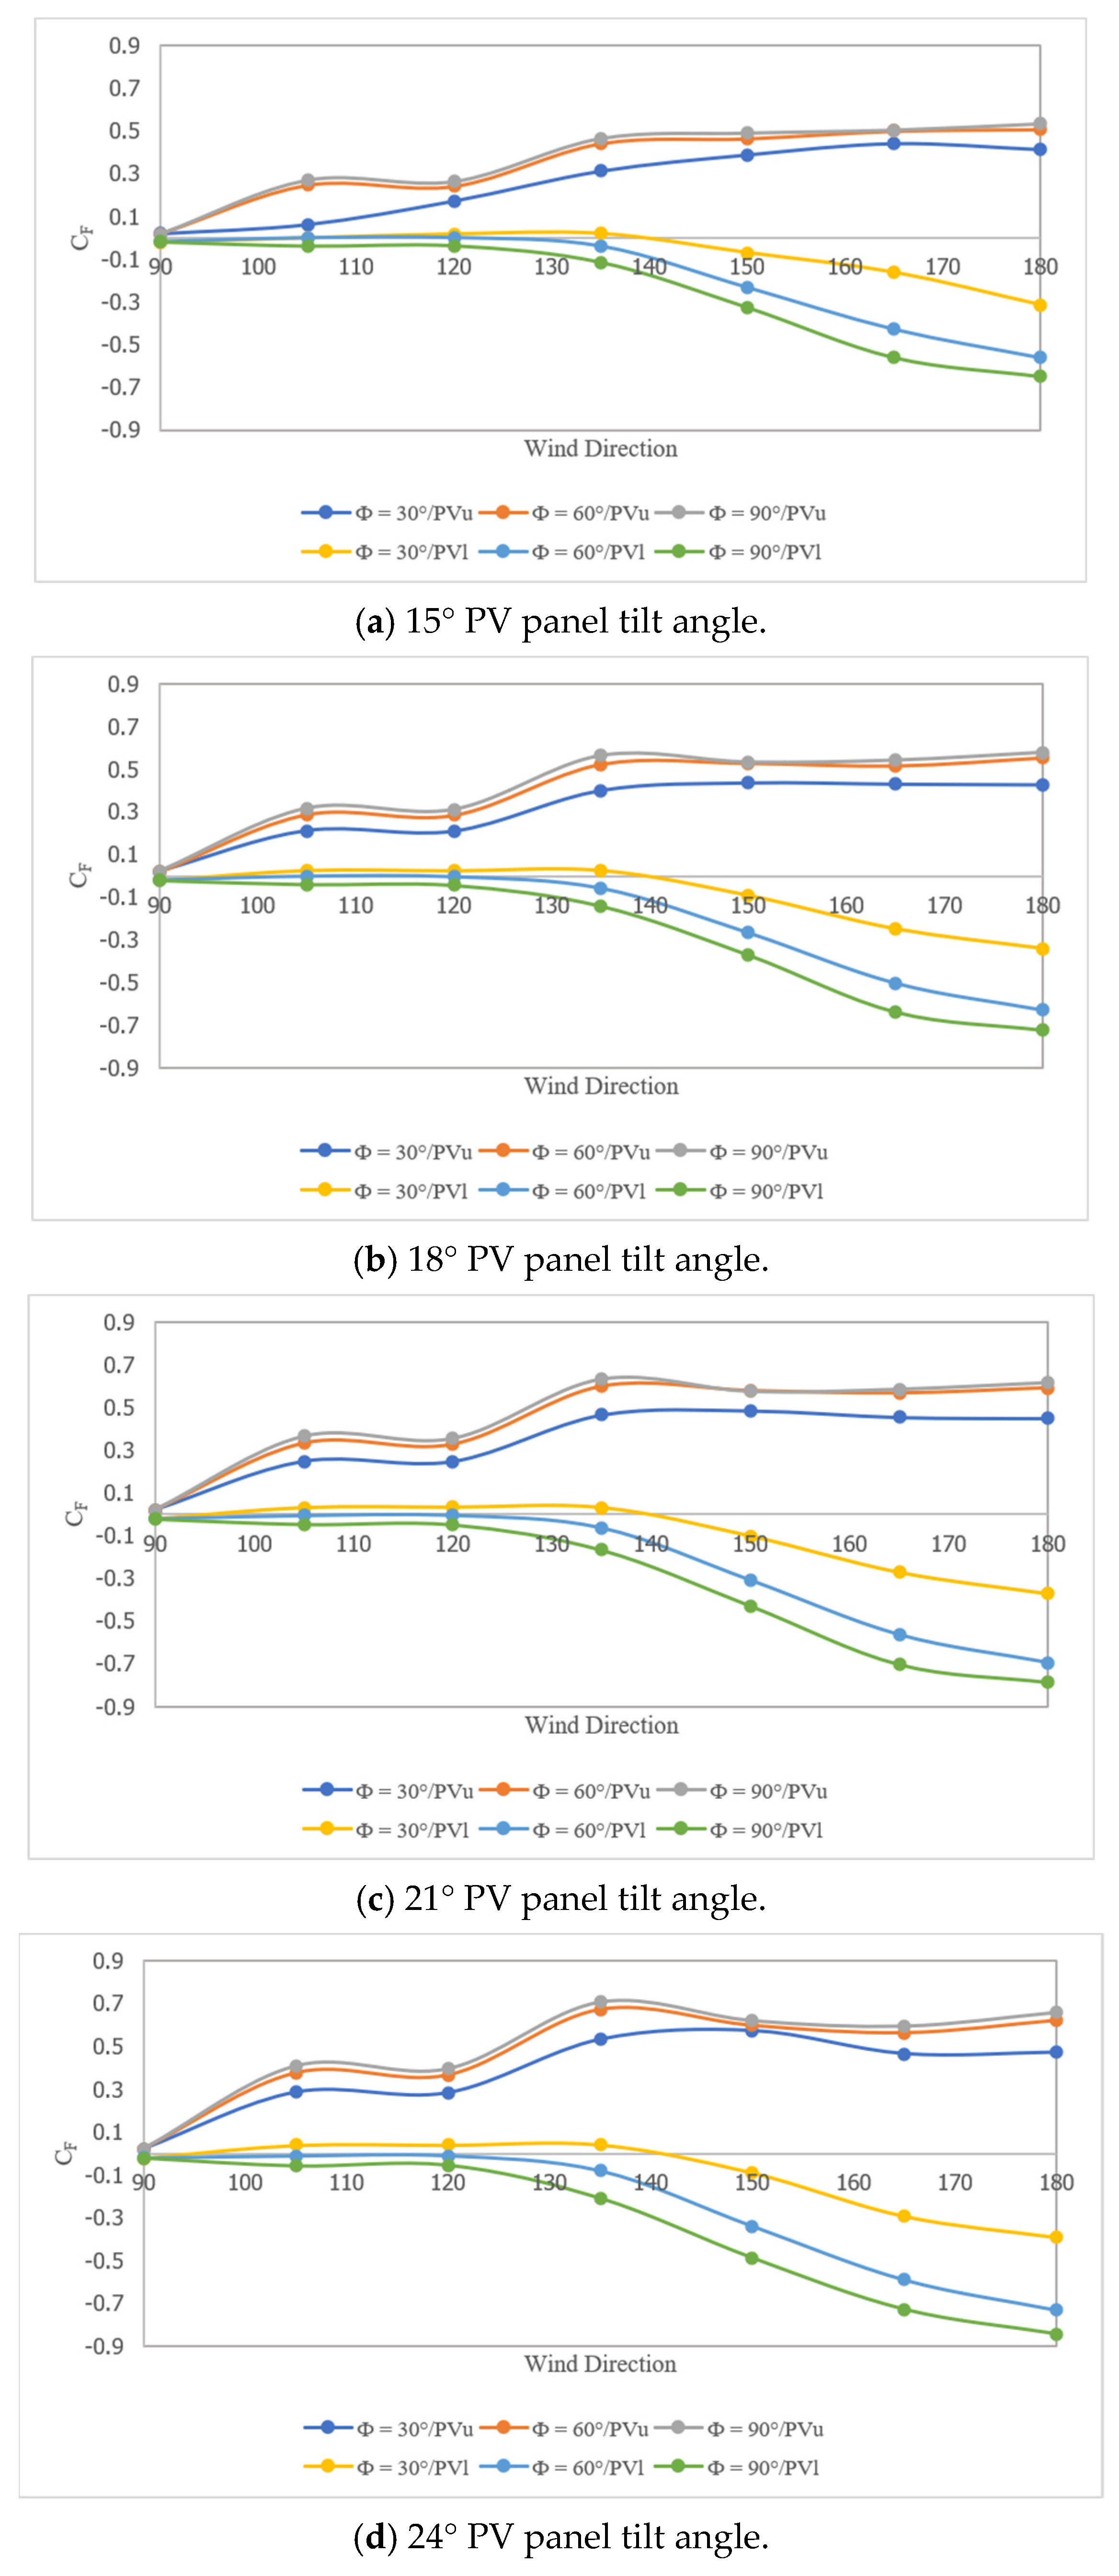
When the lift force acts on the lower surface of the solar panels, the lift coefficient becomes negative, whereas when the lift force acts on the upper surface of the solar panels, the lift coefficient becomes positive in value [6].
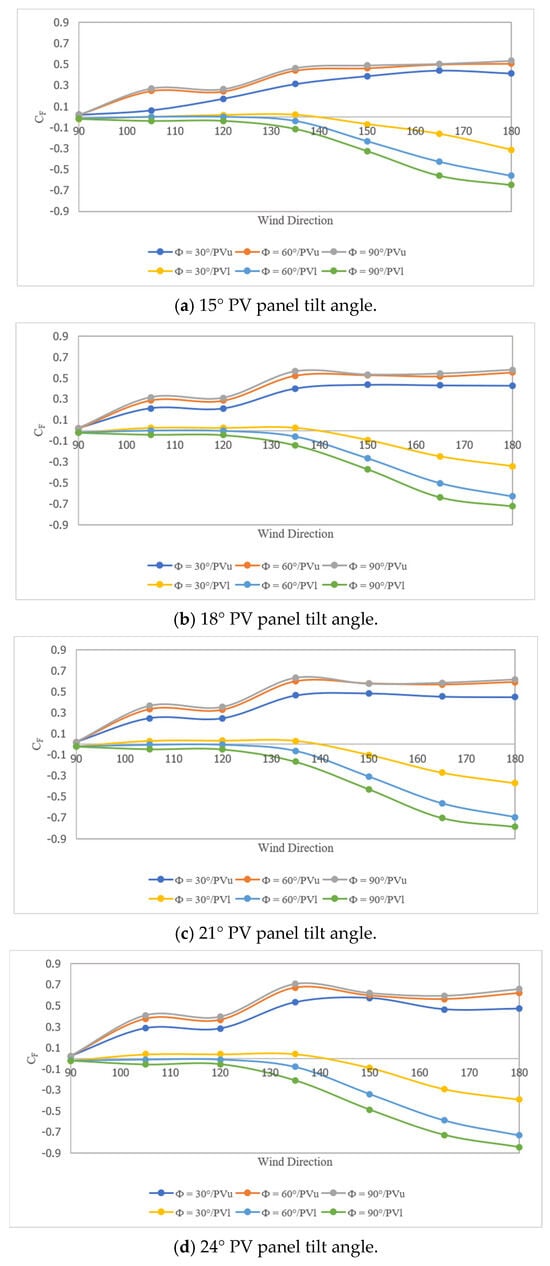
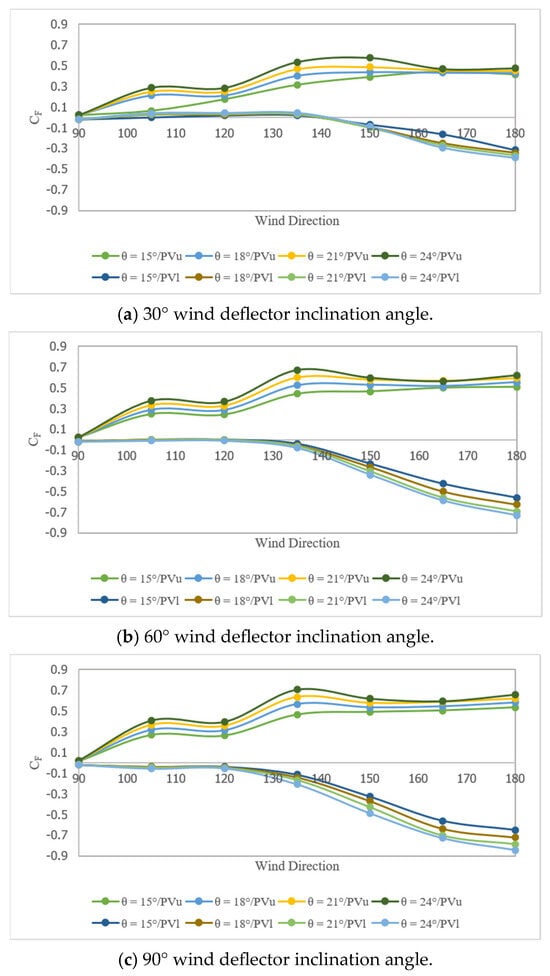
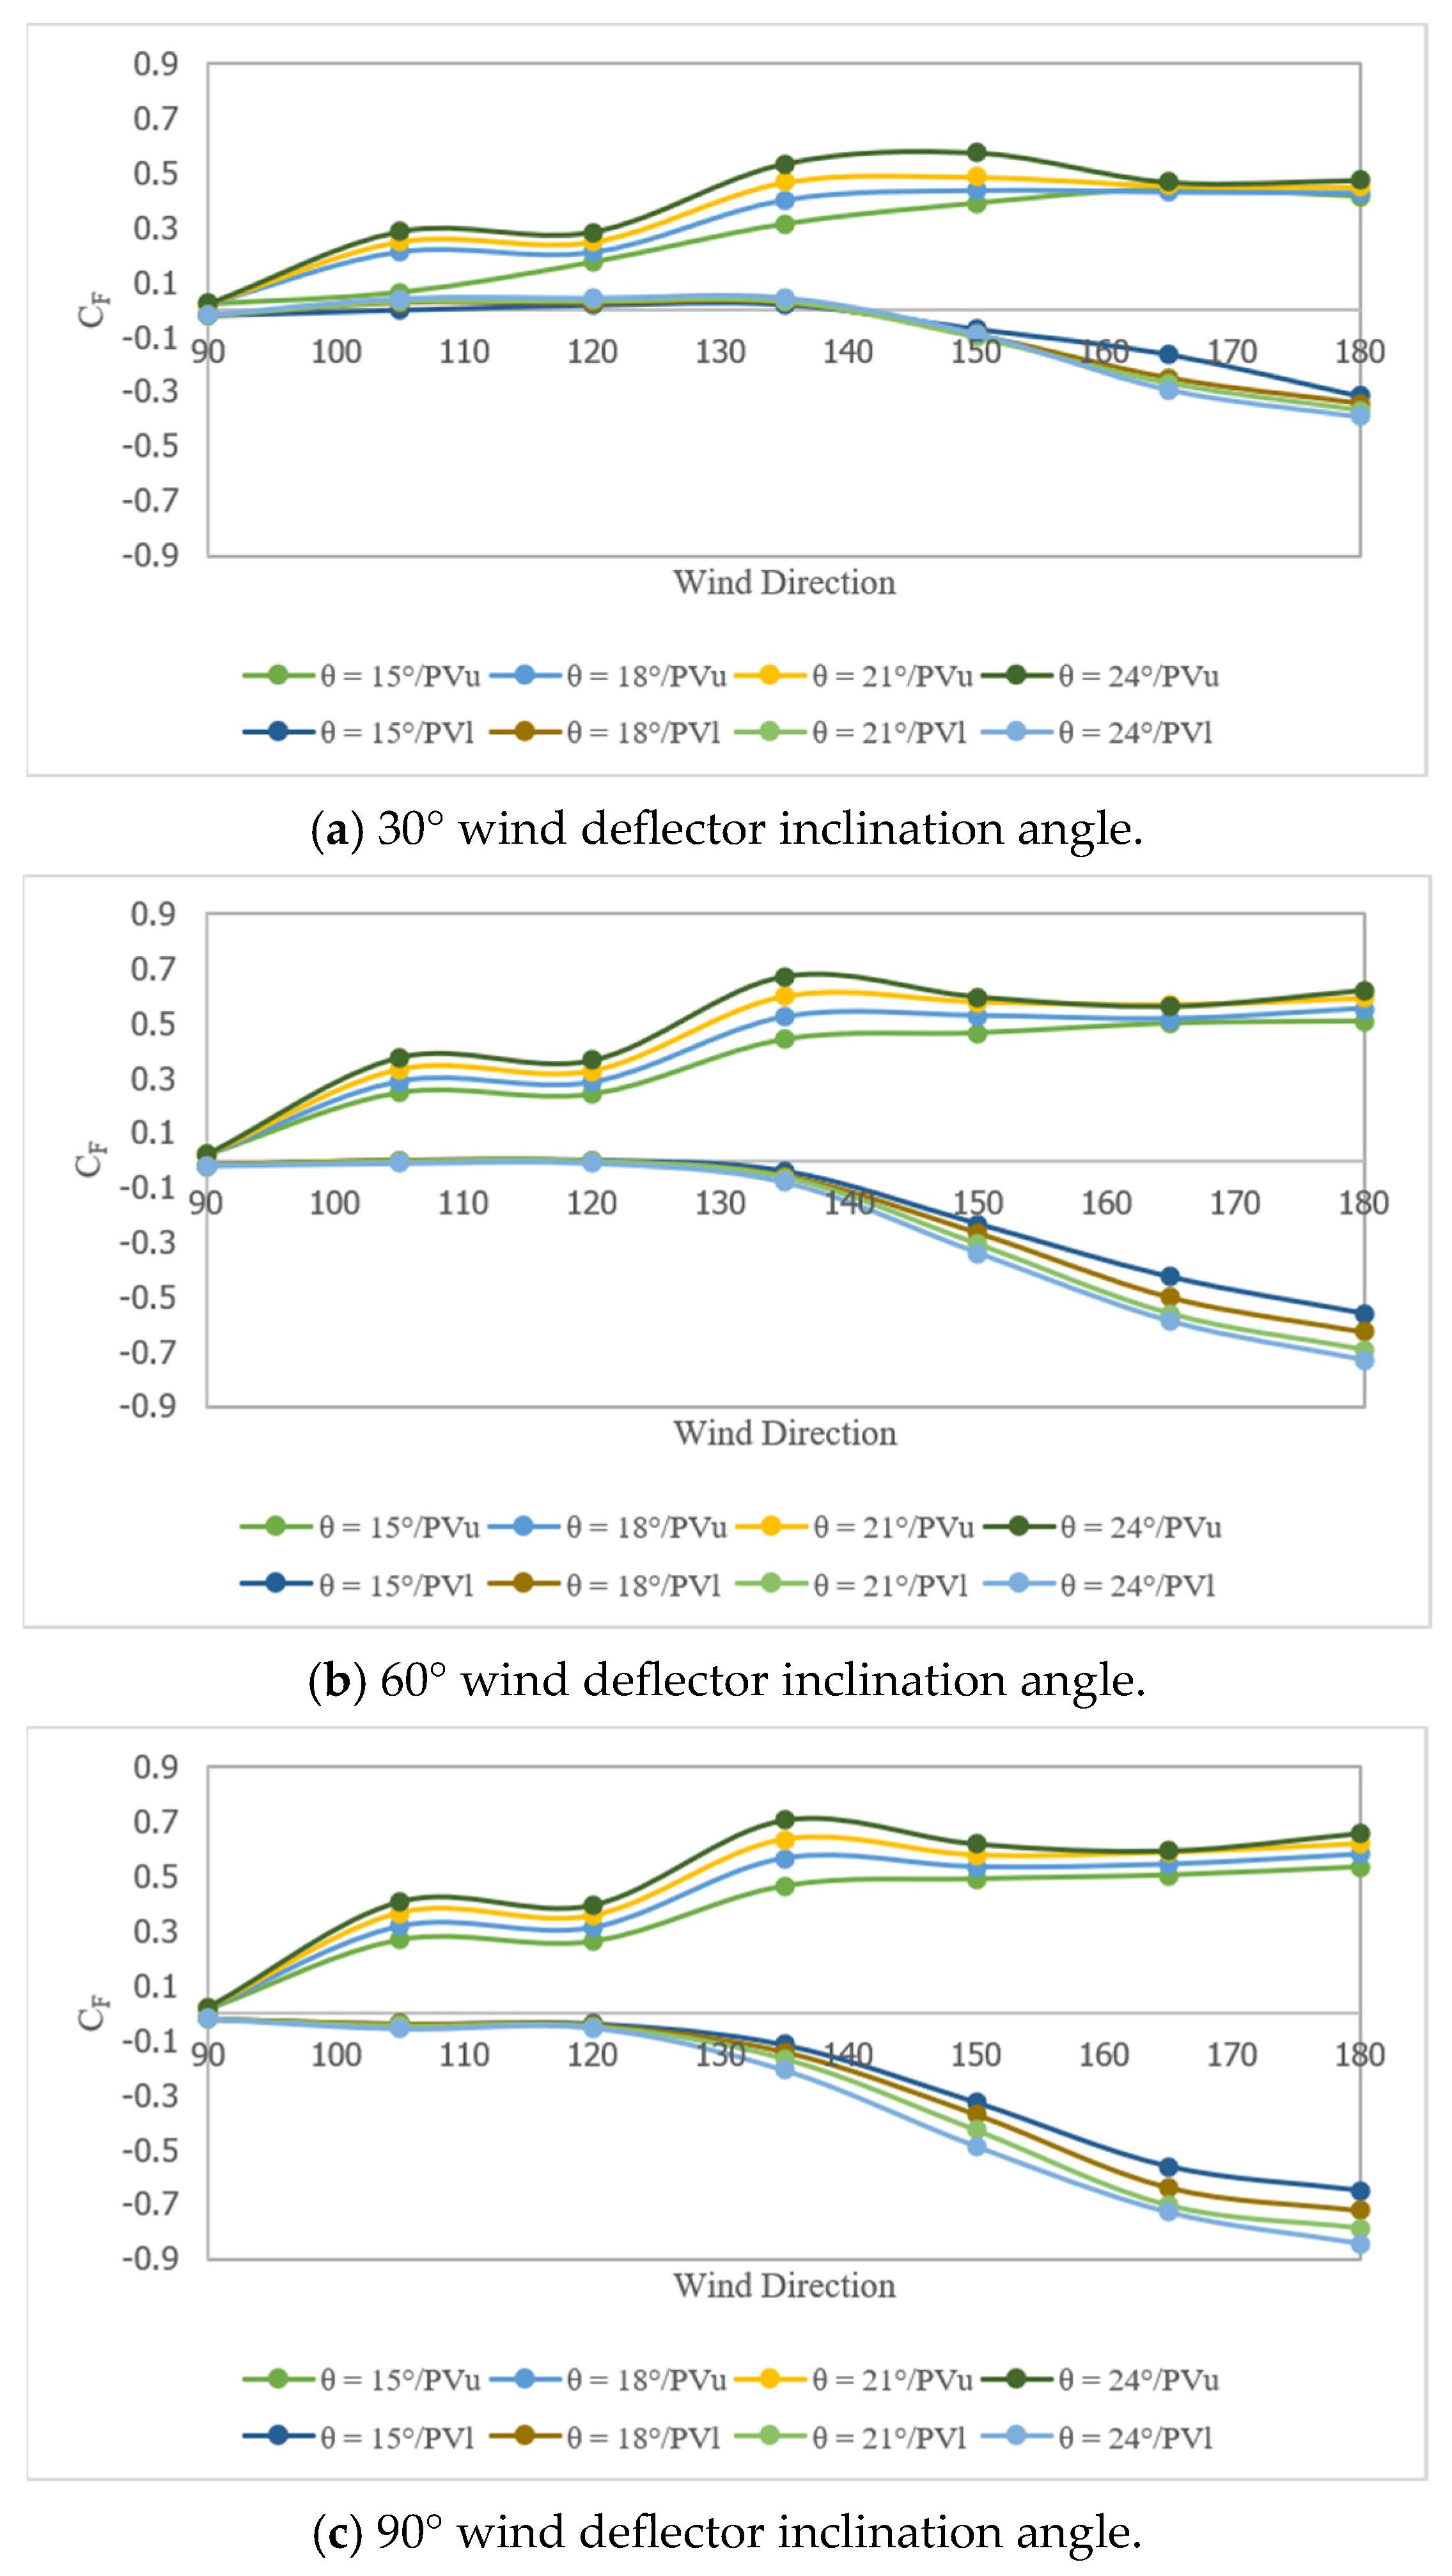
Figure 14 shows the lift coefficient for the investigated wind deflector inclination angles with respect to the wind direction and the tested PV panel tilt angles. For all tested PV panel tilt angles and wind deflector inclination angles, the greatest lift coefficient was found when the wind direction was 180°, which is consistent with the findings of other researchers [6,31]. Figure 14 shows the lift coefficient separately on the upper and lower surfaces of the solar panels. The lowest lift coefficient values were registered when the wind deflector inclination angle was 30°, both on the upper and lower surfaces of the PV panels, followed by a 60° wind deflector inclination angle and finally 90° wind deflector inclination angle. At 180° wind direction and 15° PV panel tilt angle, the module with a 30° wind deflector inclination angle showed a 38.49% decrease in the lift coefficient compared with module that has a 90° wind deflector inclination angle. It can be concluded that the wind deflector inclination angle has a greater effect on the lower surface of the solar panels than the upper surface. The PV panel tilt angle difference along with wind deflector inclination angle can be seen in Figure 15. The 15° PV panel tilt angle showed the lowest lift coefficient compared with the other PV panel tilt angles that were investigated.
Figure 14.
Lift coefficient with respect to the wind direction for different PV panel tilt angles.
Figure 15.
Lift coefficient with respect to the wind direction for different wind deflectors inclination angles.
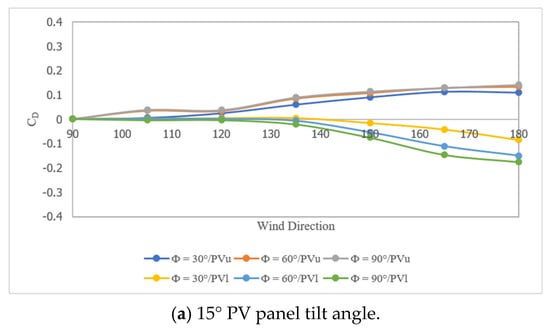
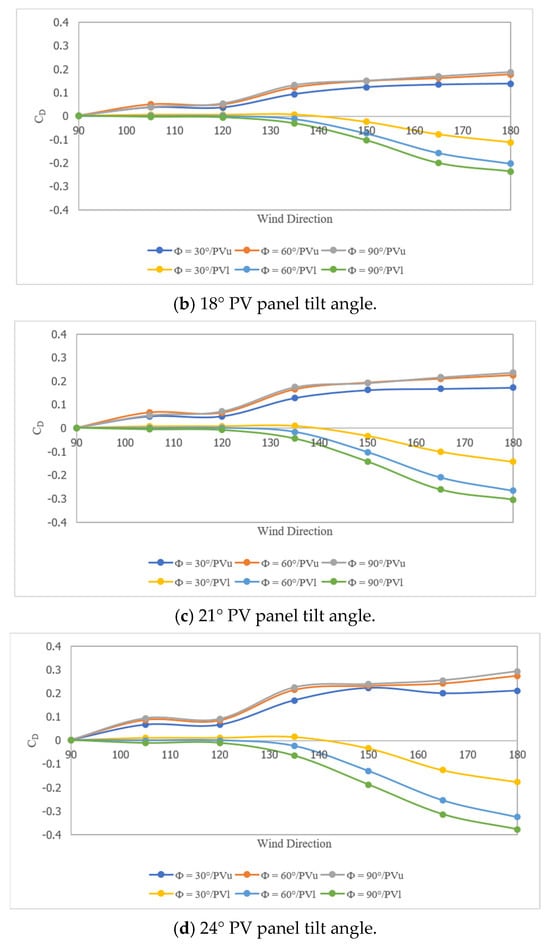
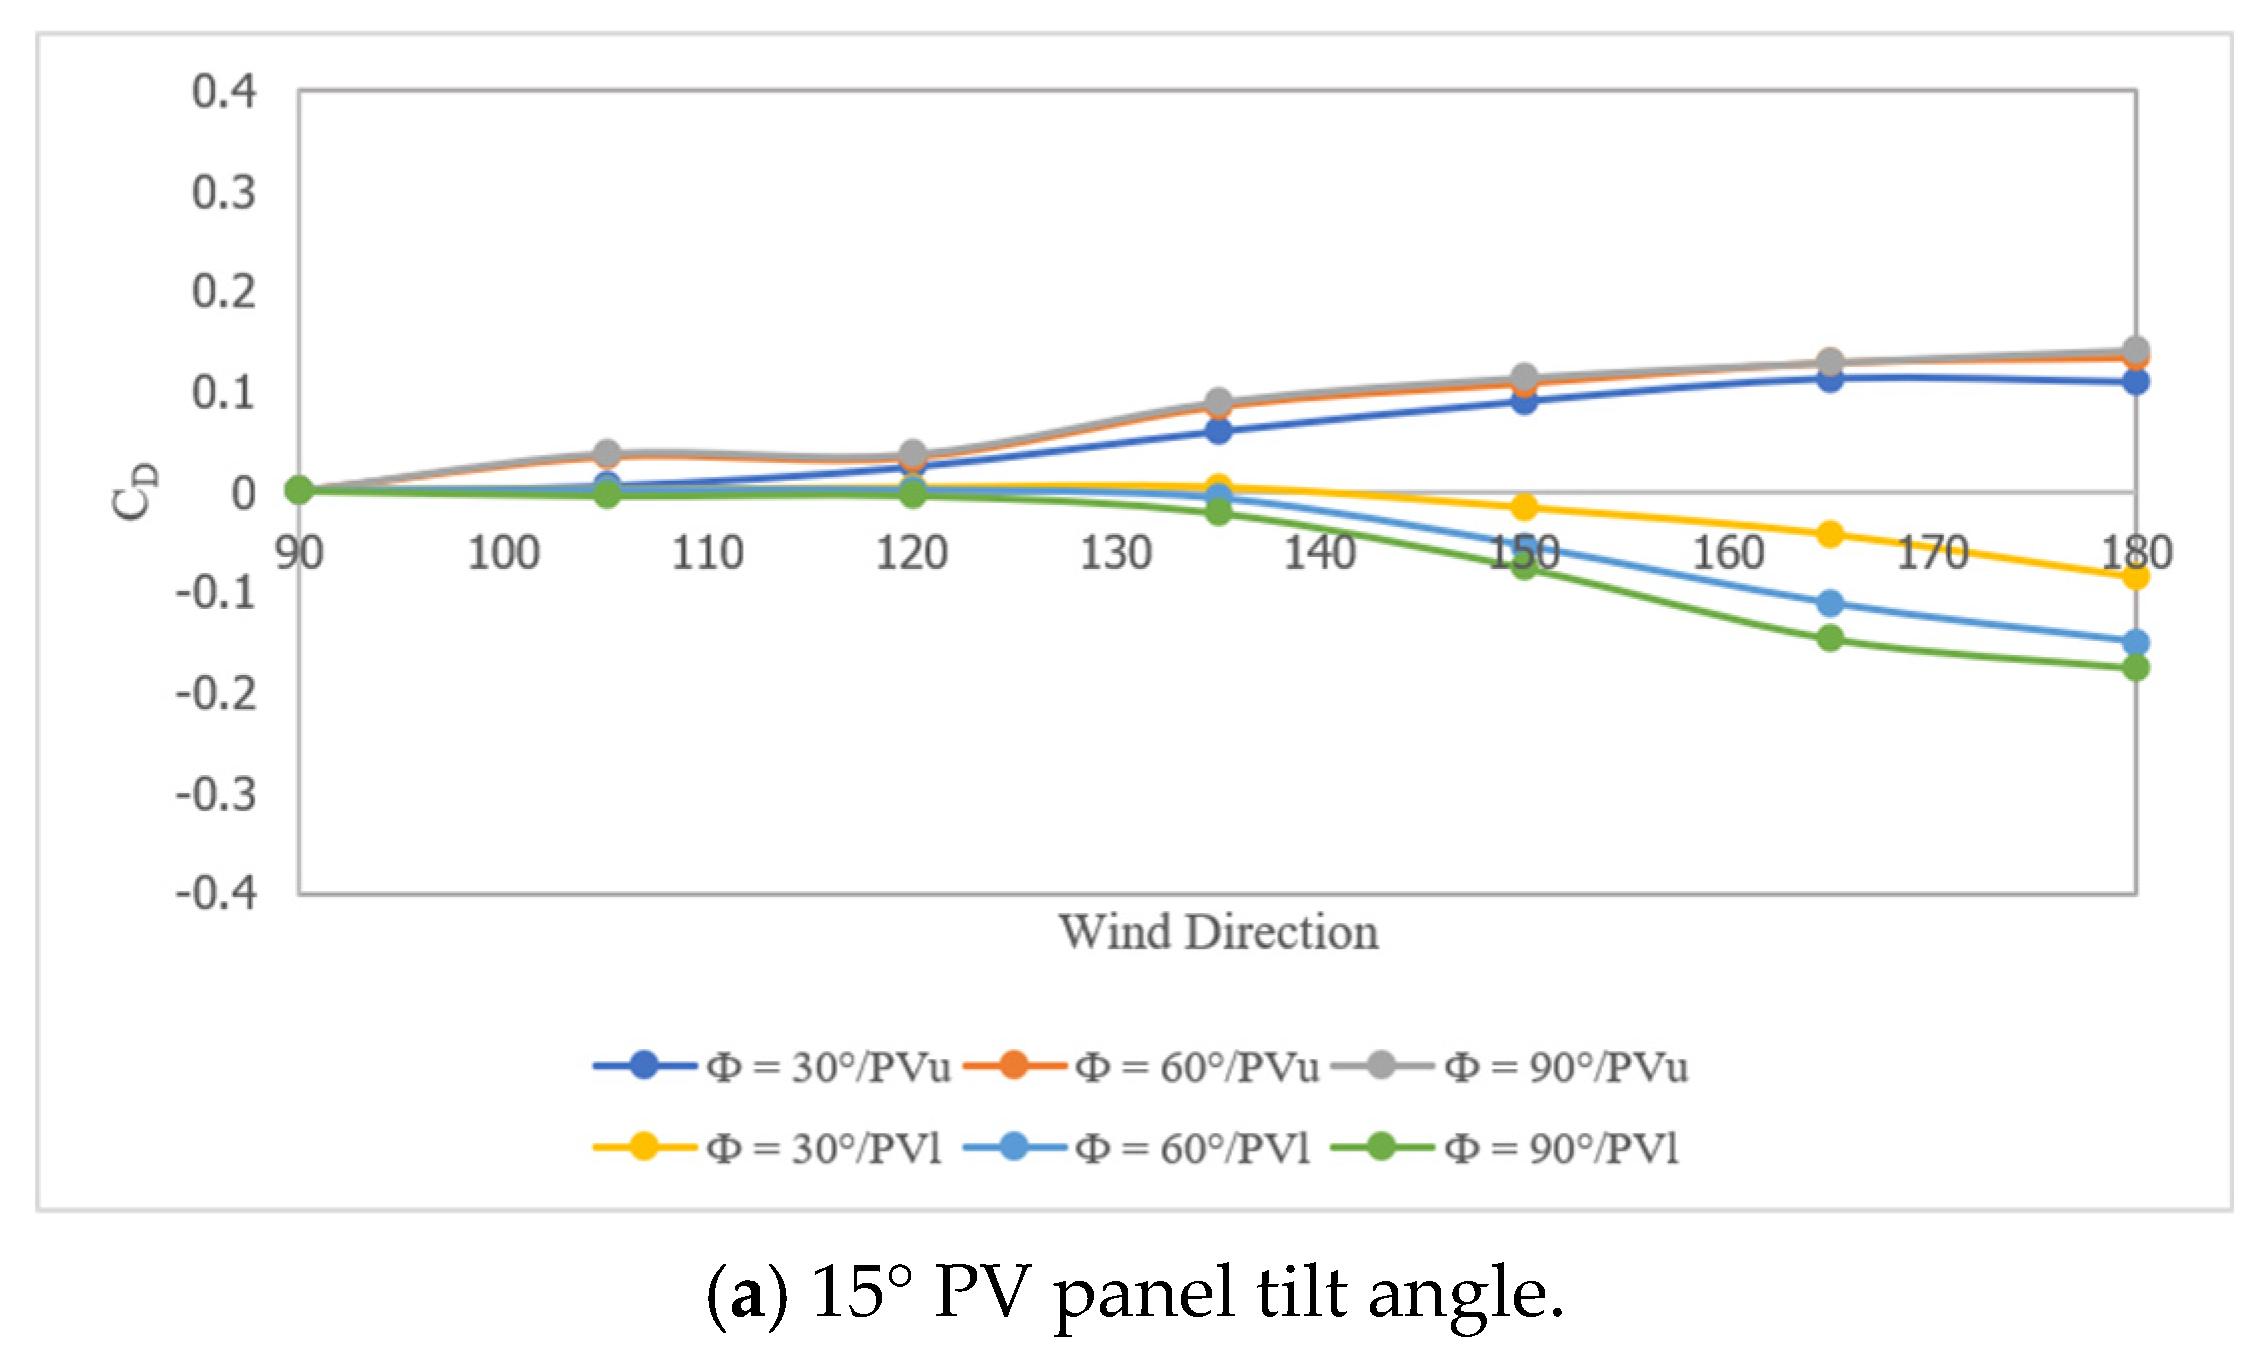
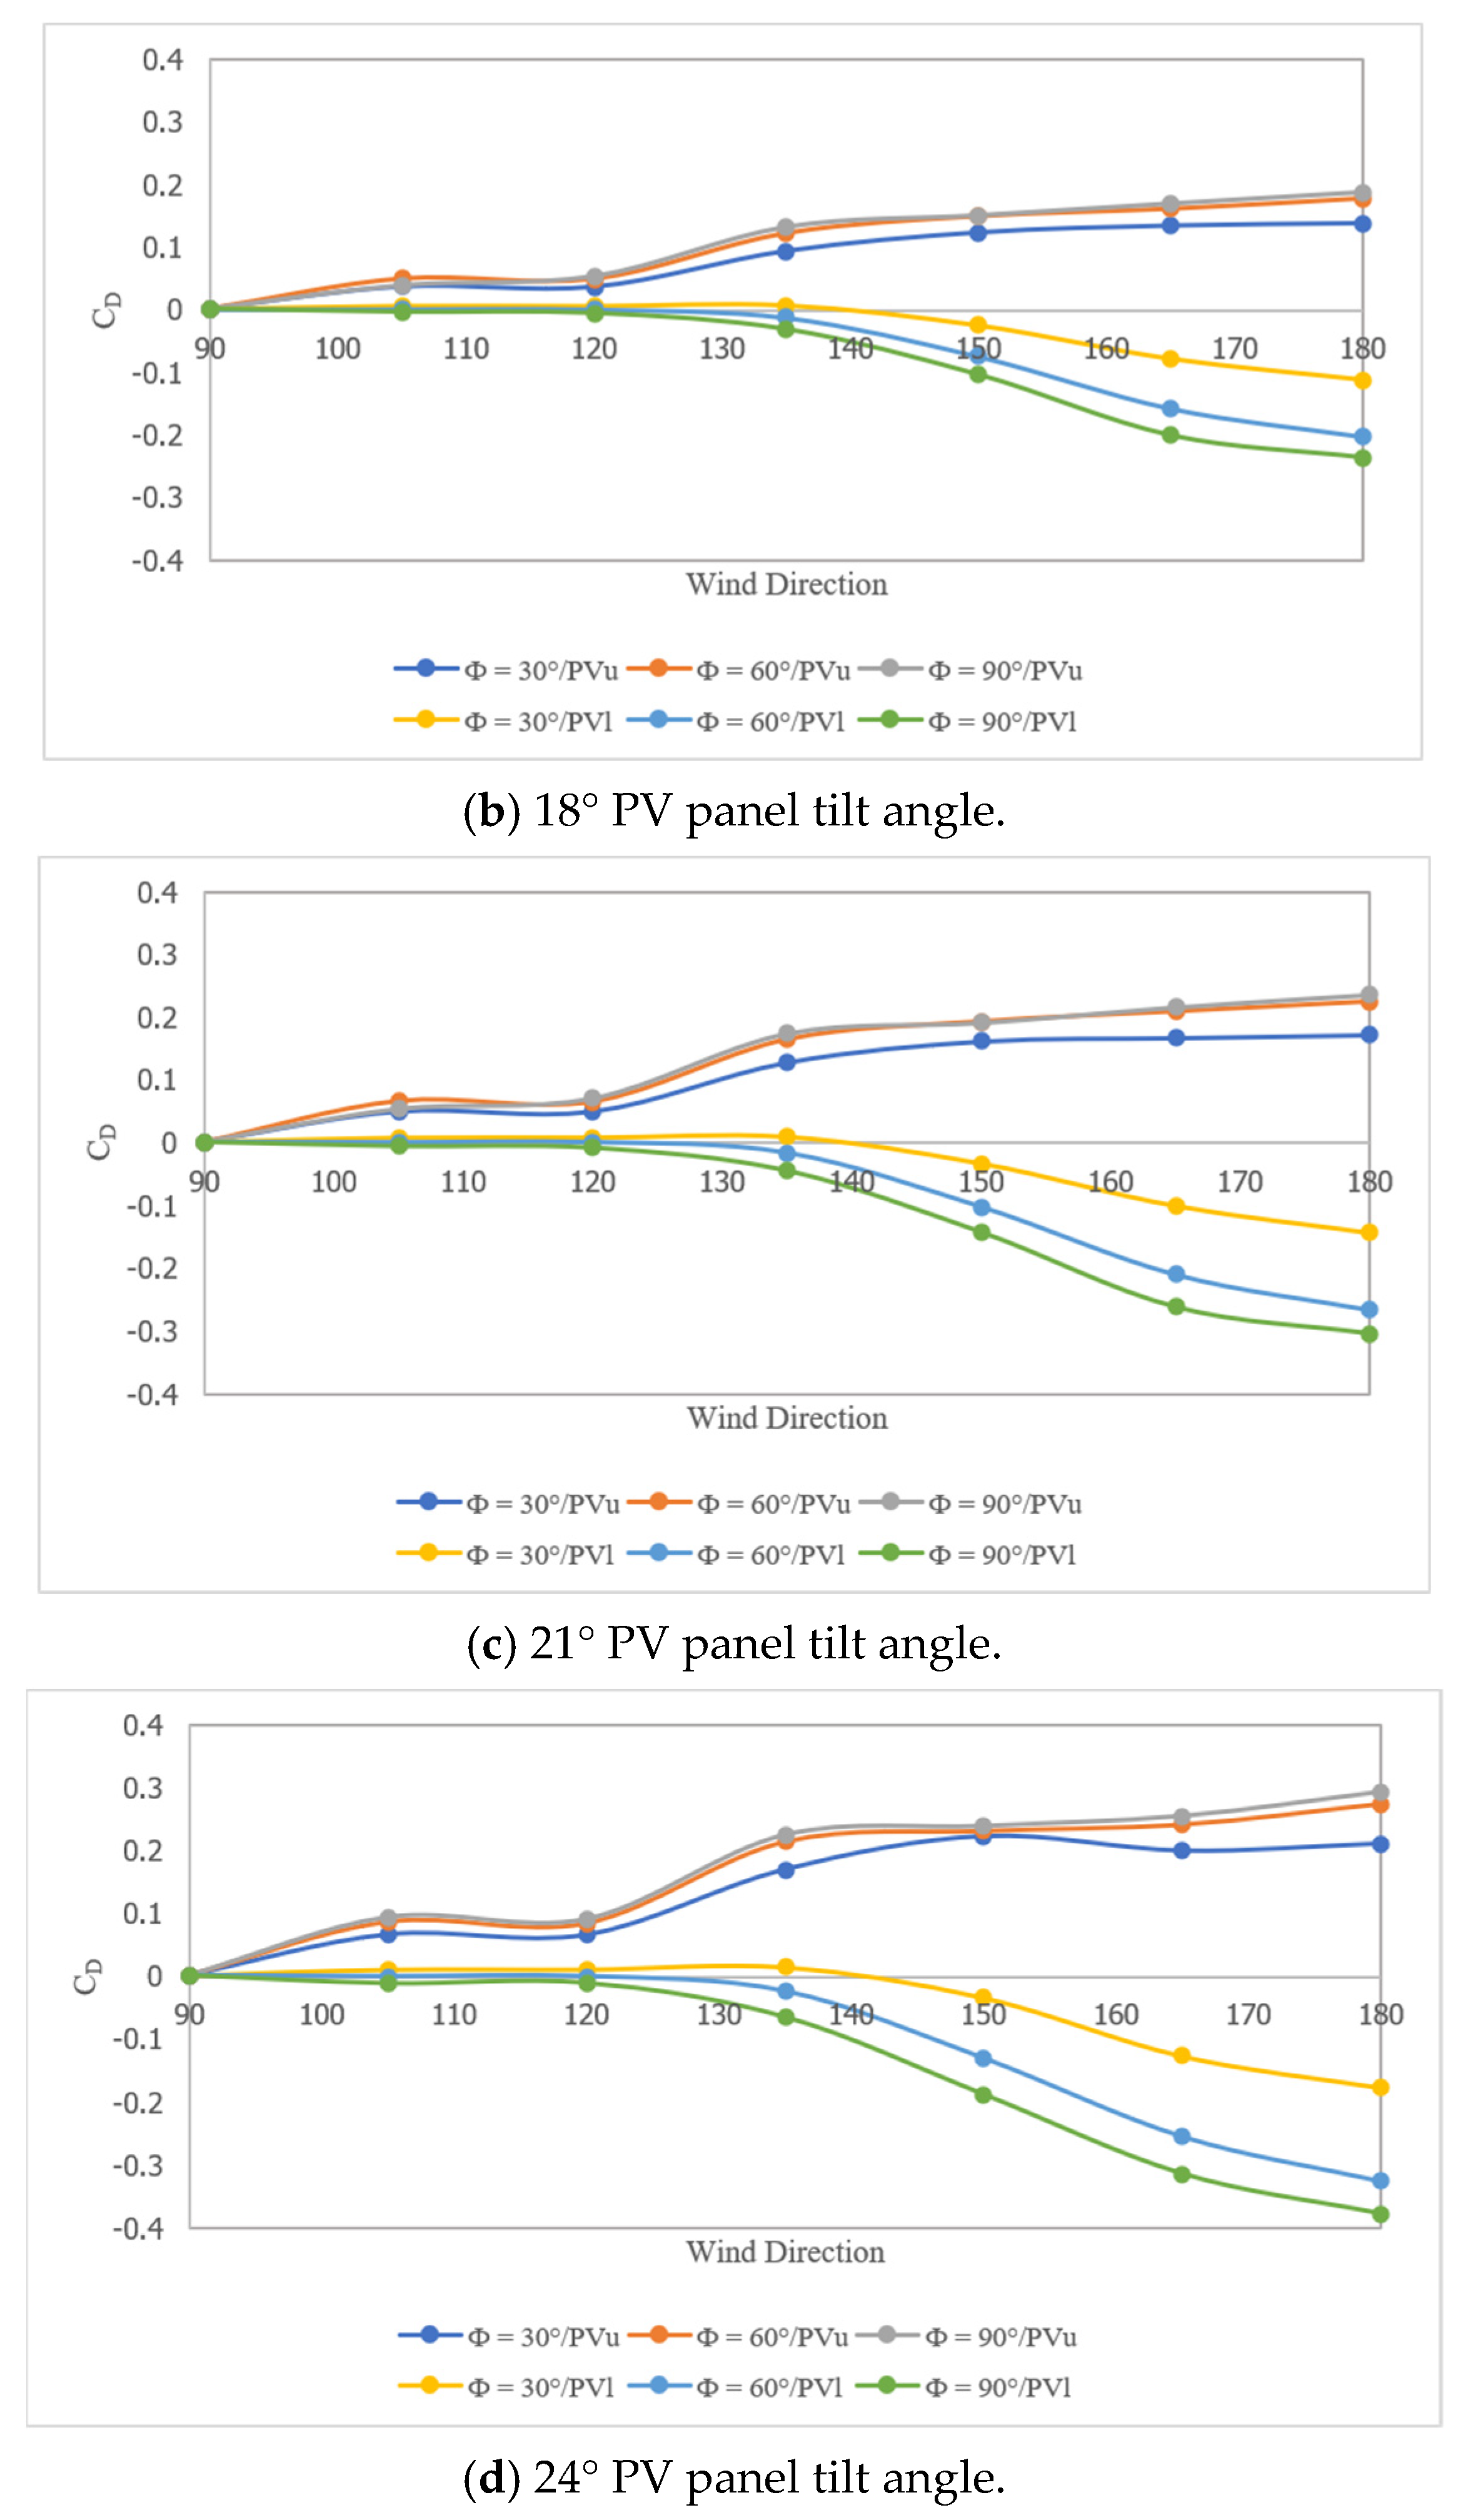
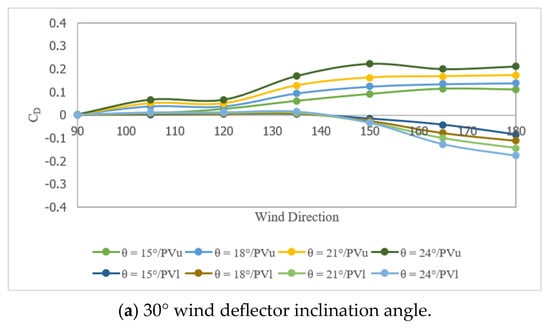
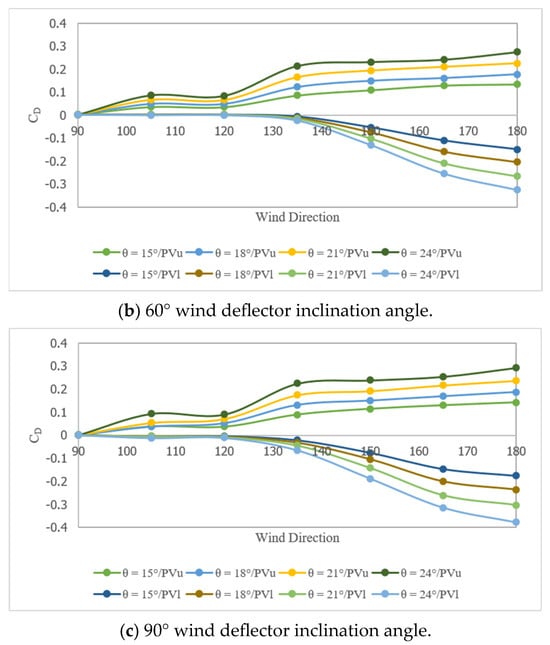
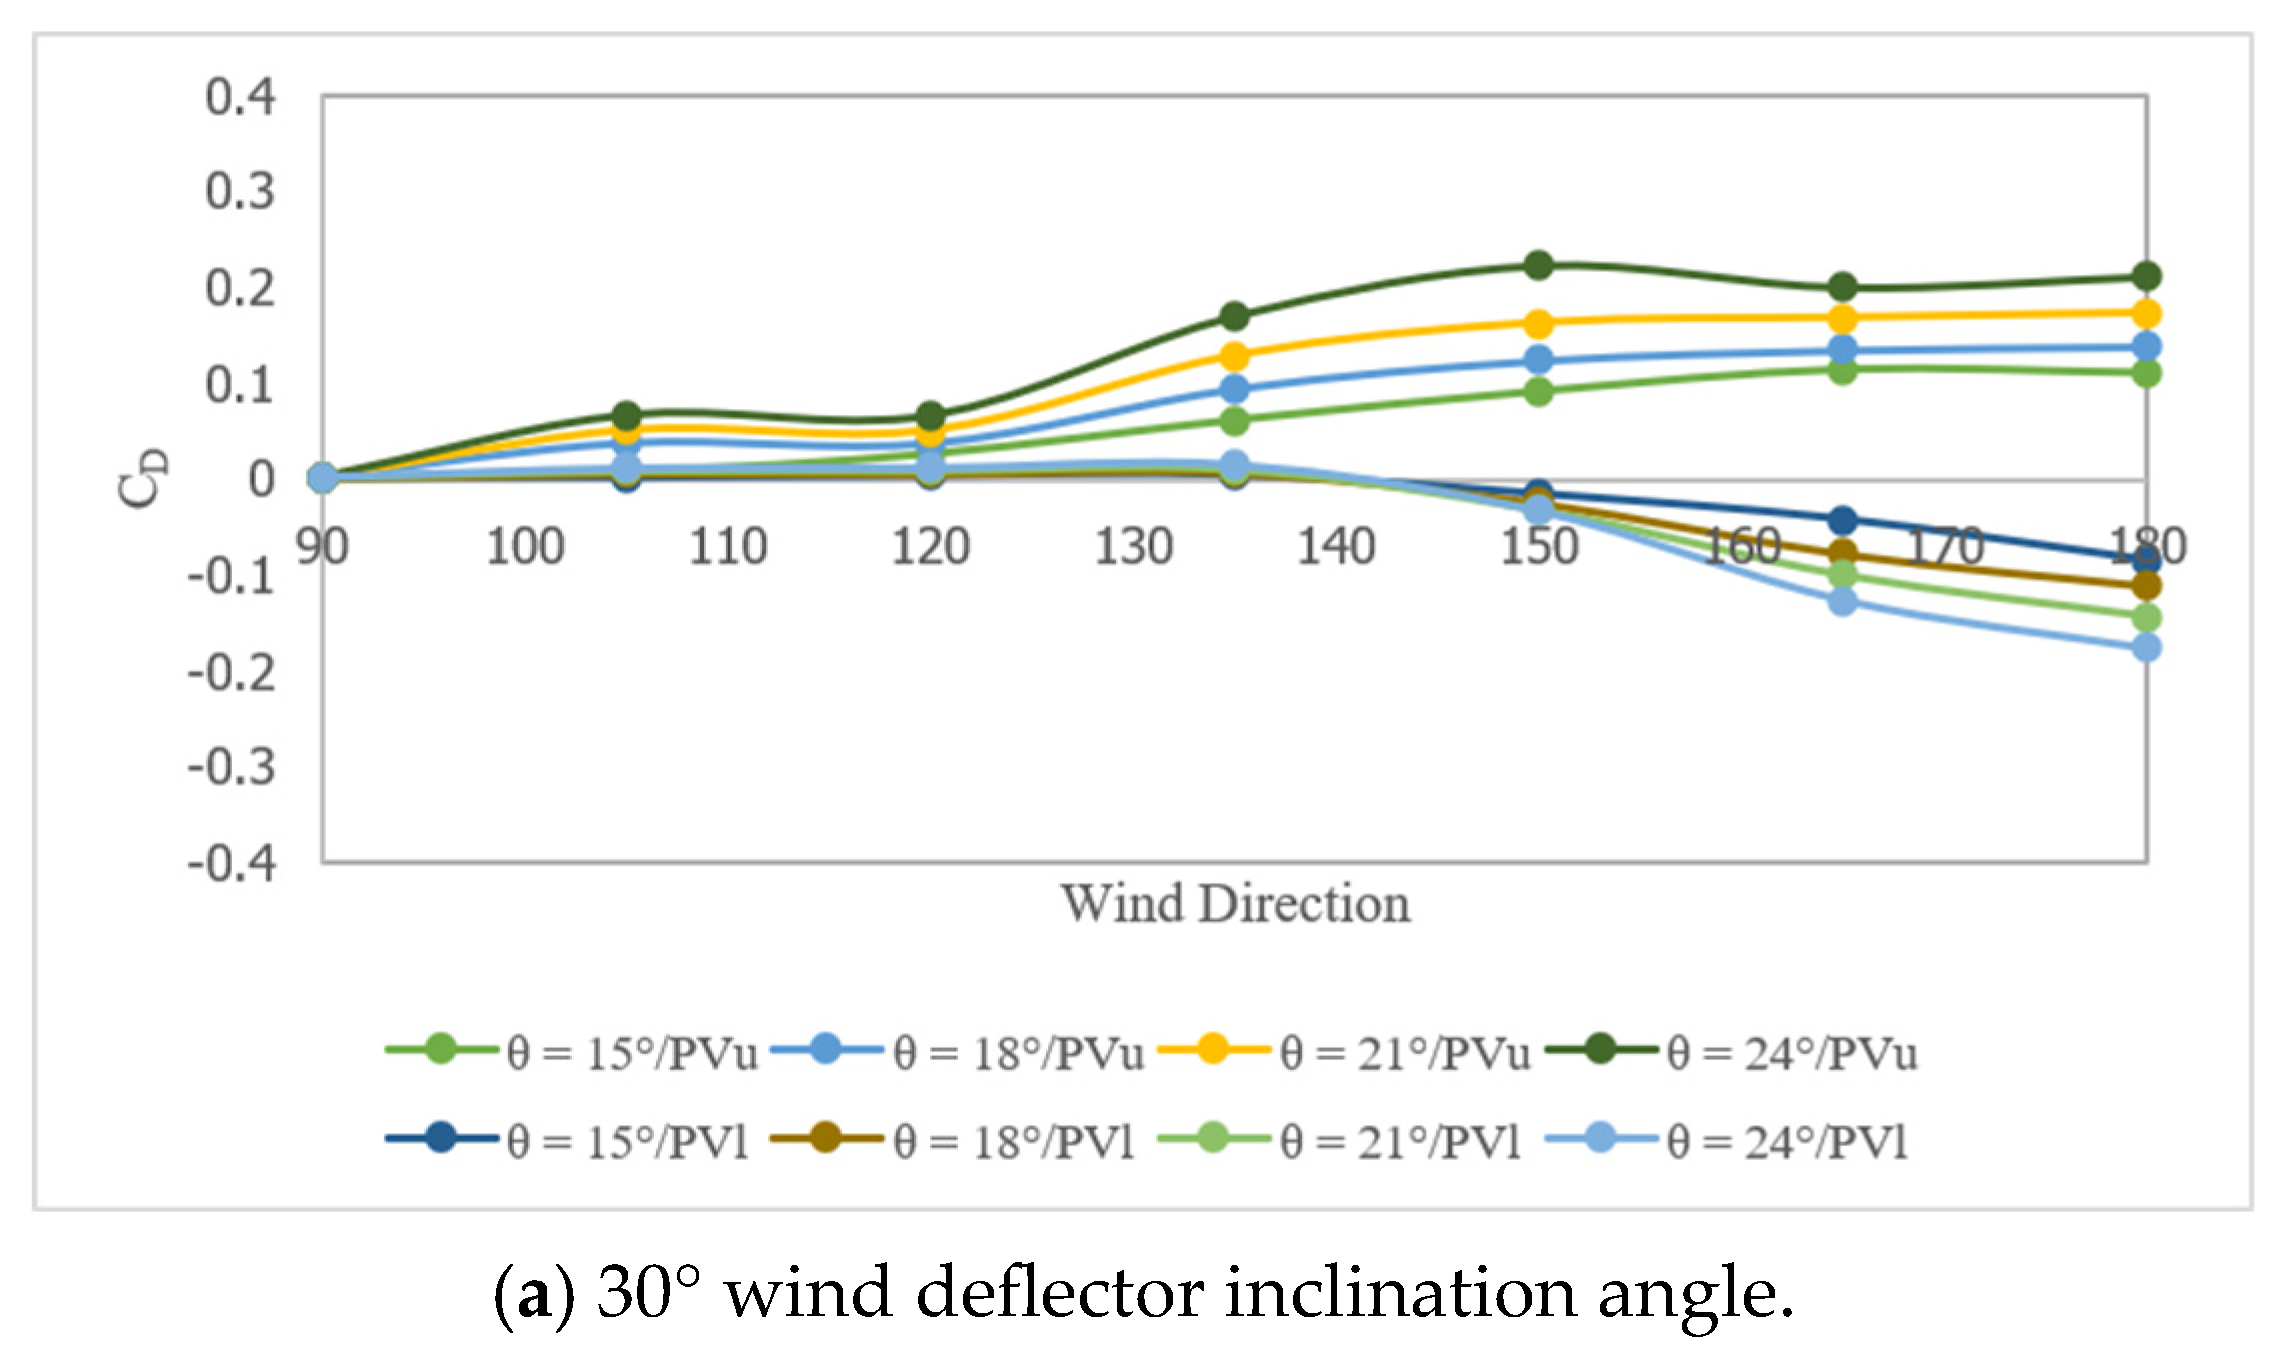
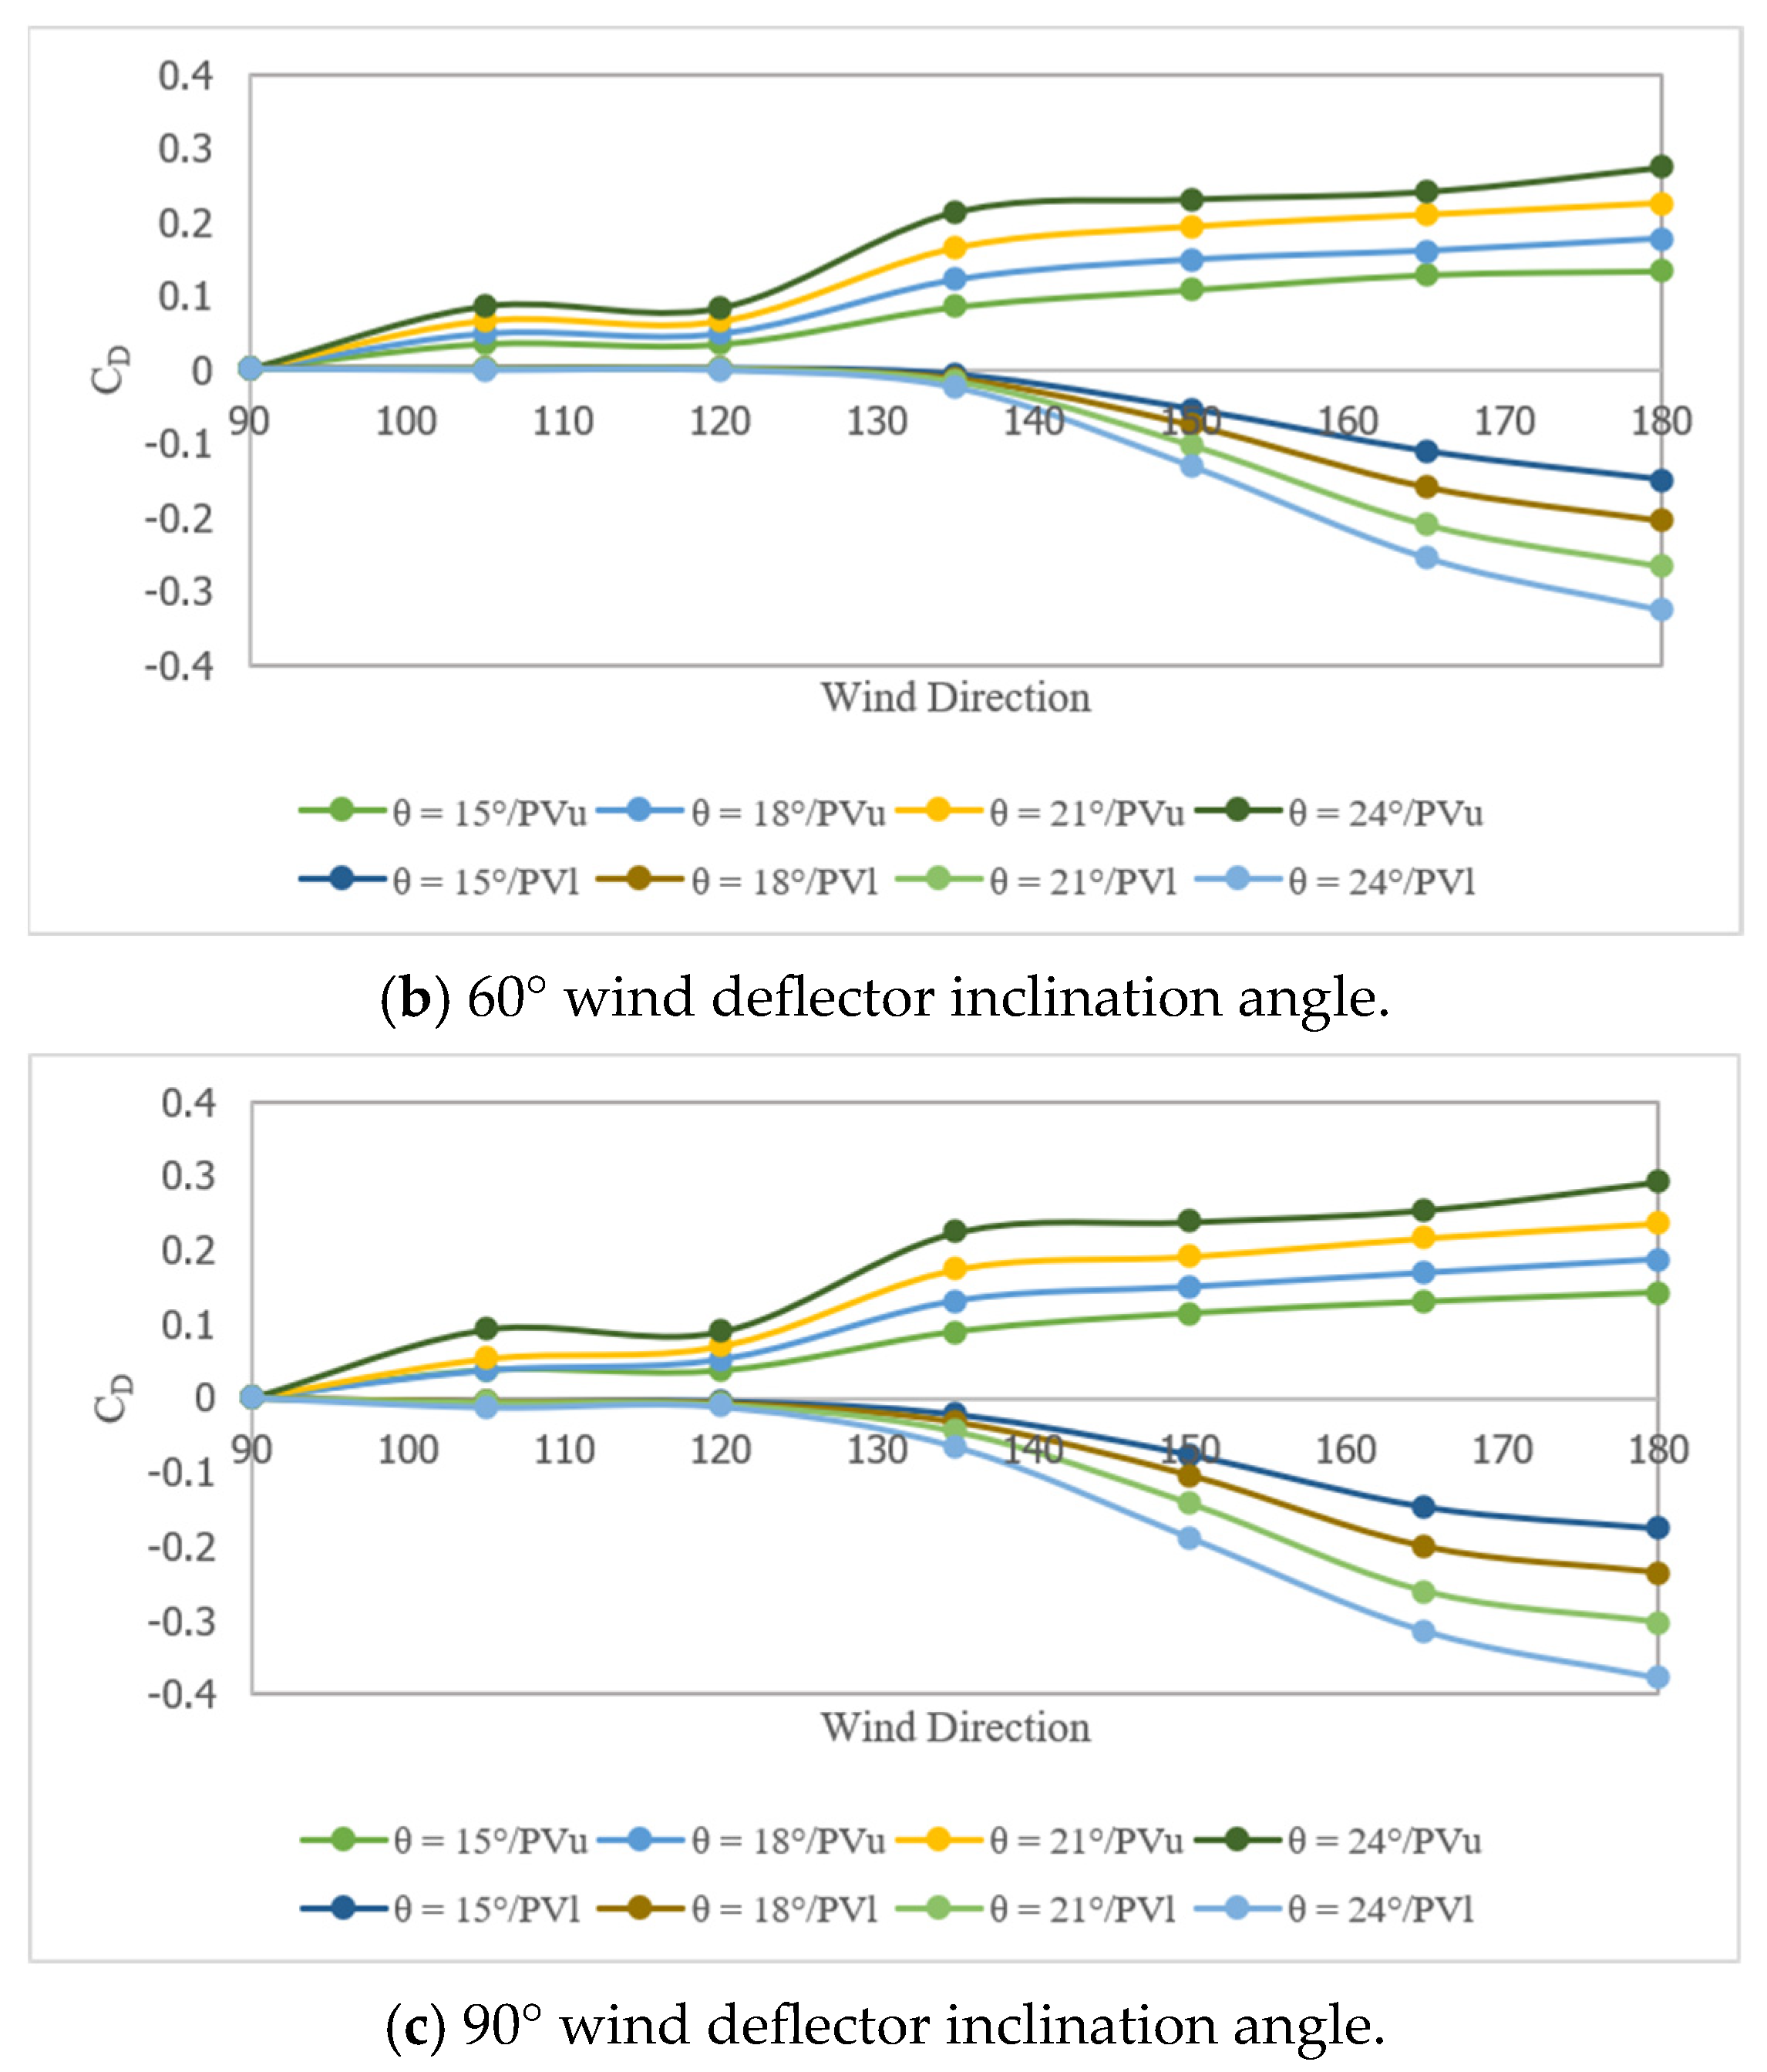
The drag coefficient is mostly affected by the direction of the flow, as can be seen in Figure 16. As the wind direction was tested from 90° to 135° wind direction angles, the drag coefficient was found to be affected by the oblique wind less than the straight wind. As can be seen, the drag coefficient is minimal until the 135° wind direction angle; then, it starts to rise, especially on the lower surface of the solar panels, corresponding with the findings of other researchers [39]. The effect of the wind deflector inclination angle on the drag coefficient of the solar panels is also shown in Figure 16. Similar to the lift coefficient, the biggest effect of the wind deflector inclination angle was on the lower surface of the solar panels rather than the upper surface. Figure 16 shows that the 30° wind deflector inclination angle produced the lowest negative drag on the lower surface of the solar panels compared to the other wind deflector inclination angles investigated. The results indicate that a 90° wind deflector inclination angle leads to trapping the air underneath the solar panels, creating a powerful forward shoving force. Figure 17 shows the effect of the PV panel tilt angle on the drag coefficient, similar to the lift effect 15° PV panel tilt angle showing the lowest drag effect compared with the other solar panels that were investigated. Compared at the 180° wind direction and 30° wind deflector inclination angle, the 15° PV panel tilt angle showed a 49.68% decrease in the drag coefficient compared with the 24° PV panel tilt angle.
Figure 16.
Drag coefficient with respect to the wind direction for the different PV panel tilt angles.
Figure 17.
Drag coefficient with respect to the wind direction for the different wind deflector inclination angles.
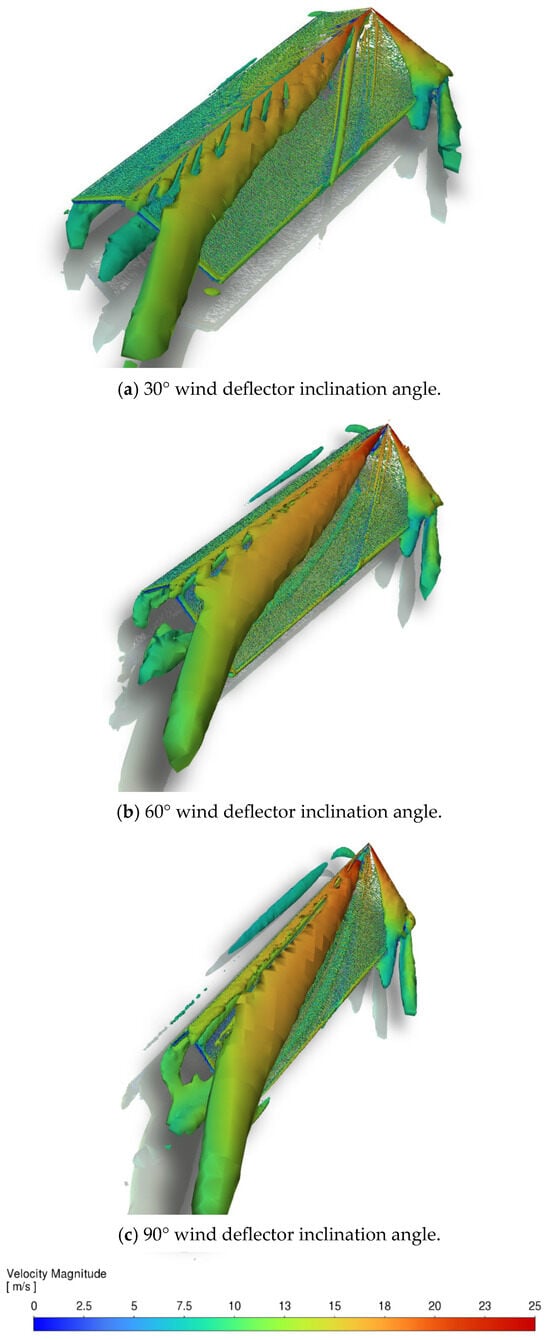
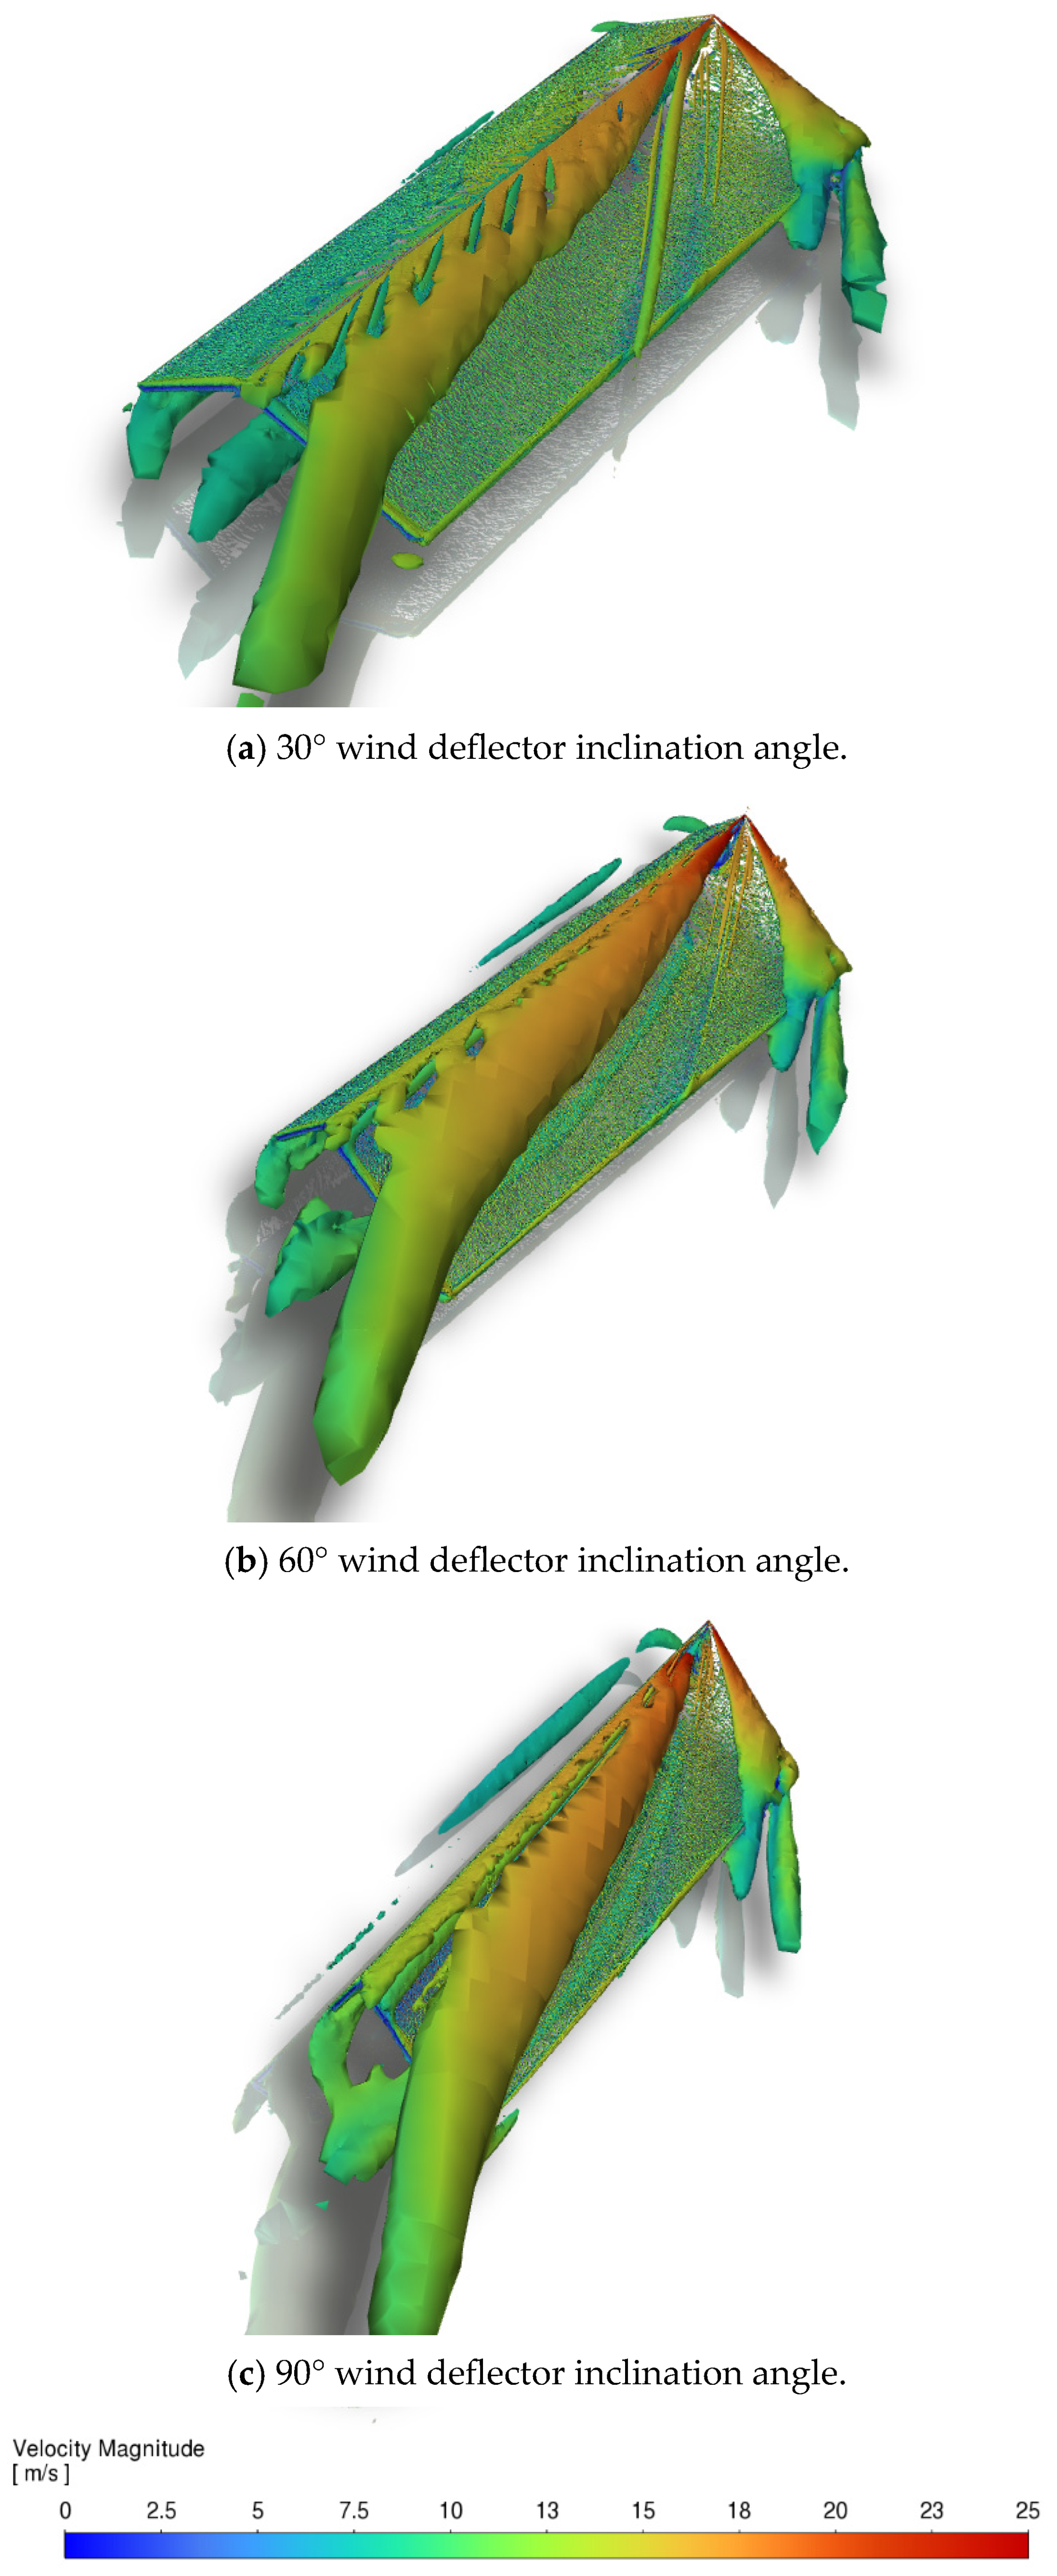
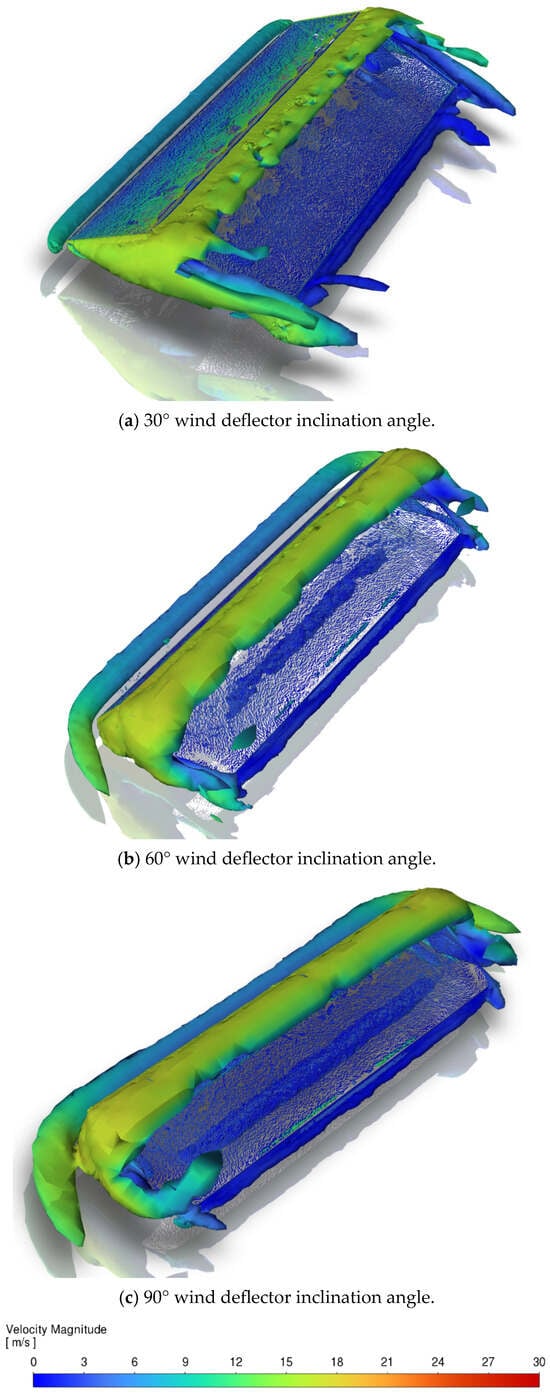
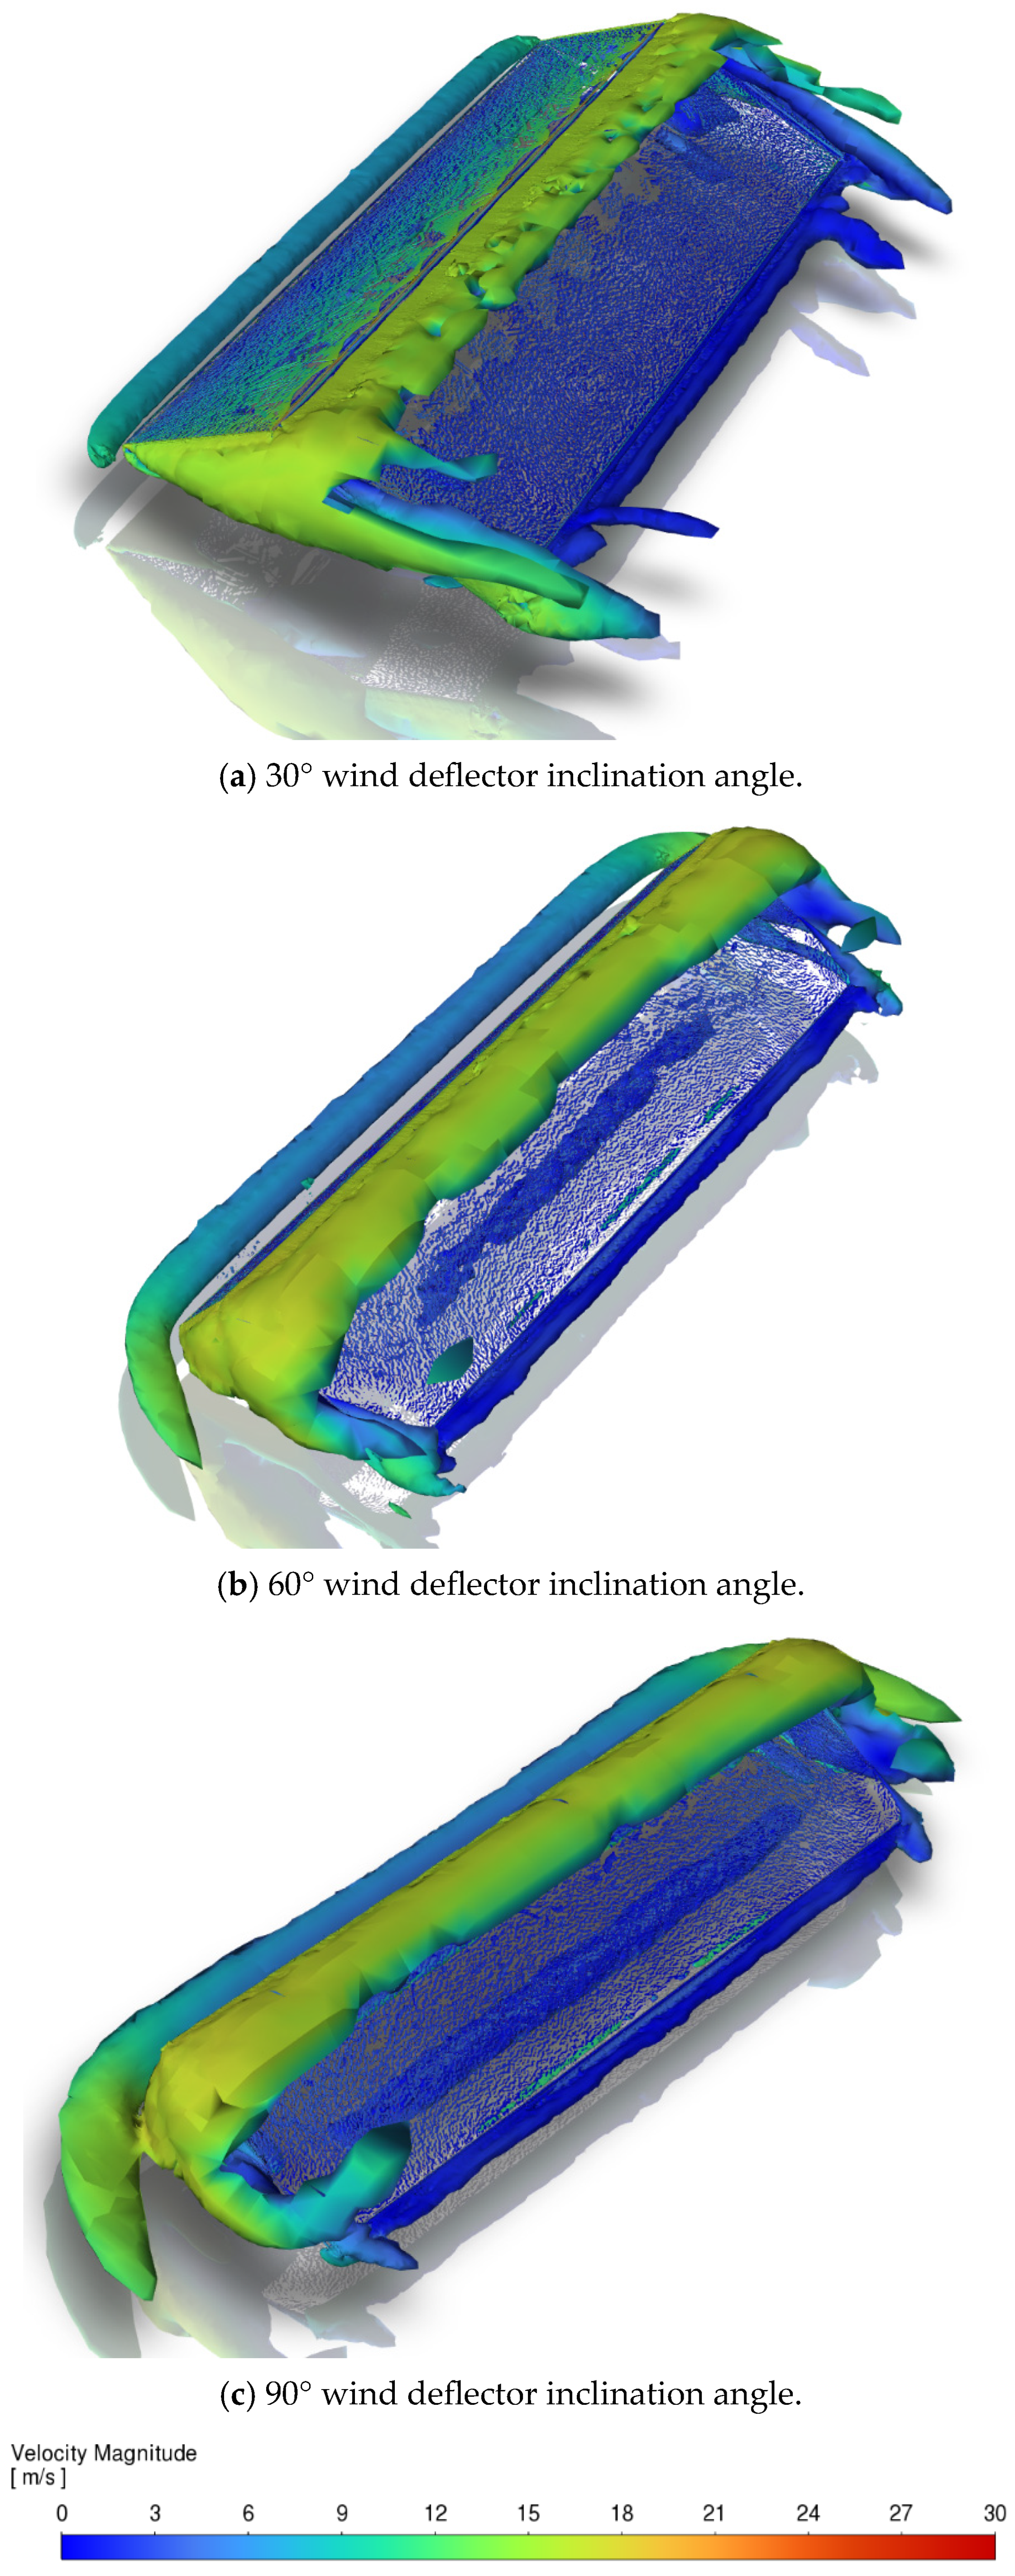
The vortex structures identified by the Q-criterion according to the velocity distribution can be seen in Figure 18 and Figure 19; the figures are from a case study with an 18° PV panel tilt angle and 105° and 180° wind direction angles, respectively. The iso-surface of the Q-criterion was created to identify the shape of the vortices around the solar panels and the wind deflector. When the wind deflector inclination angle was 30°, the vortices seemed to be more scattered and detached compared to the 60° and 90° wind deflector inclination angles. The flow separation that was created on the upper surface of the solar panels helped in the reduction in the suction effect on the solar panels’ upper surface. Moreover, the vortices created around and behind the model were increased when the wind deflector inclination angles were 60° and 90°. The vortex structure in Figure 19 shows the vortices are larger and more energized with the 90° wind deflector inclination angle than the 30° wind deflector inclination angle, and additional high-energy vortices are reformed around the sides of the solar panels when the wind deflector inclination angle is 90° compared to the same PV panel tilt angle and wind direction but with a 30° wind deflector inclination angle. A wind deflector inclination angle of 30 deg improves the aerodynamics of the module due to the sweeping shape that will add to the back of the solar panel in opposition to the shape that the 90 deg wind deflector inclination angle creates.
Figure 18.
Vortex structures according to the vorticity distribution identified by Q-criterion, for 18° PV panel tilt angle, 105° wind direction angle and different wind deflector inclination angles.
Figure 19.
Vortex structures according to the vorticity distribution identified by Q-criterion, for 18° PV panel tilt angle, 180° wind direction angle and different wind deflector inclination angles.
5. Conclusions
Investigations on the use of wind deflectors with solar panels are limited; moreover, the effect of the wind deflector inclination angle has not been thoroughly investigated. This study investigates the importance of choosing the right wind deflector inclination angle with respect to the PV panel tilt angle and wind direction. Three wind deflector inclination angles were investigated (30°, 60°, 90°), along with four PV panel tilt angles (15°, 18°, 21°, 24°), and the wind direction was changed from 90° to 180° with a 15° interval. The following conclusions can be drawn:
- The highest Cp-Net values were achieved with a 15° PV panel tilt angle, whereas lower Cp-Net values were achieved with a 24° PV panel tilt angle for the conditions where the wind direction inclination angle changed from 90° to 150°; conversely, the lowest Cp-Net values were achieved with a 15° PV panel tilt angle, and the highest Cp-Net values were achieved with a 24° PV panel tilt angle.
- The lowest lift and drag coefficient values were registered when the wind deflector inclination angle was 30° and the PV panel tilt angle was 15°.
- The lift coefficient decreased by 38.49% at a 30° wind deflector inclination angle compared with a 90° wind deflector inclination angle.
- The lowest lift coefficient was found when the PV panel tilt angle was 15° compared with the other PV panel tilt angles that were investigated.
- The drag coefficient decreased by 49.68% at a 15° PV panel tilt angle compared to a 24° PV panel tilt angle.
The results established from these investigations can be utilized in designing ballasted PV mounting systems with wind deflectors to ensure stable mounting systems for solar panels for future investigations. The materials of the ballasted PV mounting systems can be further investigated.
Author Contributions
This study is part of a PhD thesis, S.O. was responsible for data gathering and analysis, running simulation, validation of CFD model, drafting original writing, and editing. H.P. provided conceptualization and supervision, project administration, and funding acquisition. Z.P. supervised computational fluid dynamics analysis, methodology, format analysis, and reviewing and editing of the manuscript. E.Ö. provided the funding and financial support of this work. All authors have read and agreed to the published version of the manuscript.
Funding
This work was supported and funded by Kocaeli University.
Data Availability Statement
Data will be made available on request.
Conflicts of Interest
The authors declare no conflicts of interest.
References
- Xypnitou, E. Wind Loads on Solar Panels Systems Attached to Building Roofs. Master’s Thesis, Concordia University, Montreal, QC, Canada, 2012. [Google Scholar]
- Yu, Y. Numerical Simulation of Wind Load on Roof Mounted Solar Panels. Master’s Thesis, University of Windsor, Windsor, ON, Canada, 2012. [Google Scholar]
- Alrawashdeh, H.; Stathopoulos, T. Wind loads on solar panels mounted on flat roofs: Effect of geometric scale. J. Wind Eng. Ind. Aerodyn. 2020, 206, 104339. [Google Scholar] [CrossRef] [Scilit]
- Goossens, D.; Goverde, H.; Catthoo, F. Effect of wind on temperature patterns, electrical characteristics, and performance of building-integrated and building-applied inclined photovoltaic modules. Sol. Energy 2018, 170, 64–75. [Google Scholar] [CrossRef] [Scilit]
- Mirzaei, P.A.; Paterna, E.; Carmeliet, J. Investigation of the role of cavity airflow on the performance of building-integrated photovoltaic panels. Sol. Energy 2014, 107, 510–522. [Google Scholar] [CrossRef] [Scilit]
- Choi, S.M.; Park, C.-D.; Cho, S.-H.; Lim, B.-J. Effects of wind loads on the solar panel array of a floating photovoltaic system e Experimental study and economic analysis. Energy 2022, 256, 124649. [Google Scholar] [CrossRef] [Scilit]
- Choi, S.M.; Lee, G.R.; Park, C.D.; Cho, S.H.; Lim, B.J. Wind load on the solar panel array of a floating photovoltaic system under extreme hurricane conditions. Sustain. Energy Technol. Assess. 2021, 48, 101616. [Google Scholar] [CrossRef] [Scilit]
- Agrawal, M.; Kumar, A.; Chowdhury, A. A detailed simulation-based study on the effect of mirror integration on PV Module(s) with analysis of different wind flow scheme. Sol. Energy 2021, 222, 129–144. [Google Scholar] [CrossRef] [Scilit]
- Zheng, G.; Yao, J.; Tu, Z.; Zhou, X. Effect of building height on wind load characteristics of photovoltaic arrays. In Proceedings of the International Conference on Power System and Energy Technology (ICPSET 2022), Guangzhou, China, 12–14 August 2022. [Google Scholar]
- Kopp, G.A.; Banks, D. Use of wind tunnel test method for obtaining design wind loads on roof-mounted solar arrays. J. Struct. Eng. 2013, 139, 284–287. [Google Scholar] [CrossRef] [Scilit]
- Choi, H.; Adamu Shedo, D.; Chang, B. Serviceability analysis and feasibility study of ballasted rooftop PV system on existing concrete roof slab buildings. Renew. Energy 2024, 228, 120622. [Google Scholar] [CrossRef] [Scilit]
- Kuruneru, S.T.W.; Anderson, K.; Beath, A. Advanced computational fluid dynamic analysis of microclimate effects on solar photovoltaics for the utility-scale solar industry. Energy Convers. Manag. 2026, 353, 121153. [Google Scholar] [CrossRef] [Scilit]
- Opie, B.; Avci, O.; Gutta, J.B.; Quaranta, J.D.; Taylor, S. A brief review of solar panel installations on former mine lands: Technical challenges and uncertainties for tracking and foundation systems. Sol. Energy 2025, 300, 113858. [Google Scholar] [CrossRef] [Scilit]
- Al Sayegh, H.; Gan Chowdhury, A.; Zisis, I.; Elawady, A.; Estephan, J.; Tolera, A. Full-scale experimental investigation of wind loading on ballasted photovoltaic arrays mounted on flat roofs. J. Wind Eng. Ind. Aerodyn. 2025, 256, 105963. [Google Scholar] [CrossRef] [Scilit]
- Kopp, G.A. Wind Loads on Low-Profile, Tilted, Solar Arrays Placed on Large, Flat, Low-Rise Building Roofs. J. Struct. Eng. 2014, 140, 04013057. [Google Scholar] [CrossRef] [Scilit]
- Aly, A.M. On the evaluation of wind loads on solar panels: The scale issue. Sol. Energy 2016, 135, 423–434. [Google Scholar] [CrossRef] [Scilit]
- Nahani, P.; Eslami, M.; Hamzehzarghani, R. Effects of wind on cooling and performance of photovoltaic arrays: A case study CFD modeling. Energy 2024, 293, 130596. [Google Scholar] [CrossRef] [Scilit]
- Toja-Silva, F.; Peralta, C.; Lopez-Garcia, O.; Navarro, J.; Cruz, I. Effect of roof-mounted solar panels on the wind energy exploitation on high-rise buildings. J. Wind Eng. Ind. Aerodyn. 2015, 145, 123–138. [Google Scholar] [CrossRef] [Scilit]
- Franke, J.; Baklanov, A. Best Practice Guideline for the CFD Simulation of Flows in the Urban Environment: COST Action 732 Quality Assurance and Improvement of Microscale Meteorological Models. Doctoral Dissertation, COST European Cooperation in Science and Technology, Brussels, Belgium, 2007. [Google Scholar]
- Shi, G.; Tang, M.; Lv, W.; Peng, X.; Quan, H. Identification of the vortex in the main flow passage of a multiphase pump and the relationship with pressure fluctuation. Energy Sci. Eng. 2024, 12, 4394–4413. [Google Scholar] [CrossRef] [Scilit]
- Ansys help, Transition SST Model. Available online: https://ansyshelp.ansys.com/public/account/secured?returnurl=/views/secured/corp/v251/en/flu_th/flu_th_sec_turb_transition.html (accessed on 23 September 2026).
- Güemes, A.; Fajardo, P.; Raiola, M. Experimental Assessment of RANS Models for Wind Load Estimation over Solar-Panel Arrays. Appl. Sci. 2021, 11, 2496. [Google Scholar] [CrossRef] [Scilit]
- Abiola-Ogedengbe, A.; Hangan, H.; Siddiqui, K. Experimental investigation of wind effects on a standalone photovoltaic (PV) module. Renew. Energy 2015, 78, 657–665. [Google Scholar] [CrossRef] [Scilit]
- Simiu, E. Design of Buildings for Wind: A Guide for ASCE 7-10 Standard Users and Designers of Special Structures, 2nd, ed.; John Wiley & Sons, Inc.: Hoboken, NJ, USA, 2011. [Google Scholar]
- Bogdan, O.; Creţu, D. Wind Load Design of Photovoltaic Power Plants by Comparison of Design Codes and Wind Tunnel Tests. Math. Model. Civ. Eng. 2019, 15, 13–27. [Google Scholar] [CrossRef] [Scilit]
- Dai, S.F.; Liu, H.J.; Yang, J.H.; Peng, H.Y. Wind loads on roof-mounted isolated solar panels of tall buildings through wind tunnel testing. Sol. Energy 2022, 231, 607–622. [Google Scholar] [CrossRef] [Scilit]
- Zhou, Y.; Peng, R.; Xiang, Y.; Li, M.; Xi, G.; Li, Y.; Luo, N. Experimental investigation on wind loads and wind-induced responses of large-span flexible photovoltaic support structure. Eng. Struct. 2025, 322, 119009. [Google Scholar] [CrossRef] [Scilit]
- Dai, S.F.; Liu, H.J.; Peng, H.Y. Investigation into the effect of rounded building corner on wind loads of flat-roof-mounted solar arrays. J. Build. Eng. 2024, 87, 109048. [Google Scholar] [CrossRef] [Scilit]
- Li, S.; Mao, D.; Li, S.; Wang, Q.; Yang, Q.; Chen, Y.; Zhou, S. Wind load characteristics of photovoltaic panel arrays mounted on flat roof. Eng. Res. Express 2022, 4, 015027. [Google Scholar] [CrossRef] [Scilit]
- Peng, H.Y.; Song, S.S.; Liu, H.J.; Dai, S.F.; Zhang, F.L. Investigation of wind loading characteristics of roof-mounted solar panels on tall buildings. Sustain. Energy Technol. Assess. 2022, 54, 102800. [Google Scholar] [CrossRef] [Scilit]
- Yemenici, O.; Osman Aksoy, M. An experimental and numerical study of wind effects on a ground-mounted solar panel at different panel tilt angles and wind directions. J. Wind Eng. Ind. Aerodyn. 2021, 213, 104630. [Google Scholar] [CrossRef] [Scilit]
- Hubova, O.; Franek, M.; Macak, M. Experimental determination of wind action on triangular solar panel assemblies. MATEC Web Conf. 2020, 313, 00050. [Google Scholar] [CrossRef] [Scilit][Green Version]
- Naeiji, A.; Raji, F.; Zisis, I. Wind loads on residential scale rooftop photovoltaic panels. J. Wind Eng. Ind. Aerodyn. 2017, 168, 228–246. [Google Scholar] [CrossRef] [Scilit]
- Yao, F.; Tu, Z.B.; Shen, G.H.; Guo, Y.; Wang, D. Experimental investigation of wind pressures on photovoltaic (PV) panel installed parallel to residential gable roof. Sol. Energy 2024, 271, 112452. [Google Scholar] [CrossRef] [Scilit]
- Stathopoulos, T.; Zisis, I.; Xypnitou, E. Local and overall wind pressure and force coefficients for solar panels. J. Wind Eng. Ind. Aerodyn. 2014, 125, 195–206. [Google Scholar] [CrossRef] [Scilit]
- Reina, G.P.; De Stefano, G. Computational evaluation of wind loads on sun-tracking ground-mounted photovoltaic panel arrays. J. Wind Eng. Ind. Aerodyn. 2017, 170, 283–293. [Google Scholar] [CrossRef] [Scilit]
- Khan, A.K.; Shah, T.R.; Khosa, A.A.; Ali, H.M. Evaluation of wind load effects on solar panel support frame: A numerical study. Eng. Anal. Bound. Elem. 2023, 153, 88–101. [Google Scholar] [CrossRef] [Scilit]
- Mohammad Jubayer, C.; Hangan, H. A numerical approach to the investigation of wind loading on an array of ground mounted solar photovoltaic (PV) panels. J. Wind Eng. Ind. Aerodyn. 2016, 153, 60–70. [Google Scholar] [CrossRef] [Scilit]
- Yemenici, O. Aerodynamic Mechanisms on a Ground-Mounted Solar Panel at Different Wind Directions. Uludağ Univ. J. Fac. Eng. 2020, 25, 111–120. [Google Scholar]
Disclaimer/Publisher’s Note: The statements, opinions and data contained in all publications are solely those of the individual author(s) and contributor(s) and not of MDPI and/or the editor(s). MDPI and/or the editor(s) disclaim responsibility for any injury to people or property resulting from any ideas, methods, instructions or products referred to in the content. |
© 2026 by the authors. Licensee MDPI, Basel, Switzerland. This article is an open access article distributed under the terms and conditions of the Creative Commons Attribution (CC BY) license.