


Abstract
This study experimentally investigates the energy, exergy, and economic performance of an enhanced photovoltaic/thermal (PVT) solar collector using micro-finned tubes, twisted-tape inserts, hybrid nanofluid, and nano-enhanced phase-change material (NPCM). Five collector configurations were tested at mass flow rates ranging from 0.008 to 0.042 kg/s. The best-performing configuration combined micro-finned tubes and twisted-tape inserts with SiC-NPCM and a hybrid nanofluid composed of 0.3 vol.% SiC and 0.3 vol.% Al2O3 dispersed in water. The experimental uncertainty was reported to be within ±3.5%. The optimized configuration achieved a maximum thermal efficiency of 87.5% and a peak useful thermal output of 189 W at a mass flow rate of 0.033 kg/s, corresponding to a 71.8% improvement compared with the baseline system. Active cooling of the photovoltaic back surface also increased the peak electrical power output to 23.5 W. The maximum overall exergy efficiency reached 12.85%, representing a 117.8% improvement compared with the conventional configuration. Although the micro-finned tubes and NPCM accounted for a substantial share of the initial capital cost, operation at a mass flow rate of 0.024 kg/s provided a favorable compromise between performance and cost, reducing the unit energy cost to USD 0.094/kWh while maintaining thermal-storage stability. The results indicate that the proposed hybrid cooling strategy can improve the thermal and thermodynamic performance of PVT collectors, although further validation under outdoor conditions is recommended.
1. Introduction
Fossil fuels remain a major source of environmental pollution and greenhouse-gas emissions, which has increased the need for sustainable and renewable energy technologies. Among renewable energy sources, solar energy is particularly attractive because of its abundance, availability, and suitability for both electrical and thermal applications. Photovoltaic (PV) modules are widely used to convert solar radiation into electricity; however, only part of the incident radiation is converted into electrical energy, while a large fraction is transformed into heat. The resulting increase in PV surface temperature reduces electrical efficiency and may accelerate module degradation. Therefore, effective thermal management is essential for maintaining PV modules near their optimal operating temperature and improving their overall performance. This can be achieved through active or passive cooling techniques, including the integration of photovoltaic/thermal (PVT) systems [1,2].
Several studies have investigated the use of nanofluids, phase-change materials (PCMs), and modified absorber geometries to improve the performance of PVT systems. Sardarabadi et al. [3] examined the effect of using different metal-oxide/water nanofluids in a PVT system and reported that Al2O3/water nanofluid at a concentration of 0.2 wt.% provided the best improvement, increasing the overall energy efficiency by approximately 18.27%. Aberoumand et al. [4] showed that Ag/water nanofluid enhanced the energy and exergy performance of a PVT collector. The incorporation of a paraffin/aluminum-foam composite was also reported to improve electrical efficiency by approximately 14% and reduce the unit production cost from USD 0.1165/kWh to USD 0.1145/kWh [5].
Shahsavar et al. [6,7] presented studies on improving PV cooling performance using modified flow passages and nanofluids. Their results showed that advanced tube geometries and magnetite/water nanofluids could improve power output and overall exergy efficiency. Similarly, the circulation of Al2O3/water nanofluid reduced PV panel temperature by approximately 2–7 °C and increased thermal efficiency by about 12.8% [8]. Senthilraja et al. [9] experimentally studied a hybrid cooling system using water and paraffin for PV thermal regulation and reported maximum thermal and electrical efficiencies of 33.8% and 9.1%, respectively. In another application, the integration of PCM and a PVT collector in a solar still increased freshwater productivity by 10.6% and exergy efficiency by 27% [10].
PCMs and PCM-based slurries have also been examined as promising thermal-storage media for PVT systems. Microencapsulated PCM slurry used as a working fluid improved energy efficiency by up to 8.3% and exergy efficiency by up to 3.23% [11]. The integration of sealed aluminum-foil enclosures filled with lauric acid increased the maximum thermal efficiency of PV panels to 87.72%, while the maximum exergy efficiency reached 12.19% [12]. In nanofluid-based PVT/PCM systems, the use of PCM increased useful thermal power by approximately 29.60%, with maximum system efficiency reaching 13.61% [13]. Furthermore, increasing nanoparticle concentration from 1% to 6% was reported to increase thermal efficiency by 19% [14], while laminar pulsating nanofluid flow improved the thermal efficiency of solar panels by approximately 22% [15].
Techno-economic performance is also an important factor in evaluating the practical applicability of PVT systems. Experimental and annual performance analyses have shown that average annual energy efficiency may remain below 50%, while the cost of electricity produced by PV-based systems can range from 0.056 to 0.083 €/kWh [16]. Optimization methods have also been applied to PVT/PCM systems; for example, a genetic-algorithm-based design of a PV panel integrated with PCM and a pump achieved a maximum cell energy efficiency of 53% [17]. In another techno-economic study, the cost of electricity from a 30 kW solar power plant was reported to range from EUR 0.116 to below EUR 0.10/kWh, with a simple payback period of about six years [18].
Although previous studies have demonstrated the benefits of nanofluids, PCMs, and enhanced absorber designs, limited experimental work has examined their combined effect in a single compact PVT configuration using micro-finned tubes, twisted-tape inserts, hybrid nanofluid, and nano-enhanced PCM. Therefore, the present study experimentally evaluates the energy, exergy, and economic performance of a PVT collector enhanced by an integrated cooling unit consisting of micro-finned tubes, twisted-tape inserts, SiC/Al2O3 hybrid nanofluid, and SiC-based nano-enhanced PCM. Five configurations are compared under controlled indoor solar-simulator conditions and different mass flow rates. The aim is to identify the thermal, electrical, exergetic, and economic performance benefits of the proposed hybrid cooling configuration compared with a conventional water-cooled PVT system.
2. Experimental Testing Methodology and Performance Measurement Equipment
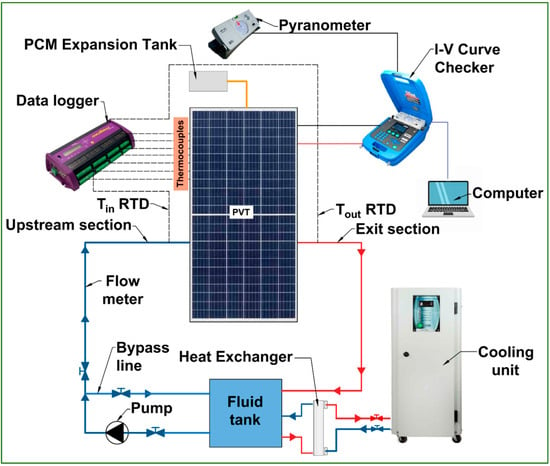
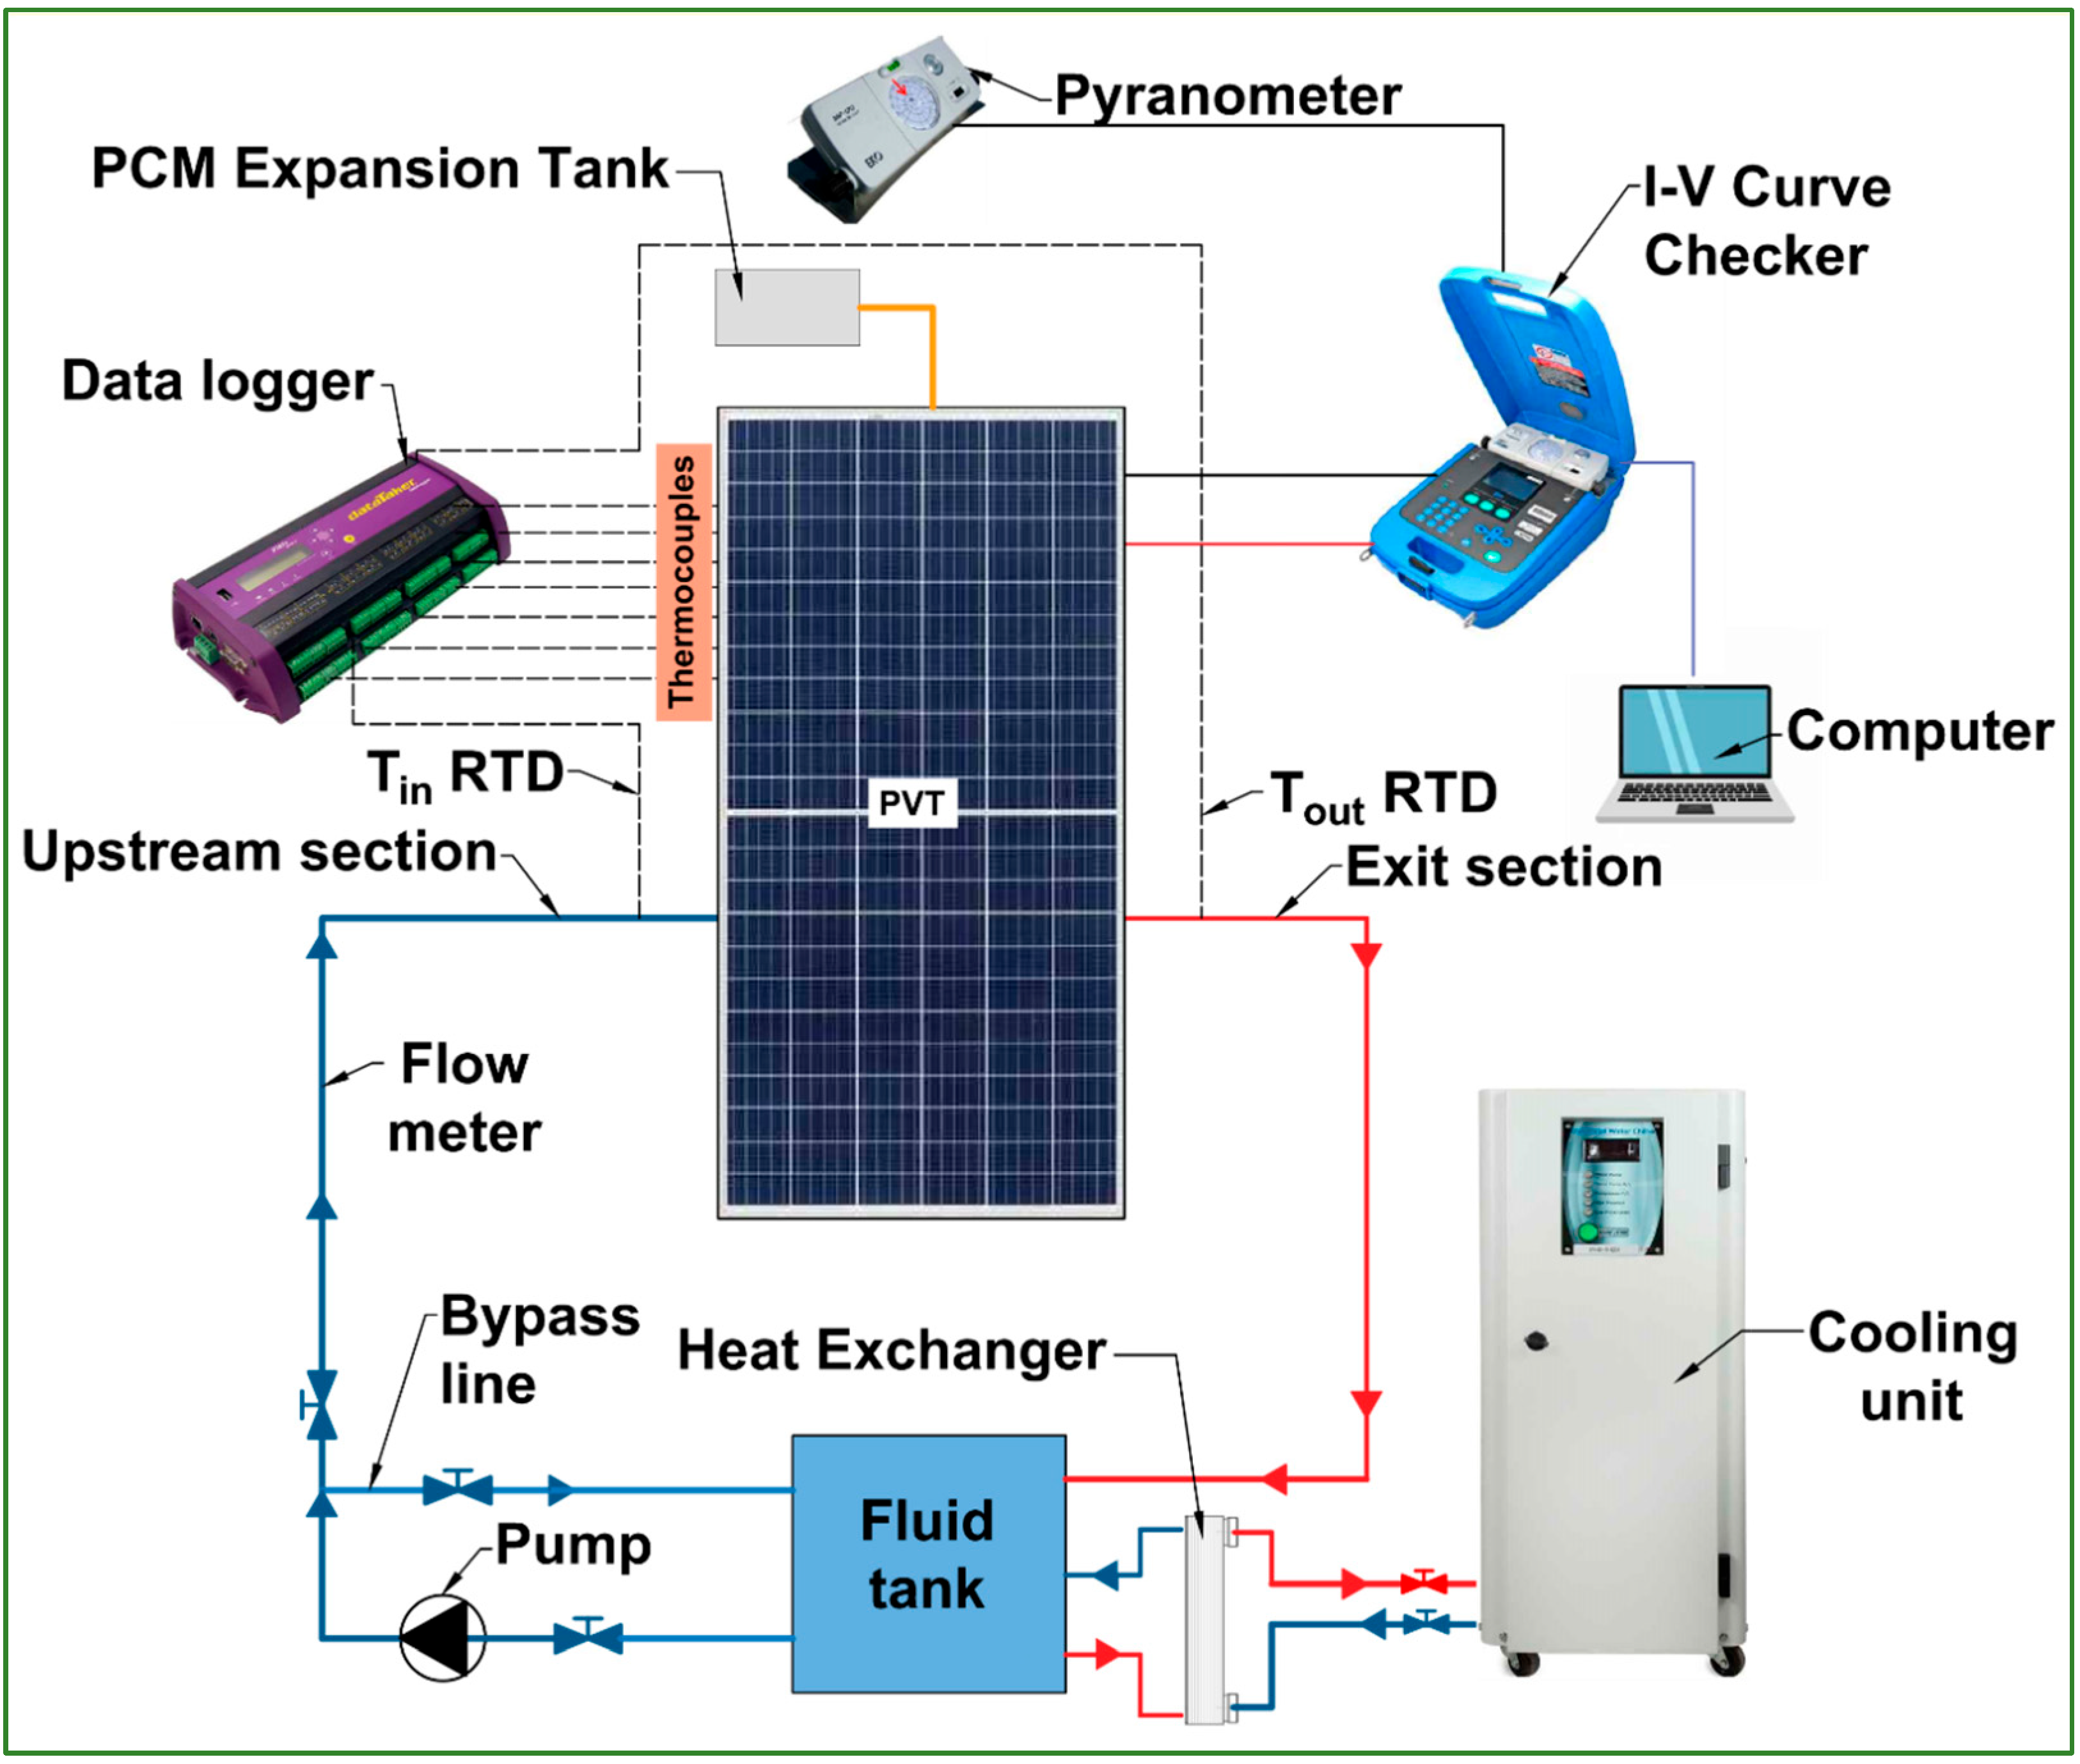
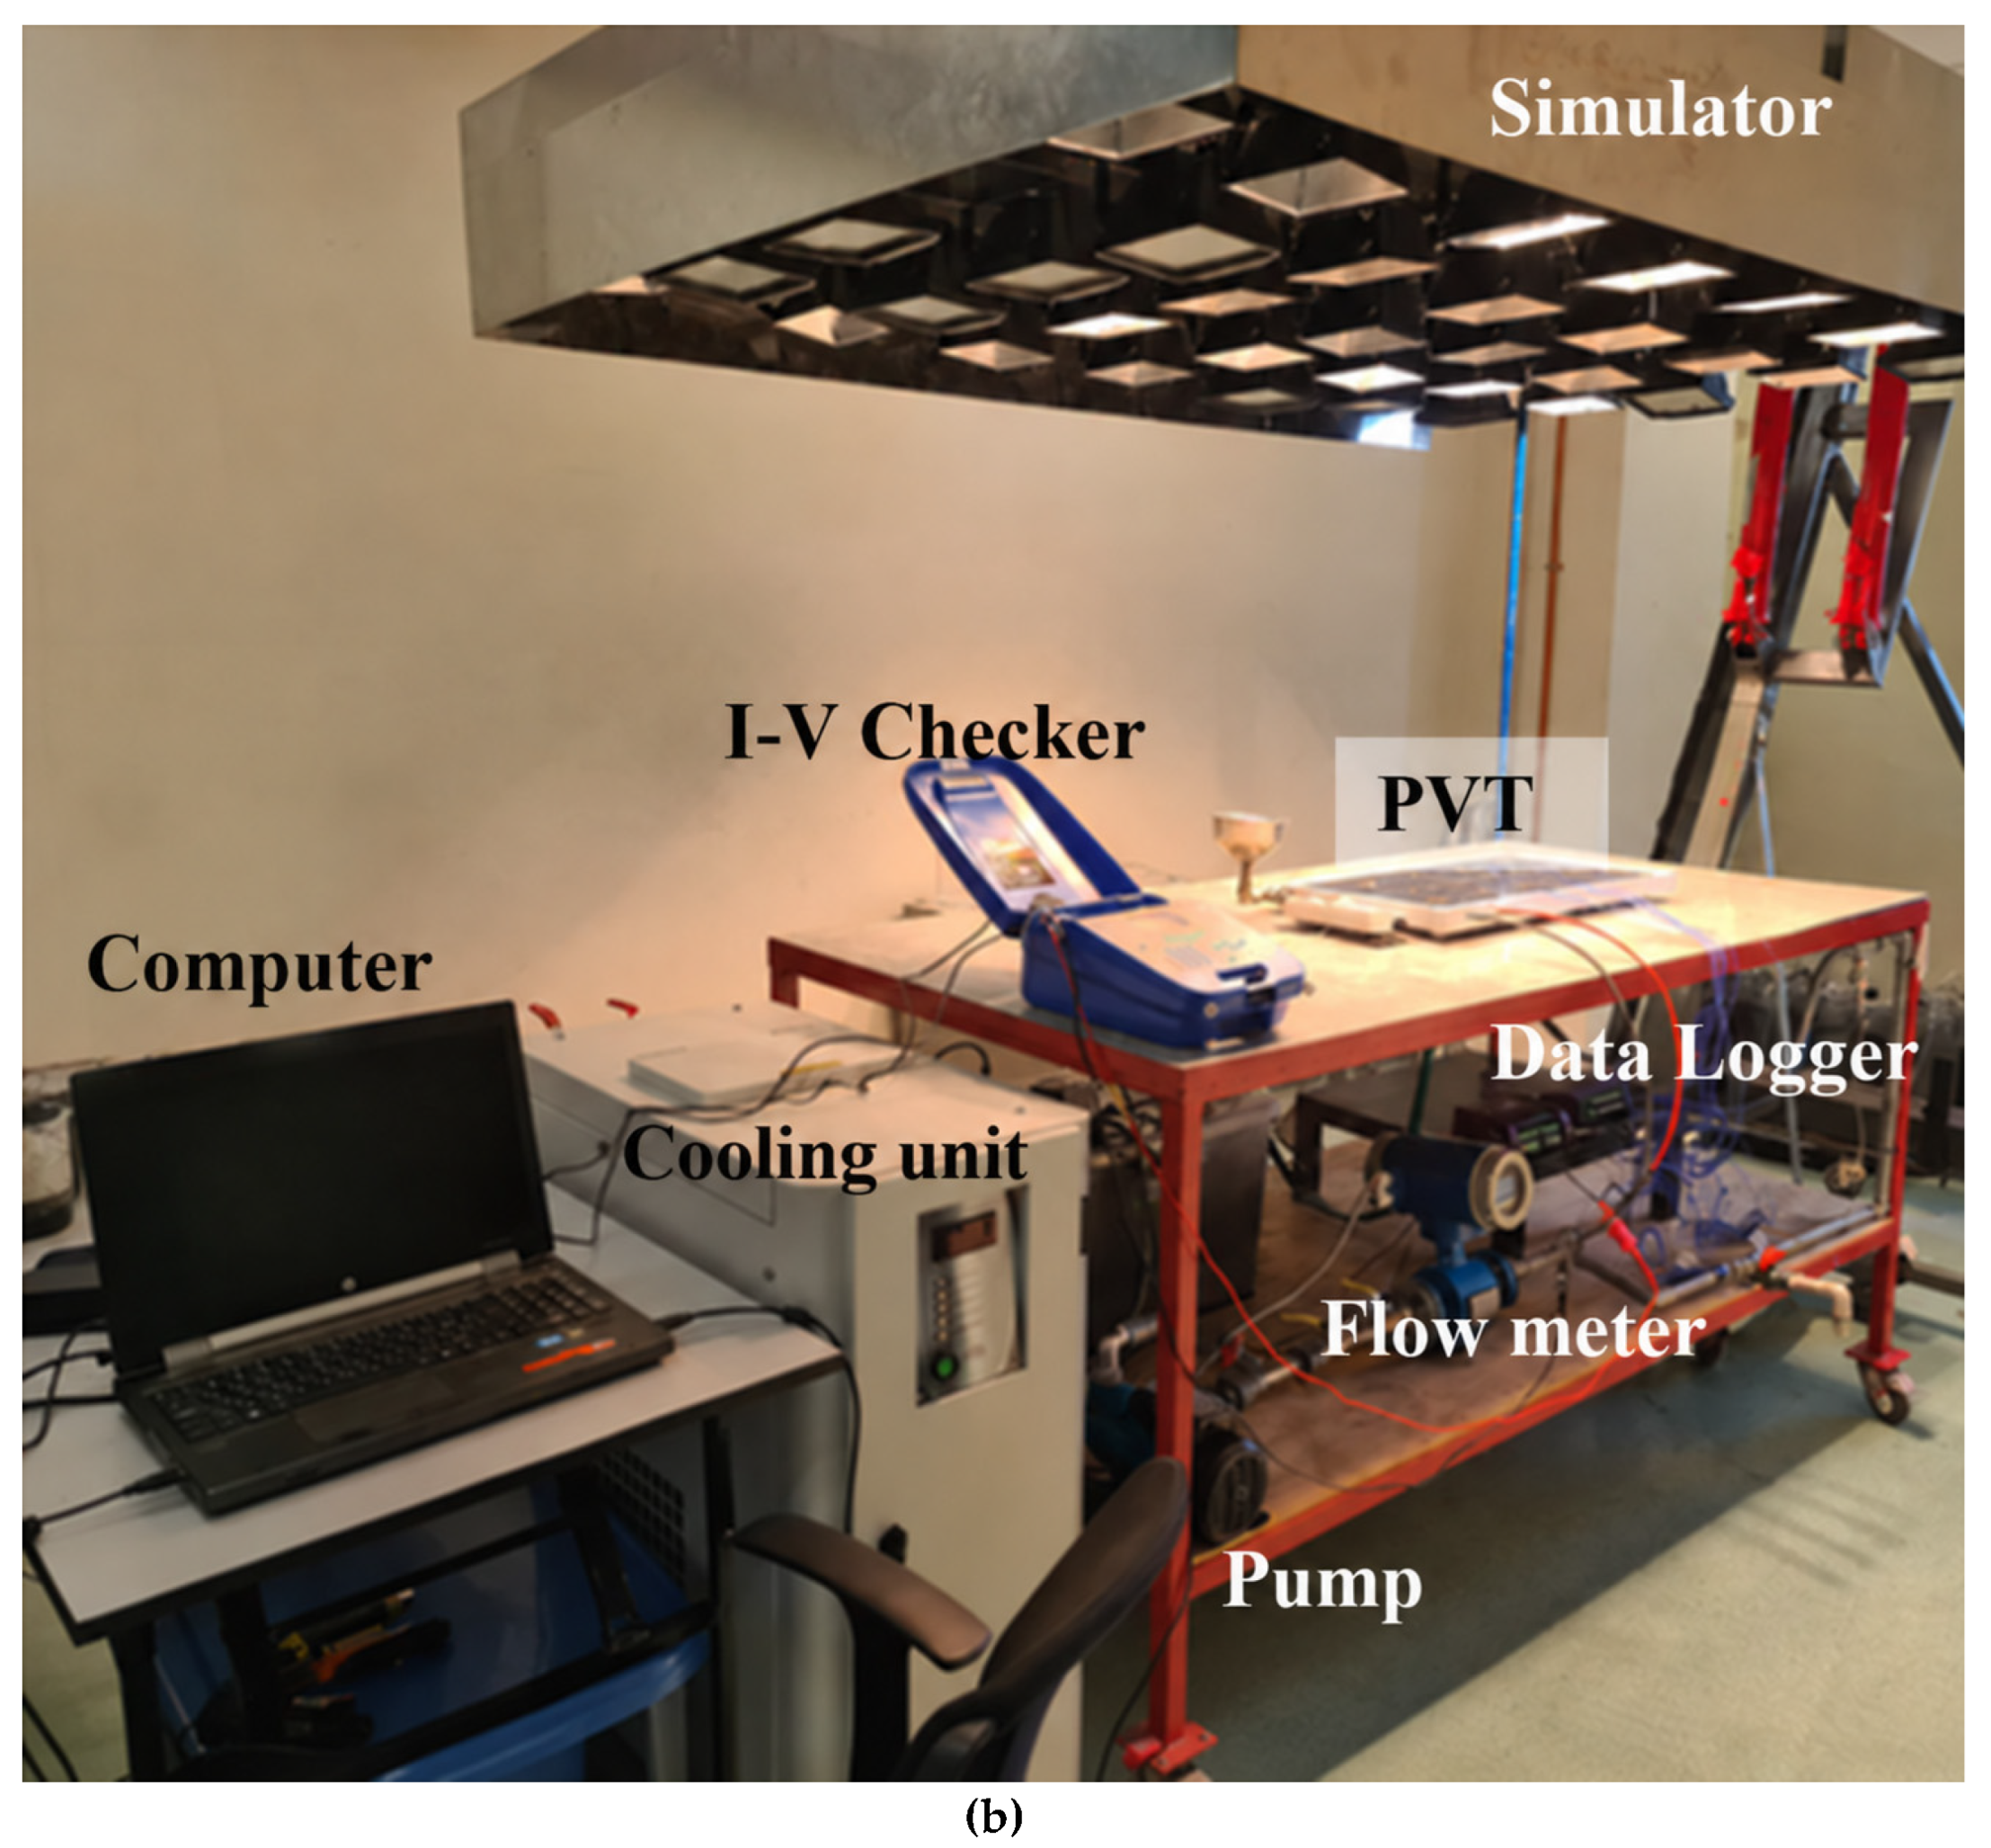
The experimental test loop consisted of the main components summarized in Table 1 and illustrated schematically in Figure 1. The system was designed to evaluate the thermal, electrical, and thermodynamic performance of different PVT collector configurations under controlled indoor conditions. The experimental setup included a photovoltaic panel, coolant storage tank, heat exchanger, vertical cooling unit, data logger, fluid reservoir, circulation pump, flow meter, pyranometer, and I–V curve tracer. The experimental data and curve fittings were processed and analyzed using MATLAB (v2022b, MathWorks Inc., Natick, MA, USA).
Table 1.
Equipment manufacturers and source locations used in the experimental study.
Figure 1.
Schematic diagram of the experimental PVT collector test loop.
2.1. Design of the Absorber Section
The cooling system was designed to enhance heat removal from the rear surface of the PV panel by increasing the heat-transfer area and improving fluid mixing inside the absorber tubes. The absorber section consisted of micro-finned copper tubes equipped with twisted-tape inserts and connected using elbow fittings.
2.1.1. Absorber-Tube Design
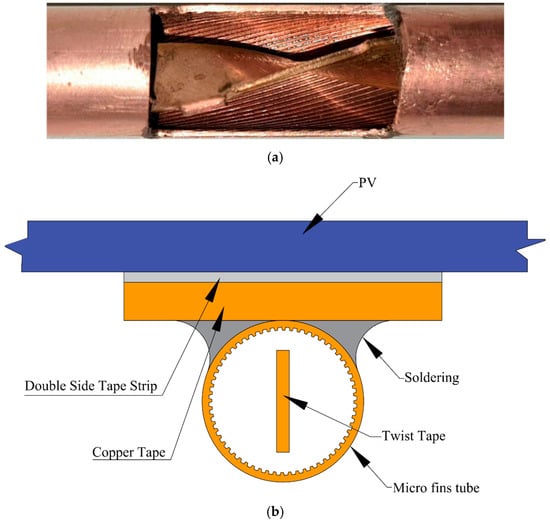
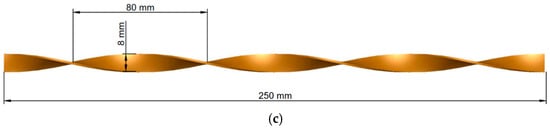
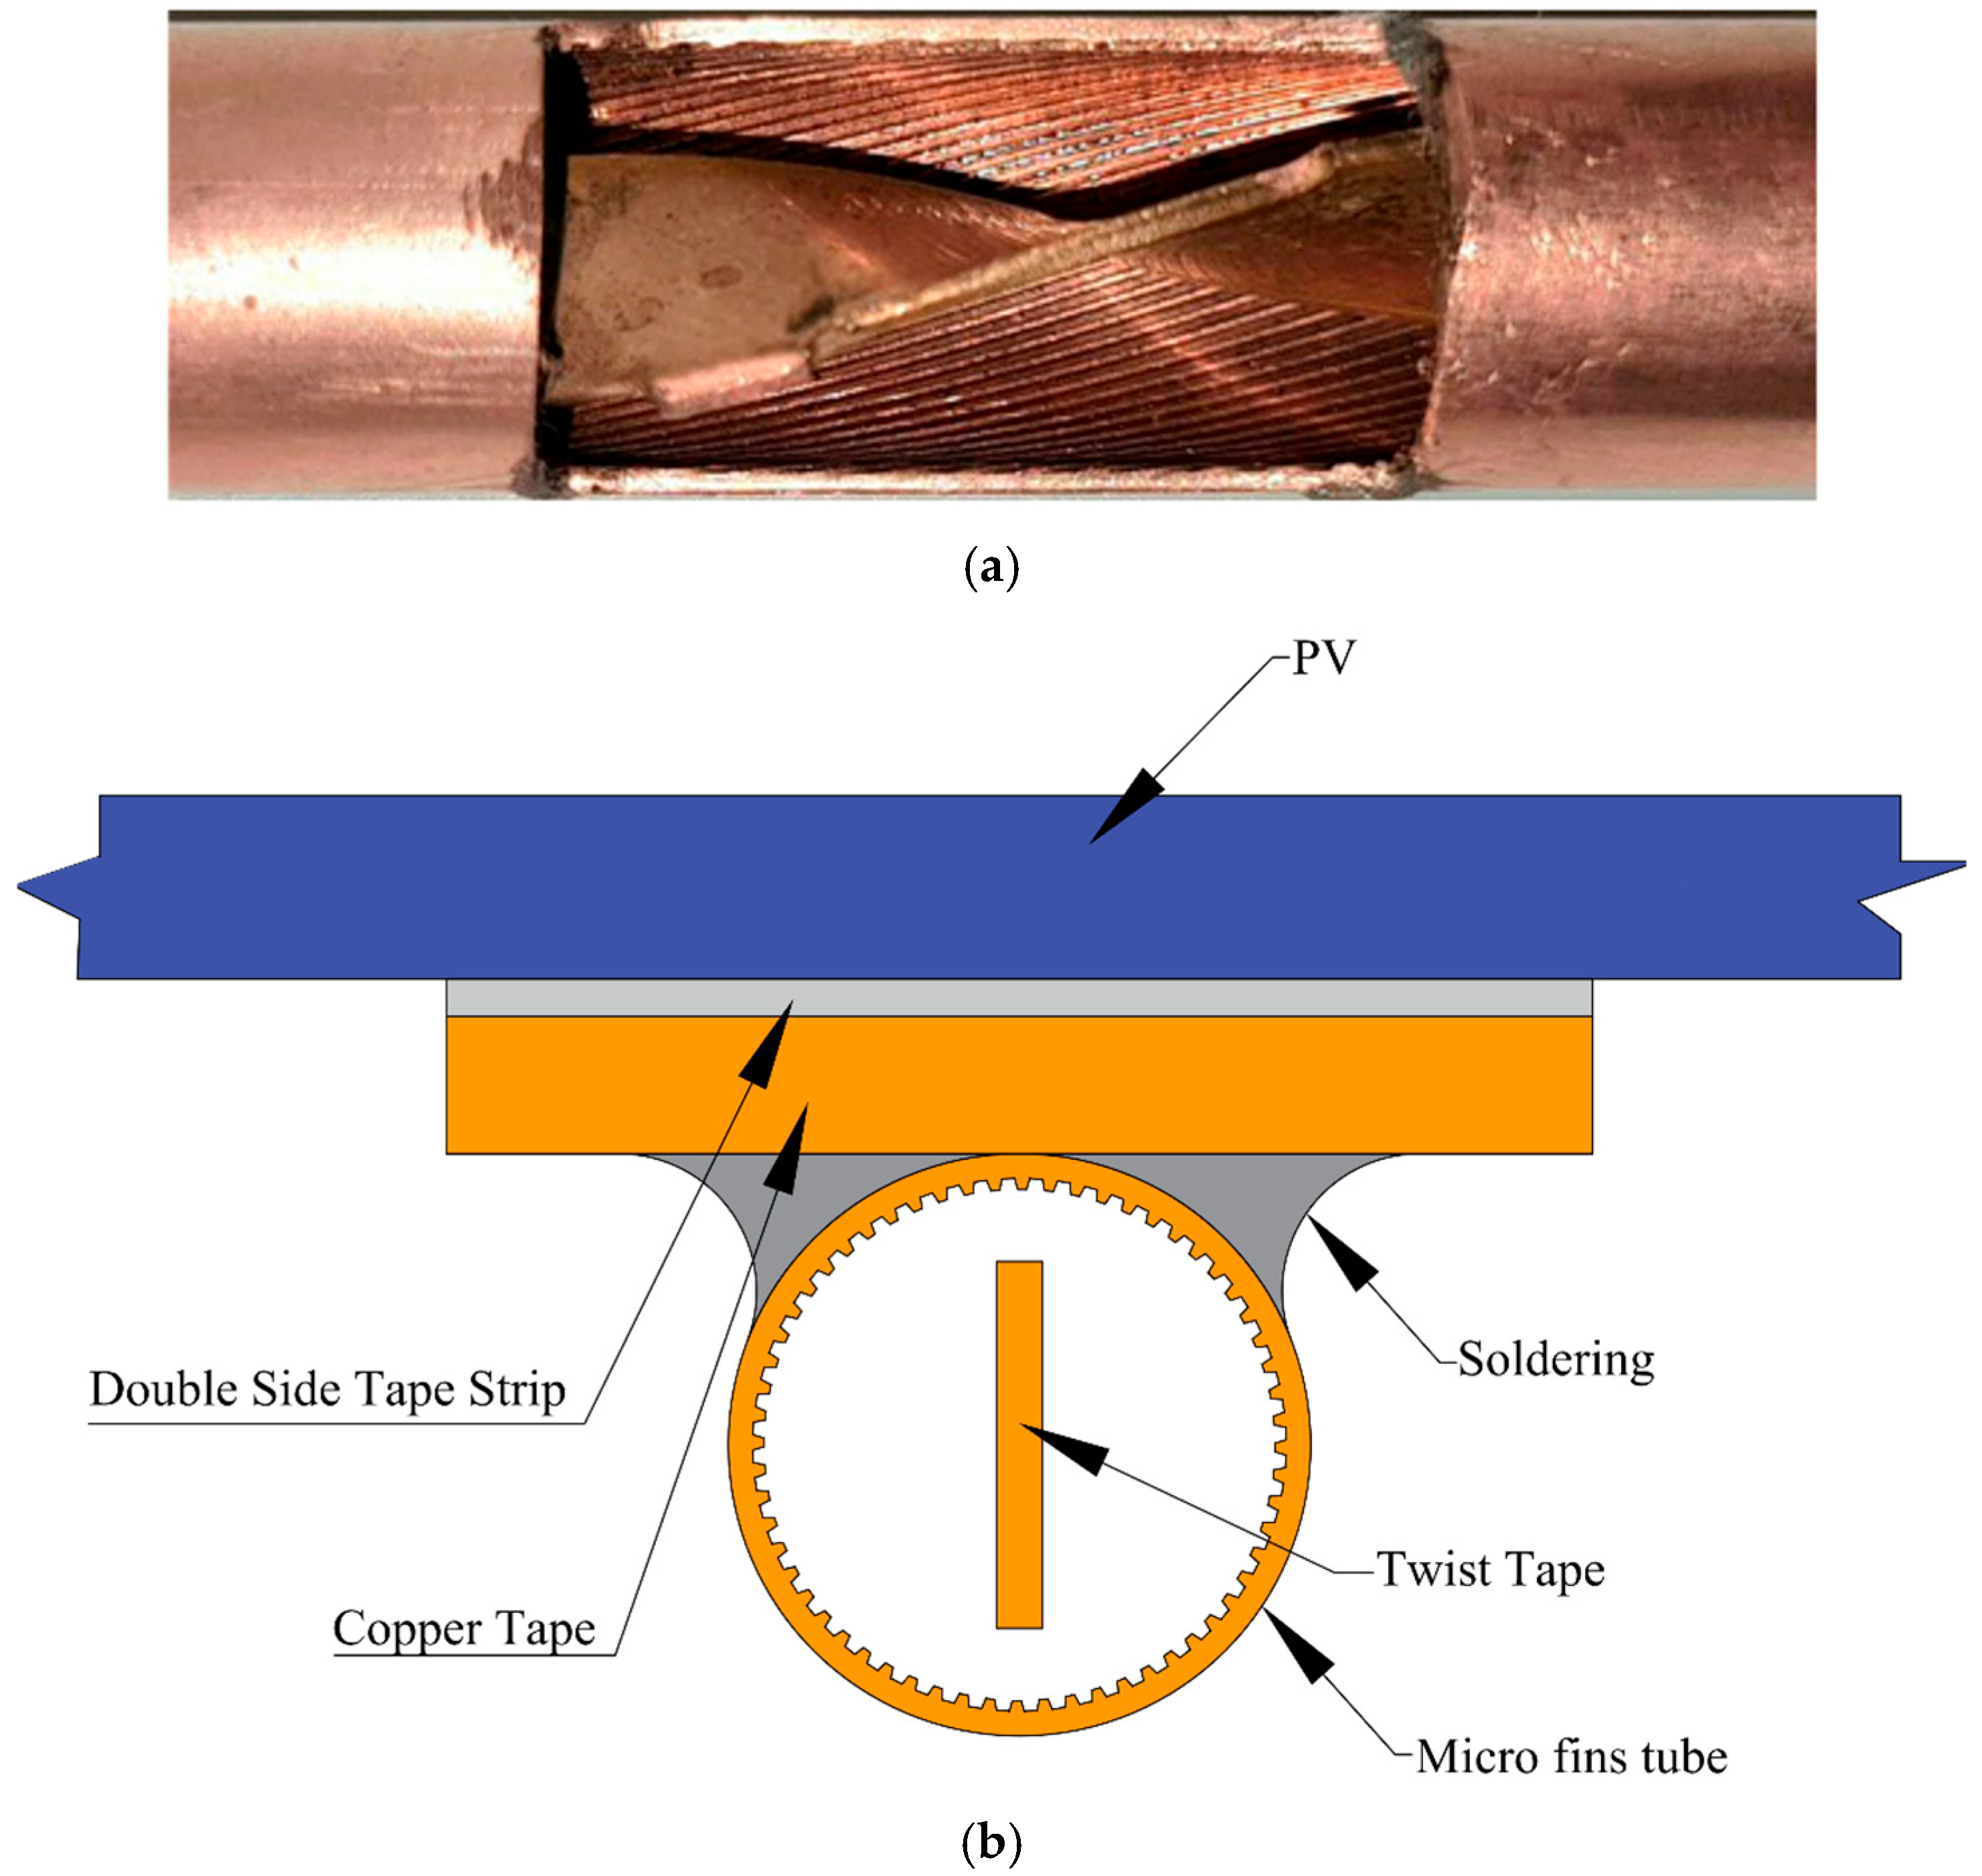
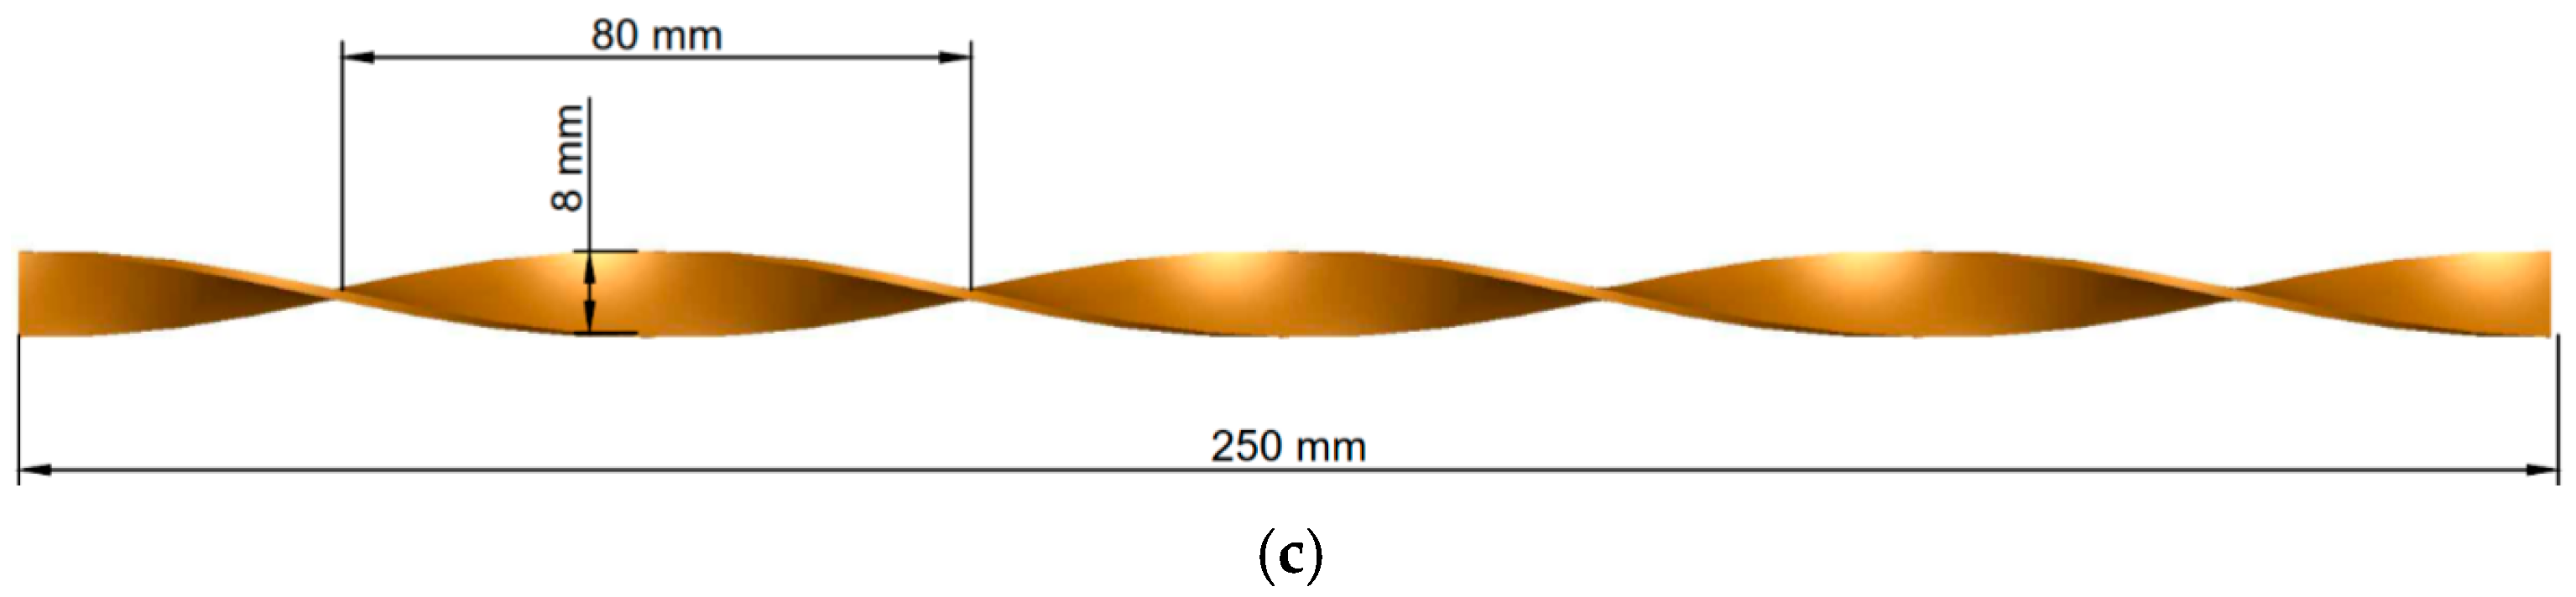
The flow channel was constructed from micro-finned tubes with an outer diameter of 12.7 mm. Twisted-tape inserts were placed inside the tubes to promote secondary flow and improve convective heat transfer between the absorber wall and the working fluid. The tubes were connected in a serpentine arrangement using elbow fittings. The geometric specifications of the micro-finned tube and twisted-tape insert are presented in Table 2, while Figure 2 shows the tube section, cross-section of the finned tube, and twisted-tape geometry.
Table 2.
Geometric specifications of the micro-finned tube and twisted-tape insert.
Figure 2.
Absorber-tube geometry: (a) micro-finned tube section with twisted-tape insert, (b) cross-section of the micro-finned tube, and (c) twisted-tape insert.
2.1.2. Thermal Interface
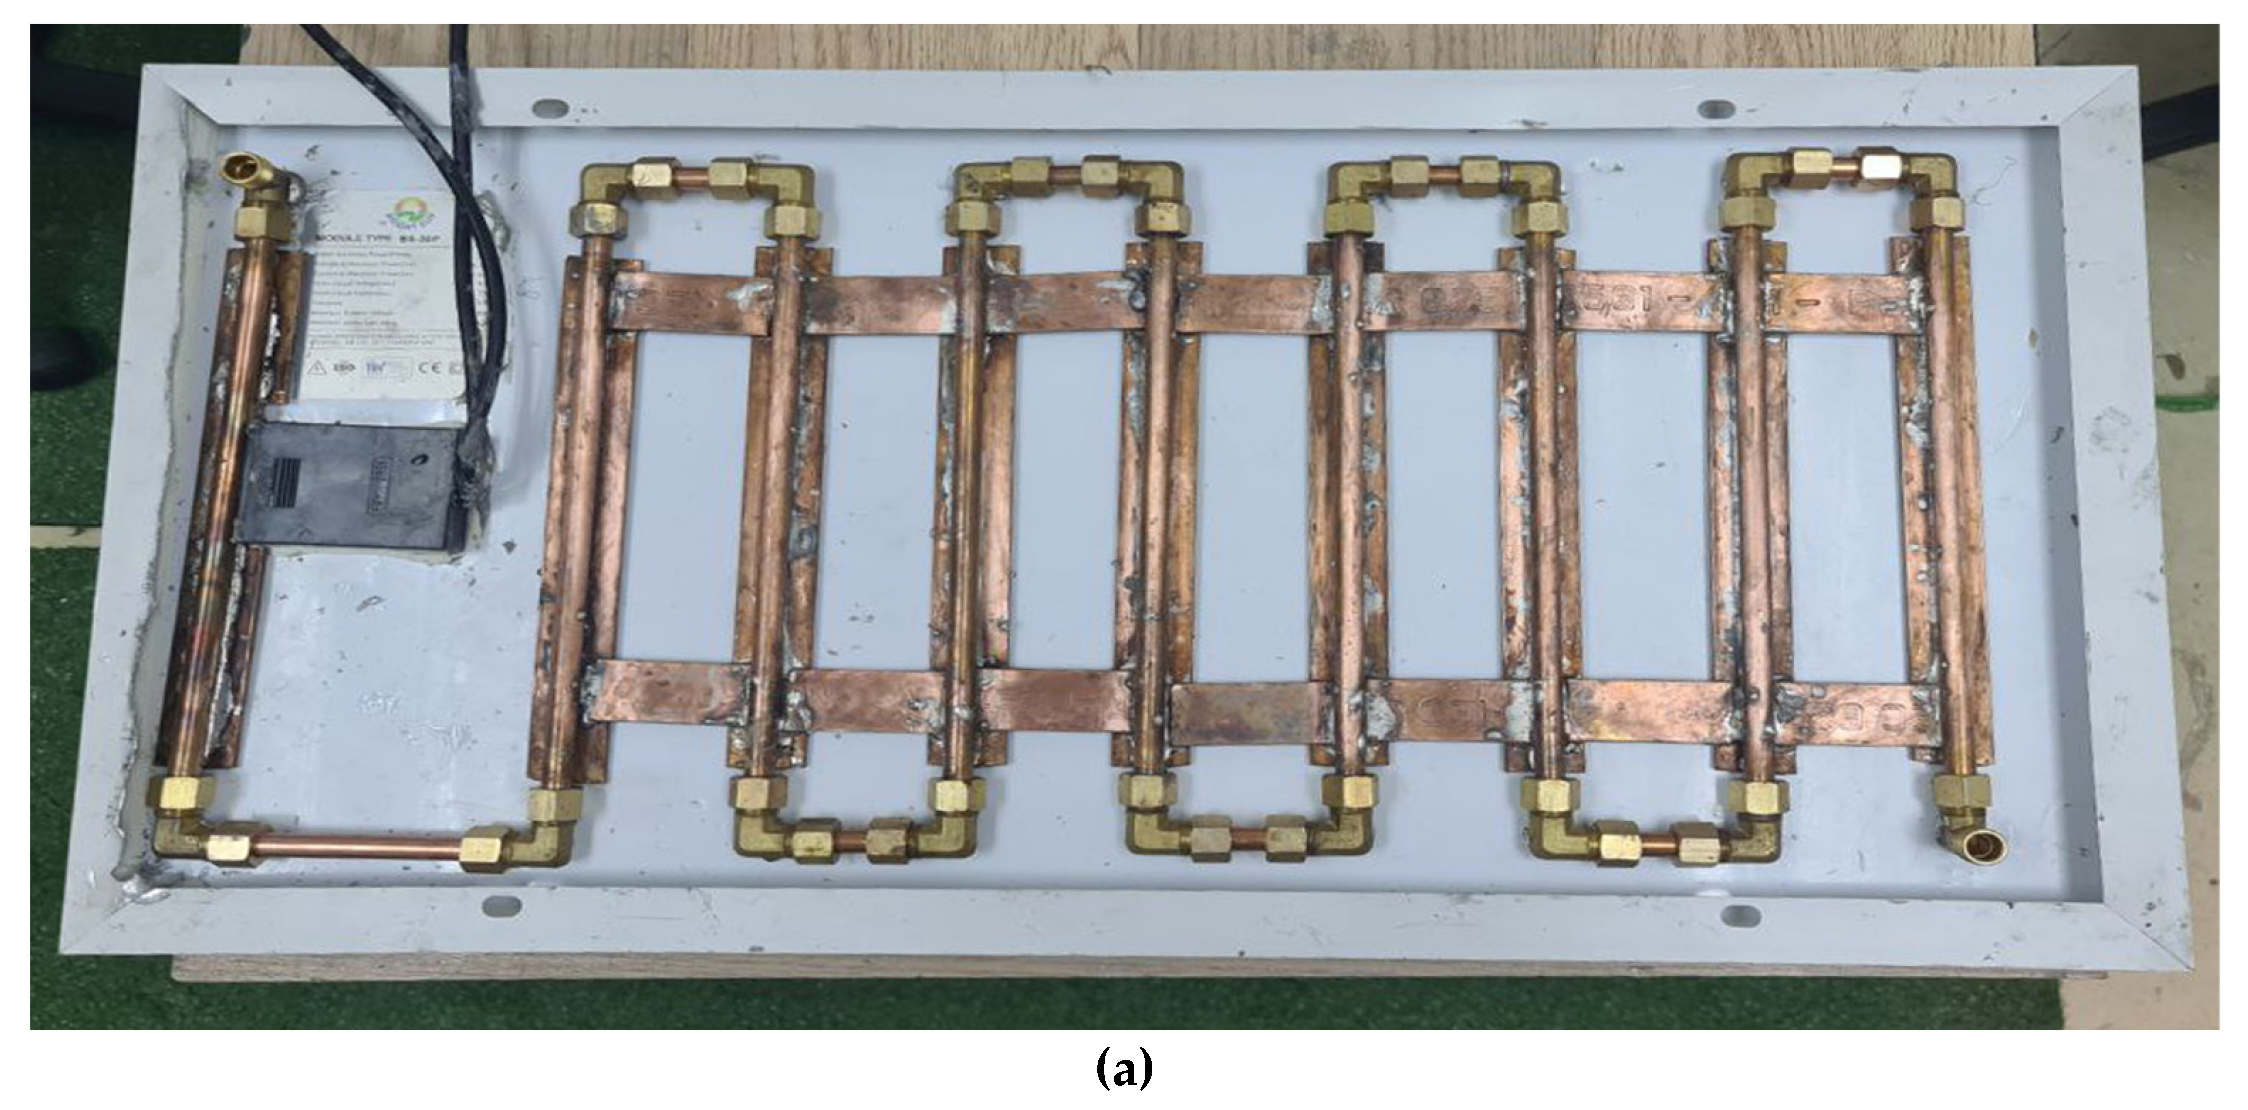
A copper strip with dimensions of 25 mm × 3 mm was used to join and reinforce the tube assembly, increase the contact area, and reduce thermal resistance between the absorber and the PV panel. The assembled absorber was attached firmly to the rear surface of the photovoltaic panel using highly conductive double-sided thermal tape, as shown in Figure 2b.
2.2. Solar Simulation and Environmental Conditions
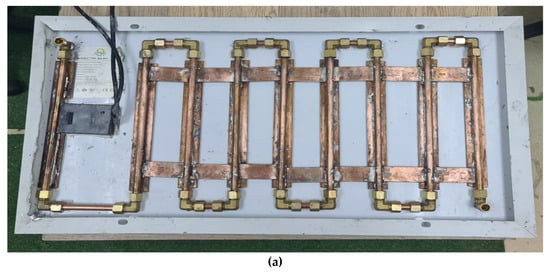
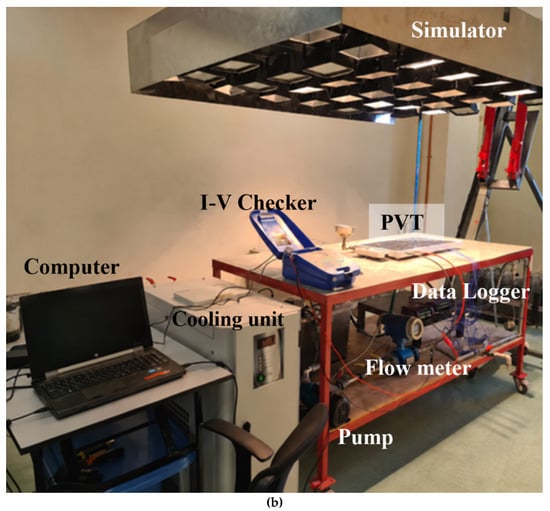
Indoor experiments were conducted under controlled and repeatable conditions using a solar simulator consisting of 35 halogen lamps, each rated at 500 W. The simulator provided five irradiance levels: 200, 400, 600, 800, and 1000 W/m2. During testing, the system was allowed to reach thermal equilibrium before measurements were recorded. The ambient room temperature was maintained at approximately 27 °C, and each test was conducted over a standard one-hour measurement period, as shown in Figure 3.
Figure 3.
Experimental setup: (a) PVT collector with micro-finned absorber configuration and (b) indoor solar simulator.
2.3. Measurement Equipment
To monitor the thermal and electrical performance of the PVT collector, the experimental loop was connected to a digital data logger, model Datataker DT85G. Ten calibrated K-type thermocouples were used to measure the PV surface and system temperatures. In addition, two PT100 RTD sensors were installed at the inlet and outlet of the absorber to measure the working-fluid temperatures.
2.4. Fluid Circulation and Thermal Control
The working fluid was circulated through a closed loop using a 0.5 HP circulation pump. The volumetric flow rate was controlled and measured using an electromagnetic flow meter, model DHYB-800. A vertical cooling unit, model SPH20N-19-4566, together with a secondary heat exchanger, was installed at the loop inlet to maintain a stable inlet-fluid temperature during the experiments.
2.5. Electrical Performance Measurement
The electrical characteristics of the photovoltaic panel were measured using an EKO MP-11 I–V curve tracer. The main operating specifications of the photovoltaic collector are listed in Table 3. The thermal absorber attached to the rear side of the PV panel consisted of 12.7 mm outer-diameter micro-finned tubes equipped with twisted-tape inserts. Depending on the tested configuration, the working fluid was pure water, SiC/water nanofluid, or SiC–Al2O3/water hybrid nanofluid.
Table 3.
Operating specifications of the photovoltaic panel and absorber section.
2.6. Tested Configurations
To evaluate the individual and combined effects of the enhanced absorber geometry, nanofluid, hybrid nanofluid, and nano-enhanced PCM, five PVT collector configurations were tested and compared:
- Case 1 (TT-W): Baseline PVT system using a plain tubular absorber and pure water as the working fluid.
- Case 2 (MF-T-W): Enhanced PVT system using micro-finned tubes with twisted-tape inserts and pure water as the working fluid.
- Case 3 (MF-T-W-NPCM): Enhanced PVT system using micro-finned tubes with twisted-tape inserts, pure water as the working fluid, and SiC-based nano-enhanced PCM for thermal storage.
- Case 4 (MF-T-NF-0.6-NPCM): Hybrid PVT system using micro-finned tubes with twisted-tape inserts, SiC/water nanofluid at 0.6 vol.% as the working fluid, and SiC-based nano-enhanced PCM for thermal storage.
- Case 5 (MF-T-HNF-0.6-NPCM): Advanced hybrid PVT system using micro-finned tubes with twisted-tape inserts, SiC-based nano-enhanced PCM, and a hybrid nanofluid composed of 0.3 vol.% SiC and 0.3 vol.% Al2O3 dispersed in water, with a total nanoparticle concentration of 0.6 vol.%.
3. Preparation of Nano-Enhanced PCM and Nanofluids
The nano-enhanced phase-change material (NPCM) and nanofluids were prepared in two stages. First, the nanoparticles were dispersed in the base media, namely paraffin wax for the NPCM and distilled water for the nanofluids. Second, the prepared materials were integrated into the corresponding PVT collector configurations.
For the NPCM, SiC nanoparticles were dispersed in paraffin wax to improve the thermal conductivity of the storage medium. The paraffin wax was heated until complete melting, after which the nanoparticles were gradually added under continuous mixing to promote uniform dispersion. The prepared NPCM was then incorporated into the thermal-storage section used in Cases 3–5.
For the nanofluids, two working fluids were prepared. The first was an SiC/water nanofluid with a nanoparticle concentration of 0.6 vol.%, used in Case 4. The second was an SiC–Al2O3/water hybrid nanofluid, composed of 0.3 vol.% SiC and 0.3 vol.% Al2O3, giving a total nanoparticle concentration of 0.6 vol.%, used in Case 5. Pure water was used as the working fluid in Cases 1–3.
To reduce particle agglomeration and improve suspension stability, polyvinylpyrrolidone (PVP) was added as a surfactant. Homogenization was carried out using a 30 L ultrasonic bath, model Xuelelile PS-100A. The mixtures were sonicated for 90 min at 40 kHz to improve dispersion and minimize sedimentation. The thermophysical properties of the base paraffin wax and the nanoparticles used in this study are listed in Table 4.
Table 4.
Thermophysical properties of paraffin wax and nanoparticles [19].
4. Uncertainty Analysis
A measurement uncertainty analysis was performed to evaluate the reliability of the experimental data and the calculated performance indicators. Experimental errors may arise from instrument accuracy, calibration limits, environmental fluctuations, and reading or data-acquisition errors. The combined uncertainty of a calculated parameter was estimated using the method of Kline and McClintock [20], as expressed by:
where is the total uncertainty of the calculated variable ; are the independent measured variables; and are the corresponding uncertainties of the measured variables.
Instrument Uncertainties
The main instruments used in the experiment and their corresponding measurement ranges and accuracies are listed in Table 5. These uncertainties were used in the propagation analysis for the calculated thermal, electrical, and exergetic performance parameters.
Table 5.
Measurement ranges, accuracies, and uncertainties of the experimental instruments.
The calculated estimated amounts of uncertainty in the individual devices combined were within the range of ±0.29% to ±1.75%. This range indicates acceptable experimental reliability for comparing the tested PVT configurations. However, the uncertainty associated with each derived quantity should be reported separately to allow a more complete assessment of the measured performance improvements.
The instrumental accuracy of the laboratory instruments used to evaluate the thermophysical properties of the nanofluid suspensions is listed in Table 5, where the maximum uncertainty for these instruments was ±1.74.
5. Thermodynamic Analysis
5.1. Energy Performance Analysis of the PVT Collector
The energy performance of the PVT collector was evaluated using the electrical output, useful thermal gain, and thermal efficiency. These parameters were used to compare the performance of the five tested configurations under different irradiance levels and mass flow rates. The electrical efficiency of the PV panel is calculated as follows [21]:
where is the maximum electrical power output (W), G is the solar irradiance (W/m2), and is the area of the photovoltaic panel (m2).
The thermal efficiency of the PVT collector is calculated as follows [22]:
where is the useful thermal gain (W) and is the collector area (m2).
The useful thermal gain is calculated from the working-fluid temperature rise:
where is the mass flow rate of the working fluid (kg/s), is the specific heat capacity of the working fluid (J/kgK), and and are the outlet and inlet fluid temperatures, respectively.
5.2. Exergy Balance Analysis of the PVT Collector
The exergy analysis was performed using the second law of thermodynamics to evaluate the quality of the recovered thermal and electrical energy. The total exergy output of the PVT collector was determined from the sum of the useful thermal exergy and the electrical exergy [20,23].
The exergy input associated with solar irradiance is expressed as:
where is the solar exergy input (W), is the ambient temperature (K), and is the apparent sun temperature (K) and is estimated to be around 5800 Kelvin.
The useful thermal exergy is calculated as:
where is the thermal exergy output (W), and is the outlet fluid temperature (K). All temperatures used in the exergy equations should be expressed in Kelvin.
The electrical exergy is assumed to be equal to the electrical power output and is expressed as:
The total exergy output of the PVT collector is therefore:
The overall exergy efficiency is calculated as:
Alternatively, the exergy efficiency can be expressed in terms of exergy destruction:
where is the exergy destruction rate of the PVT collector.
6. Techno-Economic Analysis
The economic performance of the PVT collector was evaluated by estimating the annual cost of the system and the unit cost of the useful energy produced. The annual cost includes the annualized capital cost of the collector, the annual operating cost of the pump, the maintenance cost, and the annual salvage value. The cost analysis was performed using the economic parameters listed in Table 5. The annual operating cost of the pump is calculated as follows [5,15]:
where ARC is the annual running cost (USD/year), is the pump power consumption (kW), is the annual operating time of the pump (h/year), and is the electricity price (USD/kWh).
The capital recovery factor is calculated as [24]:
where is the annual interest rate and nis the expected service life of the PVT system.
The annual collector cost is obtained from:
where ACC is the annualized collector cost (USD/year), and is the total capital investment of the system.
The sinking fund factor is calculated as:
The annual salvage value is then calculated as:
where SV is the salvage value of the system. In this study, the salvage value was assumed to be 10% of the total capital investment:
The total annual cost is calculated as:
where AC is the total annual cost (USD/year), MC is the annual maintenance cost (USD/year), ARC is the annual running cost, and ASV is the annual salvage value.
The unit energy cost can be calculated by dividing the total annual cost by the annual useful energy gain:
where UC is the unit energy cost (USD/kWh), and AEG is the annual useful energy gain (kWh/year), which is estimated at 2920 h/year.
It should be noted that UC represents the cost per unit of energy (kWh/USD), and AEG is the annual gain in useful energy (kWh/year). Therefore, using Equation (19), and considering an annual operating time of 2920 h/year (8 h/day) and an average solar irradiance of 600 W/m2, the annual gain in useful energy can be calculated and estimated at 536 kWh/year for Case 5.
Table 6 shows the costs of raw materials used to build the working model.
Table 6.
Cost data and economic assumptions used in the techno-economic analysis.
Economic Analysis
The economic indicators of the proposed PVT collector were calculated using Equations (11)–(19) and the assumptions listed in Table 5. The total capital investment, CI, was obtained by summing the costs of the main system components:
CI = (30 + 100 + 40 + 30 + 30 + 53 + 55) = USD 338
The annual maintenance cost was assumed to be 10% of the combined cost of the water pump and piping system, giving:
MC = USD 7.00/year
For a service life of 25 years and an annual interest rate of 6%, the salvage value was calculated as:
SV = 0.1CI = USD 33.80
The corresponding capital recovery factor and sinking fund factor were:
CRF = 0.07823
SFF = 0.01823
Accordingly, the annualized collector cost and annual salvage value were:
ACC = CRF × CI = USD 26.44/year
ASV = SFF × SV = USD 0.62/year
Assuming that the pump operates for 2920 h/year, corresponding to 8 h/day for 365 days, with a power consumption of 0.04 kW and an electricity price of USD 0.15/kWh, the annual running cost was:
ARC = USD 17.52/year
Therefore, the total annual cost of the system was:
AC = ACC + MC + ARC − ASV
AC = 26.44 + 7.00 + 17.52 − 0.62 = USD 50.34/year
The calculated economic indicators are summarized in Table 7. Despite the additional cost of the micro-finned tubes, twisted-tape inserts, nanofluid, and NPCM, the annualized cost remains moderate. However, the practical economic viability of the system depends strongly on the annual useful energy gain, pump power consumption, component lifetime, and operating conditions.
Table 7.
Summary of the calculated economic indicators.
7. Results and Discussion
7.1. Thermal Behavior and Experimental Reliability
The performance of the tested PVT configurations depends on the combined effects of absorber geometry, working-fluid properties, and thermal storage. The use of micro-finned tubes and twisted-tape inserts increases the heat-transfer area and promotes secondary flow inside the absorber tubes. This improves convective heat transfer between the absorber wall and the circulating fluid. In the configurations containing NPCM, the phase-change material provides additional thermal storage and helps reduce temperature fluctuations at the rear surface of the PV panel.
Among the tested configurations, Case 5 combines micro-finned tubes, twisted-tape inserts, SiC-based NPCM, and a hybrid nanofluid containing 0.3 vol.% SiC and 0.3 vol.% Al2O3. The high thermal conductivity of SiC and the dispersion stability associated with Al2O3 and PVP contribute to improved heat removal from the PV panel. This combination reduces thermal resistance in the absorber section and supports more effective temperature regulation compared with the baseline water-cooled configuration.
The reliability of the experimental measurements was assessed through the uncertainty analysis described in Section 4. The combined experimental uncertainty was reported to be within ±2.5% to ±3.5%, which supports comparison among the tested cases. Nevertheless, the uncertainty of each calculated performance parameter should be reported separately to strengthen the reliability of the thermal, electrical, and exergy results.
7.2. Energy Performance: Thermal and Electrical Output
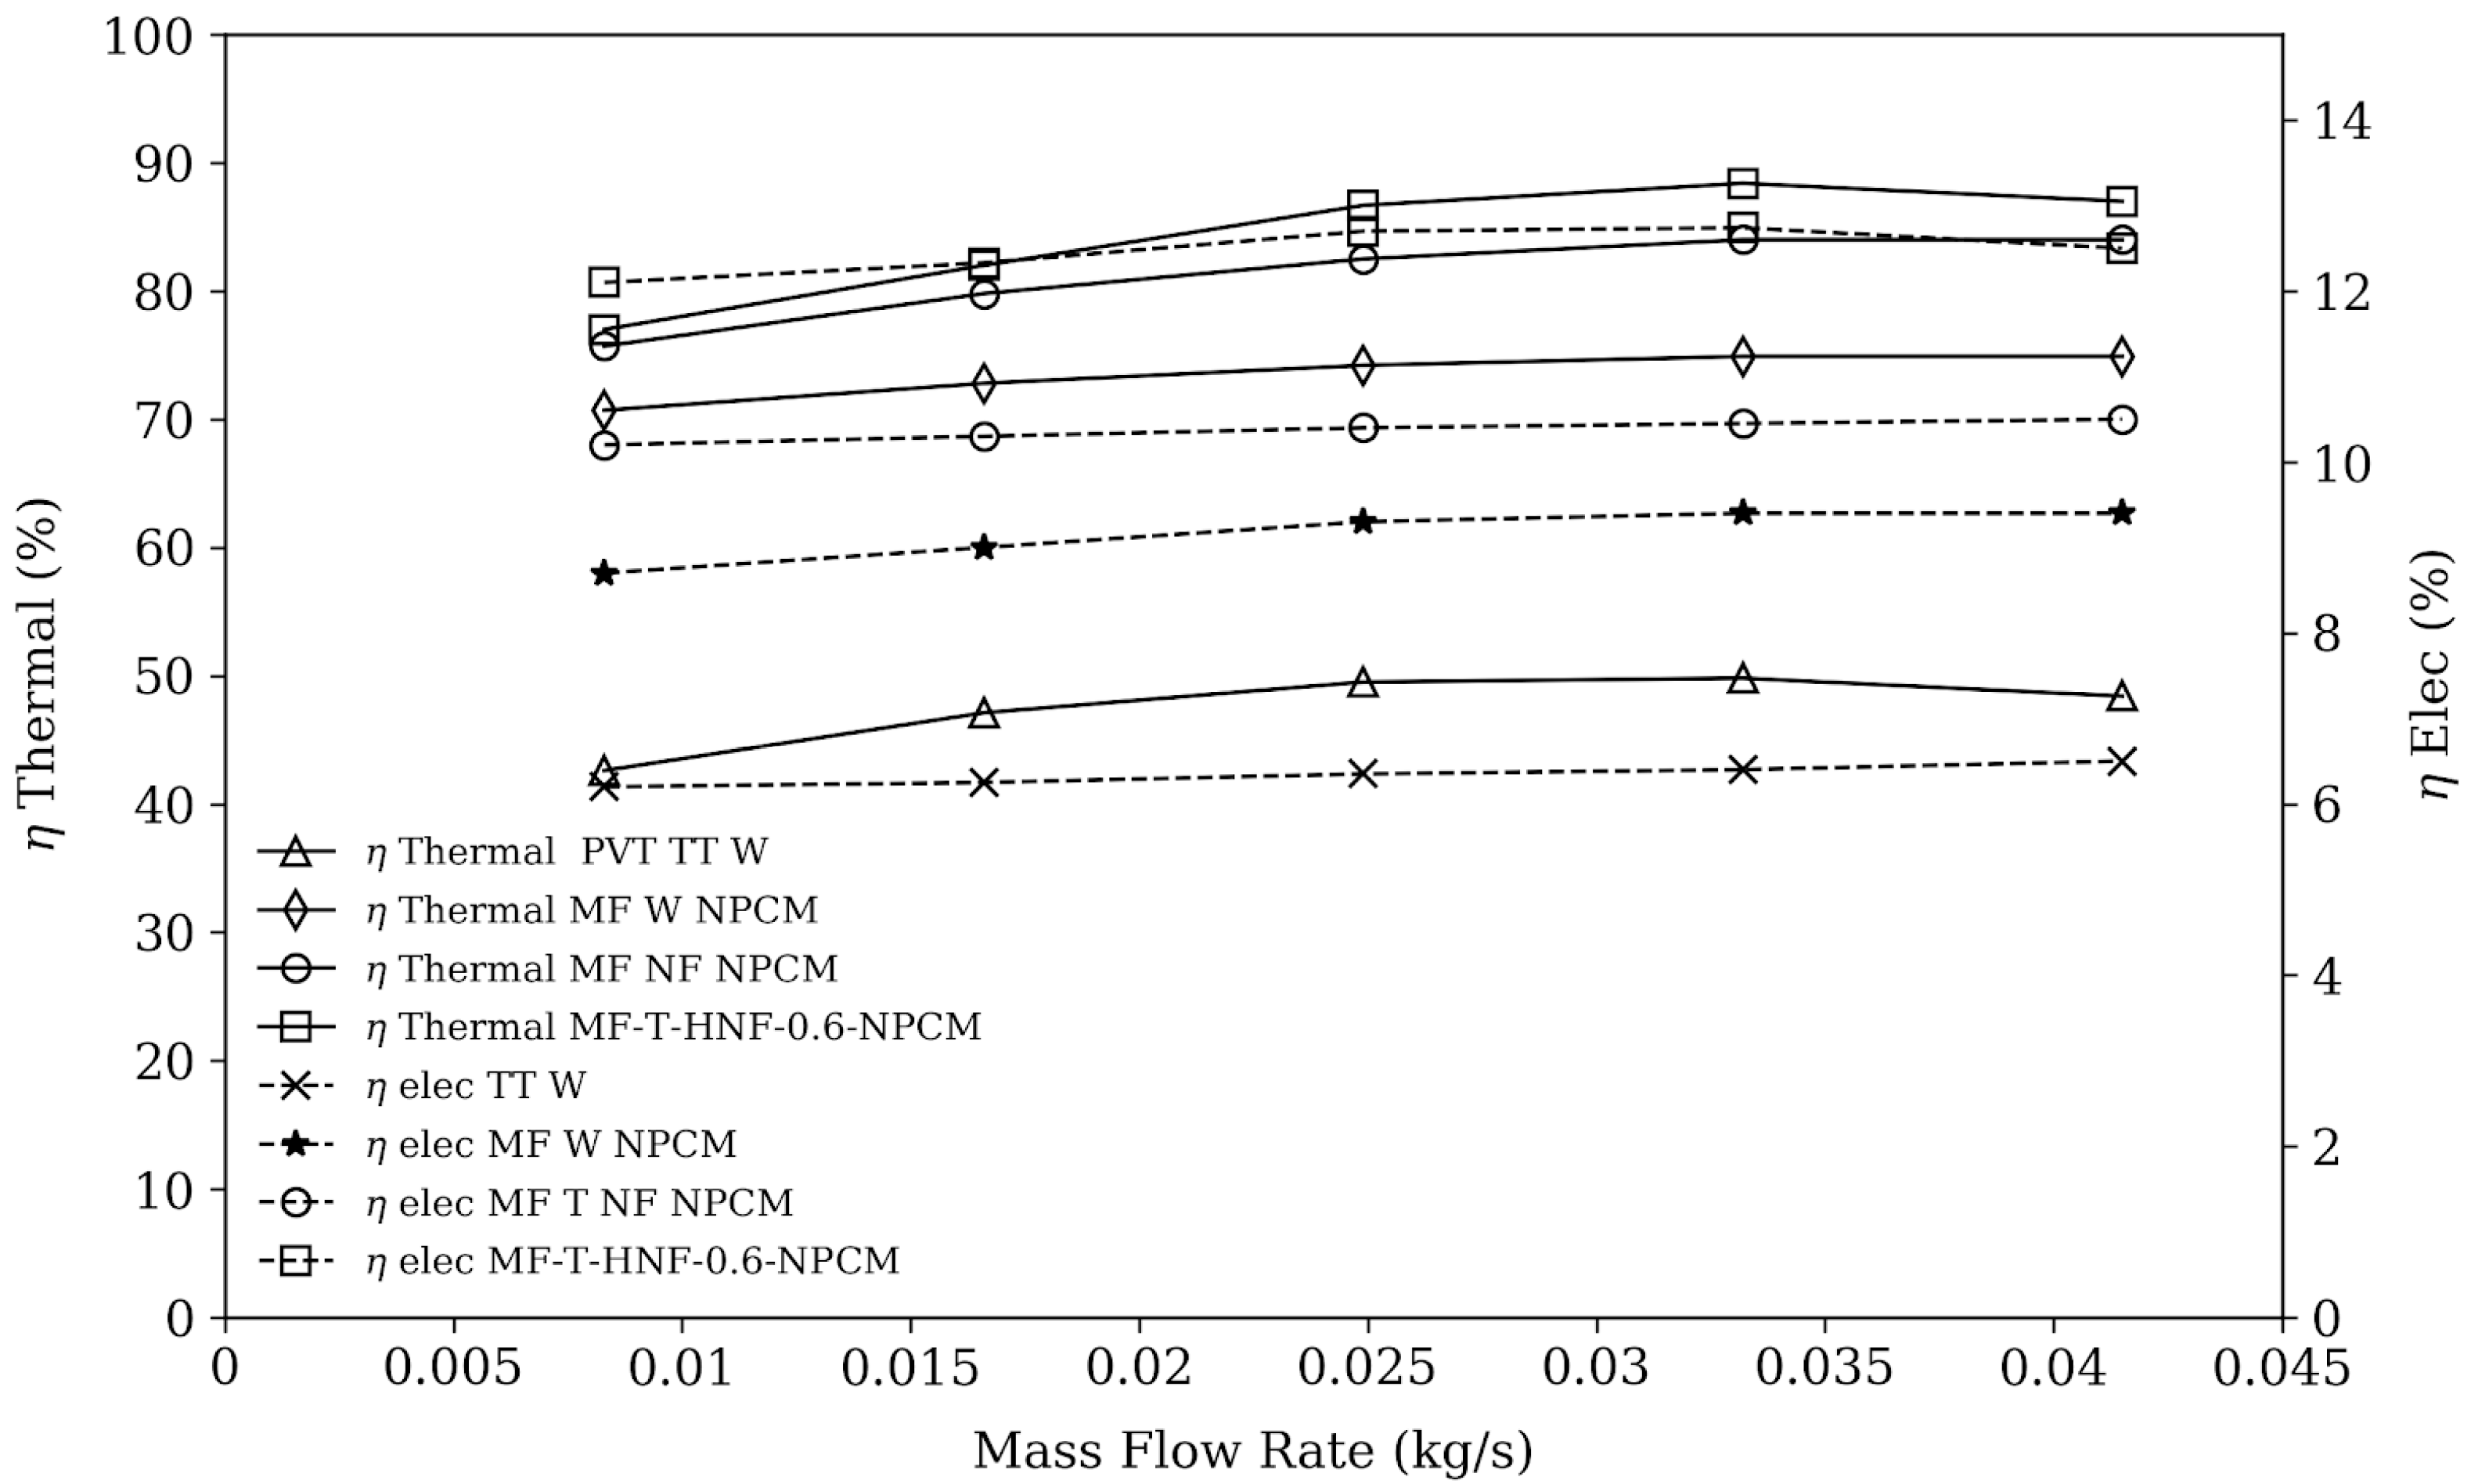
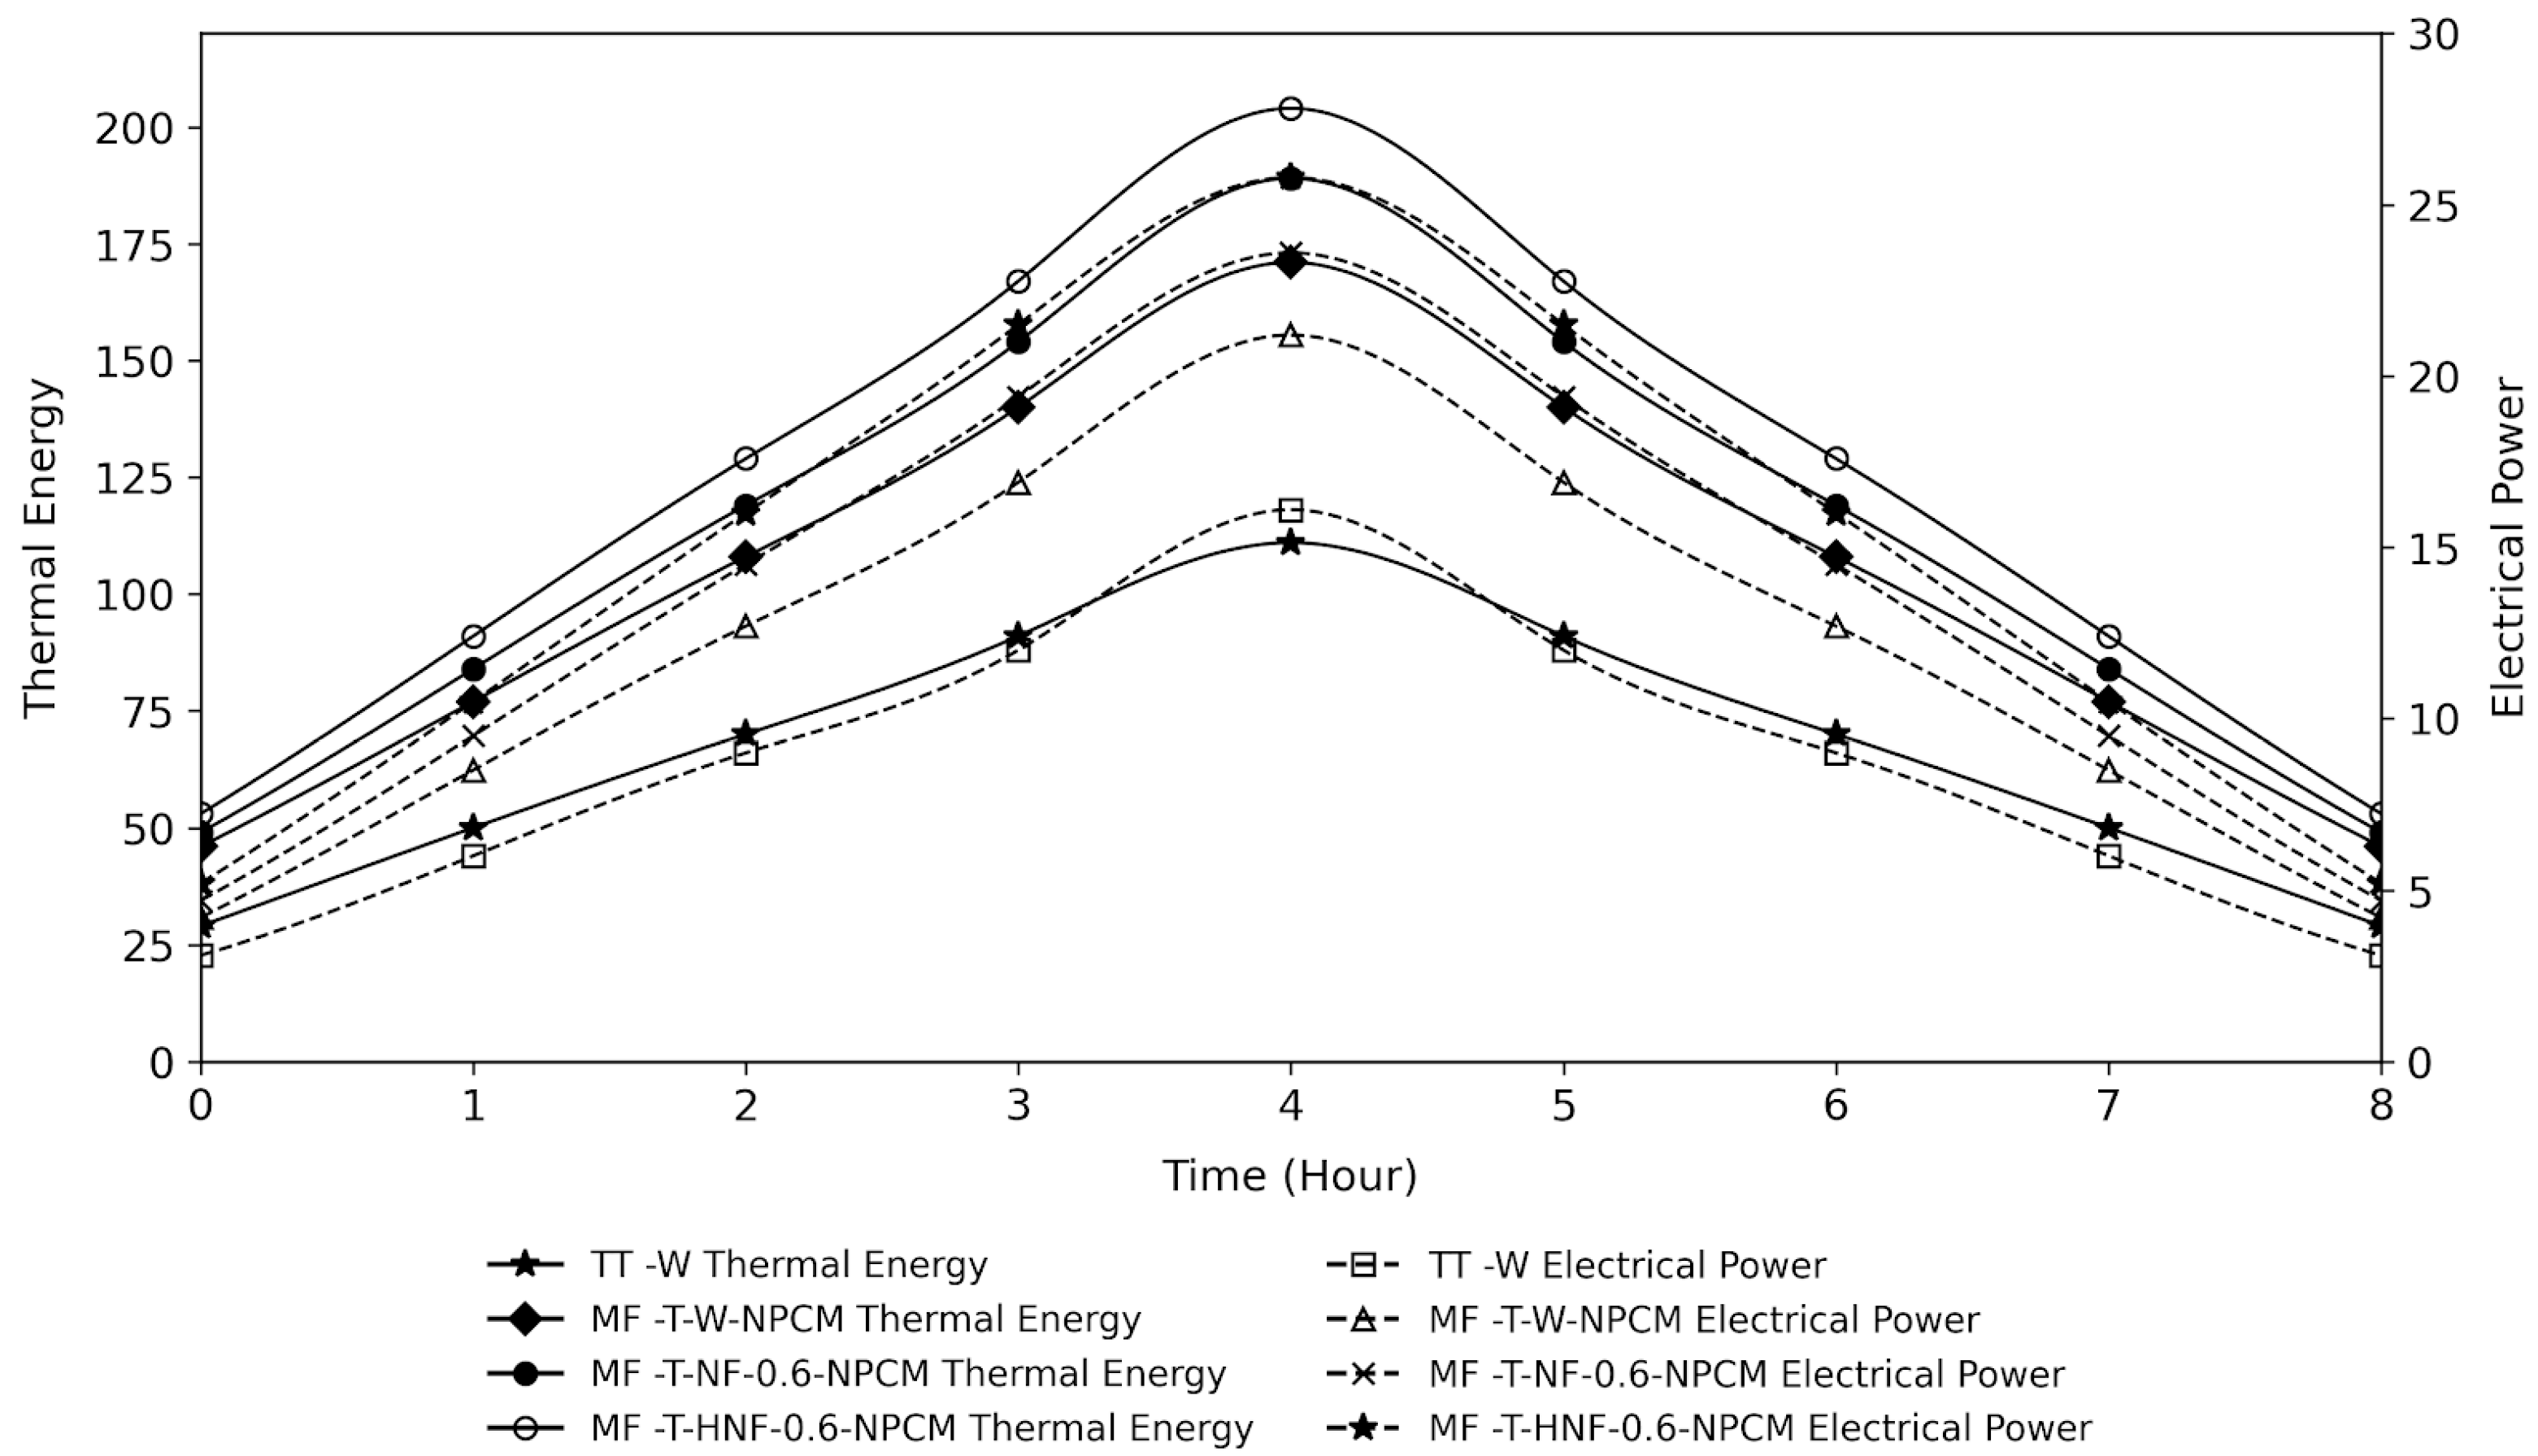
The thermal and electrical performance of the five PVT collector configurations was evaluated at different mass flow rates, as shown in Figure 4 and Figure 5. The results show that increasing the level of absorber enhancement improved heat removal from the rear surface of the PV panel and increased the useful thermal gain of the collector.
Figure 4.
Thermal and electrical efficiencies of the tested PVT configurations at different mass flow rates (at solar radiation 800 w/m2).
Figure 5.
Measured hourly thermal energy and electrical power performance under stepped solar simulator irradiance (200 w/m2 to 1000 w/m2 in 200 w/m2 increments) at a constant mass flow rate of 0.008 kg/s.
Case 5, which combined micro-finned tubes, twisted-tape inserts, SiC-based NPCM, and SiC–Al2O3/water hybrid nanofluid, achieved the highest thermal performance among the tested configurations. At a mass flow rate of 0.033 kg/s, Case 5 reached a maximum thermal efficiency of 87.5% and a useful thermal output of 189 W. This corresponds to an improvement of approximately 71.8% compared with the baseline configuration, Case 1. The improvement can be attributed to the increased heat-transfer area provided by the micro-finned tubes, the enhanced fluid mixing caused by the twisted-tape inserts, and the improved thermal properties of the hybrid nanofluid and NPCM.
The electrical performance also improved as a result of active cooling. By reducing the operating temperature of the PV panel, the enhanced cooling configuration helped maintain a higher electrical output. The maximum electrical power output reached 23.5 W for Case 5. At higher mass flow rates, particularly above approximately 0.025 kg/s, the electrical output became more stable, indicating that additional increases in flow rate produced only limited further cooling benefit.
Overall, the results indicate that the combined use of enhanced absorber geometry, hybrid nanofluid, and NPCM can improve both the useful thermal output and the electrical performance of the PVT collector. However, the reported improvements should be interpreted together with the experimental uncertainty and with the operating conditions under which the measurements were obtained.
7.3. Exergy Performance and Thermodynamic Losses
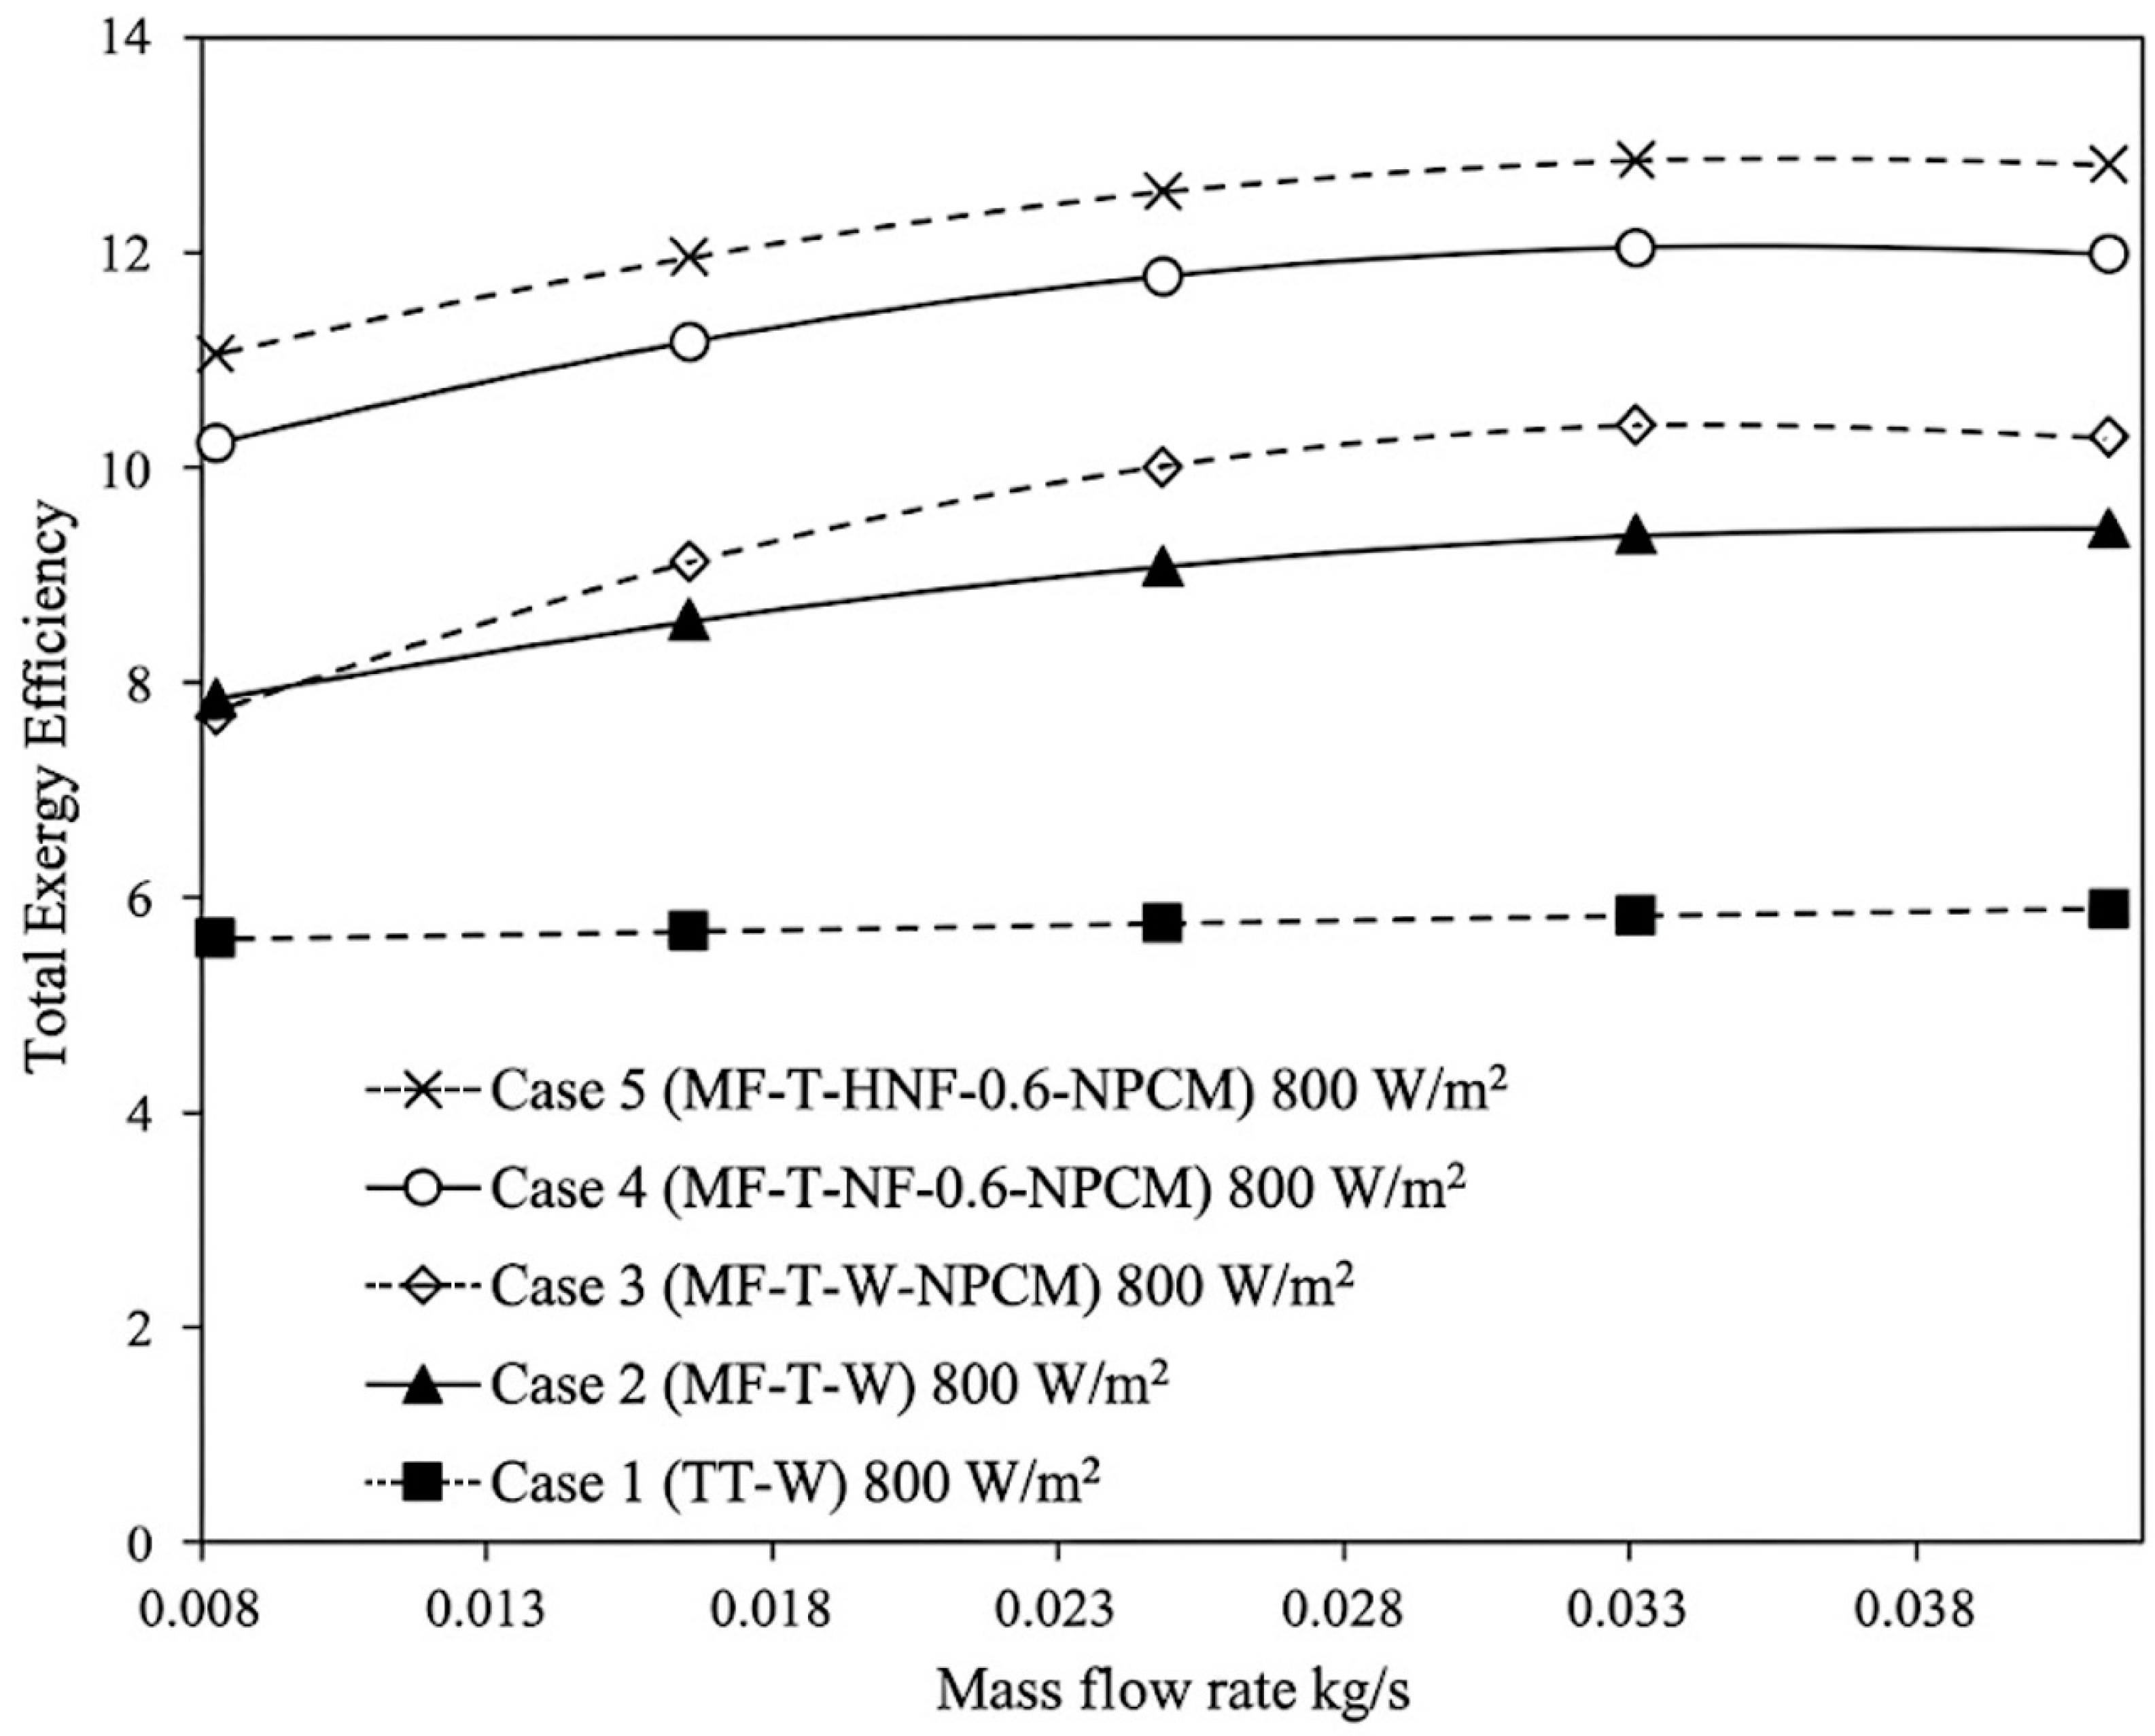
The exergy performance of the tested PVT configurations was evaluated to assess the quality of the recovered thermal and electrical energy. As shown in Figure 6, the exergy efficiency increased with mass flow rate up to an optimum range and then tended to stabilize or decrease slightly at higher flow rates.
Figure 6.
Overall exergy efficiency of the tested PVT configurations at a solar irradiance of 800 W/m2.
Case 5 achieved the highest exergy performance among the tested configurations. At a mass flow rate of 0.033 kg/s, the maximum overall exergy efficiency reached 12.85%, corresponding to an improvement of approximately 117.8% compared with the baseline configuration, Case 1. This improvement is mainly attributed to the enhanced cooling of the PV panel, increased useful thermal gain, and improved heat transfer in the absorber section.
At mass flow rates above 0.033 kg/s, the exergy efficiency showed only limited additional improvement and then decreased slightly. This behavior may be explained by the reduction in outlet-fluid temperature at higher flow rates, which reduces the thermal exergy content of the recovered heat. In addition, higher flow rates may increase hydraulic losses and pumping requirements, reducing the net thermodynamic benefit of further increasing the flow rate.
These results indicate that the optimum operating condition is not necessarily the highest mass flow rate. Instead, the best exergy performance is obtained when the improvement in heat removal is balanced against the reduction in thermal energy quality and the increase in flow-related losses.
7.4. Techno-Economic Performance
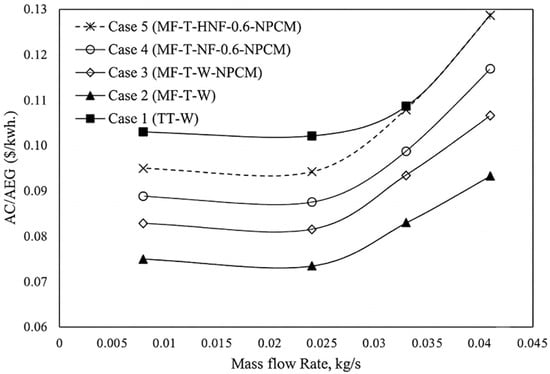
The techno-economic performance of the tested PVT configurations is presented in Figure 7, Figure 8 and Figure 9. The results show that the addition of micro-finned tubes, twisted-tape inserts, nanofluid, and NPCM increases the initial capital cost of the system. However, these components also improve thermal and exergy performance, which can reduce the unit energy cost when the system is operated under suitable conditions.
Figure 7.
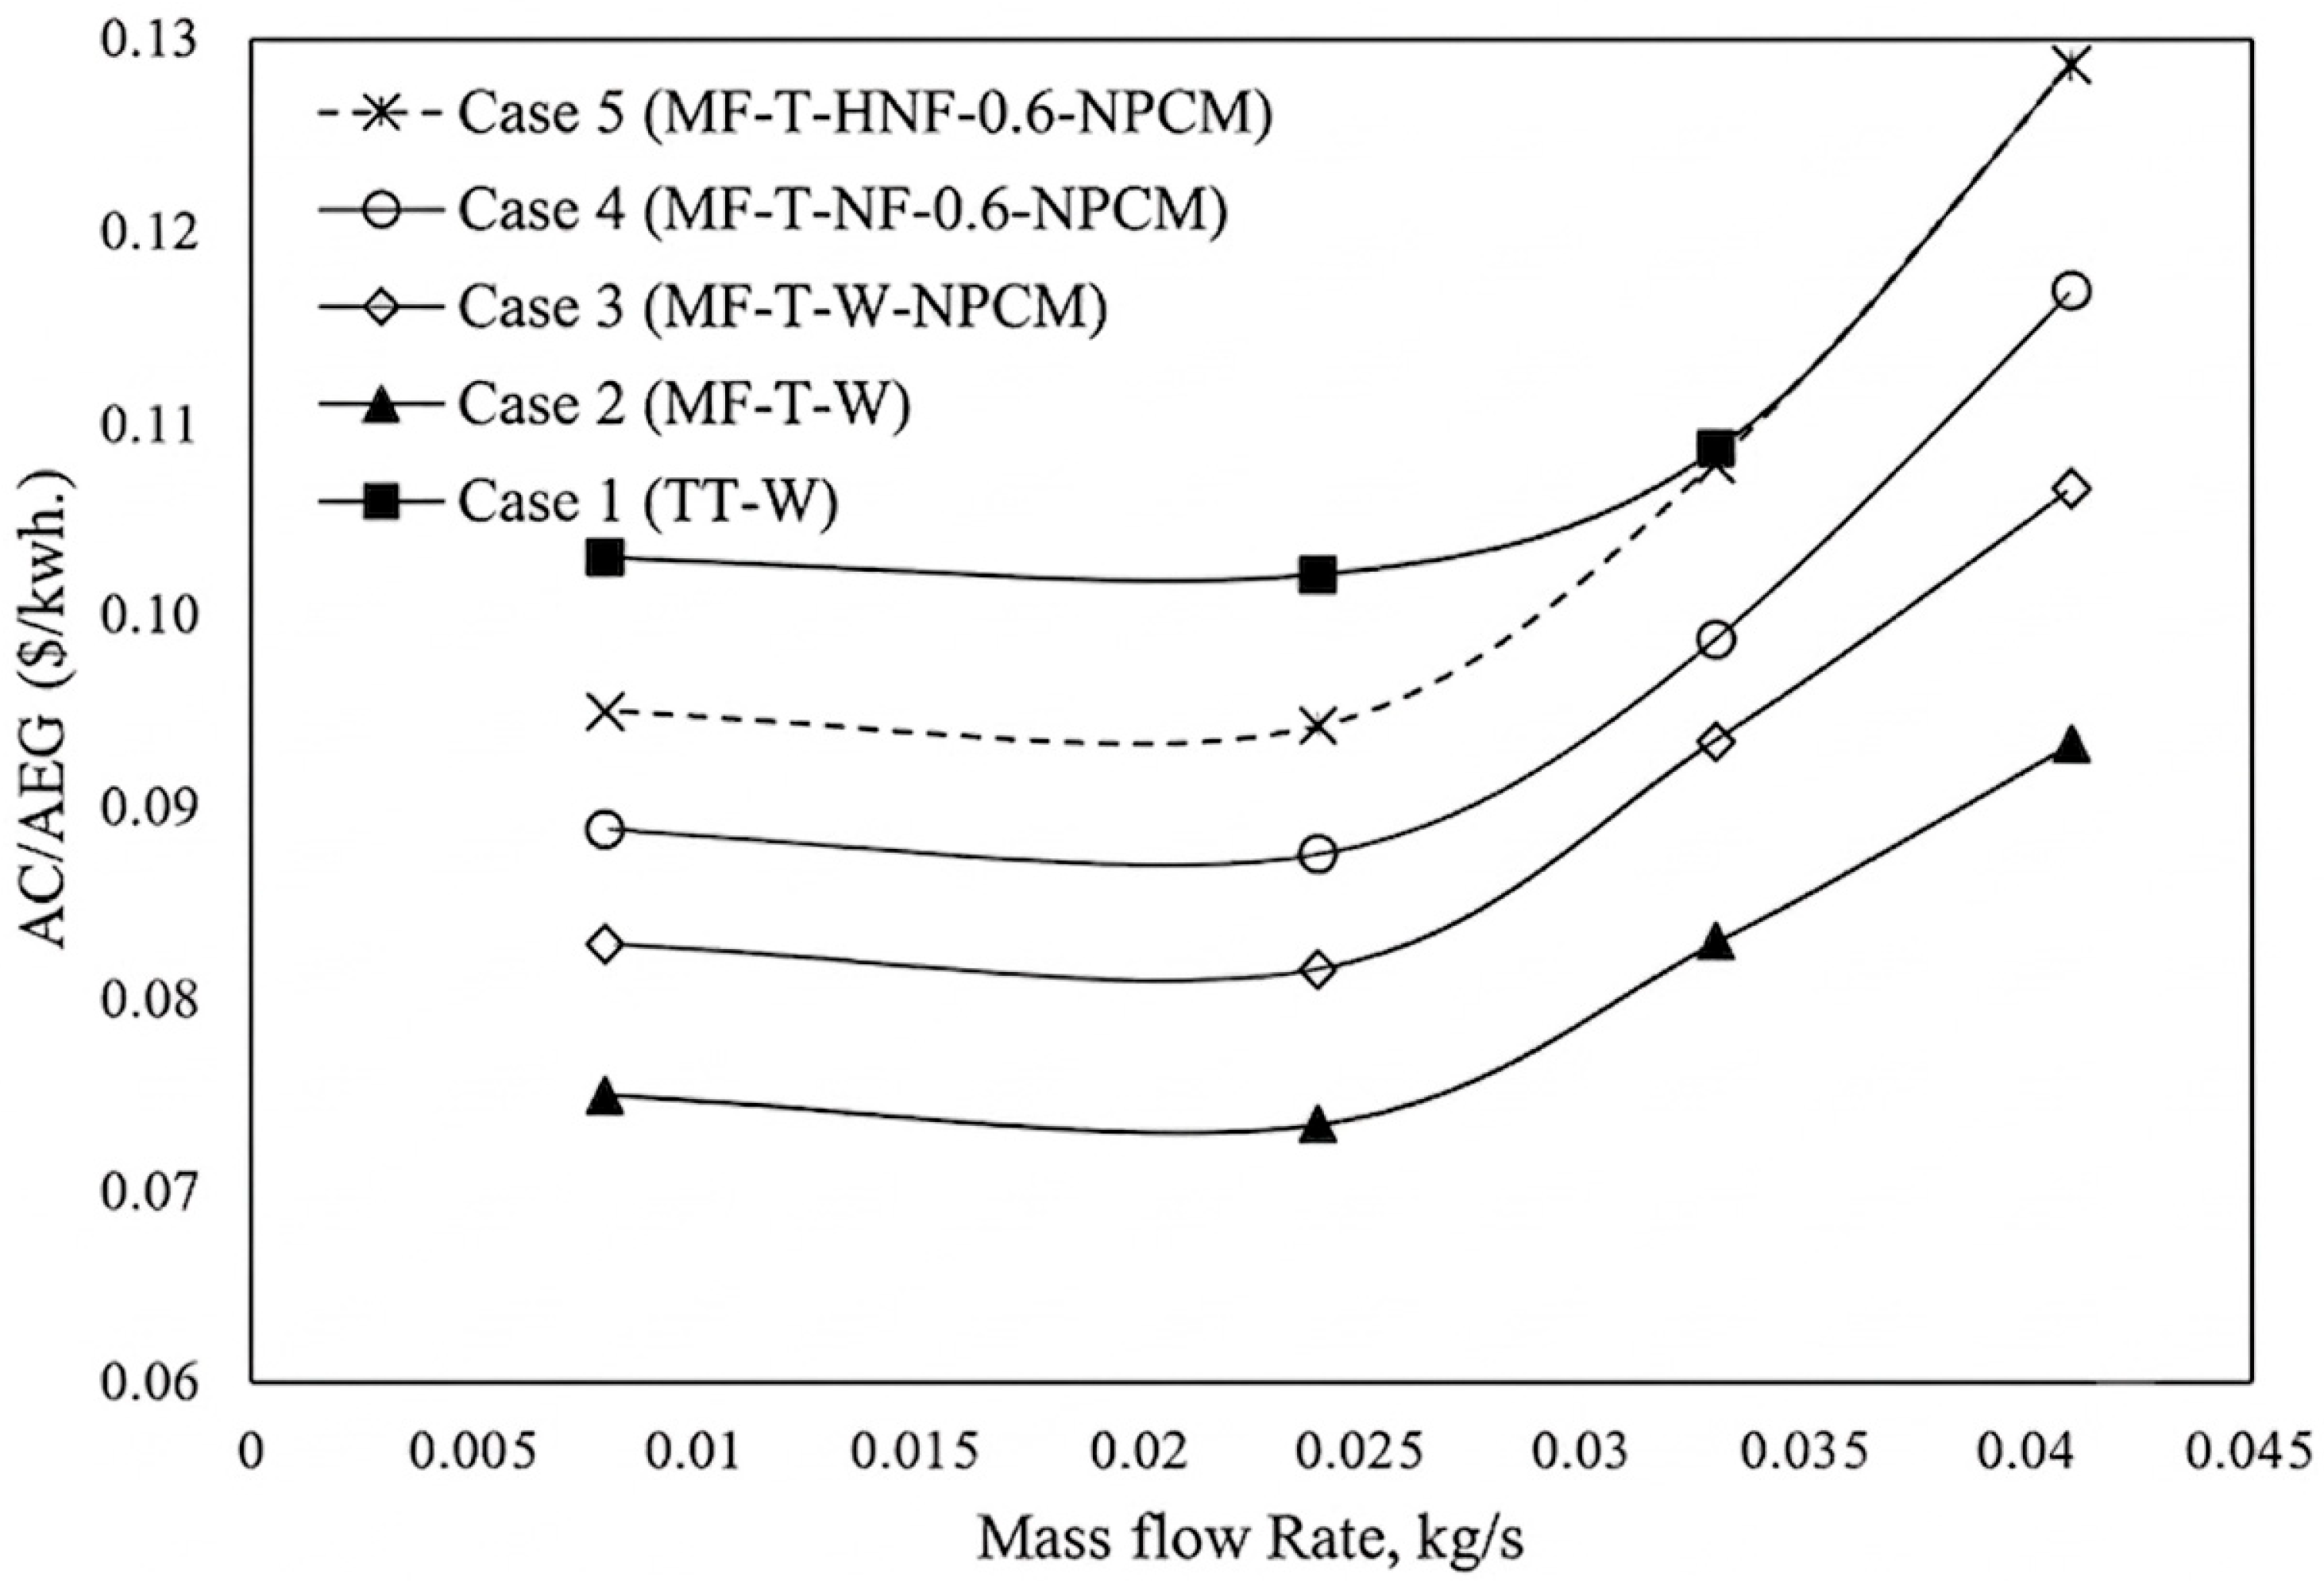
Unit energy cost of the tested PVT configurations at different mass flow rates.
Figure 8.
Initial component cost distribution for the tested PVT collector configurations.
Figure 9.
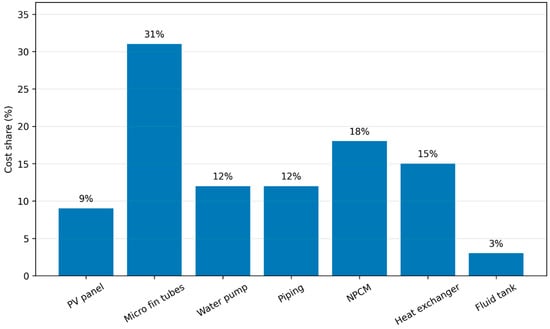
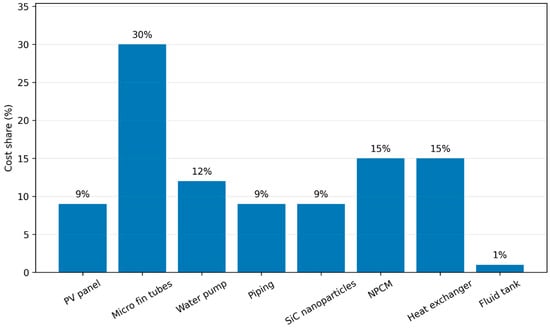
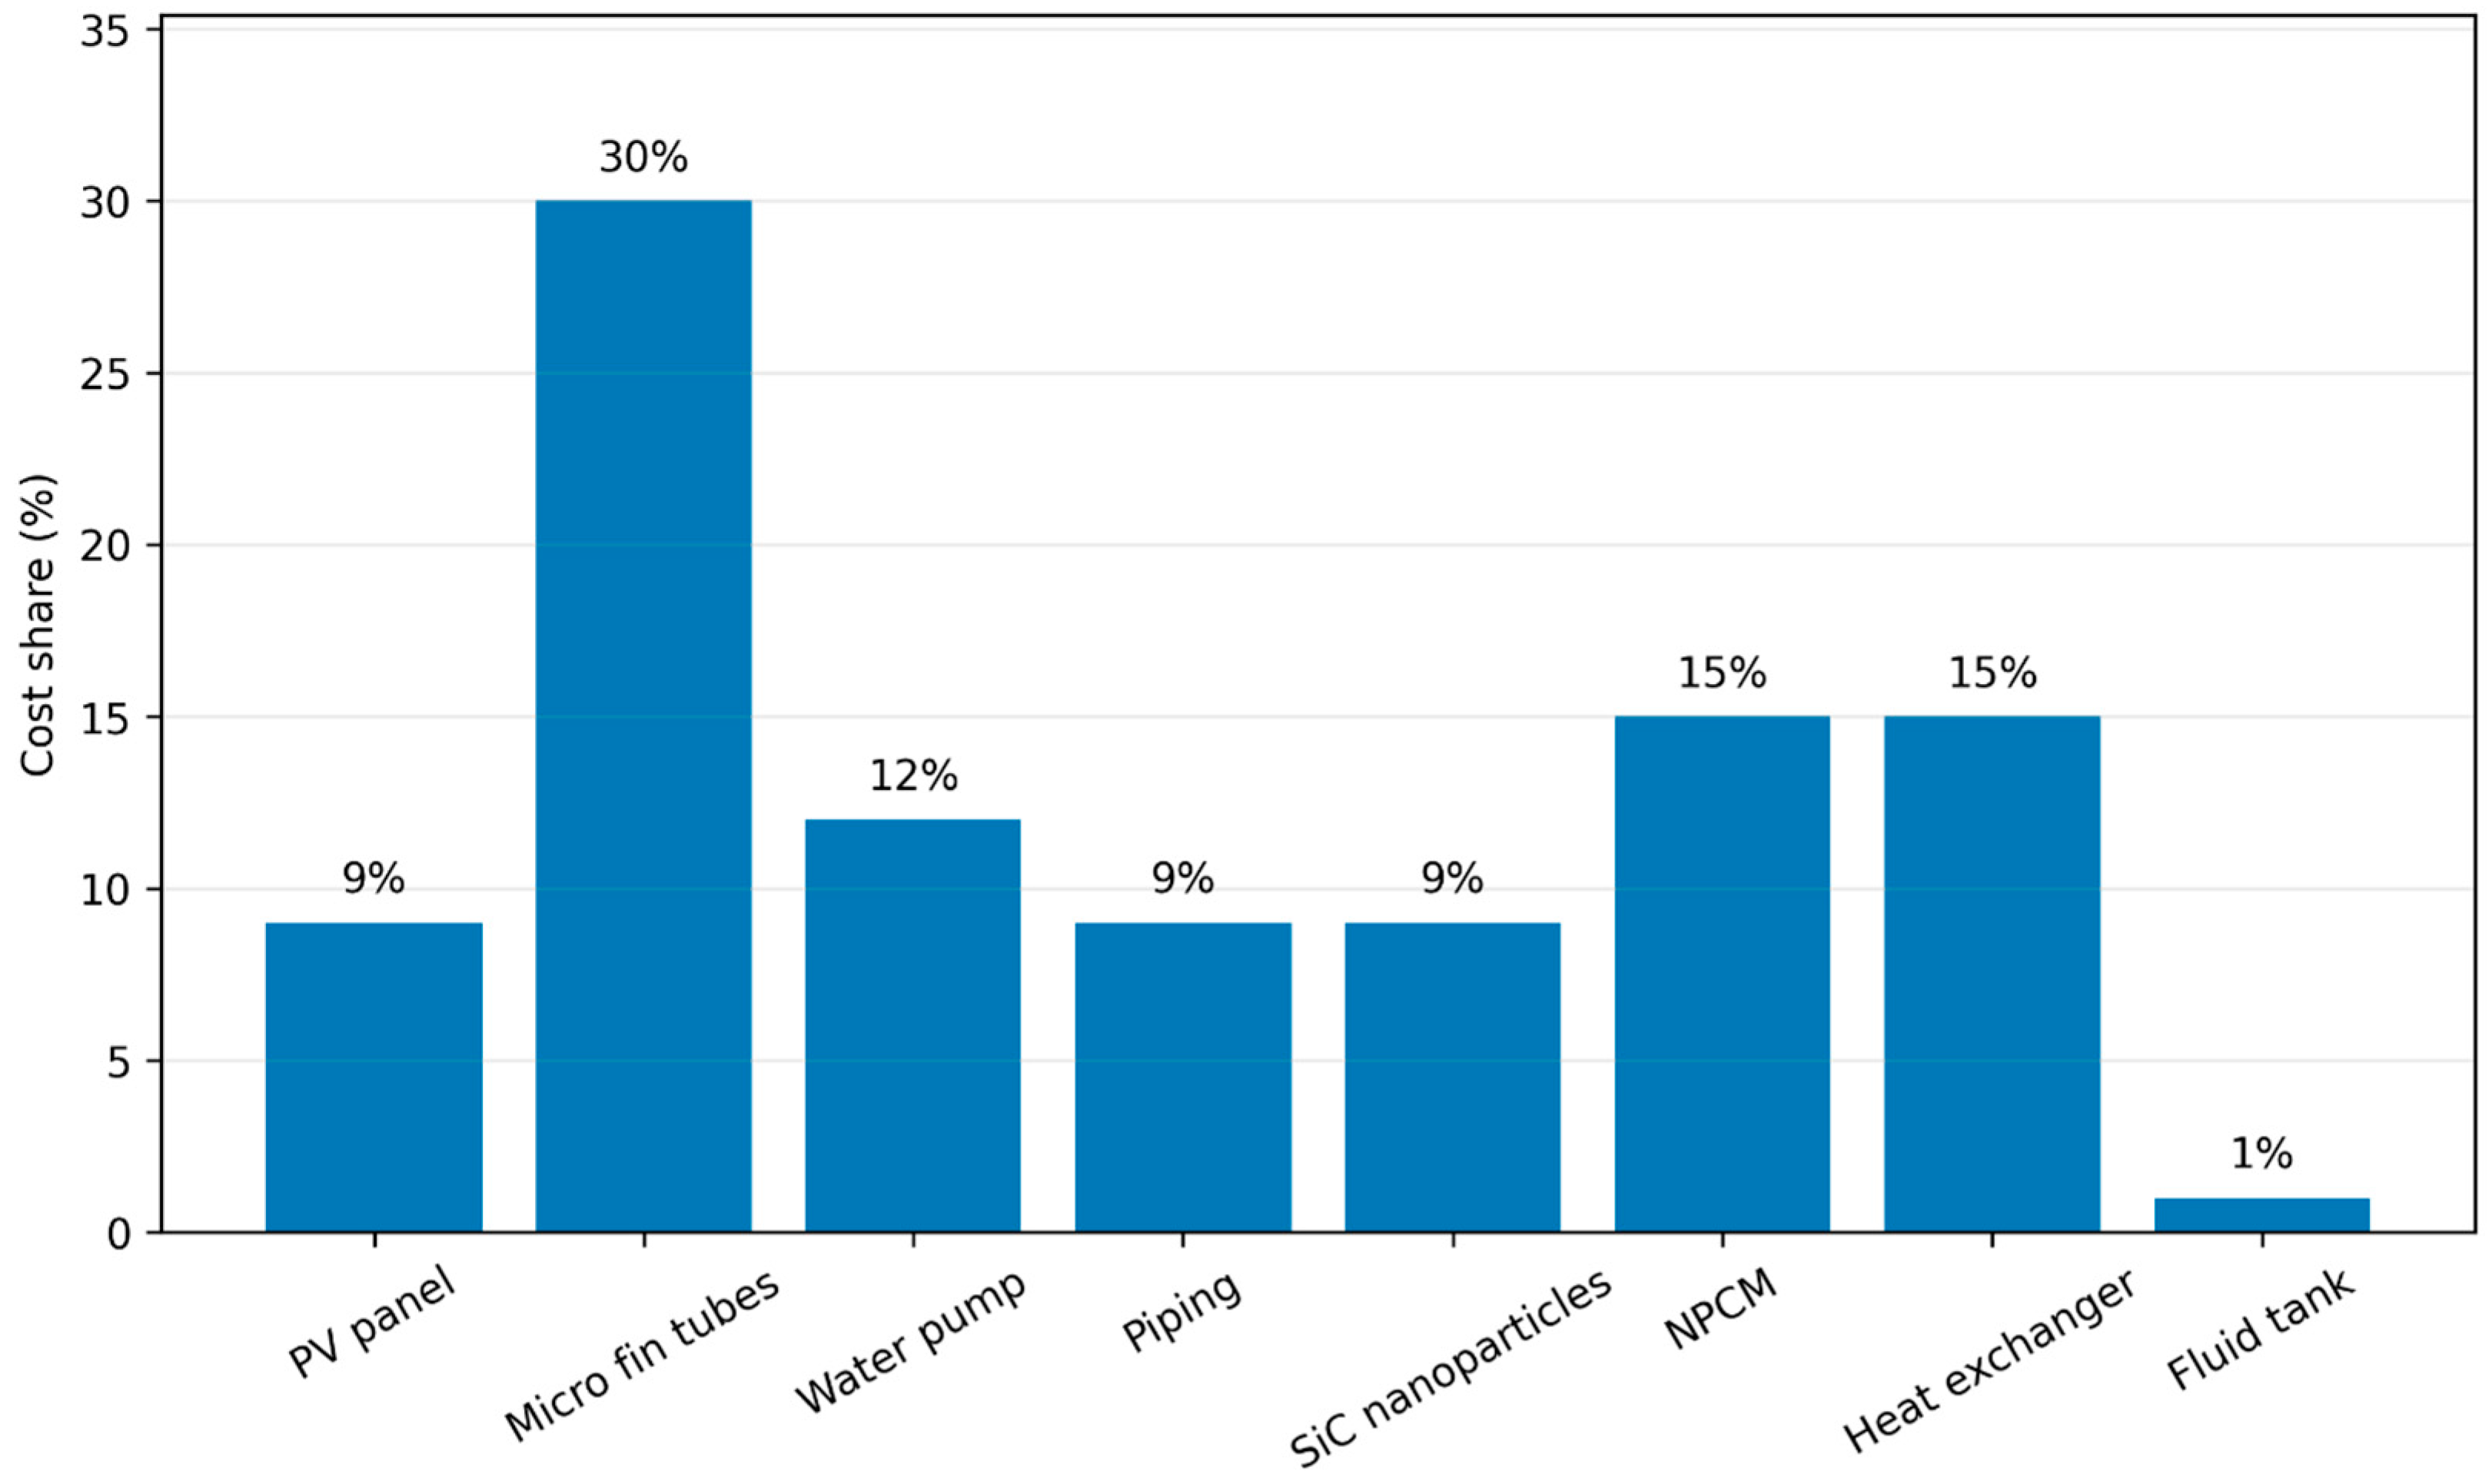
Initial cost share of the main components in the Case 5 PVT collector configuration.
As shown in Figure 8 and Figure 9, the advanced thermal components represent a substantial share of the total initial investment. For Case 5, the micro-finned tubes account for approximately 30% of the total cost, while the NPCM and SiC nanoparticles together account for approximately 24%. Therefore, these components represent about 54% of the initial capital investment of the prototype.
Although Case 2 (MF-T-W) achieved the lowest estimated unit energy cost of USD 0.073/kWh, this configuration does not include NPCM and therefore does not provide the same thermal-storage capability as the advanced configurations. In contrast, Case 5 provides higher thermal and exergy performance, together with improved thermal-storage stability due to the integration of NPCM.
For Case 5, operation at a mass flow rate of 0.024 kg/s provides a favorable compromise between performance and cost. Under this condition, the unit energy cost is reduced to USD 0.094/kWh while maintaining the benefits of the hybrid nanofluid and NPCM. This indicates that the best economic operating condition is not necessarily the same as the condition that gives the maximum thermal or exergy efficiency.
Overall, the techno-economic results show that the proposed advanced configuration can be economically competitive if the additional capital cost is offset by improved useful energy production and stable thermal performance. However, long-term outdoor testing and durability assessment would be needed to confirm its practical economic feasibility.
8. Conclusions
This study experimentally evaluated the energy, exergy, and economic performance of an enhanced photovoltaic/thermal solar collector using micro-finned tubes, twisted-tape inserts, hybrid nanofluid, and nano-enhanced phase-change material. Five PVT collector configurations were tested and compared under controlled indoor solar-simulator conditions and different mass flow rates. The main conclusions are summarized as follows:
- The best thermal performance was obtained for Case 5 (MF-T-HNF-0.6-NPCM), which combined micro-finned tubes, twisted-tape inserts, SiC-based NPCM, and SiC–Al2O3/water hybrid nanofluid. This configuration achieved a maximum thermal efficiency of 87.5% and a useful thermal output of 189 W at a mass flow rate of 0.033 kg/s.
- Compared with the baseline configuration, Case 1, the maximum thermal efficiency improvement of Case 5 was approximately 71.8%. This improvement was mainly attributed to the increased heat-transfer area, enhanced fluid mixing, and improved thermal properties of the hybrid cooling medium.
- The active cooling of the PV rear surface improved the electrical performance of the system. The highest electrical power output reached 23.5 W for the advanced hybrid configuration.
- The highest overall exergy efficiency was also obtained for Case 5. At a mass flow rate of 0.033 kg/s, the maximum exergy efficiency reached 12.85%, corresponding to an improvement of approximately 117.8% compared with Case 1.
- At mass flow rates above 0.033 kg/s, the exergy efficiency tended to stabilize or decrease slightly. This behavior can be attributed to the reduction in outlet-fluid temperature and the possible increase in flow-related losses at higher mass flow rates.
- From the economic analysis, Case 2 (MF-T-W) achieved the lowest estimated unit energy cost of USD 0.073/kWh. However, this configuration did not include NPCM and therefore did not provide the same thermal-storage capability as the advanced configurations.
- For Case 5, the micro-finned tubes represented approximately 30% of the total initial cost, while the NPCM and SiC nanoparticles together represented approximately 24%. These components therefore accounted for about 54% of the initial capital investment of the prototype.
- Operating Case 5 at a mass flow rate of 0.024 kg/s provided a favorable balance between performance and cost, giving an estimated unit energy cost of USD 0.094/kWh while maintaining the benefits of hybrid nanofluid cooling and NPCM-based thermal storage.
- It is worth noting that the increase in viscosity of the nanofluid is inversely proportional to the decrease in pressure, and due to the low mass flow rate, the additional energy required is estimated at fractions of a watt, which means that it is very inexpensive compared to the increase in thermal energy, making it inconsequential to the efficiency of thermal energy and available energy.
Overall, the results indicate that combining micro-finned tubes, twisted-tape inserts, hybrid nanofluid, and NPCM can improve the thermal, electrical, and exergy performance of PVT collectors. Further outdoor testing, long-term stability assessment, and uncertainty reporting for each calculated performance parameter are recommended to confirm the practical applicability of the proposed configuration.
Author Contributions
Conceptualization, M.M.A.S.; methodology, M.M.A.S.; data curation, M.M.A.S.; visualization, M.M.A.S.; formal analysis, A.A.; writing—original draft preparation, M.M.A.S.; writing—review and editing, A.A.; project administration, A.A. All authors have read and agreed to the published version of the manuscript.
Funding
The authors received no specific funding for this work.
Institutional Review Board Statement
This article does not contain any studies involving human participants or animals performed by any of the authors.
Data Availability Statement
Data are contained within the article.
Conflicts of Interest
The authors declare no conflicts of interest.
Nomenclature
| Symbol | Description | Unit |
| Acoll | Collector area | m2 |
| APV | Photovoltaic panel area | m2 |
| AC | Total annual cost | USD/year |
| ACC | Annualized collector cost | USD/year |
| AEG | Annual useful energy gain | kWh/year |
| ARC | Annual running cost of the pump | USD/year |
| ASV | Annual salvage value | USD/year |
| CE | Electricity price | USD/kWh |
| CI | Total capital investment | USD |
| cp | Specific heat capacity of the working fluid | J/kgK |
| Di | Inner diameter of the tube | mm |
| e | Fin height | mm |
| Exdest | Exergy destruction rate | W |
| Exe | Electrical exergy output | W |
| Exin | Solar exergy input | W |
| Exout | Total exergy output | W |
| Exth | Useful thermal exergy output | W |
| G | Solar irradiance | W/m2 |
| i | Annual interest rate | % |
| MC | Annual maintenance cost | USD/year |
| Mass flow rate of the working fluid | kg/s | |
| n | System lifetime/service life | years |
| P | Fin pitch | mm |
| Pmax | Maximum electrical power output | W |
| Qu | Useful thermal gain | W |
| R | Calculated dependent variable in uncertainty analysis | — |
| SFF | Sinking fund factor | — |
| SV | Salvage value | USD |
| T | Absolute temperature | K |
| Ta | Ambient temperature | K |
| Ti | Inlet fluid temperature | K or °C |
| To | Outlet fluid temperature | K or °C |
| Tfo | Outlet fluid temperature used in exergy analysis | K |
| Ts | Apparent sun temperature | K |
| top | Annual operating time of the pump | h/year |
| UC | Unit energy cost | USD/kWh |
| Wpump | Pump power consumption | kW |
| x1, x2, …, xn | Independent measured variables in uncertainty analysis | — |
| w/y | Twist ratio of twisted-tape insert | — |
| Greek Symbol | ||
| Symbol | Description | Unit |
| α | Fin helix angle | degree |
| ηe | Electrical efficiency | % |
| ηex | Exergy efficiency | % |
| ηth | Thermal efficiency | % |
| M | Dynamic viscosity | Pa·s |
| ρ | Density | kg/m3 |
| ωR | Total uncertainty of calculated variable R | % or same unit as R |
| ω1, ω2, …, ωn | Uncertainties of independent measured variables | % or relevant unit |
| Abbreviation | ||
| Abbreviation | Meaning | |
| Al2O3 | Aluminum oxide | |
| CRF | Capital recovery factor | |
| HNF | Hybrid nanofluid | |
| I–V | Current–voltage | |
| MF | Micro-finned tube | |
| NF | Nanofluid | |
| NPCM | Nano-enhanced phase-change material | |
| PCM | Phase-change material | |
| PV | Photovoltaic | |
| PVT | Photovoltaic/thermal | |
| PVP | Polyvinylpyrrolidone | |
| RTD | Resistance temperature detector | |
| SiC | Silicon carbide | |
| SFF | Sinking fund factor | |
| TT | Twisted tape | |
| UC | Unit energy cost | |
References
- Wongwuttanasatian, T.; Sarikarin, T.; Suksri, A. Performance Enhancement of a Photovoltaic Module by Passive Cooling Using Phase Change Material in a Finned Container Heat Sink. Sol. Energy 2020, 195, 47–53. [Google Scholar] [CrossRef] [Scilit]
- Xu, Y.; Li, M.-J.; Zheng, Z.-J.; Xue, X.-D. Melting Performance Enhancement of Phase Change Material by a Limited Amount of Metal Foam: Configurational Optimization and Economic Assessment. Appl. Energy 2018, 212, 868–880. [Google Scholar] [CrossRef] [Scilit]
- Sardarabadi, M.; Hosseinzadeh, M.; Kazemian, A.; Passandideh-Fard, M. Experimental Investigation of the Effects of Using Metal-Oxides/Water Nanofluids on a Photovoltaic Thermal System (PVT) from Energy and Exergy Viewpoints. Energy 2017, 138, 682–695. [Google Scholar] [CrossRef] [Scilit]
- Aberoumand, S.; Ghamari, S.; Shabani, B. Energy and Exergy Analysis of a Photovoltaic Thermal (PV/T) System Using Nanofluids: An Experimental Study. Sol. Energy 2018, 165, 167–177. [Google Scholar] [CrossRef] [Scilit]
- Yousef, M.S.; Sharaf, M.; Huzayyin, A.S. Energy, Exergy, Economic, and Enviroeconomic Assessment of a Photovoltaic Module Incorporated with a Paraffin-Metal Foam Composite: An Experimental Study. Energy 2022, 238, 121807. [Google Scholar] [CrossRef] [Scilit]
- Shahsavar, A.; Jha, P.; Arıcı, M.; Estellé, P. Experimental Investigation of the Usability of the Rifled Serpentine Tube to Improve Energy and Exergy Performances of a Nanofluid-Based Photovoltaic/Thermal System. Renew. Energy 2021, 170, 410–425. [Google Scholar] [CrossRef] [Scilit]
- Shahsavar, A.; Alwaeli, A.H.A.; Azimi, N.; Rostami, S.; Sopian, K.; Arıcı, M.; Estellé, P.; Nižetić, S.; Kasaeian, A.; Ali, H.M.; et al. Exergy Studies in Water-Based and Nanofluid-Based Photovoltaic/Thermal Collectors: Status and Prospects. Renew. Sustain. Energy Rev. 2022, 168, 112740. [Google Scholar] [CrossRef] [Scilit]
- Jasim, O.M.J.; Selimli, S.; Dumrul, H.; Yilmaz, S. Closed-Loop Aluminium Oxide Nanofluid Cooled Photovoltaic Thermal Collector Energy and Exergy Analysis, an Experimental Study. J. Energy Storage 2022, 50, 104654. [Google Scholar] [CrossRef] [Scilit]
- Senthilraja, S.; Gangadevi, R.; Köten, H.; Marimuthu, R.; Awad, M.M. Performance Analysis of a Novel Hydrogen Production System Incorporated with Hybrid Solar Collector and Phase Change Material. Int. J. Hydrogen Energy 2022, 47, 26223–26237. [Google Scholar] [CrossRef] [Scilit]
- Hedayati-Mehdiabadi, E.; Sarhaddi, F.; Sobhnamayan, F. Exergy Performance Evaluation of a Basin-Type Double-Slope Solar Still Equipped with Phase-Change Material and PV/T Collector. Renew. Energy 2020, 145, 2409–2425. [Google Scholar] [CrossRef] [Scilit]
- Yu, Q.; Romagnoli, A.; Yang, R.; Xie, D.; Liu, C.; Ding, Y.; Li, Y. Numerical Study on Energy and Exergy Performances of a Microencapsulated Phase Change Material Slurry Based Photovoltaic/Thermal Module. Energy Convers. Manag. 2019, 183, 708–720. [Google Scholar] [CrossRef] [Scilit]
- Hossain, M.S.; Pandey, A.K.; Selvaraj, J.; Rahim, N.A.; Islam, M.M.; Tyagi, V.V. Two Side Serpentine Flow Based Photovoltaic-Thermal-Phase Change Materials (PVT-PCM) System: Energy, Exergy and Economic Analysis. Renew. Energy 2019, 136, 1320–1336. [Google Scholar] [CrossRef] [Scilit]
- Hosseinzadeh, M.; Sardarabadi, M.; Passandideh-Fard, M. Energy and Exergy Analysis of Nanofluid Based Photovoltaic Thermal System Integrated with Phase Change Material. Energy 2018, 147, 636–647. [Google Scholar] [CrossRef] [Scilit]
- Alqatamin, A.; Su, J. Computational Analysis of Photovoltaic Thermal Performance Using Al2O3/Water and CNT/Water Nanofluids with Perforated V-Shape Heatsink. Energy 2025, 334, 137793. [Google Scholar] [CrossRef] [Scilit]
- Mushabbab, A.; Alhamayani, A.; Chiasson, A. Experimental and Numerical Enhancement of Photovoltaic/Thermal Nanofluid Performance Using Pulsating Flow. Appl. Therm. Eng. 2026, 300, 131491. [Google Scholar] [CrossRef] [Scilit]
- Jurčević, M.; Nižetić, S.; Čoko, D.; Arıcı, M.; Hoang, A.T.; Giama, E.; Papadopoulos, A. Techno-Economic and Environmental Evaluation of Photovoltaic-Thermal Collector Design with Pork Fat as Phase Change Material. Energy 2022, 254, 124284. [Google Scholar] [CrossRef] [Scilit]
- Abbasi Kamazani, M.; Aghanajafi, C. Multi-Objective Optimization and Exergoeconomic Evaluation of a Hybrid Geothermal-PVT System Integrated with PCM. Energy 2022, 240, 122806. [Google Scholar] [CrossRef] [Scilit]
- Grubišić Čabo, F.; Nižetić, S.; Giama, E.; Papadopoulos, A. Techno-Economic and Environmental Evaluation of Passive Cooled Photovoltaic Systems in Mediterranean Climate Conditions. Appl. Therm. Eng. 2020, 169, 114947. [Google Scholar] [CrossRef] [Scilit]
- Saeed, M.M.A.; Hameed, H.G.; Diabil, H.A.N. Experimental Investigation on Thermal Performance of Solar Air Heater Using Nano-PCM. J. Adv. Res. Fluid Mech. Therm. Sci. 2024, 117, 83–97. [Google Scholar] [CrossRef] [Scilit]
- Kline, S.J.; McClintock, F.A. Describing Uncertainties in Single-Sample Experiments. Mech. Eng. 1953, 75, 385–387. [Google Scholar]
- Abdulsahib, M.B.; Sopian, K.; Bin Ibrahim, A. Photovoltaic Thermal (PVT) with Advanced Tube Design and Working Fluid—A Review. Int. J. Renew. Energy Res. 2021, 11, 600–617. [Google Scholar] [CrossRef] [Scilit]
- Ibrahim, A.; Fudholi, A.; Sopian, K.; Othman, M.Y.; Ruslan, M.H. Efficiencies and Improvement Potential of Building Integrated Photovoltaic Thermal (BIPVT) System. Energy Convers. Manag. 2014, 77, 527–534. [Google Scholar] [CrossRef] [Scilit]
- Kallio, S.; Siroux, M. Energy Analysis and Exergy Optimization of Photovoltaic-Thermal Collector. Energies 2020, 13, 5106. [Google Scholar] [CrossRef] [Scilit]
- Saleh, I.R.; Rafiei, B.; Gharali, K.; Sajadi, B. Economic Feasibility of Solar and Wind Energy Harvesting in Karbala, Iraq. Ain Shams Eng. J. 2026, 17, 103946. [Google Scholar] [CrossRef] [Scilit]

Disclaimer/Publisher’s Note: The statements, opinions and data contained in all publications are solely those of the individual author(s) and contributor(s) and not of MDPI and/or the editor(s). MDPI and/or the editor(s) disclaim responsibility for any injury to people or property resulting from any ideas, methods, instructions or products referred to in the content. |
© 2026 by the authors. Licensee MDPI, Basel, Switzerland. This article is an open access article distributed under the terms and conditions of the Creative Commons Attribution (CC BY) license.