


Abstract
The rapid expansion of solar photovoltaics has intensified land-use competition between renewable energy and agriculture, particularly in regions where food security and clean-energy transitions must progress together. Semi-transparent photovoltaic technologies may provide a land-use-compatible pathway for potential agrivoltaic applications by allowing partial light transmission while generating electricity. This study evaluates Dye-Sensitized Solar Cells (DSSCs) as a semi-transparent photovoltaic option and investigates the use of DSSC-generated electricity to power Direct Air Capture (DAC). The scope is limited to photovoltaic-system performance and economics and does not include Photosynthetically Active Radiation (PAR) transmission, crop growth, crop yield, or microclimate analysis. A techno-economic assessment was performed using the System Advisor Model for two contrasting regions, Karachi, Pakistan, and Davis, USA. DSSC and monocrystalline silicon systems were compared over the same land area. Due to their lower installed capacity, the DSSC systems generated less annual electricity. However, their lower assumed capital expenditure resulted in a Levelised Cost of Electricity (LCOE) that was 10% lower in Davis, at US Dollars (USD) 0.29/kWh, and 0.7% lower in Karachi, at USD 0.25/kWh. Based on literature-reported DAC energy requirements, the DSSC systems could support annual Carbon Dioxide (CO2) removal of 331–9707 tonnes in Karachi and 334–9783 tonnes in Davis, depending on the selected DAC pathway. These results indicate that semi-transparent DSSCs may provide a lower-capital, land-use-compatible photovoltaic pathway combined with renewable-electricity-driven carbon removal. Their suitability for practical agrivoltaic deployment requires future PAR-transmission measurements and crop-specific experimental validation.
1. Introduction
The global climate crisis is escalating, with rising temperatures, extreme weather patterns, and environmental degradation posing significant risks to ecosystems and human livelihoods [1,2]. A primary driver of climate change is the increasing concentration of carbon dioxide (CO2) in the atmosphere, largely resulting from fossil fuel combustion in the energy sector. In response, nations worldwide are transitioning toward renewable energy sources to mitigate greenhouse gas emissions and reduce dependency on non-renewable resources [3,4]. Among various renewable energy technologies, solar photovoltaics (PVs) have emerged as a key solution due to their scalability, abundant solar resource availability, and technological advancements [5,6,7]. However, large-scale deployment of PV farms faces a critical challenge: land-use competition, particularly in regions where agricultural productivity is vital for food security [8,9,10].
Renewable energy transitions are no longer only technical challenges; they are also land-use, food-security, and climate-governance challenges. Large solar projects can support decarbonization, but their expansion must be planned in ways that avoid displacing agricultural activity or intensifying pressure on rural landscapes. This is especially important in regions where agricultural productivity, clean-energy access, and climate adaptation are closely interconnected. Therefore, integrated approaches that combine renewable energy generation, agricultural compatibility, and carbon mitigation are increasingly needed to support climate-smart development pathways.
The increasing footprint of solar energy projects in agricultural areas has sparked concerns regarding the trade-offs between energy generation and food production [11,12]. In conventional solar farms, monocrystalline silicon (Mono-c-Si) PV panels, which are widely deployed due to their high efficiency, are installed on vast tracts of land, often rendering the underlying land unsuitable for cultivation [13]. This competition for land resources presents a significant obstacle to sustainable development, especially in regions where farmland is limited. To overcome this challenge, agrivoltaics—a concept that integrates solar PV systems with agricultural activities—has gained momentum as a promising dual-use land strategy [14,15].
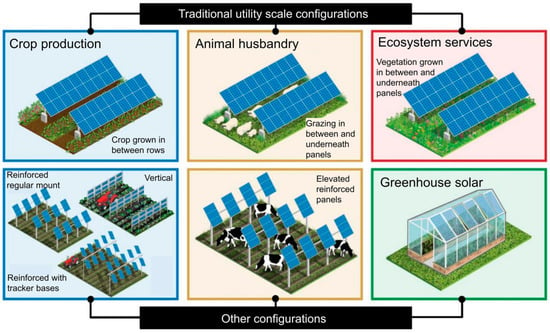
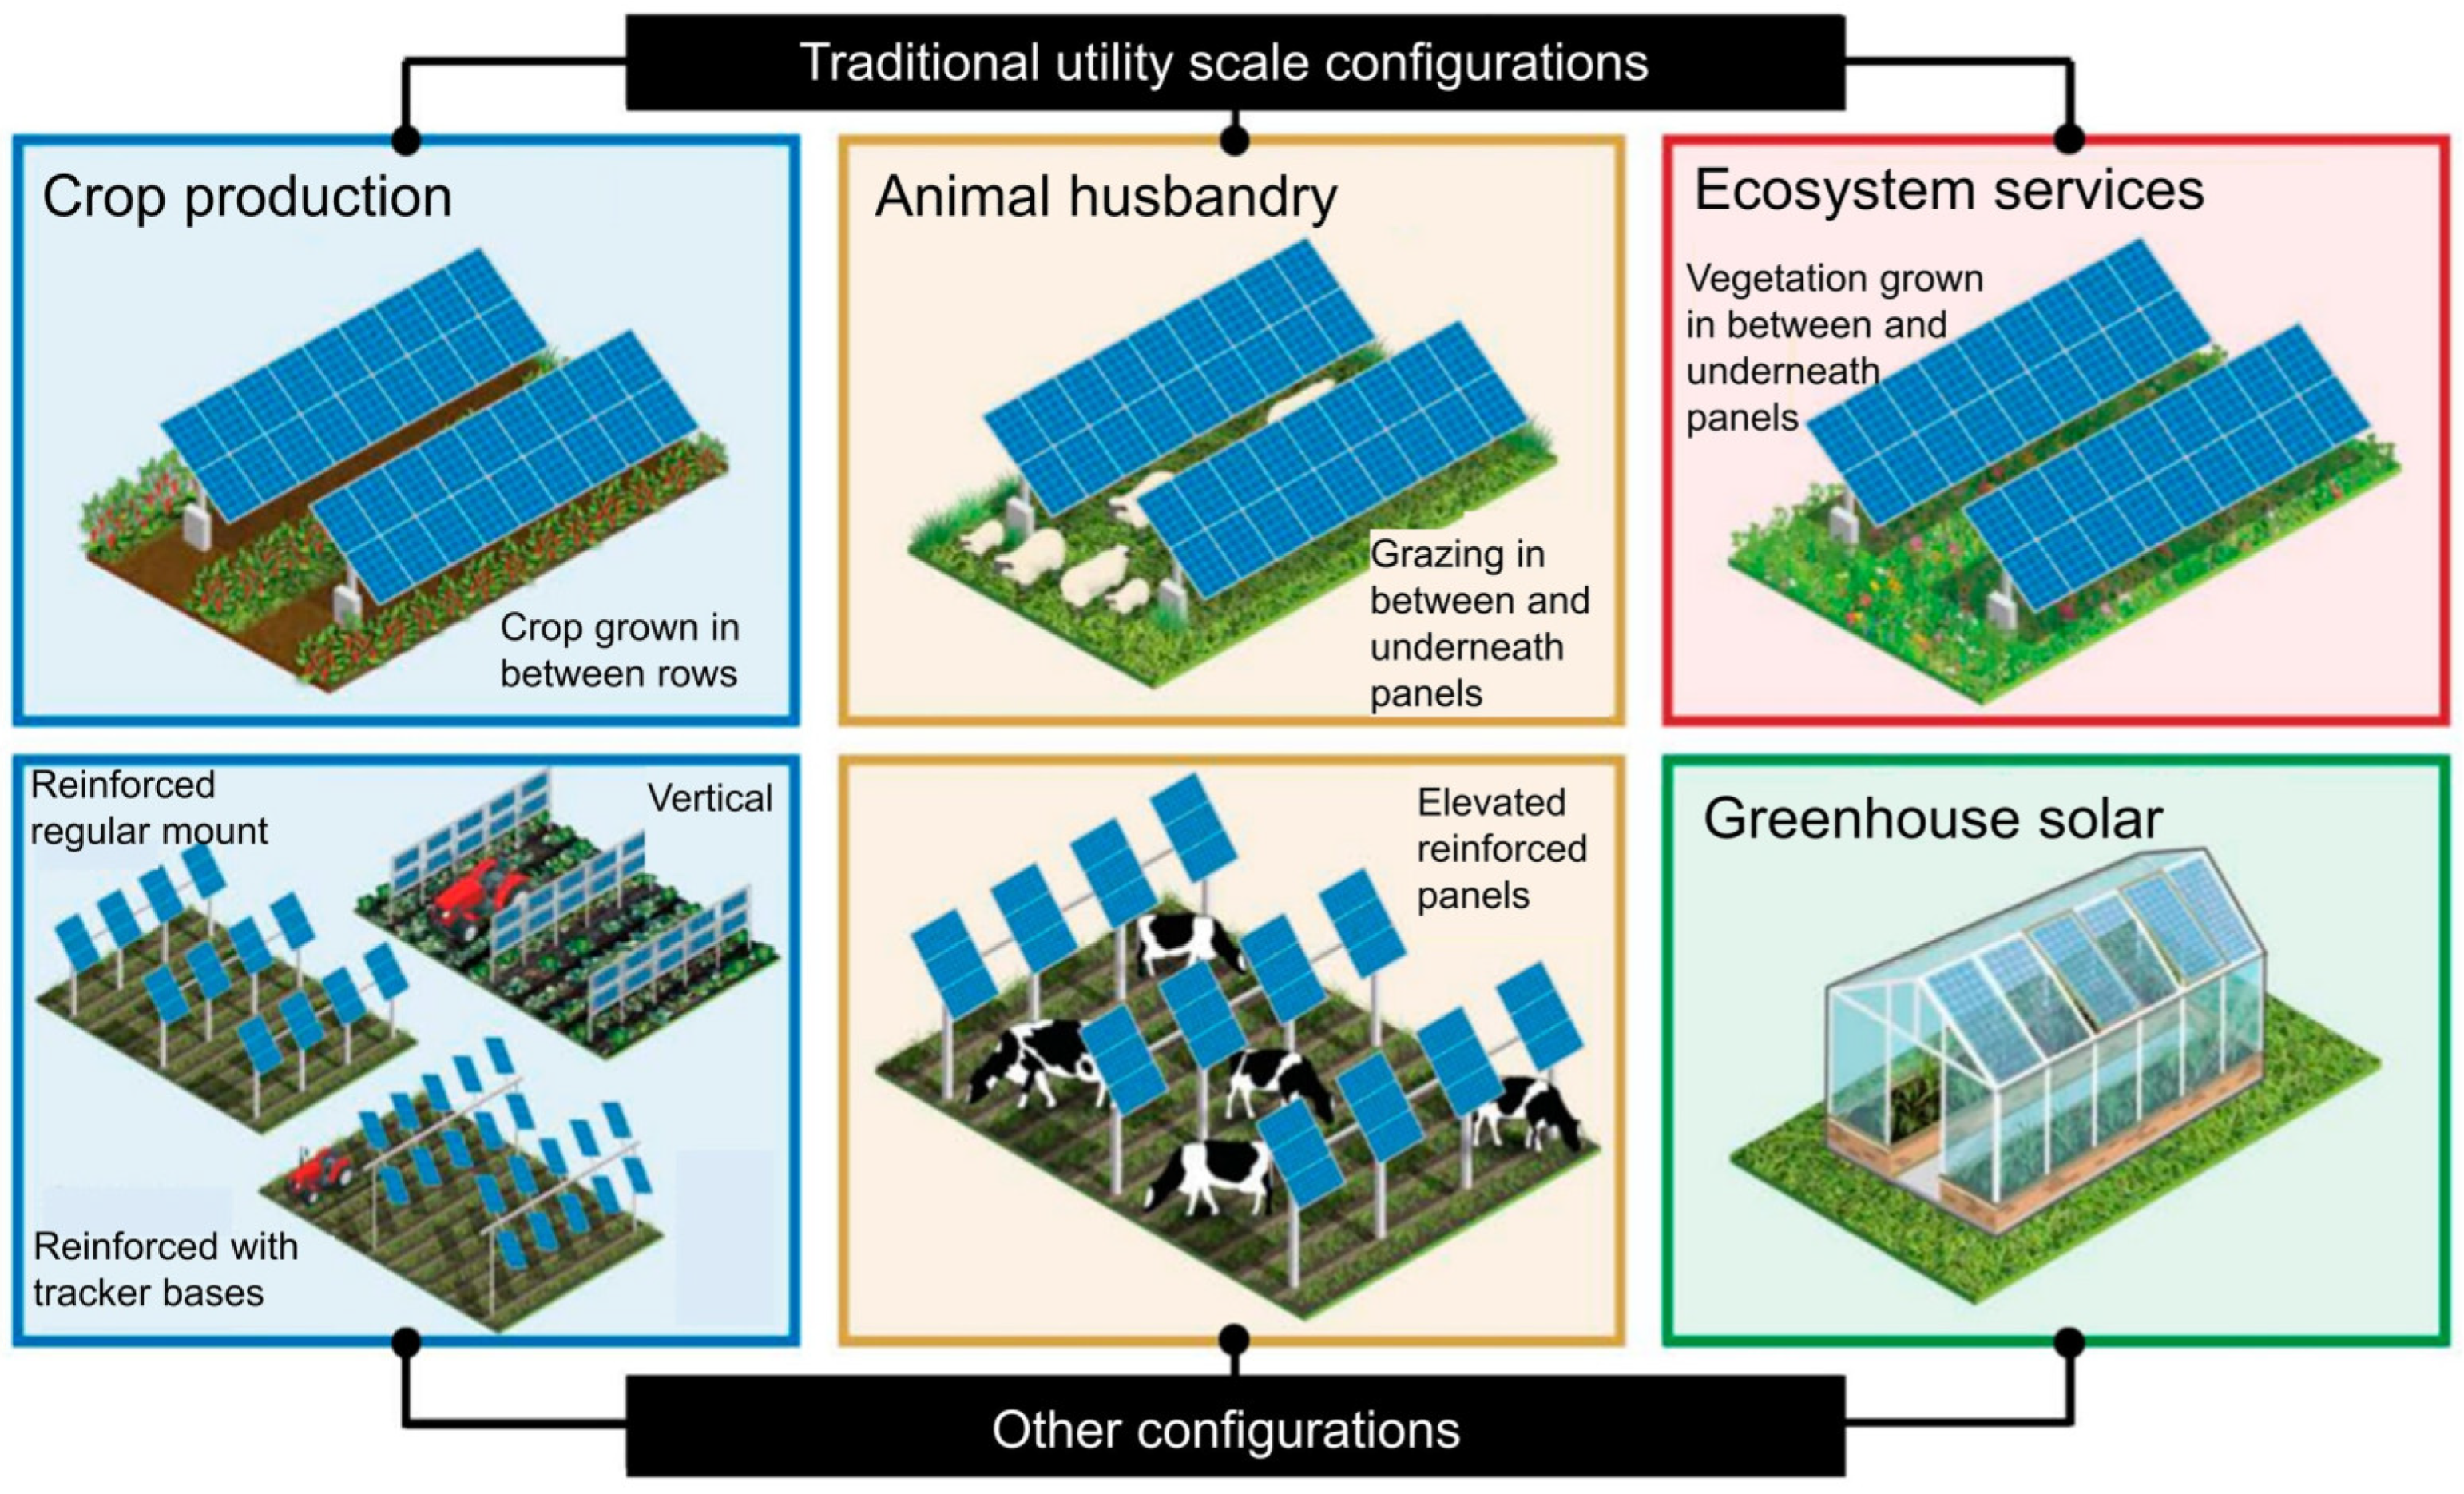
Agrivoltaic systems aim to harmonize renewable energy generation with agricultural productivity by allowing both activities to coexist on the same land [16,17]. Traditionally, opaque PV panels have been installed in configurations such as elevated structures above crop fields, vertical mounting, or spaced arrays to permit partial sunlight penetration [18]. However, these approaches present trade-offs: reducing panel coverage to allow more sunlight for crops lowers overall electricity generation, whereas increasing PV coverage results in crop shading and reduced yields due to a decrease in photosynthetically active radiation (PAR) [19,20]. Studies suggest that maintaining at least 80% of open-sky PAR for crops may require restricting solar panel coverage to approximately 50% of the available land area, significantly impacting the energy output of agrivoltaic systems [21]. The various agrivoltaic configurations aimed at optimizing this balance are illustrated in Figure 1.
Figure 1.
Various synergistic agrivoltaic configurations. Redrawn from [22].
Despite the potential of agrivoltaics to alleviate land-use conflicts, opaque PV panels still impose limitations on light availability for crops. To address this, researchers have explored semi-transparent photovoltaics (STPVs), which selectively filter sunlight, allowing a controlled fraction of light to reach plants while generating electricity [23,24]. The effectiveness of STPVs depends on their ability to transmit wavelengths necessary for photosynthesis while absorbing others to produce energy. Among different STPV technologies, dye-sensitized solar cells (DSSCs) have emerged as a promising alternative due to their low-cost manufacturing, compatibility with flexible substrates, and efficiency under diffuse lighting conditions [25,26].
DSSCs belong to the third generation of photovoltaic technologies and offer optical characteristics that can be modified through the selection of dyes, electrodes, electrolytes, and device architecture. This tunability has encouraged their investigation for greenhouse and potential agrivoltaic applications [27,28,29]. However, the agricultural suitability of a semi-transparent DSSC depends on its wavelength-resolved transmission, photosynthetically active radiation availability, crop species, growth stage, and local environmental conditions. Therefore, semi-transparency alone does not demonstrate an agronomic benefit, and crop compatibility cannot be inferred solely from photovoltaic performance.
Despite these advantages, research on large-scale DSSC applications in agrivoltaics is still in its early stages. While previous studies have investigated prototype-level DSSC performance, a comprehensive assessment of their techno-economic feasibility in real-world agrivoltaic systems remains largely unexplored. Furthermore, the integration of DSSCs with carbon capture technologies has not been extensively studied, presenting an opportunity to enhance the environmental impact of agrivoltaic farms.
While agrivoltaics optimize land use for sustainable energy and agriculture, they do not directly address the global carbon crisis. Given the urgency of climate action, combining agrivoltaic systems with direct air capture (DAC) technologies could significantly contribute to CO2 reduction efforts. DAC systems extract CO2 directly from the atmosphere, enabling a decentralized and scalable approach to carbon sequestration [4,6,30]. However, a major challenge associated with DAC is its high energy requirement, making its implementation economically viable only when powered by renewable energy sources [31,32,33].
Despite extensive research on agrivoltaics, DSSC technology, and DAC, very few studies have explored their synergistic integration into a unified system. Existing research has primarily focused on individual DSSC properties, often in greenhouse environments, rather than assessing their full-scale outdoor agrivoltaic potential [34,35,36]. Moreover, the combination of DSSC-based agrivoltaics with DAC remains unexamined, highlighting a critical research gap.
From a photovoltaic-systems perspective, semi-transparent solar technologies require evaluation beyond cell-level efficiency because their practical value depends on module configuration, installed capacity per land area, annual AC energy yield, temperature sensitivity, inverter selection, system losses, and project-level economics. DSSCs are particularly relevant for agrivoltaics because their spectral selectivity and partial transparency may allow electricity production while maintaining a modified light environment for crops. Therefore, system-level modeling is necessary to determine whether their lower nominal power output can be offset by lower capital cost, land-use compatibility, and additional solar-powered applications such as DAC. Although previous studies have examined the spectral transmission and potential crop-related benefits of semi-transparent photovoltaic technologies, the present study is limited to a photovoltaic-system techno-economic assessment. It does not model wavelength-resolved transmission, photosynthetically active radiation, crop growth, crop yield, or changes in the agricultural microclimate. Consequently, the term “potential agrivoltaic application” is used to describe the possible future use of the evaluated DSSC technology rather than a crop-compatible system demonstrated in the present work. Experimental PAR measurements and crop-specific field studies are required before its agrivoltaic suitability can be confirmed.
The novelty of this study lies in the system-level techno-economic evaluation of semi-transparent DSSCs as a land-use-compatible photovoltaic technology for potential agrivoltaic applications. Unlike studies focused mainly on cell-level DSSC performance or conventional silicon-based photovoltaic layouts, this work evaluates DSSC and mono-c-Si systems over the same land area using SAM-based modeling. The comparison includes annual AC energy generation, capacity factor, energy yield, capital cost, and LCOE under two contrasting solar-climatic conditions. The analysis is further extended by estimating the carbon-removal potential when DSSC-generated electricity is allocated to DAC systems.
This study makes three main contributions. First, it provides a photovoltaic-system techno-economic assessment of semi-transparent DSSCs benchmarked against conventional monocrystalline silicon systems in Karachi, Pakistan, and Davis, USA. Second, it evaluates the potential use of DSSC-generated electricity for different DAC pathways. Third, it establishes a preliminary land-use-compatible photovoltaic and carbon-removal framework that can support future agrivoltaic investigations. Crop compatibility is not demonstrated in this study and must be verified through PAR-transmission measurements, crop-growth experiments, and field-scale testing.
This combined assessment extends the discussion of agrivoltaics beyond energy yield alone and highlights its potential role in addressing land-use competition, clean-energy access, agricultural sustainability, and climate mitigation. The remainder of this paper is structured as follows: Section 2 describes the methodology, including SAM-based photovoltaic modeling and DAC assessment; Section 3 discusses the techno-economic and carbon-removal results; Section 4 presents the broader implications of the study; and Section 5 concludes the paper.
2. Methodology
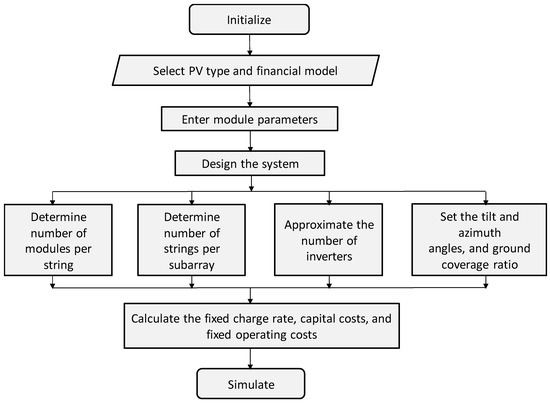
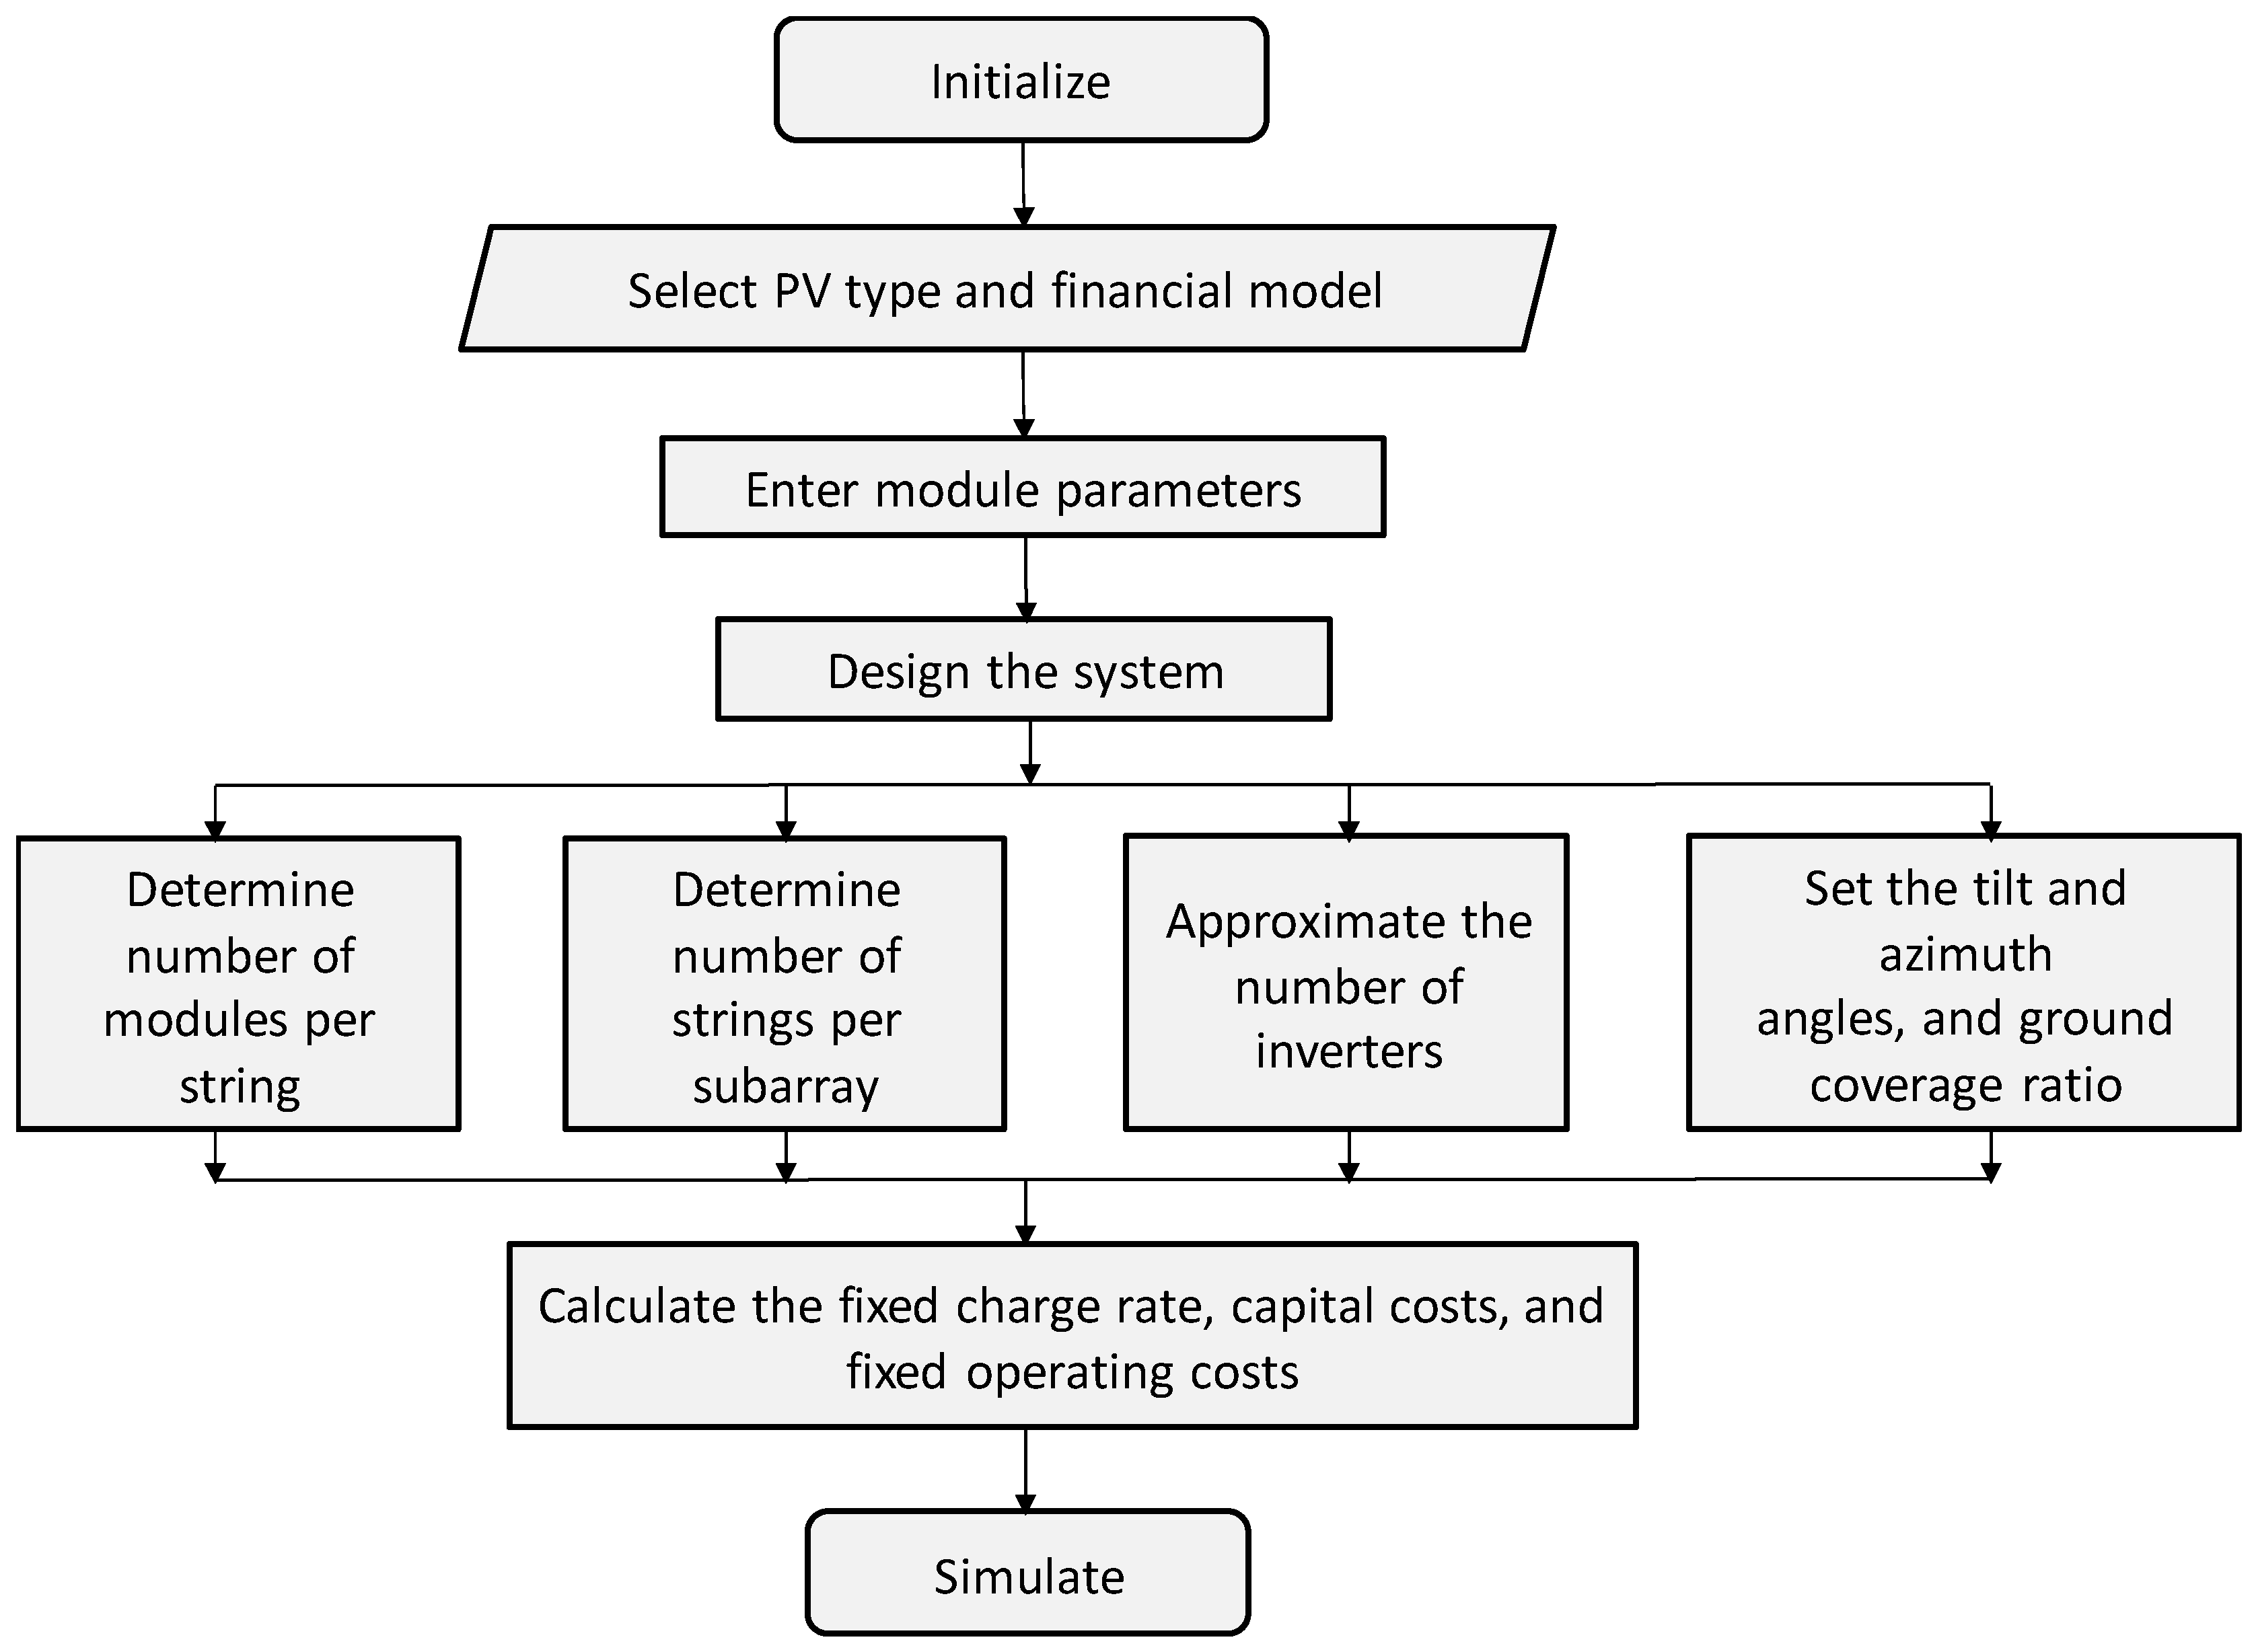
For this study, two locations were selected: (1) Karachi in Southern Sindh, Pakistan, and (2) Davis, CA, USA. Pakistan has an agri-based economy and many parts of the country, especially Sindh, receive a high amount of solar radiance throughout the year, with more than 300 days of sunshine and 1800–2200 kWh/m2 annual global horizontal irradiation [37]. Karachi, a major economic and research hub, has nearby farmland areas like Malir, positioning it as a key player in deploying DSSCs for agrivoltaics. Similarly, Davis, California, is a center for cutting-edge renewable and sustainable agriculture technologies, supported by California’s vast agricultural sector, which produces $59 billion annually and employs over 350,000 people [38]. To determine the feasibility of installing a DSSC module for agrivoltaics, the annual AC generation, among other performance factors, must be compared to those of a conventional opaque solar panel system installed over open farmland. A comprehensive technical and financial model was constructed using the System Advisor Model (SAM), developed by the National Renewable Energy Lab. SAM is widely used for predicting the performance and the economic viability of various renewable energy systems, especially solar PV systems, and comparing different system configurations [39,40,41,42,43,44,45]. A flowchart describing the steps for the System Advisor Model simulation algorithm for a PV system is illustrated in Figure 2.
Figure 2.
System Advisor Model simulation algorithm for techno-economic modeling of a PV system.
The system boundary of the present study includes location-specific photovoltaic performance, system sizing, techno-economic assessment, and annual electricity allocation to the selected DAC pathways. It does not include wavelength-resolved optical transmission, photosynthetically active radiation beneath the modules, crop growth or yield, irrigation requirements, agricultural microclimate, or land-equivalent ratio. Therefore, the agricultural component is treated as a potential future application rather than a quantitatively validated outcome of the present model.
2.1. Solar Cell Parameters
Pakistan has an agri-based economy and many parts of the country, especially Sindh, receive a high amount of solar radiance throughout the year, with more than 300 days.
For the conventional opaque photovoltaic (PV) system, commercially available Trina Solar modules (model TSM-385DE09.05 from Trina Solar, Changzhou, Jiangsu, China), based on monocrystalline silicon (mono-c-Si) technology, were selected. This module class is representative of utility-scale PV installations and has been extensively deployed in operational solar power plants [46], making it a commonly adopted benchmark in PV performance assessment studies [47]. The solar cell parameters were obtained from the module database of the System Advisor Model (SAM), which uses manufacturer datasheet values [48,49]. These parameters are summarized in Table 1.
Table 1.
SAM model input parameters.
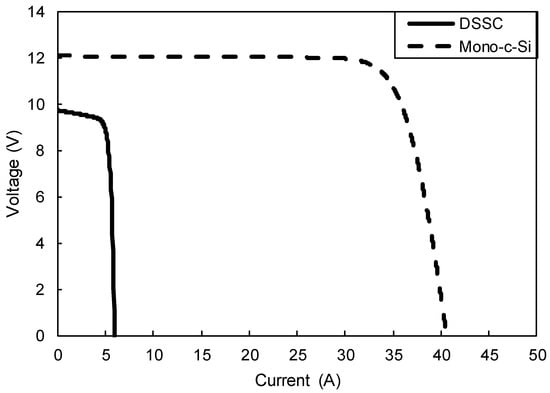
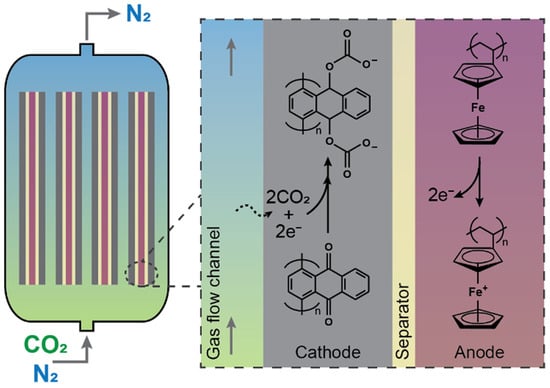
For the DSSC system, electrical reference parameters were obtained from previously reported Diketopyrrolopyrrole (DPP13)-sensitized DSSCs [50]. These cells were selected due to the strong spectral overlap between the DPP13 absorption spectrum and the agrivoltaic spectral window considered in this study [50]. Reported short-circuit and maximum power current density values were converted to cell currents (Isc and Imp) using a single-cell active area of 0.0625 m2 (5 cells, 5 cm by 5 cm each). A module configuration consisting of 8 cells connected in series was assumed, corresponding to a module size of 0.530 m × 0.901 m (Half the size of the mono-c-Si module). Cell-level voltage parameters reported in [50] were used to determine the corresponding module-level voltages, including the open-circuit voltage (Voc) and maximum power point voltage (Vmp). Because temperature coefficients for DPP13-based DSSCs are not reported in the literature, representative values from similar DSSC technologies were adopted from [51]. The complete set of parameters used as inputs to the System Advisor Model (SAM) is summarized in Table 1. The current–voltage curves of the specified mono-c-Si and DSSC modules (for a solar irradiance of 1000 W/m2) are shown in Figure 3.
Figure 3.
Current–voltage curves of DSSC (Diketopyrrolopyrrole (DPP13)-sensitized) [50] and mono-c-Si modules (model TSM-385DE09.05) [44] for a solar irradiance of 1000 W/m2.
The coordinates of Karachi and Davis are 24.86° N, 67.00° E and 38.54° N, 121.74° W. The annual daily horizontal solar radiation for Karachi is 5.96 kWh/m2/day and for Davis is 4.61 kWh/m2/day [52]. The average annual soiling loss of 5%, and total DC power loss of 4.44%, with no self-shading of the panels in any of the arrays, were assumed for the analysis in SAM. Additional solar cell and inverter design parameters are also presented in Table 1.
Since the analysis in the present study is primarily a comparison between the energy production of a conventional solar panel and a DSSC module, and thus for a fair comparison, one variable must be the same in both cases. For the purposes of this study, the total area upon which the agrivoltaics farm would be installed is approximately 10 acres (≈40,826 m2) for both the DSSC-based farm and the mono-c-Si based farm. Inverters from Trina Energy Storage Solutions, Changzhou, Jiangsu, China (TB6000SHU and TB8000SHU) [53] with maximum AC power of 5.76 kW and 7.68 kW were selected for the DSSC and mono-c-Si cases respectively. Based on the inverter and module specifications, the total numbers of modules are 85,410 and 21,373 for the DSSC and mono-c-Si cases respectively. Further details are provided in Table 1.
2.2. Financial Input Parameters
The fixed charge rate for an analysis period of 5 years was calculated by assuming a project-term debt of 60%. The inflation rate, effective tax rate and nominal debt interest rate for Karachi are taken to be 7.2% per year as of February 2026 [54], 20% per year [55] and 10.2% (March 2026) [56], respectively. For Davis, these inflation rate, effective tax rate and nominal debt interest rate are 2.5% [57], 28.8% (21% Federal, 8.8% California State tax) [58] and 3.65% [59] respectively. The internal rate of return was set to 10% for both Karachi and Davis to enable a direct comparison of the resulting LCOE, although the expected IRR for a Karachi project would typically be higher (around 21%) given the greater country risk. The depreciation schedule was set at 0% of capital cost to exclude it from the analysis. The annual cost during construction and the nominal construction interest rate were assumed to be 100% of capital cost and 0% per year, respectively. The fixed charge rate (FCR) was then automatically determined by the software, which is used in calculating the LCOE after running the simulations.
For the mono-c-Si system, the total installed capital cost of $780/kWdc was adopted from a previous study [47], encompassing solar modules, inverters, balance of plant components, installation labor, and project overheads. This cost aligns well with contemporary benchmarks for utility-scale PV installations, which range from $691/kWdc globally [60] to approximately $800/kWdc in the United States [61]. An OPEX of 13 USD/kW-year was adopted [47,62]. The capital cost for the DSSC modules was calculated using the BOM and processing cost described in Syed & Wei [63]. Because reliable technology-specific operation and maintenance data for large-scale DSSC systems are not available, the annual O&M cost was assumed to be equal to that of the mono-c-Si system, namely USD 13/kW-year. This assumption is used only as a first-order approximation for the five-year project period considered in this study. Routine system-level activities, including cleaning, inspection, inverter servicing, and balance-of-system maintenance, are expected to be broadly similar for both photovoltaic technologies over this relatively short period. However, DSSCs are subject to distinct degradation mechanisms, including electrolyte leakage or instability, dye photobleaching, electrode deterioration, and sealant failure, which may require more frequent maintenance or component replacement. These DSSC-specific interventions and major component replacements were not included in the present economic model. Therefore, the reported DSSC LCOE may be underestimated if the actual O&M requirements are greater than those assumed here.
2.3. Carbon Capture Models
In a typical single-stage membrane DAC system, air is passed through a membrane that selectively permits CO2 molecules to permeate while blocking other gases. A vacuum pump on the other side extracts the CO2-enriched stream. Membrane-based DAC offers various advantages such as a smaller footprint, simpler operation, and scalability and above all, the need for high-grade heat to regenerate the sorbent and separate CO2 is eliminated. The specific energy required for the removal of CO2 depends on several factors, including the desired purity and flow rate of CO2, the removal rate of CO2 from the air, the number of stages, and the specific membrane used [64]. In the present study, a four-stage membrane DAC system with organic polymer membranes presented by Fujikawa [65] is considered, which requires 64.8 GJ of electricity for one ton of CO2. (Which equates to 0.06 kg of CO2 removed for each kWh of electricity)
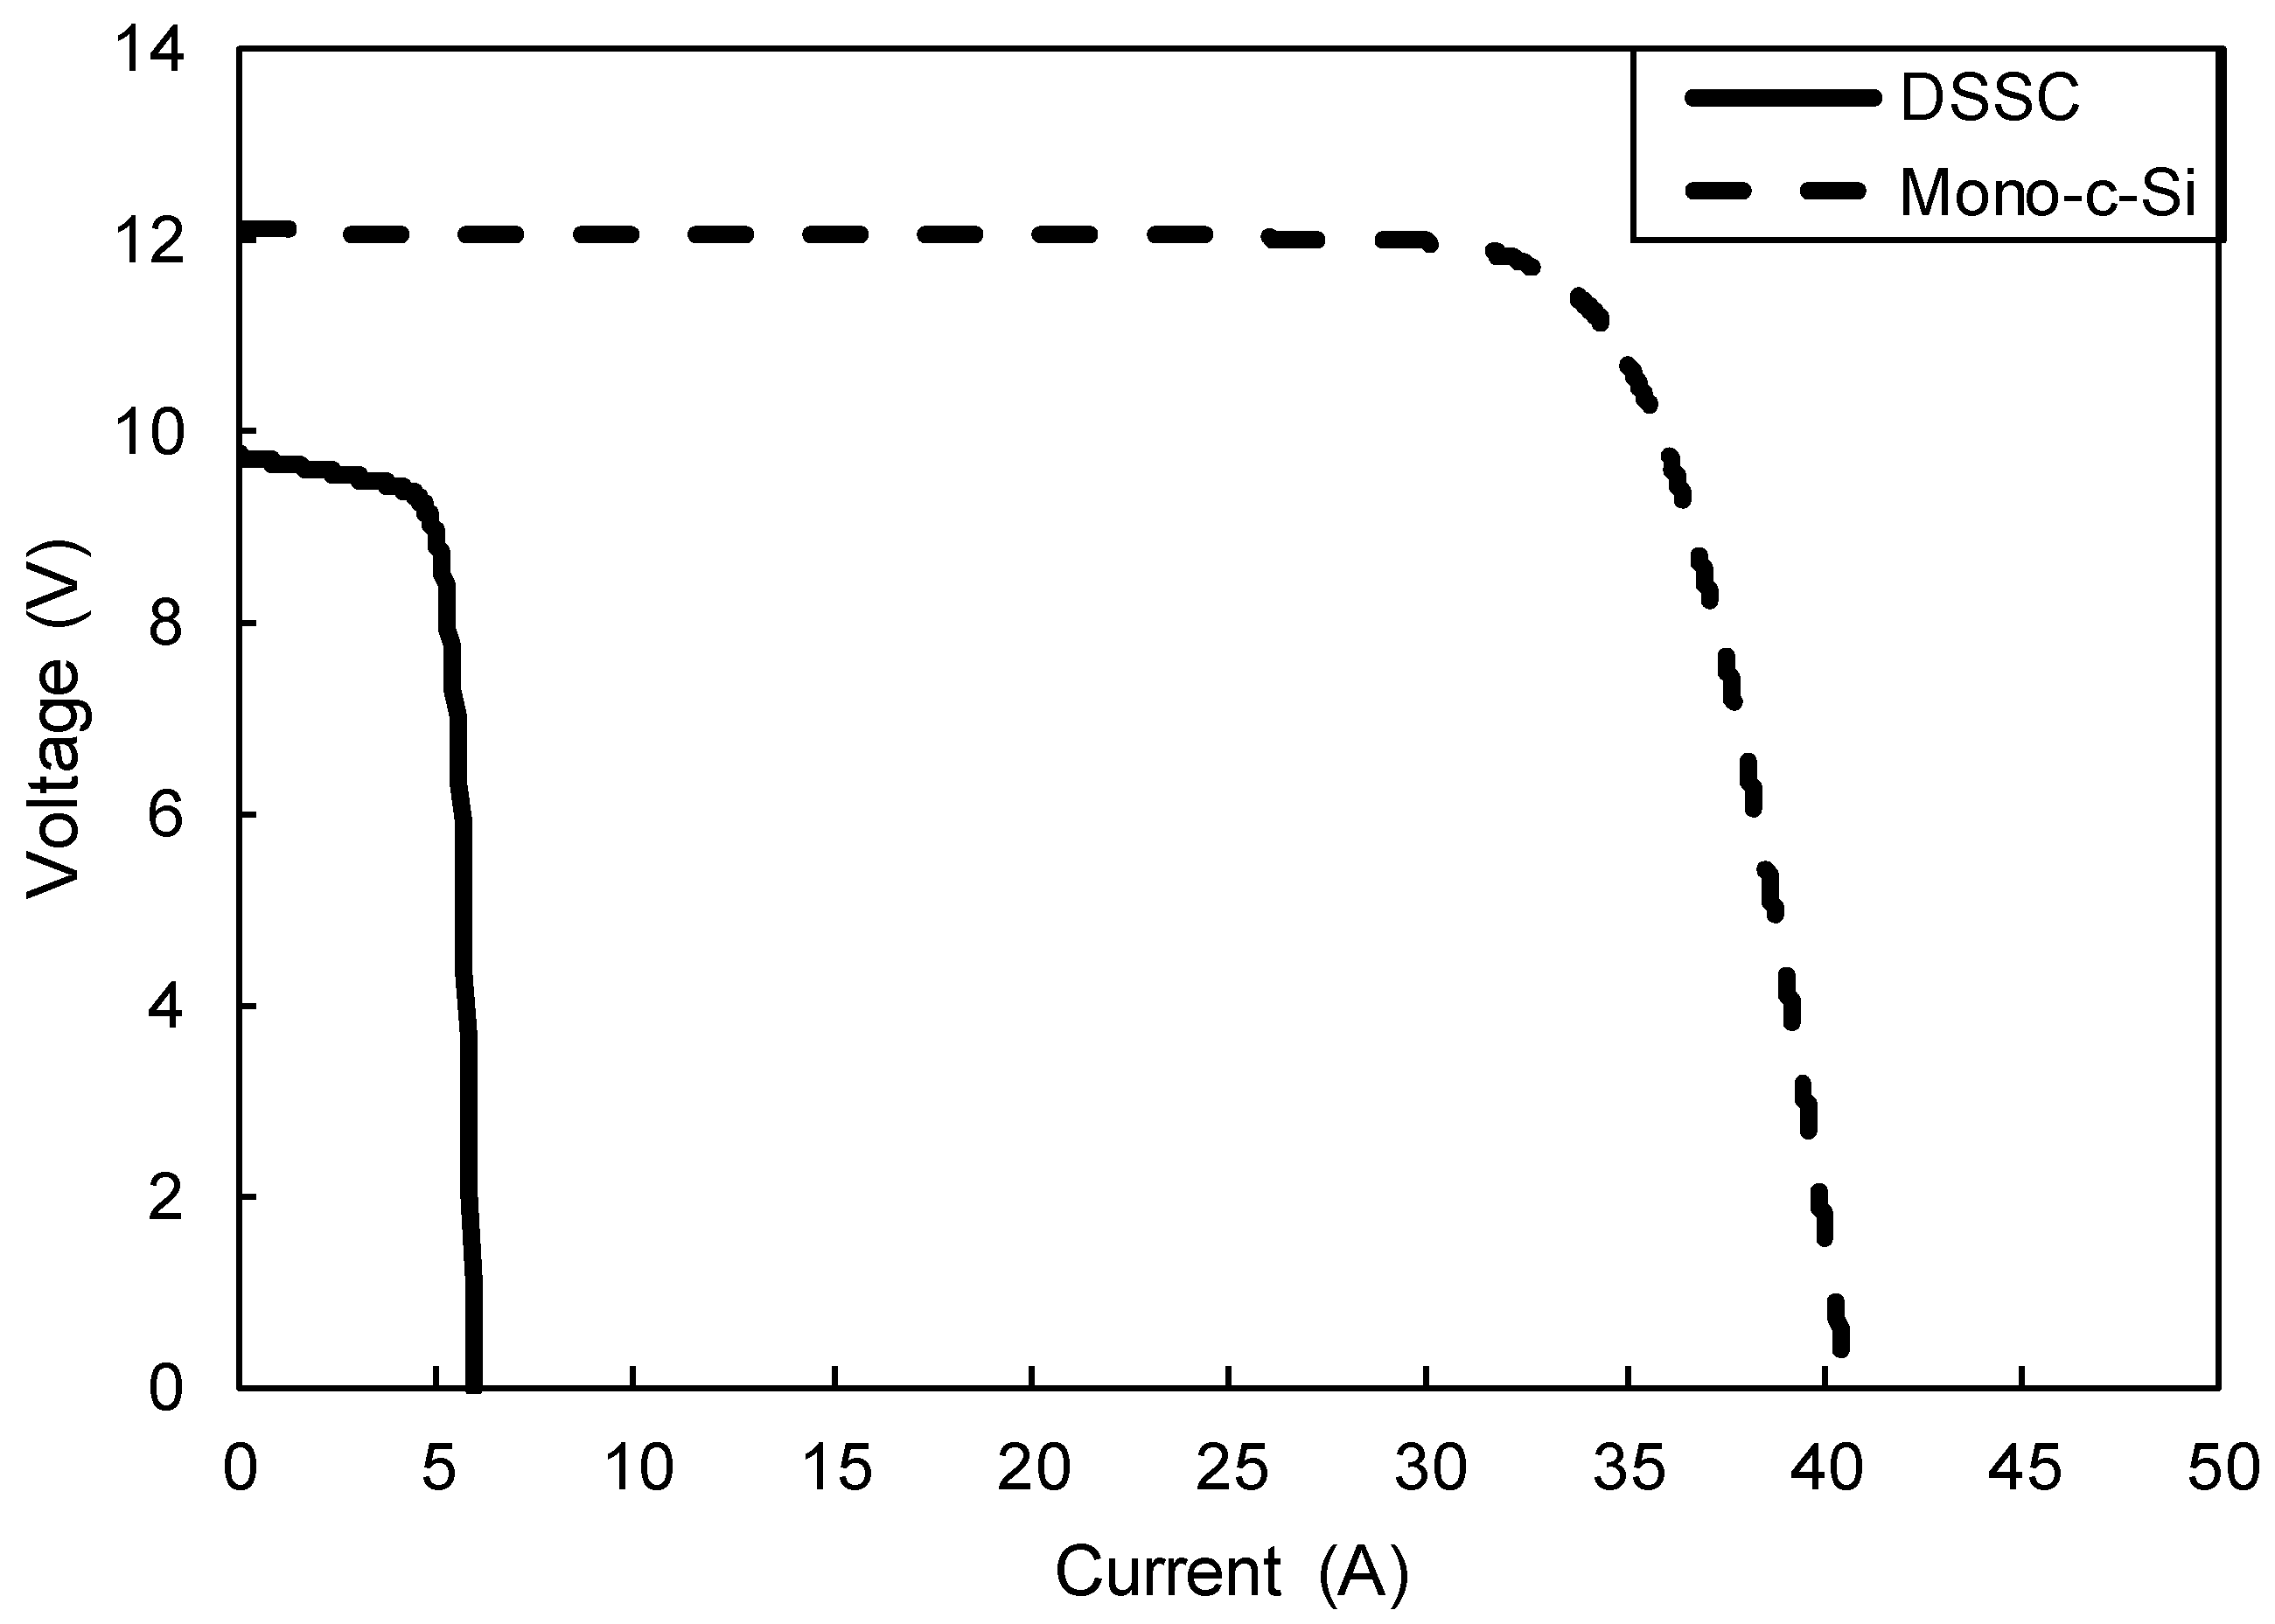
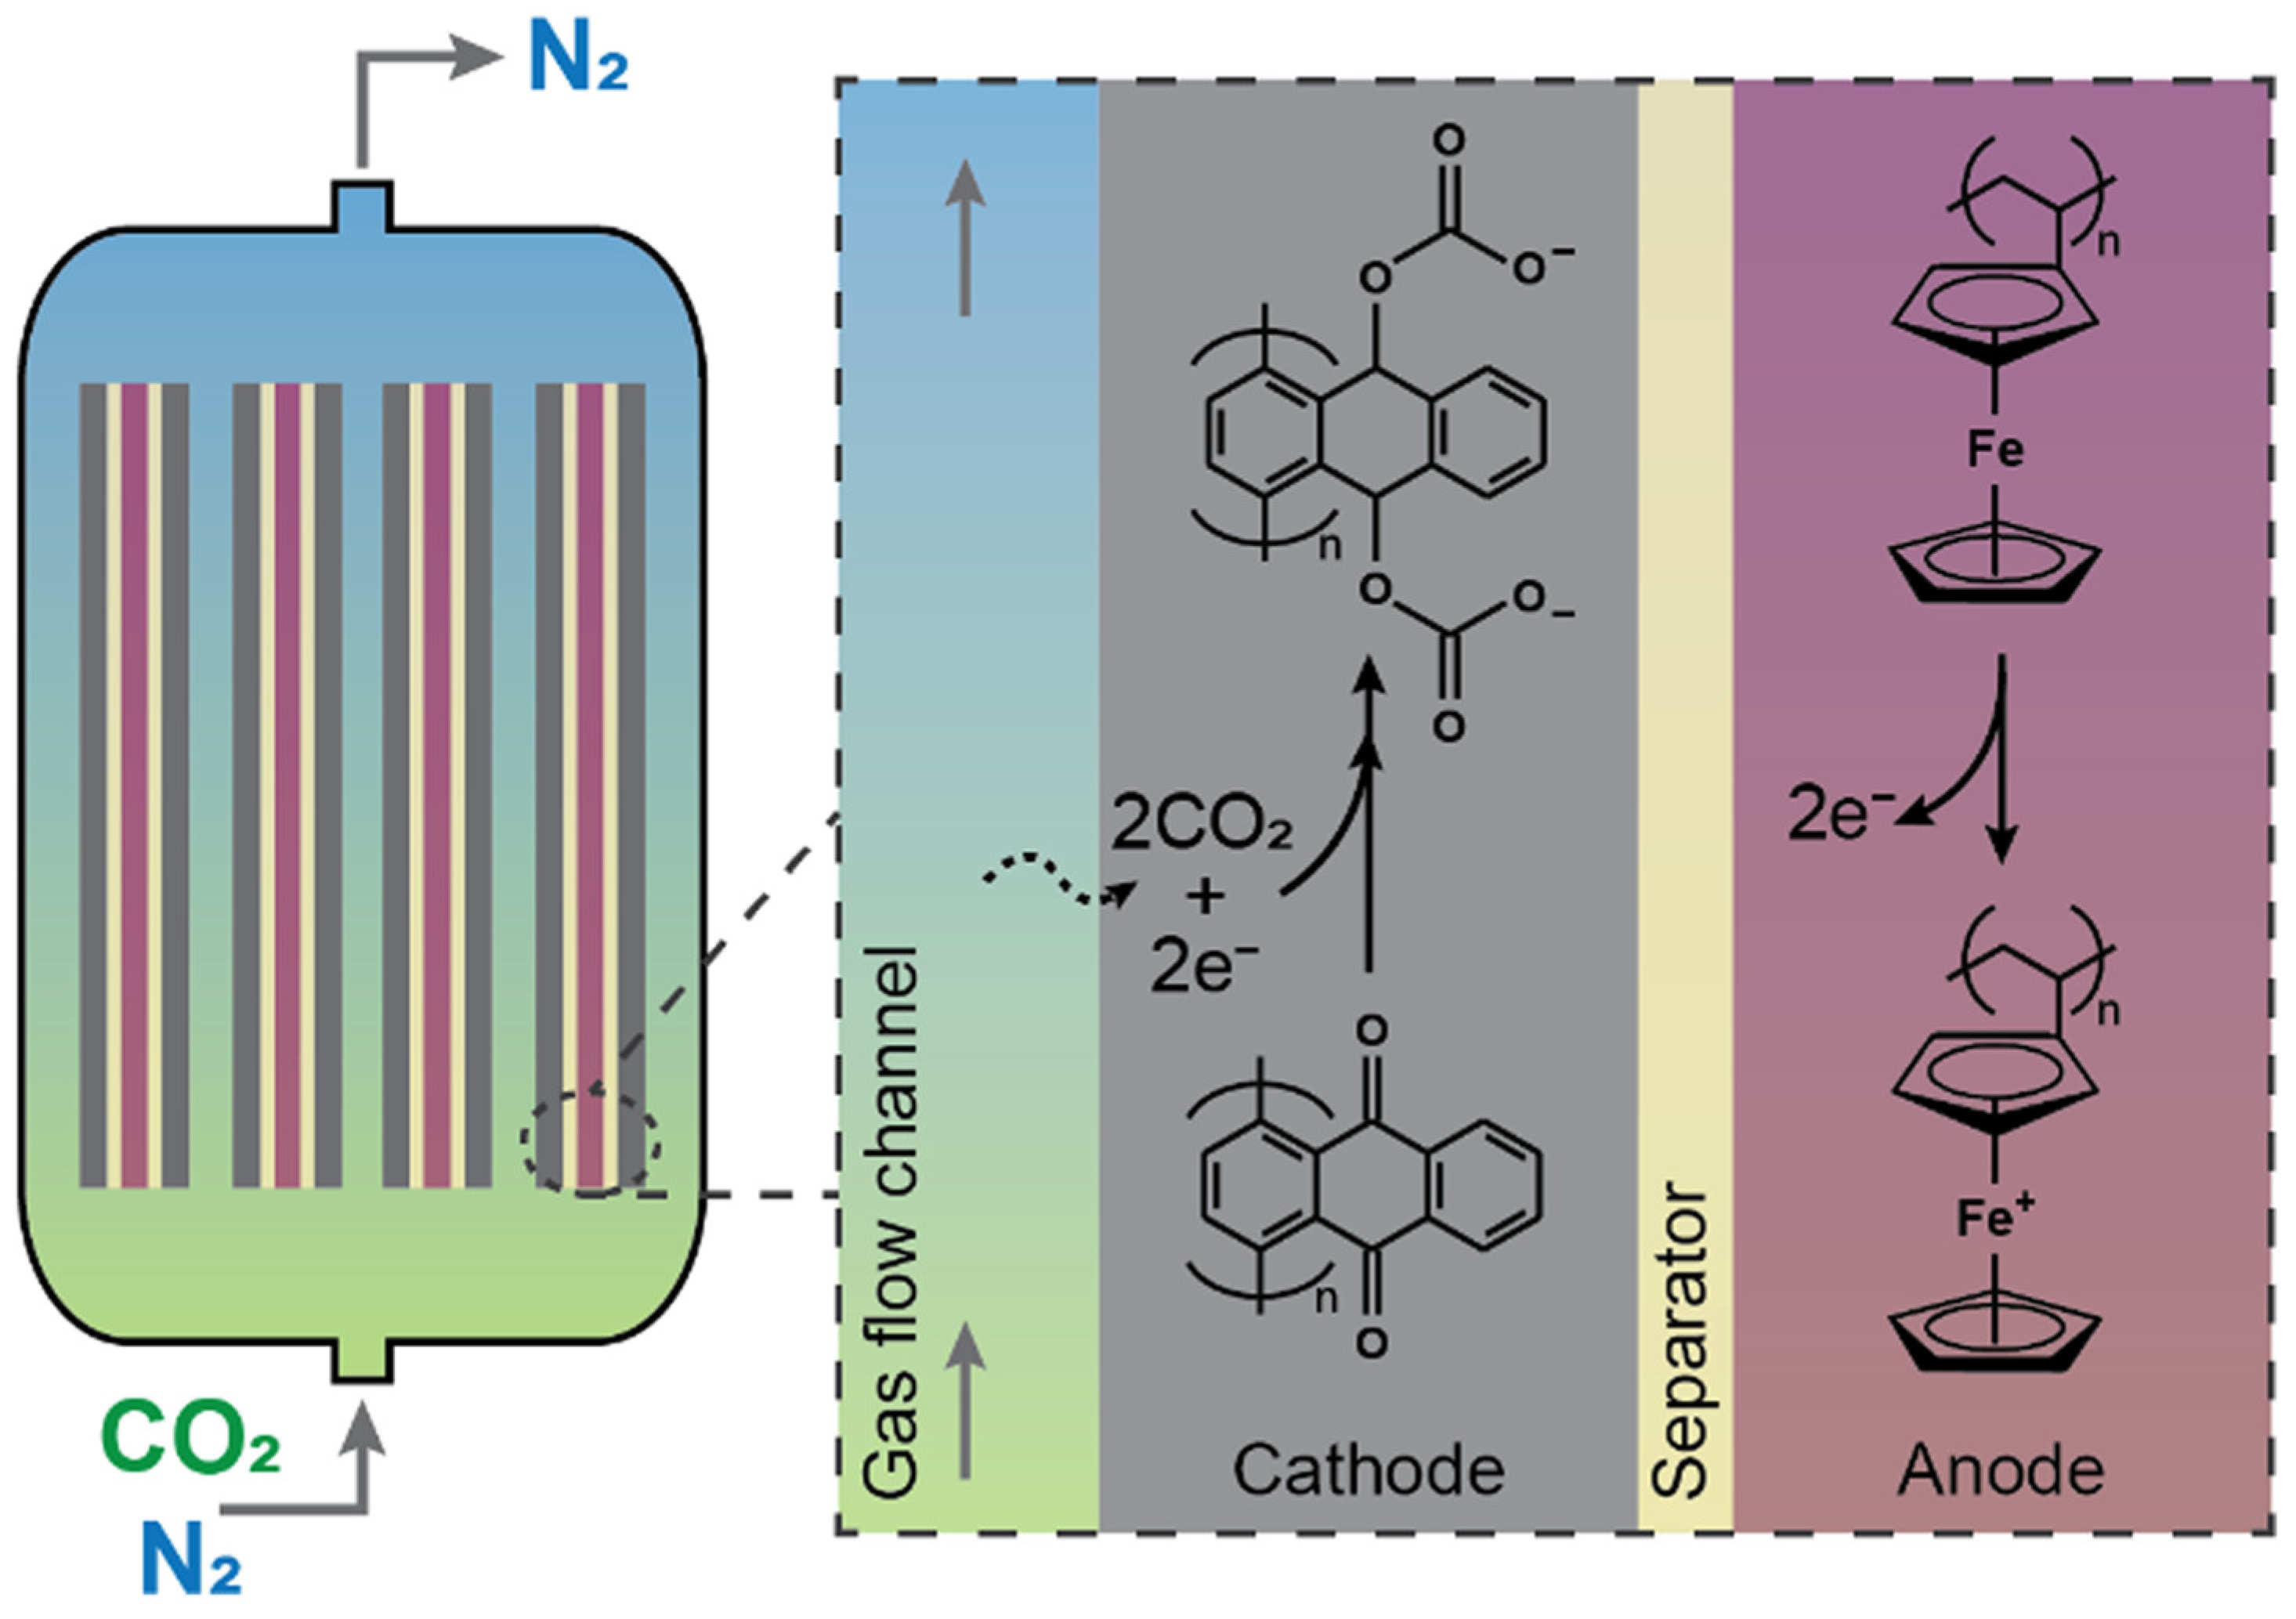
Figure 4 shows the basic working principle of redox-active DAC. Redox-active organic carriers demonstrate a strong affinity for CO2 when reduced (negatively charged) and an almost negligible affinity when oxidized (positively charged). In this technique, CO2 capture and release occur simultaneously within the electrochemical cell by adjusting the CO2 affinity of the carrier through cycles of reduction and oxidation. Depending on whether the redox-active carrier is in a liquid or solid state, this electrochemical process is known as either “electrochemical CO2 pumping” or “electro-swing adsorption.” Voskian & Hatton [66] demonstrated an electrochemical device in which an anthraquinone (namely poly(1,4-anthraquinone)) was polymerized and immobilized onto a carbon mesh as the working electrode, with a polyvinyl ferrocene composite used as the counter electrode, and an ionic liquid employed as the electrolyte. Using ambient air (410 ppm CO2 in the presence of 20% oxygen) as a feed gas, the system was able to remove CO2 at an estimated maximum energy requirement of 2.04 GJe per ton of CO2 (which translates to 1.76 kg of CO2 for each kWh of electricity). Although a breakdown of the cost of the system is not provided, it is expected to range from $50 to $100 per ton of CO2 depending on the feed concentrations and applications under consideration [67]. The membrane and redox-active DAC pathways were treated as two separate technology scenarios rather than as the lower and upper limits of a single DAC system. The four-stage polymer-membrane scenario requires 64.8 GJ of electricity per tonne of CO2 and offers a potentially modular, fully electric configuration without high-temperature sorbent regeneration [64,65]. However, its high electricity demand, vacuum requirements, membrane selectivity, and limited large-scale validation currently restrict its practical application. In comparison, the redox-active electrochemical scenario requires 2.04 GJ of electricity per tonne of CO2 and may enable lower-energy electrically driven capture and release [66,67,68]. Nevertheless, this energy value is based on laboratory-scale electrochemical experiments, and important uncertainties remain regarding electrode lifetime, oxygen stability, cycle durability, system scale-up, capital cost, and continuous outdoor operation. Therefore, the redox-active scenario is presented as an emerging technology case rather than as a commercially validated DAC benchmark.
Figure 4.
Schematic diagram of the flow cell design utilizing poly(1,4-anthraquinone) (PAQH) as the cathode material. The gas stream enters from the bottom and CO2 exits from the top after treatment. Each cell within the device comprises a PAQH composite cathode and a counter electrode containing polyvinyl ferrocene (PVFc). CO2 capture is achieved through saturation of the PAQH cathode, followed by polarity reversal for desorption. Redrawn from [68].
In the present assessment, PV–DAC integration is modeled only on an energy basis. The annual electricity generated by the DSSC system is divided by the literature-reported specific electricity requirement of each DAC pathway to estimate the corresponding annual CO2-removal potential. The analysis does not represent the physical co-location or engineering design of the DAC installation. In practice, integration would require additional land for air-contacting and separation equipment, pumps or vacuum systems, power-conditioning units, access and maintenance areas, and facilities for CO2 compression, transport, storage, or utilization. Grid connection, battery storage, or other electricity-management infrastructure may also be required because PV generation and DAC operation may not coincide continuously. Potential thermal integration or waste-heat utilization was not considered because the present calculation uses only the reported electrical energy requirements of the selected DAC pathways.
3. Results and Discussion
This section presents the key performance indicators derived from SAM simulations for DSSC and mono-c-Si photovoltaic systems deployed in Karachi and Davis to evaluate the technical performance of both technologies under contrasting climatic and geographic conditions.
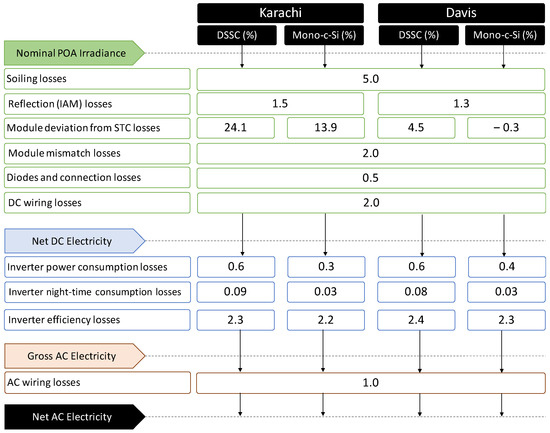
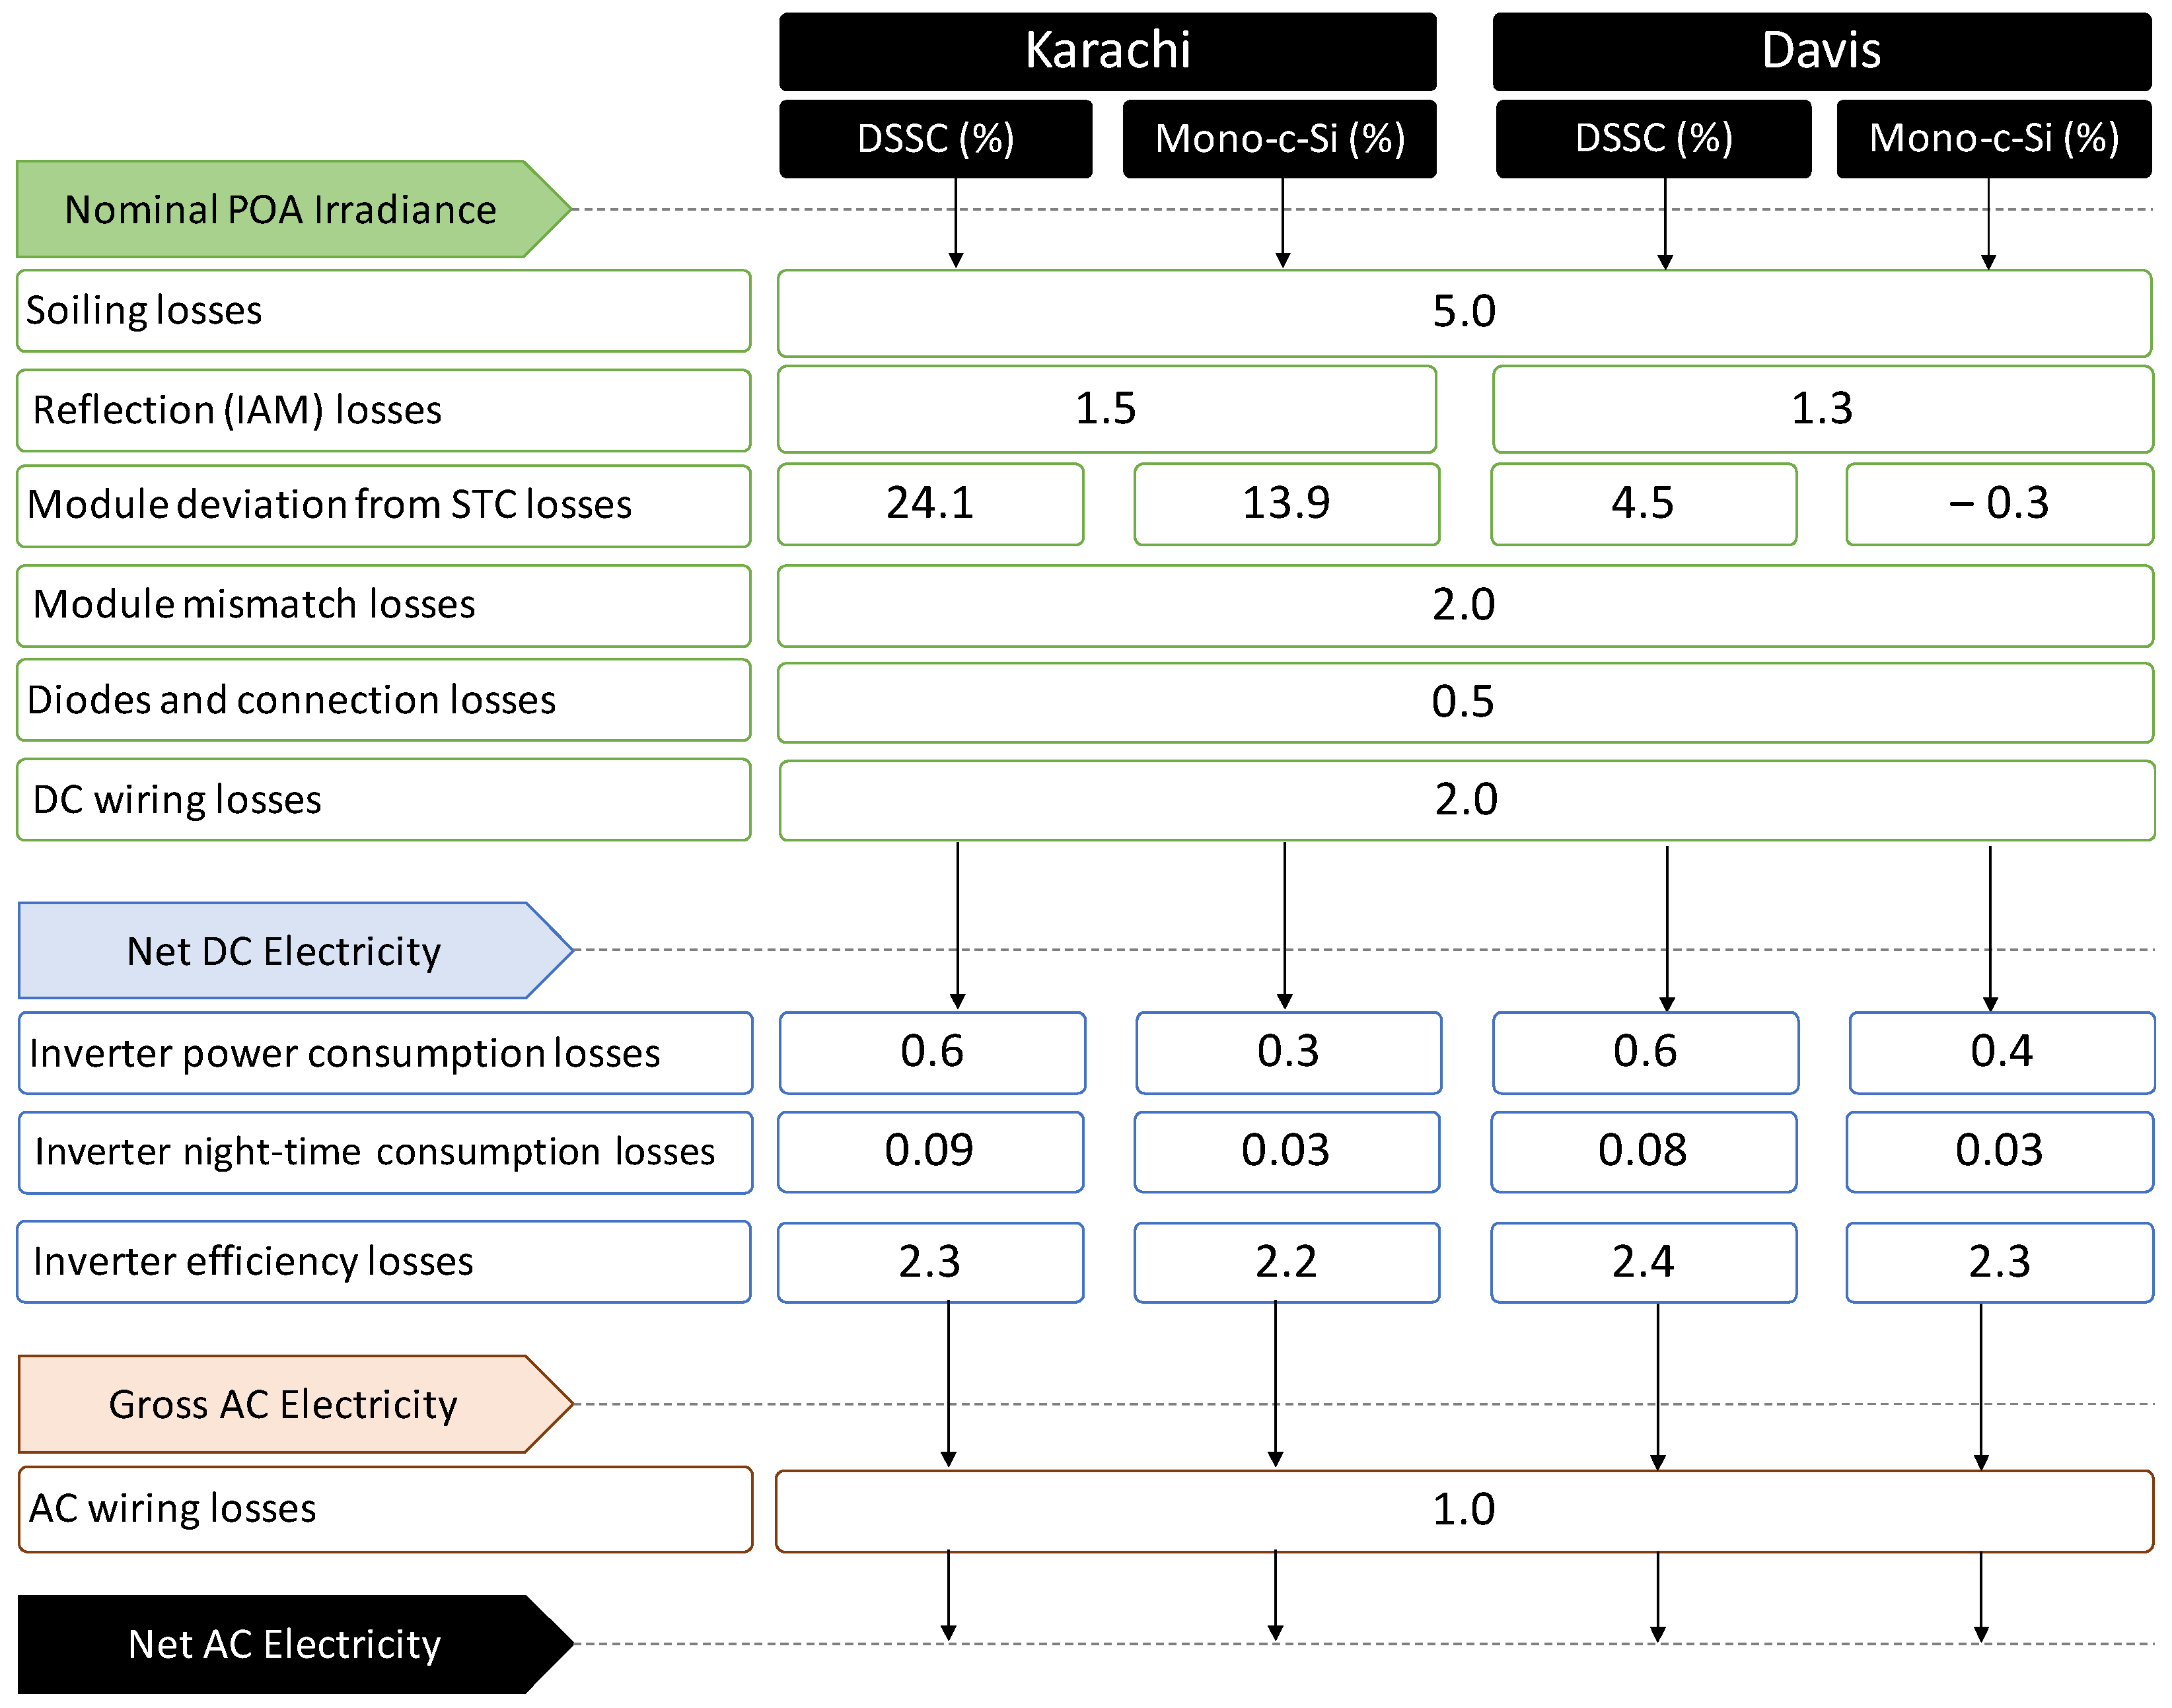
Figure 5 summarizes the sequential energy loss breakdowns for DSSC and mono-c-Si PV systems in both locations, as modeled by the System Advisor Model (SAM). The values reflect the losses occurred as nominal plane-of-array (POA) irradiance is converted into usable AC electricity, accounting for optical, electrical, and system-level inefficiencies. These losses are not additive but are instead applied sequentially as multiplicative reductions, where each stage derates the output of the previous one. Losses such as soiling, wiring (DC/AC), module mismatch, and connection losses were largely consistent across technologies. DSSC systems showed slightly higher inverter power consumption losses (0.6% versus 0.3% in Karachi and 0.6% versus 0.4% in Davis). Inverter efficiency losses are very similar for both technologies. DSSC systems showed higher nighttime consumption losses; however, the magnitude of these losses is very small to have any significant impact on the output. Karachi’s lower latitude results in higher solar elevations that are less optimally aligned with the module tilt (set equal to latitude), leading to slightly higher average angles of incidence and consequently higher reflection (incidence angle modifier, IAM) losses compared to Davis (1.5% vs. Davis’s 1.3%).
Figure 5.
Flowchart showing losses for DSSC and mono-c-Si systems in Karachi and Davis obtained from SAM simulations. Labels show the energy levels or stages to which losses are applied sequentially as multiplicative reductions. Arrows indicate the location and technology to which each number corresponds. Dashed lines indicate the stage in the energy-conversion sequence (i.e., from Nominal Plane-of-Array (POA) Irradiance to Net AC Electricity)
The main difference between the DSSC and mono-c-Si systems is the module deviation from standard test conditions (STCs). For DSSCs, the SAM-derived module deviation was 24.1% in Karachi and 4.5% in Davis, corresponding to an additional loss of 19.6 percentage points in Karachi. For mono-c-Si, the corresponding values were 13.9% in Karachi and −0.3% in Davis, giving a difference of 14.2 percentage points. The negative value for mono-c-Si in Davis indicates a small operating-condition gain relative to the STC reference.
The higher module losses in Karachi are primarily associated with its higher operating temperatures. The average daytime ambient temperatures during 08:00–16:00 were 31.2 °C in Karachi and 12.9 °C in Davis, representing a difference of 18.3 °C. Using the maximum-power temperature coefficients listed in Table 1, namely −0.49%/°C for DSSC and −0.342%/°C for mono-c-Si, a first-order calculation indicates approximately 9.0% additional temperature-related power reduction for DSSC and 6.3% for mono-c-Si in Karachi relative to Davis. These simplified estimates assume a similar module-to-ambient temperature difference at both locations. The larger differences obtained from SAM reflect hourly variations in module temperature and irradiance, together with nonlinear effects on the current–voltage curve. Therefore, the SAM module-deviation values are used in the subsequent energy-balance comparison.
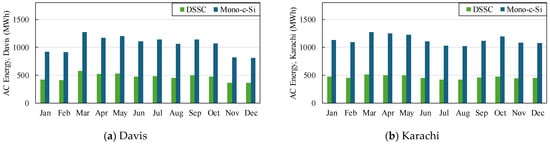
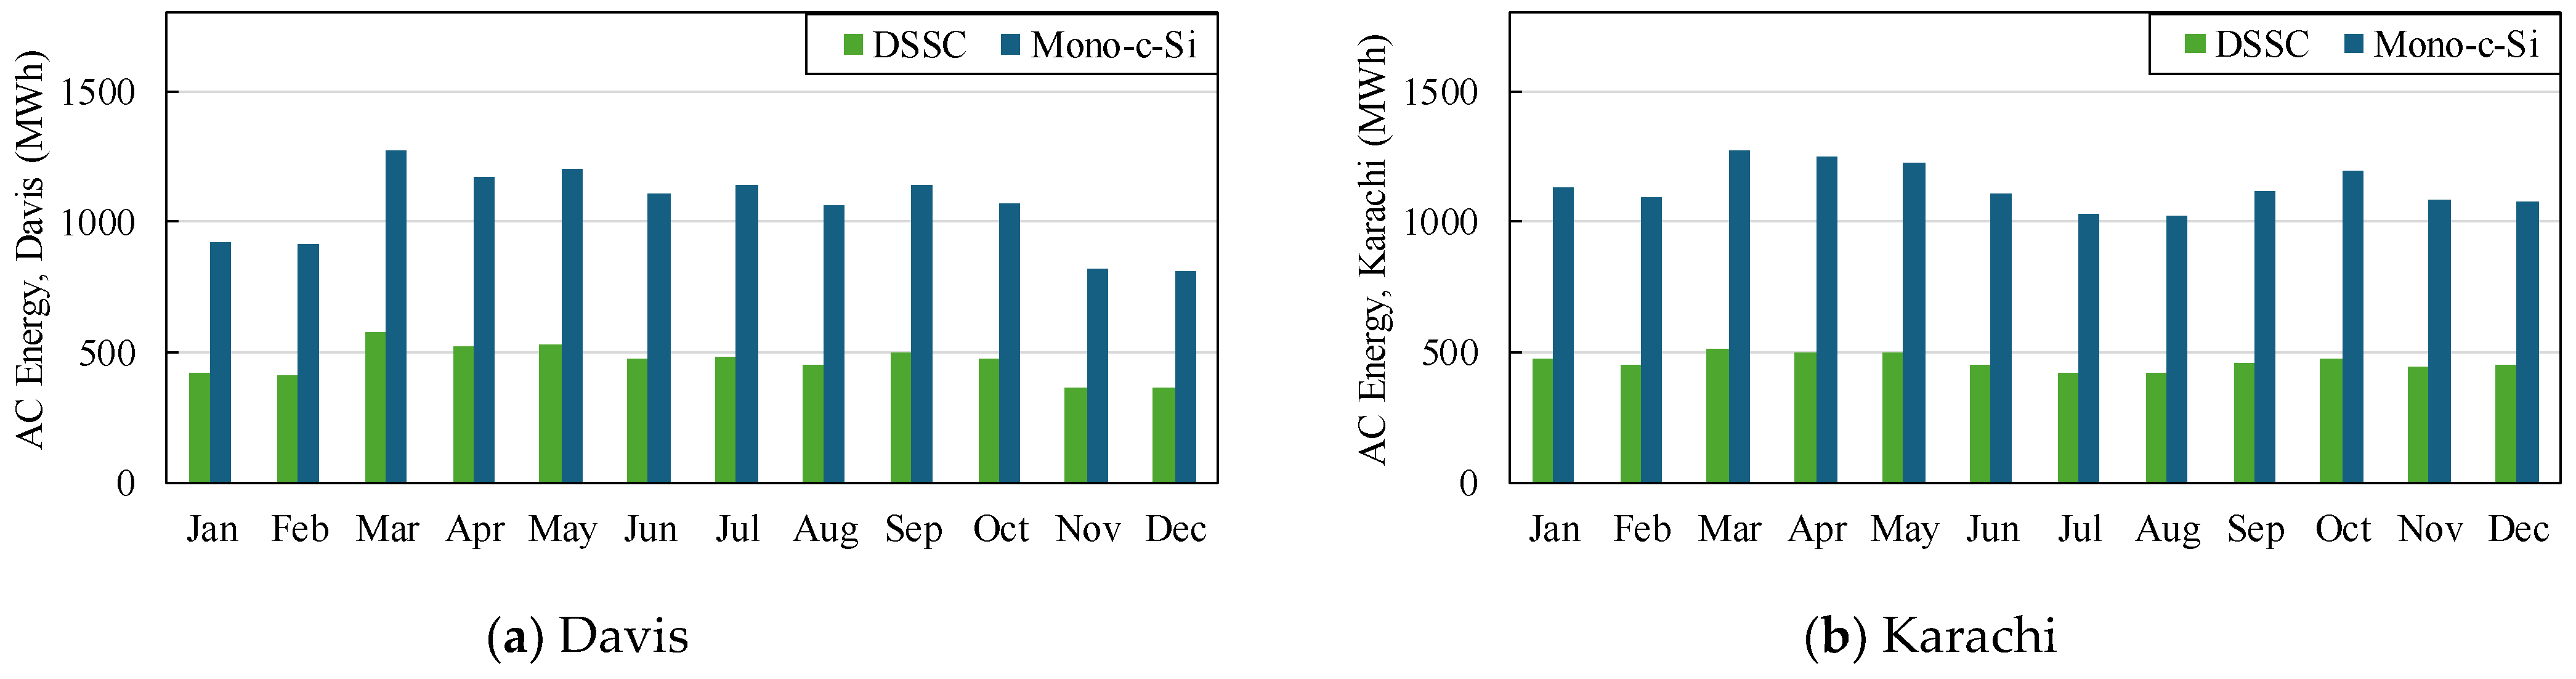
Figure 6 presents the monthly AC energy production of the DSSC and mono-c-Si photovoltaic systems in Davis and Karachi. On average across the two locations, the mono-c-Si systems generated approximately 2.4 times more annual AC electricity than the DSSC systems. This difference is primarily attributable to the higher installed AC capacity of the mono-c-Si systems, namely 6.144 MW compared with 2.835 MW for the DSSC systems. In Karachi, the monthly mono-c-Si output ranged from 1023 to 1273 MWh, whereas the DSSC output ranged from 417 to 512 MWh. The minimum monthly output was approximately 12% below the annual monthly average for mono-c-Si and 11% below the annual monthly average for DSSC. In Davis, where seasonal variation in daylight and solar irradiance is greater, DSSC output ranged from 363 to 576 MWh/month, while mono-c-Si output ranged from 809 to 1278 MWh/month. The minimum monthly output was approximately 22% below the annual monthly average for DSSC and 23% below the corresponding average for mono-c-Si. These differences of only one percentage point are not considered practically significant. Therefore, the two photovoltaic technologies are interpreted as showing comparable seasonal variation within each location. Both technologies exhibited greater seasonal variation in Davis than in Karachi because of the larger seasonal changes in solar availability at the higher-latitude location.
Figure 6.
Monthly AC energy production of DSSC and mono-c-Si photovoltaic systems in (a) Davis and (b) Karachi.
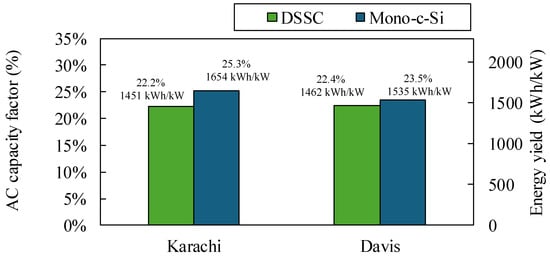
Figure 7 shows the AC capacity factor and energy yield for each system. The AC capacity factor is the ratio of the actual annual electricity produced by the system and the theoretical maximum output based on generation at the installed capacity throughout the year. Another metric to convey this information is energy yield, which shows the annual electricity produced per installed capacity (kWh/kW). Mono-c-Si achieved slightly higher capacity factors than DSSCs in both locations—25.3% vs. 22.2% in Karachi and 23.5% vs. 22.4% in Davis—however, the difference is less than 3%. This indicates that, based on the assumptions used for the simulations, the DSSCs can have capacity factors comparable to mono-c-Si systems. However, it should be noted that DSSCs are subject to intrinsic limitations—particularly long-term stability issues, electrolyte degradation, and sensitivity to temperature and UV exposure—which can lead to performance deterioration over time and, consequently, reduced effective capacity factors in practical deployments. An important uncertainty arises from scaling the electrical parameters of the laboratory-scale DPP13 DSSC to the assumed 2.835 MW AC system. The model assumes that the cell-level current–voltage characteristics are retained when individual cells are assembled into modules and large arrays. Therefore, the analysis does not explicitly account for inactive interconnection areas, additional series resistance and current-mismatch losses, optical losses introduced by encapsulation and sealing, manufacturing yield, module-to-module variability, or progressive degradation of the dye, electrolyte, electrodes, and seals during long-term outdoor operation. Module-level outdoor studies have shown that DSSC performance can be affected by electrolyte changes, sealing limitations, thermal exposure, and dye degradation. Because no experimentally validated module-derating or ageing model is available for DPP13-based utility-scale systems, these effects could not be quantified in the present analysis. Accordingly, the predicted DSSC energy yield, capacity factor, and DAC-driven CO2 removal should be interpreted as theoretical upper-bound estimates, whereas the corresponding LCOE should be considered an optimistic lower-bound estimate. The extrapolation from laboratory-cell performance to utility-scale operation is therefore a key uncertainty of this study. Since the capacity factor is defined based on the ratio of actual energy output to installed capacity over the entire year, it does not explicitly account for the hourly distribution of solar irradiance (W/m2). Consequently, the higher solar insolation (W/m2-year) in Karachi compared to Davis offsets the temperature-induced losses, resulting in comparable capacity factors at both locations.
Figure 7.
Key performance indicators derived from SAM simulations for DSSC and mono-c-Si photovoltaic systems deployed in Karachi and Davis AC capacity factor (%) and energy yield (kWh/kW).
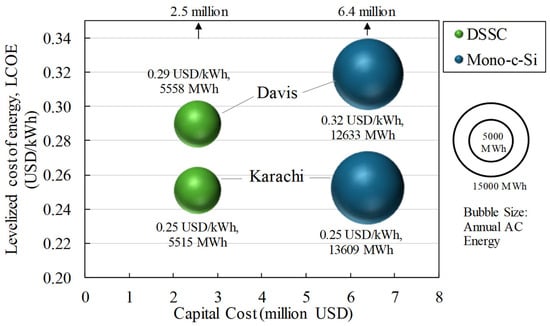
Figure 8 presents a bubble chart comparing DSSC and mono-c-Si systems in Karachi and Davis across three key techno-economic indicators: capital cost, levelized cost of electricity (LCOE), and annual energy production. The x-axis represents system capital cost (in thousands of USD), the y-axis shows LCOE in USD/kWh, and bubble size corresponds to net annual AC energy output in MWh. This visualization highlights the trade-offs between initial investment, cost of energy, and electricity yield for each configuration.
Figure 8.
Bubble chart comparing capital cost and levelized cost of electricity (LCOE) for DSSC and mono-c-Si PV systems in Karachi and Davis. Bubble size represents annual AC energy output (MWh). DSSC systems exhibit lower capital cost and LCOE, making temperature resilience in high-irradiance environments.
The DSSC system generated 5515 MWh/year in Karachi and 5558 MWh/year in Davis. Karachi received 90.8 GWh/year of annual plane-of-array irradiation compared with 74.1 GWh/year in Davis, representing a 22.5% irradiation advantage. However, applying the SAM-derived module-deviation factors sequentially reduces these values to approximately 68.9 GWh/year-equivalent in Karachi [90.8 × (1 − 0.241)] and 70.8 GWh/year-equivalent in Davis [74.1 × (1 − 0.045)] after the module operating-condition loss stage. Thus, the initial 22.5% irradiation advantage in Karachi becomes an approximately 2.6% deficit after the module-deviation loss is applied. Following the remaining optical, electrical, inverter, and wiring losses, the final DSSC AC output in Karachi is approximately 0.8% lower than that in Davis. This quantitative breakdown demonstrates how the higher irradiation in Karachi is counterbalanced by its greater temperature-dominated module losses.
In contrast, mono-c-Si experienced a smaller difference in module deviation from STC, namely 13.9% in Karachi compared with −0.3% in Davis. Consequently, part of Karachi’s irradiation advantage was retained, resulting in annual mono-c-Si AC production of 13,609 MWh in Karachi compared with 12,633 MWh in Davis, or approximately 7.7% higher output in Karachi.
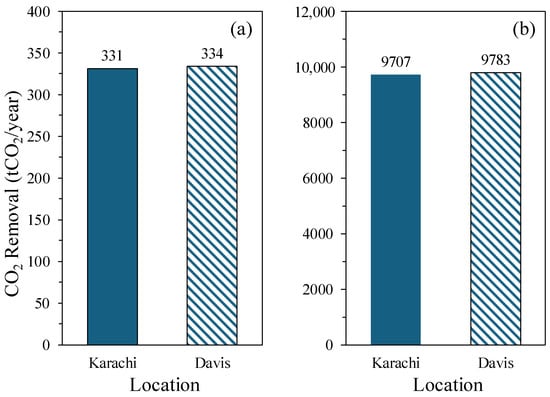
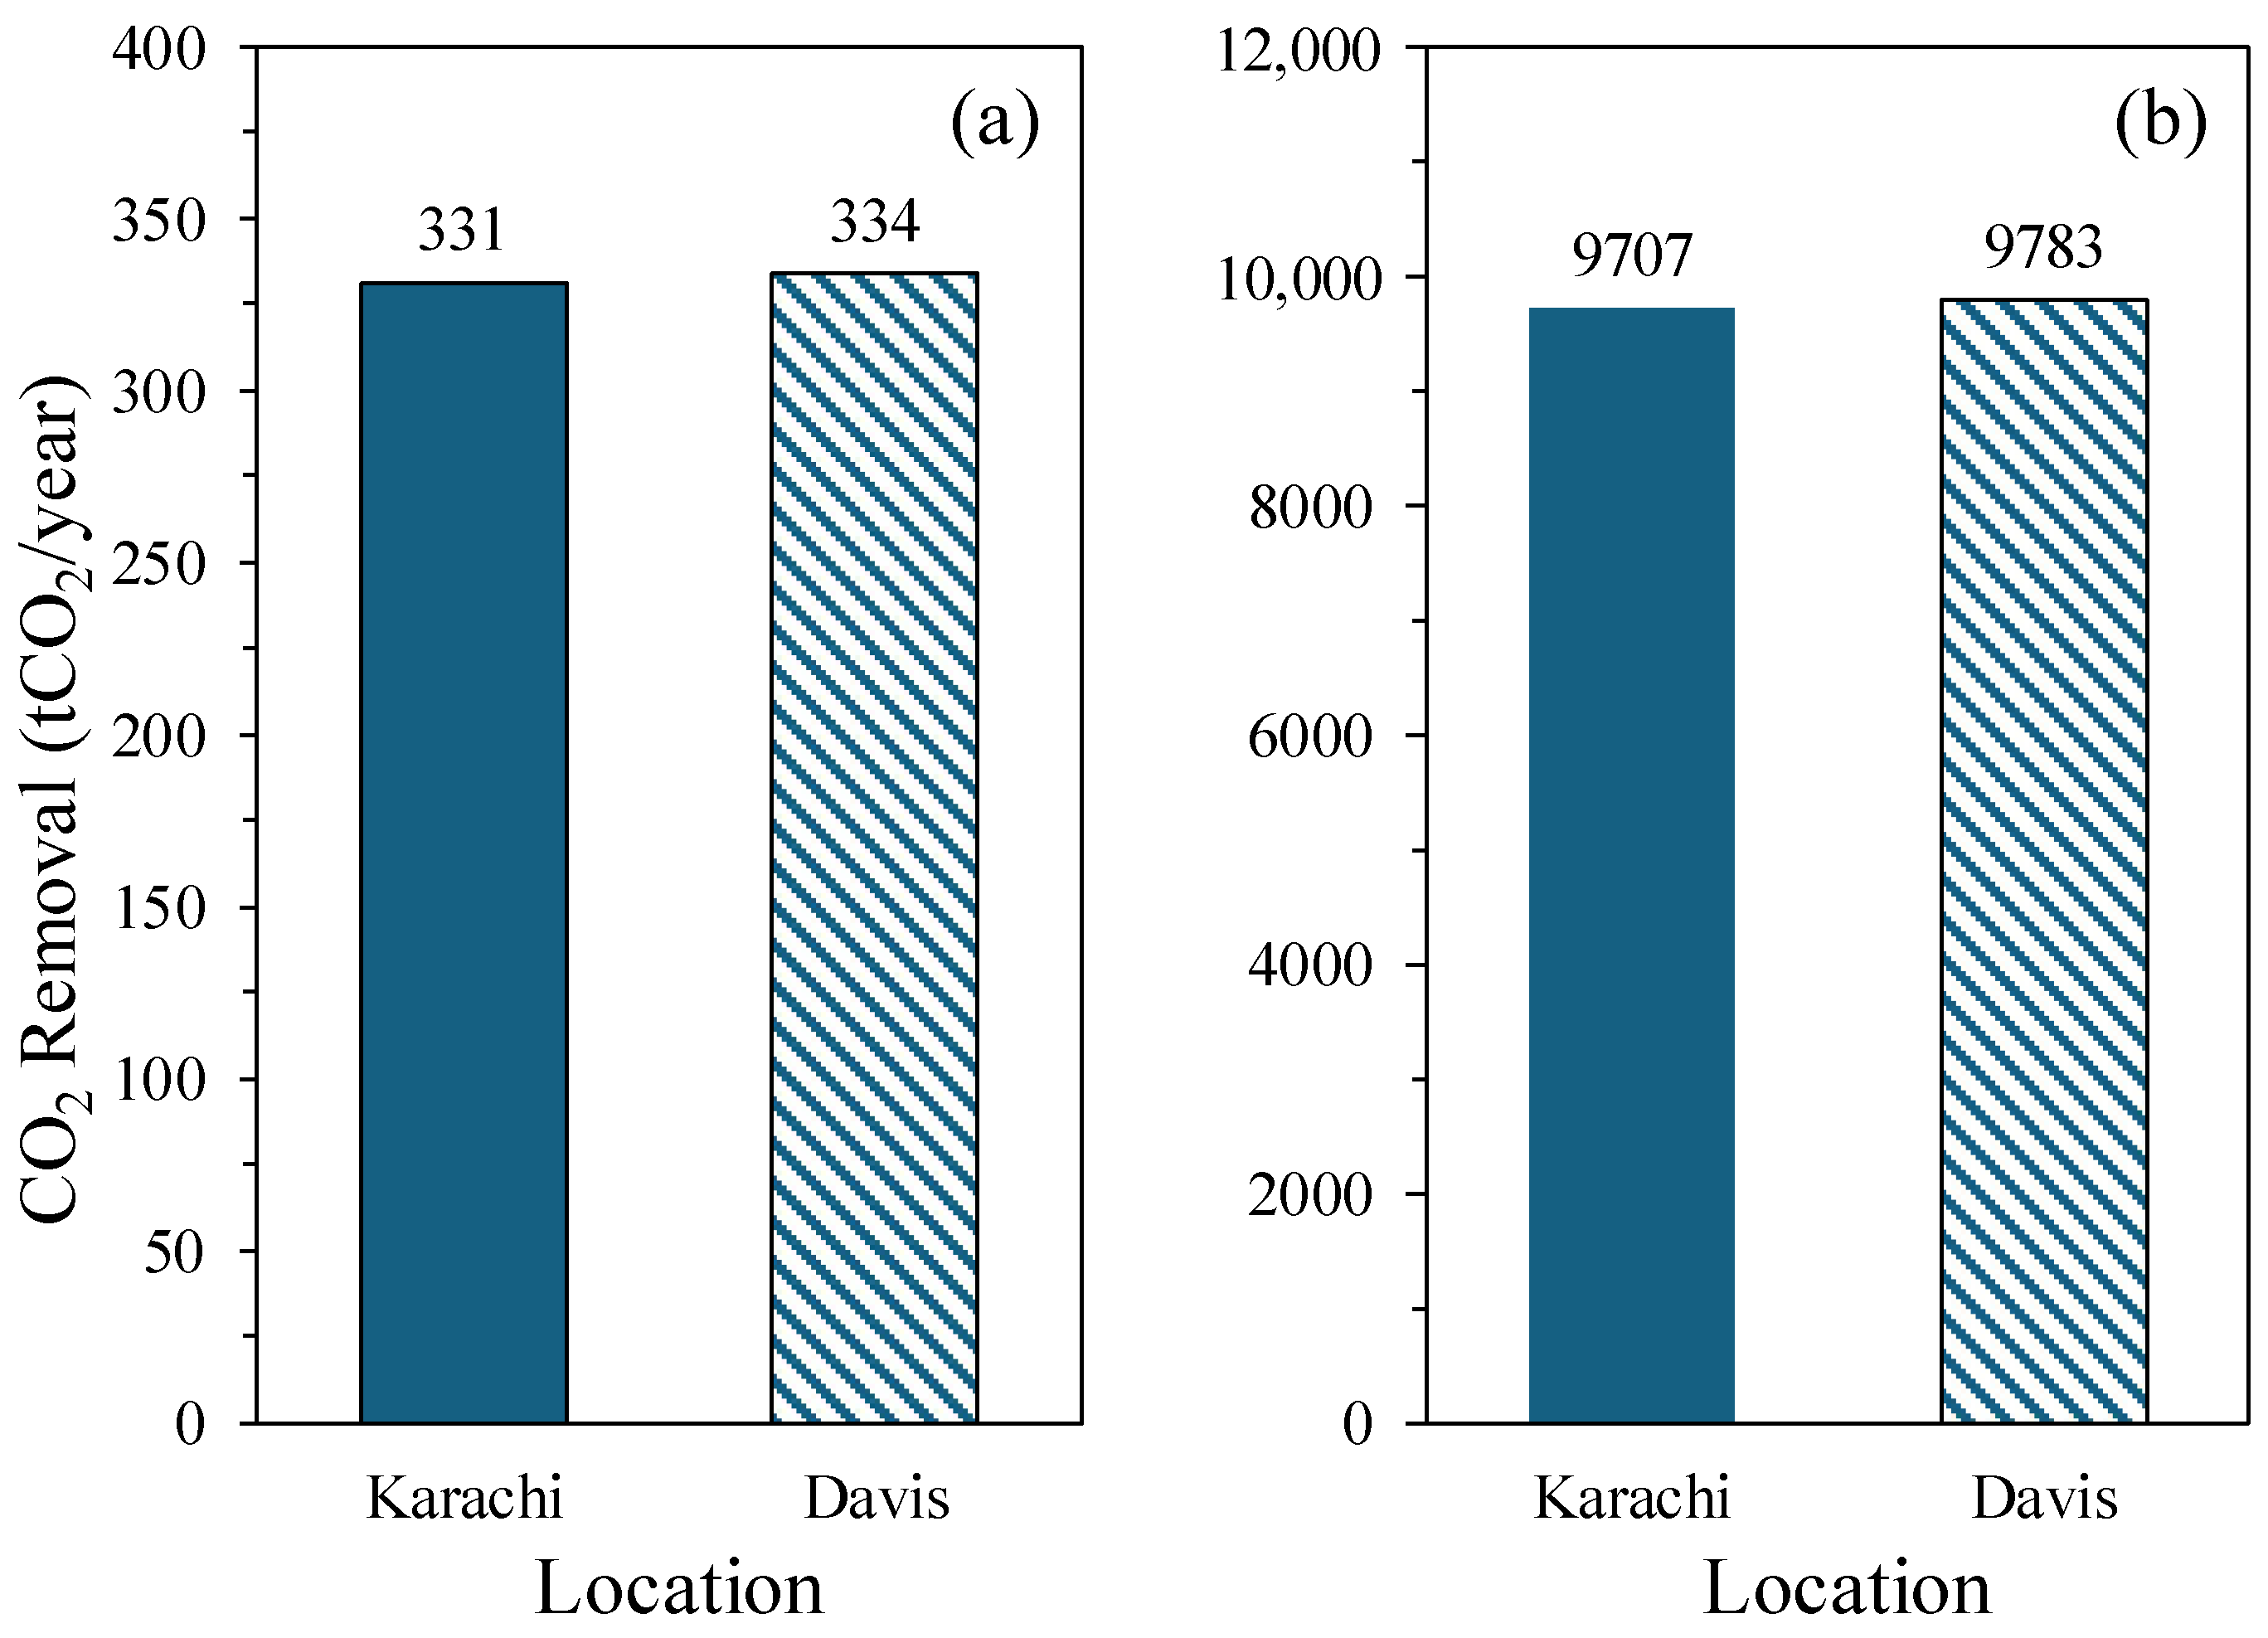
Figure 9 presents the estimated CO2 removal separately for the membrane-based and redox-active DAC scenarios. For the membrane-based pathway, which requires 64.8 GJ of electricity per tonne of CO2, the DSSC system could support the removal of approximately 331 tCO2/year in Karachi and 334 tCO2/year in Davis. For the redox-active pathway, which requires 2.04 GJ of electricity per tonne of CO2, the corresponding estimated removal capacities increase to 9707 tCO2/year in Karachi and 9783 tCO2/year in Davis. The large difference between these results arises because the literature-reported energy requirement of the membrane scenario is approximately 31.8 times greater than that of the redox-active scenario. These values are therefore technology-specific scenario estimates and should not be presented as a continuous uncertainty range.
Figure 9.
Estimated annual CO2 removal supported by DSSC-generated electricity for two separate DAC technology scenarios: (a) membrane-based DAC requiring 64.8 GJ/tCO2 and (b) redox-active electrochemical DAC requiring 2.04 GJ/tCO2. The redox-active scenario represents an emerging lower-energy technology and is not commercially validated performance.
The two pathways also differ considerably in maturity, estimated cost, and potential application. Membrane DAC offers a conceptually simple and modular all-electric process, but the modeled four-stage system has a high electricity requirement and has not been validated at commercial DAC scale. Redox-active DAC offers substantially lower theoretical energy consumption and may be more suitable for electrically powered decentralized capture; however, it remains an emerging electrochemical technology requiring further validation of electrode stability, cycle life, oxygen tolerance, and large-scale operation. Based only on the modeled DSSC LCOE and excluding DAC capital cost, maintenance, compression, transport, and storage, the approximate electricity cost would be USD 4500/tCO2 in Karachi and USD 5220/tCO2 in Davis for the membrane scenario. For the redox-active scenario, the corresponding electricity-only costs would be approximately USD 142/tCO2 and USD 164/tCO2, respectively. These calculations demonstrate the potential energy advantage of the redox-active pathway but do not represent complete or commercially validated DAC capture costs.
Accordingly, the membrane results provide a more conservative high-energy scenario, whereas the redox-active results illustrate the prospective performance of a lower-energy but less mature electrochemical pathway. Experimental scale-up, durability testing, and complete techno-economic assessment of the DAC equipment are required before either pathway can be considered for practical integration with the proposed photovoltaic system.
The results highlight important trade-offs between energy output, cost, and land-use efficiency in agrivoltaic systems. While monocrystalline silicon systems provide higher electricity generation due to greater installed capacity, DSSC-based systems demonstrate competitive economic performance and improved compatibility with agricultural applications due to their semi-transparent nature. This indicates that optimizing agrivoltaic systems should not be based solely on maximum energy generation, but rather on achieving a balanced integration of energy production, crop productivity, and land-use efficiency. Furthermore, the integration of DSSC systems with direct air capture introduces an additional dimension of climate mitigation, enabling decentralized carbon removal alongside renewable electricity generation. These findings suggest that multifunctional energy systems can play a critical role in addressing interconnected challenges related to food security, energy demand, and climate change.
4. Policy and Sustainability Implications
This study has important implications for sustainable energy planning, agricultural land management, and climate mitigation. The findings show that dye-sensitized solar cells (DSSCs), despite their lower nominal power output compared with monocrystalline silicon photovoltaic systems, may provide additional system-level value when evaluated in the context of agrivoltaics. Their semi-transparent nature makes them potential candidates for dual land use; however, their suitability for crop cultivation cannot be confirmed without measurements of PAR transmission and crop-specific biological responses.
From a land-use perspective, semi-transparent DSSC systems could potentially reduce competition between photovoltaic deployment and agricultural production if sufficient crop-compatible radiation is transmitted through the modules. This possibility is particularly relevant in regions where food security, rural livelihoods, and clean-energy expansion are closely connected. However, the present analysis evaluates only photovoltaic and economic performance and does not quantify agricultural productivity or land-equivalent benefits.
Instead of treating agricultural land and solar infrastructure as competing priorities, semi-transparent agrivoltaic systems can support integrated food–energy planning.
The techno-economic results also suggest that DSSCs may be attractive for decentralized renewable energy applications where lower capital investment and system flexibility are important. Although monocrystalline silicon systems generate more electricity, DSSCs showed competitive levelized costs of electricity and comparable capacity factors under the assumptions used in this study. This indicates that emerging photovoltaic technologies should be assessed not only by maximum energy yield, but also by their broader contribution to land-use efficiency, affordability, and multifunctional infrastructure.
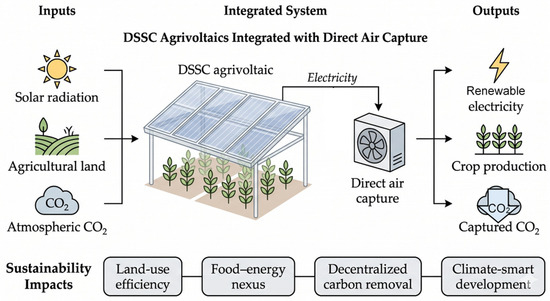
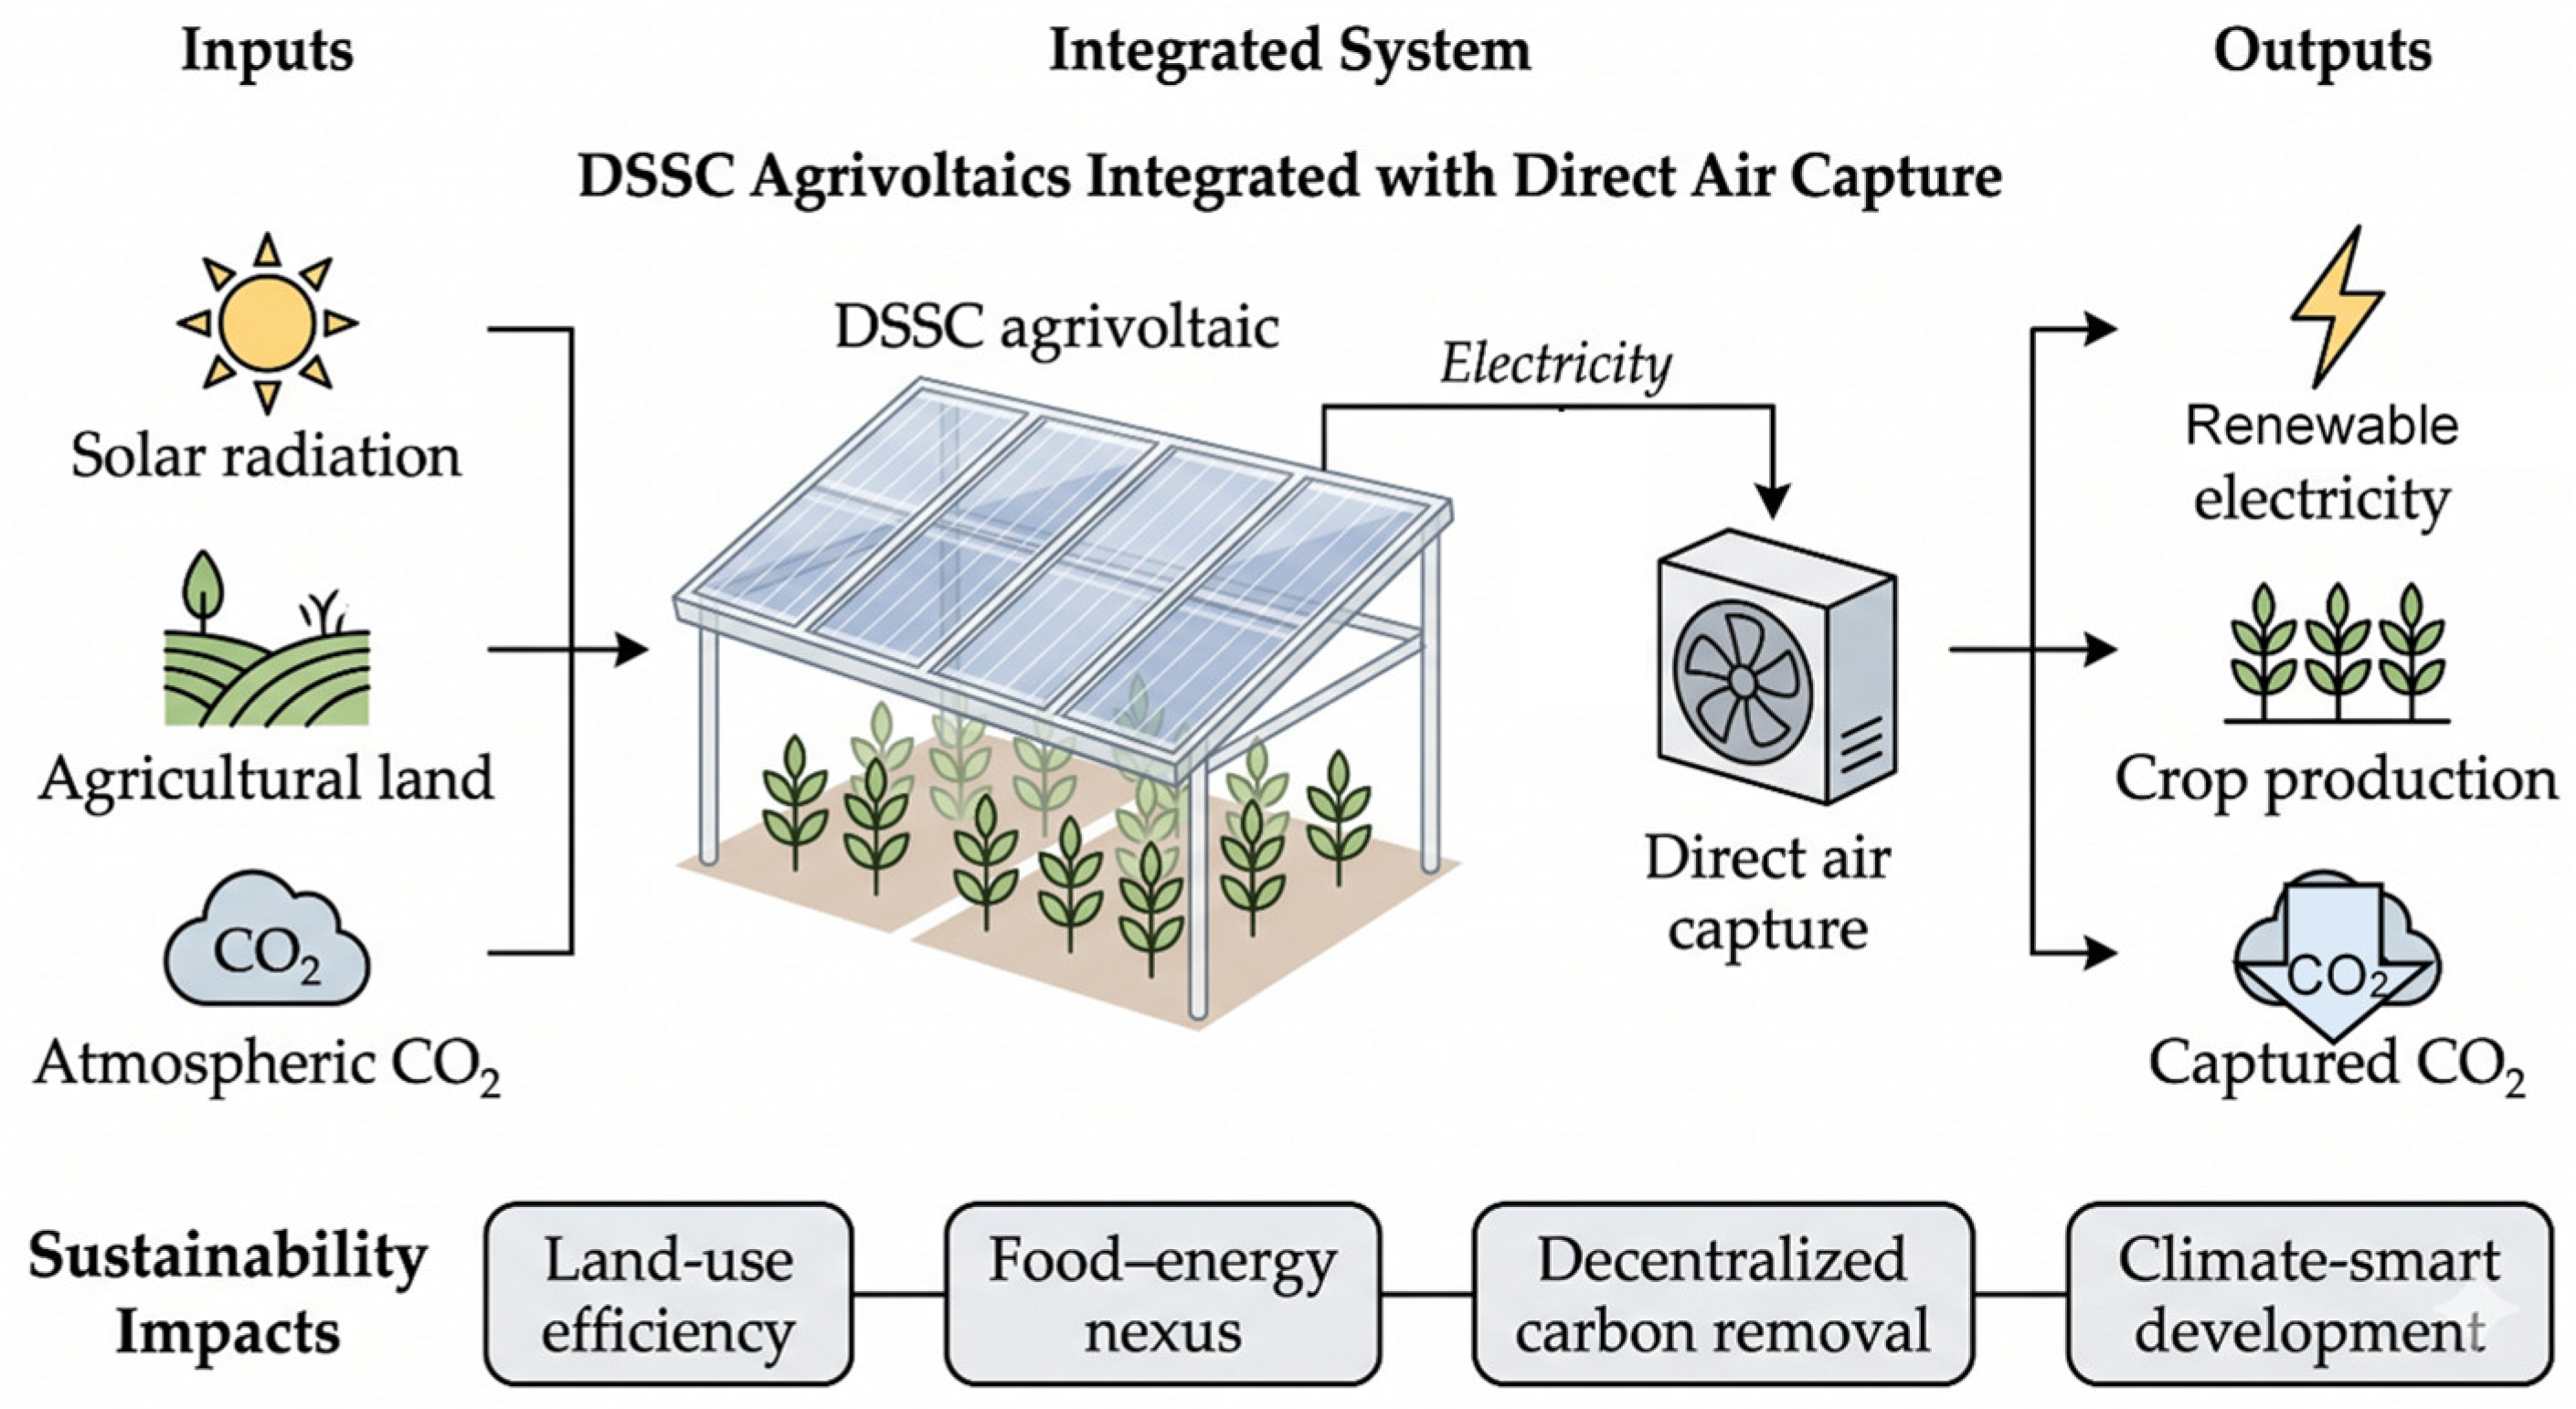
The integration of DSSC systems with direct air capture (DAC) further extends their relevance to climate policy. By using renewable electricity for localized carbon removal, such systems could contribute to distributed climate mitigation strategies, especially in urban, peri-urban, and agricultural regions where centralized carbon capture infrastructure may be difficult to deploy. The estimated CO2 removal potential indicates that semi-transparent photovoltaic systems could potentially function as both renewable-energy assets and electricity sources for decentralized carbon-management technologies. Figure 10 illustrates the conceptual framework of semi-transparent DSSC-based photovoltaic systems for potential agri-voltaic applications integrated with direct air capture.
Figure 10.
Conceptual framework of semi-transparent DSSC-based photovoltaic systems for potential agrivoltaic applications integrated with direct air capture.
For solar-energy planners, the results indicate that agrivoltaic technologies should be evaluated using both PV performance indicators and land-use compatibility indicators. In this context, semi-transparent DSSCs may offer value where maximizing electricity generation is not the only design objective and where crop-compatible solar deployment is prioritized.
Limitations and Future Research Needs
This study has several limitations. First, the analysis is based on simulated PV performance and literature-derived cell-level parameters rather than field-tested DPP13 DSSC modules. The extrapolation from a laboratory-scale cell to the assumed utility-scale system does not include experimentally validated module derating, manufacturing yield, module-to-module variability, or long-term field degradation and is therefore a key uncertainty of the assessment. In addition, the DSSC O&M cost was assumed to be equal to that of mono-c-Si for the five-year analysis period; DSSC-specific maintenance and major component replacements were not modeled, which may result in an optimistic estimate of the DSSC LCOE. Second, crop-specific responses to transmitted light, spectral distribution, shading, and microclimate were not modeled. Third, DSSC degradation, electrolyte stability, UV exposure, encapsulation durability, and long-term O&M requirements remain uncertain and may affect practical capacity factors and LCOE. Fourth, the DAC assessment is solely energy-based and does not include the physical design or spatial integration of DAC equipment with the photovoltaic system. Equipment footprint, land occupation, balance-of-plant infrastructure, grid connection, electricity storage, operational availability, hourly matching between PV output and DAC demand, and potential waste-heat utilization were not modeled. The analysis also excludes detailed equipment sizing and CO2 compression, transport, storage, or utilization. Therefore, the reported CO2-removal values represent theoretical annual electricity-allocation scenarios rather than the performance of a fully integrated PV–DAC facility. The membrane and redox-active DAC results represent separate literature-based technology scenarios at different stages of development. In particular, the low energy requirement assumed for the redox-active pathway is derived from laboratory-scale studies and has not been demonstrated in a continuous commercial DAC installation. The reported CO2 removal values therefore do not include technology-specific scale-up penalties, DAC capital cost, component degradation, or operational availability. Finally, the economic results depend on assumed capital costs, interest rates, IRR, and project lifetime; therefore, future work should include experimental validation, long-term degradation testing, crop-yield modeling, and detailed integrated PV–DAC process optimization.
5. Conclusions
This study presents a comparative techno-economic evaluation of semi-transparent dye-sensitized solar cell photovoltaic systems and monocrystalline silicon systems across two contrasting climatic regions, Karachi and Davis. The analysis also estimates the potential CO2 removal achievable when DSSC-generated electricity is allocated to selected direct air capture pathways. The results show that mono-c-Si systems generate more total electricity because of their greater installed capacity, whereas the modeled DSSC systems achieve comparable capacity factors and lower capital requirements under the assumptions adopted in this study. The estimated DSSC LCOE was 0.7% lower than that of mono-c-Si in Karachi and 10% lower in Davis.
The results support the consideration of semi-transparent DSSCs as a land-use-compatible photovoltaic technology for potential agrivoltaic applications rather than as an experimentally validated agrivoltaic system. The present analysis does not evaluate wavelength-resolved transmission, photosynthetically active radiation, crop growth, crop yield, or agricultural microclimate. Therefore, no conclusion can be drawn regarding the effect of the selected DPP13 DSSC on crop productivity.
The integration with DAC indicates that DSSC-generated renewable electricity could potentially support decentralized CO2 removal. However, the practical viability of the proposed concept depends on module-scale DSSC performance, long-term durability, realistic O&M requirements, DAC system integration, and crop-specific optical and biological validation. Future research should combine field-tested DSSC modules, PAR-transmission measurements, crop-growth experiments, long-term degradation studies, and integrated PV–DAC process analysis.
Supplementary Materials
The following supporting information can be downloaded at https://www.mdpi.com/article/10.3390/solar6050055/s1, Supplementary File S1: Detailed SAM Model Inputs.
Author Contributions
Conceptualization, A.A.K. and A.N.; methodology, A.N., J.R. and S.A.K.; software, J.R. and A.H.; validation, M.A., S.A.K. and S.A.S.; formal analysis, A.A.K., M.A. and A.H.; investigation, A.A.K., J.R. and M.A.; data curation, J.R., A.H. and M.A.; writing—original draft preparation, A.A.K., J.R. and M.A.; writing—review and editing, A.N., A.A.Z., S.A.K., and S.A.S.; visualization, J.R. and A.H.; supervision, A.N., A.A.Z. and S.A.S.; project administration, A.N. and S.A.S.; funding acquisition, A.A.Z. All authors have read and agreed to the published version of the manuscript.
Funding
This research was supported by Vital Green (Private) Ltd., Al-Hafeez Heights, Gulberg III, Lahore, Pakistan.
Institutional Review Board Statement
Not applicable.
Informed Consent Statement
Not applicable.
Data Availability Statement
The detailed SAM input parameters and model configurations used for all four simulation cases are provided in Supplementary File S1. The native editable SAM project files are retained by the authors and may be made available to the journal editor for verification upon reasonable request.
Acknowledgments
During the preparation of this work, the authors used ChatGPT 4.0 to refine writing and improve readability. The authors have reviewed and edited the AI-generated content as necessary and take full responsibility for the contents of this publication.
Conflicts of Interest
The authors declare no conflicts of interest.
References
- United Nations Environment Programme. Emissions Gap Report 2022: The Closing Window. Climate Crisis Calls for Rapid Transformation of Societies. In The Emissions Gap Report United Nations; United Nations: New York, NY, USA, 2022. [Google Scholar] [CrossRef] [Scilit]
- Olabanji, M.F.; Chitakira, M. A Review of Climate Change Impacts on Water Resources, Crop Production and Adaptation Strategies in South Africa. World 2026, 7, 73. [Google Scholar] [CrossRef] [Scilit]
- Baskaran, D.; Saravanan, P.; Nagarajan, L.; Byun, H.-S. An overview of technologies for capturing, storing, and utilizing carbon dioxide: Technology readiness, large-scale demonstration, and cost. Chem. Eng. J. 2024, 491, 151998. [Google Scholar] [CrossRef] [Scilit]
- Bouaboula, H.; Chaouki, J.; Belmabkhout, Y.; Zaabout, A. Comparative review of Direct air capture technologies: From technical, commercial, economic, and environmental aspects. Chem. Eng. J. 2024, 484, 149411. [Google Scholar] [CrossRef] [Scilit]
- Erans, M.; Sanz-Pérez, E.S.; Hanak, D.P.; Clulow, Z.; Reiner, D.M.; Mutch, G.A. Direct air capture: Process technology, techno-economic and socio-political challenges. Energy Environ. Sci. 2022, 15, 1360–1405. [Google Scholar] [CrossRef] [Scilit]
- Tregambi, C.; Bareschino, P.; Hanak, D.P.; Mancusi, E.; Montagnaro, F.; Pepe, F. Techno-economic assessment of a synthetic methane production process by hydrogenation of carbon dioxide from direct air capture. Int. J. Hydrogen Energy 2023, 48, 37594–37606. [Google Scholar] [CrossRef] [Scilit]
- Habib, M.I. Quantifying Solar Irradiation and Photovoltaic Energy Yield at Optimal Tilt Angles: A Case Study of Gojra, Punjab, Pakistan. J. Energy Mater. Sustain. 2026, 2, 18–38. [Google Scholar] [CrossRef] [Scilit]
- IEA. Renewables 2020; International Energy Agency: Paris, France, 2020; Available online: https://www.iea.org/reports/renewables-2020 (accessed on 28 April 2024).
- Torkington, S. 5 Charts That Show How Renewable Energy Generation Has Soared. Available online: https://www.weforum.org/agenda/2022/11/renewable-energy-generation-soars/ (accessed on 4 December 2023).
- Luna-Carlosama, C.F.; Jiménez-García, F.N. Impact of Agrivoltaic System Design on Productivity and Sustainability: A Systematic Review and Bibliometric Analysis. World 2026, 7, 71. [Google Scholar] [CrossRef] [Scilit]
- The Rise of Renewables-DNV. Available online: https://www.dnv.com/energy-transition-outlook/rise-of-renewables.html (accessed on 4 December 2023).
- Sarr, A.; Soro, Y.M.; Tossa, A.K.; Diop, L. A new approach for modelling photovoltaic panel configuration maximizing crop yield and photovoltaic array outputs in agrivoltaics systems. Energy Convers. Manag. 2024, 309, 118436. [Google Scholar] [CrossRef] [Scilit]
- Narayan, L. Solar Farm Market Size, Share, and Trends 2026 to 2035. Available online: https://www.precedenceresearch.com/solar-farm-market (accessed on 28 April 2024).
- Dinesh, H.; Pearce, J.M. The potential of agrivoltaic systems. Renew. Sustain. Energy Rev. 2016, 54, 299–308. [Google Scholar] [CrossRef] [Scilit]
- Dupraz, C.; Marrou, H.; Talbot, G.; Dufour, L.; Nogier, A.; Ferard, Y. Combining solar photovoltaic panels and food crops for optimising land use: Towards new agrivoltaic schemes. Renew. Energy 2011, 36, 2725–2732. [Google Scholar] [CrossRef] [Scilit]
- Marrou, H.; Wery, J.; Dufour, L.; Dupraz, C. Productivity and radiation use efficiency of lettuces grown in the partial shade of photovoltaic panels. Eur. J. Agron. 2013, 44, 54–66. [Google Scholar] [CrossRef] [Scilit]
- Baker, J.; Guler, M.; Medonna, A.; Li, Z.; Ghosh, A. Analysis of large-scale (1GW) off-grid agrivoltaic solar farm for hydrogen-powered fuel cell electric vehicle (HFCEV) charging station. Energy Convers. Manag. 2025, 323, 119184. [Google Scholar] [CrossRef] [Scilit]
- Macknick, J.; Hartmann, H.; Barron-Gafford, G.; Beatty, B.; Burton, R.; Seok-Choi, C.; Davis, M.; Davis, R.; Figueroa, J.; Garrett, A.; et al. The 5 Cs of Agrivoltaic Success Factors in the United States: Lessons from the InSPIRE Research Study; NREL/TP-6A20-83566; 1882930; MainId: 84339; National Renewable Energy Laboratory: Golden, CO, USA, 2022.
- Niazi, K.A.K.; Victoria, M. Comparative analysis of photovoltaic configurations for agrivoltaic systems in Europe. Prog. Photovolt. 2023, 31, 1101–1113. [Google Scholar] [CrossRef] [Scilit]
- Campana, P.E.; Stridh, B.; Amaducci, S.; Colauzzi, M. Optimisation of vertically mounted agrivoltaic systems. J. Clean. Prod. 2021, 325, 129091. [Google Scholar] [CrossRef] [Scilit]
- Riaz, M.H.; Imran, H.; Younas, R.; Alam, M.A.; Butt, N.Z. Module Technology for Agrivoltaics: Vertical Bifacial Versus Tilted Monofacial Farms. IEEE J. Photovolt. 2021, 11, 469–477. [Google Scholar] [CrossRef] [Scilit]
- Sarr, A.; Soro, Y.M.; Tossa, A.K.; Diop, L. Agrivoltaic, a Synergistic Co-Location of Agricultural and Energy Production in Perpetual Mutation: A Comprehensive Review. Processes 2023, 11, 948. [Google Scholar] [CrossRef] [Scilit]
- Darko, E.; Hamow, K.A.; Marček, T.; Dernovics, M.; Ahres, M.; Galiba, G. Modulated Light Dependence of Growth, Flowering, and the Accumulation of Secondary Metabolites in Chilli. Front. Plant Sci. 2022, 13, 801656. [Google Scholar] [CrossRef] [Scilit] [PubMed]
- Tang, Z.; Yu, J.; Xie, J.; Lyu, J.; Feng, Z.; Dawuda, M.M.; Liao, W.; Wu, Y.; Hu, L. Physiological and Growth Response of Pepper (Capsicum annum L.) Seedlings to Supplementary Red/Blue Light Revealed through Transcriptomic Analysis. Agronomy 2019, 9, 139. [Google Scholar] [CrossRef] [Scilit]
- Best Research-Cell Efficiency Chart|Photovoltaic Research|NREL. Available online: https://www.nrel.gov/pv/cell-efficiency.html (accessed on 4 December 2023).
- Danziger, N.; Bernstein, N. Light matters: Effect of light spectra on cannabinoid profile and plant development of medical cannabis (Cannabis sativa L.). Ind. Crops Prod. 2021, 164, 113351. [Google Scholar] [CrossRef] [Scilit]
- La Notte, L.; Giordano, L.; Calabrò, E.; Bedini, R.; Colla, G.; Puglisi, G.; Reale, A. Hybrid and organic photovoltaics for greenhouse applications. Appl. Energy 2020, 278, 115582. [Google Scholar] [CrossRef] [Scilit]
- Uchanski, M.; Hickey, T.; Bousselot, J.; Barth, K.L. Characterization of Agrivoltaic Crop Environment Conditions Using Opaque and Thin-Film Semi-Transparent Modules. Energies 2023, 16, 3012. [Google Scholar] [CrossRef] [Scilit]
- Allardyce, C.S.; Fankhauser, C.; Zakeeruddin, S.M.; Grätzel, M.; Dyson, P.J. The influence of greenhouse-integrated photovoltaics on crop production. Sol. Energy 2017, 155, 517–522. [Google Scholar] [CrossRef] [Scilit]
- Nema, A.; Kumar, A.; Warudkar, V. An in-depth critical review of different carbon capture techniques: Assessing their effectiveness and role in reducing climate change emissions. Energy Convers. Manag. 2025, 323, 119244. [Google Scholar] [CrossRef] [Scilit]
- Martins, I.S.; Fraga, G.; Zhou, S.; Sakheta, A.; Ramirez, J.; O’Hara, I. Techno-economic analysis of hydrogen production in the sugarcane industry by steam reforming of ethanol with carbon capture. Energy Convers. Manag. 2025, 328, 119635. [Google Scholar] [CrossRef] [Scilit]
- Chalkias, D.A.; Charalampopoulos, C.; Andreopoulou, A.K.; Karavioti, A.; Stathatos, E. Spectral engineering of semi-transparent dye-sensitized solar cells using new triphenylamine-based dyes and an iodine-free electrolyte for greenhouse-oriented applications. J. Power Sources 2021, 496, 229842. [Google Scholar] [CrossRef] [Scilit]
- Liu, Y.; Cheng, P.; Li, T.; Wang, R.; Li, Y.; Chang, S.-Y.; Zhu, Y.; Cheng, H.-W.; Wei, K.-H.; Zhan, X.; et al. Unraveling Sunlight by Transparent Organic Semiconductors toward Photovoltaic and Photosynthesis. ACS Nano 2019, 13, 1071–1077. [Google Scholar] [CrossRef] [Scilit] [PubMed]
- Xue, Q.; Xia, R.; Brabec, C.J.; Yip, H.-L. Recent Advances in Semi-Transparent Polymer and Perovskite Solar Cells for Power Generating Window Applications. Energy Environ. Sci. 2018, 11, 1688–1709. [Google Scholar] [CrossRef] [Scilit]
- Song, W.; Ge, J.; Xie, L.; Chen, Z.; Ye, Q.; Sun, D.; Shi, J.; Tong, X.; Zhang, X.; Ge, Z. Semi-transparent organic photovoltaics for agrivoltaic applications. Nano Energy 2023, 116, 108805. [Google Scholar] [CrossRef] [Scilit]
- Wang, Z.; Zhu, X.; Feng, J.; Yang, D.; Liu, S. Semitransparent Flexible Perovskite Solar Cells for Potential Greenhouse Applications. Sol. RRL 2021, 5, 2100264. [Google Scholar] [CrossRef] [Scilit]
- Wakeel, M.; Chen, B.; Jahangir, S. Overview of Energy Portfolio in Pakistan. Energy Procedia 2016, 88, 71–75. [Google Scholar] [CrossRef] [Scilit]
- California Department of Food and Agriculture. 2022–2023 California Agricultural Statistics Review; California Department of Food and Agriculture: Sacramento, CA, USA, 2024. Available online: https://www.cdfa.ca.gov/Statistics/PDFs/2022-2023_california_agricultural_statistics_review.pdf (accessed on 2 May 2024).
- Soumhi, M.; Zalim, Y.; Ahmadi, Z.E.; El Hamdani, F.; Bouzekri, H. Comparative study of supercritical CO2 brayton cycles for solar towers plants in arid climates: Design and off-design performance. Energy Convers. Manag. 2025, 337, 119902. [Google Scholar] [CrossRef] [Scilit]
- Komrit, S.; Zabihian, F. Comparative analyses of solar photovoltaic, wind turbine, and solar photovoltaic and wind turbine hybrid systems: Case study of Thailand. Energy Convers. Manag. 2023, 293, 117479. [Google Scholar] [CrossRef] [Scilit]
- Guzman, L.; Henao, A.; Vasquez, R. Simulation and Optimization of a Parabolic Trough Solar Power Plant in the City of Barranquilla by Using System Advisor Model (SAM). Energy Procedia 2014, 57, 497–506. [Google Scholar] [CrossRef] [Scilit]
- Sadiq, M.; Kokchang, P.; Kittipongvises, S. Comparative Techno-Economic Evaluation of a Standalone Solar Power System for Scaled Implementation in Off-Grid Areas. Energies 2023, 16, 6262. [Google Scholar] [CrossRef] [Scilit]
- Veerendra Kumar, D.J.; Deville, L.; Ritter, K.A., III; Raush, J.R.; Ferdowsi, F.; Gottumukkala, R.; Chambers, T.L. Performance Evaluation of 1.1 MW Grid-Connected Solar Photovoltaic Power Plant in Louisiana. Energies 2022, 15, 3420. [Google Scholar] [CrossRef] [Scilit]
- Kim, Y.; Skaggs, A. A Multi-Stage Approach to Assessing the Echo-Tech Feasibility of a Hybrid SAM-CREST Model for Solar PV Power Plants in Maryland, USA. Solar 2024, 4, 246–268. [Google Scholar] [CrossRef] [Scilit]
- Imam, A.A.; Al-Turki, Y.A.; R., S.K. Techno-Economic Feasibility Assessment of Grid-Connected PV Systems for Residential Buildings in Saudi Arabia—A Case Study. Sustainability 2020, 12, 262. [Google Scholar] [CrossRef] [Scilit]
- Bureau, S.N. Trina Solar Supplies 800 MW Solar Modules to 2 GW Al Dhafra PV Power Plant. Available online: https://www.saurenergy.com/solar-energy-news/trina-solar-supplies-800-mw-solar-modules-to-2-gw-al-dhafra-pv-power-plant (accessed on 8 February 2026).
- Sadiq, M.; Mayyas, A.; Rochedo, P.R.R. Comprehensive techno-economic assessment of Green-Ammonia@Scale production. Clean. Eng. Technol. 2025, 26, 100964. [Google Scholar] [CrossRef] [Scilit]
- Dobos, A. PVWatts Version 5 Manual; NREL/TP-6A20-62641; National Renewable Energy Laboratory: Golden, CO, USA, 2014.
- Keith, J.; Mirletz, B.; Prilliman, M.; Janzou, S.; Gilman, P.; Blair, N.; Deline, C.; Guittet, D.; Ovaitt, S. Foundational Open-Source Solar and Storage Modeling through the System Advisor Model and PVWatts Platforms: FY22-24 Final Technical Report; NREL/TP--7A40-92372; MainId:94153; UUID:77cd31ce-bddd-44d7-aed3-67b72d0122d5; MainAdminId:75669; National Renewable Energy Laboratory: Golden, CO, USA; USDOE Office of Energy Efficiency and Renewable Energy (EERE): Washington, DC, USA, 2025. [CrossRef] [Scilit] [PubMed]
- Yum, J.-H.; Holcombe, T.W.; Kim, Y.; Rakstys, K.; Moehl, T.; Teuscher, J.; Delcamp, J.H.; Nazeeruddin, M.K.; Grätzel, M. Blue-Coloured Highly Efficient Dye-Sensitized Solar Cells by Implementing the Diketopyrrolopyrrole Chromophore. Sci. Rep. 2013, 3, 2446. [Google Scholar] [CrossRef] [Scilit] [PubMed]
- Ursu, D.; Vajda, M.; Miclau, M. Highly efficient dye-sensitized solar cells for wavelength-selective greenhouse: A promising agrivoltaic system. Int. J. Energy Res. 2022, 46, 18550–18561. [Google Scholar] [CrossRef] [Scilit]
- PVWatts Calculator. Available online: https://pvwatts.nrel.gov/pvwatts.php (accessed on 21 April 2024).
- Blair, N.J.; DiOrio, N.A.; Freeman, J.M.; Gilman, P.; Janzou, S.; Neises, T.W.; Wagner, M.J. System Advisor Model (SAM) General Description (Version 2017.9.5); National Renewable Energy Laboratory: Golden, CO, USA, 2018.
- Agency, P.N. Pakistan’s CPI Forecasted to Reach 7.2% in February Amid Steady Policy Rate, PPI News Agency. Available online: https://ppinewsagency.com/pakistans-cpi-forecasted-to-reach-7-2-in-february-amid-steady-policy-rate/ (accessed on 16 March 2026).
- Moore Global. Pakistan Tax Guide. Available online: https://www.moore-global.com/services/tax/international-corporate-tax/pakistan/ (accessed on 16 March 2026).
- Shahnawaz, F. SBP KIBOR Rates for March 11, 2026–Daily Update. Available online: https://pkrevenue.com/sbp-releases-daily-kibor-rates-for-march-11-2026/ (accessed on 16 March 2026).
- Hrung, W. The Federal Reserve’s Monetary Policy Framework: The 2025 Review. Available online: https://bankingjournal.aba.com/2025/09/the-federal-reserves-monetary-policy-framework-the-2025-review/ (accessed on 16 March 2026).
- Table US2–U.S. Federal Tax–Corporations–2025|Raymond Chabot Grant Thornton. Available online: https://www.rcgt.com/en/tax-planning-guide/tables/4-corporate-taxation-and-u-s-federal-tax-rates/u-s-federal-tax-corporations/ (accessed on 16 March 2026).
- Secured Overnight Financing Rate (Market Daily)-United States. Available online: https://ycharts.com/indicators/sofr?utm_source=newsletter.cobaltintelligence.com&utm_medium=referral&utm_campaign=fed-holds-at-3-5-regional-banks-now-chasing-commercial-deals (accessed on 16 March 2026).
- IRENA. Renewable Power Generation Costs in 2023; International Renewable Energy Agency: Abu Dhabi, United Arab Emirates, 2024. [Google Scholar]
- Basore, P.; Dummit, K.; Ellis, C.; Peng, P.; Benoliel, P.; Hendrickson, T.; Feldman, D.; Ramasamy, V.; Woodhouse, M.; Zuboy, J.; et al. Q1-2024 Solar Cost Benchmarks. In National Laboratory of the Rockies; Department of Energy: Washington, DC, USA, 2026; p. 1. [Google Scholar] [CrossRef]
- Dirnbacher, M.; Bürger, M. ‘The costs of solar broken down’, Electrifying. Available online: https://www.electrifying.world/the-costs-of-solar-broken-down/ (accessed on 21 April 2024).
- Syed, T.H.; Wei, W. Technoeconomic Analysis of Dye Sensitized Solar Cells (DSSCs) with WS2/Carbon Composite as Counter Electrode Material. Inorganics 2022, 10, 191. [Google Scholar] [CrossRef] [Scilit]
- Castro-Muñoz, R.; Ahmad, M.Z.; Malankowska, M.; Coronas, J. A new relevant membrane application: CO2 direct air capture (DAC). Chem. Eng. J. 2022, 446, 137047. [Google Scholar] [CrossRef] [Scilit]
- Fujikawa, S.; Selyanchyn, R.; Kunitake, T. A new strategy for membrane-based direct air capture. Polym. J. 2021, 53, 111–119. [Google Scholar] [CrossRef] [Scilit]
- Seo, H.; Hatton, T.A. Electrochemical direct air capture of CO2 using neutral red as reversible redox-active material. Nat. Commun. 2023, 14, 313. [Google Scholar] [CrossRef] [Scilit] [PubMed]
- Voskian, S.; Hatton, T.A. Faradaic electro-swing reactive adsorption for CO2 capture. Energy Environ. Sci. 2019, 12, 3530–3547. [Google Scholar] [CrossRef] [Scilit]
- Rahimi, M.; Khurram, A.; Hatton, T.A.; Gallant, B. Electrochemical carbon capture processes for mitigation of CO2 emissions. Chem. Soc. Rev. 2022, 51, 8676–8695. [Google Scholar] [CrossRef] [Scilit] [PubMed]

Disclaimer/Publisher’s Note: The statements, opinions and data contained in all publications are solely those of the individual author(s) and contributor(s) and not of MDPI and/or the editor(s). MDPI and/or the editor(s) disclaim responsibility for any injury to people or property resulting from any ideas, methods, instructions or products referred to in the content. |
© 2026 by the authors. Licensee MDPI, Basel, Switzerland. This article is an open access article distributed under the terms and conditions of the Creative Commons Attribution (CC BY) license.