


Abstract
In recent years, cascaded hydropower (CHP) has been extensively leveraged to enhance the grid-connected penetration of photovoltaic (PV) generation. However, the inherent stochasticity and volatility of high-penetration PV often lead to significant renewable curtailment. To address this challenge, this paper proposes a coordinated day-ahead and intra-day scheduling model that incorporates curtailment risk assessment. The proposed framework employs a two-stage optimization architecture: the day-ahead stage establishes a baseline dispatch schedule with the objective of maximizing total energy production, while the intra-day stage refines this plan through multi-scenario optimization that explicitly accounts for curtailment risk. This synergistic mechanism achieves the objective of “maximizing day-ahead economic benefits and ensuring intra-day renewable accommodation”. Case studies on a specific river basin demonstrate the effectiveness of the proposed model. Simulation results indicate that, compared to conventional energy-maximization approaches, the proposed model significantly reduces intra-day curtailment rates and substantially enhances the integrated accommodation capacity of the hydro–solar hybrid system.
1. Introduction
Under the global impetus for energy transition, the installed capacity of Variable Renewable Energy (VRE), particularly photovoltaic (PV) power, has escalated significantly, serving as a pivotal pathway toward carbon neutrality goals [1,2,3]. However, the inherent stochasticity, volatility, and non-dispatchability of PV pose formidable challenges to the stable operation of power grids [4]. Developing hydro–solar hybrid systems is widely recognized as an effective solution [5]. Leveraging superior regulation capabilities and large-scale storage advantages, hydropower has evolved from a traditional energy supplier into the most critical flexible resource within power systems, assuming the responsibility of smoothing PV fluctuations and ensuring grid security [6,7]. Currently, hydropower-rich regions such as Southwest China are actively promoting hydro–solar integrated energy bases, forming a collaborative operational pattern characterized by bundled integration and shared transmission corridors [8,9].
To improve the economic benefits of hydro–PV complementary systems, previous studies have primarily focused on scheduling models that maximize total energy production. These approaches typically rely on deterministic optimization based on day-ahead forecasts. For example, traditional mathematical programming methods, such as mixed-integer linear programming (MILP) and dynamic programming (DP) [10,11], are commonly used to optimize cascaded hydro–solar generation. Furthermore, various heuristic algorithms [12,13] have been applied to determine dispatch schedules for maximum energy output. However, their day-ahead scheduling plans are usually based on PV forecasts. Executing these fixed plans causes critical difficulties when actual PV output fluctuates during intra-day operation. First, regarding grid stability, the total output of the hydro–PV system must closely track the established load curve. This tracking ensures the stability of the residual load. However, intra-day PV forecast errors often cause the actual total output to severely deviate from this curve. This deviation threatens the stable operation of the receiving-end grid [14,15,16]. Second, regarding economic efficiency, rigidly executing the day-ahead plan during intra-day PV fluctuations easily triggers power curtailment. The system is constrained by transmission capacity and the physical limits of hydropower regulation. As a result, surplus PV power is difficult to fully accommodate. This significantly reduces renewable energy utilization and causes energy waste [17,18].
To address the limitations of these rigid energy-maximization strategies, existing studies have extensively explored ways to improve grid stability and accommodate forecast errors. Their core ideas mostly focus on optimizing the residual load curve and smoothing renewable energy output fluctuations. Regarding peak shaving and valley filling, several studies aim to minimize the peak-to-valley difference of the residual load. They deeply investigate how hydropower compensates for the uncertainties of wind and solar power. For example, Liu et al. [19] introduced chance-constrained programming and successive linear programming methods for problem-solving, respectively. Wu et al. [20] proposed a hybrid strategy. It generates initial solutions via conceptual scheduling and then applies mixed-integer linear programming for secondary optimization. This approach further improves the peak-shaving efficiency of the joint system. Marneris et al. [21] constructed a multi-time-scale scheduling framework. This framework effectively handles severe short-term fluctuations in the net load. Zhang et al. [22] proposed a stochastic expected peak shaving model based on stochastic programming theory, thereby effectively solving the peak shaving problem caused by the uncertainty of wind and photovoltaic power in high-proportion renewable energy grids. For cascaded hydro–PV complementary systems, Wang et al. [23] developed a two-stage robust optimization model. This model is based on the nested column-and-constraint generation algorithm and aims to eliminate power imbalances. Lin et al. [11] proposed a bi-level multi-objective architecture. It coordinates the long-term economic scheduling and short-term grid peak shaving for large-scale systems. Furthermore, researchers have introduced specific metrics to scientifically quantify the operational benefits of these systems. These include load-tracking indices [24] and comprehensive evaluation methods for peak shaving and valley filling [25]. They provide objective support for evaluating system scheduling performance.
To reduce power curtailment risk and improve renewable energy accommodation, existing studies use advanced mathematical paradigms. These paradigms effectively quantify and address source-load uncertainties. Regarding stochastic optimization and probability constraints, Du et al. [26] utilized adaptive diffusion kernel density estimation combined with stochastic optimal scheduling. This approach effectively reduced wind and solar curtailment rates. Zhang et al. [27] used chance-constrained programming to ensure that reserve capacity smoothes actual output fluctuations. This achieves effective control of curtailment risk. However, exact probability distributions are often difficult to obtain. To overcome this limitation, distributionally robust optimization (DRO) is widely applied. Jin et al. [28] built a distributionally robust model based on the Wasserstein distance. This model achieves balanced scheduling between risk control and economic operation. Lu et al. [29] also adopted DRO combined with a two-stage, multi-period scheduling strategy. Under uncertain environments, this approach balances system economy, security, and curtailment risks. In addition, some scholars further suppress curtailment by exploring system flexibility and innovative scheduling architectures. Han et al. [30] innovatively coordinated two flexible resources—power regulation and frequency response—in day-ahead scheduling. This significantly reduced the curtailment risk of hydro–wind hybrid systems. Guo et al. [31] developed a bi-level nested optimization framework integrating multi-objective differential evolution. This framework accurately avoids curtailment risks caused by forecast errors.
However, most existing studies treat day-ahead scheduling and intra-day adjustment in isolation. They lack a systematic two-stage coordination mechanism. Furthermore, few models can simultaneously consider output curve tracking and curtailment risk management. Conventional day-ahead plans lack effective feedback from intra-day fluctuations. Consequently, they lack robustness. When facing intra-day uncertainties, the system either struggles to maintain the established output curve or faces severe PV curtailment dilemmas. To address these shortcomings, this paper proposes a risk-aware, coordinated day-ahead and intra-day two-stage scheduling model. This model is designed for multi-subsystem hydro–solar hybrid systems. By quantitatively analyzing the curtailment risk, the proposed method aims to resolve the conflict between output curve tracking and PV accommodation. The main contributions of this paper are as follows:
- Proposal of a scheduling mechanism incorporating curtailment risk. The curtailment risk arising from local transmission constraints, aggregate transmission saturation, and scheduled profile violation is analytically dissected. This enables precise characterization of the integrated risk across different seasonal inflows and PV penetration levels.
- Validation of the effectiveness and robustness of the coordinated day-ahead and intra-day model. Through experimental analysis of typical scenarios in a specific river basin, the superior performance of the proposed model in enhancing renewable accommodation is demonstrated.
2. Mathematical Model Formulation
Conventional deterministic scheduling models often focus solely on maximizing total energy production based on day-ahead forecasts. However, these methods typically lack robustness and fail to reserve sufficient regulation margins. Consequently, when facing severe intra-day PV volatility, they struggle to accommodate forecast errors, inevitably leading to massive passive curtailment. To address these limitations, a two-stage cascade hydropower–PV coordinated scheduling model is developed, consisting of a day-ahead planning phase and an intra-day adjustment phase. The proposed model aims to accurately track the target load curve in the day-ahead stage while proactively minimizing PV curtailment risk across multiple intra-day scenarios, subject to complex hydraulic couplings and transmission capacity constraints.
2.1. Objective Functions
Stage 1: Maximization of Day-Ahead Generation Revenue:
In the day-ahead scheduling stage, the objective is to maximize the total generation revenue over the scheduling horizon by optimizing the aggregated output of the hybrid system:
where is the planned total output of the hybrid system at time interval t in the day-ahead stage, which is the sum of hydropower generation and grid-connected PV power:
where is the power output of hydropower plant r at time t, and is the grid-connected PV power associated with plant r in the day-ahead stage.
Stage 2: Minimization of Intra-Day PV Curtailment Risk:
In the intra-day operational phase, the inherent uncertainty of PV generation causes the actual system output to deviate from the load demand of the receiving grid. To address this, the proposed model allows a degree of deviation allowance for the total system output relative to the day-ahead dispatch schedule, rather than enforcing rigid tracking. Specifically, the second-stage objective is to minimize the expected renewable curtailment across multiple scenarios while simultaneously considering the tracking precision of the scheduled profile:
where J is the total number of PV output scenarios; is the probability of occurrence for intra-day scenario j; and represent the total system output and the system curtailment power at time t under scenario j, respectively. The parameter is a predefined weighting coefficient introduced to balance the trade-off between the tracking precision of the day-ahead schedule and the expected PV curtailment risk. A lower prioritizes renewable accommodation by penalizing curtailment more heavily, thereby allowing larger profile deviations; conversely, a higher enforces stricter adherence to the day-ahead target load profile at the expense of higher potential curtailment.
The first term of the objective function is the profile deviation penalty, which characterizes the degree of divergence between the actual intra-day output and the day-ahead dispatch schedule. The second term is the curtailment risk penalty, representing the expected renewable curtailment across the generated scenarios. By employing a weighted summation, the model achieves a synergistic optimization between “profile tracking precision” and “intra-day accommodation capacity”. Effectively, this formulation seeks an optimal equilibrium between the accuracy of load tracking and the sufficiency of renewable accommodation.
The actual system output under scenario j is expressed as
where is the grid-connected PV power associated with plant r at time t under scenario j in the intra-day stage.
2.2. Hydropower Operation Constraints
The operation of cascade hydropower plants must satisfy the following hydraulic and physical constraints:
- 1.
- Water balance equation:
- 2.
- Cascade hydraulic connection:
- 3.
- Upper and lower bounds:
- 4.
- Stage-storage relationship:
- 5.
- Tailwater elevation relationship:
- 6.
- Initial and final water level constraints:
- 7.
- Water head and power generation:
2.3. System Output Planning and PV Accommodation
The day-ahead total output is determined based on the grid load demand:
where is a proportionality coefficient, and is the forecasted load at time t. Three types of load profiles are considered: double-peak, single-peak, and flat.
The PV power generation and curtailment satisfy the following relationships:
- Day-ahead stage:
- Intra-day stage under scenario j:
where and are the total PV power outputs in the day-ahead and intra-day stages, respectively; and represent the corresponding curtailed PV power.
3. Case Study
3.1. System Description
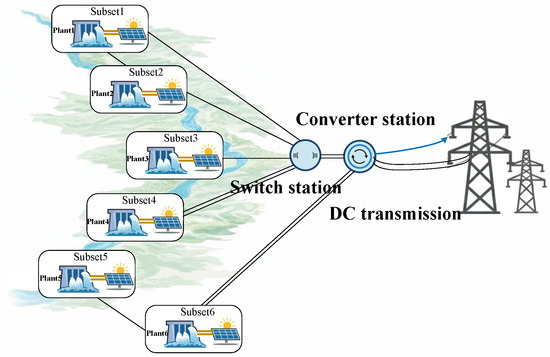
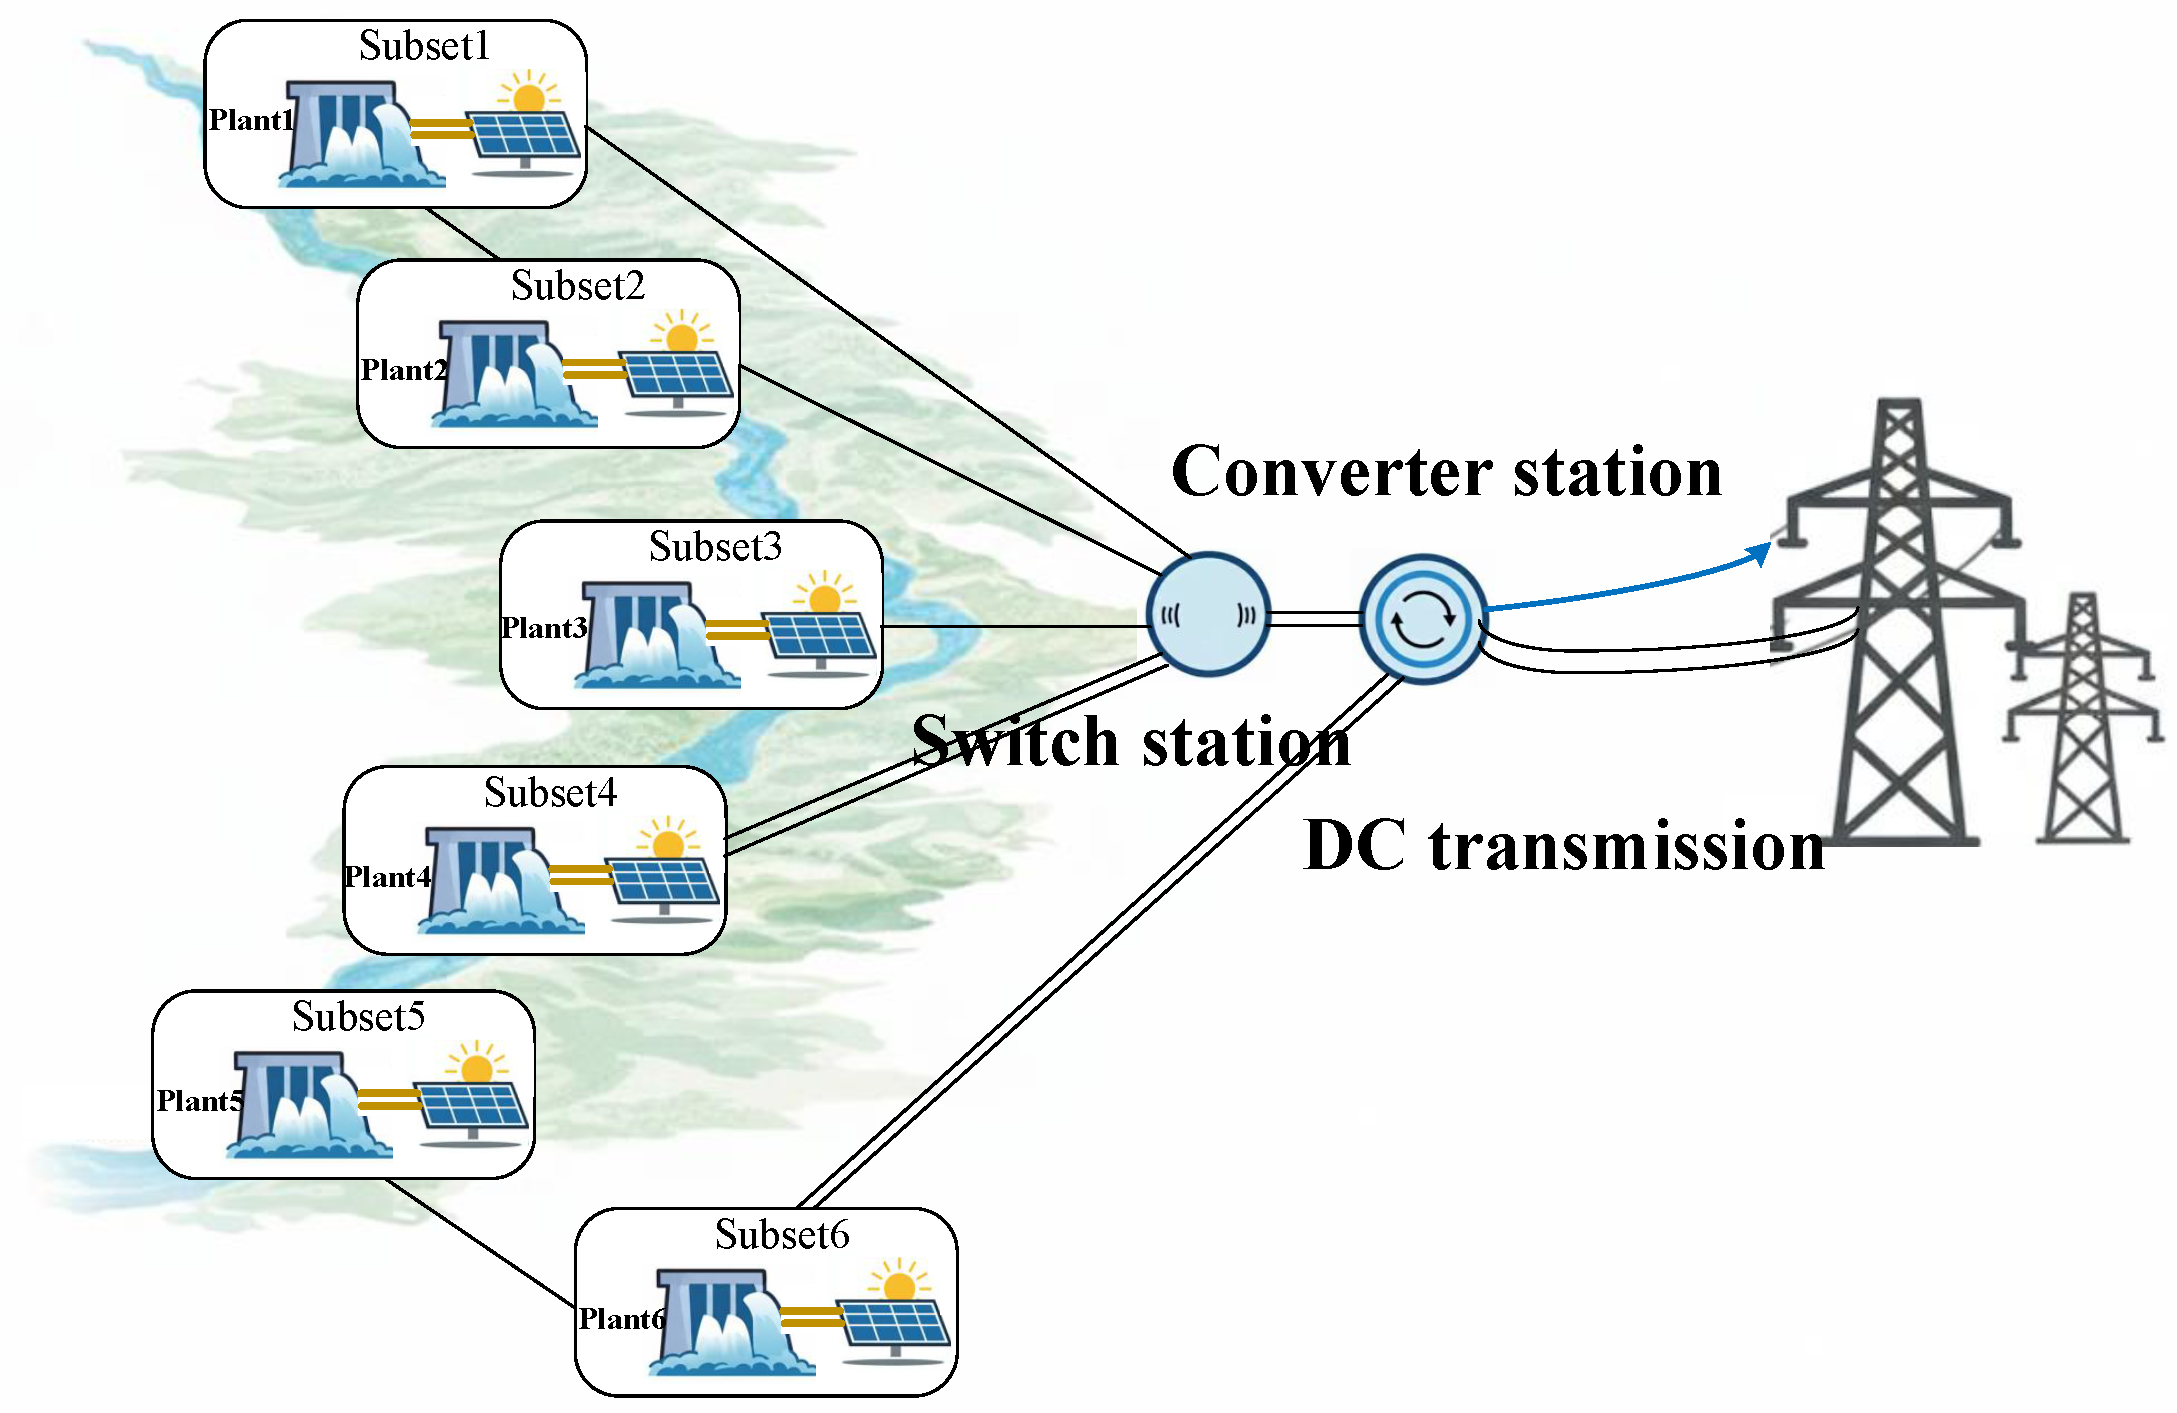
In this paper, a cascaded hydropower system consisting of six cascaded hydropower stations with sub-seasonal regulation capacities, along with their respective bundled PV plants, is selected as the research object. Each hydropower station and its bundled PV plant form a complementary system subset, and these six subsets collectively constitute a basin-scale cascaded hydro–PV complementary system. The topological structure of the system, including the bundling configuration and transmission corridors, is illustrated in Figure 1.
Figure 1.
Schematic diagram of the cascaded hydro–PV complementary system topology.
The installed capacities of the six hydropower plants are listed in Table 1.
Table 1.
Installed capacities of cascade hydropower plants.
3.2. PV Scenario Generation
To quantify the PV curtailment risk arising from uncertainty, a scenario-based approach is adopted to generate a typical set of PV output scenarios, including one baseline scenario (day-ahead forecast) and ten intra-day fluctuation scenarios. The generation procedure is as follows:
- Baseline scenario extraction: The mean output curve is derived from historical PV generation data for each month, serving as the baseline scenario.
- Deviation distribution assumption: The upper and lower envelopes of historical PV outputs are identified, and the fluctuation deviations are assumed to follow a normal distribution.
- Scenario sampling: Ten discrete scenarios are constructed via stratified sampling based on historical power output envelopes. To capture temporal correlations, first-order autoregressive noise is superimposed on the mean historical profile. Each scenario is assigned a probability weight using the standard normal density function and normalized, ensuring that central scenarios have higher probabilities than extreme ones.
- Scenario scaling: The generated PV scenarios are scaled proportionally according to the installed capacity of each corresponding hydropower plant and the PV integration ratio . With taking values of 0.2, 0.4, 0.6, and 0.8, the installed PV capacity vector for each subset is given bywhere is the installed capacity of the hydropower plant r.
3.3. Transmission Corridor Architecture and Incidence Matrix Modeling
The hydro–PV complementary system considered in this study comprises six hydropower plants and their associated PV clusters. To accurately characterize the curtailment behavior of such a multi-subset system under complex transmission constraints, this subsection defines the transmission corridor architecture and the spatial incidence matrix.
As illustrated in Figure 1, the six subsets are connected to the main grid through four key transmission corridors:
- Corridor I: Bundled output from Subsets 1–3
- Corridor II: Independent output from Subset 4
- Corridor III: Bundled output from Subsets 5–6
- Corridor IV: Aggregation of the above three corridors, constrained by the total system export capacity
The capacity limits of these corridors are summarized in Table 2.
Table 2.
Transmission corridor capacity limits.
To mathematically decouple the subset outputs from corridor constraints, a spatial incidence matrix is constructed, where m denotes the corridor index, and k denotes the subset index. The element is defined as
Based on the corridor design described above, the incidence matrix is given by
3.4. Three Typical Curtailment Scenarios Induced by Spatial Constraints
Under the constraints imposed by the incidence matrix , the curtailment risk exhibits significant spatial heterogeneity. Based on this, three typical curtailment scenarios are classified as follows:
3.4.1. Local Corridor Congestion
When PV generation surges within a specific corridor, the branch capacity limit may be triggered, necessitating active curtailment even if the total transmission capacity remains underutilized. This type of curtailment can be expressed as
3.4.2. Total Export Congestion
When all sub-corridors operate below their individual limits, but the total system export capacity is reached, system-wide regulatory curtailment occurs. This is formulated as
3.4.3. Profile Constraint-Induced Curtailment
When hydropower plants lack sufficient regulation capacity to further accommodate PV generation, curtailment arises from the inability to follow the planned output profile. This reflects the deviation of actual output from the day-ahead schedule and is incorporated as a penalty term in the objective function:
where and are selection vectors used to extract overload values for specific corridors; and represent the vectors of minimum hydropower output and PV output, respectively; is the vector of corridor capacity limits, including both local and total export constraints.
3.4.4. Unified Curtailment Risk Expression
Considering the three types of curtailment risks described above, the total curtailment risk for scenario j at time t can be unified as
Equation (27) reflects the physical bottlenecks in actual grid operations. PV curtailment is caused by three specific situations:
- Local congestion: PV generation on a specific branch surges, and the local hydropower cannot decrease its output enough, exceeding the branch’s transmission limit.
- Total congestion: The system-wide PV generation surges, exceeding the capacity of the total export corridor.
- Profile constraints: Even when there is no transmission congestion, PV must be curtailed to make the total hydro–PV output exactly follow the target load curve.
In reality, these three types of curtailment are not added together. The actual curtailment is simply the maximum of these three values.
4. Results and Analysis
In this section, multiple sets of experiments are conducted to validate the effectiveness of the proposed model, covering various combinations of PV penetration levels, seasonal runoff characteristics, and load profiles. Section 4.1 analyzes the system’s tracking capability across different load profiles and evaluates its physical rationality. Section 4.2 assesses the curtailment risk under multi-level transmission constraints. Section 4.3 verifies the robustness of the proposed model through 100 sets of stochastic scenarios. All simulation experiments are implemented in Python 3.13 on a workstation equipped with an AMD Ryzen 9 8945HX processor and 32 GB of RAM. The resulting optimization problems are solved using the Gurobi optimizer.
4.1. Synergistic Characteristics Analysis of Day-Ahead and Intra-Day Output Profiles
To validate the regulation capability of the proposed model regarding the scheduled profile under varying conditions, a typical scenario with a PV capacity ratio of 0.6 is selected to analyze the output characteristics across different seasons and demand patterns. Specifically, October and January are selected as representative operational conditions, with three types of scheduled profiles configured: single-peak, double-peak, and steady-state. Considering the significant increase in natural inflow during July (the flood season), the cascaded hydropower units operate under high-load conditions for extended periods, which constrains the system’s regulation capacity. Therefore, only the typical operational characteristics are analyzed for the flood season, without distinguishing between scheduled profile types.
Prior to evaluating the comprehensive system performance, it is necessary to determine the optimal weighting coefficient in Equation (3). This parameter governs the trade-off between profile tracking precision and renewable curtailment risk. A sensitivity analysis is conducted using the October single-peak scenario with a PV ratio of 0.6. As detailed in Table 3, a larger enforces stricter adherence to the scheduled profile. This raises the tracking precision () from 0.84 to 0.99. However, this operational rigidity restricts the system’s flexibility to absorb PV fluctuations. Consequently, the curtailment rate increases from 10.97% to 17.93%. We identify as the optimal equilibrium point. At this setting, the tracking precision reaches a highly satisfactory level (). Meanwhile, the curtailment rate remains at a moderate 16.16%. Consequently, is adopted for all subsequent experiments.
Table 3.
Impact of the weighting coefficient on tracking precision and renewable curtailment.
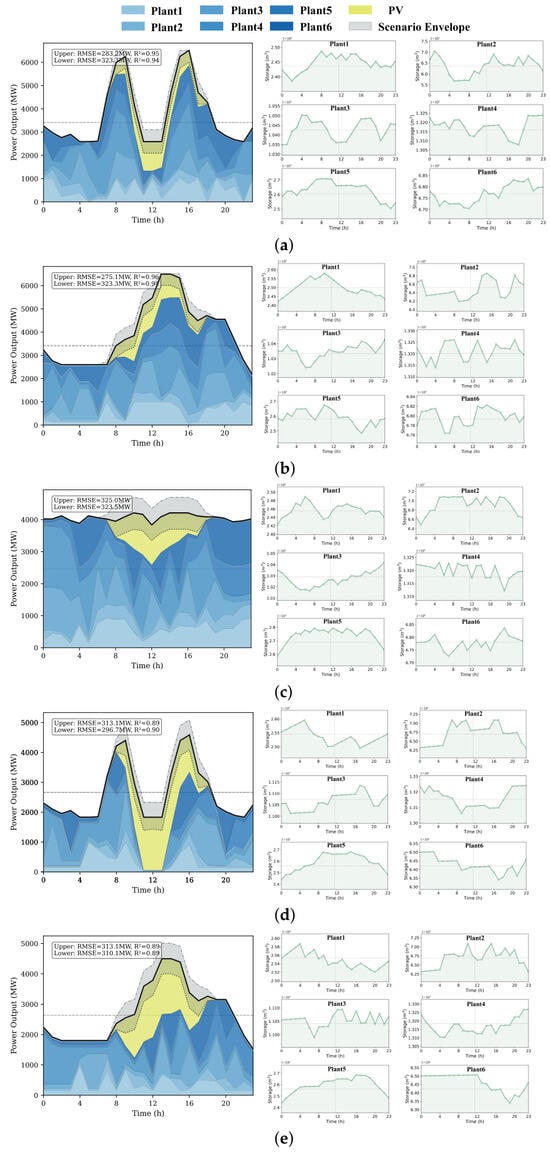
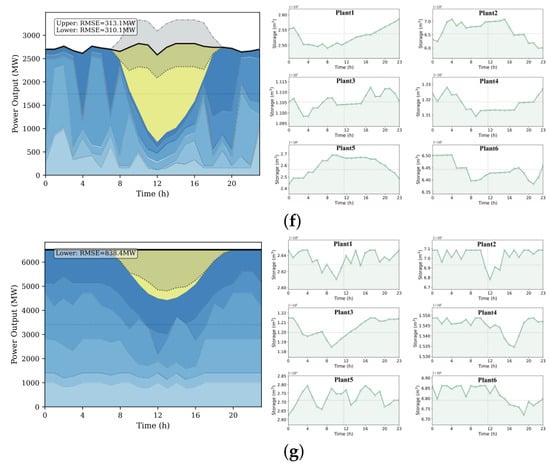
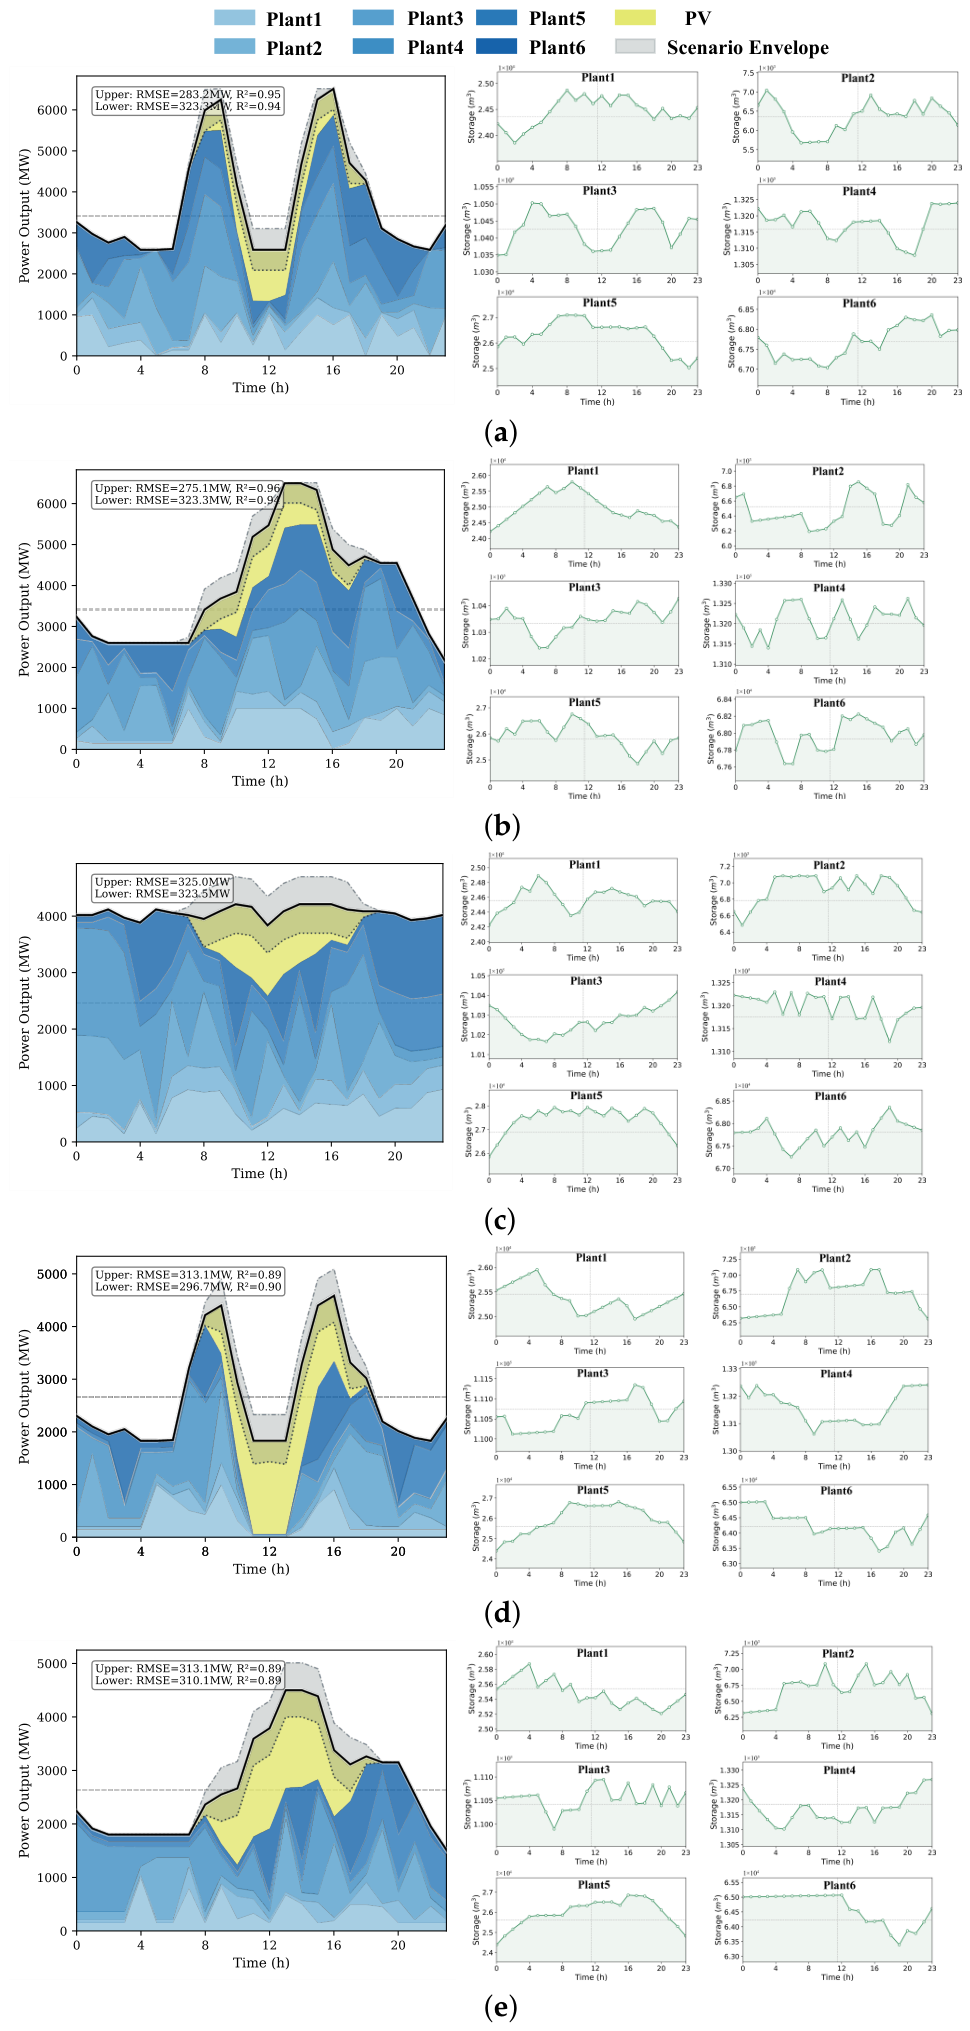
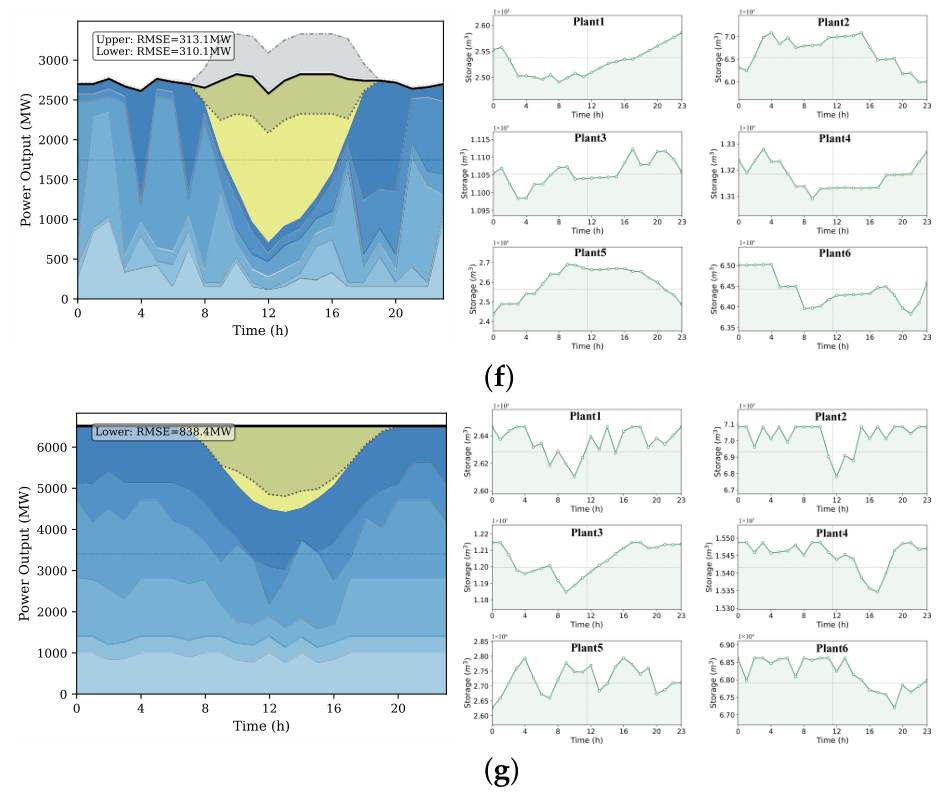
By applying the proposed model with the optimal parameter (), we obtain the total system output and reservoir storage variations for each cascaded station. Figure 2 illustrates the simulation results for all selected cases. In these visualizations, varying shades of blue denote the power contributions from individual hydropower stations. Yellow represents PV generation, and the solid black line indicates the baseline scheduled profile. The results demonstrate that the total system output tightly aligns with the target demand curve across different seasons, verifying that the day-ahead dispatch effectively achieves its tracking objective.
Figure 2.
Total system output and hydropower distribution of the cascaded hydro–PV complementary system under various seasonal and export curve conditions (weighting coefficient ): (a) October, dual-peak; (b) October, single-peak; (c) October, steady-state; (d) January, dual-peak; (e) January, single-peak; (f) January, steady-state; (g) July.
Furthermore, Figure 2 presents the upper and lower envelopes of the total system output. These correspond to scenarios where actual PV output exceeds or falls below forecasted values, respectively. Incorporating a deviation allowance within the objective function effectively resolves an inherent conflict. Specifically, it bridges the gap between day-ahead scheduling rigidity and intra-day PV uncertainty. If a day-ahead hydropower plan strictly forces the intra-day output to match a target profile, it creates a severe operational bottleneck. To perfectly maintain this predefined curve across diverse intra-day PV scenarios, the system is inevitably forced to execute extensive and passive power curtailment.
The day-ahead plan achieves high adaptability by permitting the total output profile to slightly deform. Instead of applying strict hard constraints, the objective function penalizes the magnitude of this deformation. This mathematical formulation minimizes PV curtailment while restricting the profile deviation to a secure range. Under extreme scenarios, the total intra-day generation no longer perfectly mirrors the target load curve. However, other peak-shaving resources or energy storage facilities in the broader grid can readily balance the resulting minor surpluses or deficits. Ultimately, this flexible strategy significantly enhances PV accommodation. Concurrently, it ensures the overall regulation burden remains well within the grid’s manageable limits.
4.2. Impact of PV Penetration on System Curtailment Characteristics
To analyze the impact of PV penetration on system curtailment characteristics, comparative experiments are conducted under varying PV capacity ratios. Specifically, PV penetration ratios () of 0.2, 0.4, 0.6, and 0.8 are selected, with optimization calculations performed for the three scheduled profile types (single-peak, double-peak, and steady-state) in October, as well as the typical operational conditions in July. Each case is solved using the proposed coordinated day-ahead and intra-day scheduling model. During optimization, this approach explicitly considers the curtailment risk across 10 intra-day PV fluctuation scenarios defined in Section 3.1, deriving an optimal hydropower dispatch schedule through the weighted optimization of expected curtailment and output deviation.
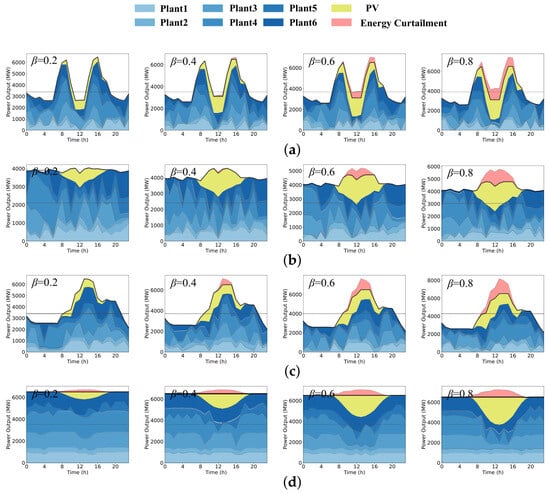
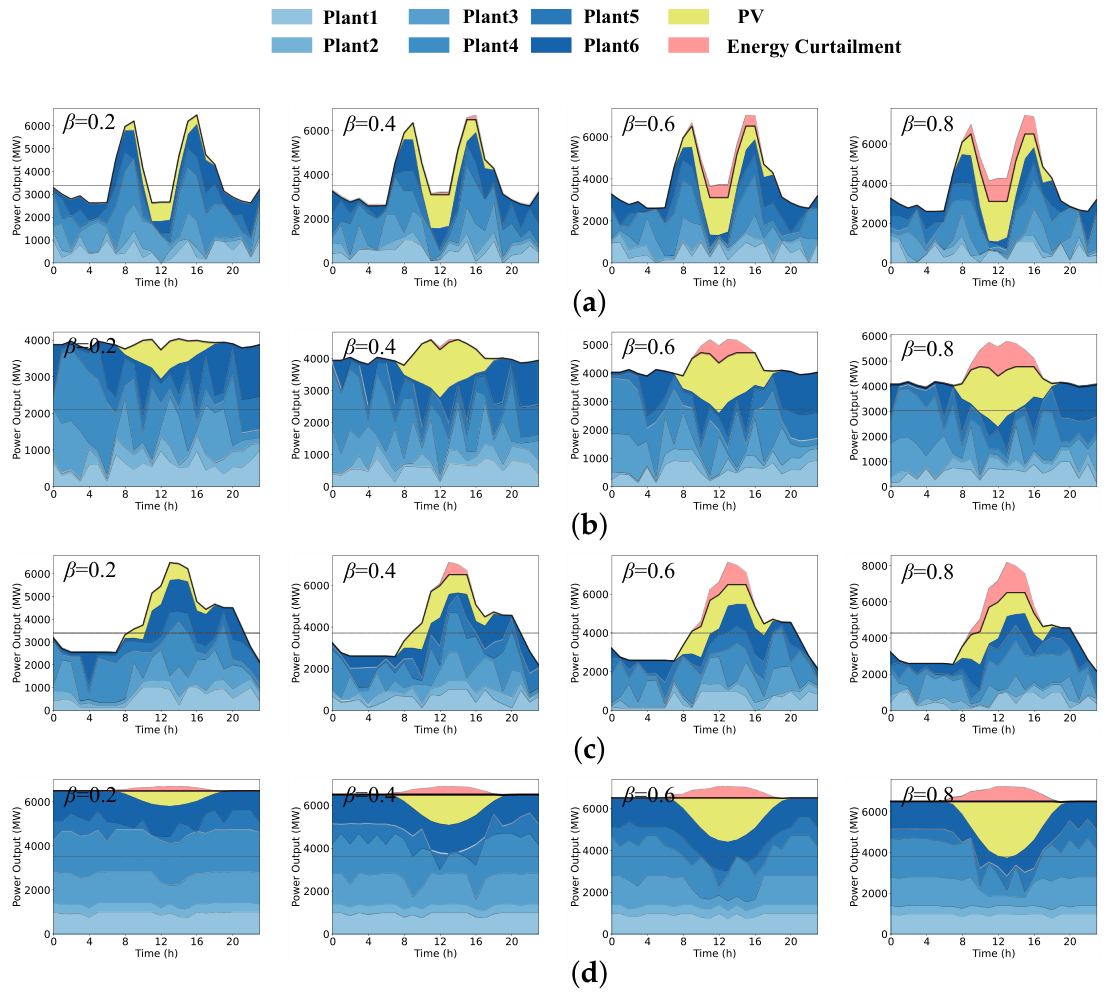
Figure 3 illustrates the system output distribution under different PV penetration levels, where the red shaded areas represent the volume of curtailment. It should be noted that the results presented reflect the operational performance of the optimal hydropower dispatch schedule under the baseline PV forecast scenario. It is noteworthy that a certain degree of active curtailment occurs even under the baseline forecast scenario. This phenomenon reflects the fundamental characteristic of the proposed stochastic dispatch strategy. Rather than overfitting to a single deterministic baseline, the day-ahead model optimizes the expected performance across 100 unpredictable intra-day scenarios. To robustly balance tracking precision and renewable accommodation, the model proactively curtails a minor portion of PV power in the baseline. This strategic compromise explicitly reserves downward regulation margins for cascaded hydropower, ensuring the system maintains sufficient flexibility to absorb extreme PV surges in other severe scenarios without violating the target load profile.
Figure 3.
System output distribution and PV curtailment volume under different PV penetration levels: (a) October, dual-peak; (b) October, steady-state; (c) October, single-peak; (d) July.
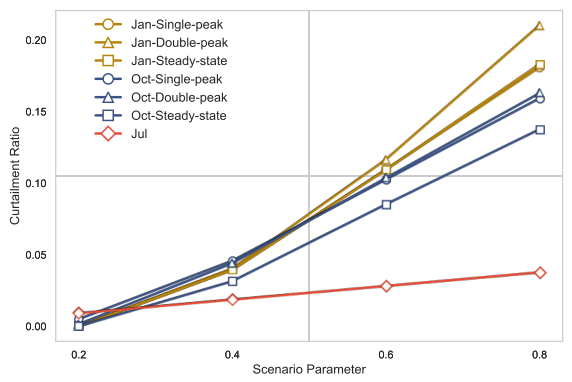
It is observed that under identical seasonal and scheduled profile conditions, the system curtailment exhibits a significant monotonic increasing trend as the PV ratio rises from 0.2 to 0.8. Curtailment is primarily concentrated during the peak PV generation period (11:00–15:00). The underlying cause is that during midday, the rapid surge in PV output exceeds the regulation capability of the cascaded hydropower stations, which are constrained by the minimum technical output limits and hydraulic constraints. Consequently, the system is compelled to curtail PV power to maintain the target scheduled profile.
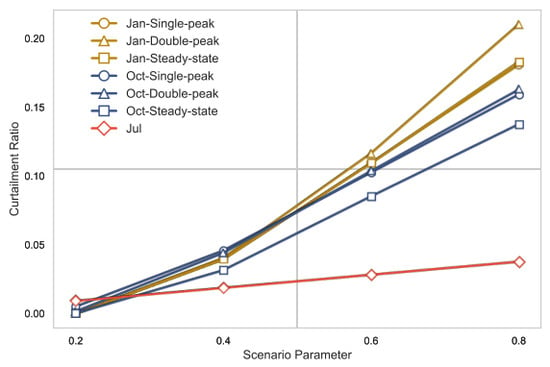
To intuitively illustrate the impact of PV penetration on the system’s curtailment level, Figure 4 presents the statistical variations of the curtailment rate across different months and scheduled profiles. The results demonstrate that the curtailment rate consistently increases with the PV ratio in all tested cases. This indicates that as the scale of PV installation expands, the available regulating resources become progressively insufficient relative to the scale of renewable generation, leading to an increasing curtailment risk.
Figure 4.
Comparison of system curtailment rate as a function of PV penetration level.
In summary, PV penetration is a critical factor influencing the system’s curtailment level. Given the constraints of fixed transmission corridors and hydropower regulation capacity, the curtailment risk escalates as PV capacity increases. This further validates that under high-penetration VRE scenarios, scheduling strategies relying solely on traditional energy maximization are insufficient to address PV uncertainty. Therefore, incorporating curtailment risk quantization and multi-scenario optimization is essential to preserve the necessary regulation margins for stable system operation.
4.3. Robustness Verification Under Stochastic PV Scenarios
To validate the effectiveness and robustness of the proposed scheduling model against PV generation uncertainty, two representative baseline methodologies are selected for comparison. The first is a conventional energy-maximization dispatch model. This benchmark satisfies all operational and load profile constraints but adopts total energy production as its sole optimization objective, thereby failing to incorporate curtailment risk indicators. The second benchmark is a traditional peak-shaving-oriented model derived from [22]. It primarily focuses on minimizing peak-valley differences without explicitly addressing intra-day stochastic volatility. Both baseline approaches lack the mathematical mechanism to proactively regulate intra-day PV fluctuations under severe uncertainty.
To objectively evaluate the operational performance of different dispatch strategies, we generated 100 independent stochastic PV output scenarios. These scenarios are distributed between the baseline forecast curve and the historical maximum output to simulate severe intra-day PV perturbations. Under these scenarios, curtailment is inevitable due to transmission corridor capacities and hydropower unit output constraints, providing a rigorous test for the accommodation capacity of each dispatch strategy. It is essential to note that the 100 stochastic scenarios utilized for validation mathematically encompass the extreme boundary conditions of the uncertainty envelope. By evaluating the system across these bounding scenarios, the validation inherently functions as a rigorous stress test. The ability of the proposed model to maintain stable curtailment rates and adhere to the scheduled profile under these extreme conditions quantitatively demonstrates its robust resilience against severe meteorological anomalies.
The computational workflow is structured as follows. First, three distinct day-ahead dispatch schedules are generated. These correspond to the proposed model, the conventional energy-maximization model, and the peak-shaving model from [22]. Notably, only the proposed model explicitly accounts for intra-day uncertainty. Subsequently, these fixed schedules are subjected to a stress test across the 100 independent stochastic PV scenarios. If the proposed framework consistently achieves superior curtailment performance compared to the dual benchmarks under extreme output conditions, it serves as empirical evidence of its enhanced robustness against significant PV uncertainty.
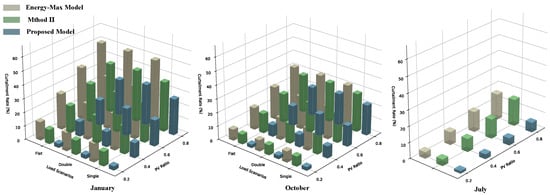
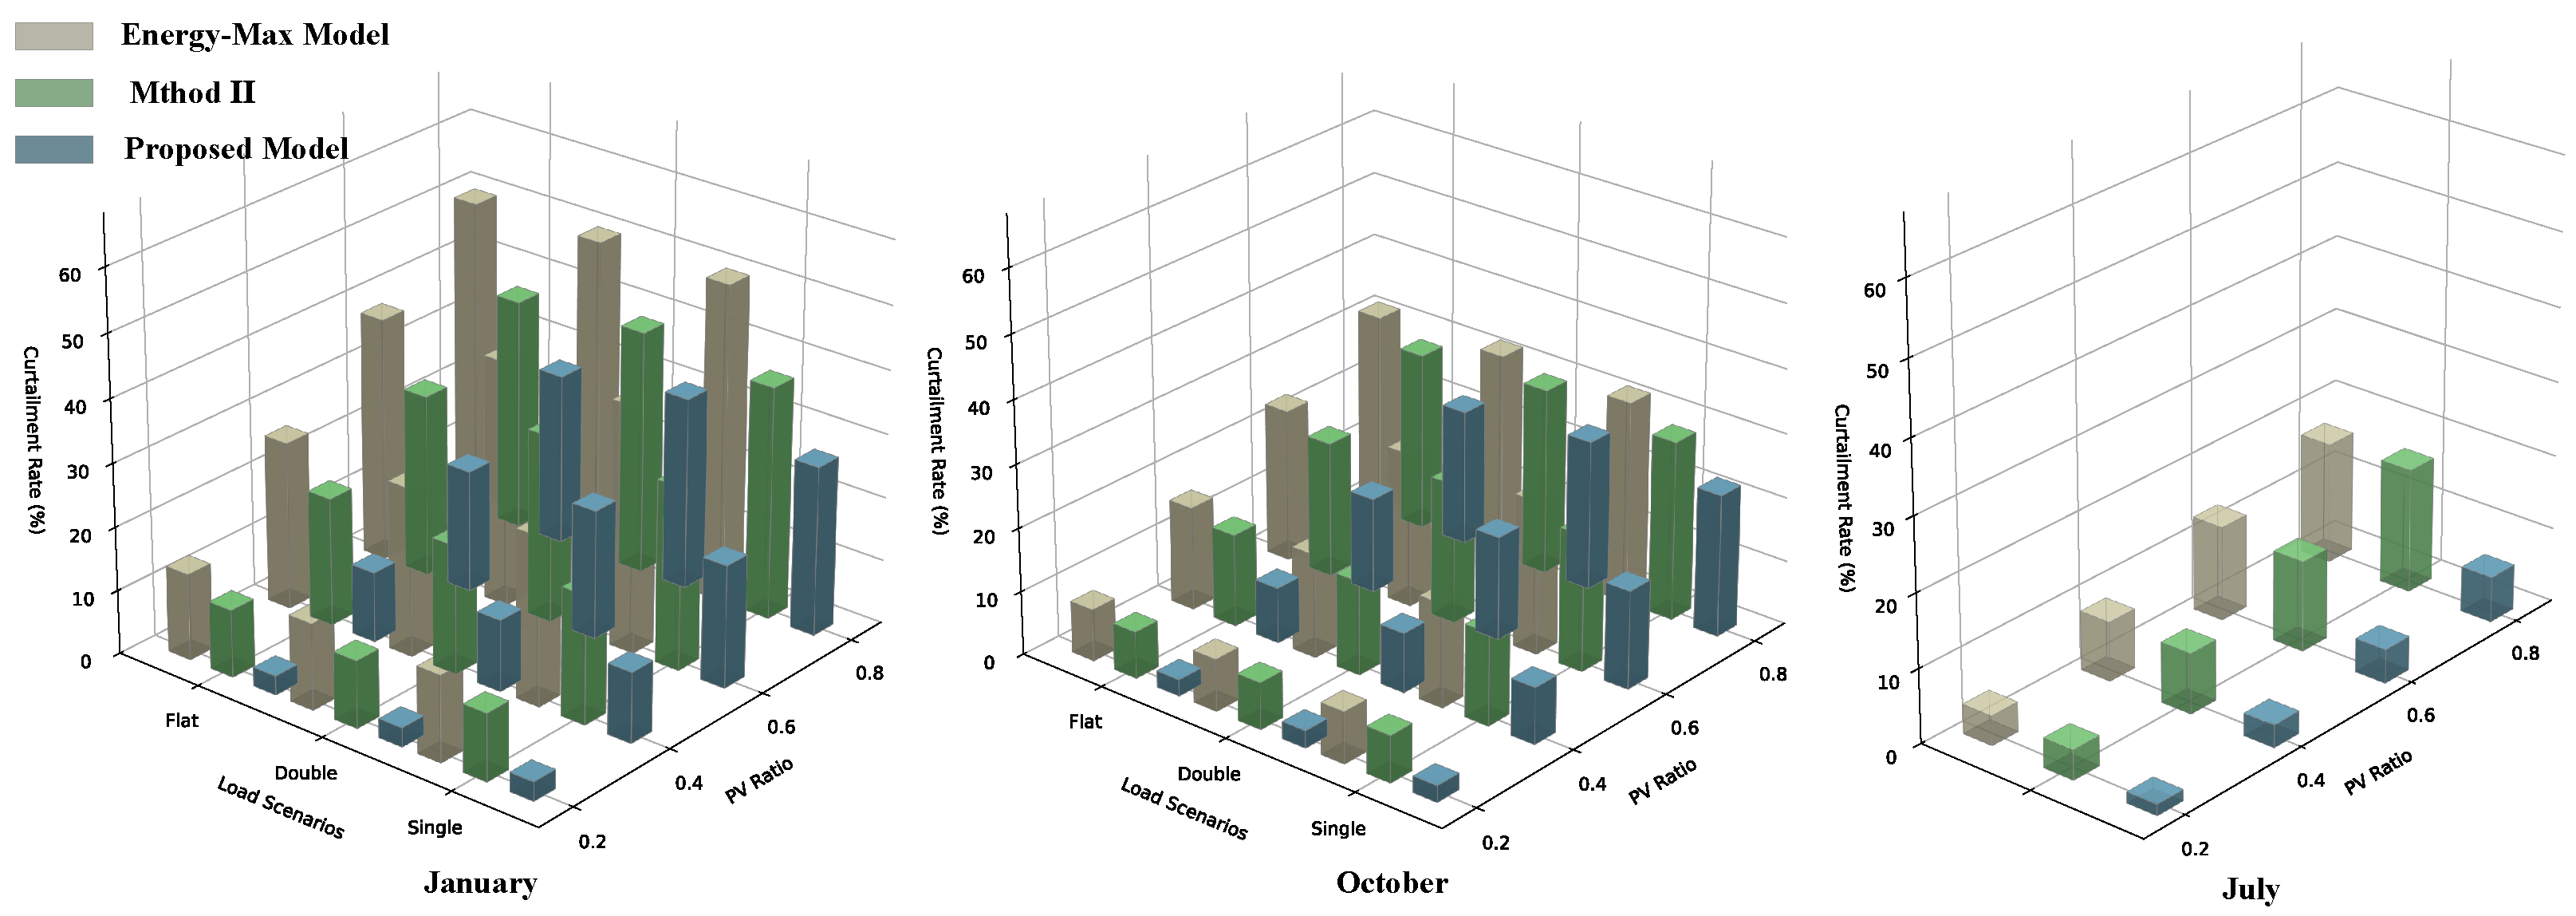
The curtailment rate is quantified as the ratio of average curtailment volume to total energy production. Experiments were conducted under typical operational conditions in October, January, and July. For October and January, 12 operational cases were configured, comprising three scheduled profiles (single-peak, double-peak, and steady-state) combined with four PV penetration ratios ( = 0.2, 0.4, 0.6, 0.8). In July, four cases were analyzed under a fixed profile with the same PV ratios. Average curtailment rates were calculated across 100 stochastic scenarios for each case and illustrated via bar charts.
The comparative results presented in Figure 5 demonstrate that the proposed two-stage coordinated scheduling model consistently achieves a significantly lower curtailment rate than both the energy-maximization benchmark and the peak shaving model from [22] across all test cases and seasonal conditions. This consistent outperformance indicates a key advantage. By integrating multi-scenario curtailment risk indices during the day-ahead stage, the proposed framework proactively adjusts hydropower output to reserve adequate regulation margins. This mechanism effectively mitigates curtailment pressure during extreme high-output PV events. Furthermore, the computational efficiency of the proposed model was evaluated to verify its engineering practicality. When tested across the 100 stochastic intra-day scenarios, the proposed method achieves an average computation time strictly within 200 s. This highly efficient solution fully supports its real-time applicability in actual operations.
Figure 5.
Comparison of the average curtailment rate between the proposed model, the conventional energy-maximization dispatch model, and the method II (adapted from [22]).
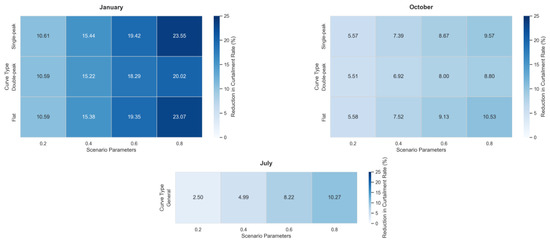
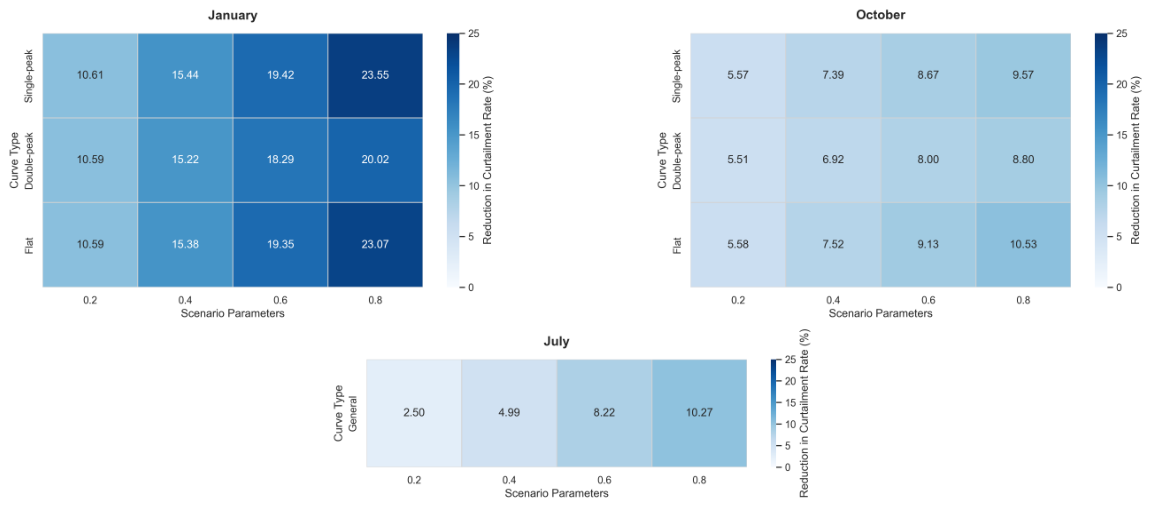
To further quantify performance gains, Figure 6 presents a heat map of the difference in curtailment rates between the proposed model and the energy-maximization benchmark. Deeper colors indicate more significant advantages of the proposed model in enhancing renewable accommodation. Furthermore, as the PV ratio increases from 0.2 to 0.8, the reduction in the curtailment rate shows an upward trend. This indicates that the system’s sensitivity to PV uncertainty intensifies with higher VRE penetration. Under high-penetration conditions, the energy-maximization strategy is highly susceptible to massive curtailment during PV peak hours. In contrast, the proposed risk-averse scheduling optimizes the hydropower output structure, significantly strengthening the system’s resilience against PV fluctuations.
Figure 6.
Heat map of the curtailment rate difference between the proposed model and the energy-maximization benchmark model.
In summary, the two-stage scheduling model incorporating curtailment risk exhibits superior robustness and accommodation capacity across varying seasonal and penetration levels. By proactively reserving regulation margins during the day-ahead stage and applying risk-constrained optimization during the intra-day stage, the model significantly reduces curtailment under high-output perturbations, thereby enhancing renewable energy utilization efficiency.
5. Conclusions
To address the curtailment challenges in hydro–solar hybrid systems under high photovoltaic penetration, this study proposes a coordinated day-ahead and intra-day scheduling model that explicitly quantifies curtailment risk. By integrating a baseline day-ahead dispatch with a risk-aware intra-day deviation allowance mechanism, the proposed framework achieves an optimal equilibrium between tracking precision and renewable energy accommodation. Extensive simulations across various seasonal and high-penetration scenarios demonstrate that this methodology consistently outperforms conventional energy maximization and traditional peak shaving strategies. The results quantitatively verify that the proposed model achieves significantly lower curtailment rates while maintaining robust resilience against severe meteorological anomalies. From a practical perspective, this two-stage scheduling approach provides a viable engineering paradigm and policy reference for grid operators. It facilitates a critical operational transition from rigid load tracking to flexible profile-based regulation, which is essential for the secure and economic integration of large-scale renewable energy bases. However, the current day-ahead schedule is derived by minimizing expected curtailment across finite discrete scenarios. While effective for general volatility, this approach remains sensitive to uncharacterized extreme realizations. Future research will therefore integrate DRO techniques. By optimizing over an ambiguity set of probability distributions rather than fixed scenarios, this advancement will further enhance the structural resilience of the dispatch schedule against worst-case fluctuations.
Author Contributions
Conceptualization, X.A., H.L. and F.L.; methodology, F.L. and Y.W.; validation, X.A. and H.L.; investigation, J.P. and Q.Z.; writing—original draft, F.L. and Y.W.; writing—review and editing, J.P.; supervision, C.C.; data curation, J.P.; resources, C.C. All authors have read and agreed to the published version of the manuscript.
Funding
This work was funded by “Technology Talent and Platform Program of Yunnan Province” (Grant No. 202405AK340002).
Data Availability Statement
The original contributions presented in the study are included in the article; further inquiries can be directed to the corresponding author.
Conflicts of Interest
Xianren Ai, Honggang Li, Yuqian Wang, Qishun Zhang and Jie Peng were employed by the Yunnan Provincial Engineering Technology Innovation Center for Integrated Hydro–Wind–Solar Energy. Chulun Cheng was employed by the Dalian Chuanhe Green Energy Technology Co., Ltd. The remaining author declares that the research was conducted in the absence of any commercial or financial relationships that could be construed as a potential conflict of interest.
Abbreviations
The following abbreviations are used in this manuscript:
| CHP | Cascaded Hydropower |
| PV | Photovoltaic |
| VRE | Variable Renewable Energy |
| RMSE | Root Mean Square Error |
References
- Elavarasan, R.M.; Pugazhendhi, R.; Irfan, M.; Mihet-Popa, L.; Khan, I.A.; Campana, P.E. State-of-the-art sustainable approaches for deeper decarbonization in Europe—An endowment to climate neutral vision. Renew. Sustain. Energy Rev. 2022, 159, 112204. [Google Scholar] [CrossRef] [Scilit]
- Li, M.; Virguez, E.; Shan, R.; Tian, J.; Gao, S.; Patiño-Echeverri, D. High-resolution data shows China’s wind and solar energy resources are enough to support a 2050 decarbonized electricity system. Appl. Energy 2022, 306, 117996. [Google Scholar] [CrossRef] [Scilit]
- Liu, Z.; He, X. Balancing-oriented hydropower operation makes the clean energy transition more affordable and simultaneously boosts water security. Nat. Water 2023, 1, 778–789. [Google Scholar] [CrossRef] [Scilit]
- Mohandes, B.; El Moursi, M.S.; Hatziargyriou, N.; El Khatib, S. A review of power system flexibility with high penetration of renewables. IEEE Trans. Power Syst. 2019, 34, 3140–3155. [Google Scholar] [CrossRef] [Scilit]
- Sun, L.; Bao, J.; Pan, N.; Jia, R.; Yang, J. Optimal scheduling of Wind-Photovoltaic-pumped storage joint complementary power generation system based on improved firefly algorithm. IEEE Access 2024, 12, 70759–70772. [Google Scholar] [CrossRef] [Scilit]
- Ergun, S.; Dik, A.; Boukhanouf, R.; Omer, S. Large-scale renewable energy integration: Tackling technical obstacles and exploring energy storage innovations. Sustainability 2025, 17, 1311. [Google Scholar] [CrossRef] [Scilit]
- Muftau, B.; Fazeli, M. The role of virtual synchronous machines in future power systems: A review and future trends. Electr. Power Syst. Res. 2022, 206, 107775. [Google Scholar] [CrossRef] [Scilit]
- Cheng, Q.; Liu, P.; Feng, M.; Cheng, L.; Ming, B.; Luo, X.; Liu, W.; Xu, W.; Huang, K.; Xia, J. Complementary operation with wind and photovoltaic power induces the decrease in hydropower efficiency. Appl. Energy 2023, 339, 121006. [Google Scholar] [CrossRef] [Scilit]
- Wen, X.; Sun, Y.; Tan, Q.; Tang, Z.; Wang, Z.; Liu, Z.; Ding, Z. Optimizing the sizes of wind and photovoltaic plants complementarily operating with cascade hydropower stations: Balancing risk and benefit. Appl. Energy 2022, 306, 117968. [Google Scholar] [CrossRef] [Scilit]
- Zhang, X.; Ma, G.; Huang, W.; Chen, S.; Zhang, S. Short-term optimal operation of a wind-PV-hydro complementary installation: Yalong river, sichuan province, China. Energies 2018, 11, 868. [Google Scholar] [CrossRef] [Scilit]
- Lin, M.; Shen, J.; Cheng, C.; Lü, Q.; Wang, Y. Long-term multi-objective optimal scheduling for large cascaded hydro-wind-photovoltaic complementary systems considering short-term peak-shaving demands. Energy Convers. Manag. 2024, 301, 118063. [Google Scholar] [CrossRef] [Scilit]
- Shen, L.; Wen, Y.; Wang, Q.; Zhang, P. Enhanced bi-layer scheduling strategies for the cascade hydropower-photovoltaic complementary system using a novel meta-heuristic algorithm. Front. Energy Res. 2024, 11, 1335683. [Google Scholar] [CrossRef] [Scilit]
- Zhang, H.; Lu, Z.; Hu, W.; Wang, Y.; Dong, L.; Zhang, J. Coordinated optimal operation of hydro–wind–solar integrated systems. Appl. Energy 2019, 242, 883–896. [Google Scholar] [CrossRef] [Scilit]
- Shafi, A.; Sharadga, H.; Hajimirza, S. Design of optimal power point tracking controller using forecasted photovoltaic power and demand. IEEE Trans. Sustain. Energy 2019, 11, 1820–1828. [Google Scholar] [CrossRef] [Scilit]
- Feng, Z.k.; Huang, Q.Q.; Niu, W.J.; Su, H.Y.; Li, S.S.; Wu, H.J.; Wang, J.Y. Peak operation optimization of cascade hydropower reservoirs and solar power plants considering output forecasting uncertainty. Appl. Energy 2024, 358, 122533. [Google Scholar] [CrossRef] [Scilit]
- Shen, Q.; Mo, L.; Liu, Z.; Sun, X.; Liu, G.; Zhang, Y. A multi-objective optimization method of sustainable wind–photovoltaic–hydro systems considering source–grid coordination. Sustainability 2023, 16, 61. [Google Scholar] [CrossRef] [Scilit]
- Lin, Y.; Lin, W.; Wu, W.; Zhu, Z. Optimal scheduling of power systems with high proportions of renewable energy accounting for operational flexibility. Energies 2023, 16, 5537. [Google Scholar] [CrossRef] [Scilit]
- Yang, Z.; Xiong, W.; Wang, P.; Shen, N.; Liao, S. A day-ahead economic dispatch method for renewable energy systems considering flexibility supply and demand balancing capabilities. Energies 2024, 17, 5427. [Google Scholar] [CrossRef] [Scilit]
- Liu, B.; Lund, J.R.; Liao, S.; Jin, X.; Liu, L.; Cheng, C. Optimal power peak shaving using hydropower to complement wind and solar power uncertainty. Energy Convers. Manag. 2020, 209, 112628. [Google Scholar] [CrossRef] [Scilit]
- Wu, X.; Zhang, J.; Wei, X.; Cheng, C.; Cheng, R. Short-Term Hydro-Wind-PV peak shaving scheduling using approximate hydropower output characters. Renew. Energy 2024, 236, 121502. [Google Scholar] [CrossRef] [Scilit]
- Marneris, I.G.; Biskas, P.N.; Bakirtzis, E.A. An integrated scheduling approach to underpin flexibility in European power systems. IEEE Trans. Sustain. Energy 2015, 7, 647–657. [Google Scholar] [CrossRef] [Scilit]
- Juntao, Z.; Chuntian, C.; Jianjian, S.; Gang, L.; Xiufeng, L.; Zhenyu, Z. Short-term joint optimal operation method for high proportion renewable energy grid considering wind-solar uncertainty. Proc. CSEE 2020, 40, 5921–5932. [Google Scholar]
- Wang, Z.; Wu, F.; Li, Y.; Li, J.; Liu, Y.; Liu, W. Day-ahead dispatch approach for cascaded hydropower-photovoltaic complementary system based on two-stage robust optimization. Energy 2023, 265, 126145. [Google Scholar] [CrossRef] [Scilit]
- Yamujala, S.; Kushwaha, P.; Jain, A.; Bhakar, R.; Wu, J.; Mathur, J. A stochastic multi-interval scheduling framework to quantify operational flexibility in low carbon power systems. Appl. Energy 2021, 304, 117763. [Google Scholar] [CrossRef] [Scilit]
- Liu, H.; Yuan, R.; Li, J.; Li, X.; Zang, X.; Yu, G.; Wang, K.; Tian, L.; Li, Y. Research on the evaluation method of peak shaving and valley filling potential of power demand side response based on typical large industrial users. In Proceedings of the 2022 IEEE 6th Conference on Energy Internet and Energy System Integration (EI2); IEEE: New York, NY, USA, 2022; pp. 3148–3152. [Google Scholar]
- Du, C.; Gao, Y.; Wang, L.; Li, X.; Cui, Y.; Gao, J. Medium-and Long-Term Optimal Stochastic Scheduling for Inter-Basin Hydro-Wind-Photovoltaic Complementary Systems Considering Wind and Solar Output Uncertainty. IEEE Open Access J. Power Energy 2025, 12, 404–416. [Google Scholar] [CrossRef] [Scilit]
- Zhang, J.; Cheng, C.; Yu, S.; Su, H. Chance-constrained co-optimization for day-ahead generation and reserve scheduling of cascade hydropower–variable renewable energy hybrid systems. Appl. Energy 2022, 324, 119732. [Google Scholar] [CrossRef] [Scilit]
- Jin, X.; Liu, B.; Liao, S.; Cheng, C.; Yan, Z. A Wasserstein metric-based distributionally robust optimization approach for reliable-economic equilibrium operation of hydro-wind-solar energy systems. Renew. Energy 2022, 196, 204–219. [Google Scholar] [CrossRef] [Scilit]
- Lu, X.; Chan, K.W.; Xia, S.; Zhou, B.; Luo, X. Security-constrained multiperiod economic dispatch with renewable energy utilizing distributionally robust optimization. IEEE Trans. Sustain. Energy 2018, 10, 768–779. [Google Scholar] [CrossRef] [Scilit]
- Han, S.; He, M.; Zhao, Z.; Chen, D.; Xu, B.; Jurasz, J.; Liu, F.; Zheng, H. Overcoming the uncertainty and volatility of wind power: Day-ahead scheduling of hydro-wind hybrid power generation system by coordinating power regulation and frequency response flexibility. Appl. Energy 2023, 333, 120555. [Google Scholar] [CrossRef] [Scilit]
- Guo, Y.; Ming, B.; Huang, Q.; Wang, Y.; Zheng, X.; Zhang, W. Risk-averse day-ahead generation scheduling of hydro–wind–photovoltaic complementary systems considering the steady requirement of power delivery. Appl. Energy 2022, 309, 118467. [Google Scholar] [CrossRef] [Scilit]

Disclaimer/Publisher’s Note: The statements, opinions and data contained in all publications are solely those of the individual author(s) and contributor(s) and not of MDPI and/or the editor(s). MDPI and/or the editor(s) disclaim responsibility for any injury to people or property resulting from any ideas, methods, instructions or products referred to in the content. |
© 2026 by the authors. Licensee MDPI, Basel, Switzerland. This article is an open access article distributed under the terms and conditions of the Creative Commons Attribution (CC BY) license.