


Abstract
Copper (Cu) is both an essential micronutrient and a pollutant, with its effects depending on its concentration, environmental context, and the species and life history stages of the organisms exposed. To advance the understanding of copper effects in the context of variation in other environmental conditions, eastern oyster (Crassostrea virginica) spat recruitment and adult tissue copper concentration [Cu] were monitored in conjunction with water column [Cu], salinity, pH, dissolved oxygen, and temperature for a year at five sites in or near Naples Bay, Florida, an urbanized estuary with some of the highest copper pollution levels in the US. Relationships among the environmental variables were explored using principal component analysis, then the effects of key variables on oyster responses were assessed using regression models and multi-model comparison. There were significant differences among sites and dates in terms of salinity, water column and tissue [Cu], and spat recruitment. Tissue [Cu] was high, up to 2868 ppm, and was correlated with high water column [Cu] in parts of the estuary (up to 7.55 mg/L). Oyster tissue [Cu] was best predicted by a linear model incorporating both salinity and water column [Cu], and oyster spat recruitment was best modeled using a polynomial fit to salinity and a negative linear relationship with water column [Cu]. This is consistent with the hypothesis that high [Cu] in conjunction with low salinities reduces spat recruitment in this system, but alternative hypotheses cannot be excluded without further assessment. Given these findings, hydrologic restoration to stabilize salinity regimes and management actions to eliminate copper pollution sources are recommended to protect oysters and improve ecological integrity in the system.
1. Introduction
Copper (Cu) is an essential micronutrient for many organisms, involved in key metabolic functions such as mitochondrial energy production, cellular proliferation, and tissue development [1,2,3], yet it is toxic in high concentrations and is becoming a worldwide problem in aquatic ecosystems [4,5,6,7,8]. Anthropogenic sources of Cu pollution include mining and industrial activity, the use of Cu-based biocides in agriculture and aquaculture, anti-fouling paints, treated wood products, and numerous other sources contributing to contamination of runoff and wastewater [9,10,11,12]. Although Cu from both natural and anthropogenic sources is nearly ubiquitous in aquatic environments [13,14], understanding and managing its effects remains challenging due to its complex environmental chemistry and the varying ways it is taken up and processed by aquatic organisms [7,15,16]. Understanding Cu effects is particularly challenging in oysters (family Ostreidae), which acquire Cu both through direct absorption from the water via gill membranes [14,17] and through ingested particulates via the digestive tract [6,12], actively accumulate Cu in high concentrations in certain cell types and tissues, and involve it in defense and developmental processes [3,18,19,20]. For example, oyster hemocytes have been shown to hyperaccumulate copper, detoxify it in membrane-bound lysosomal granules, transport it between tissues, and utilize it in defense against pathogens [17,21,22,23,24].
Because of their unique copper physiology, the lethal copper concentration [Cu] for adult oysters is higher than could reasonably be expected to occur in natural environments [25,26,27,28]. Yet even oysters may experience negative effects of environmentally relevant [Cu] levels at early life history stages, particularly in the presence of other environmental stressors like low salinity or high temperatures [29,30,31]. Oyster larvae’s physiological response to environmental Cu is thus characterized as hormesis, with impaired function due to deficiency at low [Cu], optimal performance at moderately high [Cu], and sublethal and lethal harms at very high [Cu] [24]. The threshold at which [Cu] effects become harmful to oysters is an important question that has not been completely resolved. Some studies report abnormal development, behavioral impairment, and/or decreased larval survival at water column [Cu] as low as 0.01–0.02 mg/L [32,33], while others report beneficial effects on larval development and settlement up to [Cu] of 0.6 mg/L [18,34]. Field studies exploring larval settlement across gradients of water column [Cu] and other water quality characteristics could help clarify how these thresholds may vary with environmental context and oyster species.
The eastern oyster, Crassostrea virginica, hereafter referred to as “oyster,” is an ecologically and economically important species native to temperate and tropical estuaries of the Western Atlantic Ocean [35]. For 2024, US landings of Crassostrea virginica in the Western Atlantic were 7874 metric tons, with an assessed value of 195,331,575 USD [36]. Despite their continuing importance, oyster landings have declined by over 90% across much of their range due to overharvesting and other anthropogenic factors [37,38], among which Cu pollution should be considered. The high Cu tolerance of adult oysters does not preclude the possibility of harmful, population-level impacts of Cu pollution mediated by effects on early life history stages; effects which may be exacerbated by interactions with other environmental stressors such as temperatures and salinities outside optimal ranges.
Locations where early life-history-stage oysters might experience detrimental Cu effects include urban and industrialized estuaries, where elevated [Cu] occurs in conjunction with an array of other environmental stressors [27]. Naples Bay is an urban estuary located on the southwest coast of Florida, USA (26.1227° N, 81.7917° W). Oyster reefs within Naples Bay have declined by 80% due to habitat loss, watershed alterations affecting salinity regimes, dredging for navigational channels and development, and shoreline hardening [39,40,41]. Efforts to restore oyster reefs in Naples Bay via the placement of artificial substrata have had some success but are imperiled by continuing impacts of anthropogenic disturbance [42]. Naples Bay is designated as an impaired waterbody by the state of Florida due to high levels of enterococci, fecal coliform, chlorophyll a (suspended algae), iron, and copper [43]. Water column [Cu] in excess of state standards (>3.7 µg/L) has frequently been reported in the bay and its tributaries [11] and a 2004–2005 study found some of the highest oyster tissue [Cu] in the US (1400 ppm) in Naples Bay [44]. Sediment [Cu] in the bay and its watershed of up to 675 mg/kg [45] also exceed US federal standards for protection of sensitive species [46].
Although both water column and oyster tissue [Cu] in Naples Bay are concerning, their relationships, and the extent to which they positively or negatively affect oysters in the system, have not been examined. Critical gaps in our understanding include (1) whether oyster tissue [Cu] in the estuary is a reliable proxy of water column [Cu] and (2) whether any parts of the estuary experience altered larval settlement attributable to high [Cu] or to the interaction of high [Cu] with other environmental factors. Thus, our goals were to evaluate the relationships among pH, dissolved oxygen, salinity, temperature, water column [Cu], oyster tissue [Cu], and oyster spat recruitment success in Naples Bay and to explore whether Cu may be promoting or reducing spat settlement in the system. It was hypothesized that water column [Cu] and oyster tissue [Cu] would be positively correlated and that both would be elevated in lower salinity regions of the estuary closer to freshwater pollution sources. It was also hypothesized that oyster spat recruitment would be positively correlated with optimal levels of salinity (14–28 [42,47]) and temperature (20–28 °C [48]) and negatively correlated with excessively high copper exposure (>3.7 µg/L).
2. Materials and Methods
2.1. Sampling Locations
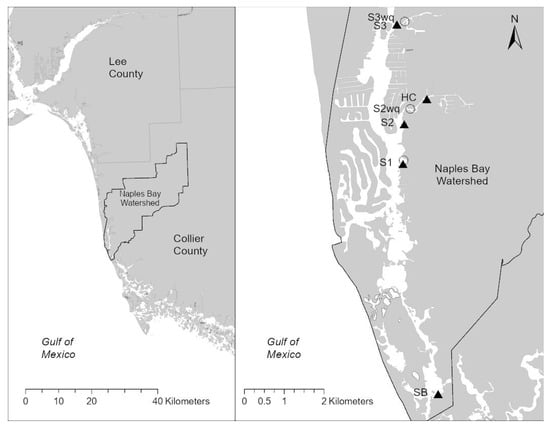
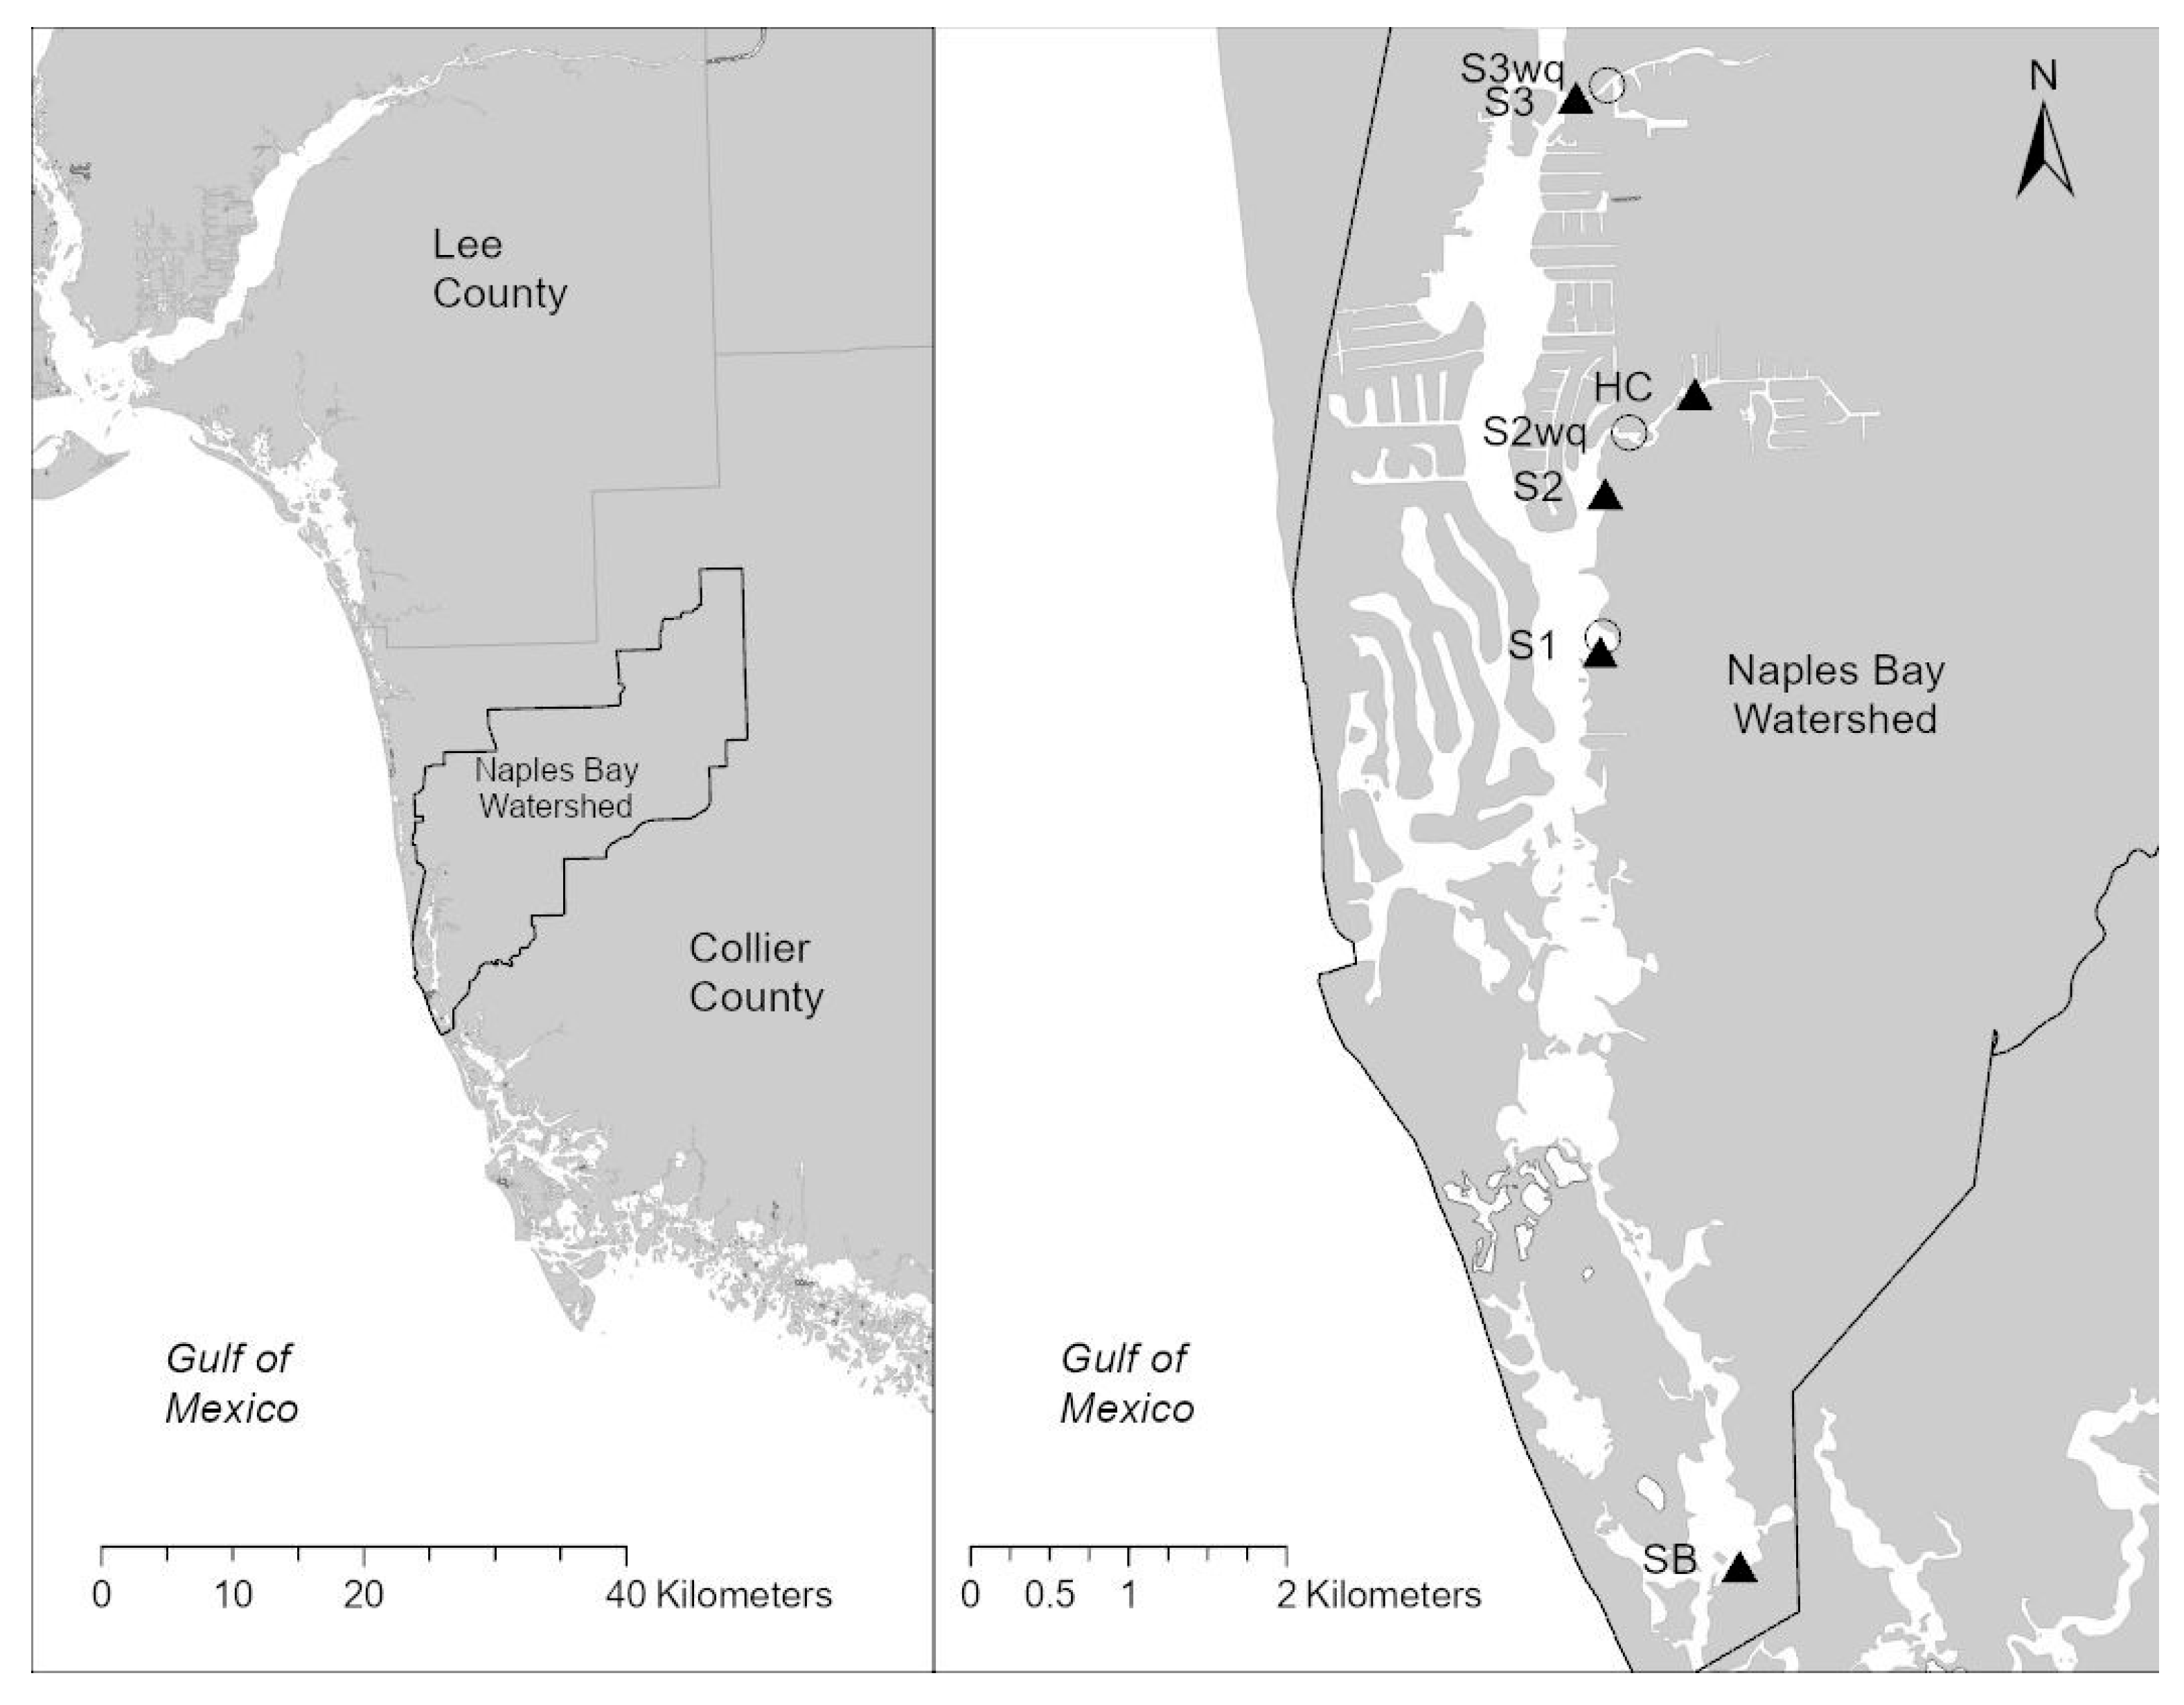
Oysters were sampled, and their recruitment was monitored at five sites in or near Naples Bay, Florida (Figure 1). The sites were chosen to span a range of salinities while also including some sites of similar salinity but differing water column [Cu]. Site 1 is closest to the mouth of the bay, with relatively high salinity, Site 2 is further from the mouth with lower salinity, and Site 3 is furthest from the mouth with the lowest and most variable salinity [42]. The fourth site, Haldeman Creek, is a moderate salinity tidal creek near Site 2, in an area that has historically reported high water column [Cu] [11]. The final site, Shell Bay, is five kilometers south of Naples Bay, has a less developed watershed, and was chosen as a high salinity, low [Cu] reference site (Figure 1). Mean tidal range is approximately 60 cm at all sites [49] and sediments are mud to sand. Current velocity data for the sites are not available, but Site 1 is presumed to be a more energetic environment due to greater exposure to wave energy from boat wakes and somewhat coarser sediments. Water column characteristics, including temperature, salinity, pH, dissolved oxygen, and [Cu], were monitored at sites or at regular monitoring stations near the sites, as indicated in Table 1 and Figure 1. This water column monitoring was an extension of a monthly monitoring program initiated by the City of Naples Natural Resources Department in 2011. Hereafter, the physicochemical characteristics of the water column are referred to as water quality.
Figure 1.
Site locations. Left panel shows the Naples Bay Watershed in the context of the SW Florida Coastline, while right panel shows sample site locations within Naples Bay. Black triangles indicate locations where oyster data were collected, while hollow circles indicate locations where only water quality data were collected. See Table 1 for site label information.
Table 1.
Sampling location information. The key for types of data collection is as follows: OC = oyster tissue copper concentrations, OR = oyster recruitment on shell stringers, WQ = water quality data including [Cu]. The key to data sources is as follows: TS = this study, GOV = city, county, or state water quality monitoring programs. The pairing(s) column indicates which other nearby site or sites the focal site was paired with for regression analyses.
2.2. Water Column Data Collection
In situ physical parameters of the water column including salinity, temperature, pH, and dissolved oxygen concentration (DO) were collected monthly, May 2020–April 2021, at each site with a YSI multiparameter sonde lowered to 0.3 m below the water’s surface. Because these parameters can vary on diel and tidal cycles, it would have been ideal to collect them with continuously deployed loggers. It was not feasible to install such instrumentation at all field sites for this study, but beginning 1 August 2020, continuous physical parameter data were available from an instrument permanently deployed at Site 1. This revealed that daily minimum and maximum salinity values could differ by up to ~15 during spring tides at that site, pH could vary ~0.5 units daily, DO 4–6 mg/L, and temperature 1–5 °C (Figure S1). While all single-point measurements were made during mid morning to mid afternoon hours, which should reduce some of the diel variation, it is acknowledged that the use of single time point measurements introduces additional error variance to the data examined. Grab samples for chemical parameters including copper were also collected from 0.3 m below the surface, immediately placed on ice in high-density polyethylene vials, and were sent to the National Environmental Laboratory Accreditation Program (NELAP) certified Collier County Pollution Control & Prevention Laboratory in Naples, FL for analysis, according to Florida Department of Environmental Protection standard operating procedures [50]. Shell Bay and Haldeman Creek were not among the City of Naples’ regular monthly monitoring locations; therefore, water samples from these sites were collected according to the same procedures and sent to the NELAP certified Pace Analytical Laboratory in Oldsmar, FL. The Collier County Pollution Control & Prevention Laboratory used the EPA 200.8 method to test for copper while the Pace Laboratory used the EPA 6020b method. Both methods include an HNO3 acidification step prior to analysis of trace metals with inductively coupled plasma mass spectrometry and deliver comparable results for surface water samples [51,52].
2.3. Oyster Tissue Sample Collection
Each month from April 2020 to March 2021, 10 oysters were collected from the intertidal zone at each site. Clumps of oysters were pulled from multiple, random locations within each site, and adult oysters in the 30–70 mm shell height range were separated from each clump until 10 oysters had been gathered. This collection method yielded similar mean oyster tissue weights (0.50–0.62 g) for all sites except for Shell Bay (0.34 g) where the oysters encountered tended to be on the lower end of the 30–70 mm shell height range. Oysters were shucked and soft tissues were dried at 105 °C until constant weight to determine dry weight (g). The dried specimens were ground into fine powder before being analyzed.
2.4. XRF Analysis of Copper in Oyster Tissues
An X-ray fluorescence spectrometer (XRF) (Olympus X-5000, Olympus Scientific Solutions Americas, Waltham, MA, USA) was used to determine [Cu] (ppm) in dried oyster tissues. Prior to starting any XRF measurement, the instrument was standardized by a standardization cap provided by the manufacturer for Soil Mode analysis. The XRF measurement time was set for 60 s for all measurements. The five largest dried samples from each site and date, by dry mass, were analyzed per the procedures described in Richards and Chaloupka [53]. The larger samples were chosen because some smaller samples did not fill the XRF collection cap completely. To calibrate the XRF, 0.75 g samples of oyster tissue standards with known [Cu] of 71.6 ppm (Standard Reference Material 1566b, Brammer Standard Company, Inc., Houston, TX, USA) and 834.5 ppm were used as references. The 834.5 ppm standard was made by enriching the 71.6 ppm standard with copper (II) nitrates trihydrate as described below.
Copper nitrate trihydrate (Cu(NO3)2·3H2O, 99%) was purchased from Thermo Fisher Scientific and was used for preparing copper stock solution and the second copper oyster standard on oyster tissues. Initially, 0.2929 g of the chemical was weighed and was dissolved in deionized water, and was transferred quantitatively to a 50 mL volumetric flask. A 152.6 g/L copper solution was diluted from the copper stock solution by deionized water. Then, 5.00 mL of the diluted Cu solution was added to 1.000 g of the Cu oyster standard (which contained 71.6 ppm Cu) in a 20 mL glass vial. The slurry was stirred on a hot plate at 105 °C to mix well and to evaporate all water until it reached a constant mass. The dried slurry was transferred to a crucible and ground with a pestle into fine powder. The Cu concentration of this second oyster standard was calculated as 71.6 ppm + 763.0 ppm = 834.60 ppm. Copper concentration in the oyster tissue demonstrated an excellent linear relationship with the XRF signal (R2 = 0.9999).
The instrumental detection limit (LOD) and quantification limit (LOQ) were defined as the lowest analyte concentration that produced a peak with signal-to noise ratio of 3 and 10, respectively. The LOD and LOQ were calculated as approximately 4 ppm and 13 ppm, respectively, at the measurement time of 60 s used in this study. A certified reference material (CRM) or a multi-element standard solution containing Cu was purchased from Agilent Technology and was used to spike to the oyster tissue standard. The slurry was stirred, heated and dried as the same procedure as the second Cu oyster standard mentioned above. The calculated recovery rate was 106%. The calibration curve with 0.75 g samples of the 71.6 ppm and 834.6 ppm standards plus 0 for a blank yielded the correction equation
[Cu] = (XRF Cu signal + 4.2238)/3.1263
Additional calibration procedures with the XRF were performed to correct for a systematic bias related to the mass of the sample analyzed. The bias was quantified by analyzing a range of masses of the 71.6 ppm standard (0.1, 0.25, 0.5, 0.75, 1, and 1.5 g), applying correction Equation (1), and then regressing the ratio 71.6/(Equation (1)) against the sample mass. This yielded the following formula:
Sample mass correction factor = 0.5615 × (Sample Mass [g]) + 0.5768, with an R2 of 0.99
Equations (1) and (2) were applied in series to convert all XRF Cu signal readings to truer [Cu] values.
2.5. Oyster Recruitment
To determine oyster spat recruitment at each site, three replicate shell stringers were deployed at each of the five sites during the 2020 spawning season from April through October 2020. The stringers were retrieved and replaced once a month. Each shell stringer included 12 shell valves from aquaculture-raised Crassostrea virginica donated by a local seafood restaurant. The valves were similar in surface area and ranged from 60 to 105 mm shell height. A hole was drilled in the middle of each shell valve, and the valves were strung together using 40 cm of galvanized wire and placed with their inner surface down [54]. Each stringer was assembled with shells taken at random from a large pool of prepared shells and it is assumed that there were no systematic differences in the availability of recruitment surface area among stringers deployed at different sites and dates. Each stringer was suspended approximately 18 cm off the bottom in the lower intertidal zone, the depth zone in which oysters are most abundant in this system [42]. Each stringer was collected with the two outer shells being discarded and the remaining 10 examined for spat with the aid of a handheld magnifying lens to confirm identifications. Recruitment data were recorded as number of spats per oyster shell.
2.6. Statistical Analysis
Principal components analysis of the five water quality data variables gathered (salinity, temperature, pH, dissolved oxygen and [Cu]) was performed using the prcomp() function in the statistics package R (version 4.5.3) [55]. These found that the first two principal components explained 75% of the variation in the data, that pH had strong positive covariance with salinity, and that dissolved oxygen had strong negative covariance with temperature (Figure S2). Because of these relationships among the environmental variables and the possible confounding effects of time of day on pH and dissolved oxygen, subsequent analyses focused only on salinity, temperature, and [Cu].
The effects of site, date, and their interaction on oyster tissue [Cu] and spat recruitment were examined using two-way analysis of variance (ANOVA). One-way ANOVA comparisons among sites were also run for oyster tissue [Cu] and oyster spat recruitment, followed by Tukey’s honestly significant difference (HSD) tests to determine which sites differed significantly. Response variables lacking within-site replication (salinity, temperature, water column [Cu]) were examined using two-way ANOVA without replication, allowing for assessment of main effects of site and date, but not their interaction. Log10 transformation of all variables was required to meet the assumptions for normality and homoscedasticity. Means comparison tests were performed in JMP® Pro Version 18.0.2 [56] and IBM SPSS Statistics Version 29.0.0.0 (241) and were run as fixed-factor designs.
Regression models were constructed to evaluate relationships of salinity, temperature, and [Cu] to two oyster response variables: tissue [Cu] and spat recruitment. Monthly site means were used for both predictor and response variables in these regression exercises. For relationships of salinity and temperature to oyster responses, second order polynomial regressions were used because the ranges of salinity and temperature observed in the field included values both above and below physiological optima for oysters [47,57]. Ten regression models were constructed for oyster tissue [Cu] and 11 were constructed for spat recruitment, and the fit and parsimony of models were evaluated with a multi-model inference approach using Akaike’s Information Criterion [58]. Model sets were limited to those models for which reasonable mechanistic hypotheses could be drawn. The regression models were run in IBM SPSS and the model evaluation and multi-model inference procedures were conducted in Microsoft Excel.
3. Results
3.1. Water Column Conditions
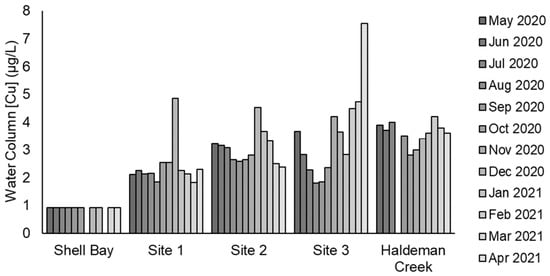
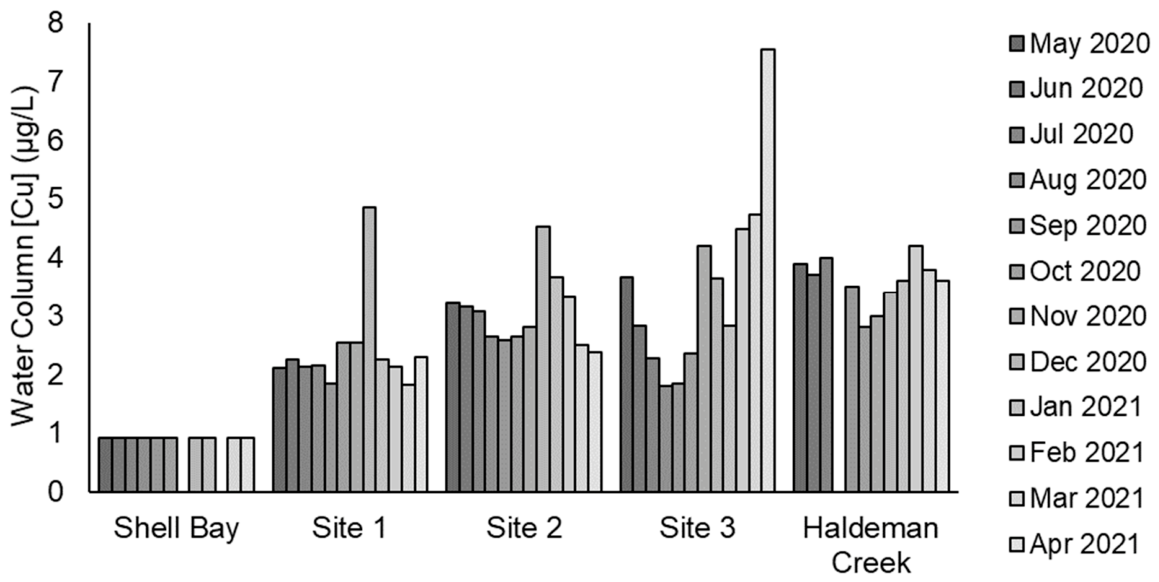
Salinity levels varied significantly by date and among sites (two-way ANOVA without replication; Date p < 0.001, Site p < 0.001, Figure S3). The spatial pattern of salinity variation was as expected based on sites’ relative proximity to freshwater and marine influences, with the lowest salinities at Site 3, followed by Haldeman Creek and Site 2. Salinity at Shell Bay was notably higher than the other sites, as expected based on its position in a southern branch of the estuary with little freshwater input. Salinity at all sites varied seasonally, with the lowest salinities in the wet season between July and September 2020 (Figure S3). Site 3 salinity was often below the optimal range for oyster growth, recruitment, and spawning (<14) while Shell Bay salinity was often above the optimal range (>28) (Figure S3). Water temperature varied significantly by date and among sites (two-way ANOVA without replication: Date p < 0.001, Site p < 0.001, Figure S4). The temporal variation was pronounced, with June-September temperatures at 30–33 °C and December-March at 18–23 °C (Figure S4). Site differences in temperature were minor, but the pattern was that more marine-influenced sites were cooler (Figure S4). Water column [Cu] varied significantly among the five sites but not by sampling date (two-way ANOVA without replication: Date p = 0.25, Site p < 0.001, Figure 2). Water column [Cu] was lower at Shell Bay than at any other site: all samples were below the detection limit of 0.93 µg/L and were entered as 0.93 µg/L for statistical analysis. Site 1 had lower [Cu] than Site 3 and Haldeman Creek. The seasonal pattern in water column [Cu] varied among sites, but some of the highest levels occurred during dry season months. Except for Shell Bay, all sites had some copper levels exceeding the 3.7 µg/L state standard for marine waters and shellfish propagation/harvesting established by Florida Statute 62-302.530.
Figure 2.
Water column copper (µg/L) concentration measurements by site and month, May 2020 through April 2021. All Shell Bay values were below detection limits and thus reported at the detection limit value (0.93 µg/L). Two measurements are missing for Shell Bay (November 2020 & February 2021) and one from Haldeman Creek (August 2020) due to documentation issues with the sampling or laboratory analysis.
3.2. Oyster Tissue Copper Levels
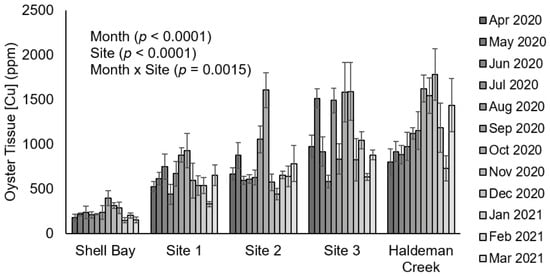
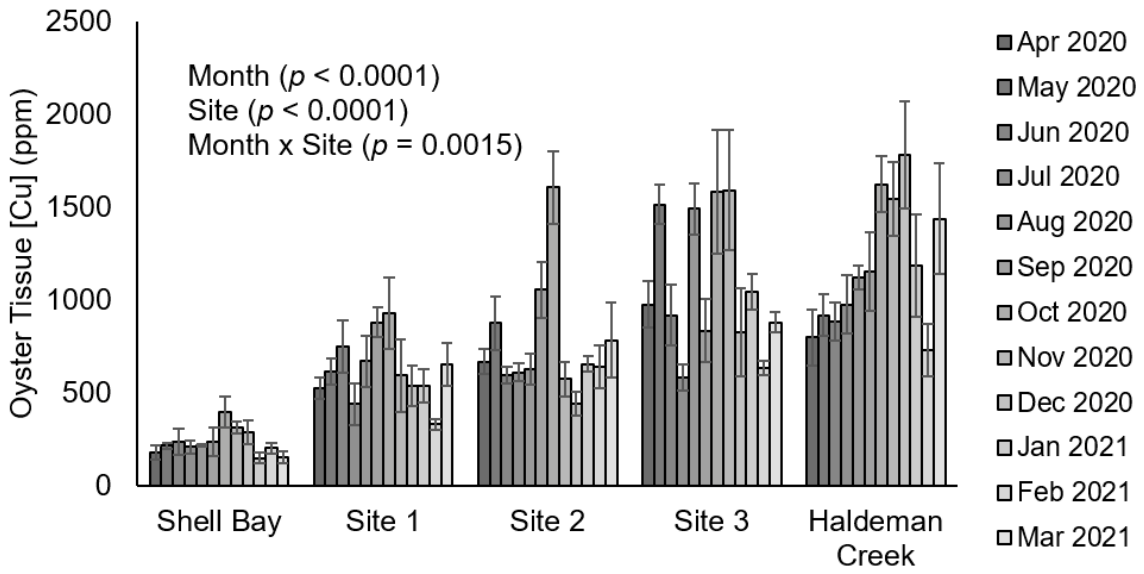
Oyster tissue [Cu] ranged from 47 to 2868 ppm in individual oysters and varied significantly by site and month (Two-way ANOVA Site p < 0.0001, Month p < 0.0001, Site × Month p = 0.0015). Mean tissue [Cu] was highest at Haldeman Creek (1179 ppm) and Site 3 (1074 ppm), and lowest at Shell Bay (234 ppm) with intermediate levels at the other sites (Figure 3). Tissue [Cu] was five to six orders of magnitude higher than water column [Cu].
Figure 3.
Mean copper (ppm) concentration in oyster tissue by site and month, April 2020 through March 2021. Error bars represent standard error. p-values are from a Two-way ANOVA on log10 transformed data.
3.3. Oyster Recruitment Success
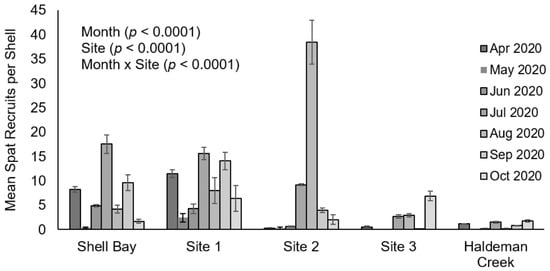
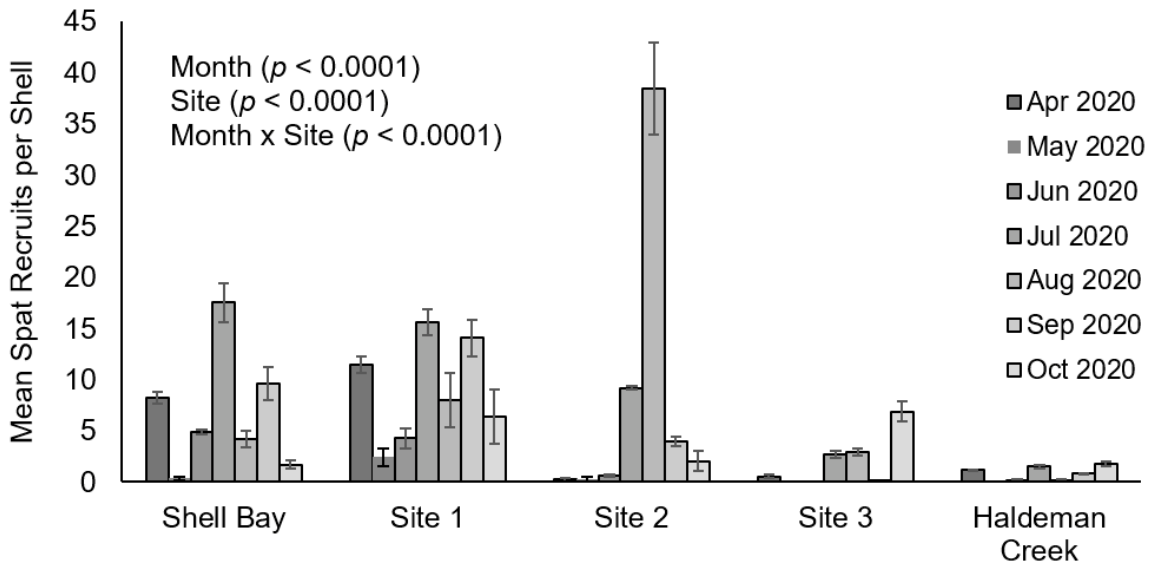
Spat recruitment varied significantly by site and month, and there was a significant site × month interaction indicating that the seasonal pattern of recruitment was not the same each month at all sites (Two-way ANOVA Site p < 0.0001, Month p < 0.0001, Site × Month p < 0.0001). Site 1 showed the highest seasonal mean recruitment of all the sites, with Site 2 and Shell Bay closely behind (8.89, 7.30, and 6.66 mean spat/shell/month, respectively). Site 3 and Haldeman Creek both had the lowest recruitment (1.88 and 0.81, respectively). Site 2 had the highest single-month recruitment peak (38.47 spat/shell) despite modest recruitment in other months (Figure 4).
Figure 4.
Mean monthly spat recruitment (spat settled per shell) on shell stringers deployed from April 2020 through October 2020 at five sites. Error bars represent standard error. p-values are from a Two-way ANOVA on log10 transformed data.
3.4. Relationships Among Variables
Multiple regression models assessing relationships among potential driving factors and response variables of interest (oyster tissue [Cu] and spat recruitment) are summarized in Table 2, with model assessment statistics presented to compare the fit and relative parsimony among models. Water column [Cu] had a positive correlation with oyster tissue [Cu] in all models, as predicted, while salinity was negatively correlated with oyster tissue [Cu] when included as a first-order term. The best model of oyster tissue [Cu] (model 8) included a simple negative correlation with salinity and positive correlation with water column [Cu] (Table 2). The second-best model of oyster tissue [Cu] (model 10) included both a first and a second-order salinity term. Including temperature (models 3–7) did not improve the fit of models of oyster tissue [Cu].
Table 2.
Regression model characteristics and model evaluation statistics for models used to predict oyster tissue [Cu] and oyster spat recruitment.
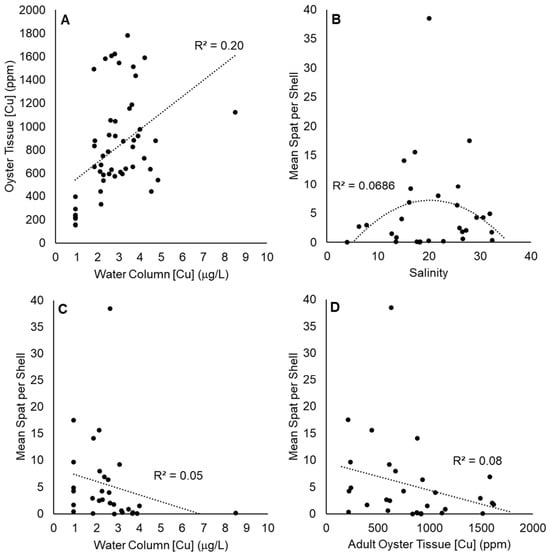
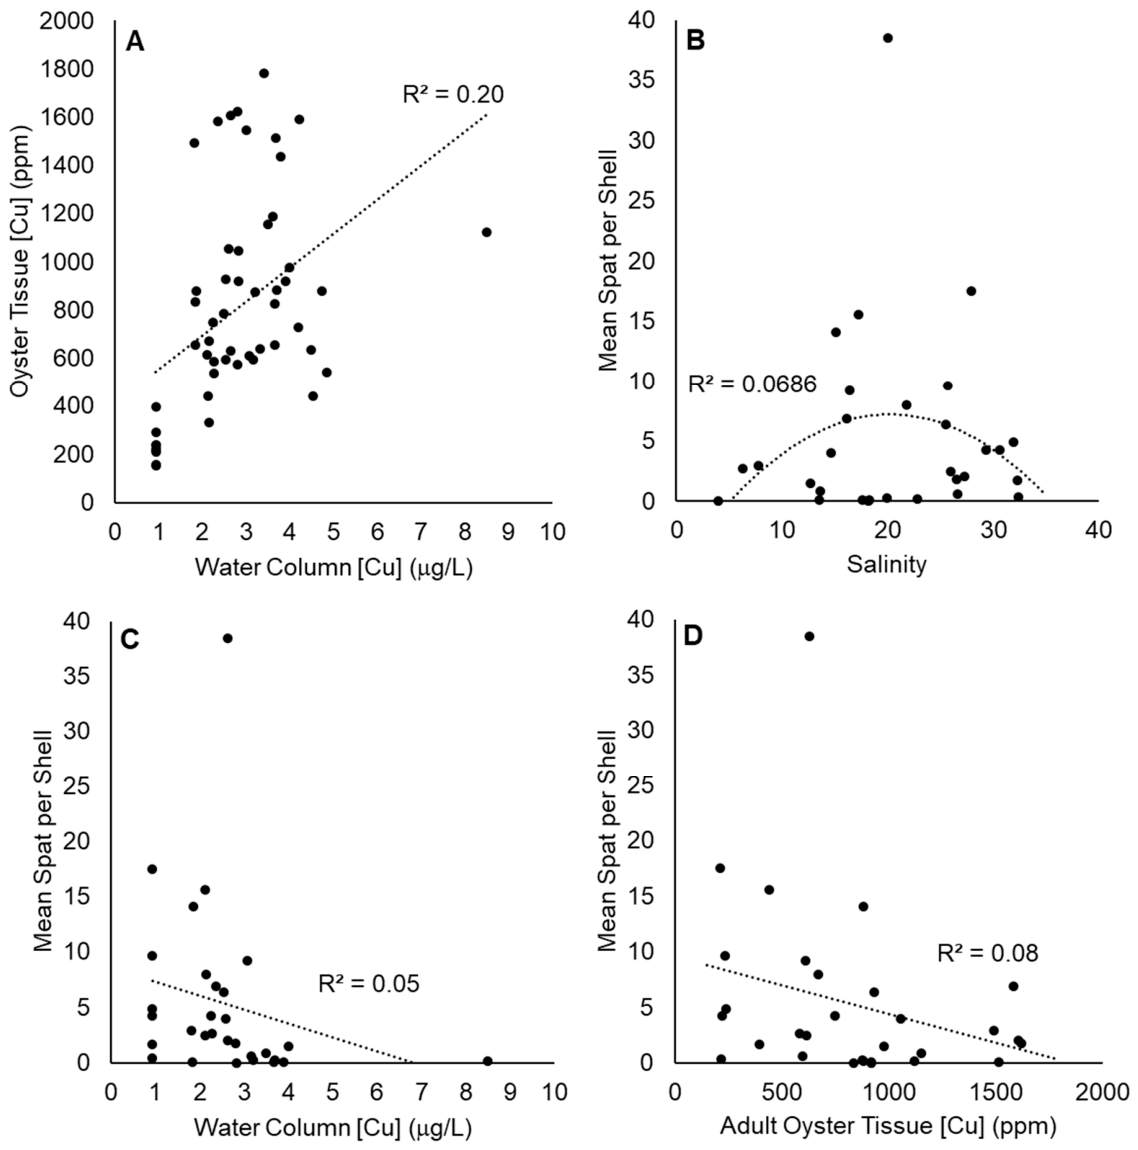
For models of spat recruitment, the best fitting, highest weighted model was 15, which included negative effects of water column [Cu] on recruitment and a polynomial fit of recruitment to salinity consistent with optimal recruitment at moderate salinities. Models 13, 14, and 16 were also effective at explaining spat recruitment relative to the other models examined. These models all included a negative correlation with Cu exposure and the polynomial fit to salinity. Water temperature was not an effective predictor of spat recruitment. Models 20 and 21, which included both water temperature and salinity, had high unadjusted R2 values but were overparameterized and had low weighted model probability. There was high residual variation even in the best models of spat recruitment, as apparent in their low adjusted R2 values and marginally non-significant p-values. Scatterplots of oyster tissue [Cu] vs. water column [Cu] and spat recruitment vs. water column [Cu] are shown to illustrate some of the patterns in the data assessed in the models (Figure 5).
Figure 5.
(A) Scatterplot of oyster tissue [Cu] versus water column [Cu] from monthly measurements at each site, May 2020 through April 2021, with simple linear regression. This plot corresponds with model 1 in Table 2. (B) Scatterplot of spat recruitment versus salinity from monthly measurements at each site, May 2020 through April 2021, with second order polynomial regression. This plot corresponds with model 11 in Table 2. (C) Scatterplot of spat recruitment versus water column [Cu] from monthly measurements at each site, May 2020 through April 2021. This plot corresponds with model 13 in Table 2. (D) Scatterplot of spat recruitment versus adult oyster tissue [Cu] from monthly measurements at each site, May 2020 through April 2021. This plot corresponds with model 14 in Table 2.
4. Discussion
This study confirms earlier evidence of elevated [Cu] in Naples Bay waters and oyster tissue [11,44,59] and finds that water column and tissue [Cu] covary spatially within the estuary. While not reaching the extreme levels that would harm adult oysters, water column [Cu] in Naples Bay approached levels that some laboratory studies have found harmed oyster embryos and larvae [29,32,33]. The highest [Cu] levels were observed near Haldeman Creek, a contaminated tributary, and the lowest levels were at Shell Bay, an undeveloped branch of the estuary. This small-scale correlation pattern corresponds with the broadly demonstrated association of bivalve tissue [Cu] with anthropogenic Cu sources [59,60]. It suggests that despite the complexity of oysters’ active Cu uptake and accumulation processes [6,12,14,17], oyster tissue [Cu] can still be a useful indicator of environmental contamination by copper in estuarine systems [61,62]. The mean tissue [Cu] of 1179 ppm in Haldeman Creek is among the highest tissue [Cu] values reported in the US [59], exceeding levels reported in other heavily urbanized US estuaries like the Patuxent River Estuary, Maryland (450 ppm [63] and the Jamaica Bay Estuary, New York (500–750 ppm [64]). The peak oyster tissue levels in Naples Bay, up to 2868 ppm in an individual oyster, approach the extreme 4400 ppm observed in the “green oyster incident” associated with widespread Crassostrea gigas mortality in Taiwan in 1986 [60].
Our results also emphasize the strong influence of salinity regime on oyster life processes, with reduced spat settlement at low salinity sites and altered demographic structure (fewer large, adult oysters) at the highest salinity site. This is consistent with previous findings of harmful effects of both hyper- and hyposalinity on Crassostrea virginica in this region, reinforcing the importance of managing basin hydrology to avoid extreme high or low freshwater inputs [65]. Avoiding excessive freshwater inputs should also reduce Cu loading to the estuary- Naples Bay sites with lower mean salinity tended to have higher mean [Cu], supporting the assumption that Cu enters the system largely through freshwater inputs. However, peak [Cu] sometimes occurred in the winter dry season when freshwater input was relatively low. This suggests that there is some temporal variation in Cu pollution loading independent of variation in freshwater input. One likely Cu source is copper sulfate algicides, which are typically applied to stormwater features when waters warm and algae blooms develop. This can happen in the late dry season in south Florida [66]. The influx of winter residents and visitors to Naples may also increase copper pollution loading via increased boating activity in the bay itself. Boating activity can introduce copper through ablation of copper-based anti-fouling paints, and through disturbance of sediments resulting in efflux of Cu previously accumulated in sediments [67]. Finer spatiotemporal scale sampling of [Cu] in the watershed and near potential estuarine sources could better distinguish sources and target management actions to reduce anthropogenic Cu inputs in this system.
The hypothesis that deleterious effects of excess copper on oyster larvae may occur in synergy with effects of other stressors (e.g., low salinities), as demonstrated in the laboratory by MacInnes and Calabrese [32], was supported by our model results., i.e., oyster spat recruitment in Naples Bay was better predicted by the combination of [Cu] and salinity than by either factor alone, and the correlation between spat recruitment and water column [Cu] was negative after accounting for salinity. Other published studies identify several physiological mechanisms by which synergistic harm from Cu and salinity stress might occur. For example, metabolomic evidence indicates that stressful salinity levels can overwhelm copper-induced metabolic profiles in oysters [68]. The energetic demands of osmoregulation at suboptimal salinities may reduce the oyster’s metabolic reserves, an effect compounded by a reduction in clearance and feeding rates at these salinities [69], thus reducing the ability to detoxify heavy metals [68].
Regardless of our field observations’ consistency with physiological principles and previous laboratory results, the correlative evidence presented here cannot unambiguously confirm a harmful effect of Cu on oyster larvae in Naples Bay. It is possible that reduced oyster recruitment in high [Cu] areas of the bay is caused by unmeasured factors that covary with [Cu], such as hydrologic conditions unfavorable to larval transport and recruitment, or exposure to other pollutants.
Other pollutants present in urbanized estuaries that have been associated with stress responses, impaired function, and/or increased mortality in Crassostrea virginica include organic contaminants, such as polychlorinated biphenyls [70], pharmaceutical and personal care products [71], the herbicide glyphosate [72], other pesticides, and polycyclic aromatic hydrocarbons [19,73,74]. Metals other than Cu, such as Zn, Pb, and Cd, have also been shown to alter embryo development in Crassostrea spp., especially at lower water temperatures (18 °C), though Cu may have the strongest effect [75]. Given the variety of contaminants potentially present in the complex and variable environments of estuaries like Naples Bay, the difficulties of pollution effect attribution are substantial [76]. However, management actions that reduce multiple pollutants are prudent to implement even as the details of pollutant impacts continue to be resolved. Addressing the watershed sources of Cu, excessive nutrients, and other contaminants to Naples Bay is critical, but the system’s heavily developed landscape and altered hydrology make this challenging. The original Naples Bay watershed was just 67.3 km2, but it was expanded to 611 km2 by the construction of the Golden Gate Canal system, greatly increasing both freshwater and pollution inputs [39]. Efforts to re-route water from the canal system to its original pathways through wetlands east of the Naples area have been proposed and would be helpful for maintaining a stable salinity regime in the bay, reducing loading of multiple pollutants [77,78,79].
While restoring natural watershed hydrology should help reduce loading of Cu and other pollutants, meeting the Florida Department of Environmental Protection (FDEP)’s mandate to cut Cu pollution by up to 68% in Naples Bay’s tributaries will require more direct measures [80]. Unfortunately, some of the most straightforward attempts to accomplish this have encountered legal obstacles. For example, a 2008 City of Naples ordinance prohibiting the use of copper sulfate algicides in city lakes and ponds was enacted but deemed unlawful by the Florida Department of Agriculture and Consumer Services and subsequently repealed. An additional challenge is that copper-based algicides are largely applied by privately owned and managed stormwater detention ponds in untracked quantities and without regular monitoring of concentrations in the treated waterbodies. Public outreach efforts might encourage individual homeowners’ associations and other private groups to voluntarily reduce copper sulfate use, but policy changes at the state level or higher would have broader impact. Among such potential changes, a comprehensive system for tracking application of copper sulfate and other biocides in both publicly and privately managed waters is urgently needed.
In addition to more effective pollutant source control, further work is needed to resolve the ambiguity around pollutant impacts in Naples Bay. Progress could be achieved by broader screening for both metals and organic contaminants in bivalve tissue, sediments, and the water column of the bay and its watershed, in conjunction with exposure experiments on oysters of different life stages in field mesocosms or laboratory settings [81]. Including such ecotoxicological studies in budgeting for coastal resilience projects such as oyster reef restoration and living shorelines projects in Naples Bay and similar urban systems could help ensure the success of such projects while improving management of pollution threats. While such work is costly and time-consuming, it is essential for fully identifying and mitigating factors contributing to oyster loss and lack of recovery in coastal ecosystems [37,38].
5. Conclusions
This field study and multi-model inference exercise confirms that salinity is a primary driver of oyster habitat suitability and spat settlement in Naples Bay and suggests that hydrologic restoration projects reducing extreme drops in salinity would improve ecosystem health. However, the model comparison also supports our hypotheses that areas of the estuary with high Cu inputs exhibit extremely high tissue [Cu] in adult oysters and experience reduced oyster spat settlement not entirely explained by salinity alone. This indicates that reduction in copper pollution should also benefit oyster population health and associated ecosystem services in the bay.
Supplementary Materials
The following supporting information can be downloaded at: https://www.mdpi.com/article/10.3390/hydrobiology5040043/s1, Figure S1. Time series plots of environmental parameters from a data sonde continuously deployed at Site 1 for the latter half of the study period. Data were recorded every 15 min; Figure S2. Biplot of first two principal components from PCA analysis of environmental data collected each month at each site. Labeled arrows represent the original variables as vectors, showing how strongly and in what direction each variable contributes to the principal components. Sal_ppt = Salinity, temp = Water Temperature (°C), do_mgl = Dissolved oxygen (mg/L), and cu_ugl = Water Column [Cu] (mg/L). Colored symbols indicate unique site and date combinations. Site codes are as such: HC = Haldeman Creek, S1 = Site 1, S2 = Site 2, S3 = Site 3, SB = Shell Bay; Figure S3. Salinity measurements by site and month, May 2020 through April 2021; Figure S4. Temperature measurements by site and month, May 2020 through April 2021.
Author Contributions
Conceptualization, R.P., S.T., and J.D.; Methodology, R.P. and J.D.; Software, J.C.; Formal Analysis, R.P., S.T., J.C., C.H., and J.D.; Resources, S.T., J.C., K.L., and J.D.; Writing—Original Draft Preparation, R.P.; Writing—Review and Editing, R.P., S.T., J.C., K.L., C.H., and J.D.; Visualization, R.P. and J.D.; All authors have read and agreed to the published version of the manuscript.
Funding
This research was funded by City of Naples, the National Oceanic and Atmospheric Administration (NOAA) Coastal Resilience Grant Program award #59-6000382, the Florida Department of Environmental Protection agreement #CM820, and by community volunteers and donors including local residents and businesses and the Naples Chapter of the Coastal Conservation Association of Florida (CCA Florida).
Informed Consent Statement
Not applicable.
Data Availability Statement
Data will be made available upon reasonable request to the corresponding author.
Acknowledgments
We thank Stephanie Molloy from the City of Naples Natural Resources Division for valuable input on study design and early versions of the manuscript, and Natalie Hardman and George Bouch for logistical support in later stages of this work.
Conflicts of Interest
The authors declare no conflicts of interest.
References
- Linder, M.C. Biochemistry of Copper; Springer: New York, NY, USA, 1991; pp. 1–526. [Google Scholar]
- Blossom, N. Copper in the ocean environment. Am. Chemet Corp. 2007, 1–8. [Google Scholar] [CrossRef] [Scilit]
- Weng, N.; Jiang, H.; Wang, W.X. Novel insights into the role of copper in critical life stages of oysters revealed by high-resolution nanoSIMS imaging. Environ. Sci. Technol. 2019, 53, 14724–14733. [Google Scholar] [CrossRef] [Scilit] [PubMed]
- Zamuda, C.D.; Sunda, W.G. Bioavailability of dissolved copper to the American oyster Crassostrea virginica. I. Importance of chemical speciation. Mar. Biol. 1982, 66, 77–82. [Google Scholar] [CrossRef] [Scilit]
- Luoma, S.N. Bioavailability of trace metals to aquatic organisms—A Review. Sci. Total Environ. 1983, 28, 1–22. [Google Scholar] [CrossRef] [Scilit] [PubMed]
- Ringwood, A.H.; Conners, D.E.; DiNovo, A. The effects of copper exposures on cellular responses in oysters. Mar. Environ. Res. 1998, 46, 591–595. [Google Scholar] [CrossRef] [Scilit]
- U.S. Environmental Protection Agency (EPA). Draft Aquatic Life Ambient Estuarine/Marine Water Quality Criteria for Copper; EPA-822-P-16-001; U.S. Environmental Protection Agency: Washington, DC, USA, 2016.
- Cima, F.; Varello, R. Immunotoxic effects of exposure to the antifouling copper(I) biocide on target and nontarget bivalve species: A comparative in vitro study between Mytilus galloprovincialis and Ruditapes philippinarum. Front. Physiol. 2023, 14, 1230943. [Google Scholar] [CrossRef] [Scilit] [PubMed]
- Hall, W.S.; Bushong, S.J.; Hall, L.W.; Lenkevich, M.J.; Pinkney, A.E. Monitoring dissolved copper concentrations in Chesapeake Bay, U.S.A. Environ. Monit. Assess. 1988, 11, 33–42. [Google Scholar] [CrossRef] [Scilit] [PubMed]
- Srinivasan, M.; Swain, G.W. Managing the use of copper-based antifouling paints. J. Environ. Manag. 2007, 39, 423–441. [Google Scholar] [CrossRef] [Scilit] [PubMed]
- Huelster, S.A.; Griffin, M. Naples Bay Water Quality and Biological Analysis Report; Streets and Stormwater Department: Naples, FL, USA, 2020. [Google Scholar]
- Kunene, S.C.; Lin, K.S.; Mdlovu, N.V.; Shih, W.C. Bioaccumulation of trace metals and speciation of copper and zinc in Pacific oyster (Crassostrea gigas) using XANES/EXAFS spectroscopies. Chemosphere 2021, 265, 129067. [Google Scholar] [CrossRef] [Scilit] [PubMed]
- Bowen, H.J.M. The cycles of copper, silver, and gold. In The Handbook of Environmental Chemistry, Part D: The Natural Environment and the Biogeochemical Cycles; Hutzinger, D., Ed.; Springer: New York, NY, USA, 1984; pp. 1–26. [Google Scholar]
- Seligman, P.F.; Zirino, A. Chemistry, Toxicity, and Bioavailability of Copper and Its Relationship to Regulation in the Marine Environment; Technical Document 3044; Office of Naval Research Workshop Report: San Diego, CA, USA, 1998.
- Flemmings, C.A.; Trevors, J.T. Copper toxicity and chemistry in the environment: A review. Water Air Soil Pollut. 1989, 44, 143–158. [Google Scholar] [CrossRef] [Scilit]
- Paquin, P.R.; Gorsuch, J.W.; Apte, S.; Batley, G.E.; Bowles, K.C.; Campbell, P.G.C.; Delos, C.G.; Di Toro, D.M.; Dwyer, R.L.; Galvez, F.; et al. The biotic ligand model: A historical overview. Comp. Biochem. Physiol. Part C Toxicol. Pharmacol. 2002, 133, 3–35. [Google Scholar] [CrossRef] [Scilit] [PubMed]
- Marigomez, I.; Soto, M.; Cajaraville, M.P.; Angulo, E.; Giamberini, L. Cellular and subcellular distribution of metals in molluscs. Microsc. Res. Tech. 2002, 56, 358–392. [Google Scholar] [CrossRef] [Scilit] [PubMed]
- Prytherch, H.F. The role of copper in the setting, metamorphosis, and distribution of the American oyster, Ostrea virginica. Ecol. Monogr. 1934, 4, 47–107. [Google Scholar] [CrossRef] [Scilit]
- Oliver, L.M.; Fisher, W.S.; Winstead, J.T.; Hemmer, B.L.; Long, E.R. Relationships between tissue contaminants and defense-related characteristics of oysters (Crassostrea virginica) from five Florida bays. Aquat. Toxicol. 2001, 55, 203–222. [Google Scholar] [CrossRef] [Scilit] [PubMed]
- Brooks, S.J.; Bolam, T.; Tolhurst, L.; Bassett, J.; Roche, J.L.; Waldock, M.; Barry, J.; Thomas, K.V. Effects of dissolved organic carbon on the toxicity of copper to the developing embryos of the Pacific Oyster (Crassostrea gigas). Environ. Toxicol. Chem. 2007, 26, 1756–1763. [Google Scholar] [CrossRef] [Scilit] [PubMed]
- Canesi, L.; Gallo, G.; Gavioli, M.; Pruzzo, C. Bacteria-hemocyte interactions and phagocytosis in marine bivalves. Microsc. Res. Tech. 2002, 57, 469–476. [Google Scholar] [CrossRef] [Scilit] [PubMed]
- Fisher, W.S. Antimicrobial activity of copper and zinc accumulated in eastern oyster amebocytes. J. Shellfish Res. 2004, 23, 321–351. [Google Scholar]
- Song, L.; Wang, L.; Qiu, L.; Zhang, H. Bivalve Immunity. In Invertebrate Immunity; Söderhäll, K., Ed.; Advances in Experimental Medicine and Biology; Springer: Boston, MA, USA, 2010; Volume 708. [Google Scholar]
- Li, Y.; Tsim, K.W.K.; Wang, W.X. Copper promoting oyster larval growth and settlement: Molecular insights from RNA-seq. Sci. Total Environ. 2021, 784, 147159. [Google Scholar] [CrossRef] [Scilit] [PubMed]
- Han, B.C.; Hung, T.C. Green oysters caused by copper pollution on the Taiwan Coast. Environ. Pollut. 1990, 65, 347–362. [Google Scholar] [CrossRef] [Scilit] [PubMed]
- Han, B.C.; Jeng, W.L.; Tsai, Y.N.; Jeng, M.S. Depuration of copper and zinc by green oysters and blue mussels of Taiwan. Environ. Pollut. 1993, 82, 93–97. [Google Scholar] [CrossRef] [Scilit] [PubMed]
- Weng, N.; Wang, W.X. Variations of trace metals in two estuarine environments with contrasting pollution histories. Sci. Total Environ. 2014, 485, 604–614. [Google Scholar] [CrossRef] [Scilit] [PubMed]
- Lu, G.; Zhu, A.; Fang, H.; Dong, Y.; Wang, W.X. Establishing baseline trace metals in marine bivalves in China and worldwide: Meta-analysis and modeling approach. Sci. Total Environ. 2019, 669, 746–753. [Google Scholar] [CrossRef] [Scilit] [PubMed]
- Calabrese, A.; Collier, R.S.; Nelson, D.A.; MacInnes, J.R. The toxicity of heavy metals to embryos of the American oyster Crassostrea virginica. Mar. Biol. 1973, 18, 162–166. [Google Scholar] [CrossRef] [Scilit]
- Roesijadi, G. Environmental factors: Response to metals. In The Eastern Oyster Crassostrea virginica; Kennedy, V.S., Newell, R.I.E., Eble, A.F., Eds.; Maryland Sea Grant College Program, University of Maryland System: College Park, MD, USA, 1996; pp. 515–537. [Google Scholar]
- Gamain, P.; Gonzalez, P.; Cachot, J.; Clerandeau, C.; Mazzella, N.; Gourves, P.Y.; Morin, B. Combined effects of temperature and copper and S-metolachlor on embryo-larval development of the Pacific oyster, Crassostrea gigas. Mar. Pollut. Bull. 2017, 115, 201–210. [Google Scholar] [CrossRef] [Scilit] [PubMed]
- MacInnes, J.R.; Calabrese, A. Combined effects of salinity, temperature, and copper on embryos and early larvae of the American oyster, Crassostrea virginica. Arch. Environ. Contam. Toxicol. 1979, 8, 553–562. [Google Scholar] [CrossRef] [Scilit] [PubMed]
- Hall, M.; Cheung, E.; Abbasi, M.; Churches, N.D. A new behavioral phenotyping strategy for pacific oyster (Crassostrea gigas) larvae reveals cohort-level effects on copper toxicity swimming response. Ann. Aquac. Res. 2016, 3, 1025. [Google Scholar]
- Nell, J.A.; Holliday, J.E. Effects of potassium and copper on the settling rate of Sydney rock oyster (Saccostrea commercialis) larvae. Aquaculture 1986, 58, 263–267. [Google Scholar] [CrossRef] [Scilit]
- Loosanoff, V.L. The American or Eastern Oyster; Circular; U.S. Bureau of Commercial Fisheries: Washington, DC, USA, 1965; pp. 1–36.
- NOAA: Fisheries One Stop Shop. US Territorial Landings Data. Available online: https://www.fisheries.noaa.gov/foss/ (accessed on 21 September 2026).
- Mackenzie, C.L., Jr. Causes underlying the historical decline in eastern oyster (Crassostrea virginica Gmelin, 1791) landings. J. Shellfish Res. 2007, 26, 927–938. [Google Scholar] [CrossRef] [Scilit]
- Bersoza Hernández, A.; Brumbaugh, R.D.; Frederick, P.; Grizzle, R.; Luckenbach, M.W.; Peterson, C.H.; Angelini, C. Restoring the eastern oyster: How much progress has been made in 53 years? Front. Ecol. Environ. 2018, 16, 463–471. [Google Scholar] [CrossRef] [Scilit]
- Schmid, J.R.; Worley, K.; Addison, D.S.; Zimmerman, A.R.; Eaton, A.V. Naples Bay past and present: A chronology of disturbance to an estuary. In Technical Report to the City of Naples; The South Florida Water Management District: West Palm Beach, FL, USA, 2005; pp. 1–58. [Google Scholar]
- Savarese, M.; Fielder, B.; Dellapenna, T. Substrate and Subsurface Mapping of Naples Bay Using Geophysical Techniques: Implications for Oyster Reef Restoration; The South Florida Water Management District: West Palm Beach, FL, USA, 2006.
- Dellapenna, T.M.; Fielder, B.; Noll, C.J., IV; Savarese, M. Geological responses to urbanization of the Naples Bay estuarine system, Southwestern Florida, USA. Estuaries Coasts 2013, 38, 81–96. [Google Scholar] [CrossRef] [Scilit]
- Laakkonen, K.S. Effects of Salinity and Other Stressors on Eastern Oyster (Crassostrea virginica) Health and a Determination of Restoration Potential in Naples Bay, Florida. Master’s Thesis, Florida Gulf Coast University, Fort Myers, FL, USA, 2014. [Google Scholar]
- Florida Department of Environmental Protection (FDEP). Statewide Comprehensive Verified List of Impaired Waters. Available online: https://floridadep.gov/dear/watershed-assessment-section/documents/comprehensive-verified-list (accessed on 22 October 2025).
- Kimbrough, K.L.; Johnson, W.E.; Lauenstein, G.G.; Christensen, J.D.; Apeti, D.A. An Assessment of Two Decades of Contamination Monitoring in the Nation’s Coastal Zone; NOAA Technical Memorandum NOS NCCOS 74; NCCOS: Silver Spring, MD, USA, 2008; pp. 1–105.
- Gardinali, P.R.; Fernandez, A.M.; Ramirez, C.E. Providing Contaminant Data for Coastal Management: Assessing the Effects of Land Based Sources of Pollution on Collier County’s Estuaries and Their Associated Watersheds; SERC Technical Report T-XXX Report 1; Florida International University: Miami, FL, USA, 2014. [Google Scholar]
- Eisler, R. Copper Hazards to Fish, Wildlife, and Invertebrates: A Synoptic Review; Biological Science Report USGS/BRD/BSR--1997-0002; U.S. Geological Survey, Biological Resources Division: Reston, VA, USA, 1998; pp. 1–98.
- Shumway, S.E. Natural environmental factors. In The Eastern Oyster: Crassostrea virginica; Kennedy, V.S., Newell, R.I.E., Eble, A.F., Eds.; Maryland Sea Grant College, University of Maryland: College Park, MD, USA, 1996; pp. 467–513. [Google Scholar]
- NOAA Fisheries Eastern Oyster Biological Review Team. Status Review of the Eastern Oyster (Crassostrea virginica); Technical Memorandum NMFS-F/SPO-88; US National Oceanic and Atmospheric Association: Silver Spring, MD, USA, 2007; p. 115.
- Naples Bay, North, FL—Station ID: 8725114. NOAA Tides & Currents. Available online: https://tidesandcurrents.noaa.gov/stationhome.html?id=8725114 (accessed on 17 May 2024).
- Florida Department of Environmental Protection (FDEP). Quality assurance. In Florida Administrative Code; Florida Department of Environmental Protection (FDEP): Tallahassee, FL, USA, 2018; Chapters 62–160. [Google Scholar]
- U.S. Environmental Protection Agency (EPA). Method 200.8: Determination of Trace Elements in Waters and Wastes by Inductively Coupled Plasma-Mass Spectrometry, Revision 5.4; U.S. Environmental Protection Agency (EPA): Cincinnati, OH, USA, 1994.
- U.S. Environmental Protection Agency (EPA). Method 6020B (SW-846): Inductively Coupled Plasma-Mass Spectrometry, Revision 2; U.S. Environmental Protection Agency (EPA): Washington, DC, USA, 2014.
- Richards, R.G.; Chaloupka, M. Temperature-dependent bioaccumulation of copper in an estuarine oyster. Sci. Total Environ. 2009, 407, 5901–5906. [Google Scholar] [CrossRef] [Scilit] [PubMed]
- Haven, D.S.; Fritz, L.W. Setting of the American oyster Crassostrea virginica in the James River, Virginia, USA: Temporal and spatial distribution. Mar. Biol. 1985, 86, 271–282. [Google Scholar] [CrossRef] [Scilit]
- R Core Team. R: A Language and Environment for Statistical Computing; R Foundation for Statistical Computing: Vienna, Austria, 2025; Available online: https://www.R-project.org/ (accessed on 29 August 2026).
- Sall, J.; Creighton, L.; Lehman, A. JMP ® Start Statistics: A Guide to Statistics and Data Analysis Using JMP®, 4th ed.; SAS Institute Inc.: Cary, NC, USA, 2007; pp. 1–617. [Google Scholar]
- Galtsoff, P.S. The American Oyster Crassostrea virginica (Gmelin); US Government Printing Office: Washington, DC, USA, 1964; Volume 64, pp. 1–480.
- Burnham, K.P.; Anderson, D.R. Model Selection and Inference: A Practical Information-Theoretic Approach, 2nd ed.; Springer: New York, NY, USA, 2002. [Google Scholar]
- O’Connor, T.P.; Lauenstein, G.G. Status and trends of copper concentrations in mussels and oysters in the USA. Mar. Chem. 2005, 97, 49–59. [Google Scholar] [CrossRef] [Scilit]
- Lee, C.L.; Chen, H.Y.; Chuang, M.Y. Use of oyster, Crassostrea gigas, and ambient water to assess metal pollution status of the Charting Coastal area, Taiwan, after the 1986 green oyster incident. Chemosphere 1996, 33, 2505–2532. [Google Scholar] [CrossRef] [Scilit]
- Apeti, D.A.; Robinson, L.; Johnson, E. Relationships between heavy metal concentrations in the American oyster (Crassostrea virginica) and metal levels in the water column and sediment in Apalachicola Bay, Florida. Am. J. Environ. Sci. 2005, 1, 179–186. [Google Scholar] [CrossRef] [Scilit]
- Pourang, N.; Richardson, C.A.; Chenery, S.R.N.; Nasrollahzedeh, H. Assessment of trace elements in the shell layers and soft tissues of the pearl oyster Pinctada radiata using multivariate analyses: A potential proxy for temporal and spatial variations of trace elements. Environ. Monit. Assess. 2014, 186, 2465–2485. [Google Scholar] [CrossRef] [Scilit] [PubMed]
- Riedel, G.F.; Abbe, G.R.; Sanders, J.G. Silver and Copper Accumulation in Two Estuarine Bivalves, the Eastern Oyster (Crassostrea virginica) and the Hooked Mussel (Ischadium recurvum) in the Patuxent River Estuary, Maryland. Estuaries 1995, 18, 445–455. [Google Scholar] [CrossRef] [Scilit] [PubMed]
- Rodney, E.; Herrera, P.; Luxama, J.; Boykin, M.; Crawford, A.; Carroll, M.A.; Catapane, E.J. Bioaccumulation and Tissue Distribution of Arsenic, Cadmium, Copper and Zinc in Crassostrea virginica Grown at Two Different Depths in Jamaica Bay, New York. In Vivo 2007, 29, 16–27. [Google Scholar] [PubMed]
- McFarland, K.; Rumbold, D.; Loh, A.N.; Haynes, L.; Tolley, S.G.; Gorman, P.; Welch, B.; Goodman, P.; Barnes, T.K.; Doering, P.H.; et al. Effects of freshwater release on oyster reef density, reproduction, and disease in a highly modified estuary. Environ. Monit. Assess. 2022, 194, 96. [Google Scholar] [CrossRef] [Scilit] [PubMed]
- Lusk, M.G.; Chapman, K. Copper concentration data for water, sediments, and vegetation of urban stormwater ponds treated with copper sulfate algaecide. Data Brief 2020, 31, 105982. [Google Scholar] [CrossRef] [Scilit] [PubMed]
- Kalnejais, L.H.; Martin, W.R.; Signell, R.P.; Bothner, M.H. Role of Sediment Resuspension in the Remobilization of Particulate-Phase Metals from Coastal Sediments. Environ. Sci. Technol. 2007, 41, 2282–2288. [Google Scholar] [CrossRef] [Scilit] [PubMed]
- Cao, C.; Wang, W.X. Copper-induced metabolic variation of oysters overwhelmed by salinity effects. Chemosphere 2017, 174, 331–341. [Google Scholar] [CrossRef] [Scilit] [PubMed]
- Casas, S.M.; Lavaud, R.; LaPeyre, M.K.; Comeau, L.A.; Filgueira, R.; LaPeyre, J.F. Quantifying salinity and season effects on eastern oyster clearance and oxygen consumption rates. Mar. Biol. 2018, 165, 90. [Google Scholar] [CrossRef] [Scilit]
- Chu, F.E.; Soudant, P.; Hale, R.C. Relationship between PCB accumulation and reproductive output in conditioned oysters Crassostrea virginica fed a contaminated algal diet. Aquat. Toxicol. 2003, 65, 293–307. [Google Scholar] [CrossRef] [Scilit] [PubMed]
- Brew, D.W.; Black, M.C.; Santos, M.; Rodgers, J.; Henderson, W.M. Metabolomic Investigations of the Temporal Effects of Exposure to Pharmaceuticals and Personal Care Products and Their Mixture in the Eastern Oyster (Crassostrea virginica). Environ. Toxicol. Chem. 2019, 39, 419–436. [Google Scholar] [CrossRef] [Scilit] [PubMed]
- Chowdhury, A.; Rahman, M.S. Molecular and biochemical biomarkers in the American oyster Crassostrea virginica exposed to herbicide Roundup at high temperature. Environ. Sci. Pollut. Res. 2023, 30, 94757–94778. [Google Scholar] [CrossRef] [Scilit] [PubMed]
- Garcia, S.M.; Du Clos, K.T.; Hawkins, O.H.; Gemmell, B.J. Sublethal Effects of Crude Oil and Chemical Dispersants on Multiple Life History Stages of the Eastern Oyster, Crassostrea virginica. J. Mar. Sci. Eng. 2020, 8, 808. [Google Scholar] [CrossRef] [Scilit]
- Mitra, S.; Bartel, J.; Volety, A.K. Trace Organic Contaminants (PAHS, PCBs, and Pesticides) in Oysters Crassostrea virginica, from the Caloosahatchee Estuary and Estero Bay, SW Florida. In Pesticides—The Impacts of Pesticides Exposure; Stoytcheva, M., Ed.; InTech: Rijeka, Croatia, 2011. [Google Scholar] [CrossRef] [Scilit] [PubMed]
- Noetzel, D.C.; Colsoul, B.; Akcha, F.; Briant, N.; Le Roy, J.; Francois, V.; Stavrakakis, C.; Pogoda, B.; Sokolova, I.M. Effect of temperature and trace metal exposure on early life stages of European flat oysters and Pacific oysters. Mar. Environ. Res. 2025, 211, 107376. [Google Scholar] [CrossRef] [Scilit] [PubMed]
- Kennish, M.J. Environmental threats and environmental future of estuaries. Environ. Conserv. 2002, 29, 78–107. [Google Scholar] [CrossRef] [Scilit]
- Tetra Tech. City of Naples Integrated Water Resources Plan. 2008. Available online: https://www.naplesgov.com/media/64026 (accessed on 25 September 2026).
- Bauer, M.R.; O’Donnell, P. City of Naples Natural Resources Division Trawling Efforts in Naples Bay. Available online: https://www.naplesgov.com/media/138881 (accessed on 25 September 2026).
- U.S. Army Corps of Engineers. Picayune Strand Restoration Project. Available online: https://www.saj.usace.army.mil/Missions/Environmental/Ecosystem-Restoration/Picayune-Strand-Restoration-Project/ (accessed on 25 September 2026).
- Florida Department of Environmental Protection (FDEP). Naples Bay, Haldeman Creek, Rock Creek Copper TMDL Report. Available online: https://floridadep.gov/dear/water-quality-evaluation-tmdl/documents/naples-bay-haldeman-creek-rock-creek-copper-tmdl. (accessed on 25 September 2026).
- O’Brien, A.L.; Keough, M.J. Detecting benthic community responses to pollution in estuaries: A field mesocosm approach. Environ. Pollut. 2013, 175, 45–55. [Google Scholar] [CrossRef] [Scilit] [PubMed]

Disclaimer/Publisher’s Note: The statements, opinions and data contained in all publications are solely those of the individual author(s) and contributor(s) and not of MDPI and/or the editor(s). MDPI and/or the editor(s) disclaim responsibility for any injury to people or property resulting from any ideas, methods, instructions or products referred to in the content. |
© 2026 by the authors. Licensee MDPI, Basel, Switzerland. This article is an open access article distributed under the terms and conditions of the Creative Commons Attribution (CC BY) license.