


Abstract
Identifying a therapeutic dose requires simultaneous consideration of efficacy and toxicity while controlling erroneous statistical conclusions across multiple dose levels. This study develops a joint confidence-based framework for identifying the minimum effective dose (MinED) and maximum safe dose (MaxSD) in trials with binary endpoints. The proposed approach integrates simultaneous confidence bounds, stepwise testing and the partitioning principle to characterise dose boundaries while addressing multiplicity. The theoretical framework establishes strong familywise error rate (FWER) control when the underlying joint confidence region achieves its required simultaneous coverage. A simultaneously adjusted Farrington–Manning score-based implementation was evaluated through a clinical illustration and simulation studies involving varying sample sizes, treatment effects and efficacy–toxicity dependence structures. The clinical illustration identified 100 mg as the only investigated dose satisfying both prespecified efficacy and safety criteria. Simulation results demonstrated favourable empirical FWER control, simultaneous coverage close to the nominal level and greater dose-identification power than a conservative exact-binomial benchmark, particularly with increasing sample sizes and treatment effects. These findings demonstrate the potential of simultaneous confidence-based inference for therapeutic-window identification, while highlighting the need for further finite-sample validation of the approximate score-based implementation.
1. Introduction
Recommended drug dosages are determined by balancing efficacy and safety considerations. Typically, increasing the dose of a treatment improves efficacy but also increases the risk of toxicity. However, at sufficiently high doses, the efficacy response may plateau or decline while toxicity may continue to increase. This trade-off leads to the idea of a therapeutic window, defined as the range of doses that are clinically effective and acceptably safe. Identifying this window requires the simultaneous determination of a minimum effective dose (MinED) and a maximum safe dose (MaxSD).
From a statistical perspective, studies aimed at identifying therapeutic windows pose two major challenges. First, efficacy and safety are often evaluated at multiple dose levels, leading to multiplicity across both endpoints and doses. Second, when efficacy and safety outcomes are observed within the same patient, inappropriate handling of these endpoints as separate analyses can inflate the familywise error rate (FWER). The FWER refers to the probability of making at least one false rejection among the collection of dose-specific efficacy and safety hypotheses tested simultaneously. As a result, statistical procedures that do not properly account for this joint structure may lead to misleading conclusions.
Various methodologies have been proposed to address challenges in identifying effective and safe doses. Multiple-test procedures, such as those proposed by Tamhane and Logan [1], have been developed to jointly identify the minimum effective and maximum safe doses while controlling the FWER. Tamhane and Logan’s testing method [1] has the disadvantage of not indicating which doses are ineffective or unsafe. The authors also noted that when a testing procedure requires multiplicity adjustment, the multivariate t-distribution becomes insensitive to the correlation coefficient. Model-based approaches, such as the Multiple Comparison Procedures and Modelling framework (MCP–Mod) employed by [2,3], combine parametric dose–response models with contrast tests to improve efficiency. However, [4] argues that MCP-Mod should not be used to make a specific claim that a drug has a positive effect in a single dose.
Bayesian and utility-based designs allow explicit trade-offs between a treatment’s efficacy and toxicity [5]. As discussed in the research by [6,7], these Bayesian and utility-based designs can help researchers balance the potential benefits and harms of new therapies. However, their implementation can be difficult, especially in the early phases of research or in studies with small sample sizes [8]. The main drawbacks of these methods are their reliance on parametric model assumptions, prior specifications, and subjective utility functions, all of which may be difficult to justify or validate with limited data, potentially affecting the reliability of the study’s conclusions [8].
Another line of research focuses on confidence-based procedures. Stepwise confidence interval methods for monotone dose–response relationships [9] offer an intuitive way to measure uncertainty without relying on a specific parametric model. These methods provide clear decision rules for identifying MinED and MaxSD. In addition, the confidence interval approaches provide additional data, such as confidence bounds for initial doses that are ineffective or unsafe. However, standard confidence interval approaches often require conservative multiplicity adjustments or relatively large sample sizes to maintain adequate error control, especially when several endpoints are considered [10]. Related approaches include benchmark dose methods in toxicity, which use profile likelihood or bootstrap confidence bounds [11,12], as well as tolerance interval and percentile-based approaches that focus on individual-level assurance. Together, these methods illustrate an important trade-off: confidence-based approaches offer transparent and interpretable measures of uncertainty but often require larger sample sizes or careful multiplicity control, whereas model-based intervals may appear more precise but risk understating uncertainty if the assumed model does not adequately represent the data.
Existing approaches differ in their underlying assumptions, inferential objectives, and treatment of multiplicity. Tamhane and Logan [1] developed multiple-testing procedures for jointly identifying the minimum effective and maximum safe doses, while MCP–Mod combines multiple comparisons with parametric dose–response modelling [2]. Bayesian efficacy–toxicity approaches, such as that of Thall and Cook [13], employ posterior decision criteria to evaluate treatment trade-offs. For binary endpoints, Newcombe’s confidence interval construction [14] and the Farrington–Manning score approach [15] provide methods for inference on differences between independent proportions, but do not independently establish simultaneous dose-boundary identification across efficacy and safety endpoints. The present study extends these approaches by developing a unified two-stage confidence-based framework that integrates treatment–control risk differences, ordered stepwise efficacy and safety assessments, and the partitioning principle to identify the therapeutic window. Strong familywise error rate control is established under the simultaneous confidence-bound coverage condition.
The present study develops a two-stage stepwise confidence-based procedure for identifying the MinED and MaxSD using binary efficacy and toxicity endpoints. By first establishing the MinED, researchers can identify the lowest dose meeting the prespecified efficacy criterion. Subsequently, the MaxSD can be determined by evaluating the highest dose satisfying the prespecified safety criterion [16]. Building on the stepwise confidence interval framework of Hsu and Berger [17] and the partitioning principle of Finner and Strassburger [18], the procedure combines ordered dose comparisons with simultaneous confidence bounds for treatment–control risk differences. The partitioning principle characterises the admissible dose-boundary configurations, while strong FWER control follows under the simultaneous coverage condition.
Although intersection–union principles provide a general framework for simultaneous inference, the proposed approach differs by constructing a sequential confidence-based decision procedure that exploits the ordered nature of dose levels. Rather than testing the therapeutic window as a single composite hypothesis, the proposed method identifies the boundary doses defining the window, namely the lowest dose satisfying efficacy requirements and the highest dose satisfying safety requirements. This produces clinically interpretable decisions on doses for which efficacy and safety are statistically established while retaining strong familywise error control under the simultaneous coverage condition.
The applicability of this article is limited to settings in which efficacy and safety are assessed as separate marginal outcomes within the same study using predefined binary endpoints at ordered dose levels. Although joint modelling approaches using copula-based methods [19], latent-variable frameworks [20], or interdependent functional forms [21] explicitly account for dependence between efficacy and toxicity outcomes, the proposed procedure targets marginal efficacy and safety differences rather than the joint distribution of patient-level outcomes. Consequently, the identification of MinED and MaxSD is based on separate confidence bounds for efficacy and safety. The theoretical framework does not require independence between efficacy and toxicity outcomes, provided that the joint confidence-region calibration accommodates their dependence. However, strong dependence between efficacy and safety outcomes may be relevant when the objective is to estimate joint patient-level benefit–risk probabilities or optimise treatment allocation. Existing simulation evidence suggests that, for dose selection objectives, approaches based on separate marginal assessments can perform similarly to more complex joint models under certain conditions [19]. Moreover, separate marginal assessments may be reasonable in settings where sample sizes are limited, outcomes are binary rather than continuous [22] or time-to-event responses [23], prior correlation information is unavailable, and transparent implementation is prioritised [20]. Given the practical constraints of early-phase trials, particularly small samples, binary endpoints, and the need for interpretable decision rules, the separate marginal inference framework adopted in this study provides a practical approach for therapeutic window identification.
The remainder of the article is organised as follows. Section 2 introduces the statistical framework and presents the proposed two-stage stepwise confidence procedure based on simultaneously calibrated Farrington–Manning score confidence bounds. Section 3 presents the clinical illustration using the randomised Phase II lasmiditan trial, evaluates the procedure’s familywise error control and statistical power through simulation studies, and discusses the principal findings. Section 4 presents the concluding remarks.
2. Statistical Methods
2.1. Binary Endpoints and Dose Definitions
Consider a study involving a control group and k ordered treatment dose levels . Let represent the binary efficacy and toxicity outcomes, respectively, observed for the patient assigned to group i. Both variables take values in , with indicating the occurrence of the prespecified efficacy response and indicating the occurrence of the toxicity event. The two responses may be statistically dependent within a patient; however, observations from different patients and treatment groups are assumed to be independent. Patients within each group are assumed to have common marginal response probabilities.
Let and denote the population probabilities of efficacy and toxicity, respectively, at dose level i. The corresponding numbers of observed events are and , where is the number of patients assigned to group i. Consequently, the marginal event counts follow binomial distributions, and , with sample proportions and . The population efficacy and toxicity probabilities are assumed to be nondecreasing across the ordered treatment doses, such that and .
The minimum effective dose (MinED) is defined as the lowest treatment dose that produces an improvement in efficacy exceeding a clinically prespecified margin relative to control. Similarly, the maximum safe dose (MaxSD) is the highest treatment dose for which the incremental toxicity risk remains below a prespecified tolerability margin . These criteria are expressed through the population risk differences
Their corresponding estimators are
The hypotheses for identifying the MinED and MaxSD are given by
where and are clinically prespecified thresholds for efficacy and safety, respectively.
The conventional Wilson score confidence interval for a single binomial proportion [24] cannot be applied directly to a treatment–control risk difference because both proportions contribute sampling uncertainty. Newcombe [14,25,26] addressed this problem through a hybrid-score construction based on individual Wilson intervals, while Shan et al. [27] examined continuity-corrected Wilson intervals for risk differences. In the present study, inference is based on the Farrington–Manning restricted-variance score approach [15], which directly accommodates the two-sample risk-difference estimand.
Given that X and Y represent efficacy and safety data, respectively, the proposed inferential framework employs a constrained two-sample score statistic, with calibration of its rejection probabilities under the corresponding null hypotheses. Let denote the lower confidence bound for the efficacy risk difference and the upper confidence bound for the toxicity risk difference. A dose is declared effective when , and safe when . The construction and calibration of these bounds are specified in the subsequent subsection.
Within the proposed framework, the population MinED and MaxSD are defined, respectively, by and For mathematical completeness, when no treatment dose satisfies the efficacy criterion, MinED is assigned the sentinel value . Similarly, when no treatment dose satisfies the safety criterion, MaxSD is assigned the sentinel value 0. Under the assumption that efficacy and toxicity probabilities are non-decreasing across the ordered dose levels, the therapeutic window is defined as
Accordingly, the therapeutic window comprises the set of treatment doses for which both the minimum efficacy requirement and the maximum tolerable toxicity criterion are satisfied. When the MinED exceeds the MaxSD, no dose simultaneously satisfies both requirements. Importantly, these definitions represent population-level therapeutic boundaries and should be distinguished from their sample-based estimates, since failure to establish statistical evidence of efficacy or safety does not necessarily imply that the corresponding population criterion is violated.
2.2. Stepwise Confidence-Based Procedure
This section introduces a two-stage, stepwise confidence-based procedure for identifying the therapeutic window. The proposed approach leverages the natural ordering of dose levels and bases statistical inference on confidence intervals. The procedure uses separate marginal assessments of efficacy and toxicity while retaining the common control group in each treatment–control comparison. The first stage identifies doses for which there is sufficient statistical evidence that the incremental efficacy exceeds the clinically prespecified threshold . The second stage identifies doses for which the incremental toxicity remains below the prespecified tolerability threshold .
Stage I examines efficacy hypotheses sequentially from the highest to the lowest dose, while Stage II examines safety hypotheses from the lowest to the highest dose. Each sequence terminates at the first non-rejection, and the estimated MinED and MaxSD are determined from the corresponding consecutive rejections. The estimated therapeutic window comprises the doses between these boundaries, provided both are established and .
The stopping rules are prespecified and are not modified in response to the observed significance pattern. A non-rejection is interpreted as insufficient evidence to establish efficacy or safety under the corresponding hypothesis, rather than evidence that the dose necessarily lacks efficacy or is unsafe. The theoretical error-control properties of the procedure depend on the simultaneous coverage of the efficacy and toxicity confidence bounds across all dose levels, rather than the validity of individual tests alone.
Let denote the joint parameter space of the efficacy and toxicity risk differences across the k treatment doses. For each , define the efficacy and safety null sets by and , respectively. Their complements are and . These sets represent the clinically prespecified efficacy and safety hypotheses evaluated using the corresponding treatment–control risk differences. Although the elementary hypothesis sets may overlap, their intersections and complements provide the basis for constructing a partition of the joint parameter space.
The overlapping efficacy and safety hypotheses induce a partition of the parameter space into mutually exclusive regions representing distinct combinations of their truth values. Let denote the finite index set of nonempty partition cells and write for the resulting partition. By construction, for , and . Having as a partition makes it possible for exactly one of the disjoint subsets to contain the true parameter . Performing nominal level tests on each of the subsets , provides a framework for controlling the FWER, provided that the partition-based testing procedure satisfies the required error-control conditions [28]. These properties are established in Proposition 1.
For each treatment dose , let and denote the numbers of efficacy responses observed among and evaluable participants in the treatment and control groups, respectively. The estimated efficacy risk difference is with and
To obtain valid inference for this two-sample contrast, we employ a Farrington–Manning restricted-variance score statistic [15]. For a candidate risk difference , let and denote the constrained maximum-likelihood estimates under . Define
Similarly, for the toxicity endpoint, let and denote the numbers of participants experiencing the specified toxicity event among and evaluable participants, respectively. The corresponding estimated risk difference and score statistic are where and
where the constrained estimates satisfy . The score statistics are defined by their continuous limiting values where a constrained variance is zero, whenever such a limit exists; degenerate cases are otherwise handled directly through the exact binomial sampling distribution.
To account simultaneously for efficacy and toxicity across the ordered doses, let denote a candidate vector of treatment–control risk differences, where is the admissible parameter space under the assumed dose ordering. We combine the directional score statistics through
Let denote the collection of joint sampling distributions compatible with the candidate risk differences, the control-group nuisance probabilities, the dose-ordering restrictions, and the observed sampling design. This collection allows for unknown dependence between efficacy and toxicity and for the shared control group. For each candidate vector, we obtain a nuisance-adjusted p-value by
where Z denotes the observed binary efficacy and toxicity data, whereas represents a replicate dataset generated under an admissible joint sampling distribution Q. The joint confidence region, , is then constructed by retaining all candidate vectors whose nuisance-adjusted p-values exceed : This construction accommodates the simultaneous uncertainty associated with both outcomes and all dose–control comparisons. In particular, when the joint tail probabilities are evaluated exactly, or replaced by certified conservative upper bounds, the resulting confidence region has coverage of at least under the specified sampling model.
The one-sided lower efficacy confidence bound for each treatment dose is obtained by taking the smallest efficacy risk difference contained in the joint confidence region:
If is empty, is conservatively set to . A treatment dose is declared to have established efficacy when . Correspondingly, the one-sided upper toxicity confidence bound is defined by the largest toxicity risk difference contained in the same joint confidence region:
If is empty, is conservatively set to 1. A treatment dose is declared to satisfy the prespecified statistical safety criterion when .
The following algorithm formalises the proposed stepwise procedure for identifying the and .
Stage I: Identification of the
Stage I evaluates the efficacy across dose levels. The is defined as the lowest dose in the uninterrupted sequence of statistically established efficacy decisions, beginning at the highest treatment dose. For an interior boundary , this requires and , with for every . If , then no dose is statistically established as effective. If for every , then all investigated doses are statistically established as effective.
- Step 1: Compute the lower efficacy confidence bound for each treatment dose .
- Step 2: Beginning at dose , assess whether . If the criterion is satisfied, proceed to dose . Continue until the first dose at which , or until all treatment doses have been examined.
- Step 3: If the descending sequence of doses satisfying the efficacy criterion extends from dose k to dose M, define For , the boundary is characterised by , and for all .
If , no minimum effective dose is statistically established, and set . If every dose satisfies , set . A dose at which the efficacy criterion is not satisfied is not necessarily ineffective; rather, the procedure does not establish efficacy at the prescribed confidence level.
Stage II: Identification of the
Stage II evaluates safety using an analogous stepwise approach. The is defined as the highest dose in the uninterrupted sequence of statistically established safety decisions, beginning at the lowest treatment dose. For an interior boundary , this requires and , with for every . If , then no dose is statistically established as satisfying the safety criterion. If for every , then all investigated doses are statistically established as satisfying the safety criterion.
- Step 1: Compute the upper toxicity confidence bound for each treatment dose .
- Step 2: Beginning at dose , assess whether . If the criterion is satisfied, proceed to dose . Continue until the first dose at which , or until all treatment doses have been examined.
- Step 3: If the ascending sequence of doses satisfying the safety criterion extends from dose 1 through dose B, define For , the boundary is characterised by , and for all .
If , no maximum safe dose is statistically established, and set . If every dose satisfies , set . Failure to satisfy the upper confidence-bound criterion indicates that safety has not been statistically established; it does not necessarily imply that the dose is unsafe.
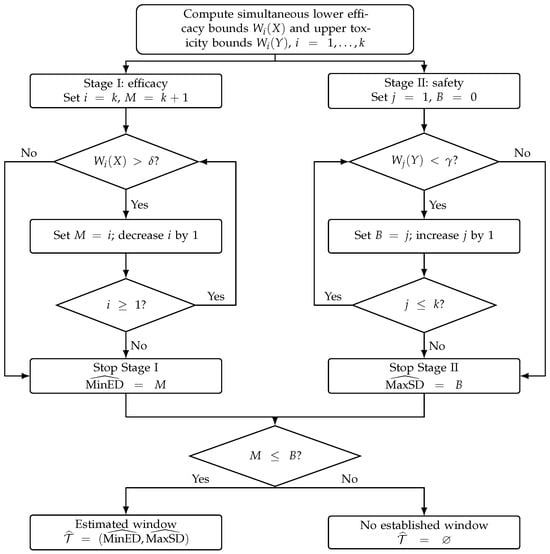
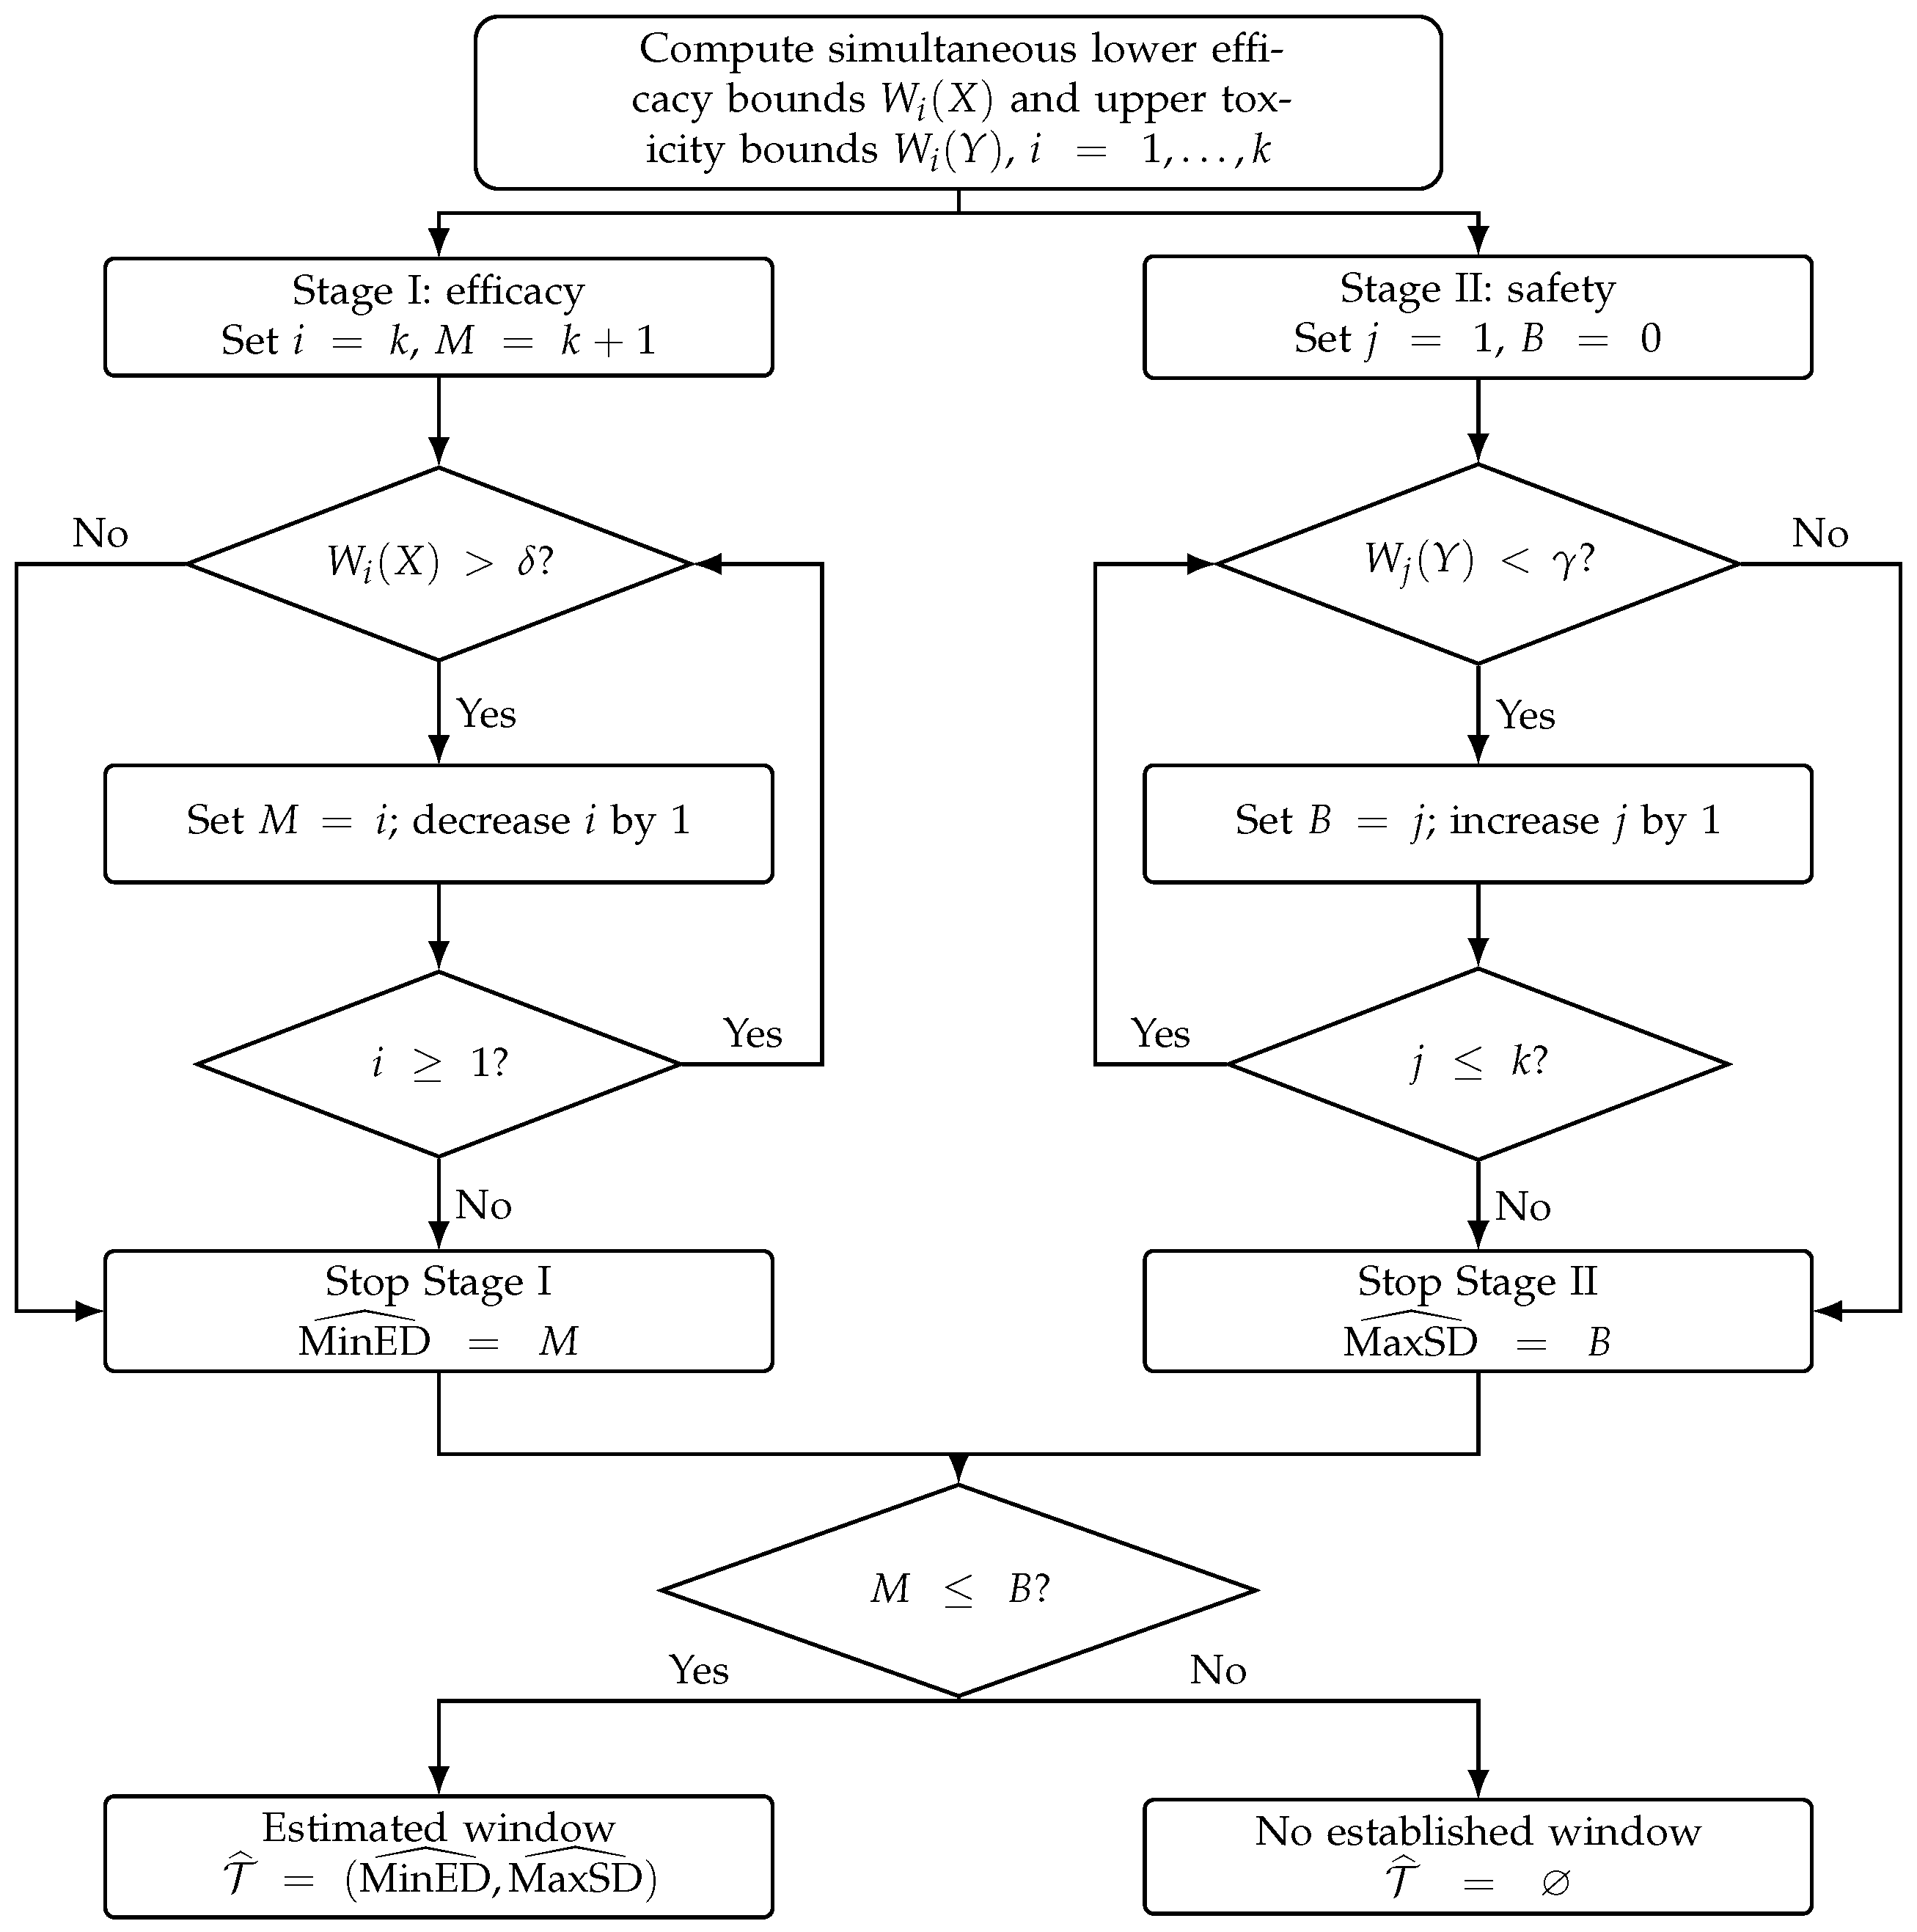
This procedure also covers cases in which no dose is statistically established as effective or safe. Likewise, it follows the prespecified stopping rules even when observed proportions or confidence bounds are not monotonic across dose levels. Decisions beyond the first non-rejection in each direction are not used to extend the estimated boundary. The complete two-stage stepwise procedure is illustrated in Figure 1. The flowchart summarises the sequential efficacy and safety assessments, the corresponding stopping rules, and the possible outcomes of therapeutic-window identification, including cases where no dose is statistically established as effective or safe.
Figure 1.
Two-stage stepwise confidence-based procedure for identifying the , , and estimated therapeutic window. The stopping rules are applied regardless of whether the observed bounds are monotonic. The initial values and cover cases in which no efficacy or safety hypothesis is rejected.
The simultaneous inferential properties of the confidence-bound procedure are examined through the partitioning principle. Proposition 1 establishes conditions under which the joint efficacy–safety decisions strongly control the familywise error rate.
Proposition 1.
Let denote the experimental data, where X and Y represent the observed binary efficacy and toxicity outcomes, respectively, from the random samples at the treatment and control dose levels. If Θ is a parameter space, assume that . The marginal efficacy and toxicity event counts follow binomial distributions characterised by the parameter vector . For and , the multiple comparisons of interest are defined by and . Let and of the parameter vector θ be defined as the lower efficacy and upper toxicity confidence bounds, respectively. These bounds induce one-sided confidence sets and , which are directed towards the alternative hypothesis sets and , respectively. Let M denote the lowest dose index in the consecutive sequence of efficacy rejections obtained by testing from dose k downwards, and let B denote the highest dose index in the consecutive sequence of safety rejections obtained by testing from dose 1 upwards. If no efficacy hypothesis is rejected at the first step, set ; if no safety hypothesis is rejected at the first step, set . Assume that for all and satisfy the simultaneous coverage condition
Then, for every , the probability of rejecting at least one true efficacy or safety null hypothesis is at most α. Consequently, the two-stage stepwise confidence-based procedure strongly controls the familywise error rate at level α.
The proof of Proposition 1 is provided in Appendix A.
Remark 1.
The two-stage stepwise procedure described in Proposition 1 enables the simultaneous identification of the estimated and while maintaining control of the FWER under the simultaneous coverage condition. In Stage I, screening begins at the highest dose level and progresses sequentially towards lower doses . For each dose level, the lower efficacy confidence bound , defined in Equation (3), is compared with the prespecified efficacy threshold δ. The lowest dose in the uninterrupted sequence satisfying is identified as . If , no minimum effective dose is statistically established. In Stage II, screening begins at the lowest dose level and progresses sequentially towards higher doses . The upper toxicity confidence bound , defined in Equation (4), is examined until the first dose at which , where γ denotes the prespecified maximum acceptable increase in toxicity relative to control. The highest dose in the uninterrupted sequence satisfying is identified as . If , no dose is statistically established as satisfying the safety criterion. Conversely, if and all preceding doses satisfy the sequential criterion, the highest investigated dose is identified as .
The procedure does not require an additional adjustment of the nominal significance level at each sequential comparison, because the confidence bounds have already been jointly calibrated to satisfy the simultaneous coverage condition in Proposition 1. Consequently, the control of false efficacy and safety declarations follows from the simultaneous confidence-bound construction rather than from treating the individual comparisons as independent.
The identification of a treatment dose as effective or safe is therefore understood in relation to the prespecified statistical thresholds and the available evidence. Failure to satisfy either confidence-bound criterion does not establish that a dose is ineffective or unsafe. Furthermore, the procedure relies on the assumed non-decreasing population probabilities of efficacy and toxicity across ordered doses. Although the observed proportions and confidence bounds need not themselves be monotonic, substantial departures from the population monotonicity assumptions may affect the interpretation of the estimated dose boundaries and require alternative modelling approaches.
3. Results and Discussion
The results of applying the MinED and MaxSD procedures to the Randomised Phase II Lasmiditan Trial are presented and discussed. The study assesses the performance of two statistical procedures in terms of FWER control and statistical power using simulation studies.
3.1. Application: Randomised Phase II Lasmiditan Trial
This section illustrates the proposed two-stage confidence-based approach using published data from the MONONOFU trial reported by Sakai et al. [29]. The study was a multicentre, randomised, double-blind, placebo-controlled phase II clinical trial conducted in Japan to evaluate the efficacy and safety of lasmiditan for the acute treatment of migraine. Participants were randomly assigned to receive placebo or one of three increasing oral doses of lasmiditan: 50 mg, 100 mg and 200 mg. The trial therefore provides a clinically relevant setting to examine efficacy and safety boundaries across ordered treatment doses.
The primary efficacy endpoint was headache pain freedom two hours after treatment administration. Efficacy was represented by a binary indicator, with a value of one assigned to participants who were headache pain-free at two hours and zero otherwise. The safety endpoint considered in the present application was the occurrence of at least one treatment-emergent adverse event (TEAE) within 48 h. after treatment. This endpoint was similarly represented by a binary indicator, with one indicating the occurrence of a TEAE and zero indicating its absence. These definitions permit the estimation of marginal efficacy and toxicity probabilities at each treatment dose and their corresponding risk differences relative to placebo.
Table 1 presents the efficacy and safety data extracted from Sakai et al. [29]. The efficacy observations were obtained from the modified intention-to-treat population, whereas the safety observations were obtained from the safety population. Consequently, the numbers of evaluable participants differ slightly between the two endpoints. The treatment–control risk differences are therefore calculated using the endpoint-specific sample sizes.
Table 1.
Observed binary efficacy and toxicity outcomes from the MONONOFU trial.
For each treatment dose, the efficacy and toxicity risk differences relative to placebo are estimated by
respectively. The resulting estimates are presented in Table 2.
Table 2.
Estimated efficacy and toxicity risk differences relative to placebo.
To determine the and , the efficacy and toxicity risk differences were examined using one-sided Farrington–Manning restricted-variance score confidence bounds. The analysis accounts for uncertainty in estimating the treatment and control event probabilities and applies a simultaneous normal-approximation critical value to the six directional dose-specific comparisons. At the nominal significance level , the simultaneous critical value was calculated as , where denotes the number of treatment doses. The resulting lower efficacy and upper toxicity confidence bounds are presented in Table 3.
Table 3.
Simultaneously adjusted Farrington–Manning score confidence bounds for efficacy and toxicity risk differences.
For this illustration, the efficacy and toxicity thresholds were set at and , respectively. These thresholds represent a minimum efficacy improvement of one percentage point and a maximum allowable increase in the probability of treatment-emergent adverse events of sixty percentage points relative to placebo. Both thresholds are adopted for methodological illustration rather than as clinically established treatment criteria. In particular, the relatively large toxicity threshold should not be interpreted as an acceptable clinical safety margin for lasmiditan. Its purpose is to illustrate how the proposed procedure identifies dose boundaries under prespecified efficacy and safety requirements. Because these thresholds determine the rejection criteria, the estimated therapeutic window may change when alternative values are selected.
Stage I: Determination of
Beginning with the highest treatment dose, the lower efficacy confidence bound at 200 mg was 0.1340, exceeding the prespecified efficacy threshold of 0.01. We therefore rejected the efficacy null hypothesis and proceeded to the next lower dose. At 100 mg, the lower efficacy confidence bound was 0.0579, which also exceeded the efficacy threshold, providing evidence of efficacy at this dose. At 50 mg, however, the lower bound was , which did not exceed the threshold. The sequential procedure consequently stopped, identifying 100 mg as the estimated minimum effective dose:
Stage II: Determination of
Beginning with the lowest treatment dose, the upper toxicity confidence bound at 50 mg was 0.4132, below the prespecified toxicity threshold of 0.60. The statistical safety criterion was therefore established, and the procedure continued to the next higher dose. At 100 mg, the upper toxicity confidence bound was 0.5688, which also remained below the threshold. At 200 mg, however, the upper confidence bound increased to 0.6638, exceeding the prespecified toxicity threshold. The sequential procedure therefore stopped, identifying 100 mg as the estimated maximum safe dose:
Applying the two-stage stepwise procedure, both MinED and MaxSD were identified as 100 mg. Efficacy was established at 100 and 200 mg, while the prespecified safety criterion was satisfied at 50 mg and 100 mg. Consequently, 100 mg represented the only investigated dose meeting both criteria, indicating a narrow therapeutic window. These findings demonstrate the practical utility of the confidence-based procedure for identifying efficacy and safety boundaries using binary outcomes. The results are conditional on the selected thresholds and approximate score calibration, and motivate further evaluation of the procedure’s familywise error control and statistical power through simulation.
A sensitivity analysis was conducted to examine the influence of alternative efficacy and toxicity thresholds on the estimated therapeutic window. Using the confidence bounds reported in Table 3, the and were recalculated under different prespecified thresholds while retaining the original stepwise decision rules. Increasing the efficacy threshold from 0.01 to 0.05 did not change the identified therapeutic window of 100 mg. However, increasing the efficacy threshold to 0.10 shifted the to 200 mg, while the remained at 100 mg, resulting in no established therapeutic window. Reducing the toxicity threshold from 0.60 to 0.50 similarly eliminated the therapeutic window, whereas increasing it to 0.70 extended the to 200 mg. These results demonstrate that therapeutic-window identification depends on the prespecified efficacy and safety margins and reinforce the importance of selecting clinically justified thresholds before applying the procedure.
3.2. Simulation Study
To evaluate the FWER and statistical power of the proposed two-stage stepwise procedure, we conducted a simulation study in R (version 4.3.2) under various efficacy and toxicity configurations. The simulation examined the performance of the Farrington–Manning (FM) score-based procedure under complete and partial null hypotheses, different sample sizes, and varying dependence structures between efficacy and toxicity outcomes. A control group and three increasing treatment doses were considered. The control-group efficacy and toxicity probabilities were fixed at and , respectively, while the treatment probabilities were varied to represent different efficacy and safety boundaries. The prespecified efficacy and toxicity thresholds were set at and , respectively.
Seven configurations were investigated. The complete-null scenario specified efficacy probabilities of and toxicity probabilities of . Two partial-null scenarios considered efficacy probabilities of with toxicity probabilities of , and efficacy probabilities of with toxicity probabilities of , respectively. A single-dose therapeutic-window configuration combined efficacy probabilities of with toxicity probabilities of . A boundary configuration used efficacy probabilities of and toxicity probabilities of , placing selected risk differences exactly at the null thresholds. Finally, enhanced- and strong-efficacy configurations used efficacy probabilities of and , respectively, while maintaining toxicity probabilities of . The latter three configurations with a therapeutic window were designed so that the true MinED and MaxSD were both Dose 2.
For each configuration, paired binary efficacy and toxicity outcomes were generated using admissible joint Bernoulli distributions. Within-patient dependence was varied between the lower and upper Fréchet bounds, with independence considered as an intermediate case. For a specified pair of marginal probabilities and , let . The four joint outcome probabilities were defined as , , , and , corresponding respectively to the outcome pairs (1,1), (1,0), (0,1), and (0,0). The lower and upper Fréchet bounds for are and , respectively, while independence corresponds to . These specifications allow different within-patient dependence structures while preserving the marginal efficacy and toxicity probabilities. We examined sample sizes of , 100, and 200 participants per group, with the same sample size assigned to the control group and each of the three treatment groups, using 10,000 independent simulation replications for each configuration. The nominal significance level was fixed at .
The primary procedure used one-sided FM restricted-variance score tests with a simultaneous normal-approximation critical value, where , giving . The resulting efficacy and safety decisions were evaluated using the descending and ascending stepwise rules, respectively. A conservative comparator was constructed from exact one-sided Clopper–Pearson binomial limits, using an error allocation of across the eight component probability limits.
The principal performance measures were the empirical FWER, simultaneous directional-score coverage, and the probability of correctly identifying both dose boundaries. In addition, the probabilities of correctly identifying the MinED and MaxSD separately were considered as measures of boundary-specific performance. The FWER was calculated as the proportion of simulated trials in which at least one true efficacy or toxicity null hypothesis was incorrectly rejected. Specifically, the reported empirical FWER was evaluated across all elementary efficacy and safety comparisons before applying the stepwise stopping rules. Since the stepwise procedure restricts the set of rejected hypotheses, these values provide conservative empirical upper bounds for the FWER of the proposed two-stage procedure under the investigated configurations. For the FM procedure, simultaneous coverage was assessed using the six directional score inequalities evaluated at the true parameter vector; the exact-binomial benchmark used its corresponding component-limit coverage criterion. The resulting measure represents an empirical coverage diagnostic for the normal-calibrated directional-score region, rather than direct verification of the simultaneous coverage of the exact nuisance-adjusted joint confidence region or its projected bounds defined in Equations (3) and (4). Correct dose-boundary identification was defined as where and denote the true minimum effective and maximum safe doses, respectively. The separate identification probabilities are defined by and . Monte Carlo confidence intervals were obtained for the empirical FWER estimates.
3.2.1. Control of Familywise Error Rate
The FWER values represent the maximum observed error rate across the nine combinations of sample size and endpoint dependence within each scenario, while the coverage probabilities are the corresponding averages. Let and denote the efficacy and safety null hypothesis sets, respectively. FWER is said to be strongly controlled at level if
Table 4 presents the empirical FWER and simultaneous coverage results across the seven simulation scenarios.
Table 4.
Maximum empirical familywise error rates across all elementary efficacy and safety comparisons, with 95% Monte Carlo confidence intervals, and simultaneous directional-score coverage probabilities for the FM procedure and exact-binomial benchmark.
Across all simulation configurations, the empirical FWER calculated across all elementary comparisons remained below the nominal significance level of 0.05 for the Farrington–Manning procedure. The maximum observed FWER was 0.0351 (95% Monte Carlo CI: 0.0317–0.0389), compared with 0.0007 for the conservative exact-binomial benchmark. Since the stepwise stopping rules restrict the set of rejected hypotheses, these values also provide conservative empirical bounds on the FWER of the proposed two-stage procedure under the investigated configurations.
3.2.2. Statistical Power and Dose-Boundary Identification
Statistical power was evaluated as the probability of correctly identifying both the true MinED and MaxSD. This measure represents joint dose-boundary identification accuracy under the specified data-generating configurations. Table 5 presents the estimated identification probabilities for the three configurations. The reported values are averaged across the three dependence structures. Separate probabilities of correctly identifying the MinED and MaxSD are defined by Equations (6) and (7), respectively, while Equation (8) represents their joint identification probability. Let denote the lower one-sided confidence bound for the efficacy contrast at dose level q, obtained using the simultaneous calibration described in Section 3.2, and let denote the corresponding one-sided upper confidence bound for the safety contrast. The minimum effective dose is correctly identified as dose i if all dose levels satisfy the efficacy criterion, while dose does not. This event may be written as
Table 5.
Probability of correctly identifying the MinED–MaxSD pair, with 95% Monte Carlo confidence intervals.
Similarly, the maximum safe dose is correctly identified as dose j if all dose levels satisfy the safety criterion, while dose does not. This event is given by
In this formulation, the power of the procedure is defined as the probability that both the true minimum effective dose and the true maximum safe dose are simultaneously identified. Let denote the true therapeutic window under the data-generating mechanism. Then the power is
The boundary-identification probabilities in Equations (6) and (7) apply directly to interior dose boundaries. For the first and last treatment doses, the corresponding adjacent-dose conditions are omitted where they fall outside the investigated dose range. When no dose meets the population efficacy criterion, the true MinED is assigned the sentinel value , whereas when no dose meets the population safety criterion, the true MaxSD is assigned the sentinel value 0. Correct identification in these cases requires the estimated boundary to equal its corresponding sentinel value. Thus, separate MinED and MaxSD identification probabilities can be calculated consistently across all simulation configurations.
The results indicate that correct dose-boundary identification improved with increasing sample size and efficacy magnitude. At , the FM procedure achieved an identification probability of 0.0384 (95% CI: 0.0363–0.0407) under the original efficacy configuration. This increased to 0.6840 (95% CI: 0.6787–0.6893) under enhanced efficacy and 0.9856 (95% CI: 0.9842–0.9869) under strong efficacy, demonstrating substantial gains in statistical power as treatment effects increased.
The FM procedure consistently outperformed the exact-binomial benchmark in identifying the true MinED–MaxSD pair. Under enhanced efficacy at , the identification probability was 0.6840 for the FM procedure, compared with 0.2164 (95% CI: 0.2118–0.2211) for the exact-binomial benchmark. Under strong efficacy, the corresponding probabilities were 0.9856 and 0.8692 (95% CI: 0.8653–0.8730), respectively. The lower identification probabilities of the exact-binomial benchmark are consistent with its conservative confidence-bound construction, which makes rejection of the efficacy and safety null hypotheses more difficult. Conversely, the less conservative FM procedure achieved higher identification probabilities under the investigated configurations, although its approximate calibration does not provide the same finite-sample coverage guarantee as the exact-binomial benchmark.
Table 6 extends the joint dose-boundary analysis by reporting the probabilities of correctly identifying the MinED and MaxSD separately. The results reveal that correct MinED identification was generally more challenging than MaxSD identification, particularly under weaker efficacy effects. For the Farrington–Manning procedure, at a sample size of 200, the probability of correctly identifying the MinED increased from 0.0416 under the original efficacy configuration to 0.6863 and 0.9881 under enhanced and strong efficacy, respectively, while the corresponding MaxSD identification probabilities remained above 0.996. This pattern suggests that efficacy-boundary uncertainty was the principal constraint on joint therapeutic-window identification in the investigated scenarios. The findings also demonstrate the value of evaluating individual dose boundaries alongside their joint identification probability.
Table 6.
Separate probabilities of correctly identifying the MinED and MaxSD under the three efficacy configurations.
3.3. Discussion of Main Findings
The findings illustrate the potential of the proposed procedure for jointly identifying efficacy and safety boundaries while accounting for multiplicity across binary endpoints. The clinical illustration identified 100 mg as the only investigated dose satisfying both prespecified criteria. This result is conditional on the selected thresholds and the approximate confidence-bound calibration.
The simulations showed favourable empirical error control across the investigated configurations, including partial-null and threshold-boundary scenarios under different efficacy–toxicity dependence structures. The Farrington–Manning procedure also achieved higher joint dose-boundary identification probabilities than the conservative exact-binomial benchmark, particularly with larger samples and stronger treatment effects. Separate boundary-identification results suggest that uncertainty in establishing the MinED was the principal constraint on joint identification under the simulated conditions.
The theoretical contribution lies in combining ordered stepwise decisions with simultaneous confidence bounds and parameter-space partitioning. Strong FWER control follows under the simultaneous coverage condition of Proposition 1. However, the numerical implementation uses normal-calibrated Farrington–Manning score bounds rather than the exact nuisance-adjusted joint confidence region. Its finite-sample properties therefore remain subject to further validation. The procedure also relies on population dose ordering and prespecified efficacy and toxicity thresholds, which may affect the resulting therapeutic window.
4. Concluding Remarks
This study developed a two-stage confidence-based framework for jointly identifying the minimum effective and maximum safe doses in studies with binary efficacy and toxicity endpoints. By combining simultaneous confidence bounds, ordered stepwise decisions and the partitioning principle, the procedure provides a systematic approach to therapeutic-window identification. The theoretical framework establishes strong FWER control under simultaneous confidence-bound coverage, while the clinical illustration and simulations demonstrate the potential of the approximate Farrington–Manning implementation. Further work should examine its finite-sample calibration and performance under alternative dose-response patterns and clinically justified decision thresholds.
Supplementary Materials
The following supporting information can be downloaded at: https://www.mdpi.com/article/10.3390/appliedmath6110200/s1. Supplementary Script S1: Baseline simulation: five scenarios; Supplementary Script S2: Extended simulation: two higher-efficacy scenarios; Supplementary Script S3: Combining simulation summaries and calculating pooled boundary-identification estimates.
Author Contributions
Conceptualization, J.A.A., M.J.A. and E.D.K.; methodology, J.A.A., E.D.K., M.J.A. and S.N.; software, E.D.K. and M.J.A.; validation, E.D.K., S.N. and J.D.; formal analysis, J.A.A. and M.J.A.; investigation, J.A.A. and E.D.K.; resources, S.N. and J.D.; data curation, J.A.A. and M.J.A.; writing—original draft preparation, J.A.A. and E.D.K.; writing—review and editing, E.D.K., S.N., M.J.A. and J.D.; visualization, J.D. and M.J.A.; supervision, E.D.K. and S.N.; project administration, J.A.A. and E.D.K. All authors have read and agreed to the published version of the manuscript.
Funding
This research received no external funding.
Institutional Review Board Statement
Not applicable.
Informed Consent Statement
Not applicable.
Data Availability Statement
The clinical efficacy and safety data used in this study were obtained from the published MONONOFU Phase II clinical trial reported by Sakai et al. [29] and are publicly available in the original publication. The relevant clinical data and simulation results are presented within this article. The R scripts used for the principal simulation analyses are provided as Supplementary Material to facilitate reproducibility. The original-efficacy results in Table 6 were generated from a separately seeded follow-up simulation, as disclosed in the manuscript.
Conflicts of Interest
The authors declare no conflicts of interest.
Appendix A. Proof of Proposition 1
Proof.
Consider the sets as a partition of the parameter space . They are defined as follows:
Let . For any , we have . Consequently,
Similarly, consider the sets as another partition of :
Let . Then, for every ,
Combining Equations (A1) and (A2), we obtain
The joint intersections are therefore mutually disjoint and collectively exhaustive over . Under the assumed dose ordering, these intersections correspond to the admissible population MinED and MaxSD configurations. Empty intersections are excluded from the partition.
Suppose that the efficacy and safety confidence bounds satisfy the assumed simultaneous coverage condition
for every parameter value and all efficacy–safety comparisons simultaneously.
Here, denotes the lower efficacy confidence bound and denotes the upper safety confidence bound. To express these bounds as confidence sets in the parameter space, define
For the boundary cases, take and .
Consider the following confidence set:
Using the partition representations, Equation (A5) can be expressed as
The empty intersections in Equation (A6) are interpreted as . It remains to establish the simultaneous coverage probability and its implication for the familywise error rate.
Since and are partitions of , every fixed parameter value belongs to exactly one joint partition cell for some and .
By the definition of , the event
implies . Since the joint partition cells are disjoint, these events are equivalent for the fixed parameter .
The assumed simultaneous coverage condition in Equation (A4) implies that the true parameter satisfies every efficacy and safety confidence-bound constraint simultaneously. In particular, it satisfies the constraints corresponding to its true partition cell.
Consequently,
Thus, the proposed partition-based confidence set satisfies the asserted coverage bound under the stated assumptions.
Finally, consider any true efficacy null hypothesis . If this hypothesis is rejected, then
indicating failure of the corresponding lower confidence bound to cover its true parameter.
Similarly, if a true safety null hypothesis is rejected, then
indicating failure of the corresponding upper confidence bound.
Let denote the simultaneous coverage event in Equation (A4). It follows that the rejection of at least one true efficacy or safety null hypothesis implies that does not occur. Hence,
Since this inequality holds for every , the proposed two-stage stepwise procedure strongly controls the familywise error rate at level . The descending efficacy and ascending safety stopping rules do not increase this error probability, since they restrict the hypotheses rejected using the simultaneously calibrated confidence bounds.
Furthermore, whenever the true parameter belongs to the joint confidence region , the corresponding partition cell necessarily intersects that region. Thus, the partitioning principle retains the true MinED–MaxSD configuration on this event, while the simultaneous coverage condition provides the required strong FWER guarantee.
This completes the proof of Proposition 1. □
References
- Tamhane, A.C.; Logan, B.R. Multiple test procedures for identifying the minimum effective and maximum safe doses of a drug. J. Am. Stat. Assoc. 2002, 97, 293–301. [Google Scholar] [CrossRef] [Scilit]
- Bretz, F.; Pinheiro, J.C.; Branson, M. Combining multiple comparisons and modeling techniques in dose-response studies. Biometrics 2005, 61, 738–748. [Google Scholar] [CrossRef] [Scilit] [PubMed]
- Zhou, Y.; Chen, S.; Sullivan, D.; Li, Y.; Zhang, Y.; Xie, W.; Zhang, H.; Tang, Y.; Wang, L.; Hartford, A.; et al. Dose-ranging design and analysis methods to identify the minimum effective dose (MED). Contemp. Clin. Trials 2017, 63, 59–66. [Google Scholar] [CrossRef] [Scilit] [PubMed]
- Koenig, F.; Krasnozhon, S.; Bornkamp, B.; Bretz, F.; Glimm, E.; Graf, A.; Xi, D. Closed MCP-Mod for Pairwise Comparisons of Several Doses With a Control. Stat. Med. 2025, 44, e70124. [Google Scholar] [CrossRef] [Scilit] [PubMed]
- Xu, X.; Yuan, Y.; Lee, J.J. Assessing the role of correlation between efficacy and toxicity endpoints in the performance of Bayesian optimal phase II design. Contemp. Clin. Trials 2025, 154, 107939. [Google Scholar] [CrossRef] [Scilit] [PubMed]
- Yuan, Y.; Nguyen, H.Q.; Thall, P.F. Bayesian Designs for Phase I–II Clinical Trials; Chapman & Hall/CRC New York: New York, NY, USA, 2016. [Google Scholar]
- Gould, A.L. Dose Selection Balancing Efficacy and Toxicity Using Bayesian Model Averaging. Stat. Biopharm. Res. 2025, 18, 39–50. [Google Scholar] [CrossRef] [Scilit]
- Brown, A.R.; Gajewski, B.J.; Mudaranthakam, D.P.; Pasnoor, M.; Dimachkie, M.M.; Jawdat, O.; Herbelin, L.; Mayo, M.S.; Barohn, R.J. Conducting a bayesian multi-armed trial with response adaptive randomization for comparative effectiveness of medications for CSPN. Contemp. Clin. Trials Commun. 2023, 36, 101220. [Google Scholar] [CrossRef] [Scilit] [PubMed]
- Peng, J.; Lee, C.I.C.; Davis, K.A.; Wang, W. Stepwise confidence intervals for monotone dose–response studies. Biometrics 2008, 64, 877–885. [Google Scholar] [CrossRef] [Scilit] [PubMed]
- Efird, J.T.; Nielsen, S.S. A method to compute multiplicity corrected confidence intervals for odds ratios and other relative effect estimates. Int. J. Environ. Res. Public Health 2008, 5, 394–398. [Google Scholar] [CrossRef] [Scilit] [PubMed]
- Crump, K.S. Calculation of benchmark doses from continuous data. Risk Anal. 1995, 15, 79–89. [Google Scholar] [CrossRef] [Scilit]
- Wheeler, M.W.; Bailer, A.J. Model averaging software for dichotomous dose response risk estimation. J. Stat. Softw. 2008, 26, 1–15. [Google Scholar] [CrossRef] [Scilit]
- Thall, P.F.; Cook, J.D. Dose-Finding Based on Efficacy–Toxicity Trade-Offs. Biometrics 2004, 60, 684–693. [Google Scholar] [CrossRef] [Scilit] [PubMed]
- Newcombe, R.G. Interval estimation for the difference between independent proportions: Comparison of eleven methods. Stat. Med. 1998, 17, 873–890. [Google Scholar] [CrossRef] [Scilit]
- Farrington, C.P.; Manning, G. Test statistics and sample size formulae for comparative binomial trials with null hypothesis of non-zero risk difference or non-unity relative risk. Stat. Med. 1990, 9, 1447–1454. [Google Scholar] [CrossRef] [Scilit] [PubMed]
- Zohar, S.; Chevret, S. The continual reassessment method: Comparison of Bayesian stopping rules for dose-ranging studies. Stat. Med. 2001, 20, 2827–2843. [Google Scholar] [CrossRef] [Scilit] [PubMed]
- Hsu, J.C.; Berger, R.L. Stepwise confidence intervals without multiplicity adjustment for dose—response and toxicity studies. J. Am. Stat. Assoc. 1999, 94, 468–482. [Google Scholar] [CrossRef] [Scilit] [PubMed]
- Finner, H.; Strassburger, K. The partitioning principle: A powerful tool in multiple decision theory. Ann. Stat. 2002, 30, 1194–1213. [Google Scholar] [CrossRef] [Scilit]
- Cunanan, K.; Koopmeiners, J.S. Evaluating the performance of copula models in phase I-II clinical trials under model misspecification. BMC Med. Res. Methodol. 2014, 14, 51. [Google Scholar] [CrossRef] [Scilit] [PubMed]
- Lee, J.; Thall, P.F.; Ji, Y.; Müller, P. Bayesian dose-finding in two treatment cycles based on the joint utility of efficacy and toxicity. J. Am. Stat. Assoc. 2015, 110, 711–722. [Google Scholar] [CrossRef] [Scilit] [PubMed]
- Thall, P.F.; Estey, E.H.; Sung, H.G. A new statistical method for dose-finding based on efficacy and toxicity in early phase clinical trials. Investig. New Drugs 1999, 17, 155–167. [Google Scholar] [CrossRef] [Scilit] [PubMed]
- Bekele, B.N.; Shen, Y. A Bayesian approach to jointly modeling toxicity and biomarker expression in a phase I/II dose-finding trial. Biometrics 2005, 61, 343–354. [Google Scholar] [CrossRef] [Scilit] [PubMed]
- Yuan, Y.; Yin, G. Bayesian dose finding by jointly modelling toxicity and efficacy as time-to-event outcomes. J. R. Stat. Soc. Ser. C Appl. Stat. 2009, 58, 719–736. [Google Scholar] [CrossRef] [Scilit]
- Wilson, E.B. Probable inference, the law of succession, and statistical inference. J. Am. Stat. Assoc. 1927, 22, 209–212. [Google Scholar] [CrossRef] [Scilit]
- Newcombe, R.G. Two-sided confidence intervals for the single proportion: Comparison of seven methods. Stat. Med. 1998, 17, 857–872. [Google Scholar] [CrossRef] [Scilit]
- Newcombe, R.G. Statistical applications in orthodontics: Part II. Confidence intervals for proportions and their differences. J. Orthod. 2000, 27, 339–340. [Google Scholar] [PubMed]
- Shan, G.; Lou, X.; Wu, S.S. Continuity corrected Wilson interval for the difference of two independent proportions. J. Stat. Theory Appl. 2023, 22, 38–53. [Google Scholar] [CrossRef] [Scilit] [PubMed]
- Xu, H.; Hsu, J.C. Applying the generalized partitioning principle to control the generalized familywise error rate. Biom. J. 2007, 49, 52–67. [Google Scholar] [CrossRef] [Scilit] [PubMed]
- Sakai, F.; Takeshima, T.; Homma, G.; Tanji, Y.; Katagiri, H.; Komori, M. Phase 2 randomized placebo-controlled study of lasmiditan for the acute treatment of migraine in Japanese patients. Headache J. Head Face Pain 2021, 61, 755–765. [Google Scholar] [CrossRef] [Scilit] [PubMed]

Disclaimer/Publisher’s Note: The statements, opinions and data contained in all publications are solely those of the individual author(s) and contributor(s) and not of MDPI and/or the editor(s). MDPI and/or the editor(s) disclaim responsibility for any injury to people or property resulting from any ideas, methods, instructions or products referred to in the content. |
© 2026 by the authors. Licensee MDPI, Basel, Switzerland. This article is an open access article distributed under the terms and conditions of the Creative Commons Attribution (CC BY) license.