


Abstract
Background/Objectives: The Q-Collar™, a device that mildly compresses the jugular veins to increase cranial fluid volume, has been investigated for potential protection against brain changes associated with concussive and subconcussive impacts during athletic events involving physical contact. However, physiological responses using this device as well as the physical and cognitive performance outcomes remain unclear. Therefore, the purpose of the study was to investigate hemodynamic, metabolic, prefrontal cortex oxygenation (PFC-O2Hb), choice reaction time (CRT) via the Stroop test, and time-to-completion outcomes with and without Q-Collar™ use. Methods: Eleven male participants qualified for inclusion into the repeated-measures randomized crossover study following an incremental cycling cardiopulmonary exercise test. Upon qualification, participants visited the lab twice to complete a 5 km cycling time trial with and without Q-Collar™ use. Each visit was separated by at least 72 h. Results: No statistically significant differences in hemodynamic, blood lactate (BLa−), PFC-O2Hb, or time-to-completion outcomes were found comparing Q-Collar™ use to a Control condition. However, improved CRT was found during, immediately following, and 10 min post the time trial relative to a resting CRT baseline. Conclusions: No statistically significant acute differences were detected between Q-Collar™ and Control for measured outcomes during a 5 km cycling time trial in this exploratory study. Smaller effects cannot be excluded, and because jugular compression was not verified during exercise, these findings reflect the effect of wearing a manufacturer-fitted Q-Collar™ rather than verified jugular compression. CRT was shorter during and after exercise relative to rest in both conditions, although repeated-testing effects cannot be excluded.
1. Introduction
Despite protective interventions (i.e., use of helmets and implementation of contactless practice sessions), sport-related traumatic brain injury (sTBI) has received greater recognition as a major public health concern [1,2,3,4,5,6,7]. Athletes who remain vulnerable to concussive and/or cumulative effects of repeated subconcussive events are at risk for cognitive impairment (e.g., memory problems) [7]. Over time, microstructural changes occurring within the brain may drive mental deterioration following symptomatic (i.e., concussive events that meet diagnostic criteria) and repetitive subconcussive asymptomatic impacts [8,9,10,11,12,13,14,15]. Depending on the athlete’s sTBI history, a poor long-term prognosis combined with reported lower quality of life scores [16] highlights a need for effective strategies to mitigate the effects of repeated asymptomatic subconcussive events within athletic populations.
The Q-Collar™, a U-shaped mild jugular vein compression device worn around the neck, increases blood flow resistance that reduces venous emptying from vasculature surrounding the brain. The resulting changes in intracranial fluid dynamics have been proposed as a potential mechanism for mitigating brain alterations associated with repetitive head impacts, although the clinical significance and protective efficacy of this mechanism remain uncertain [8,9,17,18,19]. Preliminary investigations involving athletes participating in contact sports (e.g., soccer, football, and hockey) have reported associations between Q-Collar™ use and reduced changes in neuroimaging markers of white matter integrity [8,9,17,18,19], as well as favorable short-term neurocognitive outcomes [17] and changes in neural efficiency during a working memory task [18]. However, these findings should be interpreted cautiously, as the available evidence does not establish that Q-Collar™ use prevents concussion or other brain injuries, nor does it comprehensively establish its safety during high-intensity exercise. Although evidence suggests no decrements to postural control, dynamic stabilization, isokinetic strength, and power measures in healthy young adults [19], research appears sparse in directly examining performance outcomes while wearing the Q-Collar™. Given the effect on cerebral venous blood flow and intracranial fluid dynamics elicited from Q-Collar™ use, one hypothetical concern is that increased jugular compression could impair cerebral blood flow (CBF) during athletic performance, potentially accelerating the onset of fatigue.
In the absence of Q-Collar™ use, preliminary evidence following maximal effort cycling exercise tests has demonstrated reduced global cerebral blood flow (CBF) in younger elite athletes, despite no change in cerebral oxygen extraction fraction (OEF) when compared to baseline values [20]. Specifically, CBF reductions were observed in regions linked to motor control, including the bilateral striatum and right inferior frontal gyrus (rIFG) [20,21]. Additionally, participants with longer test times had an attenuated reduction in CBF within the rIFG (r2 = 0.55, p = 0.006) and OEF within the left striatum (r2 = 0.52, p = 0.008), suggesting that maintaining cerebral perfusion may play a key role in sustaining exercise performance [20]. Reductions in cerebral blood flow during high-intensity exercise may be partly attributable to hyperventilation-induced decreases in arterial CO2, which promote cerebrovascular vasoconstriction [22]. Consequently, changes in ventilation and arterial CO2 may contribute to transient reductions in cerebral perfusion during strenuous exercise. As such, ventilatory responses above the anaerobic threshold may contribute to transient cerebral hypoperfusion, a potentially limiting factor during maximal aerobic efforts.
Because jugular venous compression may alter intracranial fluid dynamics, it is important to establish whether wearing the Q-Collar™ changes physiological or performance responses during strenuous exercise. Cerebral blood flow can be influenced by exercise intensity and arterial CO2 [20,21,22,23], but it is not established that restricting jugular venous outflow preserves cerebral perfusion during exercise. Accordingly, the present study assessed prefrontal cortex oxygenated hemoglobin (PFC-O2Hb), cardiovascular responses, choice reaction time (CRT), and cycling performance as separate outcomes rather than assuming a causal pathway between them.
Understanding how Q-Collar™ use affects time-trial performance outcomes and PFC-O2Hb during high-intensity exercise in non-contact athletes is crucial. Furthermore, evidence [8,9,17,18,19] supports the Q-Collar™’s efficacy in increasing jugular venous resistance. Consequently, this practical approach reflects the intended real-world application of the Q-Collar™, where standardized fitting procedures are used without continuous monitoring of jugular venous flow or intracranial fluid dynamics during athletic participation [8,9]. Therefore, the current study adopted the manufacturer’s standardized fitting protocol, consistent with previous investigations evaluating the Q-Collar™. Cycling was selected as a controlled, non-weight-bearing activity to examine responses to wearing the collar without the confounding influence of head impacts. In addition, a 5 km time trial reliably elicits near-maximal cardiovascular strain, thereby providing a valid yet experimentally controlled framework to examine potential alterations in regional prefrontal oxygenation and exercise performance. These acute outcomes are distinct from the device’s proposed effects on head-impact-related injury, which were not evaluated. Therefore, the aim of this study was to evaluate acute perceptual, physiological, and cognitive outcomes during a 5 km cycling time trial with and without the Q-Collar™ in recreationally trained men.
2. Materials and Methods
2.1. Experimental Design and Protocol Familiarization
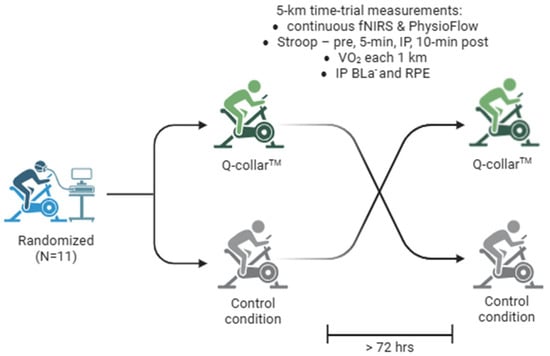
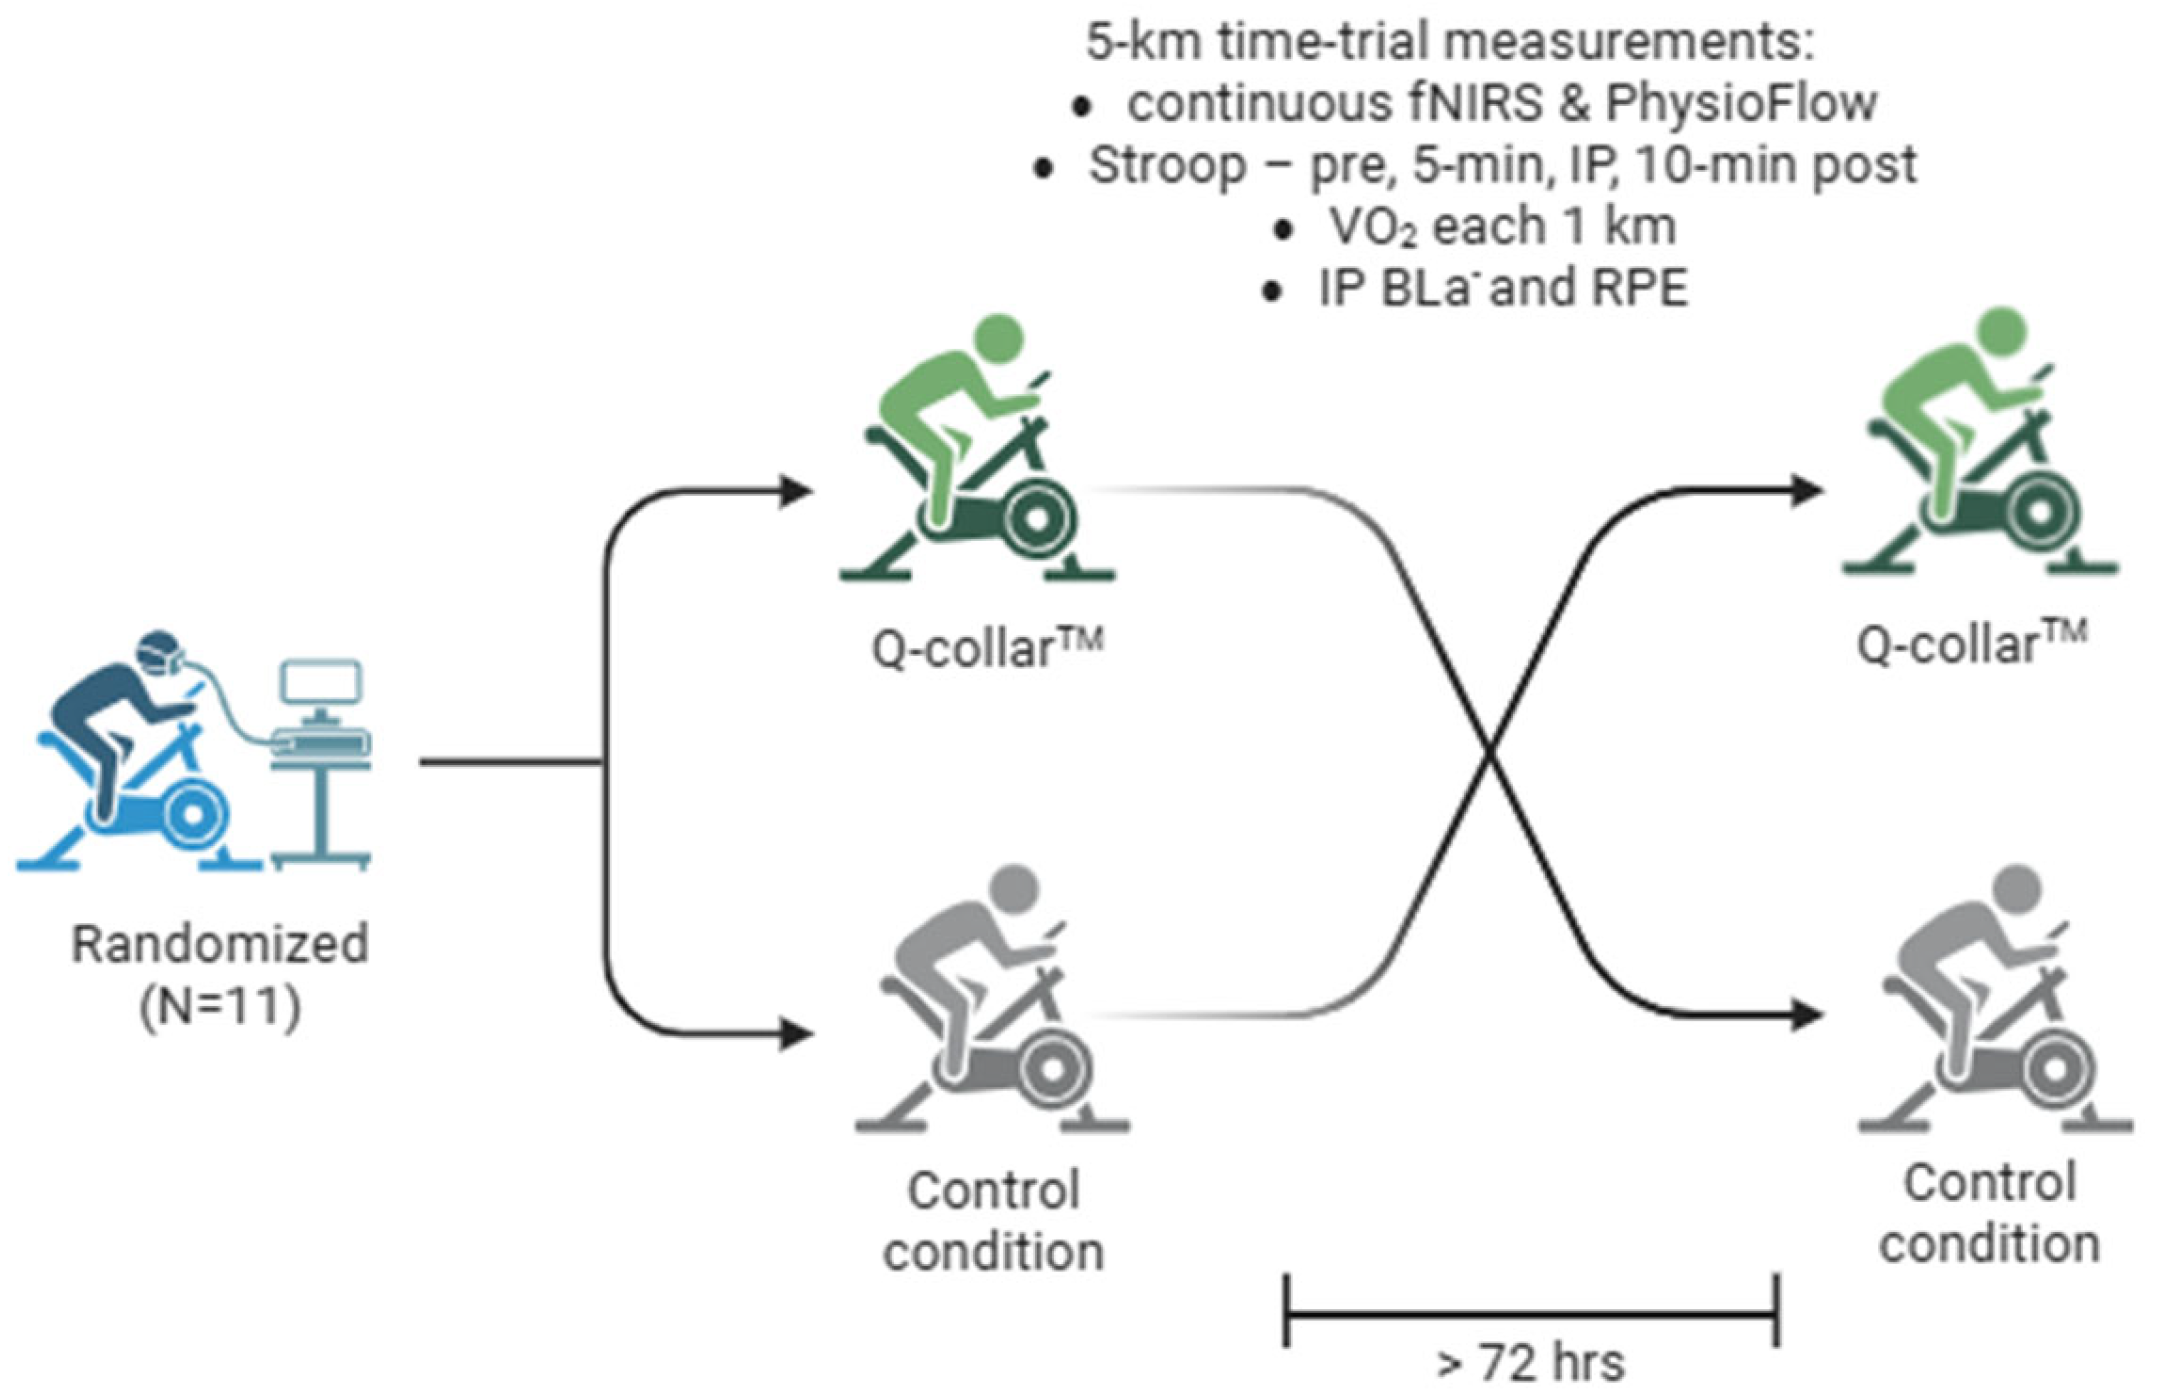
A repeated-measures randomized crossover study design was used with eleven male participants (Table 1) serving as their own controls. The study protocol, including the primary outcome measure (PFC-O2Hb), secondary outcome measures, and planned statistical analyses, was approved by the University of Northern Iowa Institutional Review Board prior to recruitment. Participants were recruited from the University of Northern Iowa between March and May 2024, and written informed consent was obtained prior to enrollment. Training status was self-reported, and participants were required to engage in aerobic exercise at least three days per week for a minimum of 3 months. Additional eligibility criteria included the absence of physical limitations, musculoskeletal injuries, cardiovascular or pulmonary disease, and medication use during the study. Participants were also required to achieve a cycling maximal oxygen consumption (VO2max) classified as ‘good’ or ‘excellent’ (38.3 to 49.5 mlO2/kg/min). Only male participants were recruited due to the limited Q-Collar™ size availability (sizes 14 and 15, not usable on smaller neck sizes). On three separate occasions, participants visited the University of Northern Iowa Exercise Physiology lab with each visit separated by at least 72 h. Following signed consent, demographic data was collected, and baseline aerobic fitness measures were assessed through cardiopulmonary testing (CPET). After, participants were familiarized with the Stroop test, Borg’s Rated Perceived Exertion 6–20 Scale (RPE), functional near-infrared spectroscopy (fNIRS), Physioflow™ cardiac impedance electrode placement, and blood lactate (BLa−) testing. Participants were additionally informed to abstain from alcohol for at least 24 h and caffeine for at least 12 h prior to the scheduled 5 km cycling time trials (Figure 1). The study was retrospectively registered at ClinicalTrials.gov (NCT07808710; registered 9 September 2026). Patients and members of the public were not involved in the design, conduct, or reporting of this study and no important changes to the study protocol were made after trial commencement.
Table 1.
Participant demographics reported as Mean ± SD.
Figure 1.
Study design. BLa−—blood lactate; fNIRS—functional near-infrared spectroscopy; IP—immediately post; RPE—rating of perceived exertion; and VO2—rate of oxygen consumed.
2.2. Demographics and Cardiopulmonary Exercise Testing
During the initial visit, participants were asked to wear the Q-Collar™ device to ensure fit for the subsequent time-trial visits. Q-Collar™ sizing and fitting were performed according to manufacturer guidelines, including neck circumference measurement and standardized collar selection. Before the Q-Collar™ trial, an investigator verified fit by confirming the correct collar size and position according to manufacturer guidelines. Prior to the Q-Collar™ trial and as previously described [9], the collar was positioned around the neck to apply mild, bilateral jugular vein compression to increase venous dilation. A small spacing on the anterior portion of the collar is provided to alleviate any pressure on the trachea [9]. The degree of venous dilation is purported to be less than a human’s natural physiologic response to a Valsalva maneuver, sneeze, or cough [18]. Participants were instructed not to adjust the collar during the time trial. Prior to wearing the device, height (cm), and weight (kg) were collected. Height was measured using a stadiometer and weight with an electronic scale. To minimize potential variation between experimental conditions, both cycling trials were conducted at the same time of day for each participant. Participants were instructed to refrain from exercise for 24 h prior to each trial, consume similar meals approximately 2–4 h before testing, and arrive at the laboratory adequately hydrated.
Following demographic data collection, cycle ergometer seat height was adjusted with the participants wearing athletic clothing, socks and shoes to preclude knee hyperextension during cycling exercise. Participants then completed a 5-min self-selected warm-up on an electronically braked cycle ergometer. They were then fitted with a nose clip, and a Rudolph one-way breathing mouthpiece mounted on a head set that was connected to a metabolic analyzer (Parvo Medics Inc., TrueOne 2400, Salt Lake City, UT, USA) for indirect oxygen consumption (VO2) and carbon dioxide (VCO2) gas exchange analysis. Heart rate (HR) was measured using a wireless HR monitor (H10, Polar Electro Inc., Woodbury, NY, USA) affixed to an elastic strap fitted at or within 5 cm below the xiphoid process. The CPET commenced at an initial workload of 40 W, with resistance increasing by 1 W every 3 s, corresponding to a ramp rate of 20 W·min−1, until volitional exhaustion. RPE was collected at the end of each minute. The CPET ended when participants reached volitional fatigue or failed to maintain a cycling cadence of 60 revolutions per minute. Incremental cardiopulmonary exercise testing provides an assessment of aerobic capacity and associated ventilatory responses, with measures such as maximal oxygen uptake, ventilatory threshold, and respiratory compensation point commonly used to characterize physiological responses to increasing exercise intensity [24].
A VO2max value, recorded as the highest value achieved using a 15-s average, was established using a VO2 plateau as a primary criterion, defined as an average change of ≤150 mLO2 over the course of the last minute of the trial. In the event that the primary criterion was violated, a combination of two of the following three secondary criteria were used to establish VO2max: (1) a respiratory exchange ratio (RER) > 1.15 calculated as VCO2/VO2; (2) an RPE > 17; or (3) a maximal HR within 10 beats per minute of age-predicted heart rate max calculated using the Fox equation (220-age).
2.3. 5 km Cycling Time-Trial Task
Participants were randomized to one of two intervention sequences (Q-Collar™ followed by Control or Control followed by Q-Collar™) using an online random number generator. Five participants were allocated to the Q-Collar™ followed by Control sequence, and six participants were allocated to the Control followed by Q-Collar™ sequence. Trials were separated by at least 72 h. The principal investigator generated the randomization sequence, enrolled participants, and assigned participants to their intervention sequence. Due to the nature of the intervention, participants and investigators were aware of the assigned condition, and no sham collar was used. To limit the influence of condition awareness, all trials followed the same standardized protocol, equipment setup, and instructions. Data (e.g., fNIRS and PhysioFlow) were processed using identical procedures but were not blinded to condition. In these subsequent remaining visits following baseline measurements, a magnetically braked bike (Velotron RacerMate Inc., Velotron, Seattle, WA, USA) was adjusted to fit participant preference and ability. Afterward, all participants completed a self-selected warm-up and were instructed to manipulate the gears as needed to complete a 5 km time trial as quickly as possible. All time trials were completed using a 53 × 17 gear ratio seated start using RacerMate software (version 4.1.0.6) used to collect time-to-completion data in an environmentally controlled setting. Oxygen consumption was sampled every 15 s for 1 min at the end of each 1 km time point to assess overall exercise intensity as a percentage of VO2max (average of each highest 15-s 1 km VO2/VO2max).
2.4. Stroop Test and Borg’s RPE Scale Assessments
Cognitive performance was assessed using a computerized Stroop color-word interference test administered on an iPad (C2 Stroop Task, version 1.0.3). Participants were presented with the words “red,” “blue,” “green,” or “black,” displayed in either congruent (e.g., “blue” printed in blue ink) or incongruent (e.g., “green” printed in red ink) colors. Each assessment consisted of 20 trials presented in randomized order, comprising 15 congruent (75%) and five incongruent (25%) stimuli. An intertrial interval of 1500 ms was used. Participants were instructed to identify the ink color, rather than read the word, as quickly and accurately as possible by selecting the corresponding color on the iPad touchscreen, including during cycling.
Before experimental testing, participants completed one full 20-trial familiarization assessment, during which results were not recorded. The Stroop test was subsequently administered at rest, during cycling, immediately following the 5 km time trial, and 10 min post exercise. Choice reaction time (CRT) and response accuracy were recorded for each assessment. Mean CRT was calculated using response times from correct trials only, with incorrect responses excluded from the reaction-time calculation. No additional reaction-time observations were excluded as outliers.
As for the RPE data, participants were visually presented with a scale from 6 (rest) to 20 (max effort) immediately following each 5 km time trial. Participants indicated the difficulty of the time trial by pointing to a number.
2.5. Functional Near-Infrared Spectroscopy
Prior to each of the two 5 km cycling time trials, a dual wavelength (760 nm and 850 nm) portable OctaMon fNIRS (Octamon, Artinis Medical Systems, Elst, The Netherlands) headcap was fitted above the nasion along the frontopolar midline (distinctly depressed area directly between the eyes, just superior to the bridge of the nose). The specific measurement location was replicated between trials by locating the nasion site and placing the edge of the headband 2 cm above this point (1 cm above the eyebrows) and the middle of the headband in the center of the forehead. Portable fNIRS was selected because it permits continuous monitoring of PFC O2Hb during unrestricted dynamic exercise, providing greater ecological validity than stationary neuroimaging modalities while maintaining high temporal resolution. Relative hemoglobin oxygenation for the PFC (ΔPFC-O2Hb) was collected using 64-bit OxySoft (version 3.2.72 x 64) software, a 10 Hz sampling rate, and a 3.5 cm optode receiver distance. These relative changes in oxygenated hemoglobin concentration were calculated from changes in optical attenuation using the modified Beer–Lambert law implemented in OxySoft. Age-adjusted differential pathlength factors (DPFs) were entered for each participant during each trial, consistent with the age-dependent approach described by Duncan et al. [25], using the manufacturer’s default OxySoft processing settings. The unit consisted of a headband with eight optodes and two receivers. Four LED optodes combined with one receiver were placed over the right and left PFC regions (8 × 2 configuration). Optode placement was based on the modified international electroencephalogram 10–20 system. Data from all eight measurement channels were pooled to obtain a single mean PFC-O2Hb value, rather than analyzing the left and right prefrontal hemispheres separately. Markers were inserted at each completed kilometer during the 5 km cycling time trial, and mean PFC-O2Hb values were calculated across successive, non-overlapping kilometer intervals (0–1, 1–2, 2–3, 3–4, and 4–5 km). A 1-min resting reference period was recorded before exercise in both conditions, following Q-Collar™ placement in the intervention condition and at an equivalent pre-exercise stage in the Control condition. All fNIRS data were normalized to the first 10 s of this resting reference period. The fNIRS recordings were visually inspected for apparent signal abnormalities, including abrupt changes in hemoglobin concentration, signal discontinuities, and potential movement-related artifacts. Following visual inspection, four individual measurement channels, each from a separate trial, were excluded in their entirety due to apparent signal abnormalities (two Q-Collar™ trials and two Control trials). Consequently, pooled PFC-O2Hb values were calculated using seven channels for the four affected trials and all eight channels for unaffected trials. Missing values were omitted without imputation. No predefined quantitative thresholds were employed for signal-quality assessment or artifact rejection. Data were subsequently processed using a 0.1 Hz low-pass filter to attenuate higher-frequency physiological fluctuations, including cardiac and respiratory oscillations. No short-separation channels were utilized to account for superficial hemodynamic contributions to the fNIRS signal.
2.6. PhysioFlow™ Cardiac Impedance and Blood Lactate Testing
Cardiac output (CO), HR, and stroke volume (SV) hemodynamic data was collected using cardiac impedance and PhysioFlow™ software (version 2.8.11) calibrated according to manufacturer instruction (PhysioFlow Enduro™, Manatec, Strasbourg, France). All electrode sites were shaved, if needed, and cleaned using alcohol pads. A total of six electrodes were used in accordance with manufacturer guidelines and connected to PhysioFlow™ leads. Two electrodes were placed in a vertical alignment within the lateral triangle of the left side of the neck in line with left carotid, two electrodes placed vertically just to the left side of the spine in line with the xiphoid process, an electrode placed in the middle of the sternum, and the last electrode placed on along the midaxillary line between the fourth and fifth intercostals of the participant. Calibration was performed before each 5 km time-trial test with the participant in a standing position as recommended by manufacturer guidelines. All variables were averaged and recorded every 15 s during exercise.
A droplet of blood (approximately 1 μL) was collected from the earlobe via lancet puncture in order to measure BLa− immediately post the CPET and both 5 km time trials. A handheld analyzer device was used to analyze the Bla− content from the droplet of blood (Nova Biomedical, Waltham, MA, USA). All samples were collected in duplicate and averaged for analysis.
2.7. Statistical Analysis
All data were analyzed in GraphPad Prism software (version 9.0.2). The primary outcome was PFC-O2Hb; cardiovascular, metabolic, perceptual, cognitive, and time-trial performance outcomes were secondary. PFC-O2Hb was analyzed at each kilometer (1–5 km) relative to the resting baseline. A two-way repeated-measures ANOVA with Bonferroni post hoc comparisons was used to statistically evaluate cardiac impedance, Stroop and fNIRS data. Aside from the Bonferroni corrections, no further adjustment was made across outcomes. Because PFC-O2Hb was the primary outcome, analyses of secondary outcomes were considered exploratory and their p-values should be interpreted with this in mind. Residual normality was assessed using a Shapiro–Wilk test and/or Q-Q plots. Mauchly’s test of sphericity was used to determine whether Greenhouse–Geisser correction was needed. Paired t-tests were used to compare Q-Collar™ and Control five-kilometer time-to-completion, immediate post-exercise BLa−, RPE, and average %VO2max. To account for the crossover design, period and sequence effects were evaluated using the standard approach for two-period, two-sequence crossover trials [26]. For each outcome, one summary value per participant and visit was used: the observed value for time-to-completion, BLa−, RPE, and %VO2max; the mean across 1–5 km for PFC-O2Hb, SV, HR, and CO; and both the resting value and the mean of the four time points for CRT. For each participant, the period difference was calculated as d = visit 1 − visit 2. With treatment coded as Q-Collar™ vs. control and period as visit 1 vs. visit 2, the mean of d estimates (treatment + period) in the Q-Collar™ → control sequence and (period—treatment) in the control → Q-Collar™ sequence. The period-adjusted treatment effect (Q-Collar™ − control) was therefore estimated as half the difference between the two sequence-group means of d, and the period effect (visit 1 − visit 2) as half their sum. Both effects were estimated as linear contrasts of the two sequence-group means of d, using the pooled within-group variance of d. The period-adjusted treatment effect was estimated as ½ ( − ) and the period effect as ½ (+ ), where and are the mean period differences in the Q-Collar™ → control and control → Q-Collar™ sequences, respectively. Both contrasts have the same standard error, ½·sp·√(1/n1 + 1/n2), where sp is the pooled standard deviation of d, and each was tested as t = estimate/SE with df = n1 + n2 − 2; 95% CIs were calculated as the estimate ± t0.975, df × SE. Equivalently, the treatment effect corresponds to a two-sample t-test comparing d between sequences, and the period effect to a two-sample t-test comparing d in the Q-Collar™ → control sequence with −d in the control → Q-Collar™ sequence. Both estimates are identical to those from a linear model with fixed effects of treatment, period, and participant. Sequence effects were assessed by comparing participants’ mean values across both visits between sequence groups using a two-sample t-test. Because the sequence effect is confounded with carryover and with between-participant differences, and because this comparison has low statistical power, it was not interpreted as establishing the presence or absence of carryover; all crossover analyses were considered descriptive.
No a priori sample-size calculation was performed as the sample size was determined by feasibility (participant availability during the March–May 2024 data collection period) and is comparable to previous repeated-measures crossover studies using similar cycling and fNIRS protocols [27,28]. To evaluate the statistical sensitivity for the primary outcome (PFC-O2Hb), post hoc sensitivity analyses were performed using G*Power (version 3.1.9.6), with n = 10 participants, α = 0.05, and statistical power of 0.80. Sensitivity was evaluated separately for the main effect of condition and the condition × time interaction. For the main effect of condition, the G*Power procedure “t tests—Means: difference between two dependent means (matched pairs)” was used (two-tailed), based on participants’ mean PFC-O2Hb values across the five-kilometer intervals. The minimum detectable effect was dz = 1.00, corresponding to approximately 4.3 µmol/L based on the observed standard deviation of paired differences. For the condition × time interaction, the G*Power procedure “ANOVA: repeated measures, within factors” was used, with one group and five measurements representing the within-participant differences between Q-Collar™ and Control across the five-kilometer intervals. The assumed correlation among repeated measurements (r = 0.62) and Greenhouse–Geisser epsilon (ε = 0.62) was estimated from these difference scores. The minimum detectable interaction effect was f = 0.38, increasing to f = 0.55 under the lower-bound ε of 0.25. Because the correlation, epsilon, and standard deviation estimates were derived from the observed data, these sensitivity analyses were considered descriptive rather than confirmatory. For secondary outcomes, the precision of between-condition estimates is indicated by the reported 95% CIs. Results are expressed as mean ± standard deviation and statistical significance was set at α = 0.05. No data were imputed.
3. Results
3.1. Participant Characteristics
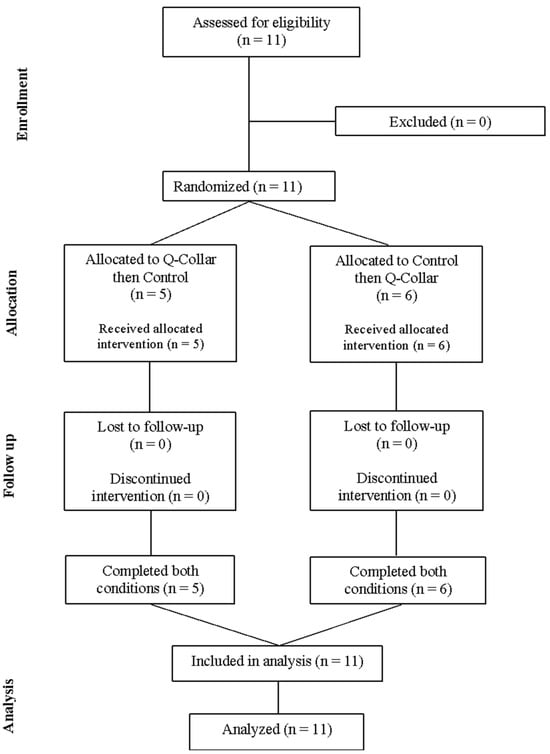
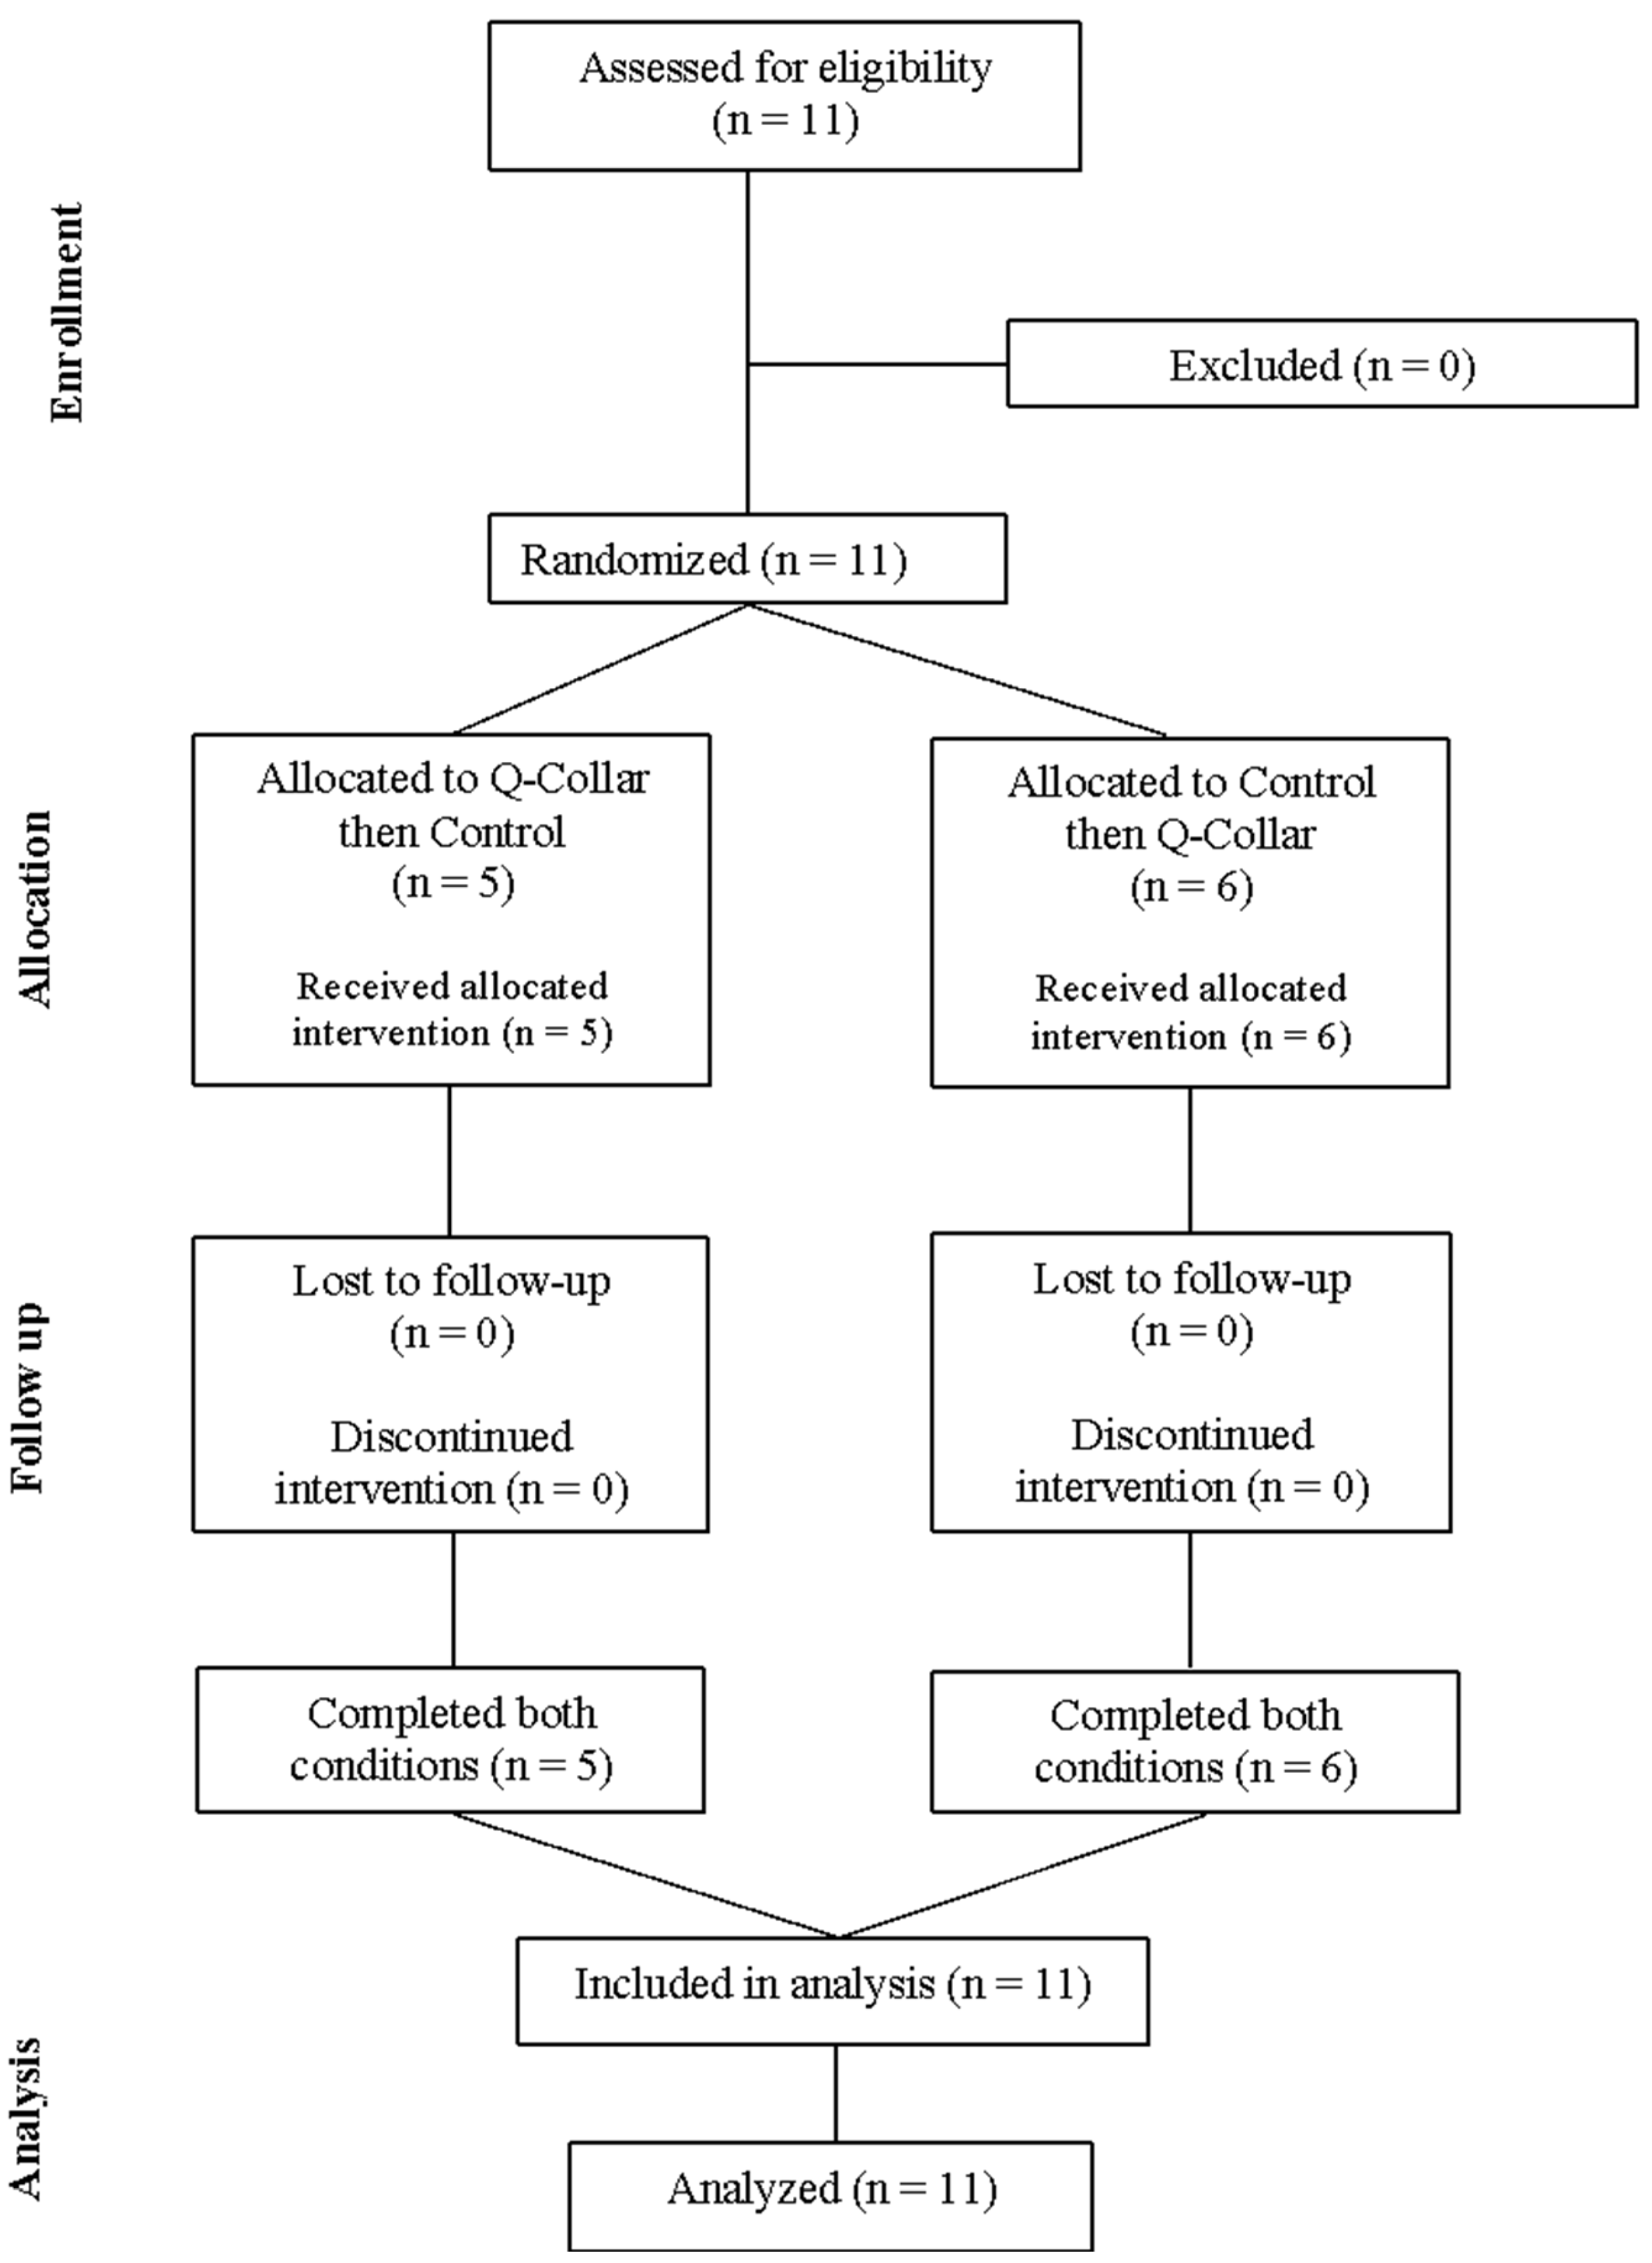
Eleven recreationally trained male participants were assessed for eligibility, randomized, and successfully completed both experimental conditions (Figure 2). Analyses included participants with complete data for each outcome (n = 11 for performance, perceptual, metabolic, and cognitive outcomes; n = 10 for PFC-O2Hb; and n = 9 for hemodynamic outcomes). Data for fNIRS were unavailable for one participant in the Q-Collar™ condition, and PhysioFlow™ exercise data for two participants in the control condition, because of technological issues. No adverse events were reported during either experimental condition.
Figure 2.
CONSORT flow diagram depicting participant enrollment, randomized intervention sequence, follow-up, and analysis in the crossover trial. All 11 participants completed both experimental conditions. Outcome-specific analysis samples were n = 11 for performance, perceptual, metabolic, and cognitive outcomes; n = 10 for prefrontal cortex oxygenated hemoglobin (PFC-O2Hb); and n = 9 for hemodynamic outcomes.
3.2. Time-Trial Performance, Perceptual, and Blood Lactate Responses
No statistically significant differences in RPE, BLa−, %VO2max, or time-to-completion differences were detected comparing Q-Collar™ and Control (Table 2). Paired mean differences and 95% CIs are shown in Table 2.
Table 2.
Physical, metabolic, and perceptual responses reported as mean ± standard deviation.
3.3. Hemodynamic Responses (Cardiac Impedance)
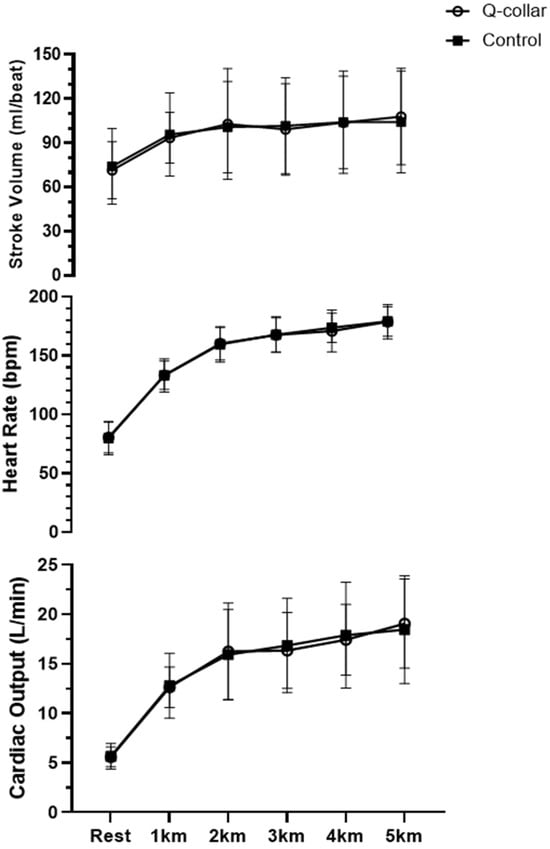
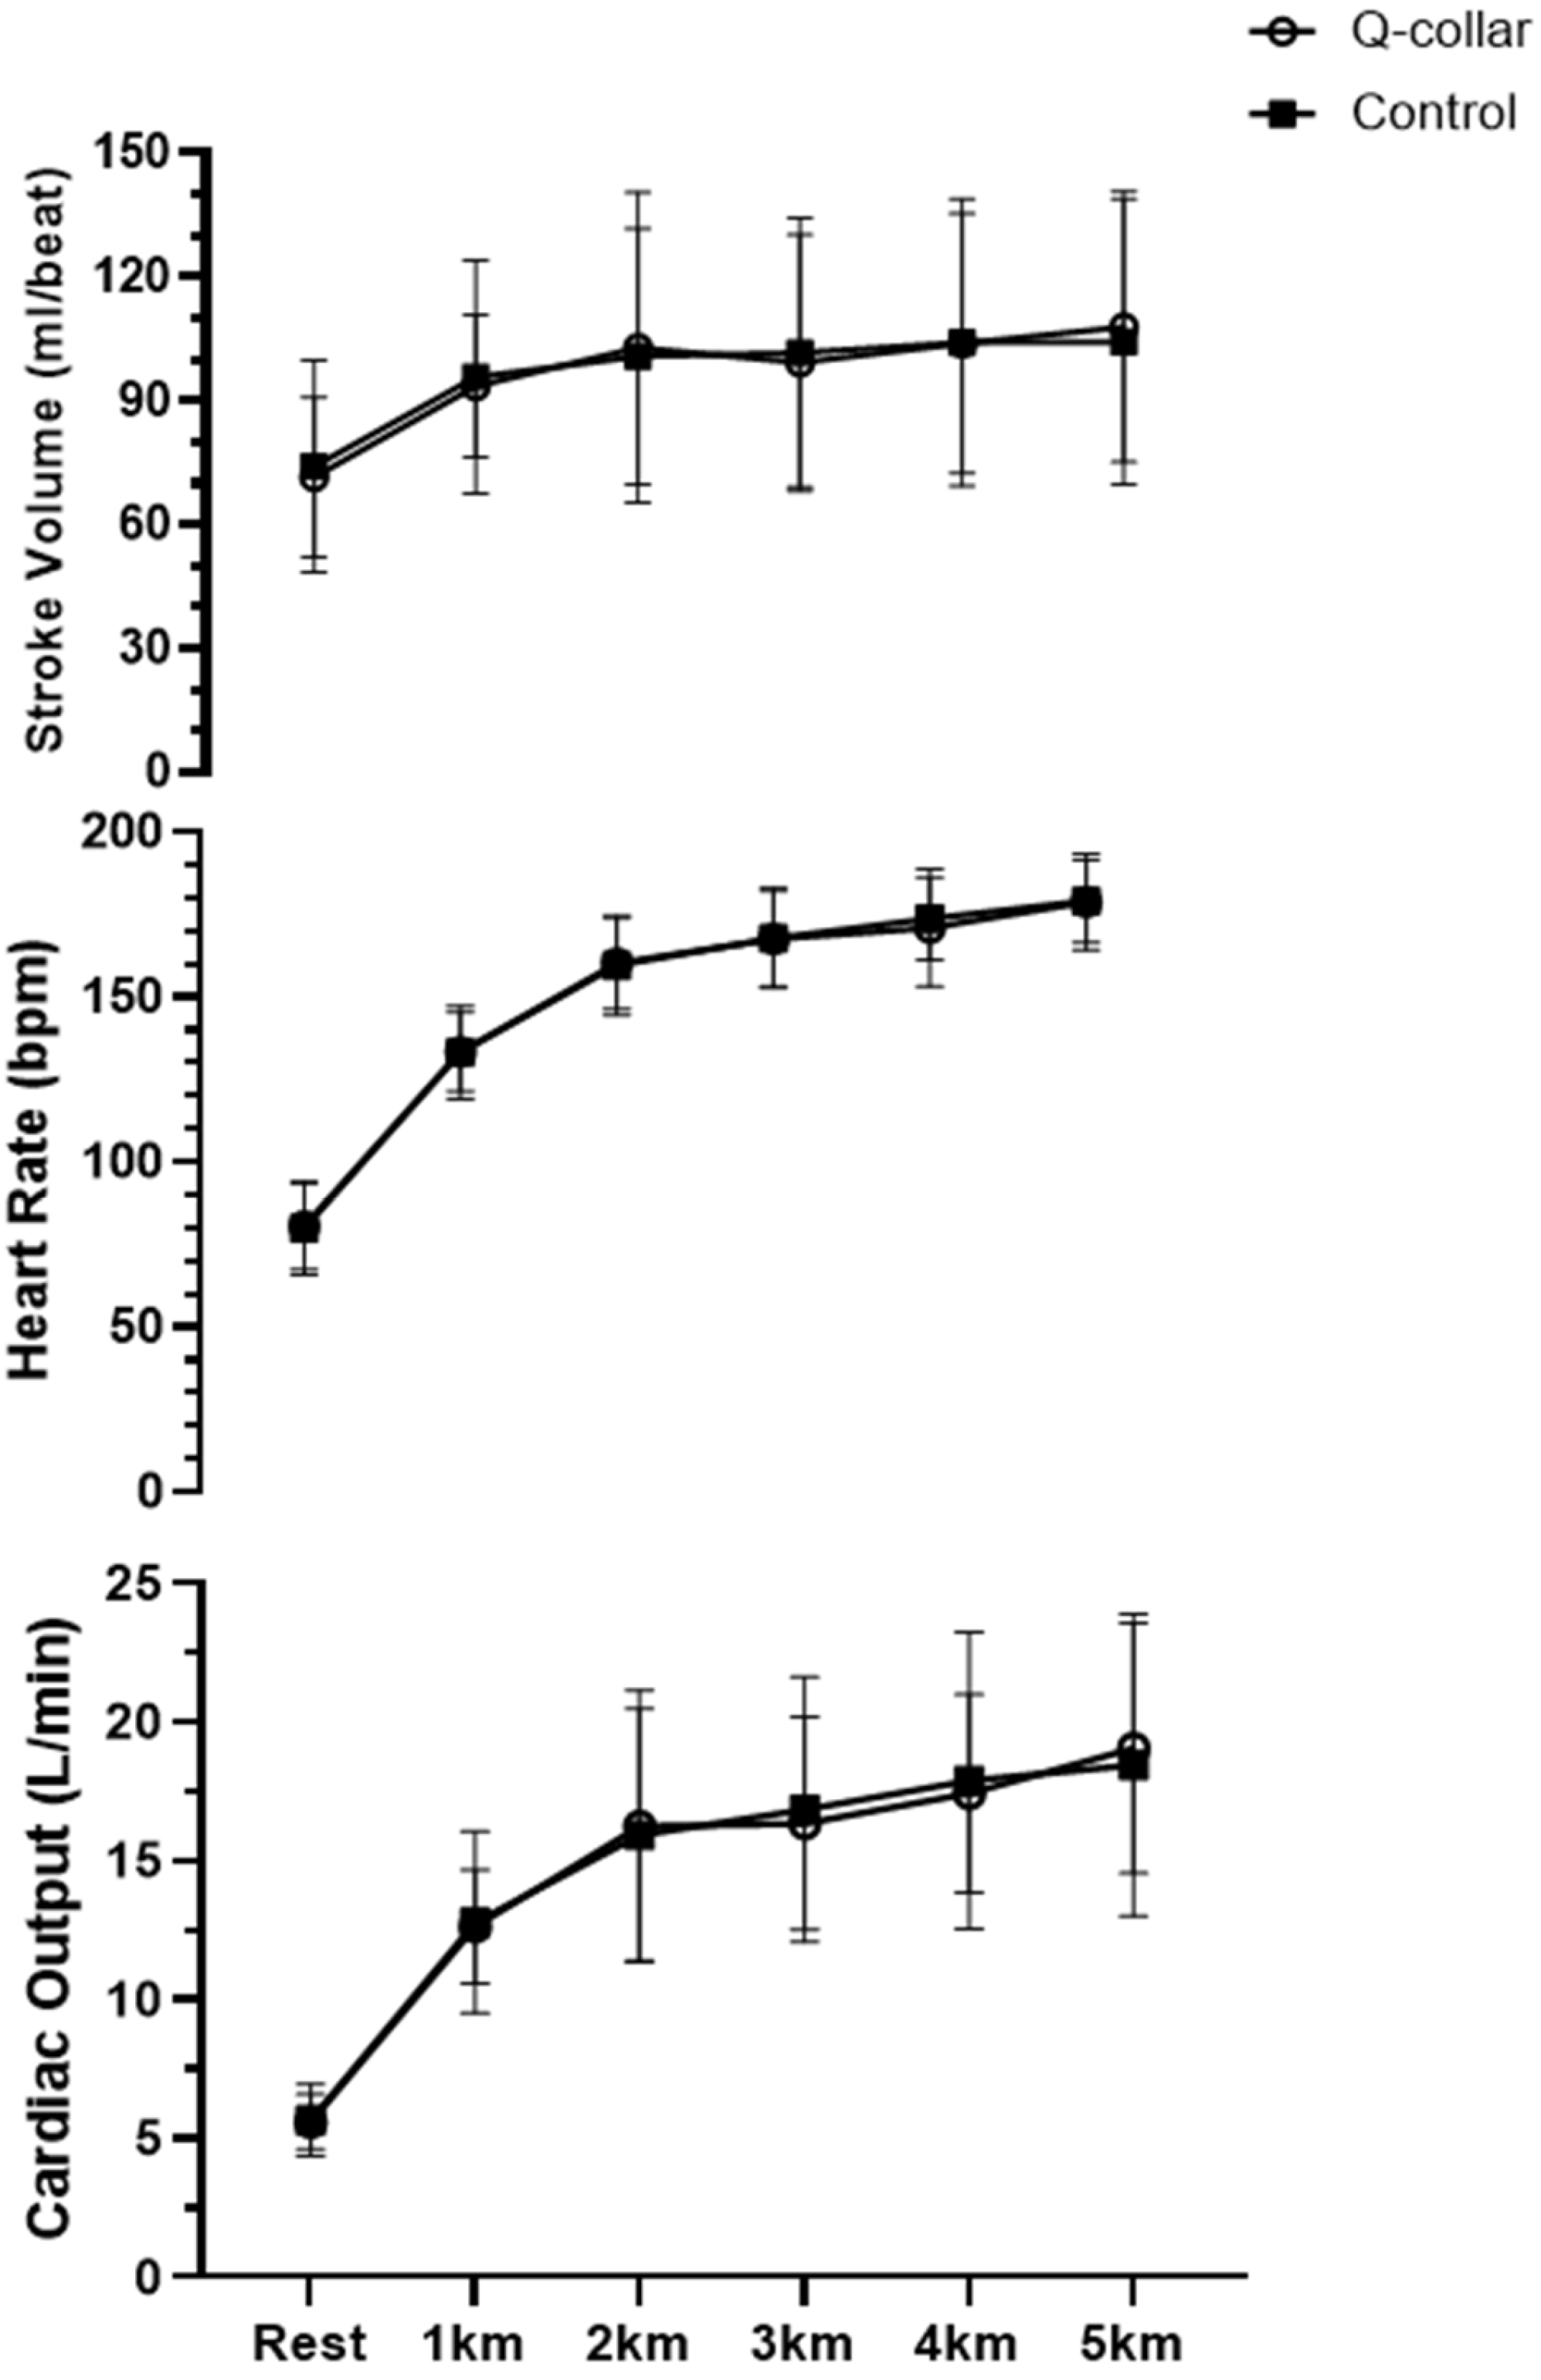
SV, HR, and CO increased over time in both conditions (all time effects p < 0.001), with no main effect of condition or condition × time interaction for any hemodynamic variable (all p ≥ 0.37; n = 9; Supplementary Table S1a). Post hoc analysis for both the Q-Collar™ and Control conditions revealed SV (p < 0.01), HR (p < 0.01), and CO (p < 0.001) PhysioFlow™ cardiac impedance measures increased with time-trial exercise relative to resting values (Figure 3). No SV differences were observed between kilometer time points regardless of testing condition. Post hoc comparisons revealed a subsequent increase in HR at each kilometer within the Control condition. Similarly, a progressive increase in HR was identified in the Q-Collar™ condition apart from no comparable difference between the third and fourth kilometer. Increases in CO were shown comparing the third, fourth, and fifth kilometer time points relative to the completion of the first kilometer within the Q-Collar™ condition. The Control condition showed increases in CO at the second, third, fourth, and fifth kilometer time point relative to completion of the first kilometer with CO at the fourth and fifth kilometer time point being greater than CO at the second kilometer timepoint. No differences in the rate of HR or CO progression were found comparing Q-Collar™ use to Control.
Figure 3.
Hemodynamic responses over the course of the 5 km time trial. Data are presented as mean ± standard deviation (SD). Error bars represent SD. L/min—liters per minute; bpm—beats per minute; ml/beat—milliliters per beat; km—kilometer.
3.4. Prefrontal Cortex Oxygenation (fNIRS) and Cognitive Performance (Stroop Test)
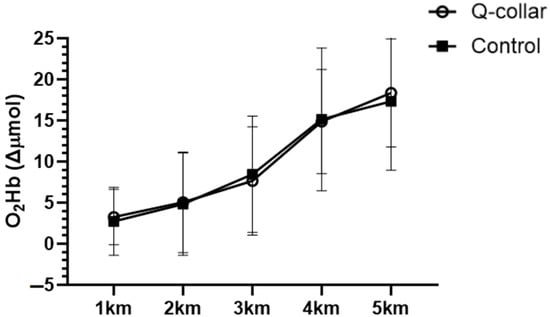
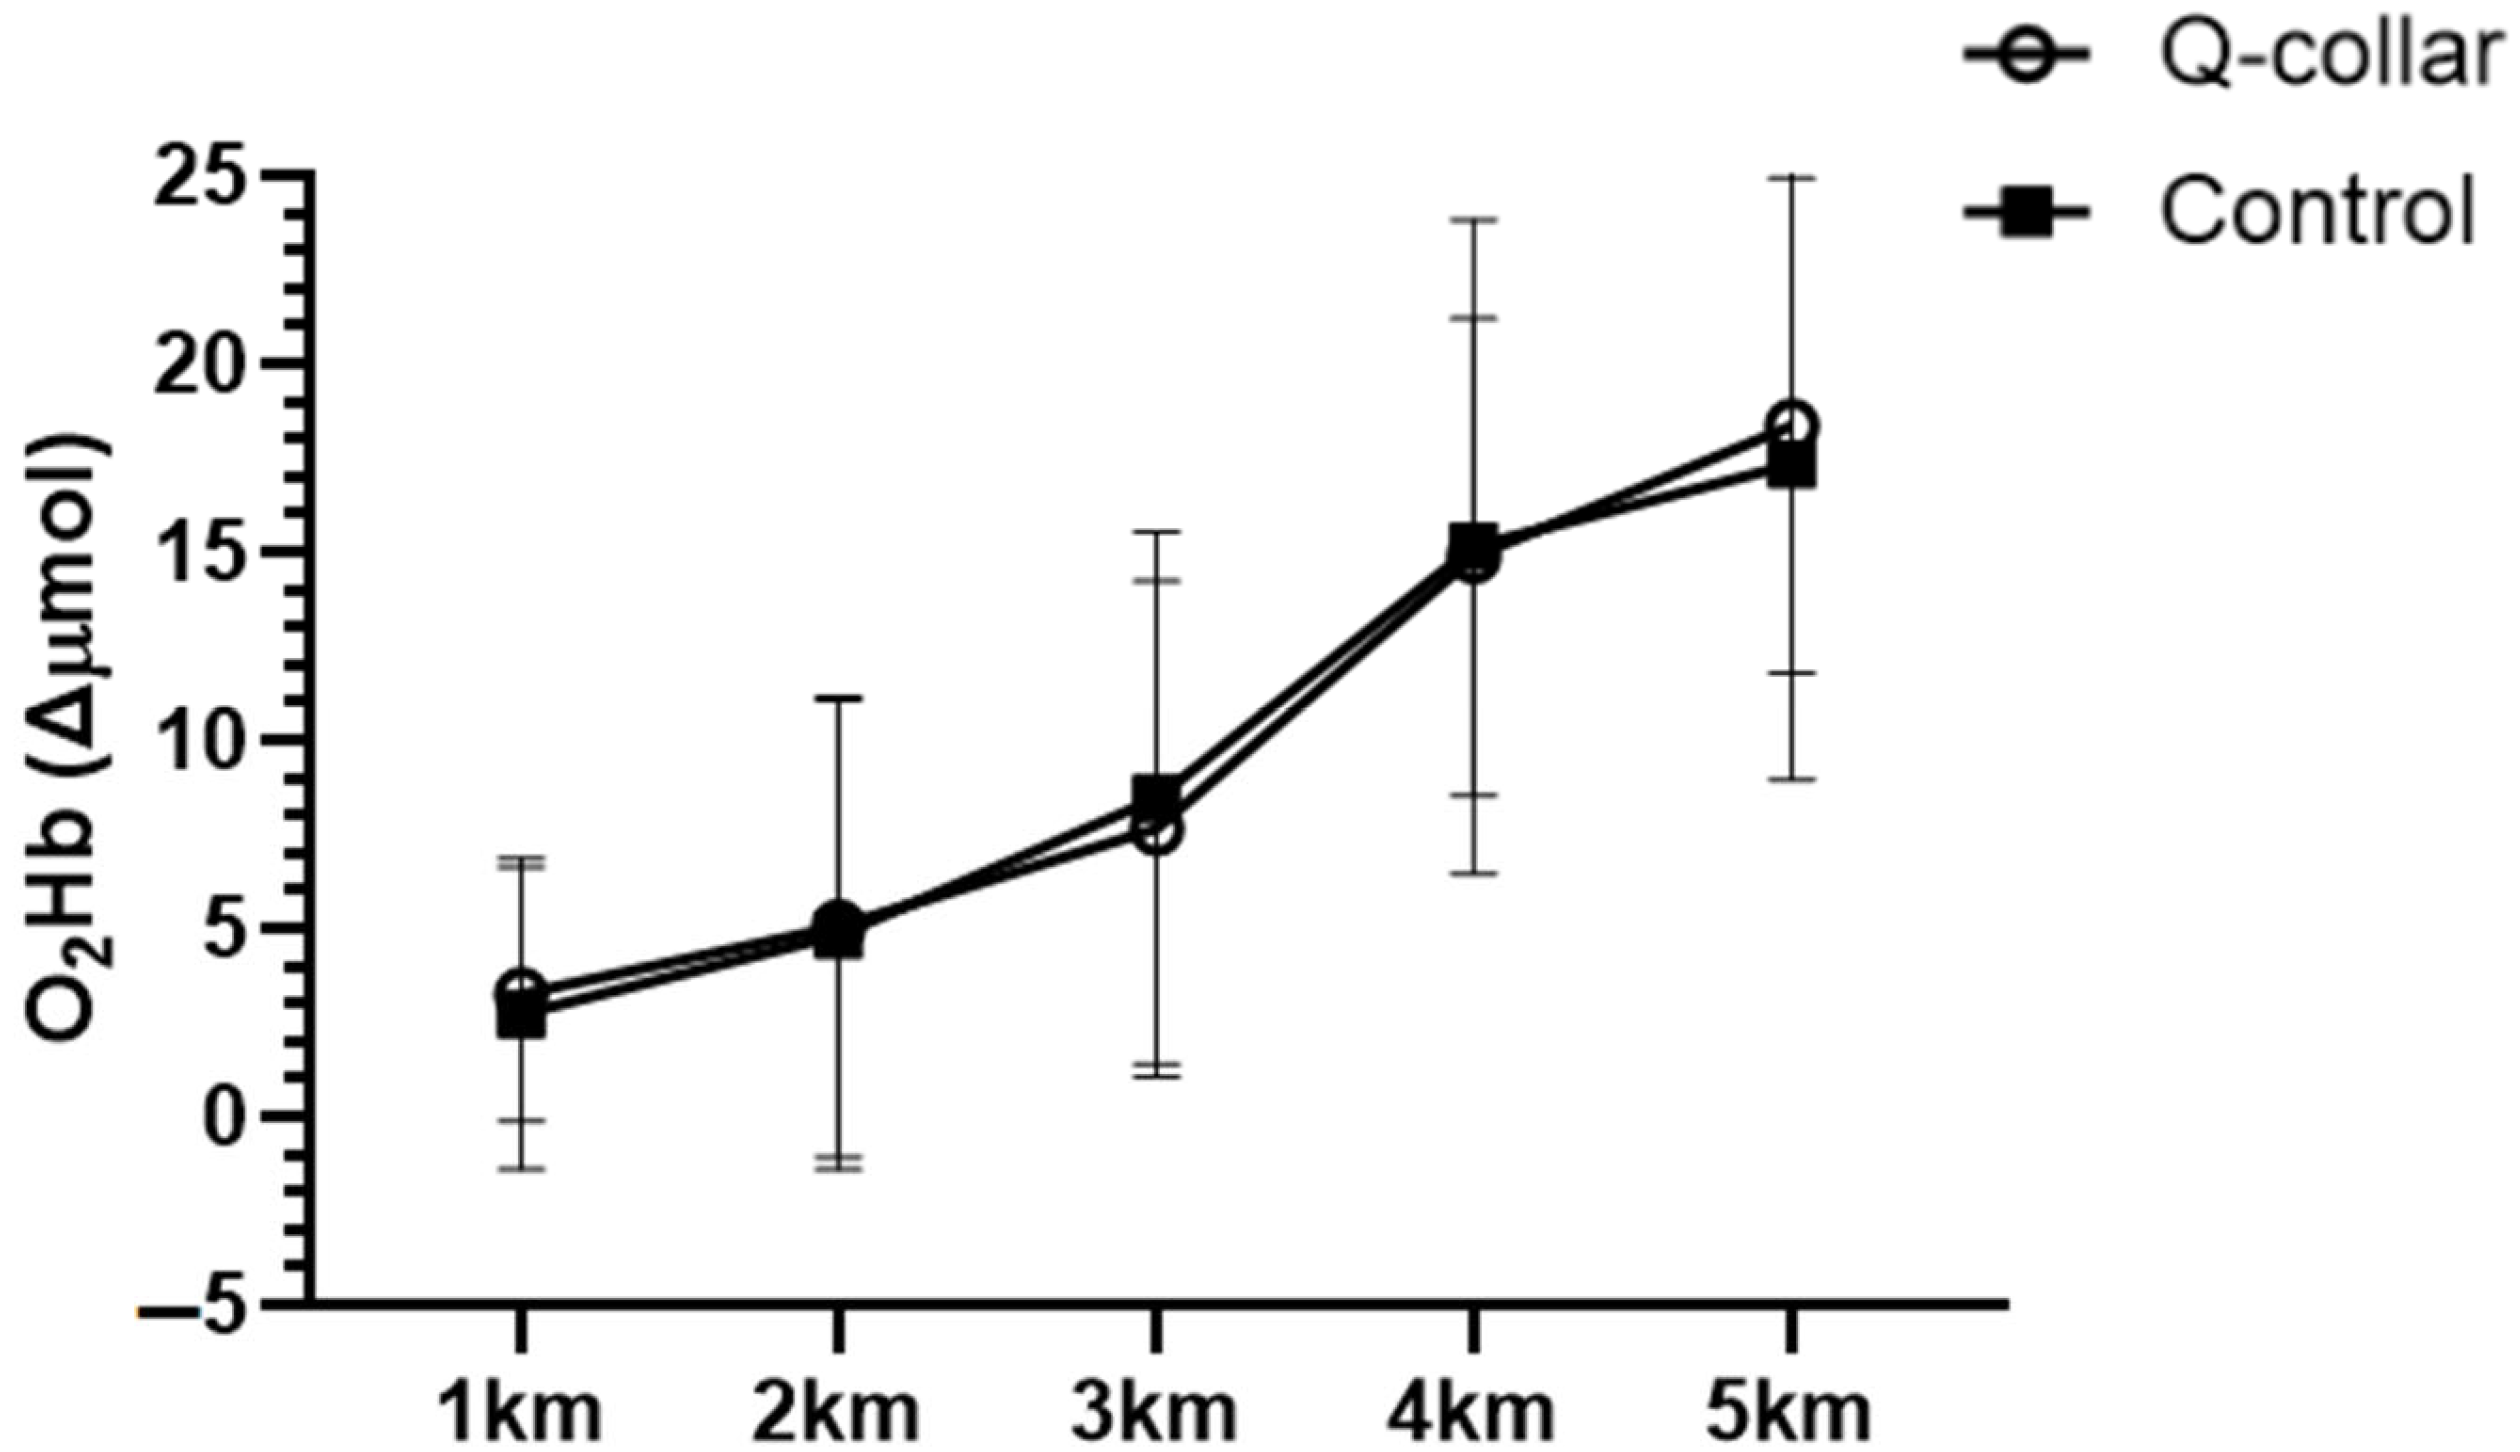
PFC-O2Hb increased progressively across the time trial in both conditions (time effect: F(2.21, 19.92) = 62.70, p < 0.001, ηp2 = 0.87, 95% CI 0.71–0.92; mean increase from 1 to 5 km, averaged across conditions: 14.5 µmol/L, 95% CI 11.0–17.9). There was no main effect of condition (F(1, 9) = 0.00, p = 0.99, ηp2 < 0.01; mean difference, Q-Collar™ − control, averaged across 1–5 km: −0.01 µmol/L, 95% CI −3.09 to 3.07) and no condition × time interaction (F(2.49, 22.37) = 0.64, p = 0.57, ηp2 = 0.07, 95% CI 0.00–0.24; n = 10; Figure 4). Post hoc analyses showed greater PFC-O2Hb at 4–5 km than at 1–2 km in both conditions. Between-condition differences at individual kilometers ranged from −0.93 to 1.28 µmol/L, and all 95% CIs included zero (Supplementary Table S1b).
Figure 4.
Prefrontal cortex oxygenation over the course of the 5 km time trial. Data are presented as mean ± standard deviation (SD). Error bars represent SD. Δµmol/L—relative change in micromoles per liter; O2Hb—hemoglobin oxygenation; km—kilometer.
In both conditions, CRT was shorter than at rest at all subsequent time points (time effect: F(1.81, 18.09) = 37.58, p < 0.001, ηp2 = 0.79, 95% CI 0.52–0.86; Table 3), and accuracy remained high (≥96.5% correct). There was no condition x time interaction (F(1.22, 12.19) = 1.08, p = 0.34, ηp2 = 0.10, 95% CI 0.00–0.40), and the change in CRT from rest did not differ between conditions at any time point (difference in change, Q-Collar™ − control, at 10 min post: 0.09 s, 95% CI −0.07 to 0.26). Resting CRT was faster at the second visit than the first, irrespective of condition. Adjusting for period did not materially change any between-condition estimate (PFC-O2Hb: 0.03 µmol/L, 95% CI −3.36 to 3.42; time to completion: −4.3 s, 95% CI −14.9 to 6.3), and no statistically significant sequence effects were observed (all p ≥ 0.17); although, given the low power of this comparison, carryover cannot be excluded. The period-adjusted PFC-O2Hb estimate (0.03 µmol/L, 95% CI −3.36 to 3.42) is the mean within-participant difference (Q-Collar™ − control) in PFC-O2Hb averaged across the five kilometer intervals (1–5 km), adjusted for visit order (n = 10). A period effect was observed for Stroop CRT, which was faster at the second visit regardless of condition (resting CRT: 0.22 s, 95% CI 0.10 to 0.35; p = 0.003), and for average HR throughout exercise, which was higher during the first visit (6.5 bpm, 95% CI 1.0 to 12.0; p = 0.03).
Table 3.
Stroop test choice reaction-time data reported as mean ± standard deviation.
4. Discussion
The aim of the present study was to evaluate acute perceptual, physiological, and cognitive outcomes during a 5 km cycling time trial with and without the Q-Collar™ in recreationally trained men. To our knowledge, this is the first investigation to simultaneously evaluate cardiovascular, cerebral oxygenation, metabolic, cognitive, and endurance performance responses during dynamic cycling while wearing the Q-Collar™. Main findings revealed no statistical differences in perceptual, physiological, metabolic, or cognitive outcomes comparing Q-Collar™ use to Control. Specifically, no differences were observed in RPE, CO, SV, HR, BLa−, CRT (Stroop test), PFC-O2Hb, or time-to-completion measures with or without Q-Collar™ use. Under the present conditions, these results suggest that wearing the Q-Collar™ was not associated with any statistically detectable differences in these outcomes during ~10 min of high-intensity cycling. Importantly, these findings describe the effect of wearing a manufacturer-fitted Q-Collar™. As jugular venous compression was not measured, the study cannot determine whether the absence of between-condition differences reflects a lack of physiological effect of jugular compression itself or insufficient compression during exercise. CRT was shorter during and following the time trial compared with rest in both conditions. However, CRT was also faster during the second visit regardless of condition, suggesting that repeated Stroop administration and associated practice effects may have contributed to these changes. Without a non-exercise repeated-testing control, the independent effects of exercise and practice cannot be distinguished. Post hoc sensitivity analyses indicated that only large between-condition effects on PFC-O2Hb could be detected with 80% power (dz ≥ 1.00, approximately 4.3 µmol/L, for the treatment effect; f ≥ 0.38 for the condition × time interaction). Interpretation of the primary outcome is based on the period-adjusted between-condition difference in PFC-O2Hb averaged across 1–5 km (Q-Collar™ − control: 0.03 µmol/L, 95% CI −3.36 to 3.42). Under the assumptions of the crossover model, this interval represents the range of average effects most compatible with the data, from approximately 3.4 µmol/L lower to 3.4 µmol/L higher with the Q-Collar™, relative to a mean increase of approximately 14.5 µmol/L over the time trial. Larger average effects are less compatible with the data, whereas smaller effects in either direction cannot be excluded. The unadjusted estimate was similar (−0.01 µmol/L, 95% CI −3.09 to 3.07).
PFC-O2Hb increased progressively throughout the 5 km cycling time trial in both the Q-Collar™ and Control conditions, with no statistically detectable differences between conditions. This response may reflect changes in regional cerebral oxygenation during high-intensity exercise; however, fNIRS-derived O2Hb is influenced by the balance between regional oxygen delivery and utilization, as well as systemic and extracerebral hemodynamic responses. Therefore, the observed increase in PFC-O2Hb cannot be attributed exclusively to increased neural activity or cerebral blood flow.
Previous investigations have demonstrated alterations in cerebral hemodynamics during strenuous exercise, potentially influenced by exercise intensity, pacing strategy, and changes in arterial CO2 associated with hyperventilation [20,21,22,23]. However, cerebral blood flow, ventilation, and arterial CO2 were not directly measured in the present study. Consequently, the mechanisms underlying the progressive increase in PFC-O2Hb remain uncertain. Furthermore, although CRT improved during and following exercise in both conditions, a direct relationship between PFC-O2Hb and CRT was not examined, and repeated testing may have contributed to the observed improvements.
From a practical perspective, wearing the Q-Collar™ was not associated with detectable acute impairments in CRT, cardiovascular or metabolic responses, or 5 km time-trial performance in this sample, and no adverse events were reported. These observations are consistent with DiCesare et al. [19] who found no differences in balance, isokinetic strength, and power generation outcomes comparing a mild jugular vein compression device used to a sham control. However, the present study was not designed to evaluate safety and only included 11 healthy young men completing two exercise exposures in a laboratory setting. Further, discomfort and musculoskeletal effects were not quantified. Likewise, the Stroop test performed during cycling does not replicate sport-specific decision-making or agility, and head impacts and injury were not examined. These findings therefore cannot be extended to the device’s safety or its protective effects against TBI in sport settings. As such, future research should continue to investigate mild bilateral jugular vein compression devices, in larger populations and more diverse samples, during sport-specific tasks, and over longer periods of use.
Limitations of the current research include the absence of a direct measure of fluid shift, an objective measure of pressure against the jugular vein, and transferability of data to more extreme environmental conditions. Therefore, although the device was applied according to manufacturer guidelines and fit was verified prior to the Q-Collar™ trial, we cannot confirm the magnitude of physiological effect (e.g., venous outflow restriction) during exercise. As such, the absence of condition differences should be interpreted cautiously, as null findings may reflect either a true lack of effect on the measured outcomes or insufficient physiological compression under the present experimental conditions. Accordingly, the present methodology evaluates the effect of wearing the device as it would be used in practice, not the effect of verified jugular compression. In addition, no a priori sample-size calculation was performed, and the sample size was determined by feasibility; the present study should therefore be considered exploratory. Moreover, all participants were young, recreationally trained men, so the findings may not generalize to female athletes. Sex differences in neck anatomy, cerebrovascular regulation, and responses to exercise warrant specific investigation into female participants. In addition to females, these results may not generalize to older adults, highly trained endurance athletes, or individuals with an elevated risk of sport-related traumatic brain injury (e.g., contact sport populations). Although the ≥72 h interval between trials allowed for physiological recovery, it does not eliminate learning effects; despite a familiarization session, CRT was faster at the second visit regardless of condition, most notably at rest, indicating that practice contributed to the observed CRT changes. Further, participants and investigators were not blinded to condition, and no sham collar was used. Because participants were aware of the condition, expectations or awareness of neck pressure may have influenced behaviorally sensitive outcomes such as pacing (and therefore time-to-completion), RPE, and CRT, and physiological outcomes may have been affected indirectly through differences in pacing. In addition, neck discomfort and musculoskeletal strain associated with wearing the Q-Collar™ were not formally assessed. Lastly, the number of secondary outcomes and time points increases the likelihood of type I error; secondary findings, including the period effects for CRT and HR, should therefore be considered exploratory.
Although fNIRS recordings were visually inspected and low-pass filtered, no predefined quantitative signal-quality thresholds, formal motion-artifact correction procedures, or short-separation measurements were employed. Therefore, residual movement-related artifacts and superficial or systemic hemodynamic influences cannot be excluded. Consequently, changes in PFC-O2Hb should be interpreted as relative changes in regional hemoglobin oxygenation rather than direct evidence of altered cerebral blood flow or neural activation. Additionally, because the resting fNIRS reference was acquired following Q-Collar™ placement, the normalized PFC-O2Hb values represent exercise-related changes relative to a post-placement baseline. Consequently, the present findings cannot establish whether collar placement itself altered resting cerebral oxygenated hemoglobin concentrations.
5. Conclusions
In this exploratory crossover study, no statistically significant acute differences were detected between Q-Collar™ and Control in hemodynamic, metabolic, PFC-O2Hb, reaction time, perceptual, or 5 km cycling time-trial outcomes. Because jugular compression was not verified during exercise, it remains unclear whether these null findings reflect a lack of a compression effect itself or insufficient compression under the present conditions. In both conditions, CRT was shorter during and after the time trial than at rest; however, practice effects from repeated Stroop administration may have contributed to this change. No adverse events or detectable acute performance impairments were observed with Q-Collar™ use in this sample.
Supplementary Materials
The following supporting information can be downloaded at: https://www.mdpi.com/article/10.3390/oxygen6040038/s1. Table S1a. Two-way repeated-measures ANOVA results for PFC-O2Hb and hemodynamic outcomes. Table S1b. Between-condition differences in PFC-O2Hb at each kilometer (n = 10).
Author Contributions
Conceptualization, Z.S. and T.M.; methodology, Z.S. and T.M.; formal analysis, Z.S. and T.M.; investigation, Z.S., B.B., I.S. and D.D.; data curation, Z.S., B.B., I.S. and D.D.; writing—original draft preparation, A.W., K.B., Z.S. and T.M.; writing—review and editing, A.W., K.B., M.H. and T.M.; supervision, T.M. All authors have read and agreed to the published version of the manuscript.
Funding
This research received no external funding.
Institutional Review Board Statement
The study was conducted in accordance with the Declaration of Helsinki and approved by the Institutional Review Board of the University of Northern Iowa (protocol FY24-97; approved 20 March 2024). The study was retrospectively registered at ClinicalTrials.gov (NCT07808710; registered 9 September 2026).
Informed Consent Statement
Informed consent was obtained from all subjects involved in the study.
Data Availability Statement
The group data presented in this study are available on request from the corresponding author. The individual data are not publicly available due to privacy and confidentiality.
Conflicts of Interest
The authors declare no conflicts of interest.
Abbreviations
The following abbreviations are used in this manuscript:
| CRT | Choice Reaction Time |
| sTBI | Sports-related Traumatic Brain Injury |
| OEF | Oxygen Extraction Fraction |
| CPET | Cardiopulmonary Exercise Testing |
| CBF | Cerebral Blood Flow |
| CSF | Cerebrospinal Fluid |
| fNIRS | Functional Near-Infrared Spectroscopy |
| PFC-O2Hb | Prefrontal Cortex Hemoglobin Oxygenation |
| VCO2 | Rate of Carbon Dioxide Production |
| VO2 | Rate of Oxygen Consumption |
| RPE | Borg’s Rated Perceived Exertion Scale |
References
- Daneshvar, D.H.; Nowinski, C.J.; McKee, A.C.; Cantu, R.C. The Epidemiology of Sport-Related Concussion. Clin. Sports Med. 2011, 30, 1–17. [Google Scholar] [CrossRef] [Scilit]
- Oldenburg, C.; Kjeldgård, L.; Stigson, H.; Friberg, E. Sickness Absence > 14 Days Following Sport-Related Traumatic Brain Injuries: A Nationwide Register-Based Study in Sweden. BMC Public Health 2025, 25, 2532. [Google Scholar] [CrossRef] [Scilit]
- eBioMedicine. Protecting Brain Health: Neurocognitive Risks in Sports Players. eBioMedicine 2025, 116, 105812. [Google Scholar] [CrossRef] [Scilit]
- Sarmiento, K.; Thomas, K.E.; Daugherty, J.; Waltzman, D.; Haarbauer-Krupa, J.K.; Peterson, A.B.; Haileyesus, T.; Breiding, M.J. Emergency Department Visits for Sports- and Recreation-Related Traumatic Brain Injuries Among Children—United States, 2010–2016. MMWR Morb. Mortal. Wkly. Rep. 2019, 68, 237–242. [Google Scholar] [CrossRef] [Scilit]
- Clark, M.; Guskiewicz, K. Sport-Related Traumatic Brain Injury. In Translational Research in Traumatic Brain Injury; Laskowitz, D., Grant, G., Eds.; CRC Press/Taylor and Francis Group: Boca Raton, FL, USA, 2016; ISBN 978-1-4665-8491-4. [Google Scholar]
- Ntikas, M.; Stewart, W.; Ietswaart, M.; Hunter, A.M.; Maas, A.I.R.; Menon, D.K.; Wilson, L. Contrasting Characteristics and Outcomes of Sports-Related and Non–Sports-Related Traumatic Brain Injury. JAMA Netw. Open 2024, 7, e2353318. [Google Scholar] [CrossRef] [Scilit]
- Khan, S.; Talley, L. Beyond the Hit: The Hidden Costs of Repetitive Head Trauma. Neurosci. Insights 2025, 20, 26331055251316315. [Google Scholar] [CrossRef] [Scilit]
- Dudley, J.; Yuan, W.; Diekfuss, J.; Foss, K.D.B.; DiCesare, C.A.; Altaye, M.; Logan, K.; Leach, J.L.; Myer, G.D. Altered Functional and Structural Connectomes in Female High School Soccer Athletes After a Season of Head Impact Exposure and the Effect of a Novel Collar. Brain Connect. 2020, 10, 292–301. [Google Scholar] [CrossRef] [Scilit]
- Diekfuss, J.A.; Yuan, W.; Foss, K.D.B.; Dudley, J.A.; DiCesare, C.A.; Reddington, D.L.; Zhong, W.; Nissen, K.S.; Shafer, J.L.; Leach, J.L.; et al. The Effects of Internal Jugular Vein Compression for Modulating and Preserving White Matter Following a Season of American Tackle Football: A Prospective Longitudinal Evaluation of Differential Head Impact Exposure. J. Neurosci. Res. 2021, 99, 423–445. [Google Scholar] [CrossRef] [Scilit]
- Major, B.; Symons, G.F.; Sinclair, B.; O’Brien, W.T.; Costello, D.; Wright, D.K.; Clough, M.; Mutimer, S.; Sun, M.; Yamakawa, G.R.; et al. White and Gray Matter Abnormalities in Australian Footballers with a History of Sports-Related Concussion: An MRI Study. Cereb. Cortex 2021, 31, 5331–5338. [Google Scholar] [CrossRef] [Scilit]
- Lees, B.; Earls, N.E.; Meares, S.; Batchelor, J.; Oxenham, V.; Rae, C.D.; Jugé, L.; Cysique, L.A. Diffusion Tensor Imaging in Sport-Related Concussion: A Systematic Review Using an a Priori Quality Rating System. J. Neurotrauma 2021, 38, 3032–3046. [Google Scholar] [CrossRef] [Scilit]
- Huang, W.; Yan, J.; Zheng, Y.; Wang, J.; Hu, W.; Zhang, J. Microstructural Alterations of Gray and White Matter in Active Young Boxers with Sports-Related Concussions. J. Neurotrauma 2025, 42, 33–45. [Google Scholar] [CrossRef] [Scilit]
- Bahrami, N.; Sharma, D.; Rosenthal, S.; Davenport, E.M.; Urban, J.E.; Wagner, B.; Jung, Y.; Vaughan, C.G.; Gioia, G.A.; Stitzel, J.D.; et al. Subconcussive Head Impact Exposure and White Matter Tract Changes over a Single Season of Youth Football. Radiology 2016, 281, 919–926. [Google Scholar] [CrossRef] [Scilit]
- Hellewell, S.C.; Nguyen, V.P.B.; Jayasena, R.N.; Welton, T.; Grieve, S.M. Characteristic Patterns of White Matter Tract Injury in Sport-Related Concussion: An Image Based Meta-Analysis. NeuroImage Clin. 2020, 26, 102253. [Google Scholar] [CrossRef] [Scilit]
- Hageman, G.; Hageman, I.; Nihom, J. Chronic Traumatic Encephalopathy in Soccer Players: Review of 14 Cases. Clin. J. Sport Med. 2024, 34, 69–80. [Google Scholar] [CrossRef] [Scilit]
- Etemad, L.L.; Yue, J.K.; Barber, J.; Nelson, L.D.; Bodien, Y.G.; Satris, G.G.; Belton, P.J.; Madhok, D.Y.; Huie, J.R.; Hamidi, S.; et al. Longitudinal Recovery Following Repetitive Traumatic Brain Injury. JAMA Netw. Open 2023, 6, e2335804. [Google Scholar] [CrossRef] [Scilit]
- Delgadillo, B.E.; Montz, F.; Ward, B.; Herson, A.B.; Toldi, J.P. Current Evidence for the Use of Jugular Vein Compression Collars in Sport: A Systematic Review. Curr. Sports Med. Rep. 2025, 24, 18–27. [Google Scholar] [CrossRef] [Scilit]
- Myer, G.D.; Yuan, W.; Foss, K.D.B.; Smith, D.; Altaye, M.; Reches, A.; Leach, J.; Kiefer, A.W.; Khoury, J.C.; Weiss, M.; et al. The Effects of External Jugular Compression Applied during Head Impact Exposure on Longitudinal Changes in Brain Neuroanatomical and Neurophysiological Biomarkers: A Preliminary Investigation. Front. Neurol. 2016, 7, 74. [Google Scholar] [CrossRef] [Scilit]
- DiCesare, C.; Foss, K.B.; Thomas, S.; Schneider, D.; Edwards, N.; Myer, G. The Effects of External Jugular Compression Applied during High Intensity Power, Strength and Postural Control Tasks. Curr. Res. Concussion 2017, 4, e23–e31. [Google Scholar] [CrossRef] [Scilit]
- Bao, D.; Zhou, J.; Hao, Y.; Yang, X.; Jiao, W.; Hu, Y.; Wang, X. The Effects of Fatiguing Aerobic Exercise on the Cerebral Blood Flow and Oxygen Extraction in the Brain: A Piloting Neuroimaging Study. Front. Neurol. 2019, 10, 654. [Google Scholar] [CrossRef] [Scilit]
- Bamford, I.J.; Bamford, N.S. The Striatum’s Role in Executing Rational and Irrational Economic Behaviors. Neuroscientist 2019, 25, 475–490. [Google Scholar] [CrossRef] [Scilit]
- Siebenmann, C.; Sørensen, H.; Jacobs, R.A.; Haider, T.; Rasmussen, P.; Lundby, C. Hypocapnia during Hypoxic Exercise and Its Impact on Cerebral Oxygenation, Ventilation and Maximal Whole Body O2 Uptake. Respir. Physiol. Neurobiol. 2013, 185, 461–467. [Google Scholar] [CrossRef] [Scilit]
- Rattray, B.; Smale, B.A.; Northey, J.M.; Smee, D.J.; Versey, N.G. Middle Cerebral Artery Blood Flow Velocity during a 4 Km Cycling Time Trial. Eur. J. Appl. Physiol. 2017, 117, 1241–1248. [Google Scholar] [CrossRef] [Scilit]
- Tortu, E.; Ouergui, I.; Deliceoğlu, G.; Keleş, A.; Ulupınar, S.; Özbay, S.; Gençoğlu, C.; Ardigò, L.P. Aerobic capacity and respiratory indices of junior cross-country skiers and biathletes during incremental exercise testing. Sci. Rep. 2024, 14, 22142. [Google Scholar] [CrossRef] [Scilit]
- Duncan, A.; Meek, J.H.; Clemence, M.; Elwell, C.E.; Fallon, P.; Tyszczuk, L.; Cope, M.; Delpy, D.T. Measurement of cranial optical path length as a function of age using phase resolved near infrared spectroscopy. Pediatr. Res. 1996, 39, 889–894. [Google Scholar] [CrossRef] [Scilit]
- Senn, S.S. Cross-Over Trials in Clinical Research; John Wiley & Sons: Hoboken, NJ, USA, 2002. [Google Scholar]
- Park, S.B.; Oh, K.; Yang, G.; Kim, T.; Lee, J.W.; Jeon, H.J.; Han, D.H. Oral Carbohydrate Sensing Enhances Prefrontal Cortex Oxygenation, Reduces Perceived Exertion, and Improves High-Intensity Cycling Performance: A Randomized Crossover Trial. PLoS ONE 2026, 21, e0349067. [Google Scholar] [CrossRef] [Scilit]
- Auten, A.; Cavey, K.; Reed, J.; Dolgener, F.; Moriarty, T. Effects of Transcranial Direct Current Stimulation on Cycling Time Trial Performance and Prefrontal Cortex Activation. Sci 2021, 3, 32. [Google Scholar] [CrossRef] [Scilit]

Disclaimer/Publisher’s Note: The statements, opinions and data contained in all publications are solely those of the individual author(s) and contributor(s) and not of MDPI and/or the editor(s). MDPI and/or the editor(s) disclaim responsibility for any injury to people or property resulting from any ideas, methods, instructions or products referred to in the content. |
© 2026 by the authors. Licensee MDPI, Basel, Switzerland. This article is an open access article distributed under the terms and conditions of the Creative Commons Attribution (CC BY) license.