


Abstract
Futsal is a high-intensity, intermittent team sport that places substantial physiological demands on the cardiovascular and musculoskeletal systems. This study aimed to analyze acute changes in hemodynamic variables, anthropometric circumferences, and lower-limb skin temperature following an indoor futsal training session in elite players competing at national and international levels. A prospective, observational, pre–post repeated-measures study was conducted in 13 healthy professional futsal players competing at the highest level of Spanish futsal, including athletes competing at both national and international levels. The following variables were assessed sequentially before and after a futsal training session: systolic and diastolic blood pressure, heart rate, lower-limb circumferences, peripheral oxygen saturation (SpO2), and skin temperature measured using infrared thermography. Following the training session, increases were observed in all measured lower-limb circumferences, except for the left thigh. Systolic blood pressure significantly increased after training (p = 0.002; ES = 1.11), whereas diastolic blood pressure showed a small, non-significant increase (p = 0.221; ES = 0.36). Significant bilateral differences were observed post-training in only tibialis anterior muscles, with lower temperatures on the right side. Skin temperature decreased consistently across all evaluated muscle groups following the training session (p < 0.05). Additionally, peripheral oxygen saturation (SpO2) significantly decreased after training (p = 0.001; ES = 1.00). A futsal training session elicits an acute, multidimensional physiological response characterized by increases in lower-limb circumference and systolic blood pressure, accompanied by reductions in skin temperature and peripheral oxygen saturation.
Keywords:
thermography; oxygen saturation; physiology; sport; performance; heart rate; anthropometry 1. Introduction
Futsal is a team sport characterized by intermittent, high-intensity play that is primarily played indoors on hard surfaces [1]. These characteristics give rise to specific physiological, neuromuscular, and metabolic demands that differ from those of other team sports, including traditional soccer [2,3]. During a training session or competition, players perform multiple explosive and repetitive actions such as sprints, changes in direction, jumps, and shots, which result in high muscle activation and significant physiological stress over short periods of time [3,4].
In this context, analyzing the acute effects of training or games is essential for understanding the body’s immediate responses and optimizing training load planning, recovery, and injury prevention [5,6]. Traditionally, these analyses have been conducted using physiological variables such as heart rate, blood pressure, or subjective perception of exertion; however, in recent years there has been growing interest in incorporating tools that allow for the evaluation of players [7,8,9].
Among these tools, infrared thermography (IRT) has emerged as an innovative technique for analyzing skin surface temperature (TSK) as a non-invasive thermographic marker that may reflect changes associated with exercise, although its relationship with muscle activity, blood flow, and inflammatory and thermoregulatory processes is complex and not fully established [10,11,12,13]. As noted by other authors, IRT is based on the detection of infrared radiation emitted by the human body at the skin level, allowing for the creation of superficial thermal maps that may reflect tissue physiological function. Although primarily used in the sports field, this technique has been widely shown to be useful for identifying areas of muscle overload and acute and chronic thermal responses to exercise [12,14,15]; in futsal, there is a gap that needs to be filled [16,17]. In a sport like futsal, where the muscle groups of the lower extremities are subjected to repetitive stress, thermography could be used to provide relevant information about immediate adaptations to training, especially when training takes place in an indoor facility, where ventilation and ambient temperature are controlled parameters.
However, anthropometry and vital sign monitoring remain essential tools in the assessment of athletic performance, even in futsal [18], since they allow us to describe the morphological and physiological characteristics that influence performance and response to exercise [19,20,21]. Several authors have linked variables such as body mass index (BMI) skinfold thickness, and muscle circumference to the analysis of exercise performance [22,23,24]. In fact, we know that in the analysis of the acute effects of training, anthropometric measurements and vital signs provide a contextual framework that helps interpret individual physiological responses, allowing us to understand why different athletes may exhibit different metabolic responses to the same training load. To conclude, morphological and vital sign analysis, in combination with thermography, could enable a comprehensive approach to studying the acute effects of training by integrating functional, morphological, and physiological information. This is because most research has focused on outdoor sports or on isolated analyses of these variables, leaving a gap in the literature regarding multidimensional approaches specifically applied to futsal. In fact, there are currently no known studies involving a specific multimodal combination applied to a hard-to-reach professional cohort.
Futsal therefore constitutes a particularly relevant context for the study of physical and neuromuscular demands due to the specific characteristics of the game. The reduced dimensions of the playing court and the high density of actions promote a greater frequency of accelerations, decelerations, and changes in direction, together with frequent turns and explosive actions performed over short distances, resulting in more specific locomotor demands compared with association football. These particularities make futsal a particularly interesting model for analyzing players’ physical and metabolic responses, as well as their performance.
Given the above, the primary objective was to characterize acute pre-to-post changes in lower-limb skin temperature following an indoor futsal training session in elite national and international players. Secondary objectives were to describe concomitant changes in limb circumference, blood pressure, heart rate, and peripheral oxygen saturation. The integration of these methodologies aims to provide physicians, physical therapists, and athletic trainers with a holistic view of the immediate responses to training, contributing to scientific knowledge applied to training load management, injury prevention, and performance optimization in futsal players. The hypothesis of our study is that the physiological changes generated by training loads can be reflected in all these variables.
2. Methods
2.1. Study Design
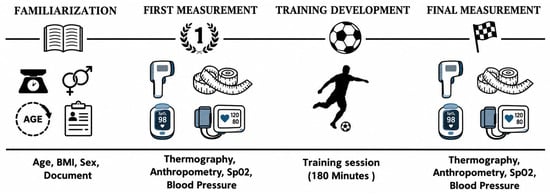
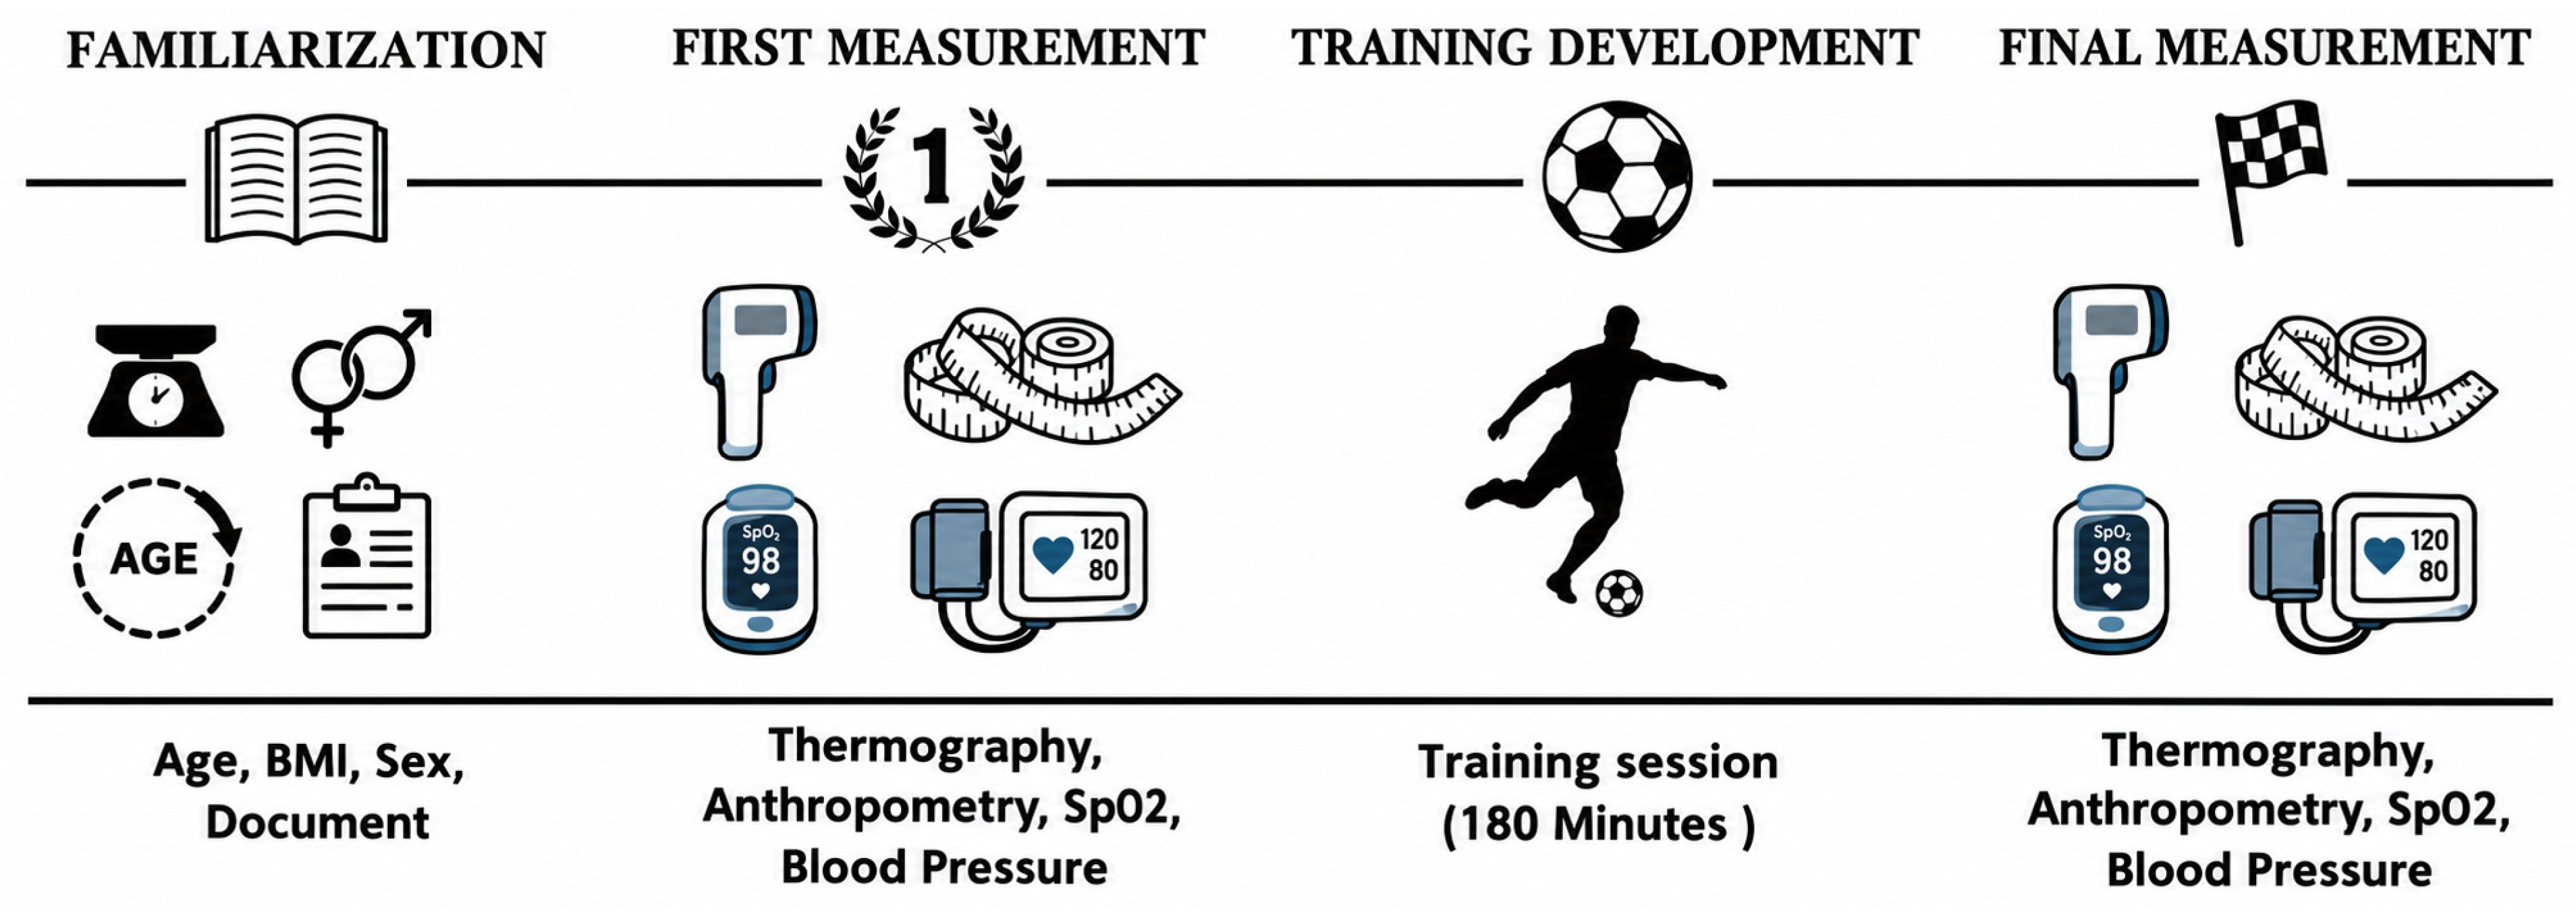
A prospective observational pre–post repeated-measures study was conducted among national and international professional futsal players in the Spanish first division. All participants received an information sheet and provided informed consent. The study was conducted in accordance with the Declaration of Helsinki on Research Involving Human Subjects [25] and was approved by the Ethics Committee of the Catholic University of San Antonio in Murcia under code (CE102102). The study was conducted during two separate laboratory sessions (Figure 1): one for familiarization and one for actual testing. The familiarization session was held 2 days before the main study session to provide all the necessary information to the volunteers, collect data on age, height, weight, and BMI, and have all athletes sign the informed consent form. In addition, during this session, the volunteers became familiar with the positioning required for thermographic, anthropometric, blood pressure, and peripheral oxygen saturation assessments. Recommendations from the Tisem protocol were provided [26] in order to avoid bias on the day of the thermographic measurement. The second session was used for pre- and post-workout measurements (Section 2.3). The order of the measurements was standardized both before and after exercise, following this sequence: (1) thermography, (2) blood pressure, (3) peripheral oxygen saturation (SpO2), and (4) limb circumferences. Thermographic measurements and limb circumference measurements were performed sequentially. On the other hand, blood pressure and SpO2 measurements were taken simultaneously, with three devices available for each of these variables. Regarding blood pressure assessment, a single measurement was taken both before and after exercise, and measurements were always taken on the same arm. The duration of the blood pressure and SpO2 measurement procedures depended on the respective automatic devices. The device used to measure blood pressure provided information on both blood pressure and heart rate.
Figure 1.
Sequence of protocol.
The study was conducted in accordance with the STROBE (Strengthening of Reporting of Observational Studies in Epidemiology) guidelines [27]. All athletes participated voluntarily and did not receive any financial or other incentives for taking part in the study.
2.2. Sample Characteristics
Thirteen healthy elite national and international players participated in the study. The study included adult subjects of any race, while volunteers with contraindications for muscle fatigue or any condition that, according to the researchers, could influence the results of the thermographic test, such as fever or muscle or joint pain in the lower limbs, were excluded.
2.3. Measurement Equipment and Protocols
2.3.1. Thermography
A Hikmicro M60 camera (Hangzhou, Zhejiang, China) was used for the thermographic study. This thermal imager has a thermal sensitivity of less than 0.04 °C and a temperature range of −20 °C to +150 °C. The emissivity was set to 0.98, as suggested by other studies [28]. The volunteers underwent a 15-min thermal acclimatization period in the room (18 m2), which was maintained at a constant temperature of 22 °C ± 1 °C, wearing only boxers and short-sleeved T-shirts. Humidity never exceeded 42 ± 1%, and atmospheric pressure was maintained at 1 atm. The temperature and humidity in the room were monitored and recorded using a digital hygrometer and controlled by the air conditioning units located in the room. There were no electronic devices or sources of artificial light or heat near the measurement point that could influence the volunteers’ body temperature. The thermal imaging device was turned on 1 h before the first measurement and positioned 1 m from the subject, who was lying on a 2-cm-thick mat to prevent direct contact with the floor. The camera was positioned in front of the athletes’ legs at a 10° angle. Pre-workout measurements were taken from 9:00 to 10:00 a.m., and post-workout measurements from 12:30 to 12:45 p.m. Regarding the interval between the end of the exercise and the post-exercise measurements, the thermographic measurements began after the exercise ended, with approximately 2 min elapsing between the end of the training session and the start of the thermographic evaluation. The measurements were taken sequentially, one at a time. Each measurement took approximately 30 to 40 s per athlete.
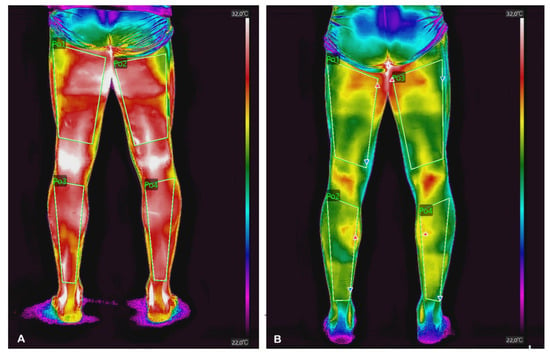
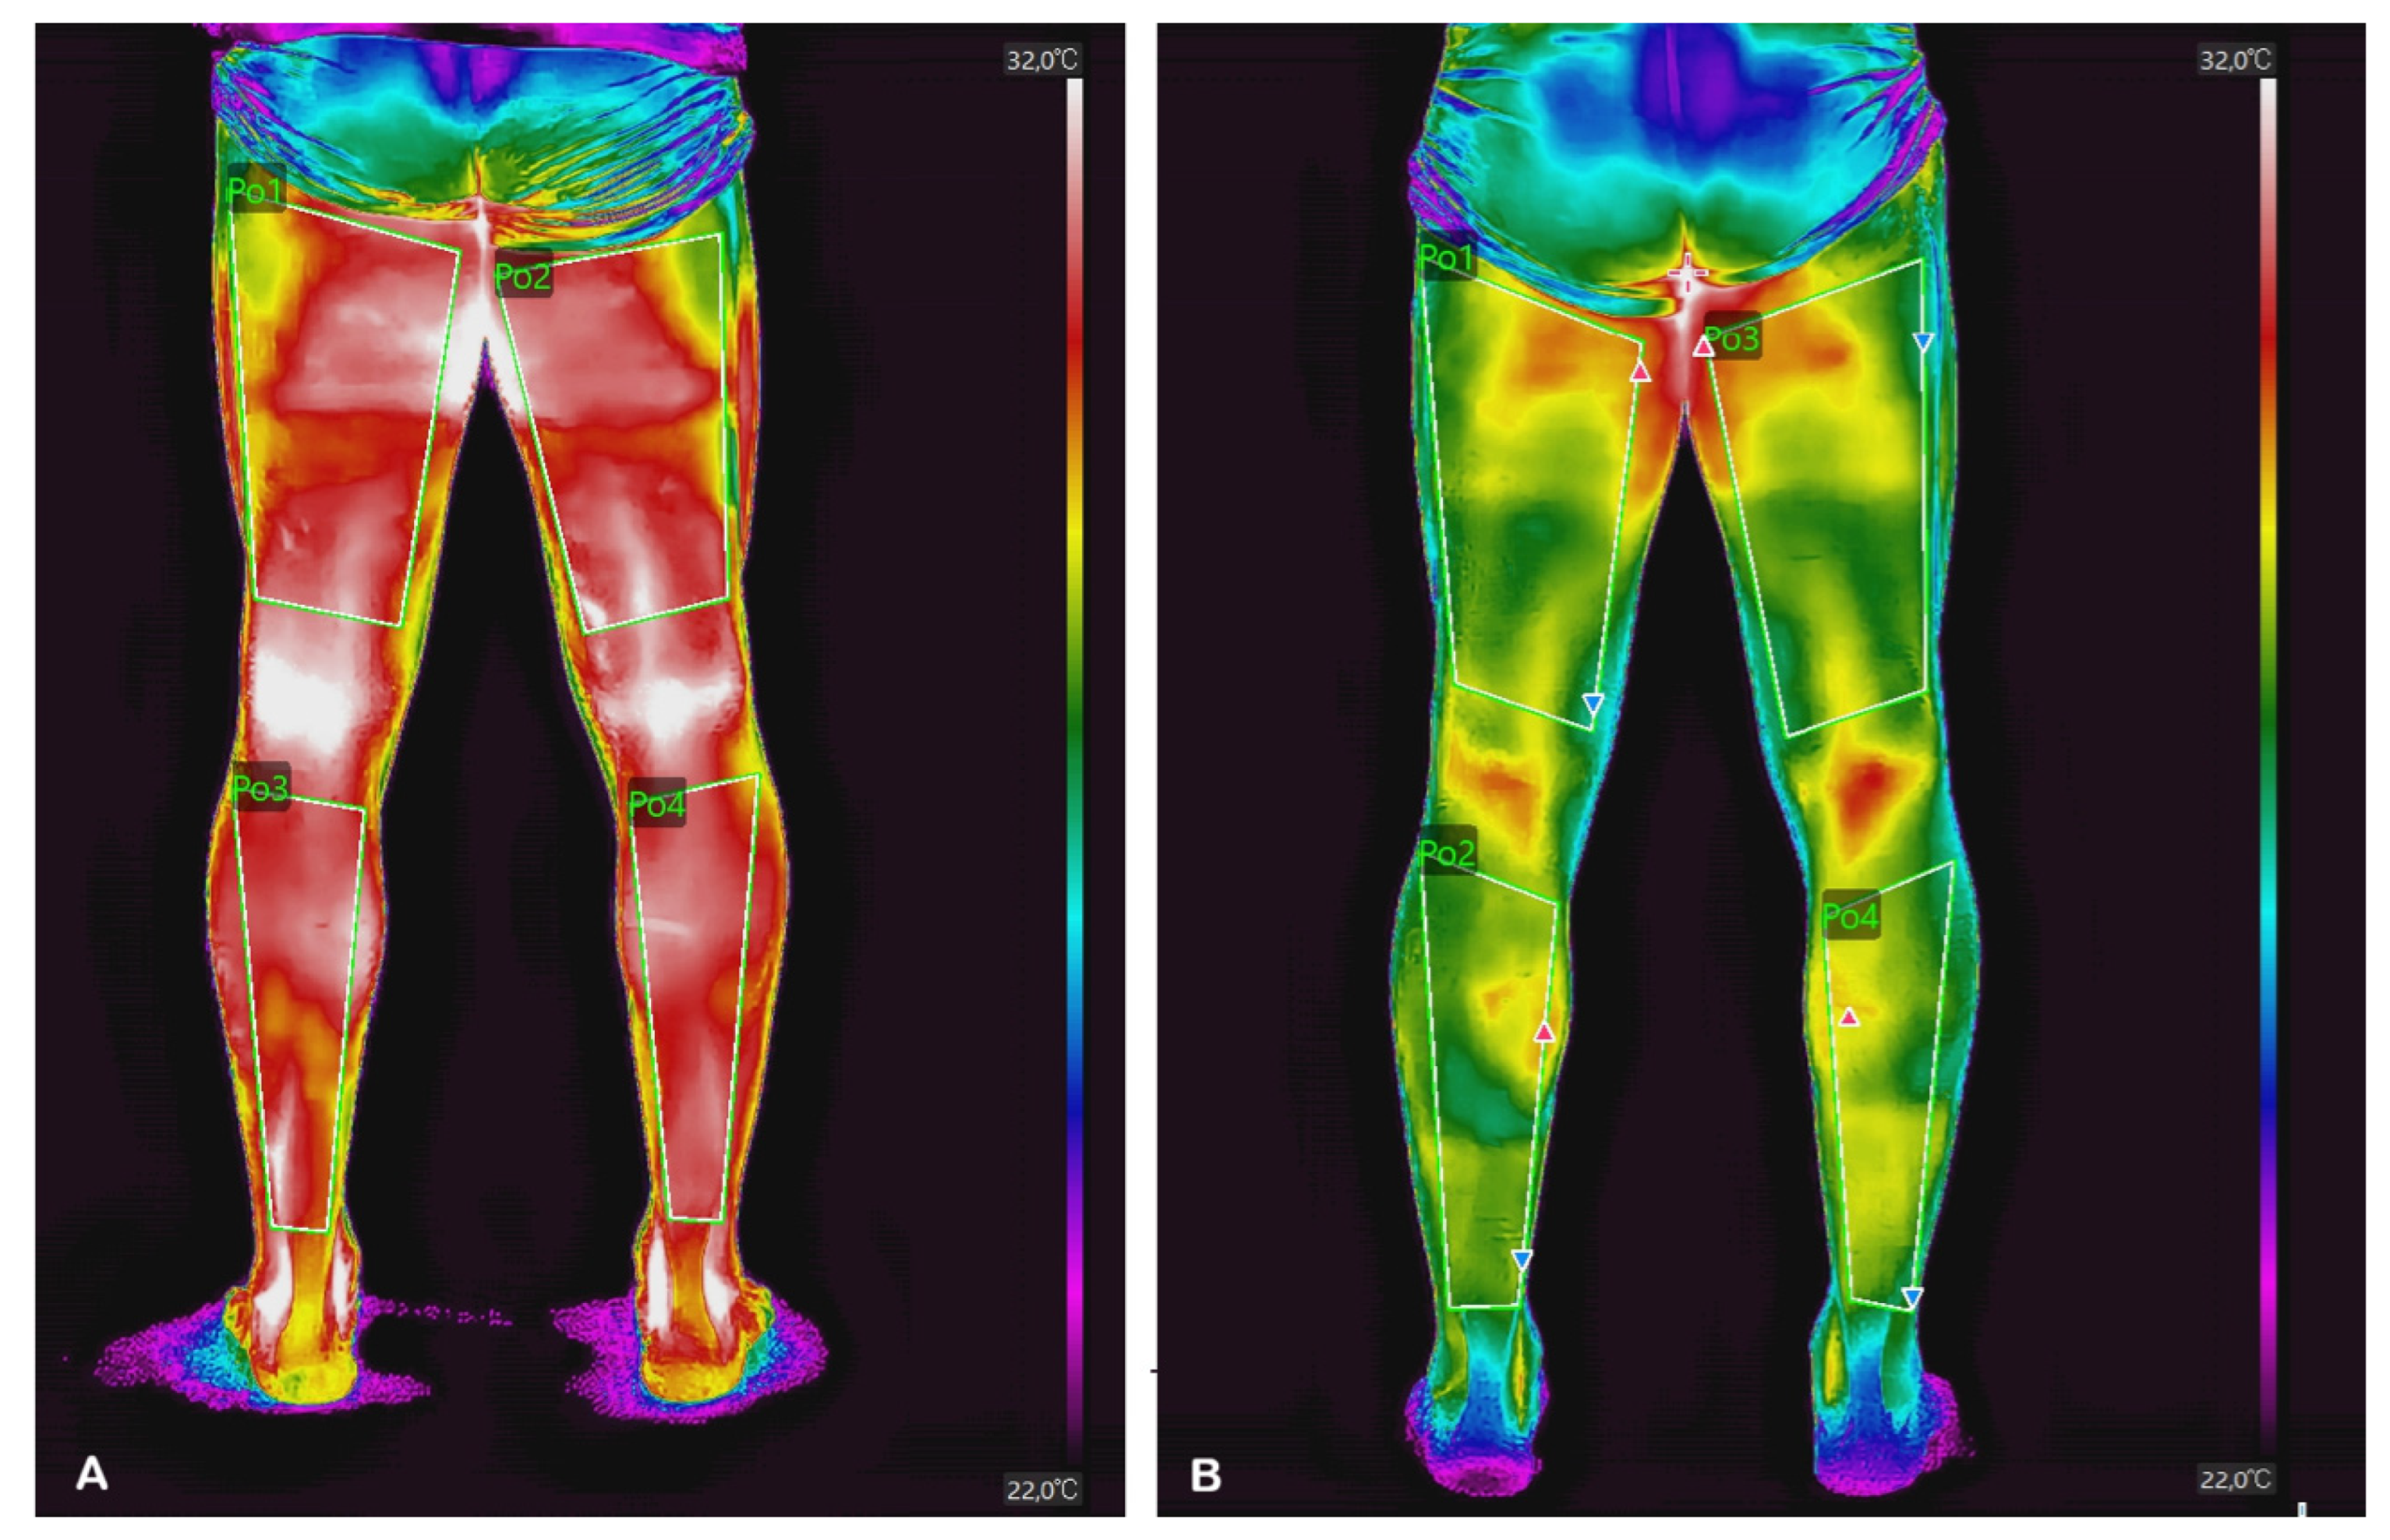
To ensure the accuracy and reproducibility of the anatomical delineation, regions of interest (ROIs) in the lower extremities were defined using standardized anatomical landmarks previously established in the literature, maximizing the number of pixels included within each ROI [13]. Thermographic images were acquired from anterior and posterior views, following the same segmentation scheme and methodological criteria described in previous studies. Four anatomical regions were assessed: the anterior thigh (quadriceps), posterior thigh (hamstrings), anterior lower leg (tibialis anterior region), and posterior lower leg (triceps surae) (Figure 2). Regarding the analysis of thermographic data, only the mean temperature values obtained from each region of interest (ROI) were extracted. To ensure consistency in the geometry and location of each ROI, the ROIs were defined on the digital images to minimize potential bias associated with the color palette. In addition, the camera and the athletes were always positioned at the same distance during each measurement. This procedure ensured that, despite the possibility of minor differences in ROI size between the pre- and post-training images, the same anatomical regions were consistently analyzed. Regarding camera calibration, the model used in this study performs automatic calibration; therefore, no additional calibration procedure was required or applied.
Figure 2.
Thermographic image with ROI of the back of the lower limbs. (A): pre-workout; (B): post-workout.
Image processing was performed in a blind manner by two researchers using the Hickmicro Analyzer V2.2.2 software. When temperature differences existed in the ROI analyzed by the researchers, they reached a consensus; in the event of a conflict, a third researcher intervened to resolve it. The intervention of a third researcher was not necessary in any of the cases analyzed.
2.3.2. Body Mass Index and Morphometry
BMI data were obtained using the Tanita BC-545 Innerscan segmental body composition monitor (Tanita Corporation, Itabashi-ku, Tokyo, Japan). For the study measuring lower limb circumference, the RENPHO smart measuring tape (RENPHO, Irvine, CA, USA) was used, which is a digital device designed to measure and record body circumferences and track changes in body composition over time via a mobile app. Measurement range: approximately 1 mm–1500 mm (150 cm). Accuracy: approximately ±3 mm. Power source: CR2032 battery. Approximate weight: 100 g. To ensure the reproducibility and standardization of circumference measurements, the protocol of the International Society for the Advancement of Kinanthropometry (ISAK) was followed [29]. The mid-thigh crease was used as a reference point, located halfway between the anterior superior iliac spine and the top of the patella. Thigh circumference: measured around the mid-thigh crease, with the subject standing and the muscle relaxed. Point of maximum calf circumference: the widest region between the knee and the ankle is measured. The subject must be standing, with weight distributed evenly and the muscle relaxed, to ensure consistency. The measurements were taken by a single expert ISAK measurer.
2.3.3. Blood Pressure
Blood pressure was measured using the Omron HEM-7144T2 device (OMRON Healthcare Co., Ltd., Kyoto, Japan), following the data collection protocol recommendations of the European Society of Hypertension. During the measurement, the patient was seated with their back against the backrest, feet flat on the floor (not crossed), and arm resting at heart level. The blood pressure cuff was placed on the bare arm, properly adjusted to fit the arm’s circumference, with its center positioned over the brachial artery.
2.3.4. SpO2
The Beijing Choice Electronic® MC300C1C (Beijing Choice Electronic Technology Co., Ltd., Beijing, China) device was used to measure peripheral oxygen saturation (SpO2). The patient was relaxed and did not speak or move during the procedure. The pulse oximeter was placed on the index finger, ensuring that the area was clean, dry, and free of nail polish, artificial nails, or dirt, as these factors can interfere with the signal. The device was adjusted properly, without applying excessive pressure that could compromise circulation. During the measurement, the athletes kept their hand supported and at heart level, avoiding movements that could cause signal artefacts. Under normal conditions, SpO2 values in healthy adults typically range from 95% to 100%. A formal device-specific signal-quality index and replicate measurements were not recorded; therefore, the analysis was based on the standardized pulse-oximetry reading obtained under the conditions described above.
2.3.5. Training Characteristics
The floor where the training took place is made of sports-grade wood, that is, a wooden flooring surface designed for indoor sports due to its elasticity and shock-absorbing properties. The dimensions are the official FIFA measurements of 40 × 20 m, with goals measuring 3 × 2 m. The training session consisted of an initial warm-up phase with exercises such as bounds, open steps, shuffles, and drop steps. In the second phase, the team practiced 4-on-1 rondos, 6-on-3 possession drills at midfield, and a controlled 5-on-5 match with two free goalkeepers. They also worked on 2-on-1 and 3-on-2 transitions, followed by a full-field 4-on-4 game with two goalkeepers, with substitutions every 8 min. The third phase consisted of a cool-down session with dynamic warm-ups and stretching. As for the duration of individual training/exposure, this information was not systematically collected during the study and is therefore not available in the existing records.
2.4. Statistical Analysis
All statistical analyses were performed using Jamovi v 2.6 (Jamovi.org, Sydney, Australia). Descriptive statistics were calculated for all study variables and are presented as mean ± standard deviation (SD), along with the standard error (SE) and the coefficient of variation (CV).
To assess the acute effects of the futsal training session, pre- and post-training measurements were compared using paired-samples Student’s t-tests for variables with a normal distribution. When the assumption of normality was not met, the corresponding Wilcoxon signed-rank test was applied. Normality was assessed using the Shapiro–Wilk test, complemented by graphical inspection of the data distribution. In addition, bilateral comparisons were performed between the right and left lower limbs separately, both before and after training. Paired-samples t-tests were used for normally distributed variables, whereas Wilcoxon signed-rank tests were used for non-normally distributed variables. Thus, the statistical test applied to each variable was determined according to its distributional characteristics and not according to the statistical significance of the results.
Bilateral comparisons between the right and left lower limbs were also performed separately before and after training using the same distribution-based procedure. Thus, the statistical test applied to each variable was determined according to its distributional characteristics and not according to the statistical significance of the results. For pairwise post-hoc comparisons, nominal confidence intervals were obtained from the corresponding pairwise contrasts, while the p-values were adjusted for multiple comparisons using the Holm procedure. Consequently, the inferential significance for these comparisons was determined based on the Holm-adjusted p-values.
Skin temperature was defined as a priori as the primary outcome, with the four predefined regions of interest in the lower extremities considered as a family of primary outcomes. The limb circumference, blood pressure, heart rate, and peripheral oxygen saturation were considered secondary outcomes. These secondary analyzes were considered exploratory and were interpreted using effect estimates, 95% confidence intervals, and nominal p-values.
For paired comparisons analyzed using the paired t-test, Cohen’s d was calculated as the mean paired difference divided by the standard deviation of the paired differences and interpreted according to conventional thresholds (small, 0.20; moderate, 0.50; large, ≥0.80). For comparisons analyzed using the Wilcoxon signed-rank test, effect size was expressed as rank-biserial correlation (rrb) and calculated as rrb = (W+ − W−)/(W+ + W−), where W+ and W− represent the sums of the positive and negative signed ranks, respectively. Values around 0.10, 0.30, and 0.50 represent small, moderate, and large effects, respectively. All statistical tests were two-tailed, and the significance level was set at p < 0.05.
3. Results
The thirteen professional futsal players included in the study had a mean age of 29.1 ± 4.33 years, a height of 178.1 ± 5.36 cm, a body mass of 77.1 ± 5.32 kg, and a body mass index (BMI) of 24.3 ± 1.20 kg·m−2 (Table 1).
Table 1.
General characteristics of the sample. Mean (standard deviation).
3.1. Anthropometric Variables
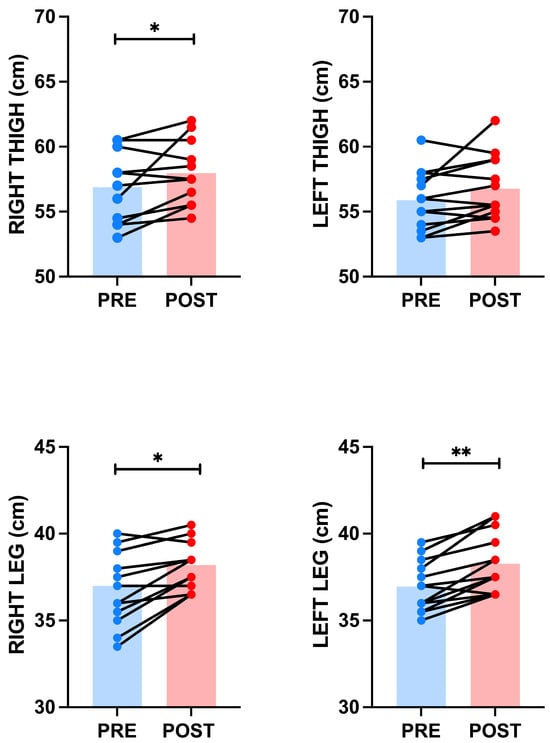
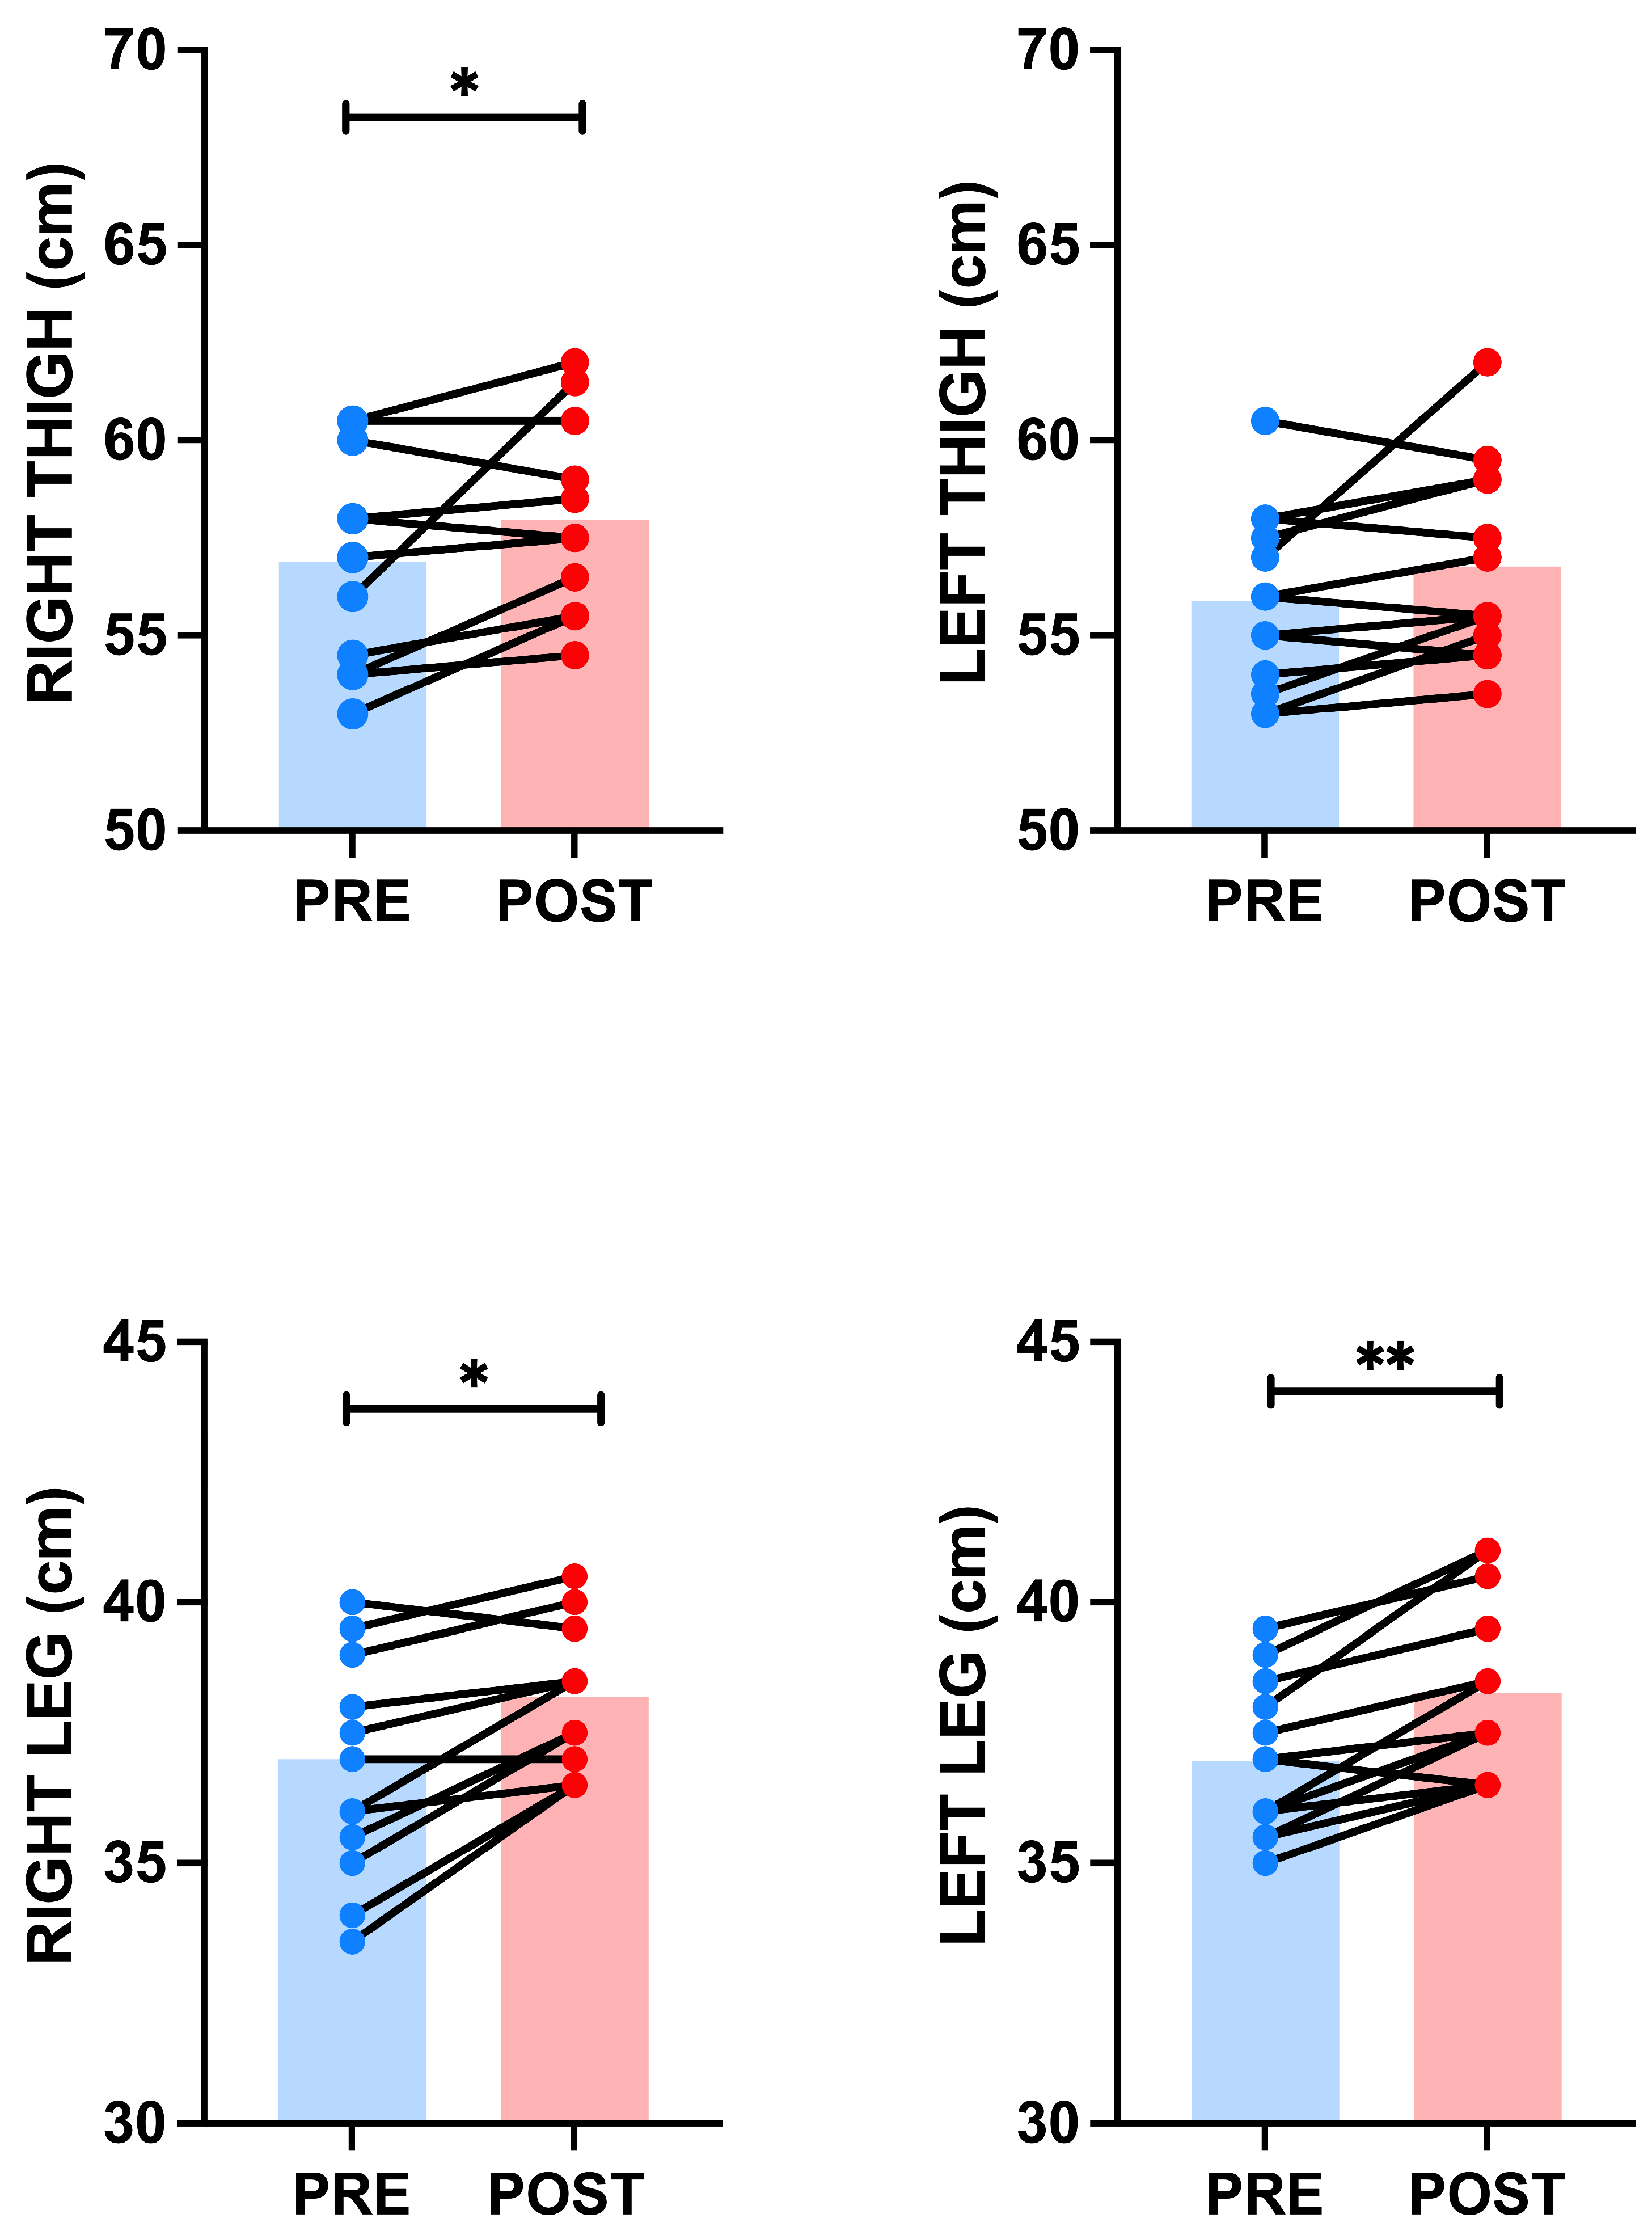
Following the intervention, an increase was observed in all measured circumferences (Figure 3). The circumference of the right thigh increased from 56.9 ± 2.53 cm (SE = 0.70; CV = 4.4%; 95%CI: 55.4–58.4) to 58.7 ± 2.98 cm (SE = 0.83; CV = 5.1%; 95%CI: 56.6–59.4) (p = 0.029; ES = 0.72). Similarly, the circumference of the right leg increased from 37.0 ± 2.22 cm (SE = 0.62; CV = 6.0%; 95%CI: 35.7–38.3) to 38.2 ± 1.39 cm (SE = 0.39; CV = 3.6%; 95%CI: 37.4–39.0) (p = 0.004; ES = 0.99) (Figure 3). In the left thigh, the circumference showed no statistically significant differences, ranging from 55.9 ± 2.27 cm (SE = 0.63; CV = 4.1%; 95% CI: 54.5–57.3) to 56.8 ± 2.49 cm (SE = 0.69; CV = 4.4%; 95% CI: 55.3–58.3) (p = 0.065; ES = 0.56) (Figure 3). However, the left leg circumference increased from 37.0 ± 1.45 cm (SE = 0.40; CV = 3.9%; 95%CI: 36.1–37.8) to 38.3 ± 1.73 cm (SE = 0.48; CV = 4.5%; 95%CI: 37.2–39.3) (p ≤ 0.001; ES = 1.41) (Figure 3). Overall, these variables showed low interindividual variability, with coefficients of variation below 6%.
Figure 3.
Changes in anthropometric measurements before and after training. * = p ≤ 0.05; ** = p < 0.001.
3.2. Cardiovascular Variables
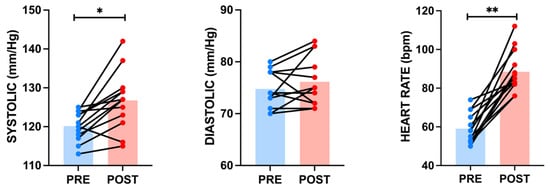
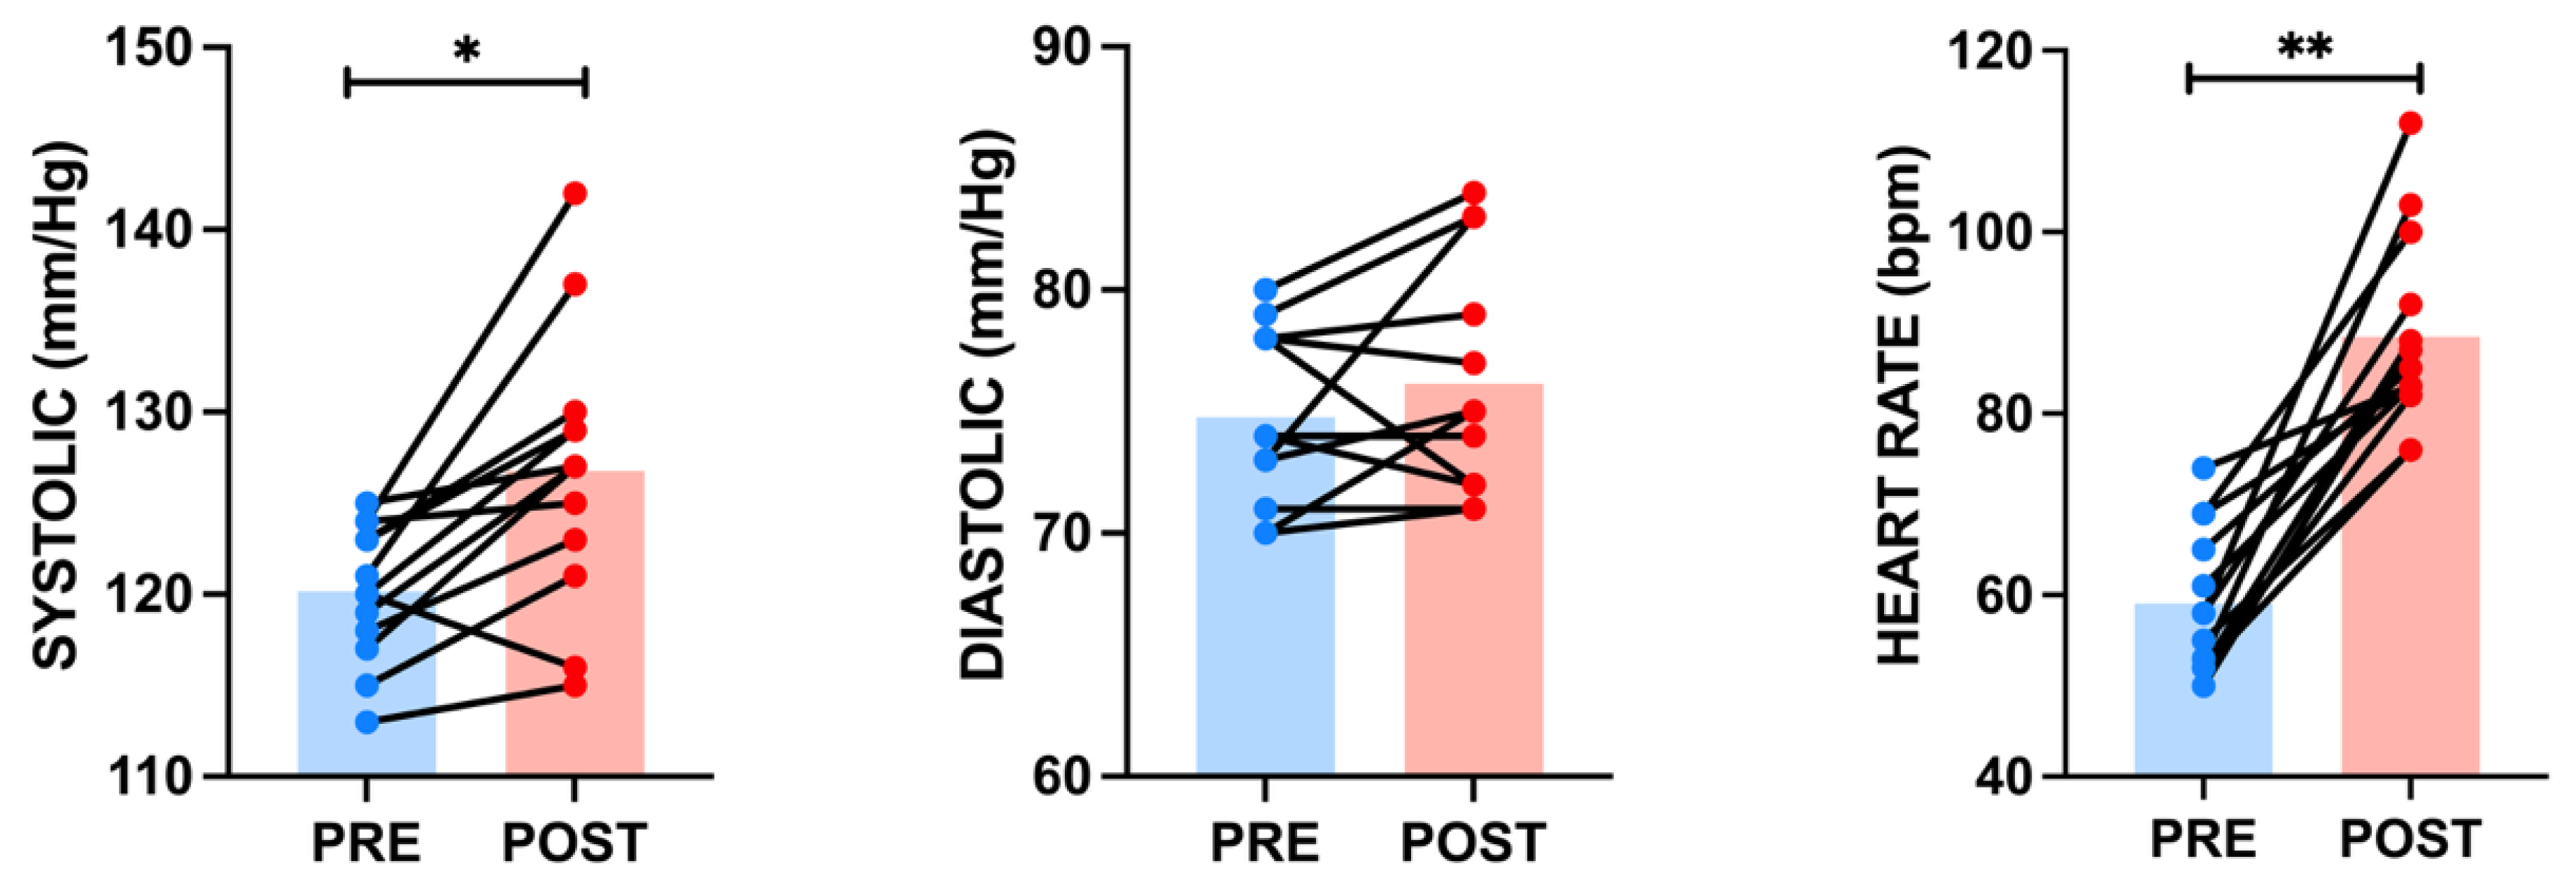
Systolic blood pressure increased from 120.2 ± 3.69 mmHg pre-test (SE = 1.02; CV = 3.1%; 95%CI: 117.9–122.4) to 126.8 ± 7.43 mmHg post-test (SE = 2.06; CV = 5.9%; 95%CI: 122.3–131.3) (p = 0.002; ES = 1.11). However, diastolic blood pressure showed a slight non-significant increase, from 74.8 ± 3.47 mmHg pre-test (SE = 0.96; CV = 4.6%; 95%CI: 72.7–76.9) to 76.2 ± 4.69 mmHg post-test (SE = 1.30; CV = 6.2%; 95%CI: 73.3–79.0) (p = 0.221; ES = 0.36). Meanwhile, heart rate increased significantly from 59.1 ± 7.89 bpm pre-test (SE = 2.19; CV = 13.4%; 95%CI: 54.3–63.8) to 88.5 ± 10.67 bpm post-test (SE = 2.96; CV = 12.1%; 95%CI: 82.0–94.9) (p ≤ 0.001; ES = 2.25), with this variable showing the greatest relative variability among participants (Figure 4).
Figure 4.
Changes in systolic and diastolic blood pressure and heart rate before and after training. * = p ≤ 0.05; ** = p < 0.001.
3.3. Surface Temperature Measured Using Infrared Thermography
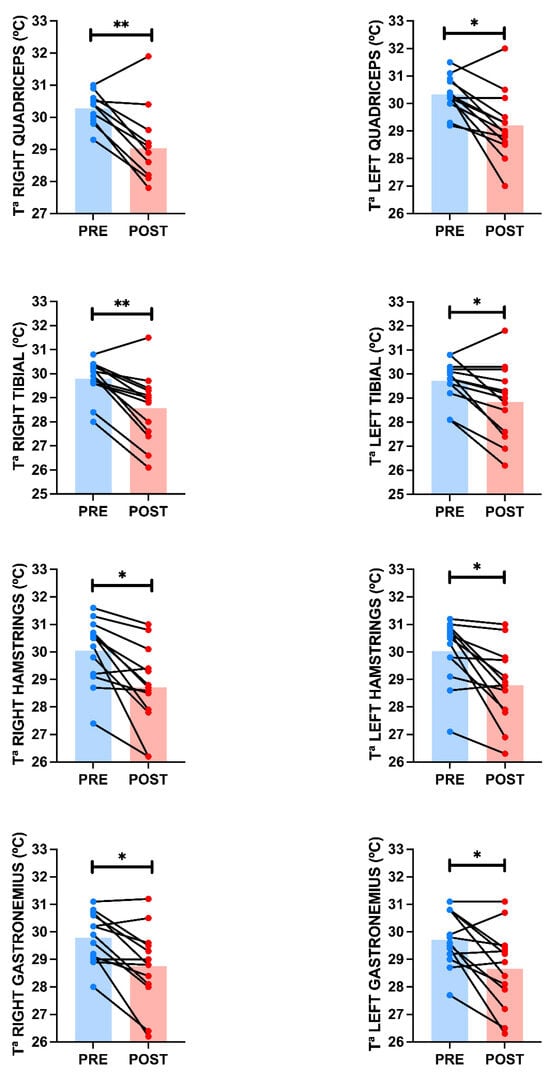
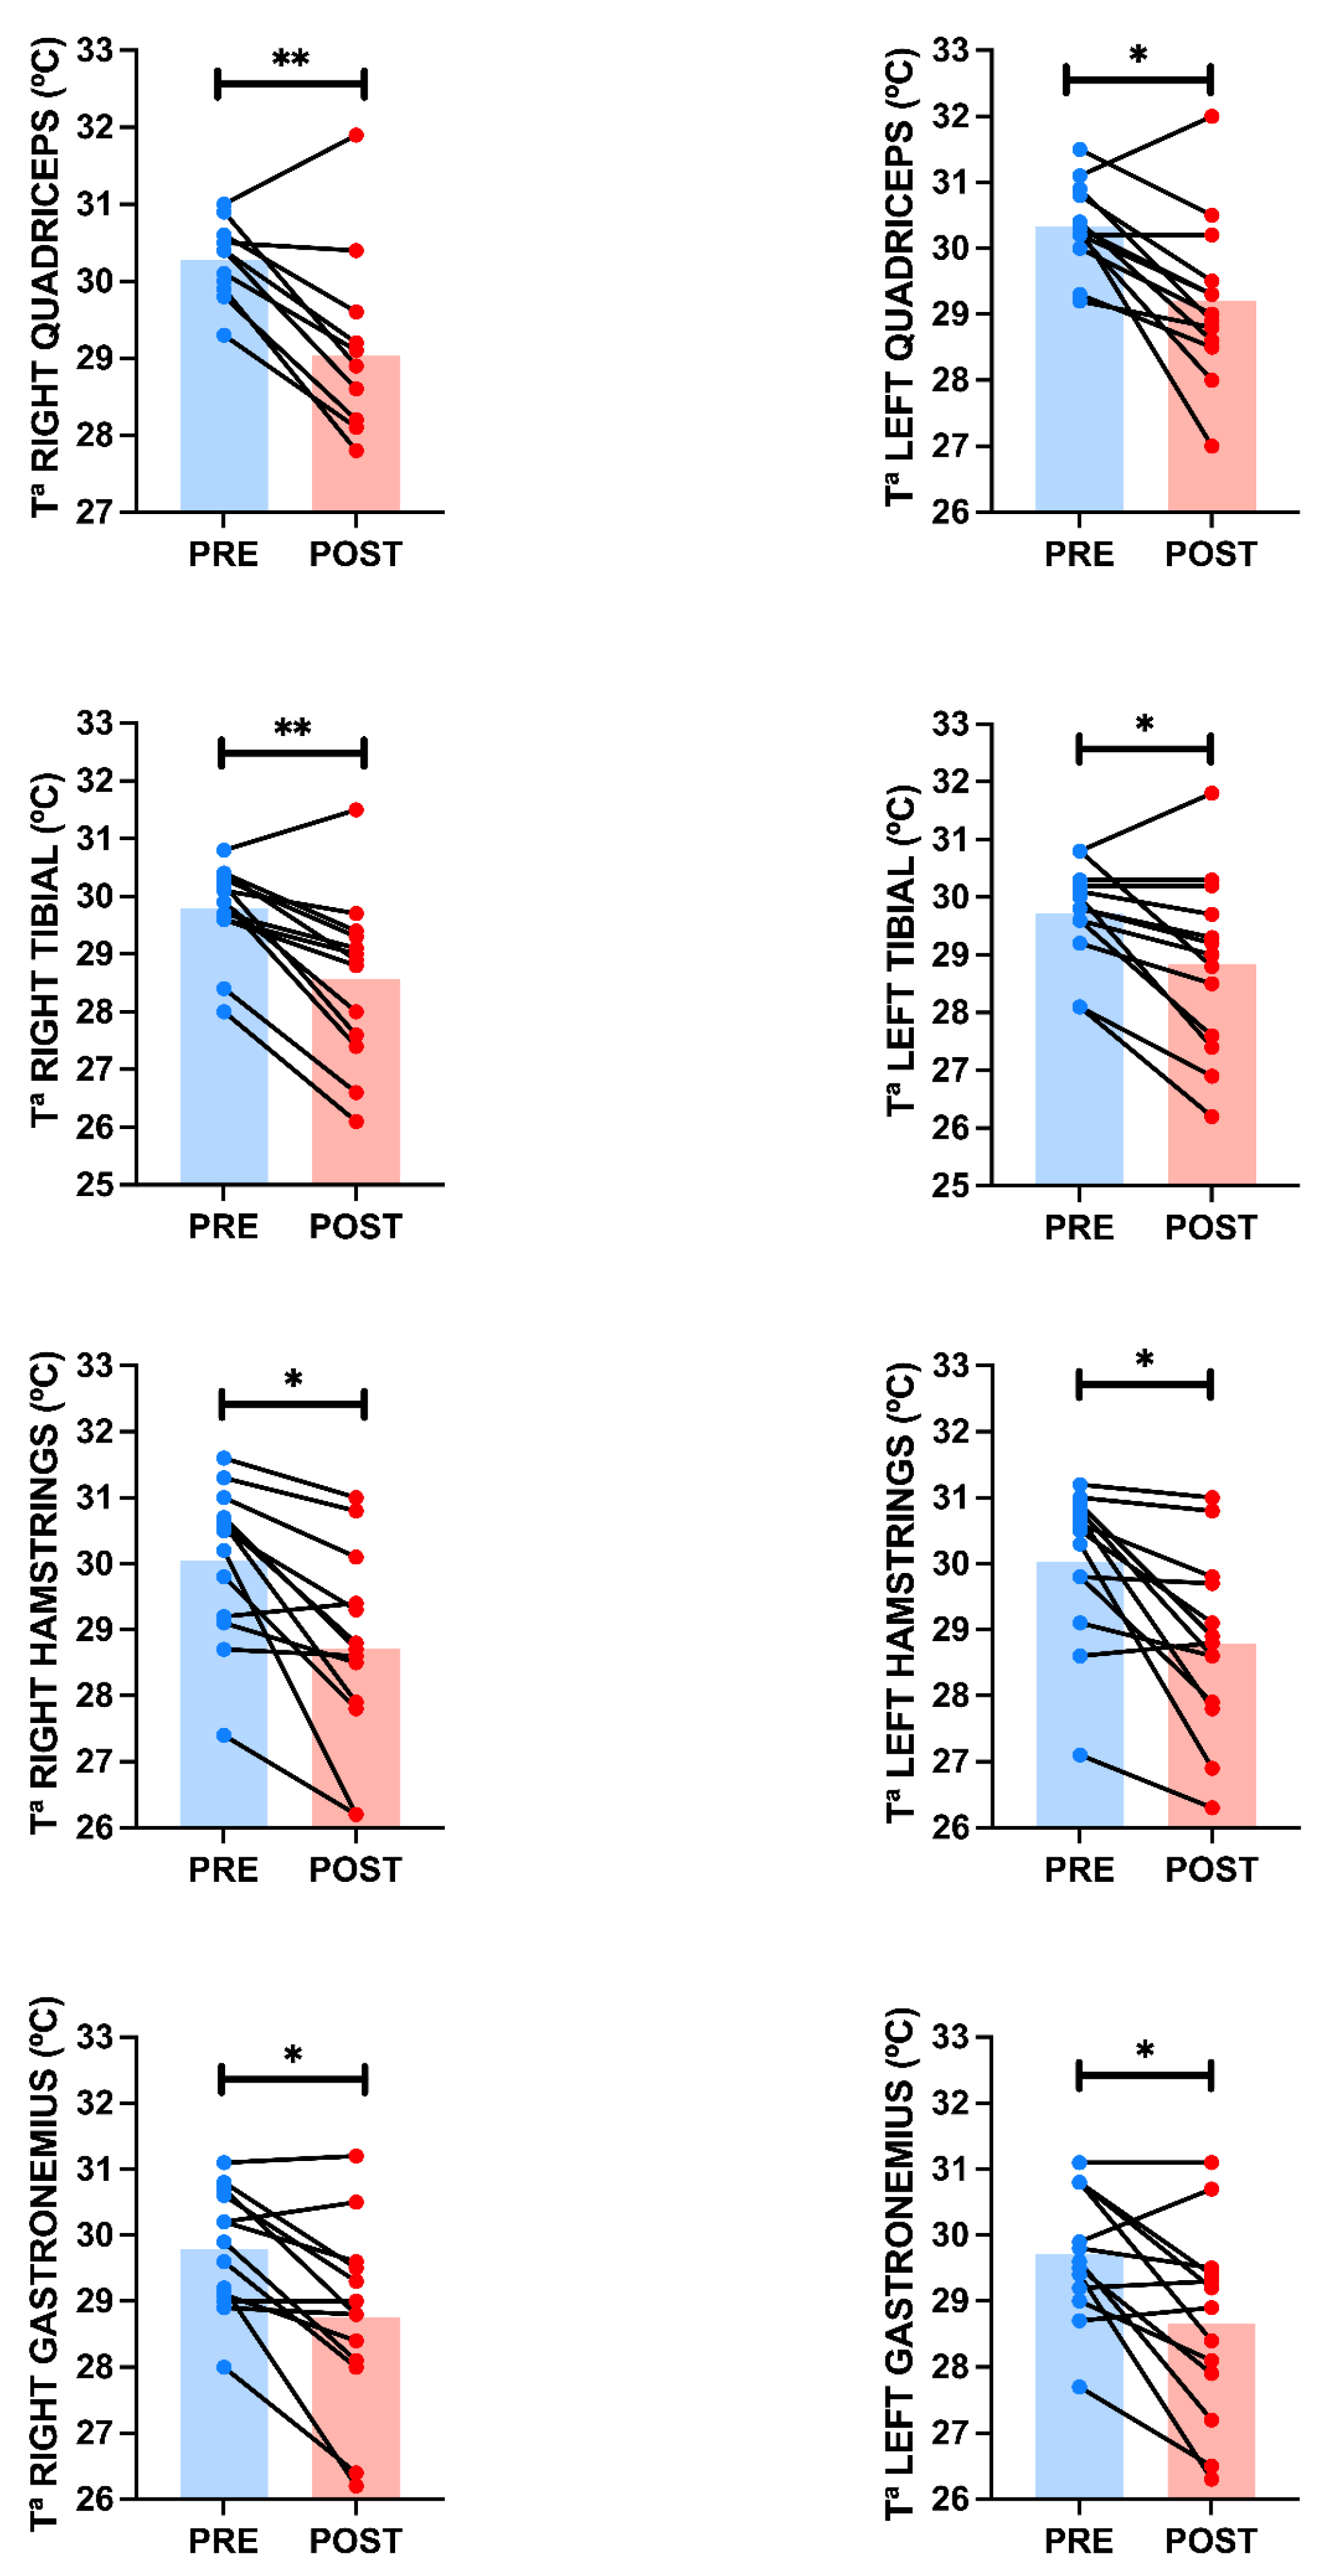
Skin temperature decreased consistently across all muscle groups evaluated following the intervention. In the right quadriceps, it decreased from 30.3 ± 0.47 °C (SE = 0.13; CV = 1.6%; 95%CI: 30.0–30.6) to 29.0 ± 1.25 °C (SE = 0.35; CV = 4.3%; 95%CI: 28.3–29.8) (p ≤ 0.001; ES = 1.29), while in the right tibialis anterior, it dropped from 29.8 ± 0.79 °C (SE = 0.22; CV = 2.7%; 95%CI: 29.3–30.3) to 28.6 ± 1.42 °C (SE = 0.40; CV = 5.0%; 95%CI: 27.7–29.4) (p ≤ 0.001; ES = 1.32) (Figure 5). In the left lower limb, the quadriceps temperature decreased from 30.3 ± 0.65 °C (SE = 0.18; CV = 2.1%; 95%CI: 30.0–30.7) to 29.2 ± 1.23 °C (SE = 0.34; CV = 4.2%; 95%CI: 28.5–29.9) (p = 0.008; ES = 1.10), while the temperature of the tibialis anterior decreased from 29.7 ± 0.85 °C (SE = 0.24; CV = 2.9%; 95%CI: 29.2–30.2) to 28.8 ± 1.54 °C (SE = 0.43; CV = 5.3%; 95%CI: 27.9–29.8) (p = 0.008; ES = 0.86) (Figure 5). In the hamstrings, the temperature on the right side decreased from 30.1 ± 1.18 °C (SE = 0.33; CV = 3.9%; 95%CI: 29.3–30.8) to 28.7 ± 1.49 °C (SE = 0.41; CV = 5.2%; 95%CI: 27.8–29.6) (p = 0.001; ES = 1.16), while on the left side it decreased from 30.0 ± 1.17 °C (SE = 0.32; CV = 3.9%; 95%CI: 29.3–30.7) to 28.8 ± 1.37 °C (SE = 0.38; CV = 4.8%; 95%CI: 28.0–29.6) (p = 0.002; ES = 1.10) (Figure 5). Finally, the right gastrocnemius decreased in temperature from 29.8 ± 0.92 °C (SE = 0.25; CV = 3.1%; 95%CI: 29.2–30.4) to 28.8 ± 1.41 °C (SE = 0.39; CV = 4.9%; 95%CI: 27.9–29.6) (p = 0.002; ES = 1.10), while the left gastrocnemius went from 29.7 ± 0.98 °C (SE = 0.27; CV = 3.3%; 95%CI: 29.1–30.3) to 28.7 ± 1.46 °C (SE = 0.40; CV = 5.1%; 95%CI: 27.7–29.5) (p = 0.007; ES = 0.90) (Figure 5). Overall, pre-intervention measurements showed high homogeneity (CV between 1.6% and 3.9%), with variability increasing slightly after the intervention.
Figure 5.
Changes in skin surface temperature in the different anatomical areas analyzed before and after training. * = p ≤ 0.05; ** = p < 0.001. Data derived from the analysis of the paired t-test comparison.
3.4. Bilateral Comparisons (Right–Left)
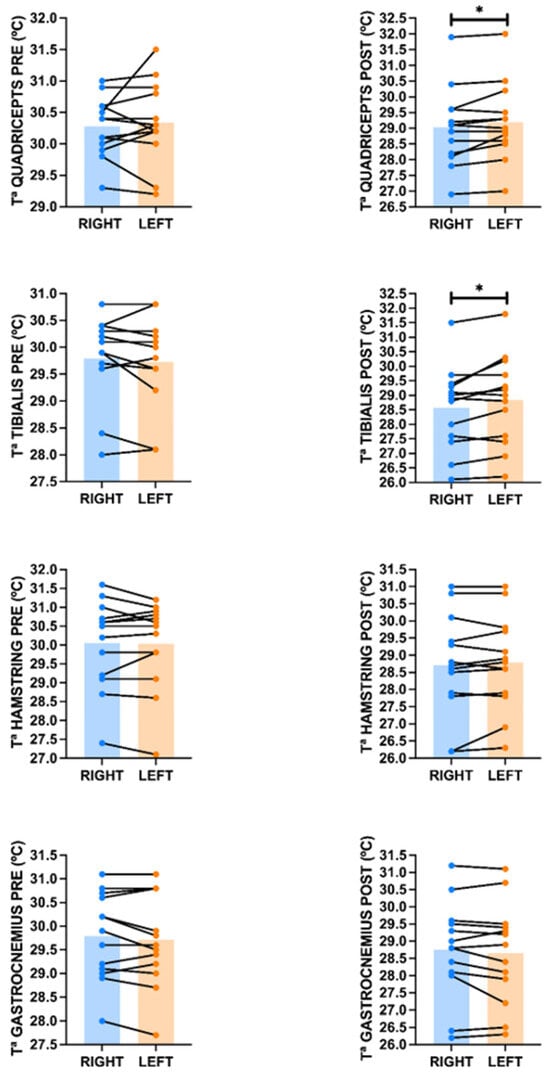
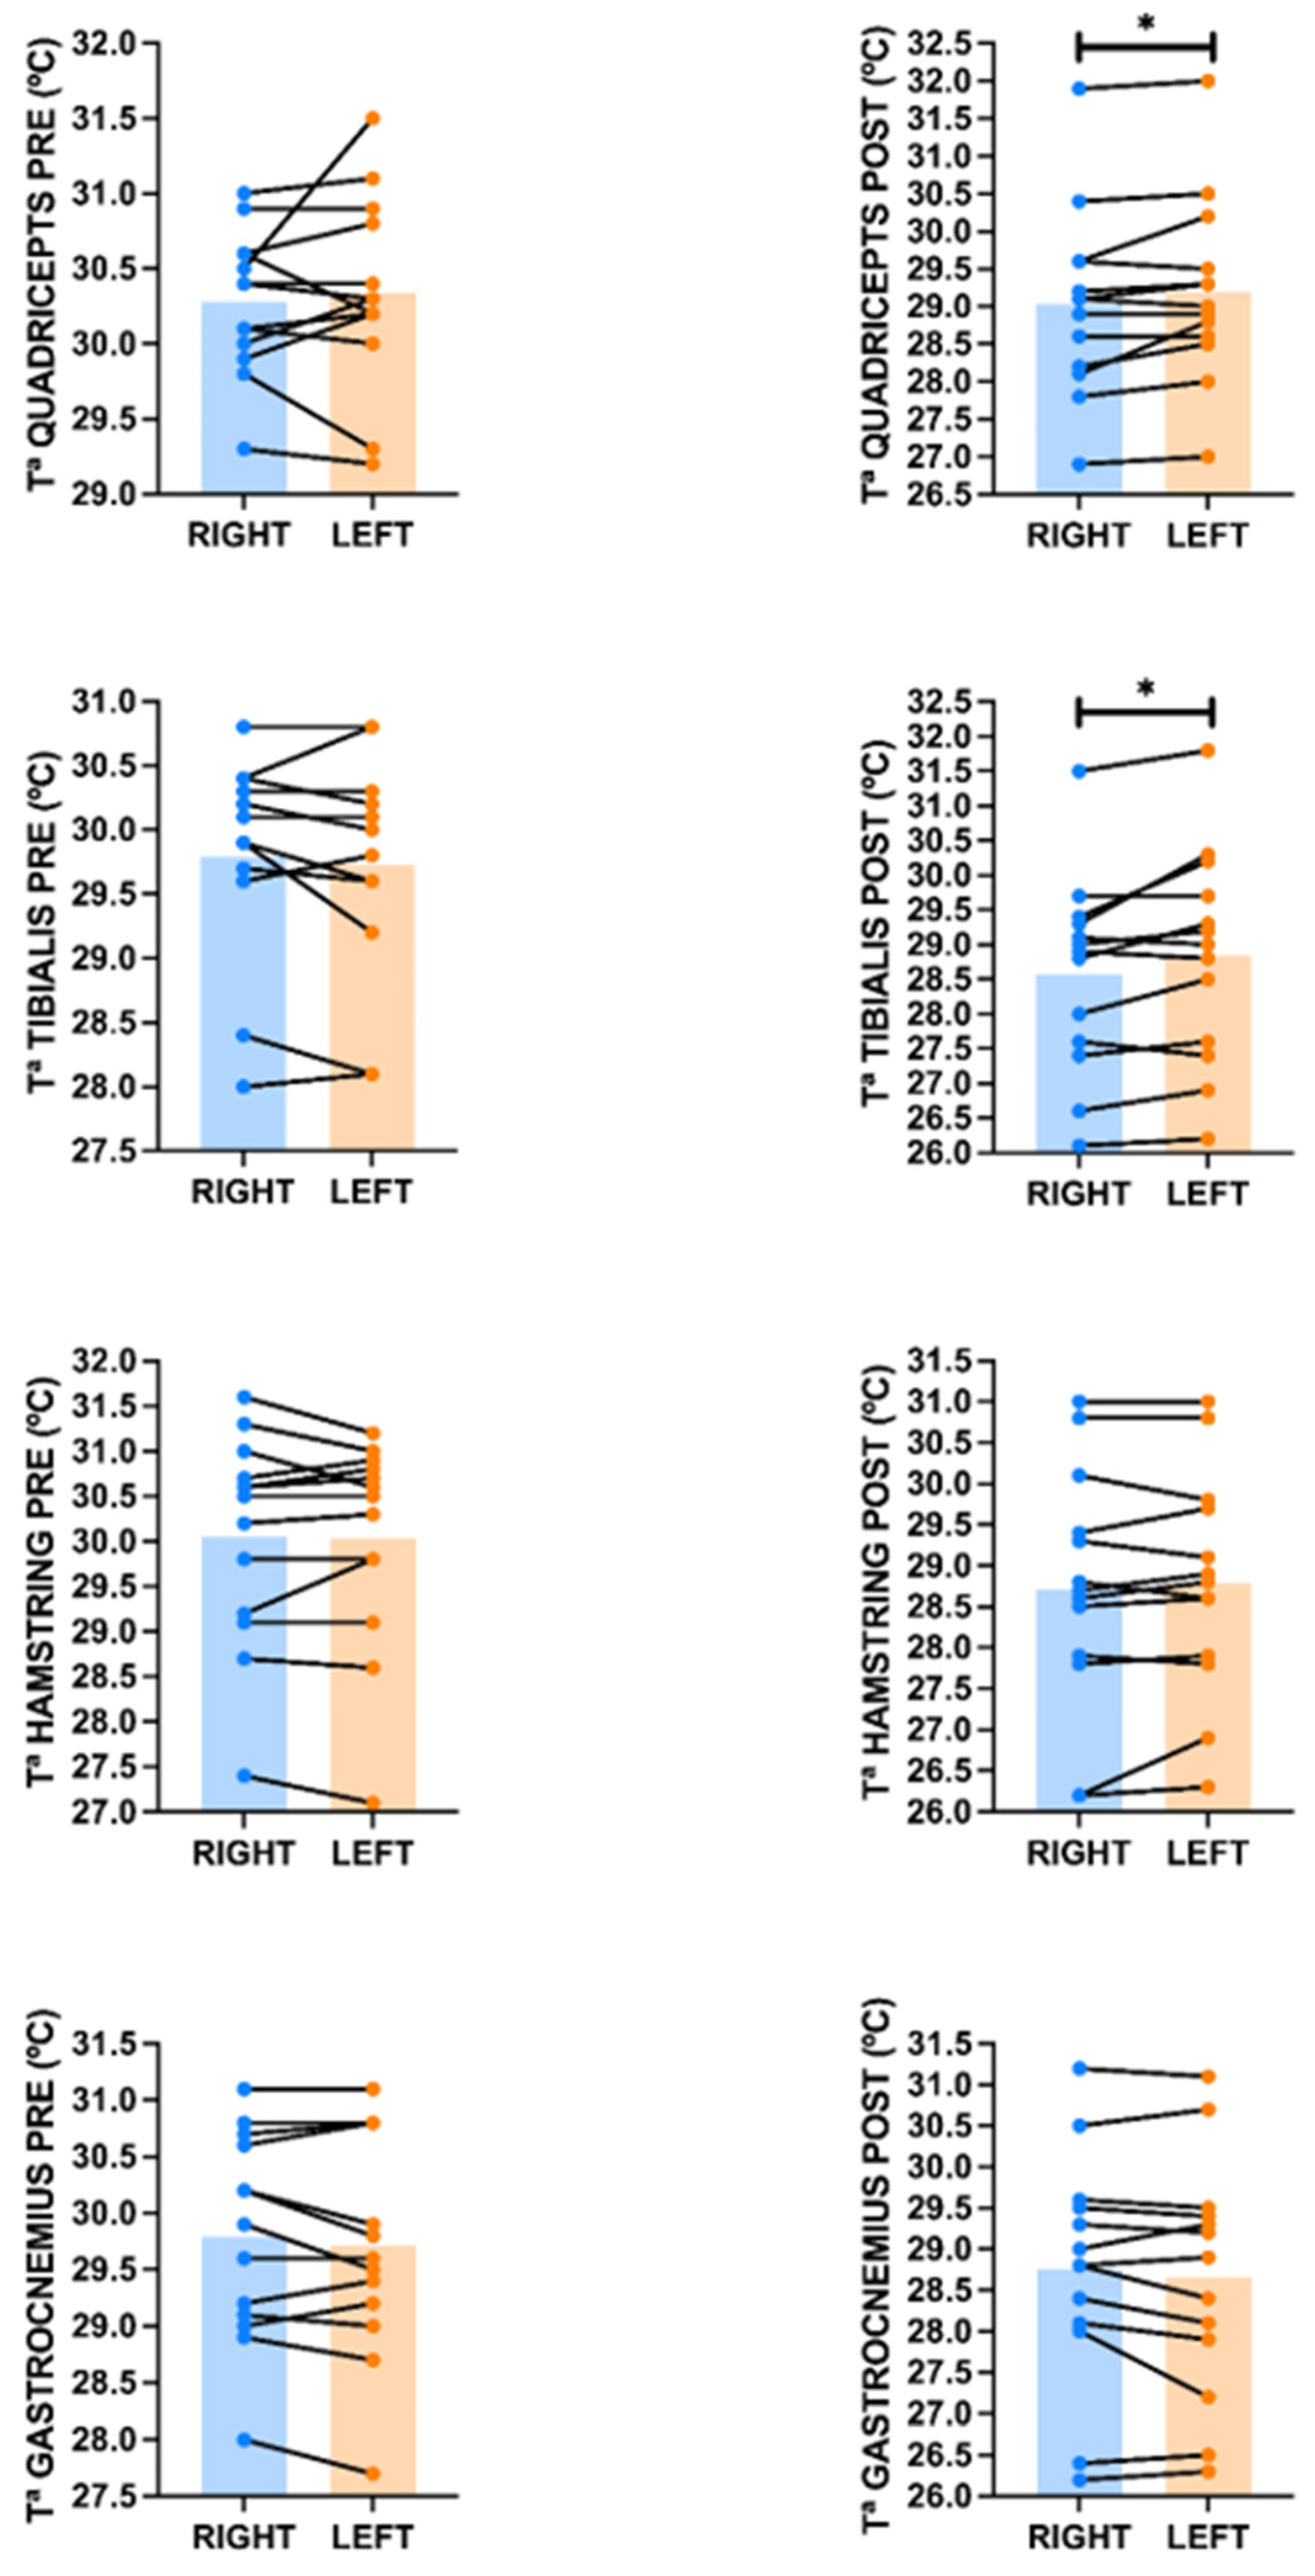
In the quadriceps pre-exercise, no differences were observed between the right side (30.3 ± 0.47 °C; SE = 0.13; CV = 1.6%; 95%CI: 30.0–30.6) and the left side (30.3 ± 0.65 °C; SE = 0.18; CV = 2.1%; 95%CI: 30.0–30.7) (p = 0.558; ES = 0.16). However, in the post-exercise quadriceps, a difference was found between the right side (29.0 ± 1.25 °C; SE = 0.35; CV = 4.3%; 95%CI: 28.3–29.8) and the left side (29.2 ± 1.23 °C; SE = 0.34; CV = 4.2%; 95%CI: 28.5–29.9) (p = 0.021; ES = 0.79) (Figure 6). In the tibialis pre-exercise, no significant differences were found between the right side (29.8 ± 0.79 °C; SE = 0.22; CV = 2.7%; 95%CI: 29.3–30.3) and the left side (29.7 ± 0.85 °C; SE = 0.24; CV = 2.9%; 95%CI: 29.2–30.2) (p = 0.392; ES = 0.25). However, a significant difference was found in the tibial region post-exercise between the right side (28.6 ± 1.42 °C; SE = 0.40; CV = 5.0%; 95%CI: 27.7–29.4) and the left side 28.8 ± 1.54 °C (SE = 0.43; CV = 5.3%; 95%CI: 27.9–29.8) (p = 0.019; ES = 0.76) (Figure 6). Similarly, no significant difference was detected in the hamstring pre-exercise temperatures between the right side (30.1 ± 1.18 °C; SE = 0.33; CV = 3.9%; 95%CI: 29.3–30.8) and the left side (30.0 ± 1.17 °C; SE = 0.32; CV = 3.9%; 95%CI: 29.3–30.7) (p = 0.774; ES = 0.08). Similarly, no significant differences were found in the hamstrings post-exercise between the right side (28.7 ± 1.49 °C; SE = 0.41; CV = 5.2%; 95%CI: 27.8–29.6) and the left side (28.8 ± 1.37 °C; SE = 0.38; CV = 4.8%; 95%CI: 28.0–29.6) (p = 0.355; ES = 0.27) (Figure 6). In the gastrocnemius pre-exercise, we did not detect any significant difference between the right side (29.8 ± 0.92 °C; SE = 0.25; CV = 3.1%; 95%CI: 29.2–30.4) and the left side 29.7 ± 0.98 °C (SE = 0.27; CV = 3.3%; 95%CI: 29.1–30.3) (p = 0.240; ES = 0.34). Similarly, in the gastrocnemius post-exercise, we also found no significant difference between the right side (28.8 ± 1.41 °C; SE = 0.39; CV = 4.9%; 95%CI: 27.9–29.6) and the left side (28.7 ± 1.46 °C; SE = 0.40; CV = 5.1%; 95%CI: 27.8–29.5) (p = 0.235; ES = 0.35) (Figure 6).
Figure 6.
Differences in skin surface temperature between the right and left sides in the various anatomical areas analyzed before and after training. * = p ≤ 0.05. Data derived from the analysis of the paired t-test comparison.
3.5. Two-Way Repeated Measures ANOVA for Asymmetry Analysis
For the quadriceps, a significant main effect of side was observed across the pre- and post-training measurements (F(1,12) = 5.37, p = 0.039, ηp2 = 0.309), indicating an overall difference between the right and left limbs. The mean difference between sides was −0.12 °C (95%CI: −0.224 to −0.006), with a small effect size (ES = −0.120). Importantly, the time × side interaction was not significant (F(1,12) = 0.58, p = 0.462, ηp2 = 0.046), indicating that the magnitude of the bilateral difference did not significantly change from pre- to post-training. However, post hoc comparisons showed no significant difference between the right and left quadriceps before training (mean difference = −0.06 °C, 95%CI: −0.384 to 0.261; pHolm = 0.558), whereas the post-training comparison approached but did not reach statistical significance (mean difference = −0.17 °C, 95%CI: −0.382 to 0.043; pHolm = 0.055). Therefore, despite the significant overall side effect, the results do not support a statistically significant training-related change in quadriceps thermal asymmetry.
However, for the hamstring, no significance was found for the main effect of side in pre- and post-training (F(1,12) = 0.14, p = 0.718, ηp2 = 0.011). The mean difference between sides was −0.02 °C (95%CI: −0.158 to 0.112), with a small effect size (ES = −0.018). Furthermore, the time × side interaction was not significant (F(1,12) = 1.20, p = 0.295, ηp2 = 0.091), indicating that the magnitude of the bilateral difference did not significantly change from pre- to post-training. In the post hoc comparisons, we did not observe any significant difference between both sides before training (mean difference = 0.02 °C, 95%CI: −0.225 to 0.271; pHolm = 0.774) nor after training between both sides (mean difference = −0.07 °C, 95%CI: −0.269 to 0.158; pHolm = 0.710).
For the tibialis, no significant main effect of side was observed across the pre- and post-training measurements (F(1,12) = 3.18, p = 0.100, ηp2 = 0.210), indicating no overall difference between the right and left limbs when averaged across time. The mean difference between sides was −0.10 °C (95%CI: −0.222 to 0.022), with a small effect size (ES = −0.083). However, unlike the pattern observed in other muscle groups, the time × side interaction was significant (F(1,12) = 5.98, p = 0.031, ηp2 = 0.332), indicating that the magnitude of the bilateral difference changed significantly from pre- to post-training. Post hoc comparisons showed no significant difference between the right and left tibialis before training (mean difference = 0.07 °C, 95%CI: −0.176 to 0.315; pHolm = 0.392). However, following training, a significant bilateral difference emerged, with the right tibialis showing a lower temperature than the left (mean difference = −0.27 °C, 95%CI: −0.581 to 0.043; pHolm = 0.037).
For the gastrocnemius, no significant main effect of side was observed across the pre- and post-training measurements (F(1,12 = 3.21, p = 0.099, ηp2 = 0.211), indicating no overall difference between the right and left limbs when averaged across time. The mean difference between sides was 0.09 °C (95%CI: −0.022 to 0.167), with a negligible effect size (ES = 0.073). Furthermore, the time × side interaction was not significant (F(1,12) = 0.05, p = 0.828, ηp2 = 0.004), indicating that the magnitude of the bilateral difference did not significantly change from pre- to post-training.
Post hoc comparisons showed no significant difference between the right and left gastrocnemius before training (mean difference = 0.08 °C, 95%CI: −0.119 to 0.273; pHolm = 0.471), nor after training (mean difference = 0.10 °C, 95%CI: −0.152 to 0.352; pHolm = 0.471).
3.6. Oxygen Saturation
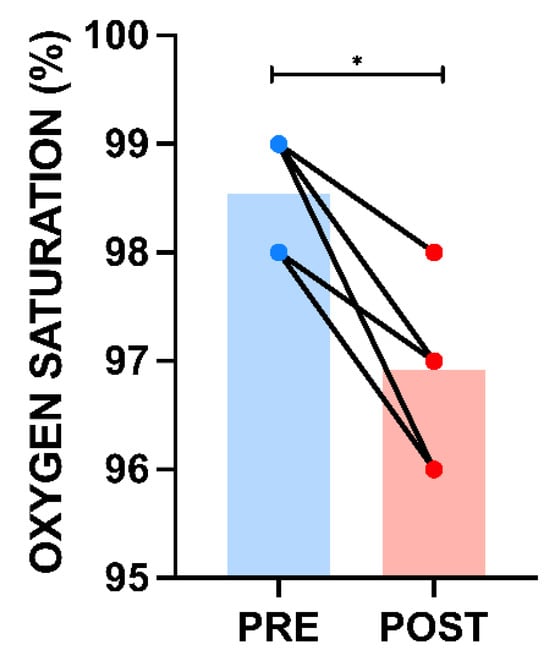
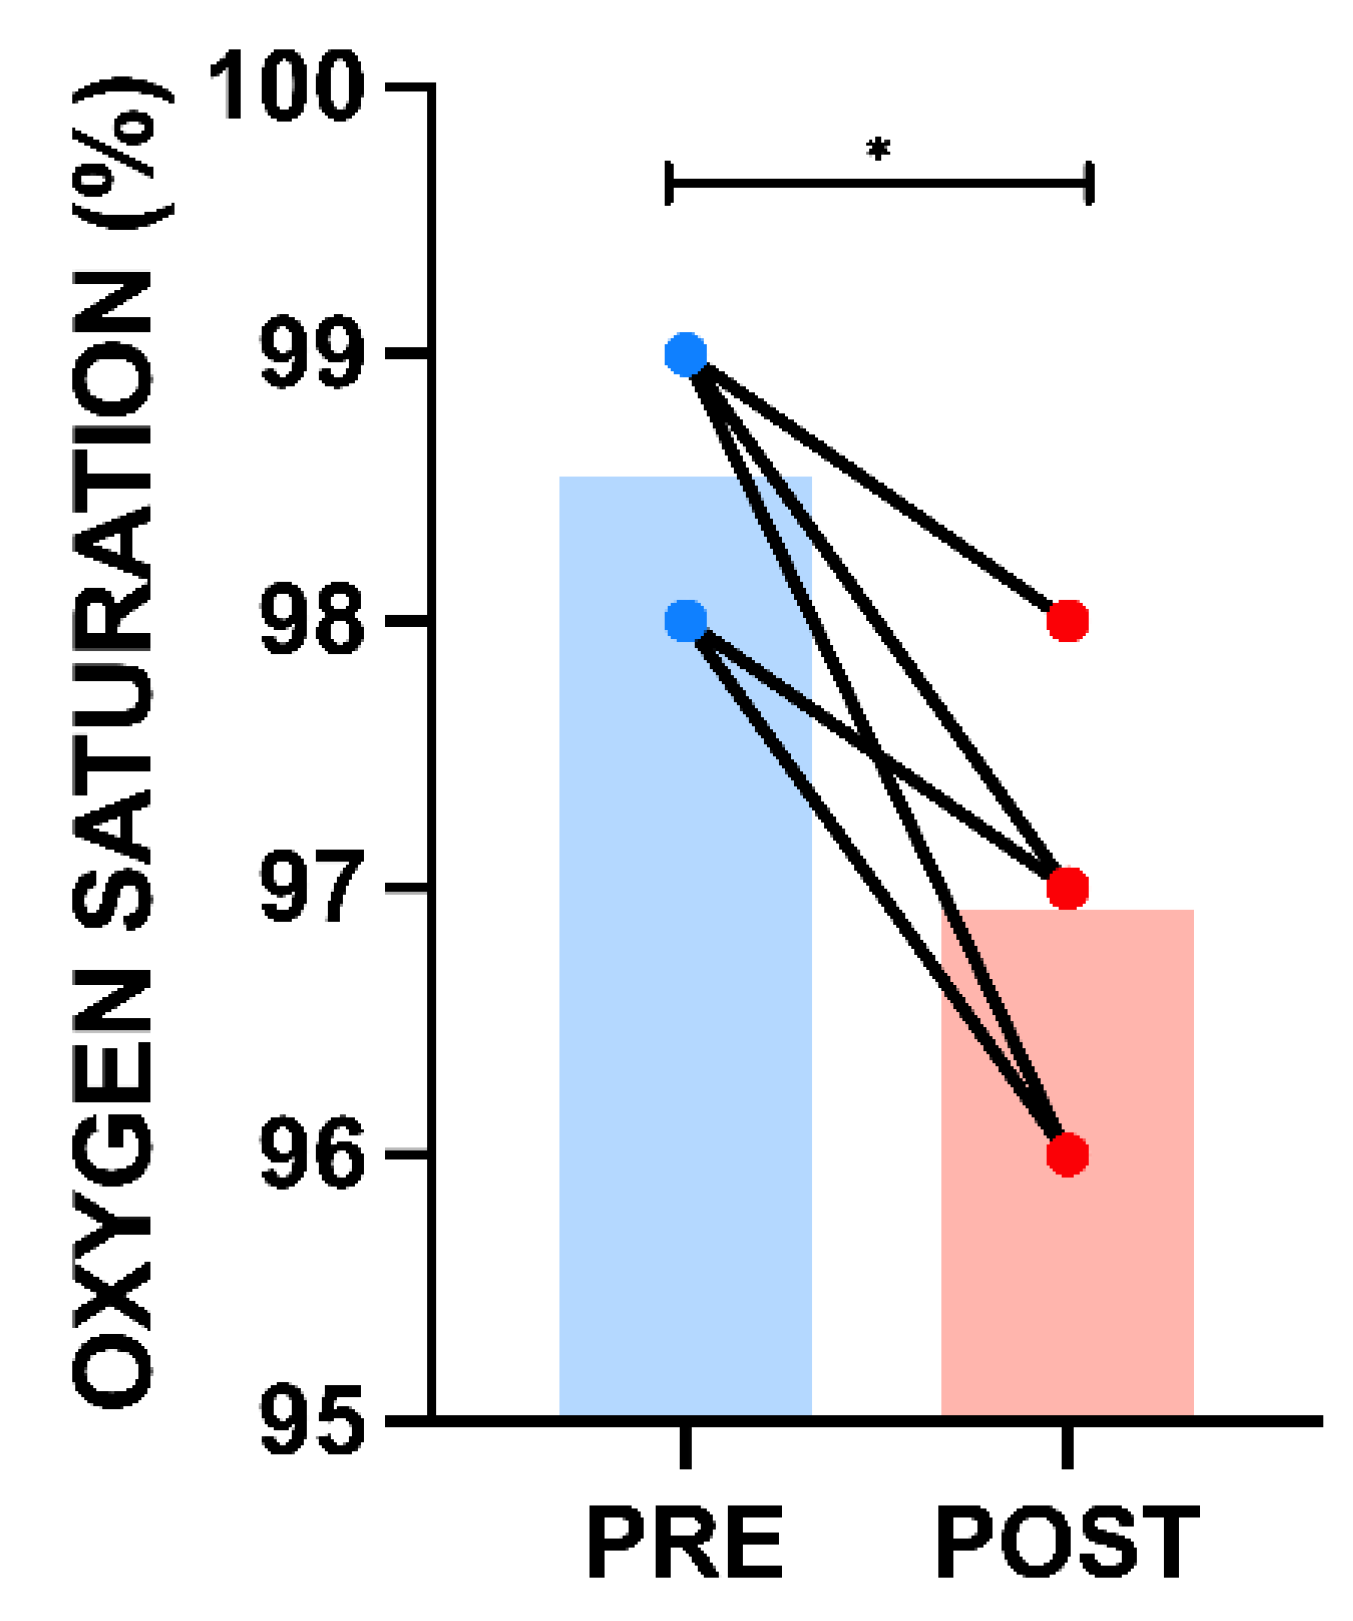
Peripheral oxygen saturation (SpO2) decreased slightly following the procedure, from 98.5 ± 0.52% (SE = 0.14; CV = 0.5%; 95%CI: 98.0–99.0) to 96.9 ± 0.76% (SE = 0.21; CV = 0.8%; 95%CI: 96.5–97.4) (p = 0.001; ES = 1.00). Despite this decrease, variability was very low in both measurements, with coefficients of variation below 1%, indicating a high degree of homogeneity in the sample with respect to this variable (Figure 7).
Figure 7.
Changes in oxygen saturation before and after training. * = p ≤ 0.05. The apparent reduction in the number of visible PRE–POST connections is due to overlapping data points resulting from identical integer SpO2 values among participants; all 13 participants are included.
4. Discussion
The objective of this study was to analyze the acute response of hemodynamic, volumetric (circumference), and thermal variables in the lower limbs to an indoor soccer training session in elite national and international athletes. The main findings show, first, that all measured lower-limb circumferences increased (except left thigh) following training compared with baseline. Second, systolic blood pressure increased significantly after the training session (p = 0.002; ES = 1.11), while diastolic blood pressure showed a small, non-significant increase (p = 0.221; ES = 0.36). Heart rate increased significantly (p < 0.001; ES = 2.25), with this variable showing the greatest relative variability among participants. Skin temperature decreased consistently across all muscle groups evaluated following training. Regarding bilateral thermal asymmetry, no significant side-to-side differences were observed before training in any of the muscle groups assessed. Following training, a significant time × side interaction was observed only for the tibialis anterior (p = 0.031; ηp2 = 0.332), with the right side showing a lower temperature than the left side post-training (pHolm = 0.037). Although a significant main effect of side was detected for the quadriceps (p = 0.039; ηp2 = 0.309), the time × side interaction was not significant (p = 0.462), indicating that the training session did not significantly modify the bilateral thermal asymmetry in this muscle. No significant bilateral differences or time × side interactions were observed for hamstrings or gastrocnemius. Overall, these findings suggest that the acute thermal response to training was generally symmetrical, with a transient side-specific response primarily evident in the tibialis anterior. Finally, peripheral oxygen saturation decreased significantly following the training session (p = 0.001; ES = 1.00).
One of the most significant findings of this study is the consistent decrease in skin temperature across all anatomical regions analyzed following training. This result may seem unusual at first glance, since it is known that the cellular agitation associated with muscle activity releases heat [30]. However, from a physiological standpoint, it is consistent with the thermoregulatory mechanisms proposed by other authors [31]. During prolonged, high-intensity exercise, blood flow may be redistributed according to the competing demands of active skeletal muscle, thermoregulation, and central cardiovascular homeostasis, potentially reducing cutaneous perfusion in some circumstances [32,33]. In addition, sweat evaporation removes heat from the skin surface and may contribute to the reduction in measured skin temperature. These mechanisms may explain why decreases in skin temperature have previously been observed using infrared thermography in several sports, such as cycling [34], walking [13], football [35] and running [31]. However, these physiological mechanisms were not directly assessed in the present study and therefore cannot be confirmed from our data.
However, our results differ from those observed by Dias FAM et al. [16], who found no statistically significant difference in skin temperature (TSK) among futsal players, 11-a-side soccer players, and sedentary individuals who underwent sprint training. This discrepancy may be related to differences in the type of exercise used in this study, as well as in the duration, intensity, and timing of the thermographic assessment across the studies. Although sprint exercise is highly intense, its shorter and more discrete exercise bouts may elicit a different thermophysiological response from futsal, which is characterized by repeated high-intensity actions interspersed with short recovery periods [36]. This difference in exercise structure may partly explain the contrasting skin-temperature responses reported between sprint-based and futsal exercise protocols. Numerous authors have shown that the type of training can influence the thermographic response, with substantial evidence supporting the temperature decrease associated with aerobic exercise [37,38]. Further research should compare different futsal training modalities and workloads while simultaneously assessing skin temperature, local blood flow, core temperature, and sweat rate. Such an approach could help practitioners better understand the thermographic response to different exercise stimuli and potentially improve the use of infrared thermography for training-load monitoring and recovery assessment.
Another interesting aspect described regarding the thermographic response is the observation of thermal symmetry in all the anatomical regions analyzed and the emergence of side-to-side differences in specific muscle groups following exercise. This differential behavior could be explained by several reasons. It is known from other studies that in both healthy individuals and elite athletes, specifically in futsal, thermal symmetry is generally observed at baseline in the absence of injury [39,40,41]. However, at the end of the exercise, thermal symmetry may be altered due to differences in muscle recruitment between limbs, and it does not necessarily indicate an injury or muscle involvement [42]. In the present study, no significant bilateral differences were observed at baseline in any of the anatomical regions analyzed. Following training, a significant time × side interaction was observed only in the tibialis anterior (p = 0.031; ηp2 = 0.332), with lower temperature on the right side than on the left in the post-training assessment (pHolm = 0.037). Although a significant main effect of side was observed for the quadriceps (p = 0.039; ηp2 = 0.309), the time × side interaction was not significant (p = 0.462), indicating that training did not significantly modify quadriceps thermal asymmetry. No significant bilateral differences or time × side interactions were observed for hamstrings or gastrocnemius.
Several biomechanical and sport-specific factors may contribute to this regional pattern. Futsal involves frequent kicking, passing, changes in direction, accelerations, decelerations, and unilateral technical actions. Kicking and passing are predominantly performed with the dominant limb and require substantial involvement of the quadriceps for knee extension and the tibialis anterior for ankle dorsiflexion and stabilization. In the present sample, limb dominance and kicking preference were recorded for each player, and a greater proportion of players reported right-sided dominance and right-foot kicking preference. This predominance of right-sided limb use may provide a plausible explanation for the lower post-training temperature observed in the right tibialis anterior, as repeated preferential recruitment and mechanical loading of the dominant limb may contribute to side-to-side differences in the acute thermographic response. However, because muscle activation and unilateral mechanical loading were not directly quantified, this interpretation should be considered plausible rather than causal. The anatomical characteristics of the tibialis anterior may also be relevant when interpreting this finding. Compared with the larger muscle groups analyzed in the present study, the tibialis anterior is a relatively small and superficial muscle. Its superficial anatomical location may facilitate the detection of local changes at the skin surface by infrared thermography, potentially making side-to-side differences more readily detectable in this region. Nevertheless, this possibility cannot be confirmed from the present data, as muscle depth, local blood flow, and muscle activation were not directly assessed. The absence of a significant time × side interaction in the hamstrings and gastrocnemius suggests that exercise-related alteration in thermal symmetry may be muscle-specific rather than a generalized consequence of unilateral loading. This interpretation is consistent with previous research showing that unilateral exercise or stimulation can produce localized differences in thermographic responses between the stimulated and contralateral regions [42,43]. Nevertheless, the present findings should be interpreted cautiously, as thermal asymmetry cannot be considered evidence of muscle damage or increased injury risk. Future longitudinal studies should investigate whether repeated exercise-induced thermal asymmetries are associated with limb dominance, accumulated training load, neuromuscular fatigue, previous injury, or subsequent injury occurrence in elite futsal players.
From a cardiovascular perspective, our post-exercise results have shown a significant increase in systolic blood pressure and heart rate, while diastolic blood pressure remains largely unchanged. This response is consistent with the previous literature on dynamic exercise, in which increased sympathetic activity and cardiac output lead to an increase in systolic blood pressure [44], while the stability of diastolic pressure could be explained, as observed by other authors, by peripheral vasodilation in the most active muscles, which would reduce vascular resistance and compensate for the increase in blood flow at the deep level [45]. The increase in heart rate, which was highly significant in our study, thus reflects the metabolic demand of exercise and the need to maintain an adequate supply of oxygen to deeper tissues such as the muscular system, a topic that has been the focus of recent studies and could support the thermographic results showing skin cooling [34]. Future studies could use ultrasound to observe changes in the size and perfusion of blood vessels, to determine more precisely and objectively the correlation between changes in vascular flow and the associated thermal processes.
Another relevant finding that could support the vascular and thermographic results obtained is that, following training, a significant increase in circumference (except left thigh) was observed in all extremities. This pattern, consistent with the previous literature, could suggest a distal circumference response, likely associated with fluid accumulation. It is known from other studies that during exercise, especially intermittent, high-intensity activities such as indoor football, there is an increase in blood flow to the most active muscles, accompanied by an increase in hydrostatic pressure in the capillaries, which can result in an increase in tissue volume [46,47,48]. Willwacher et al. [47], for example, observed an increase of up to 9% in the muscle mass of the gastrocnemius during exercise; Shi et al. [48] observed a progressive increase in fibrillar volume in the biceps brachii in accordance with fatigue levels, while Jensen et al. [49] observed a 14% increase in the volume of the supraspinatus following prolonged abduction exercises. Ploutz-Snyder et al., similarly, following specific thigh exercises, described an increase in post-exercise muscle volume [50]. However, it should be noted that this study did not use specific tools to assess blood flow and fluid redistribution in the lower extremities.
Finally, the significant decrease in peripheral oxygen saturation represents an interesting finding that warrants cautious interpretation. Pulse oximetry provides an estimate of peripheral arterial oxygen saturation at the measurement site, but it does not directly assess oxygen extraction in skeletal muscles, local tissue oxygenation, or the metabolic mechanisms underlying exercise-induced fatigue [51]. Under normal physiological conditions, arterial oxygen saturation remains relatively stable during exercise in healthy subjects, due to processes such as compensatory hyperventilation, pulmonary diffusion reserve capacity, and the recruitment of alveolar capillaries [52,53]. However, at the peripheral level, other studies showed a decrease in SpO2 after exercise [54,55,56]. Therefore, the present results demonstrate a lower post-training SpO2 reading rather than providing direct evidence of systemic arterial desaturation or peripheral muscle oxygen depletion. Although physiological factors associated with intense exercise, such as alterations in peripheral perfusion and blood flow, may influence pulse-oximeter measurements, the present study did not directly assess these mechanisms.
In this regard, other authors have shown that peripheral measurements using pulse oximetry can be affected by various factors, such as cutaneous perfusion, temperature, movement, or sweating. In this regard, peripheral vasoconstriction or the redistribution of blood flow during and after exercise could alter the signal detected by the device, resulting in apparently lower values [57]. Therefore, this decrease may reflect a technical limitation of the measurement rather than true systemic desaturation. Future studies could explore this aspect in greater depth to determine the role of peripheral oxygen saturation in relation to thermographic and vascular parameters. Such studies would be highly useful in the field of sports medicine for preventing injuries and restoring optimal physical condition.
From an applied perspective, our results highlight the potential value of combining thermal, morphometric, and cardiovascular measurements to characterize the acute physiological response to futsal training. The increase, in most cases, in lower limb circumference may indicate a transient redistribution of fluids and could be relevant when considering recovery and fluid management after exercise, although the current methodology does not allow for determining the underlying mechanism. Similarly, the reduction in skin temperature should be considered when interpreting post-exercise thermographic measurements, as a lower skin temperature does not necessarily indicate reduced muscle activity or impaired muscle function. The identification of selective thermal asymmetries in the tibialis anterior following exercise also suggests that bilateral thermographic analysis can provide additional information beyond absolute temperature values. Integrating these measurements with training load, limb dominance, history of previous injuries, and functional or neuromuscular assessments could potentially improve the individualized monitoring of athletes’ responses. However, thermography should currently be considered a complementary monitoring tool rather than an independent method for diagnosing or predicting injuries.
5. Limitations
However, it should be noted that this study has several limitations that must be considered when interpreting the results. Statistical power is limited due to the characteristics of the elite professional athlete sample, and this needs to be supplemented by expanding the sample through multi-institutional collaboration. The sample size and the lack of additional measurements such as local blood flow, intramuscular temperature, or biochemical markers limit the ability to establish causal mechanisms. Future research should address these limitations through more controlled experimental designs, including multimodal measurements that allow for a more accurate assessment of the physiological response to exercise. The inclusion of larger and more heterogeneous samples would also help improve the external validity of the results. Furthermore, another limitation of the study is that the training environment variables which can influence thermographic interpretation (court temperature and humidity) were not recorded in this study, as only the temperature, humidity, and atmospheric pressure of the measurement room were recorded. Given the exploratory nature of the study and the evaluation of multiple physiological and morphological parameters, the possibility that the Type I error rate may be inflated due to multiple comparisons cannot be completely ruled out. Therefore, the results of individual paired comparisons should be interpreted with caution and considered exploratory, with an emphasis on the magnitude and direction of the observed effects rather than on mere statistical significance.
6. Conclusions
In conclusion, a futsal training session elicited a multidimensional acute physiological response characterized by a general increase in lower limb circumference, systolic blood pressure, and heart rate, along with a decrease in skin temperature and peripheral oxygen saturation. In addition, thermal asymmetries were detected after exercise, specifically in the tibialis anterior, while the posterior muscles of the lower extremities remained bilaterally symmetrical. These findings provide relevant information on the acute physiological and thermographic response to futsal training and support the potential utility of combining infrared thermography with cardiovascular and morphometric measurements for monitoring athletes. However, the mechanisms underlying these responses and their potential relevance to fatigue, recovery, and injury risk must be confirmed through controlled longitudinal studies using multimodal physiological assessments.
Author Contributions
Conceptualization, A.C. and F.J.M.-N.; Methodology, A.C. and F.J.M.-N.; Investigation, A.C., F.J.M.-N. and M.L.C.; Formal Analysis, A.C. and M.L.C.; Data Curation, A.C. and M.L.C.; Writing—Original Draft Preparation, A.C.; Writing—Review and Editing, A.C., F.J.M.-N. and M.L.C.; Visualization, A.C.; Supervision, F.J.M.-N.; Project Administration, F.J.M.-N. All authors have read and agreed to the published version of the manuscript.
Funding
This research received no external funding.
Institutional Review Board Statement
We confirm that we have read the journal’s position on issues involved in ethical publication and affirm that this report is consistent with those guidelines.
Data Availability Statement
The raw data supporting the conclusions of this article will be made available by the authors upon request.
Conflicts of Interest
Author Miguel Ledesma Carrasco was employed by ElPozo Murcia Costa Calida, Murcia, Spain. Author Miguel Ledesma Carrasco participated in the study as an external researcher and received no financial compensation for this work. The remaining authors declare that the research was conducted in the absence of any commercial or financial relationships that could be construed as a potential conflict of interest.
References
- Spyrou, K.; Freitas, T.T.; Marín-Cascales, E.; Alcaraz, P.E. Physical and Physiological Match-Play Demands and Player Characteristics in Futsal: A Systematic Review. Front. Psychol. 2020, 11, 569897. [Google Scholar] [CrossRef] [Scilit] [PubMed] [PubMed Central]
- Lima, Y.; Clarsen, B.; Bayraktar, B. Injuries and Illnesses in National Team Male Futsal Players: A Prospective Seven-Year Cohort Study. Am. J. Phys. Med. Rehabil. 2026, 105, 612–618. [Google Scholar] [CrossRef] [Scilit] [PubMed]
- Albalad-Aiguabella, R.; Mainer-Pardos, E.; Gadea-Uribarri, H.; Vicente-Rodríguez, G.; Muniz-Pardos, B. Optimizing Performance in Women Futsal: Impact of Neuromuscular Training on Speed, Change of Direction, and Repeated Sprint Ability. J. Strength Cond. Res. 2026, 40, e385–e396. [Google Scholar] [CrossRef] [Scilit] [PubMed]
- Spyrou, K.; Ribeiro, J.N.; Alcaraz, P.E.; Freitas, T.T.; Travassos, B. Quantification of Weekly External Load in Female Futsal Players: Considering Inter-Day and -Player Variability. Res. Q. Exerc. Sport 2026, 97, 52–59. [Google Scholar] [CrossRef] [Scilit] [PubMed]
- Marques, C.; Rebelo, M.; Serrano, J.; Fonseca, H. Neuromuscular Characteristics of Female Futsal Players: A Systematic Review. Sports 2026, 14, 98. [Google Scholar] [CrossRef] [Scilit] [PubMed] [PubMed Central]
- Chaudhari, D.; Ramteke, S.U. Effect of accentuated eccentric loading countermovement jumps and drop jump training with ladder training versus ladder training alone on sprint performance and change of direction ability in futsal players: A randomized controlled trial protocol. PLoS ONE 2026, 21, e0343869. [Google Scholar] [CrossRef] [Scilit] [PubMed] [PubMed Central]
- Elias, G.; Jerez-Mayorga, D.; Intelangelo, L. Does the Position of the Ankle Matter During the Single Gluteal Bridge in Futsal Players? An Electromyographic Analysis. J. Sport Rehabil. 2024, 33, 73–78. [Google Scholar] [CrossRef] [Scilit] [PubMed]
- Guzmán, A.B.; Vidal-Espinoza, R.; Urzua-Alul, L.; Castelli Correia de Campos, L.F.; Fuentes-López, J.; Urra-Albornoz, C.; Cossio-Bolaños, M.; Gomez-Campos, R. Prescription criteria and effects of explosive strength training in indoor soccer players: A systematic review. Eur. J. Transl. Myol. 2024, 34, 12888. [Google Scholar] [CrossRef] [Scilit] [PubMed] [PubMed Central]
- Matias, C.N.; Campa, F.; Cavaca, M.; Paoli, A.; Teixeira, F.J. Fat-free mass estimation in male elite futsal players: Development and validation of a new bioelectrical impedance-based predictive equation. Nutrition 2023, 107, 111931. [Google Scholar] [CrossRef] [Scilit] [PubMed]
- Weber, V.; López, D.A.; Ochmann, D.T.; Zentgraf, S.; Nägele, M.; Neuberger, E.W.I.; Schömer, E.; Simon, P.; Hillen, B. Deep learning-based infrared thermography reveals reproducible uniform and individual thermoregulatory responses during running. Sci. Rep. 2026, 16, 10525. [Google Scholar] [CrossRef] [Scilit] [PubMed] [PubMed Central]
- Santos, S.O.; Valtierra, G.D.C.M.; Vazquez Hernández, M.C.; Tavares, J.N.G.; López Ramírez, B.C.; Bobadilla, G.M. Standardized Protocol For Monitoring Muscle Fatigue and Biomechanics In Amateur Cyclists Using Infrared Thermography. J. Vis. Exp. 2026, 229, e69926. [Google Scholar] [CrossRef] [Scilit] [PubMed]
- Cabizosu, A.; Marín-Pagan, C.; Alcaraz, P.E.; Martínez-Noguera, F.J. Infrared Thermography Sensor in the Analysis of Acute Metabolic Stress Response during Race Walking Competition. Biosensors 2024, 14, 478. [Google Scholar] [CrossRef] [Scilit] [PubMed] [PubMed Central]
- Martínez-Noguera, F.J.; Cabizosu, A.; Marín-Pagan, C.; Alcaraz, P.E. Body Surface Profile in Ambient and Hot Temperatures During a Rectangular Test in Race Walker Champions of the World Cup in Oman 2022-ScienceDirect. Available online: https://www.sciencedirect.com/science/article/abs/pii/S030645652300089X?dgcid=rss_sd_all (accessed on 18 May 2023).
- Priego Quesada, J.I.; Carpes, F.P.; Bini, R.R.; Salvador Palmer, R.; Pérez-Soriano, P.; Cibrián Ortiz de Anda, R.M. Relationship between skin temperature and muscle activation during incremental cycle exercise. J. Therm. Biol. 2015, 48, 28–35. [Google Scholar] [CrossRef] [Scilit] [PubMed]
- Priego Quesada, J.I.; Lucas-Cuevas, A.G.; Gil-Calvo, M.; Giménez, J.V.; Aparicio, I.; Cibrián Ortiz de Anda, R.M.; Palmer, R.S.; Llana-Belloch, S.; Pérez-Soriano, P. Effects of graduated compression stockings on skin temperature after running. J. Therm. Biol. 2015, 52, 130–136. [Google Scholar] [CrossRef] [Scilit] [PubMed]
- Dias, F.A.M.; da Silva, A.G.; de Assis Cassemiro, H.; da Paz E Figueiredo, I.C.; Zandonade, A.L.; Moreira, A.C.; Teixeira, I.M.; Mendes, E.d.P.; Cerqueira, R.B.; Fernandes, A.d.A.; et al. Is thermography capable of identifying physiological stress induced by a protocol of repeated sprints in university athletes? J. Therm. Biol. 2025, 134, 104346. [Google Scholar] [CrossRef] [Scilit] [PubMed]
- Mendonça Teixeira, R.; Dellagrana, R.A.; Priego-Quesada, J.I.; Machado, J.C.B.P.; Fernandes da Silva, J.; Pacheco Dos Reis, T.M.; Rossato, M. Muscular Strength Imbalances Are not Associated with Skin Temperature Asymmetries in Soccer Players. Life 2020, 10, 102. [Google Scholar] [CrossRef] [Scilit] [PubMed] [PubMed Central]
- Albalad-Aiguabella, R.; Mainer-Pardos, E.; Roso-Moliner, A.; Lozano, D.; Vicente-Rodríguez, G.; Muniz-Pardos, B. Fitness Profiles of Highly Trained Female Futsal Players According to Their Playing Positions. Int. J. Sports Physiol. Perform. 2025, 20, 473–480. [Google Scholar] [CrossRef] [Scilit] [PubMed]
- González-Fernández, F.T.; Ceylan, H.I.; Silva, R.M.; Clemente, F.M.; Bezerra, P.; Chen, Y.S. Relationships between physical fitness and match running demands during a futsal congested-weeks training camp. Biol. Sport 2024, 41, 11–30. [Google Scholar] [CrossRef] [Scilit] [PubMed] [PubMed Central]
- Tominec, D.; Stalmans, M.; Narang, B.J.; Millet, G.P.; Poffé, C.; Debevec, T. Exogenous ketosis does not alter oxygenation, oxygen uptake kinetics or whole-body efficiency during submaximal exercise in early high-altitude acclimatization. J. Appl. Physiol. 2026, 140, 1251–12640. [Google Scholar] [CrossRef] [Scilit] [PubMed]
- Bernal-Sánchez, J.J.; Arboleda-Campo, V.H.; Chavarro-Ortiz, P.A.; Valencia-Ortiz, J.G.; Wilches-Luna, E.C. Changes in vital signs and functional performance during the 2-minute step test in healthy Colombian adults. J. Bodyw. Mov. Ther. 2026, 46, 17–21. [Google Scholar] [CrossRef] [Scilit] [PubMed]
- Knechtle, B. Relationship of anthropometric and training characteristics with race performance in endurance and ultra-endurance athletes. Asian J. Sports Med. 2014, 5, 73–90. [Google Scholar] [PubMed] [PubMed Central]
- Knechtle, B.; Baumgartner, S.; Knechtle, P.; Rüst, C.A.; Rosemann, T.; Bescós, R. Changes in single skinfold thickness in 100 km ultramarathoners. Open Access J. Sports Med. 2012, 3, 147–157. [Google Scholar] [CrossRef] [Scilit] [PubMed] [PubMed Central]
- Knechtle, B.; Knechtle, P.; Rosemann, T.; Lepers, R. Personal best marathon time and longest training run, not anthropometry, predict performance in recreational 24-hour ultrarunners. J. Strength Cond. Res. 2011, 25, 2212–2218. [Google Scholar] [CrossRef] [Scilit] [PubMed]
- World Medical Association. World Medical Association Declaration of Helsinki: Ethical principles for medical research involving human subjects. J. Am. Med. Assoc. 2013, 310, 2191–2194. [Google Scholar] [CrossRef] [Scilit] [PubMed]
- Moreira, D.G.; Costello, J.T.; Brito, C.J.; Adamczyk, J.G.; Ammer, K.; Bach, A.J.E.; Costa, C.M.; Eglin, C.; Fernandes, A.A.; Fernández-Cuevas, I.; et al. Thermographic imaging in sports and exercise medicine: A Delphi study and consensus statement on the measurement of human skin temperature. J. Therm. Biol. 2017, 69, 155–162. [Google Scholar] [CrossRef] [Scilit] [PubMed]
- Cuschieri, S. The STROBE guidelines. Saudi J. Anaesth. 2019, 13, S31–S34. [Google Scholar] [CrossRef] [Scilit] [PubMed] [PubMed Central]
- Cabizosu, A.; Zoffoli, A.; Mevi, R.; Martinez-Noguera, F.J. Thermographic response to acute muscle fatigue and delayed onset soreness (DOMS) following a protocol until exhaustion with concentric exercises in the triceps suralis. Physiol. Meas. 2026, 47, 015009. [Google Scholar] [CrossRef] [Scilit] [PubMed]
- Baglietto, N.; Albaladejo-Saura, M.; Esparza-Ros, F.; Vaquero-Cristóbal, R. Agreement and differences between the equations for estimating muscle and bone mass using the anthropometric method in recreational strength trainees. PeerJ 2024, 12, e17506. [Google Scholar] [CrossRef] [Scilit] [PubMed] [PubMed Central]
- von Stockar, U.; van der Wielen, L.A. Thermodynamics in biochemical engineering. J. Biotechnol. 1997, 59, 25–37. [Google Scholar] [CrossRef] [Scilit] [PubMed]
- Cabizosu, A.; Ruiz-Angui, V.; Carazo-Díaz, C.; Martínez-Noguera, F.J.; Alcaraz, P.E. Morphological and Thermographic Factors of the Lower Limbs Before Competition and Their Impact on Performance at the Spanish National Cross Country Championships. Biosensors 2026, 16, 369. [Google Scholar] [CrossRef] [Scilit] [PubMed] [PubMed Central]
- Sanchez-Jimenez, J.L.; Aparicio, I.; Romero-Avila, J.L.; Bellot-Arcís, C.; Cibrián Ortiz de Anda, R.M.; Priego-Quesada, J.I. Skin temperature measurement in individuals with spinal cord injury during and after exercise: Systematic review. J. Therm. Biol. 2022, 105, 103146. [Google Scholar] [CrossRef] [Scilit] [PubMed]
- Torii, M.; Yamasaki, M.; Sasaki, T.; Nakayama, H. Fall in skin temperature of exercising man. Br. J. Sports Med. 1992, 26, 29–32. [Google Scholar] [CrossRef] [Scilit] [PubMed] [PubMed Central]
- Priego-Quesada, J.I.; Mackay, N.; Adejuwon, D.; Keir, D.A. Changes in calf skin temperature during ramp-incremental cycling exercise and their association with gas exchange and respiratory compensation thresholds. Physiol. Meas. 2026, 47, 075011. [Google Scholar] [CrossRef] [Scilit] [PubMed]
- Escamilla-Galindo, V.L.; Vega-Ramos, A.; Felipe, J.L.; Alonso-Callejo, A.; Fernandez-Cuevas, I. Skin Temperature as a Marker of Physical Fitness Profile: The Impact of High-Speed Running in Professional Soccer Players. Sports 2025, 13, 443. [Google Scholar] [CrossRef] [Scilit] [PubMed] [PubMed Central]
- Naser, N.; Ali, A.; Macadam, P. Physical and physiological demands of futsal. J. Exerc. Sci. Fit. 2017, 15, 76–80. [Google Scholar] [CrossRef] [Scilit] [PubMed]
- Caudet, P.; Baiget, E.; Batalla, A.; Colomar, J.; Corbi, F. Acute effects of FIFA 11+ warm-up on skin temperature in male and female amateur soccer players. Physiol. Meas. 2026, 47, 055002. [Google Scholar] [CrossRef] [Scilit] [PubMed]
- Silva AGda Albuquerque, M.R.; Brito, C.J.; Stroppa, G.M.; Oliveira, S.A.F.; Sillero-Quintana, M.; Marins, J.C.B. Effect of Whole-, Upper-, and Lower-Body High-Intensity Rowing Exercise on Skin Temperature Measured by Thermography. Res. Q. Exerc. Sport 2023, 94, 226–236. [Google Scholar] [CrossRef] [Scilit] [PubMed]
- Cruz, R.A.R.S.; de Araújo, F.F.M.; de Araújo, S.C. Mapeamento termográfico de membros inferiores de jovens atletas de futsal. Res. Soc. Dev. 2022, 11, e42011730341. [Google Scholar] [CrossRef] [Scilit]
- Conceição Lira, J.d.; Ilnete, C.; do Vale Júnior, E.G.; Lima Monteiro, M.; Santa Cruz, R.A. Simetria térmica de membros inferiores em atletas de futsal. Rev. Obs. Del Deporte 2019, 5, 8–17. [Google Scholar]
- Son, S.; Yoo, B.R.; Zhang, H.Y. Reference Standards for Digital Infrared Thermography Measuring Surface Temperature of the Upper Limbs. Bioengineering 2023, 10, 671. [Google Scholar] [CrossRef] [Scilit] [PubMed] [PubMed Central]
- De León-Muñoz, A.; Priego-Quesada, J.I.; Marzano-Felisatti, J.M.; Sanchez-Jimenez, J.L.; Sendra-Pérez, C.; Aparicio-Aparicio, I. Preliminary Application of Infrared Thermography to Monitoring of Skin Temperature Asymmetries in Professional Padel Players. Sensors 2024, 24, 4534. [Google Scholar] [CrossRef] [Scilit] [PubMed] [PubMed Central]
- Cabizosu, A.; Marín-Pagán, C.; Martínez-Serrano, A.; Alcaraz, P.E.; Martínez-Noguera, F.J. Myotendinous Thermoregulation in National Level Sprinters after a Unilateral Fatigue Acute Bout-A Descriptive Study. Sensors 2023, 23, 9330. [Google Scholar] [CrossRef] [Scilit] [PubMed] [PubMed Central]
- Varzideh, F.; Jankauskas, S.S.; Mone, P.; Kansakar, U.; Santulli, G. Autonomic neurotransmission in cardiovascular regulation and pathophysiology. Front. Neurosci. 2025, 19, 1739330. [Google Scholar] [CrossRef] [Scilit] [PubMed] [PubMed Central]
- Saltin, B.; Rådegran, G.; Koskolou, M.D.; Roach, R.C. Skeletal muscle blood flow in humans and its regulation during exercise. Acta Physiol. Scand. 1998, 162, 421–436. [Google Scholar] [CrossRef] [Scilit] [PubMed]
- Stick, C.; Jaeger, H.; Witzleb, E. Measurements of volume changes and venous pressure in the human lower leg during walking and running. J. Appl. Physiol. 1992, 72, 2063–2068. [Google Scholar] [CrossRef] [Scilit] [PubMed]
- Willwacher, S.; Sleboda, D.A.; Mählich, D.; Brüggemann, G.P.; Roberts, T.J.; Bratke, G. The time course of calf muscle fluid volume during prolonged running. Physiol. Rep. 2020, 8, e14414. [Google Scholar] [CrossRef] [Scilit] [PubMed] [PubMed Central]
- Shi, J.; Zheng, Y.P.; Chen, X.; Huang, Q.H. Assessment of muscle fatigue using sonomyography: Muscle thickness change detected from ultrasound images. Med. Eng. Phys. 2007, 29, 472–479. [Google Scholar] [CrossRef] [Scilit] [PubMed]
- Jensen, B.R.; Jørgensen, K.; Sjøgaard, G. The effect of prolonged isometric contractions on muscle fluid balance. Eur. J. Appl. Physiol. Occup. Physiol. 1994, 69, 439–444. [Google Scholar] [CrossRef] [Scilit] [PubMed]
- Ploutz-Snyder, L.L.; Convertino, V.A.; Dudley, G.A. New Collective Author. Resistance exercise-induced fluid shifts: Change in active muscle size and plasma volume. Am. J. Physiol. 1995, 269, R536–R543. [Google Scholar] [CrossRef] [Scilit] [PubMed]
- Brewster, M.; Heinzmann, C.; Sharma, S. Oxygen Saturation. In StatPearls [Internet]; StatPearls Publishing: Treasure Island, FL, USA, 2026. Available online: http://www.ncbi.nlm.nih.gov/books/NBK525974/ (accessed on 13 September 2026). [PubMed]
- Dominelli, P.B.; Sheel, A.W. The pulmonary physiology of exercise. Adv. Physiol. Educ. 2024, 48, 238–251. [Google Scholar] [CrossRef] [Scilit] [PubMed]
- Sheel, A.W.; Angus, S.A. Breathing during Exercise: Respiratory and Circulatory Interactions. Physiology 2026, 41, 272–286. [Google Scholar] [CrossRef] [Scilit] [PubMed]
- Nielsen, H.B. Arterial desaturation during exercise in man: Implication for O2 uptake and work capacity. Scand. J. Med. Sci. Sports 2003, 13, 339–358. [Google Scholar] [CrossRef] [Scilit] [PubMed]
- “Tony” Gryffin, P.A.; Gu, Q. A Paradigm Shift in Walking, Sleep, and Exercise: Unique Effects on Blood Oxygen Saturation, Oxygen Diffusion, and Cellular Metabolism. bioRxiv 2025. [Google Scholar] [CrossRef] [Scilit]
- Martín-Escudero, P.; Cabanas, A.M.; Fuentes-Ferrer, M.; Galindo-Canales, M. Oxygen Saturation Behavior by Pulse Oximetry in Female Athletes: Breaking Myths. Biosensors 2021, 11, 391. [Google Scholar] [CrossRef] [Scilit] [PubMed] [PubMed Central]
- Hom, C.; Vasquez, P.; Pozos, R.S. Peripheral skin temperature effects on muscle oxygen levels. J. Therm. Biol. 2004, 29, 785–789. [Google Scholar] [CrossRef] [Scilit]

Disclaimer/Publisher’s Note: The statements, opinions and data contained in all publications are solely those of the individual author(s) and contributor(s) and not of MDPI and/or the editor(s). MDPI and/or the editor(s) disclaim responsibility for any injury to people or property resulting from any ideas, methods, instructions or products referred to in the content. |
© 2026 by the authors. Licensee MDPI, Basel, Switzerland. This article is an open access article distributed under the terms and conditions of the Creative Commons Attribution (CC BY) license.